Article

Experimental Investigation into the Active Narrowband Reshaping of a Ship Model’s Acoustic Signature

1
Department of Mechanical and Civil Engineering, Helmut Schmidt University/University of the Federal Armed Forces Hamburg, 22043 Hamburg, Germany
2
Müller-BBM Industry Solutions GmbH, 22305 Hamburg, Germany
3
Technical Center for Ships and Naval Weapons, Maritime Technology and Research, 24340 Eckernförde, Germany
*
Author to whom correspondence should be addressed.
Acoustics 2025, 7(2), 34; https://doi.org/10.3390/acoustics7020034
Submission received: 4 April 2025 / Revised: 15 May 2025 / Accepted: 29 May 2025 / Published: 7 June 2025

Abstract

:
The use of inertial actuators to control the radiated sound pressure of a steel ship model at a lake measurement facility is examined. Therefore, methods of active vibration control as well as active control of target sound fields are applied using a fixed configuration of twelve accelerometers, eight control actuators, and five hydrophones. A narrowband feedforward active control system is used to manipulate the sound pressure at hydrophone positions, focusing not only on reducing but also on adding spectral lines in the radiated signature. The performance is assessed using measured data by additional accelerometers inside the ship model as well as by hydrophones surrounding the measurement facility. It is found that less control effort is necessary for the generation of additional tones compared to the control of a present disturbance at hydrophones. In the frequency range considered (below 500 Hz), the actively induced change in the mean structural velocity is not necessarily proportional to the change in the radiated sound pressure. In contrast to the vibration velocity, no unwanted amplification of the sound pressure is found for the frequencies observed.

1. Introduction

In addition to many other components of a surface ship’s overall signature, the acoustic part is an important indicator to assess its stealth capabilities. The acoustic signature comprises the spectral characteristics of sound caused by various noise sources, whose dominance depends on the ship’s speed. These include noise from machinery, flow-induced noise, and propeller noise. The signature can be used to detect and identify vessels using passive sonars or sensors and appropriate signal analysis techniques as part of military signature monitoring as well as civilian underwater environmental acoustic monitoring, which are influencing the behavior of naval ships. Consequently, decreasing the radiated noise lowers the ships’ risk of being detected, which brings a tactical advantage.
The frequency spectrum of an acoustic signature signal is irregular as well as variable over time and constitutes a mixture of discrete (tonal) and continuous (broadband) spectral components that are distributed through the entire frequency range [1]. The occurring frequencies of the spectral lines in the radiated signal are usually the fundamental frequency or harmonics of the corresponding rotational speeds of machines with rotating components such as propulsion engines or diesel generators. These tones are noticeable at large distances and even at low speeds. The combination of the frequencies of several lines in a pattern—the acoustic fingerprint—can lead to a classification and even contain information about the ship’s condition. To a large extent, sound radiation of those tones is generated by structure-borne sound transmitted through various transmission paths to the ship’s hull. Decreasing the radiated sound pressure is possible by reducing the transmissibility between the vibrating sound sources inside the ship and its hull as the receiving structure. This is achieved by well-established passive noise control measures, i.e., passive mounts [2,3]. Passive mounts like double-layer vibration isolation are less effective at low frequencies [4]. This is particularly relevant for the frequency range of the acoustic fingerprint. Thus, passive methods are supplemented in the lower-frequency range by active concepts. A widespread technology designed for that purpose and with many experimental applications is active vibration control (AVC) [5,6,7]. AVC in application to ship vibration comprises active mounts or actuators that are designed to reduce vibration transmission through the whole ship [8], of engines [9,10,11], of gearboxes [12,13], and of the bearing support of ship propulsion shafts [14].
AVC systems do not take into account the transmission behavior from the structure-borne sound excitation to the receiver medium. And even if active vibration isolation is successful, as shown in [2], various secondary sound paths like cables, pipes, and the surrounding cavity itself can impair the desired noise reduction success. With conventional feedforward AVC systems, only the frequency components contained in the disturbance signal can be influenced. However, noise control applied to mission-critical military systems is not just about reducing the emitted signature but rather about manipulating the signature to make it more difficult to analyze. A similar active concept aims to misrepresent the acoustic fields due to scattering by a rigid object. Since sound radiation caused by low-frequency hull vibrations is easily detected, it must be reduced as much as possible. On the other hand, unwanted amplification effects due to active noise reduction aiming for a target zero residual field should be avoided, whereas the deliberate amplification of spectral signature components can be an effective strategy for the purpose of anti-reconnaissance.
As a solution approach, Active Structural Acoustic Control (ASAC) takes into account the transmission behavior into the surrounding medium [15,16]. As with AVC, ASAC is suitable at low frequencies due to the lower modal density [17]. The two effects that lead to the reduction in radiated sound power or the radiated sound pressure at discrete points in the far field for a system with distributed actuators are the active damping of individual modes of vibration and the rearrangement of radiation-relevant structural modes to produce an ineffective radiator or to suppress sound radiation in the desired directions [18,19]. Both require that the sound radiation into the surrounding medium is observable, e.g., by sensors. The intended active control system should work just based on data measured on board. To overcome the problem of non-existing error sensors in water, the remote microphone technique for ASAC [20] is adopted to a remote hydrophone technique.
As mentioned in [21], many paths of sound transmission need to be controlled in order to manipulate the overall sound radiation. Thus, unwanted secondary transmission paths can be ignored by positioning control actuators close to the hull as the wave-bearing structure and main acoustic source. It is advantageous for use in ships that the reference signals recorded at the main noise sources are highly coherent with the disturbance signature emitted in the fluid. Thus, the input signal is sensed before it arrives at the plant, which allows using simplified and robust adaptive signal processing schemes in terms of feedforward control based on the Filtered-x Least Mean Square algorithm (FxLMS) [22,23]. For additional signature manipulation capabilities, the principle of Active Sound Design (ASD) from the automotive sector [24] can be applied, which is also known as “active sound profiling” [25] or “active sound quality control” [26]. These concepts have their origin in residual noise shaping principles, which are used to meet the requirements of human perception based on an Active Noise Equalizer (ANE) [27,28]. With ASD, a desired sound pressure level is retained by active control rather than full attenuation. Additionally, engine orders can be enriched, which felt insufficient in the first place. ASD has been extended to include an Active Sound Injection (ASI) mode in which engine noises are actively added to intensify the driving experience [29,30]. An approach of ASI requiring a minimal control effort in application to the acoustic signature of a surface ship model is presented in [31].
This paper deals with the experimental implementation of an ASD system for the manipulation of narrowband components of an acoustic signature of a steel ship model (scale 1:8) at a measurement facility in a lake. The water depth is 12 m approximating free-field conditions. Stochastic disturbances are not part of the content. Section 2 presents details of the ship model, the experimental setup, and the signal processing of the active control strategies ANE and ASI. Both together will be referred to as ASD in the remainder of the manuscript. It is known from several earlier studies that ASAC systems with control actuator positions that do not coincide with discrete vibrational power insertion points can lead to spatial control spillover [19,32]. This can result in an increased radiated sound power and hence a larger detection range, which should be avoided. Thus, in Section 3, specific attention is paid to the change in the vibroacoustic measured variables when the active control system is switched on. Conclusions are drawn in Section 4 and Section 5.

2. Experiment

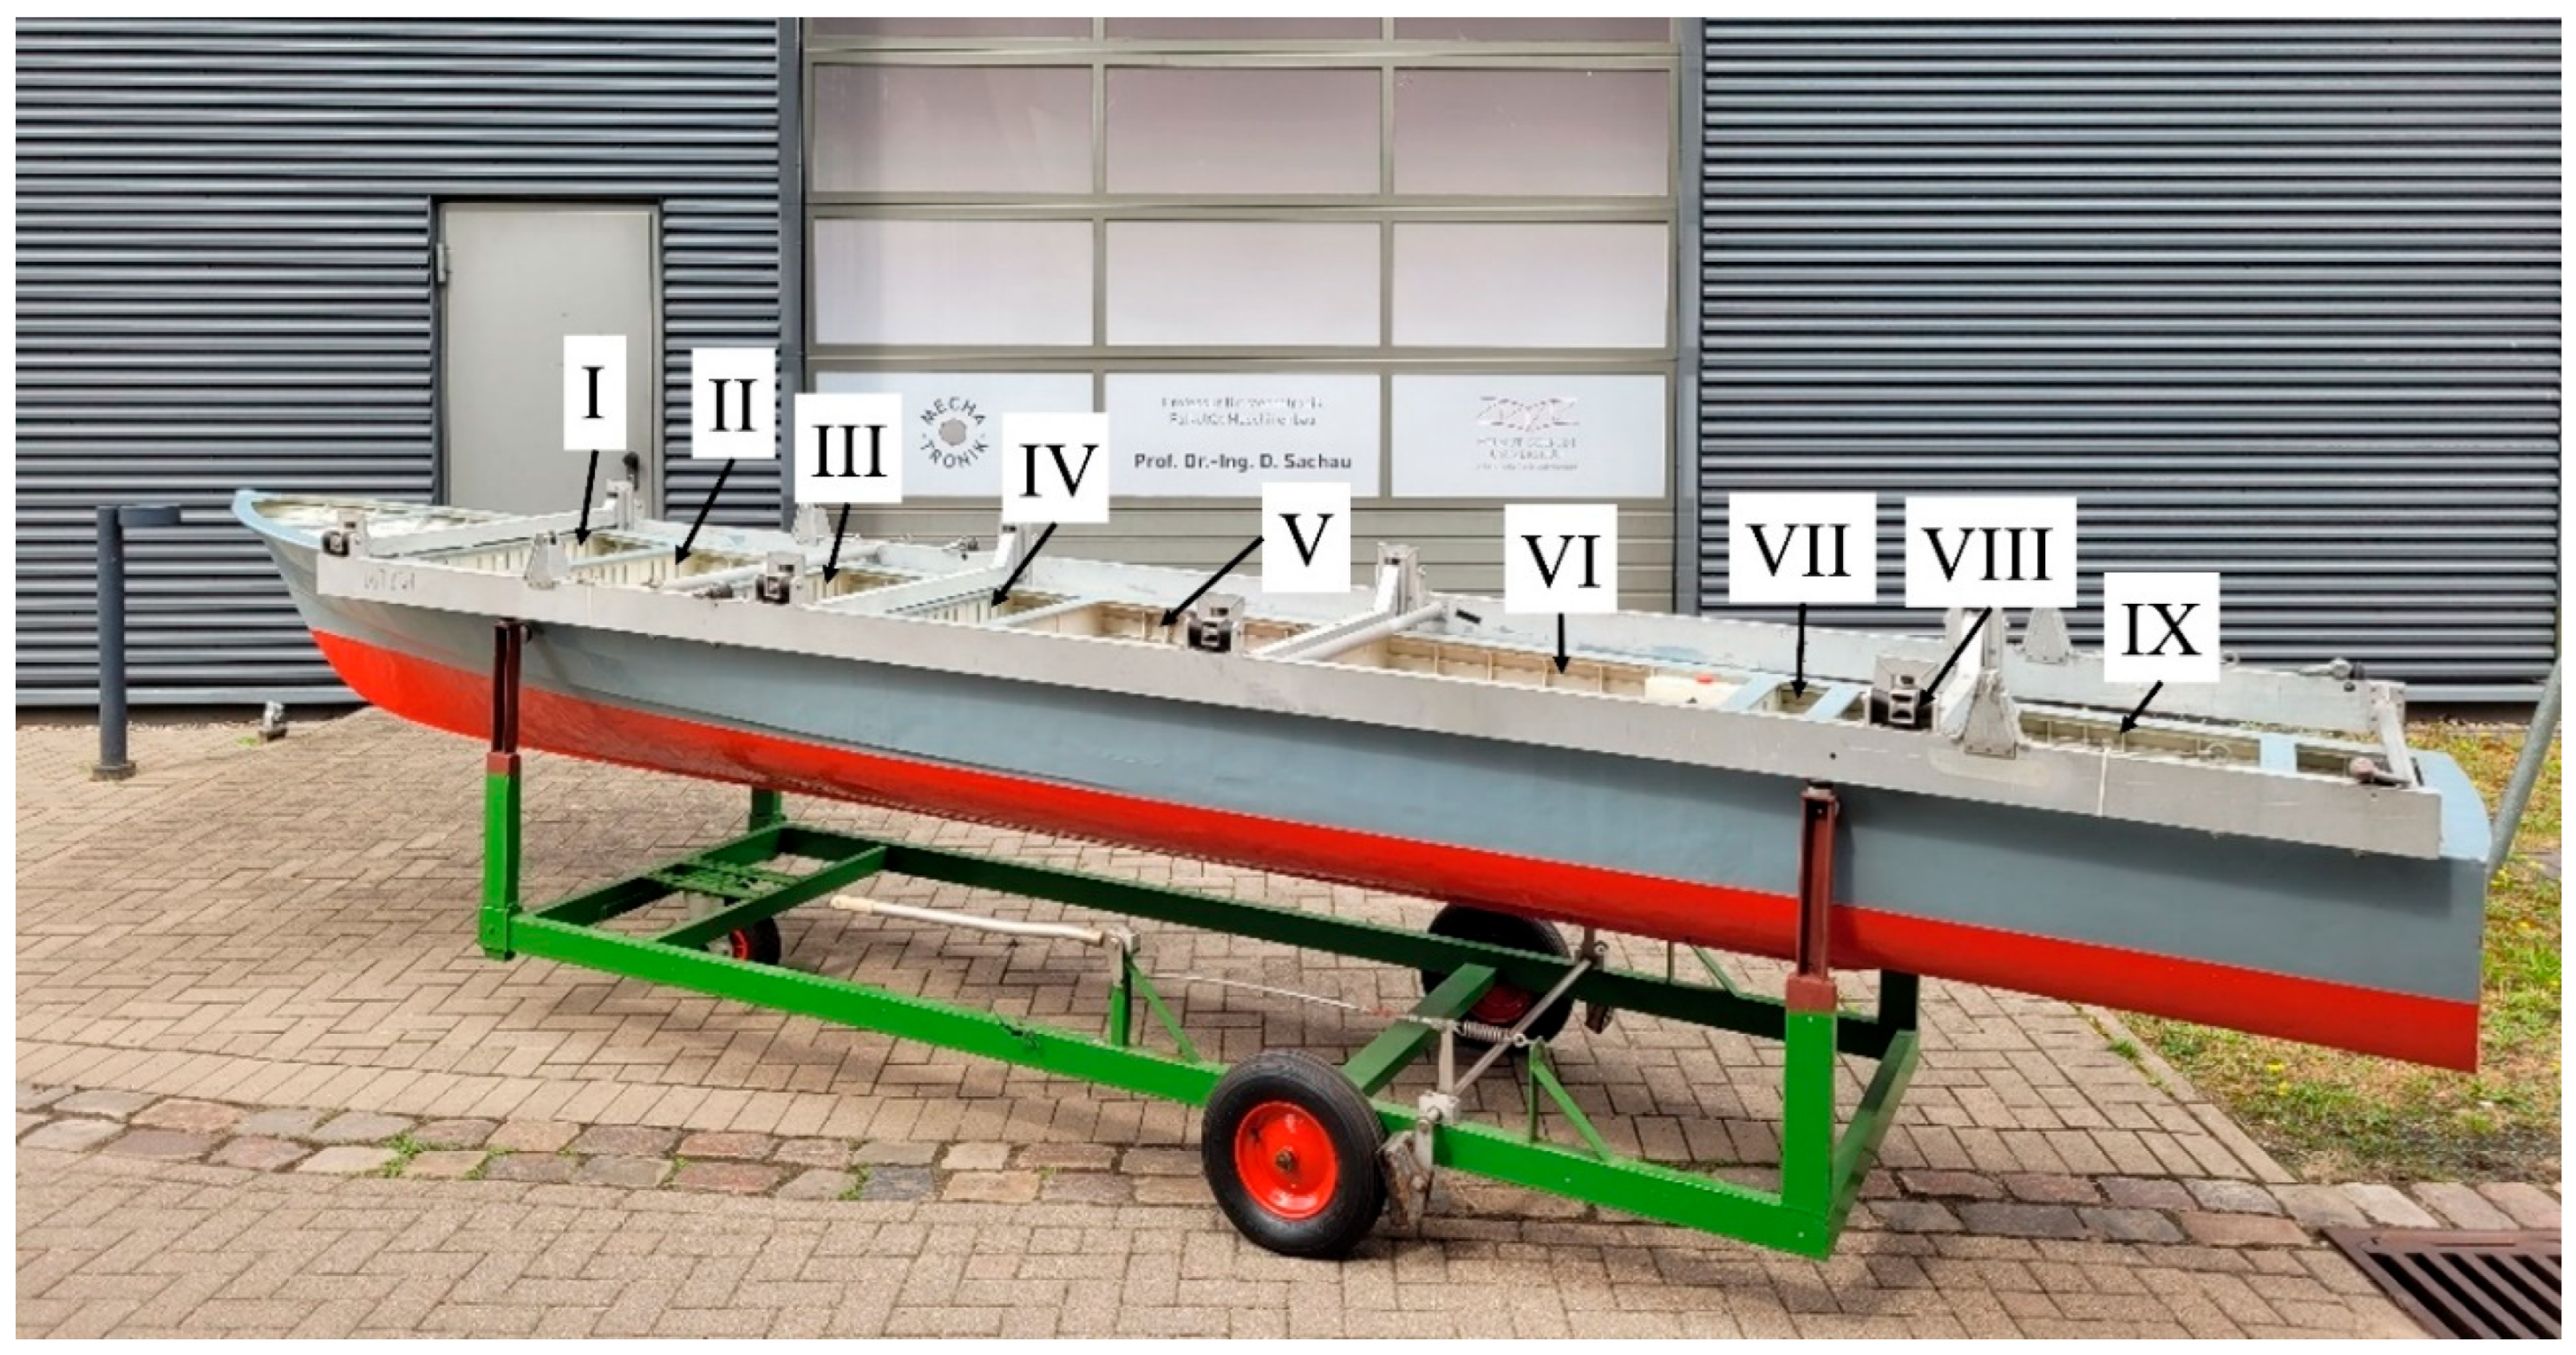
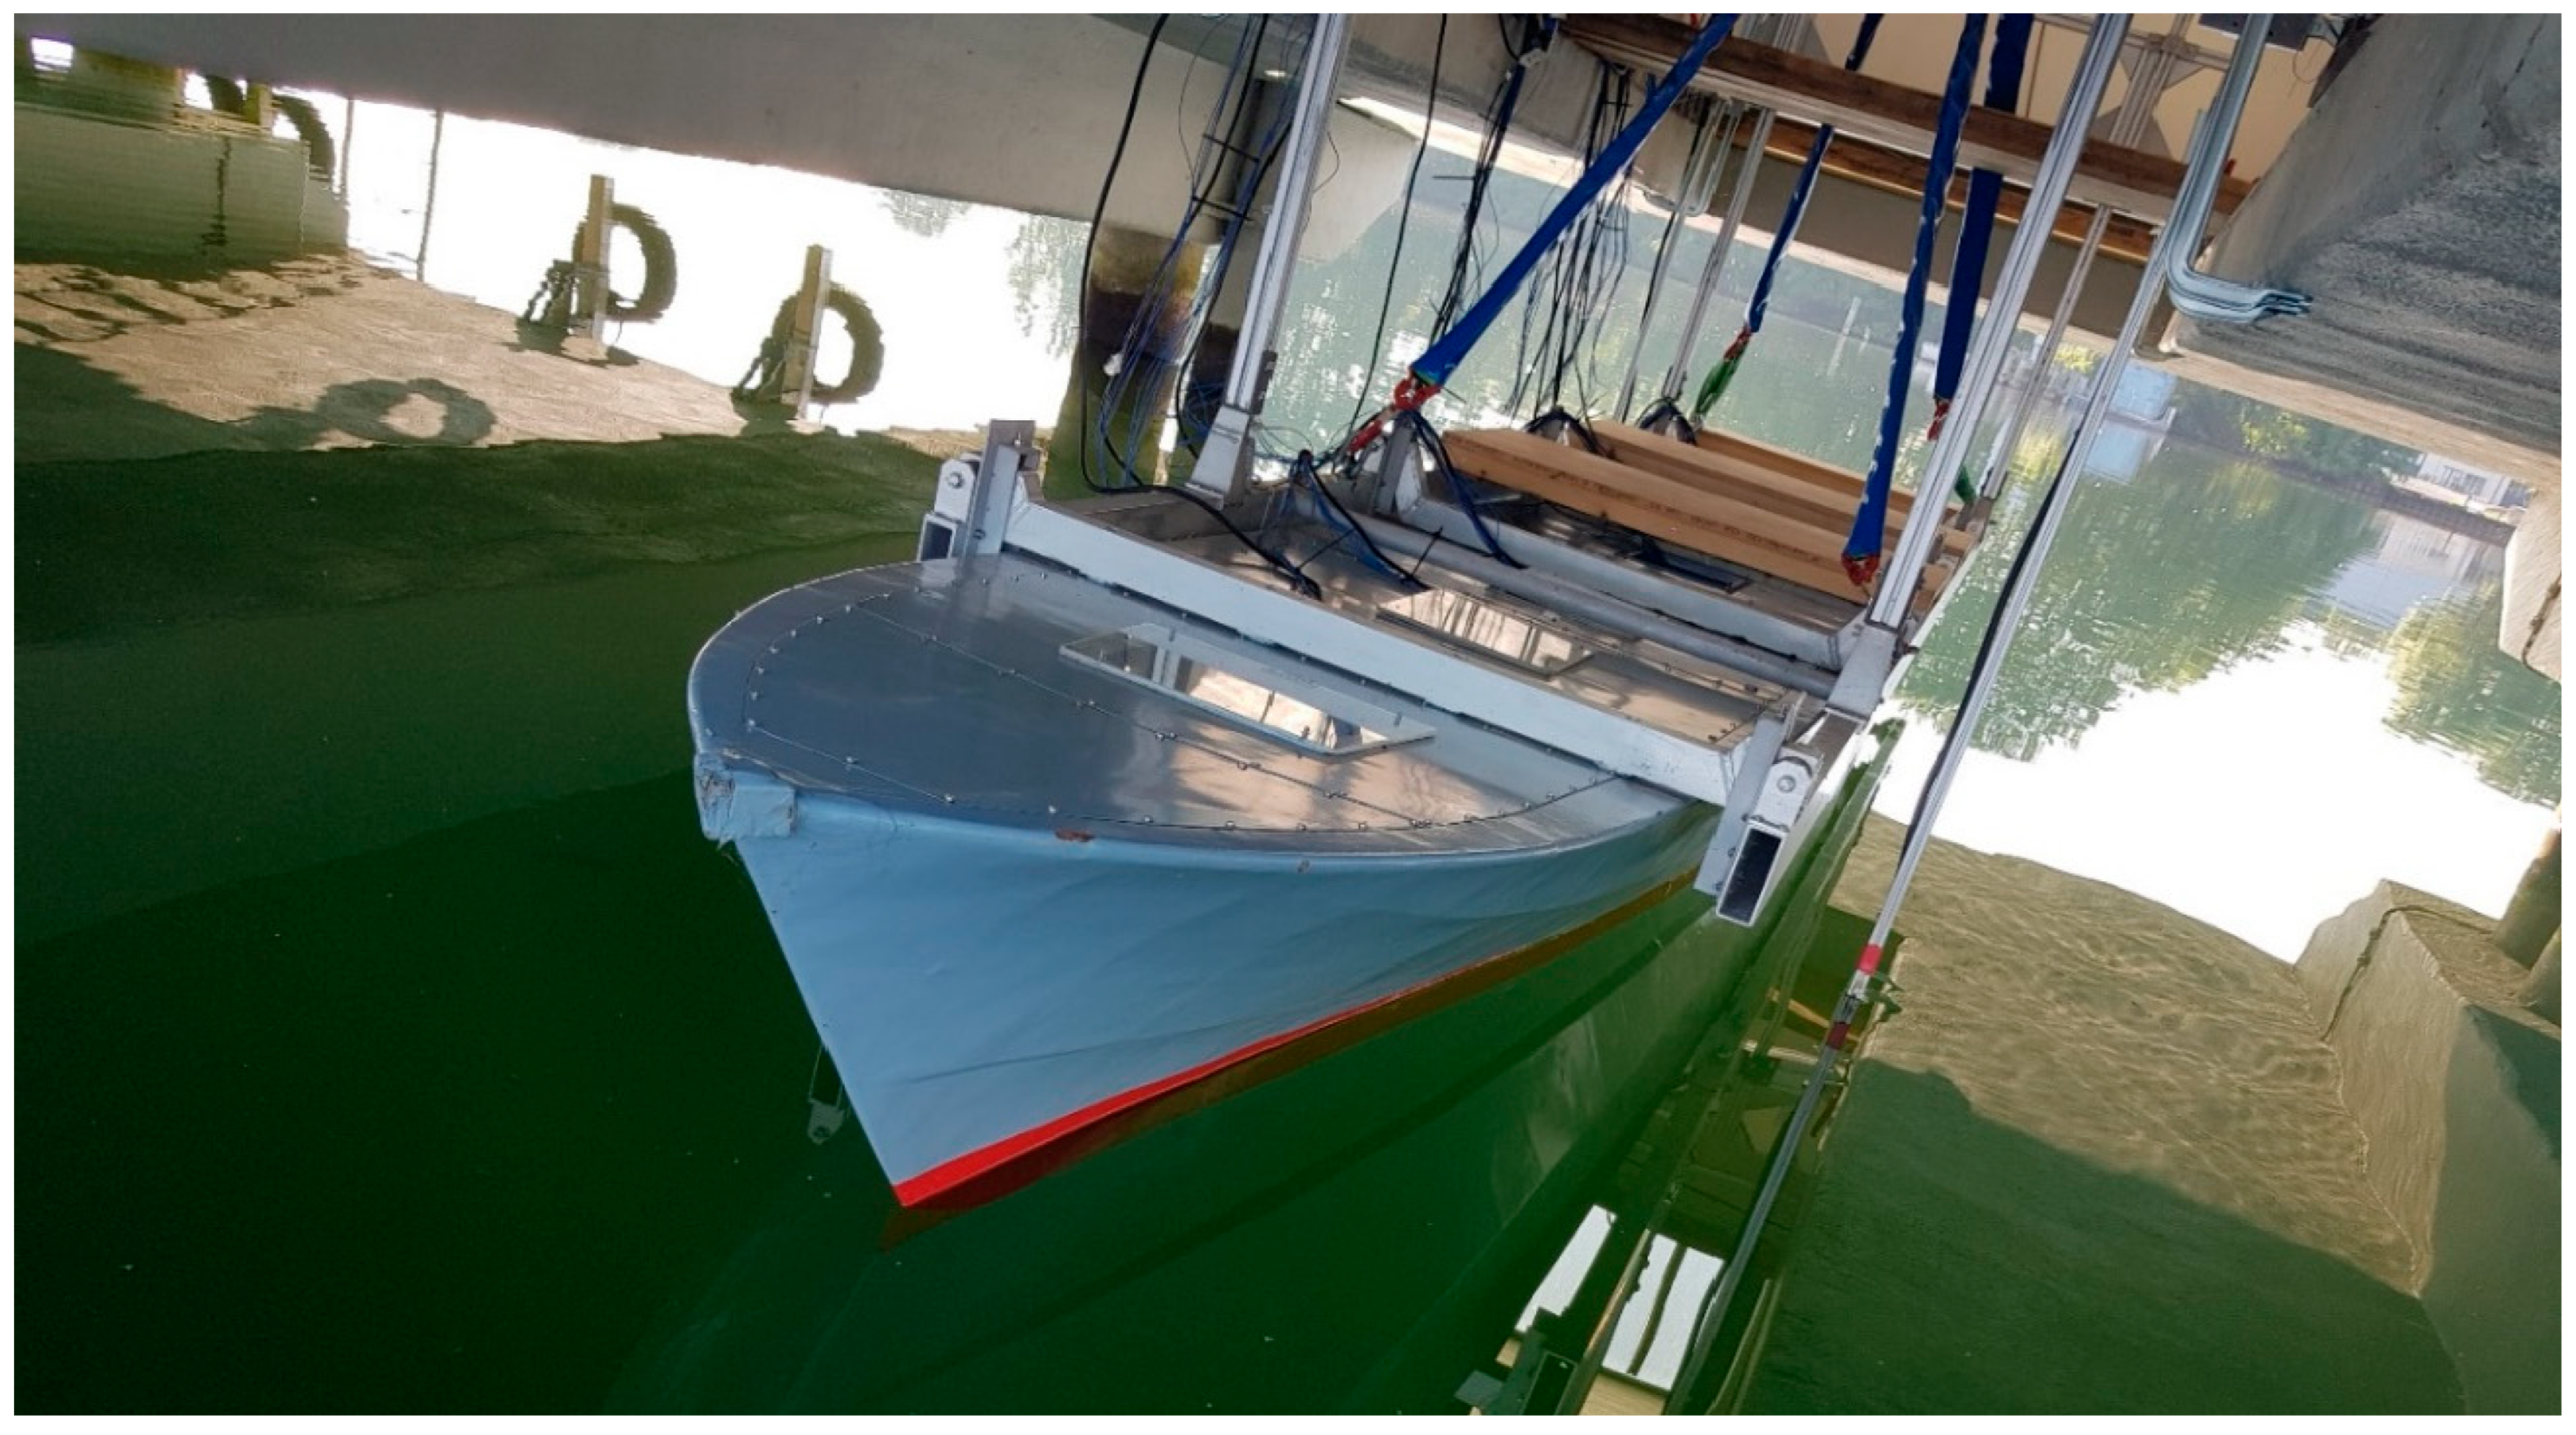
For the experimental test procedure, a ship model and a measurement facility in Lake Plön, Germany, are available; see Figure 1. Because no motorboats are allowed on the lake, the ambient noise level there is suitable for obtaining a sufficient signal-to-noise ratio. The structural ship model in Figure 2 is composed of steel, has a total length of 5.85 m, a beam of 0.90 m, and a 0.5 mm thick hull skin. It reproduces a fast-attack craft of class 148 of the German navy and achieves geometric as well as acoustic similitude [33]. Deck installations, aggregates, and propulsion systems are not included in the model.

2.1. Experimental Setup

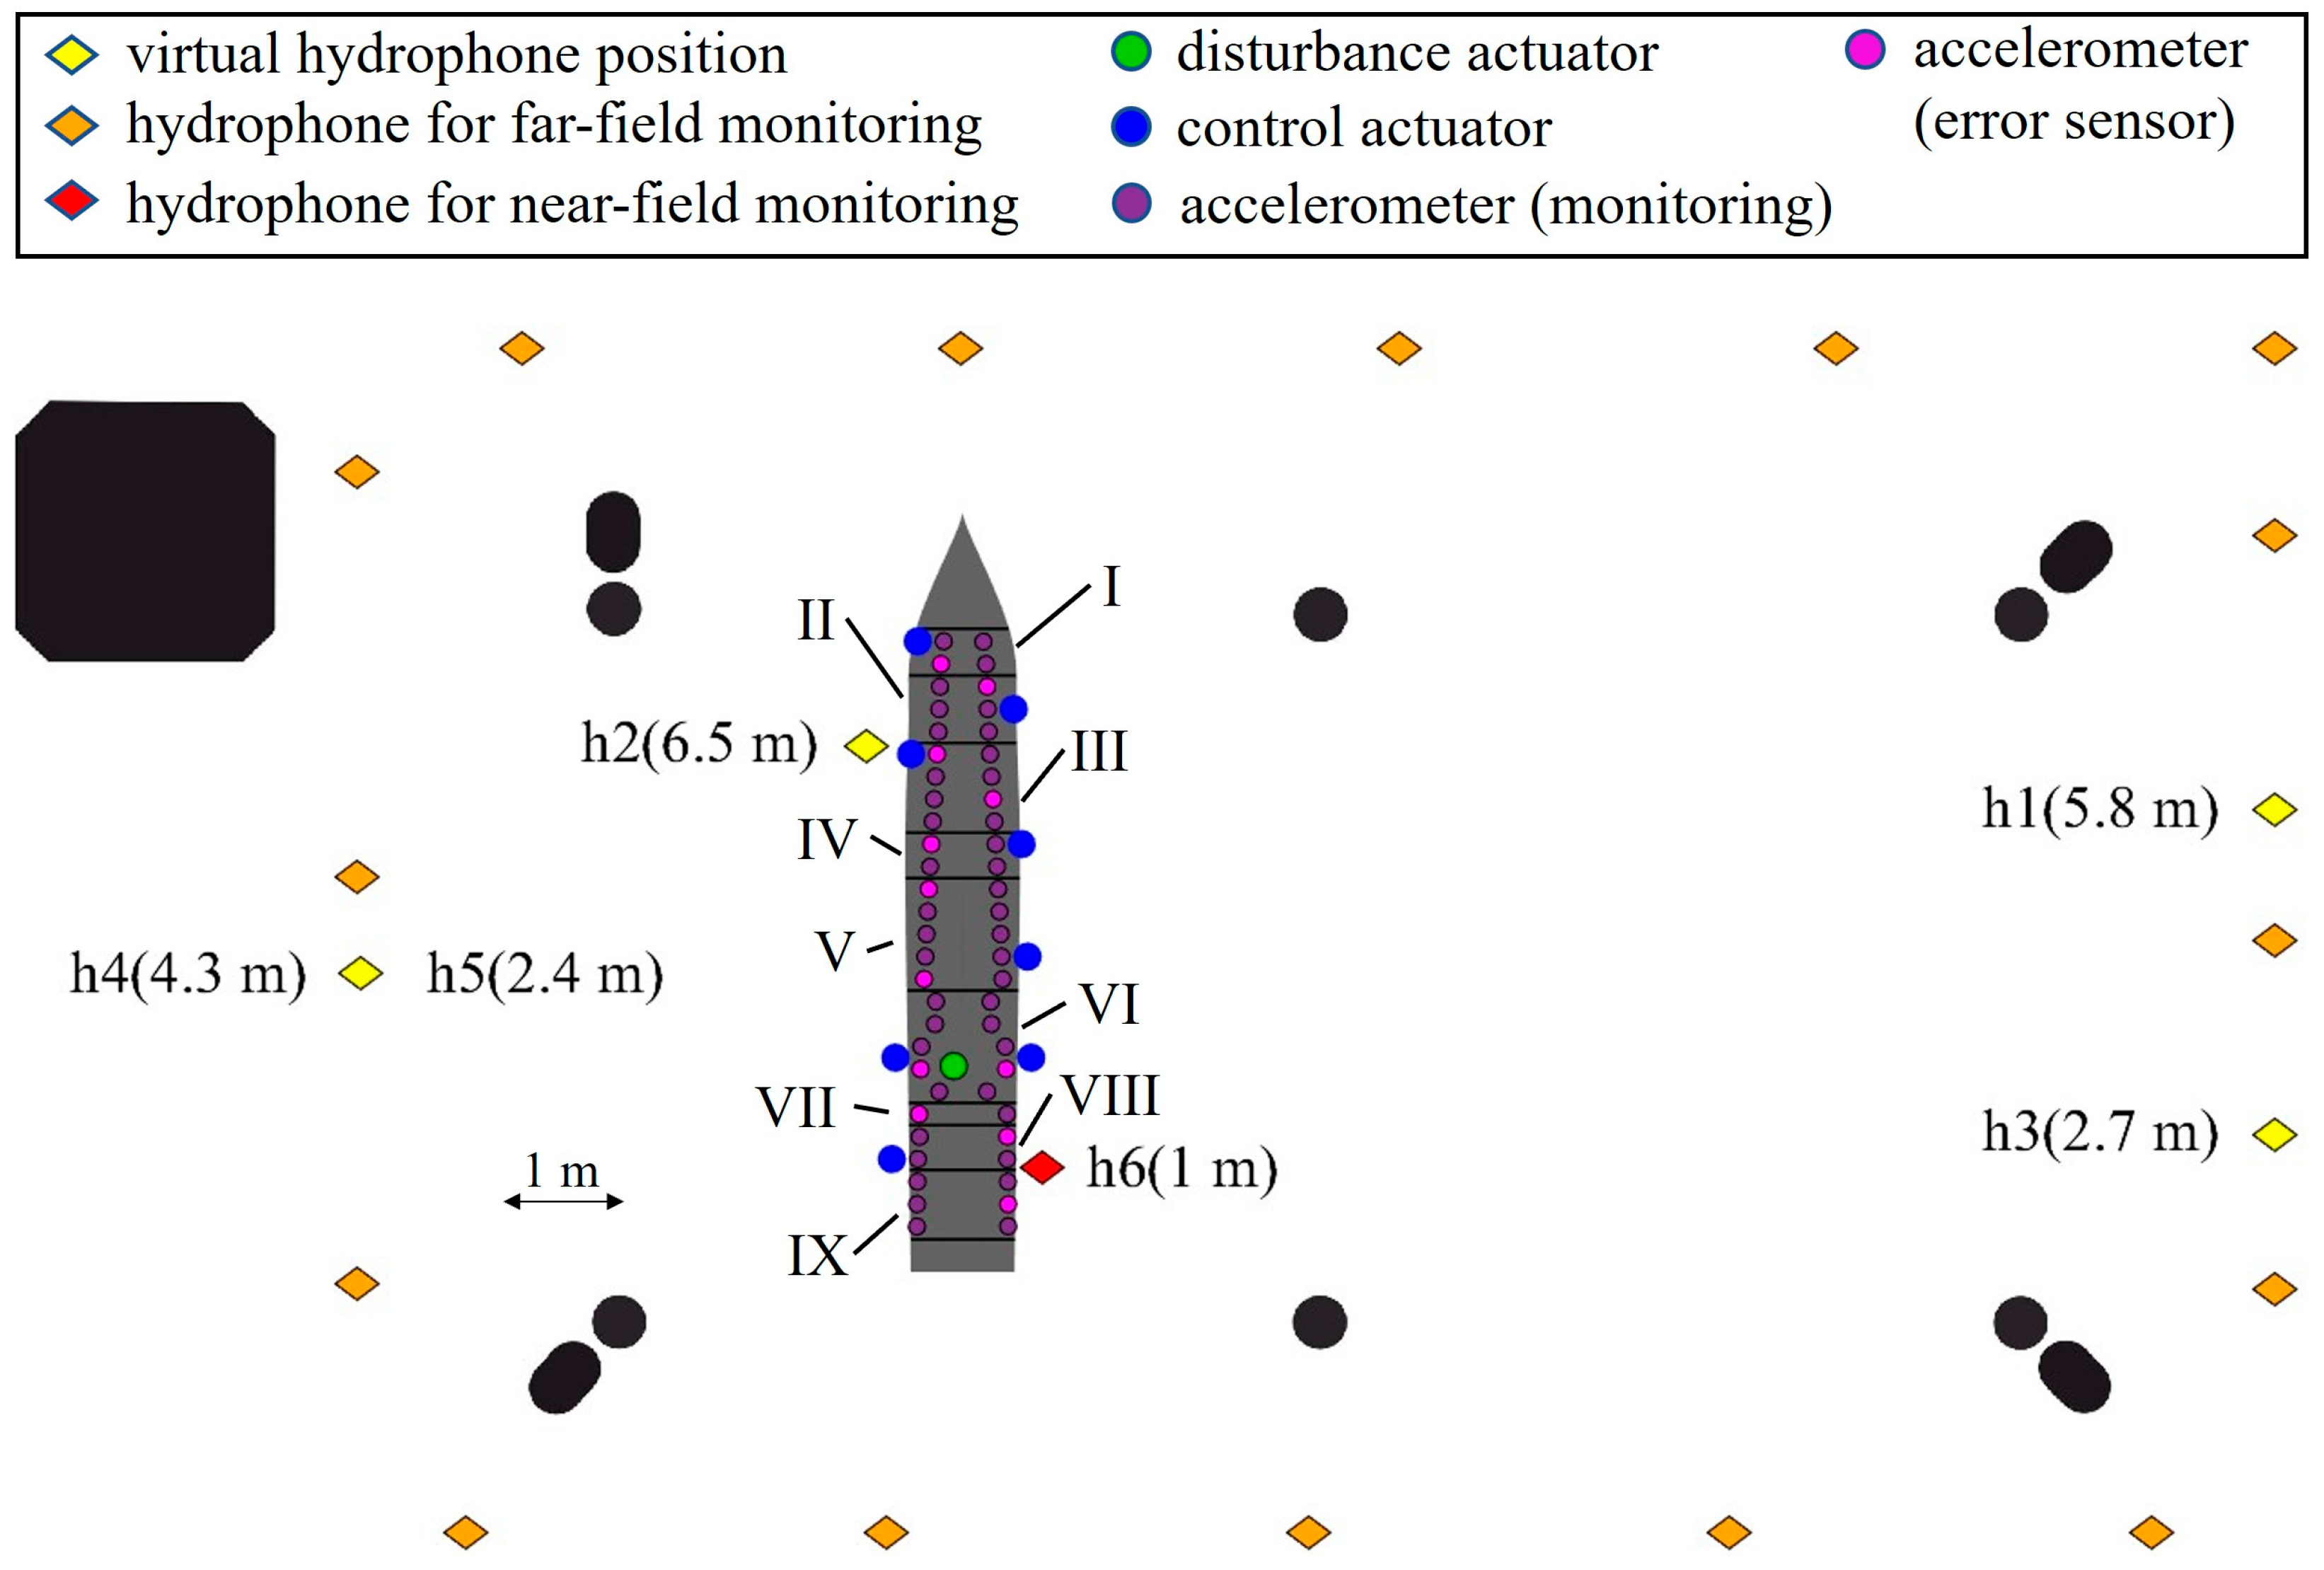
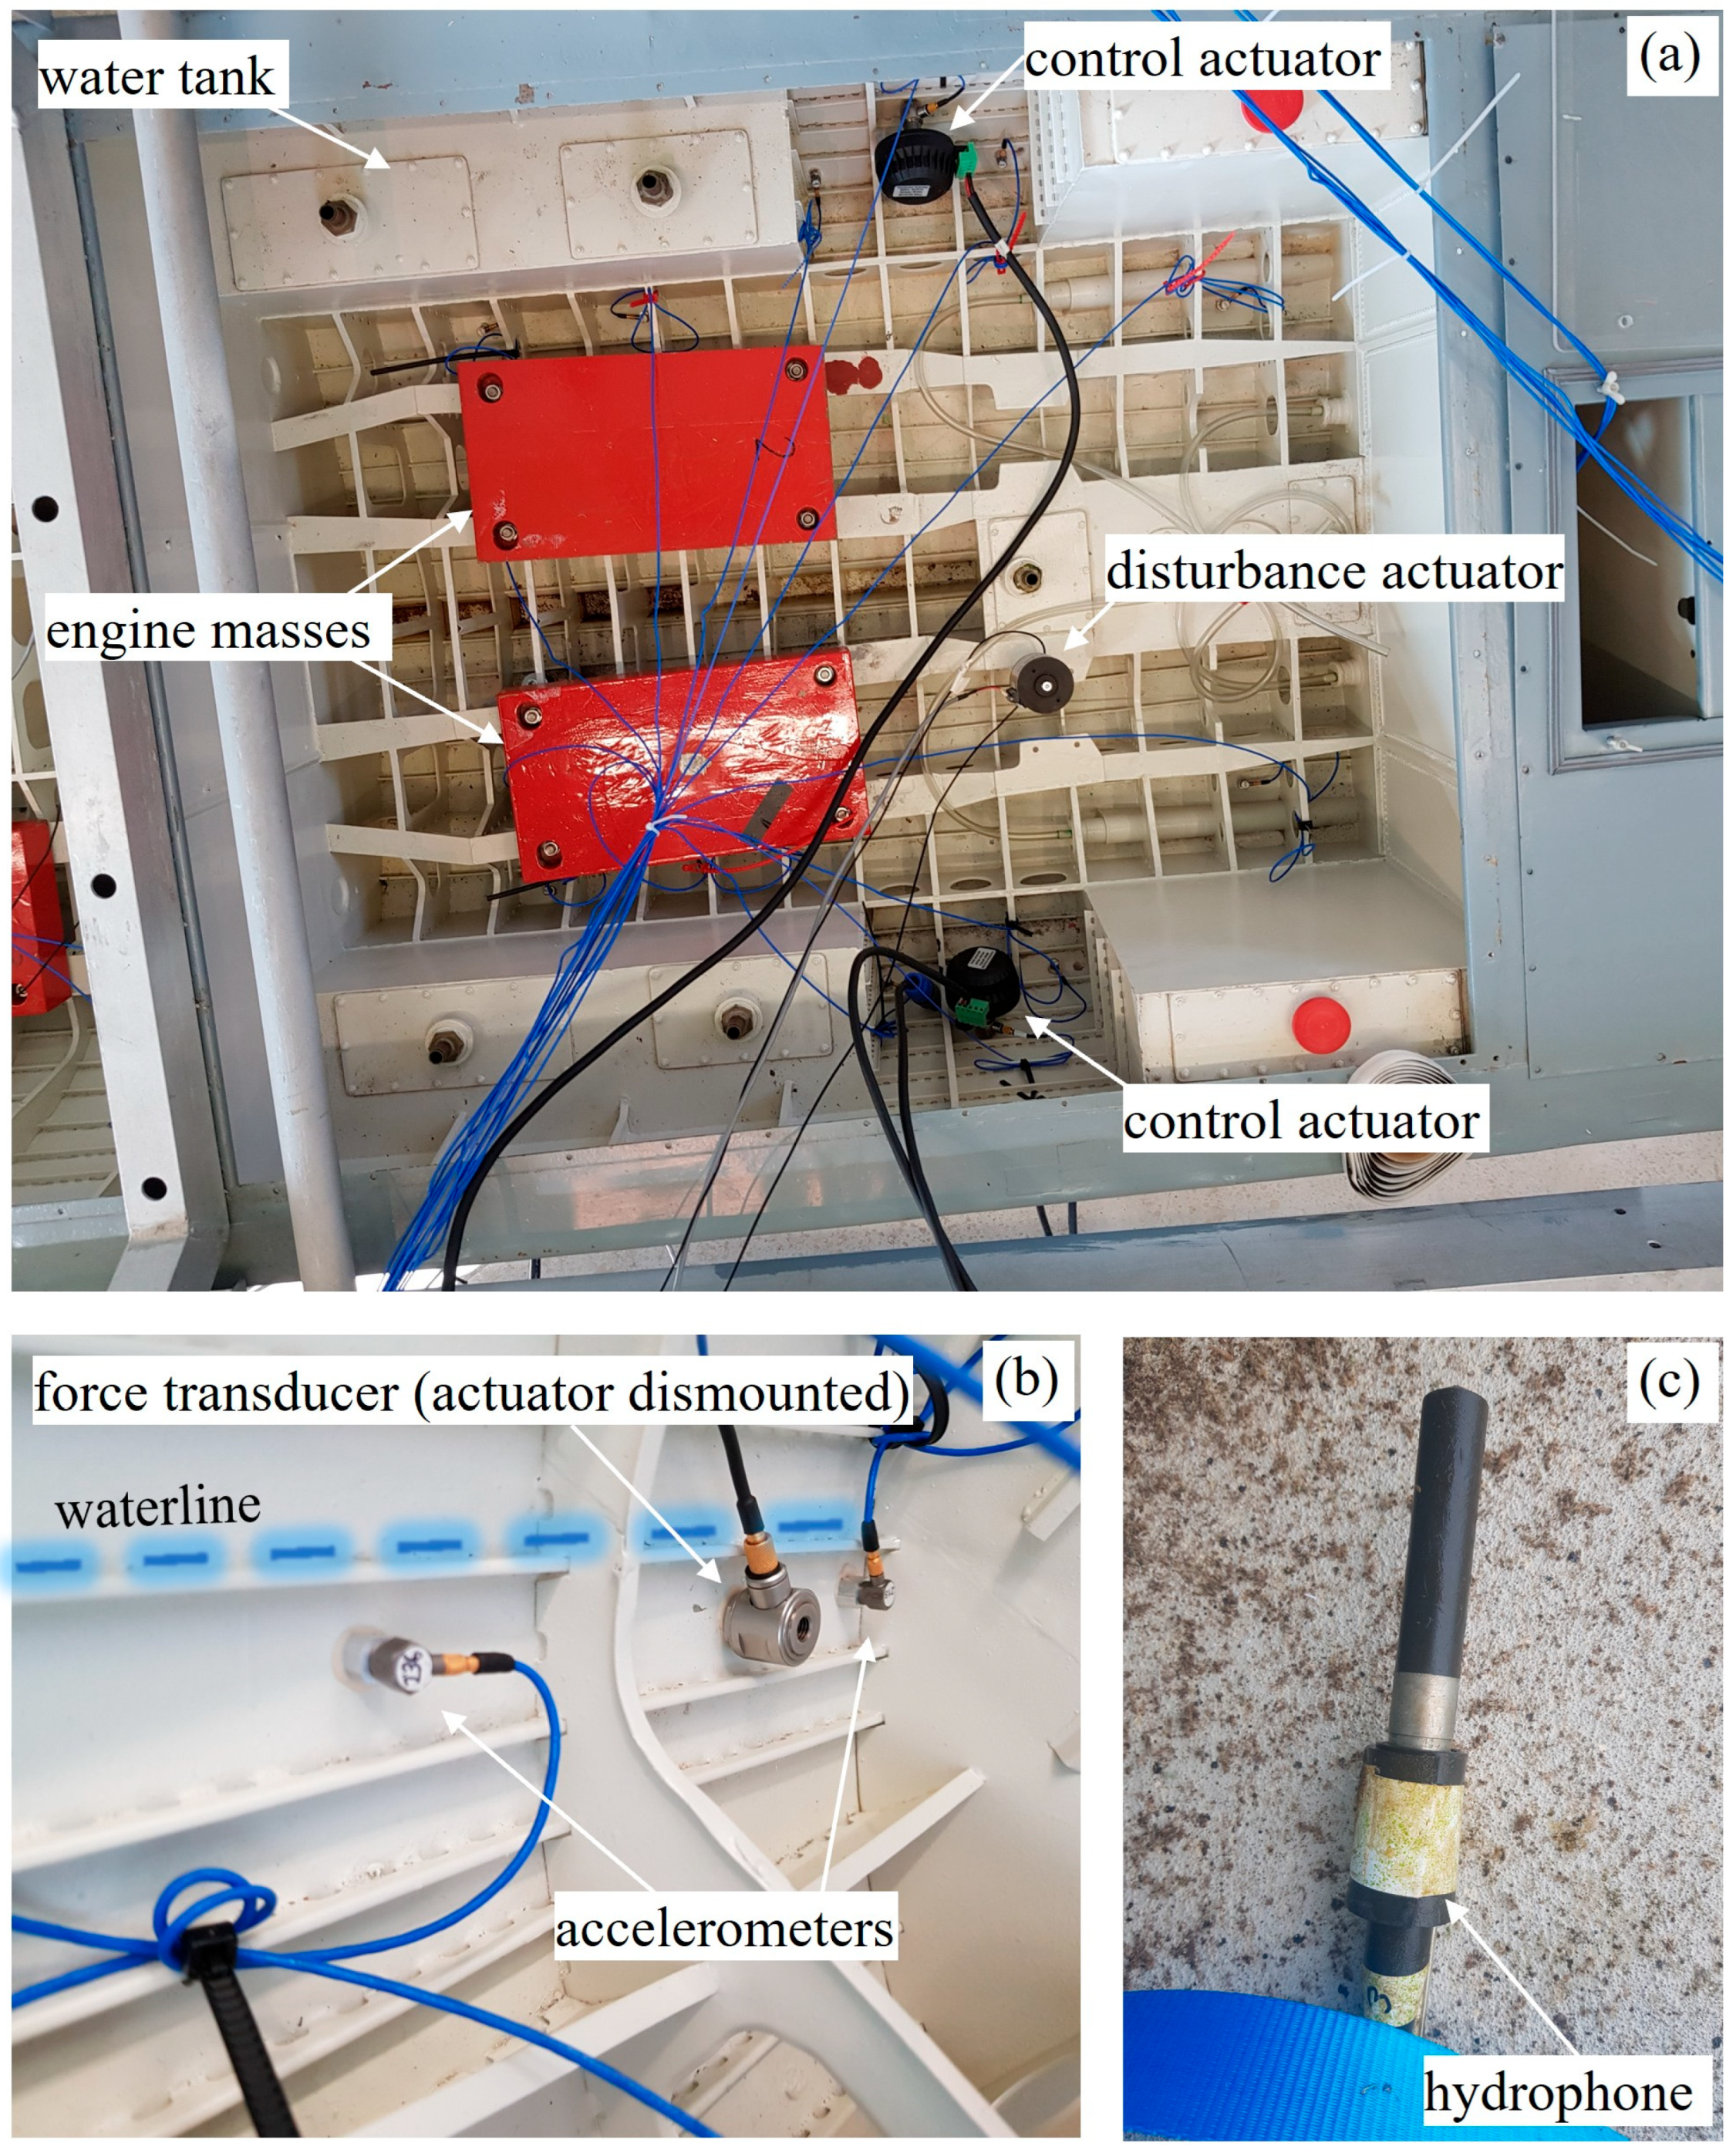
During all measurements the ship model is suspended in a fixed frame using four crossbars that are fastened with transverse bulkheads. The bulkheads divide the ship model into nine sections (I–IX) containing different combinations of sensors and actuators. The ship model is fixed under the measurement platform with a static draught of 0.25 m; see Figure 3. The test environment is shown schematically in Figure 4, looking down onto the water surface. The active control configuration described here is installed inside the ship model with eight control actuators (AS1101/E3, Kendrion N.V., Amsterdam, The Nederland), which are mounted on the inner hull skin above girders; see Figure 5. Those secondary actuators generate a field superimposed on the primary field to realize the target signature. The actuators are illustrated adjacent to the accelerometers in Figure 4. Force transducers (DeltaTron 8230-001, Hottinger Brüel & Kjaer GmbH, Darmstadt, Germany) are mounted between each inertial actuator and the ship’s hull.
Structural normal vibration velocities on board are measured via 54 one-axis accelerometers (M352C65 and 4507, PCB Piezotronics Inc., Depew, NY, USA and Hottinger Brüel & Kjaer GmbH) surface mounted with a regular approximate distance of 0.15 m to each other on the inner hull skin in the height of the waterline. A subset of 12 accelerometers is used for measuring the input (error) signals of the active control system. The active control configuration represents a robust design using a genetic algorithm considering amplitude and phase mismatches due to frequency shifts in measured plant matrices according to [34]; see also [35]. As shown in Figure 4, the accelerometers are located more centrally at the bow because the ship model is narrower there. In ship section VI, the water tanks do not permit the installation of all accelerometers at the same height. A force actuator (K2002E01, The Modal Shop Inc., Cincinnati, OH, USA) is used as the primary noise source generating the actual signature representing the disturbance at different sensor groups, i.e., the primary structural velocity field at the acceleration sensors and the sound pressure field at the hydrophones. The primary actuator is attached to a frame via a screw connection in the vicinity of scaled engine masses through an impedance head (8001, Brüel & Kjær, Narum, Denmark). In total, six hydrophones (8101, Brüel & Kjær) are in use, where the hydrophone h 6 is very close to the ship model with an approximate distance of 1 m (near-field monitoring); see Figure 4. The other five hydrophones ( h 1 h 5 ) are used for off-line system identification as part of the virtual hydrophone concept. The hydrophones h 4 and h 5 are installed at the same location at different heights. An additional hydrophone is used to sequentially measure the influence of the active control system on the sound field at 16 positions surrounding the measurement facility at the depths of 4 m and 8 m beneath the water surface (far-field monitoring). A real-time control system (MicroLabBox, dSPACE GmbH, Paderborn, Germany) is used to implement the digital adaptive filter designs at a sampling rate of 2 13 Hz where analog anti-aliasing filters are used as input/output interfaces. The eight control signals for the actuators’ loads are amplified (STA-1508, Monacor International GmbH, Bremen, Germany). By using 12 accelerometers, 8 secondary actuators, and 5 virtual hydrophones, the dimensions of the system of equations of the active control system are fixed and will be used throughout the following section.

2.2. Signal Processing

As mentioned in the Introduction section, active signature manipulation should enable a reduction in and amplification of the actual radiated sound pressure as well as the insertion of artificial sounds. Accordingly, approaches from the fields of active noise and vibration control are used. Two cases are considered in Figure 6 and Figure 7, in which all variables are treated frequency-wise using complex notation at a discrete time instance for the entire block diagrams. The caret notation indicates quantities that result from measured plant models. Variables with tilde represent signals inside the control system. The transition between the frequency and the time domain is carried out using the Fast Fourier Transform (FFT) with an overlap of 50% and with von Hann windowing. With the assumption of a reference signal x C 1 × 1 from a noise source being available, the principle of feedforward control is used. The reference signal is taken from the force signal measured at the impedance head. The voltage signals u C 8 × 1 of the control actuators are adapted to minimize the difference between primary and secondary field data, i.e., error signals measured by accelerometers on the sound-radiating structure e a C 12 × 1 or measured by hydrophones in water e h C 5 × 1 .
In the first case, a present tonal signature component is to be reduced or amplified to a predefined level. The ANE control concept for residual noise shaping of narrowband signals according to [28] is used for that case, introducing the amplification parameter η R 1 × 1 and a so-called pseudo-error signal
e ~ h = O ^ d a + G ^ h u ,
with
G ^ h = 1 η O ^ G a G ^ a + G ^ h .
In Figure 6, d a C 12 × 1 and d h C 5 × 1 denote periodic disturbance signals, where G a C 12 × 8 and G h C 5 × 8 represent secondary paths. The secondary path models are measured in an off-line identification procedure, activating all eight secondary actuators one after the other with the tone complex of the actual signature. Thus, transfer functions between the actuation voltage of the respective actuator and all sensor signals are determined according to equation 7.10 in [36]. Arithmetic averaging is performed over 20 FFT blocks, whereby all variables to be stored are measured or subsequently calculated from measured variables. The primary paths are denoted by P a C 12 × 1 and P h C 5 × 1 . The ANE is combined with the principle of virtual sensors according to [20] using the observation matrix
O ^ = d ~ h d ~ a H d ~ a d ~ a H 1 .
The superscript H denotes the Hermitian transpose. By implementing this equation, no hydrophones in the water are required as error sensors during adaptation. As for G ^ a and G ^ h , O ^ is obtained by pre-measurements switching on the disturbance sources. By minimizing the pseudo-error e ~ h using the cost function
J ANE = e ~ h H e ~ h + β u H u ,
The difference between the specified sound pressure and actual values at the hydrophones is minimized. According to [37,38] the regularization parameter β adjusts the control effort. The filter weights are adapted in principle coordinates of the plant model in the secondary paths, i.e.,
G ^ h = U h Σ h V h H ,
in order to enhance the convergence rate. Thus, with the Compact Singular Value Decomposition (CSVD) [39], the multiple-input/multiple-output control channels are decoupled. In the resulting transform domain version of the multichannel FxLMS algorithm, convergence rates can be set for each singular mode independently. U h C 5 × 5 and V h C 8 × 5 are pseudo-unitary matrices, because they are not necessarily square. Σ h is a diagonal matrix with singular values σ h on its main diagonal. The update equation in C in Figure 6 for the discrete time instance n is given with the following:
w n + 1 = V h I 2 M h β V h H w n 2 V h M h Σ h x n U h H e ~ h n .
Here, M h R 5 × 5 is a diagonal matrix
M h = 1 / 100 Σ h 1 ,
with step size parameters on its main diagonal. I is the identity matrix. Equation (7) is a reasonable first estimate. During the experiments, values on the main diagonal of M h connected to control modes with very slow convergence had been increased manually. The convergence and stability properties of the practical control algorithm ANE with the matrix of the responses to the physical plant defined in Equation (2), G h , are well documented in [40].
However, the update equation in Equation (6) is not mandatory, and the convergence properties are not examined further herein. Considering the steady state solution
u = G ^ h H G h + β I 1 G ^ h H O ^ d a ,
reveals that the influence of plant model errors G a G ^ a in Equation (2) on the solution of the steepest-descent algorithm decreases when η approaches one and vice versa.
In the second case, a stochastic signal is present as the primary path, to which a periodic signal is to be superimposed. It is assumed that the RMS value of the amplitudes of the disturbance signals d h and d a in the narrow band under consideration are of the same order of magnitude as the measurement noise. For this case, the principles of sound field generation according to [25,41,42] are used in Figure 7. In that case, a pseudo-reference signal x is fed forward to the adaptation algorithm.
The target vibration velocity distribution c C 12 × 1 is determined by the weighting of the control modes via the column matrix q . The CSVD in Equation (5) sorts the source modes according to the size of the associated singular values, so that the first pressure–source mode pair, filtered by q = [ 1 , 0,0 , 0,0 ] T , requires the least control effort [31]. The superscript T denotes the matrix transpose. With the assumption of exact plant models, the error function
e ~ a = G a u G ^ a V h q ,
is set to zero by voltage signals representing the first source mode, e.g., the first column of V h . The cost function for the ASI control structure is defined as follows:
J ASI = e ~ a H e ~ a + β u H u .
In equivalence to the ANE control scheme, filter weights are adapted in principle coordinates of the pre-measured plants in the secondary paths of the vibration velocity, i.e.,
G ^ a = U a Σ a V a H ,
with singular values σ a on the main diagonal of Σ a C 8 × 8 and with U a C 12 × 8 and V a C 8 × 8 containing velocity and structural source modes in their columns. The update equation in C for the discrete time instance n of the ASI algorithm is given with the following:
w n + 1 = V a I 2 M a β V a H w n 2 V a M a Σ a x n U a H e ~ a n .
M a R 8 × 8 is a diagonal matrix with step size parameters on its main diagonal, which are chosen to be proportional to the structural singular values, i.e.,
M a = 1 / 100 Σ a 1 .
The control systems in Figure 6 and Figure 7 are realized via Matlab/Simulink. The regularization parameter is set to β = 10 4 , which is a practical tradeoff between stability and control performance. This parameter may also be implemented as a matrix to enhance the stability of single pressure–source mode pairs. For adaptive control, the primary actuator then generates the actual signature consisting of a sum of tones. According to the block diagram in Figure 6, the target Δ L A N E for the signature change within the ANE control scheme results from the selection of η with
Δ L A N E = 20 log 10 η .
The signature target of the control structure in Figure 7 is set via the weighting of the first source mode:
L A S I = 20 log 10 R M S G ^ h V h q / p 0 ,
with
q = [ a , 0,0 , 0,0 ] T .
Thus, the parameter a results from the quadratic mean level specified at the five virtual hydrophone positions in Figure 4 with p 0 = 1   μ P a . The results of Equations (14) and (15) can be noticed as green lines in Figure 8a.

3. Results

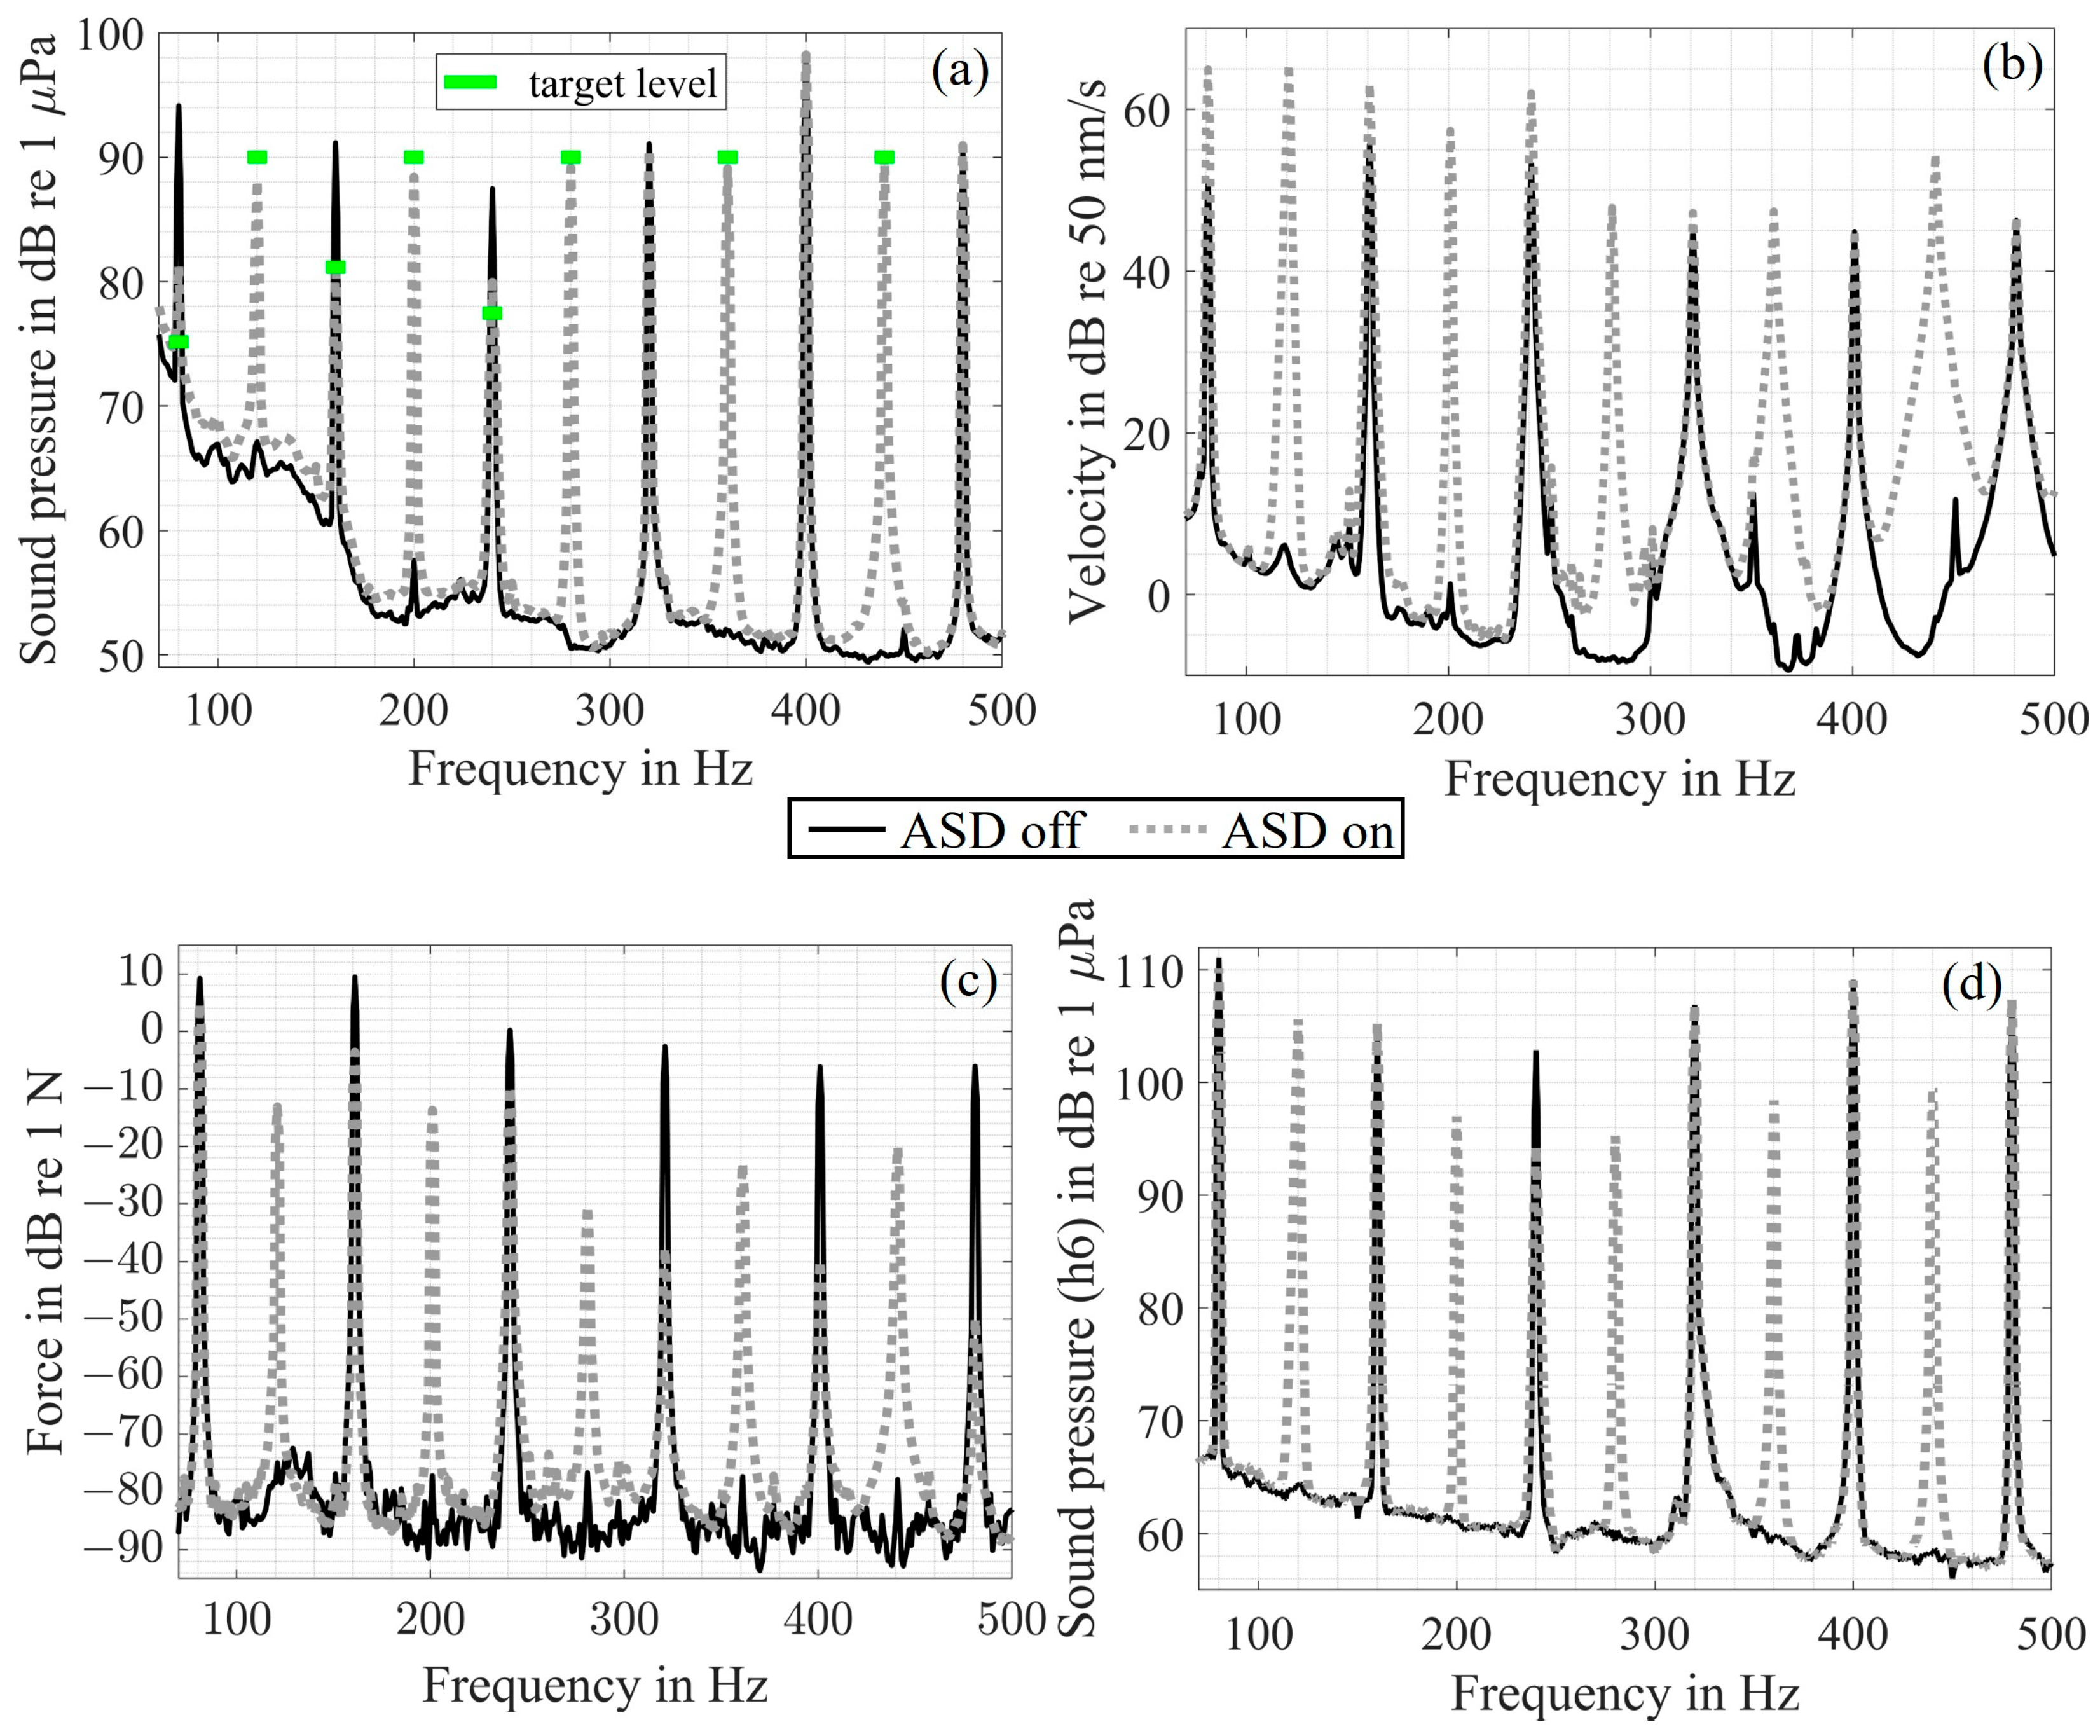
In the chosen measurement scenario, the first three harmonics (ANE-frequencies) of a synthesized engine noise signal, frequency scaled by a factor of eight, are reduced to a pre-defined target sound pressure level using Equation (14). Furthermore, additional harmonics (ASI-frequencies) are to be added to the actual signature simulating artificial engine orders according to the principle shown in Figure 7. The target value L A S I is chosen with 90 dB. Three tones in the actual signature remain unchanged. The RMS levels across three sensor groups as well as the sound pressure at hydrophone h6 achieved after adaptation are depicted in Figure 8. Similar results are remeasured several hours before and after the original test. Accordingly, the variability in the experimental methods can be determined based on a limited number of data sets presented in Appendix B. The differences between the target levels and measured sound pressure levels after the adaptation process comprise a standard deviation of 3 dB for the ANE-frequencies and of 2 dB for the ASI-frequencies.
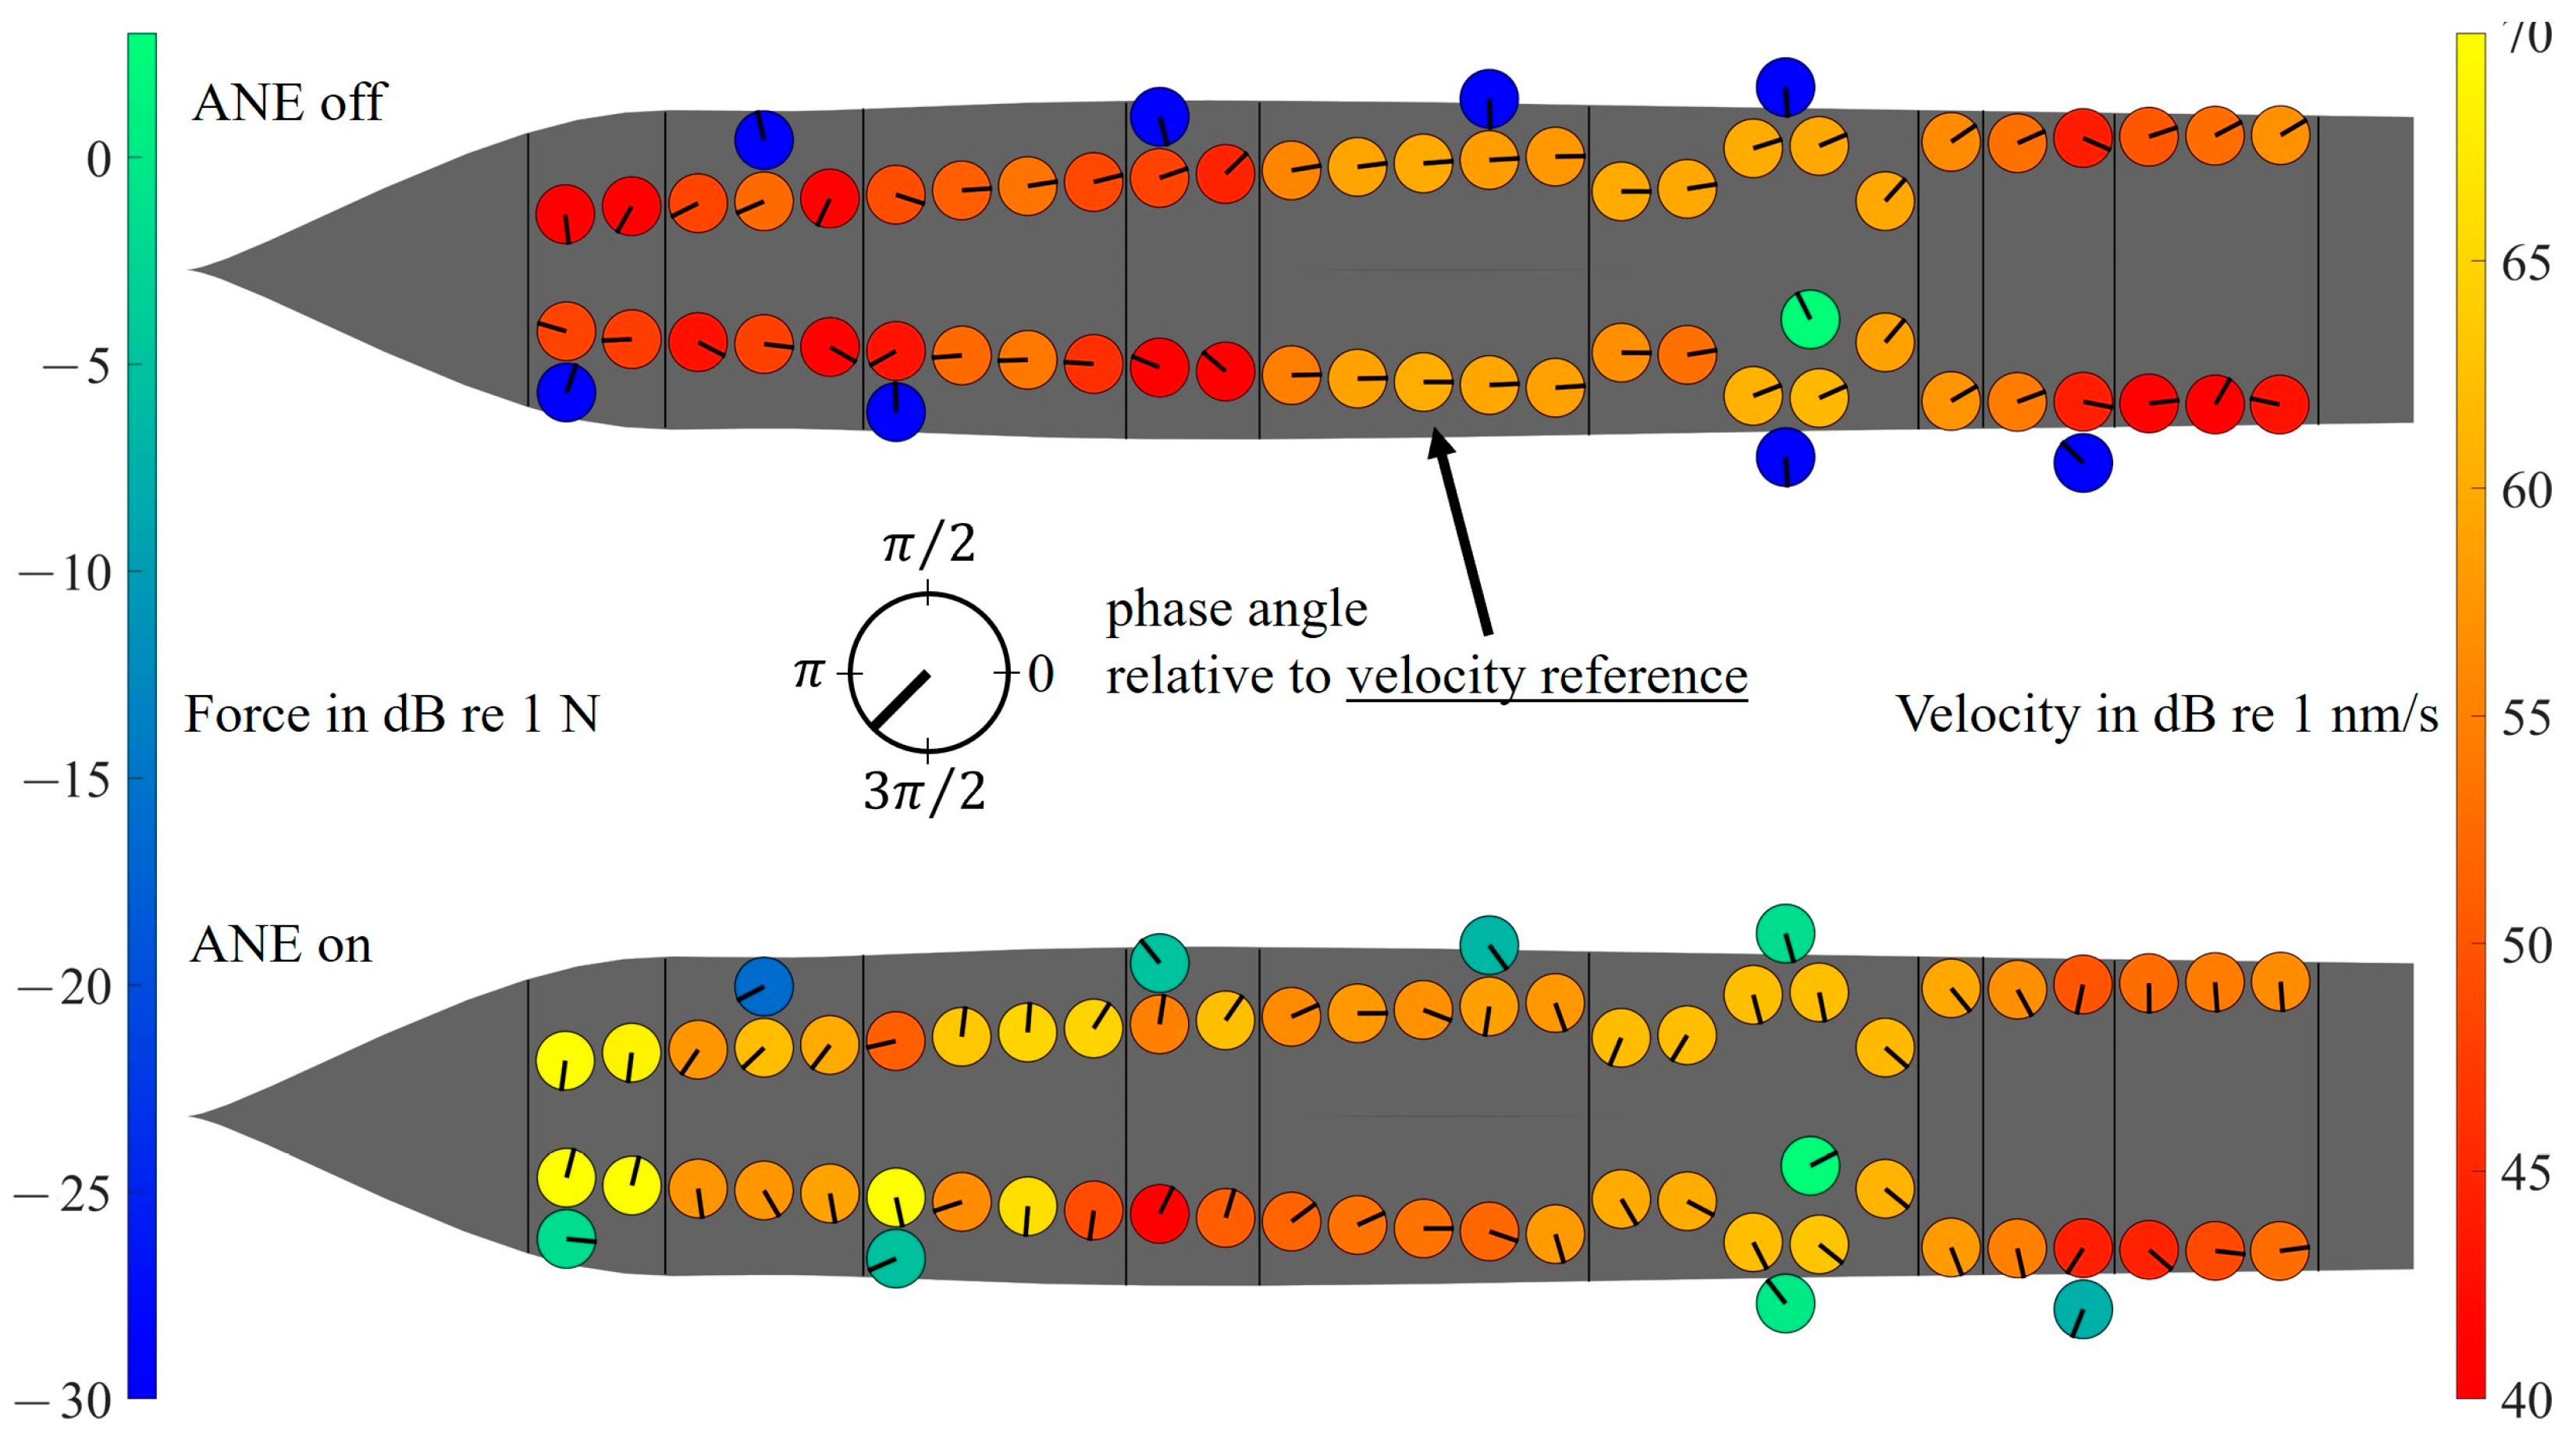
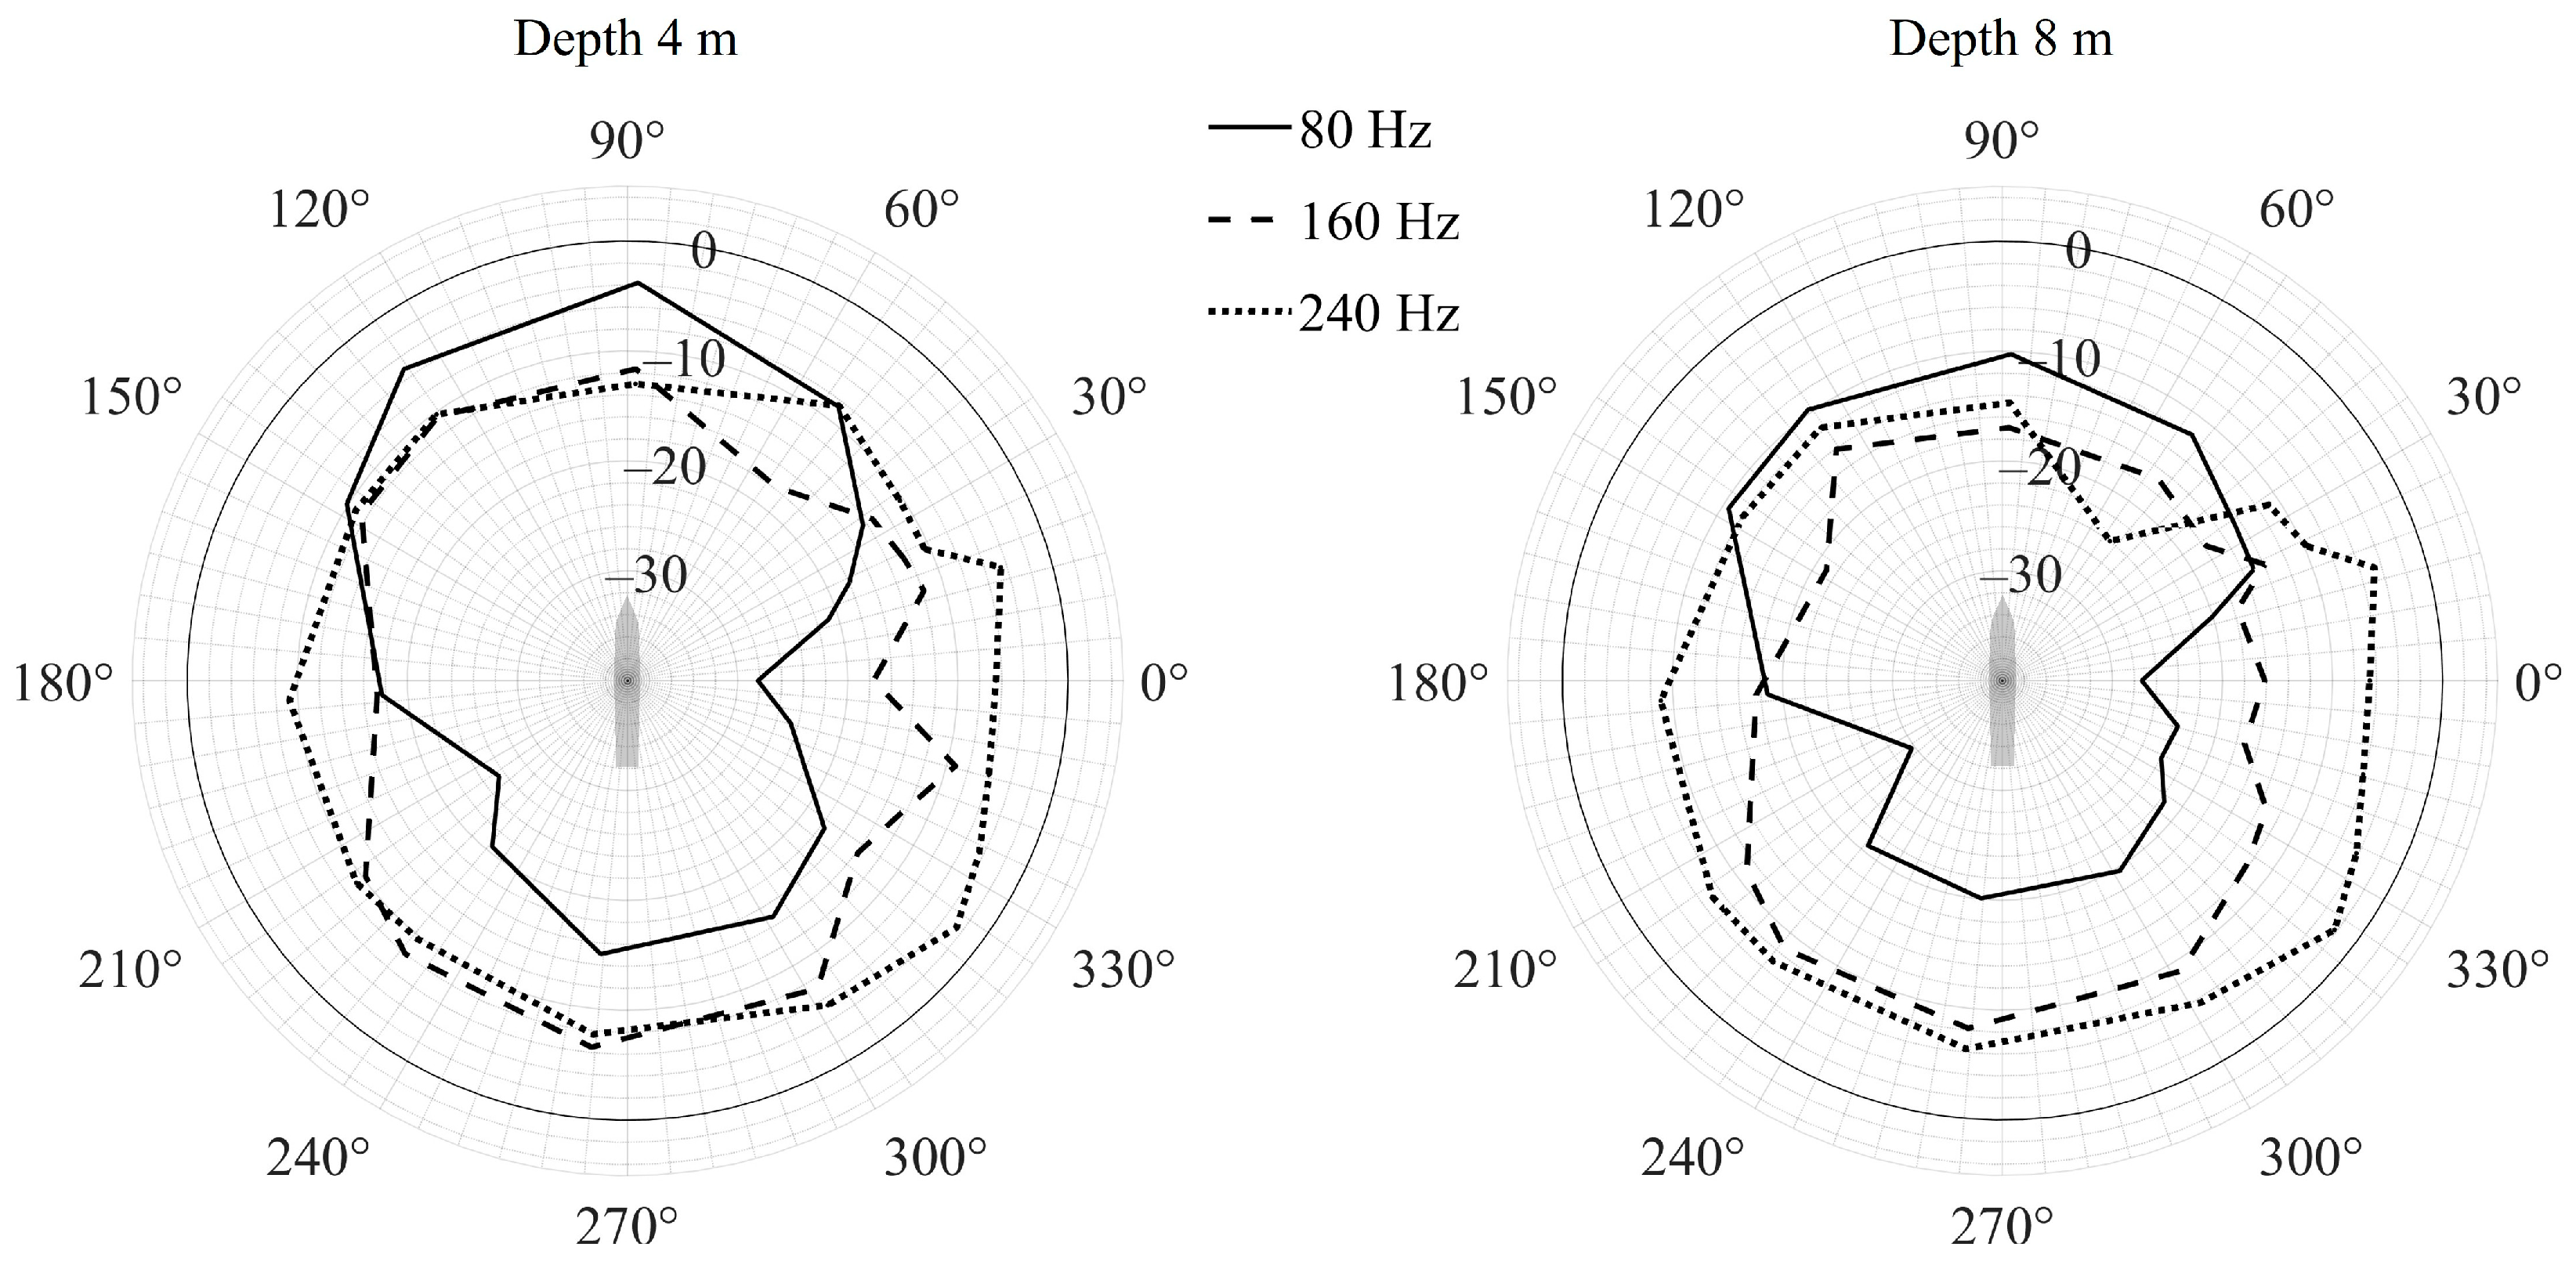
In order to further investigate the relationship between the change in vibration velocity and the radiated sound pressure, the measured vibrational fields at all accelerometers at the frequencies of 120 Hz (ASI) and 160 Hz (ANE) are analyzed exemplarily in Figure 9 and Figure 10. Additionally, structural eigenfrequencies and eigenfunctions are identified using the Complex Mode Indicator Function (CMIF) in Appendix A according to [43]. Another objective of this measurement period was to examine the sound field amplification effects. For this purpose, additional hydrophone positions were defined according to Figure 4. The change in sound pressure level around the measurement facility for two different depths at ANE-frequencies is depicted in Figure 11.
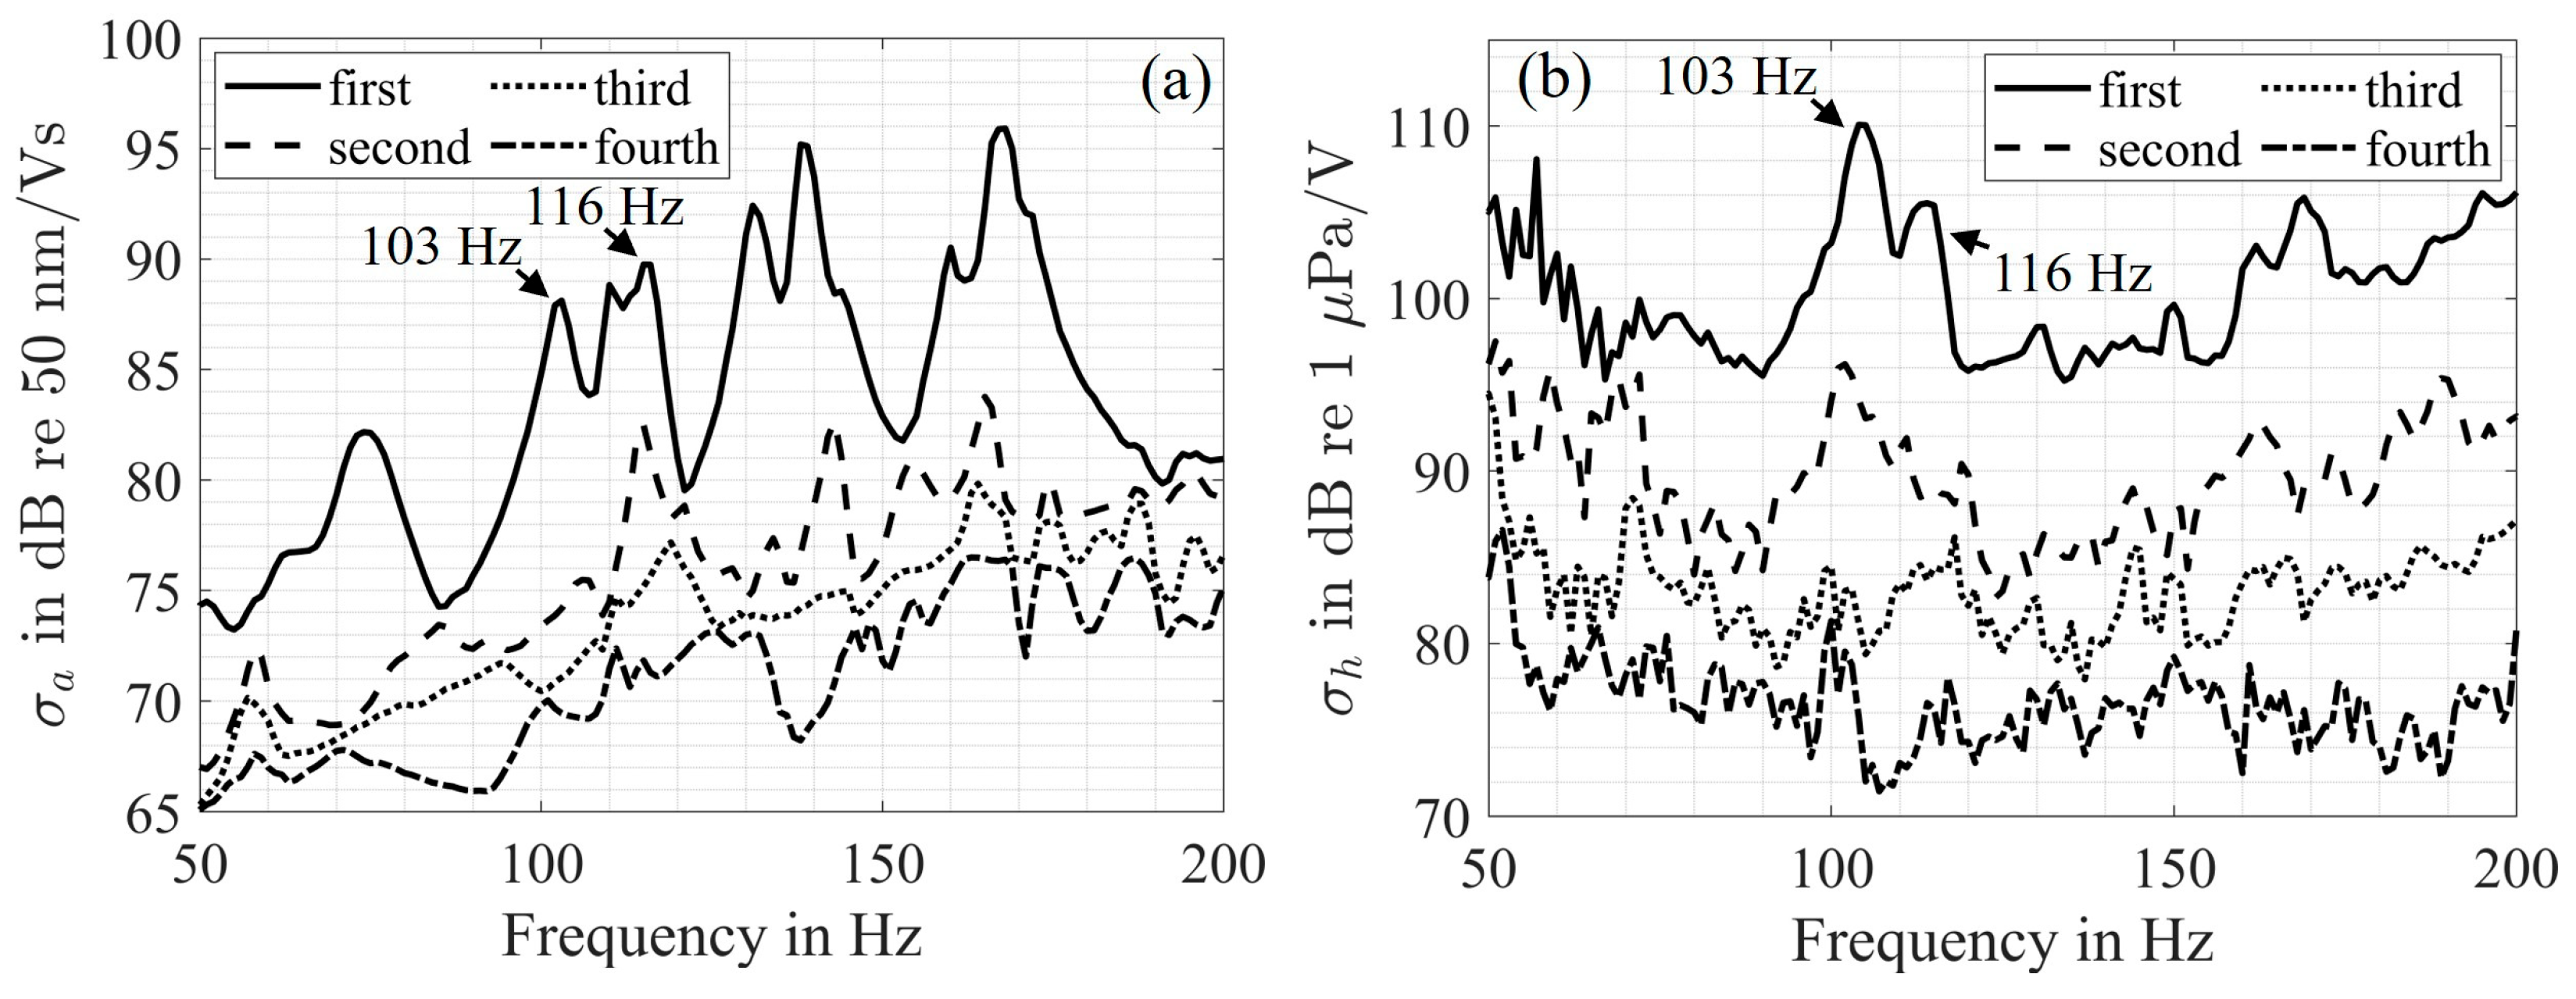
Target values at ANE-frequencies in Figure 8a are not reached at all hydrophones, which is mainly due to the modeling errors according to Equation (8) between the pre-measured plant model and the physical plant. With the exception of the frequency of 240 Hz, the sound pressure level at hydrophone h6 remains constant; see Figure 8d. At the three frequencies where the disturbance remains unchanged, forces are induced at positions of the control actuators due to their passive damping. As Figure 8c shows, less control effort is necessary for the ASI in comparison with the ANE. This is due to the resulting structure-borne sound field, which does not need to interfere with a disturbance field. In Figure 9, the operating velocity shape generated with the ASI control principle at 120 Hz is composed of the first singular vectors in U a , connected to the natural frequencies 103 Hz and 116 Hz in Figure A2. While structural natural frequencies are indicated by large values of σ a , thus the first CMIF in Figure A1a, their sound radiation capabilities can be seen from the peaks of σ h in Figure A1b.
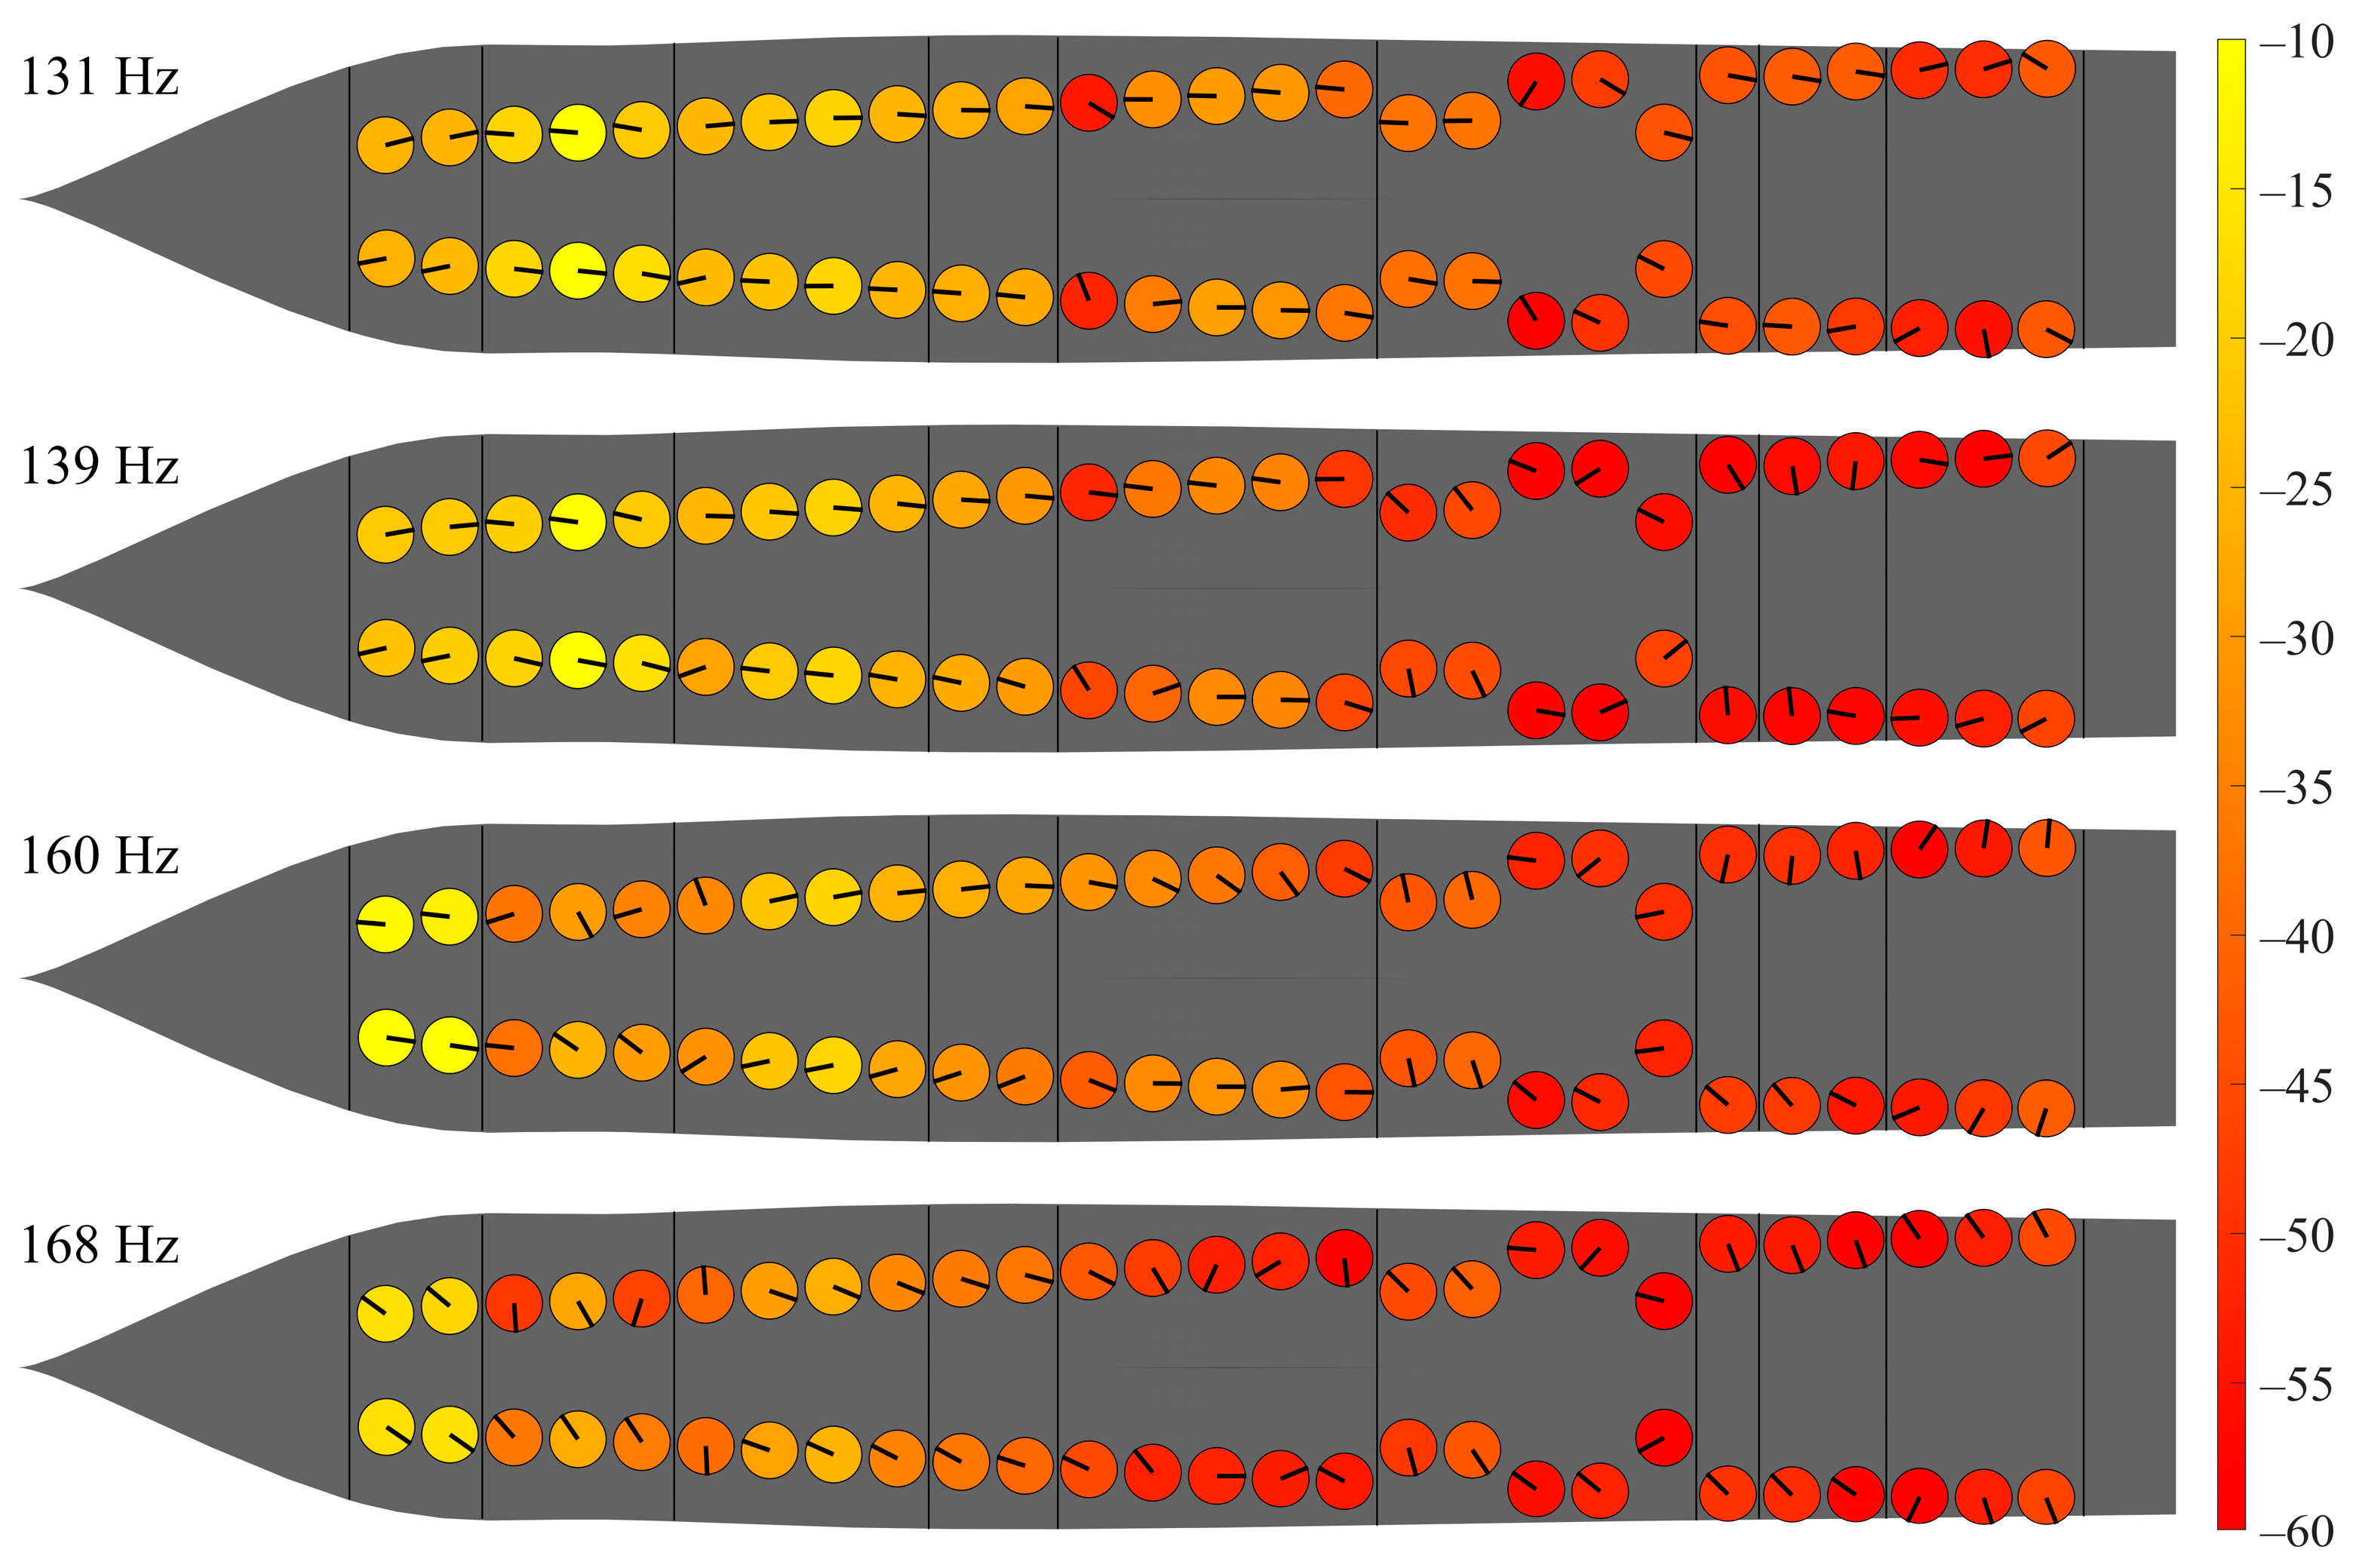
An increase in the measured vibration velocity is noticeable in Figure 8b at the three ANE-frequencies while the sound pressure at the virtual hydrophone positions is reduced. At 160 Hz, the phase angle of the velocity mode shape in ship sections III–V while ANE off corresponds to the singular vector extracted from the CMIF at that frequency; see Figure A3. In the other sections, the velocity field generated by the primary actuator dominates. In contrast, all available actuators are used for extraction of the singular modes with the CMIF.
When comparing ANE off with ANE on, it is noticeable that the vibration velocity increases in the bow section. This is due to the fact that the singular vector of the first CMIF at 160 Hz in Figure A3 has a maximum there, which is thus easily excited by the control of the secondary actuators in this section.
The effect that leads to the reduction in sound radiation cannot be clearly identified. It can be stated that the reduction in the amplitudes of the velocity mode shape only occurs locally, e.g., in ship section V on the port side. While ANE off, in sections V and VI, the velocity mode shape has an almost constant phase angle, which indicates structural waves with small wave numbers. These in turn are known to be responsible for the energy transport of the radiated structure-borne sound into the acoustic far field. When the active system is switched on, the constant phase field, especially at the starboard side, is disturbed, which indicates modal restructuring towards higher wave numbers. This subsequently creates evanescent acoustic waves due to acoustic short circuits [44], which leads to a reduction in the sound pressure level at the virtual hydrophone positions that are at least half a wavelength away from the ship model. Finally, Figure 11 shows that there is no local amplification of the radiated sound pressure for the considered frequencies. It should be noted that this illustration does not represent the acoustic far field according to [45] in all directions since the hydrophones differ in their distance from the ship model.

4. Discussion

This paper investigates the influence on the vibro-acoustic quantities by the active control of vibration of a surface ship model using force actuators. In addition to the experimental feasibility of the intended active control system, the investigation also focuses on the required control effort. The feedforward control system therefore takes into account the transfer functions between the actuation voltage of the inertial actuators and hydrophones in the surrounding water. With a fixed configuration of 12 accelerometers, 8 secondary actuators, and 5 virtual hydrophones, a change in tonal sound radiation in the context of signature manipulation in the frequency range between 80 Hz and 500 Hz is achieved. While an attenuation of radiated sound pressure between 10 dB and 20 dB is reached at the five hydrophone control input channels and in the monitoring region around the measurement facility, an enhanced structural response of about 5 to 15 dB is measured. At the frequency of 160 Hz, spatial control spillover, making the ship model a less effective radiator, is identified as the main reason for that effect. The second stepstone for the control of underwater signatures is the active insertion of tones, simulating additional engine orders, for example. This is experimentally accomplished, whereby the measurement results demonstrate that structural modes with a high radiation coupling into the surrounding medium are actuated in the low-frequency regime. This results in less control effort compared to actively reducing a present disturbance at the hydrophones.
It should be emphasized that the assumptions made for the particular case presented above are that all transfer paths behave linearly and are constant over time. It is also assumed that no frequency fluctuations occur in the primary signal. In reality, a ship’s acoustic signature is non-stationary broadband with high tonal densities. Even with constant engine speed, different sea states, for example, produce a time-varying fundamental frequency. Consequently, those changes in frequency need to be included in the signal processing of an active control system. This problem might be solved by reference signal synthesis [46]. Only the noise transmission of machinery through the ship’s hull into the surrounding water can be sufficiently modified with the ANE. The active control schemes presented are not applicable on propeller cavitation or flow-induced boundary layer noise. In addition, the active control system is prone to the time-varying transfer functions of the system. The amplitude and phase of the system transfer functions must be accurately reproduced in order to achieve substantial noise reduction. However, ship conditions change over time, and with them the transfer functions. Thus, the virtual hydrophone technique as the method of choice for sound field prediction therefore harbors uncertainties and is dependent on the disturbance signals measured in advance; see Equation (3). Other approaches seek to avoid the virtual hydrophone method by using internal microphones as error sensors instead [47].

5. Conclusions

An ASAC system for signature manipulation has been investigated for the first time. Testing on a scale model of a steel ship in a real lake allowed the real physical environment to be approximated. Since the source of vibration in a real surface ship is a rotating engine, the assumption of the primary disturbance to be a deterministic, periodic, and narrowband signal is valid. The possibility of reducing the radiated sound pressure by utilizing inertial shakers is demonstrated, although interestingly, a reduction in the mean vibration velocity is not necessarily associated with a reduction in radiated sound pressure. Considering the required control effort, the insertion of artificial tones seems to be an efficient extension for active signature manipulation, where an enhanced level of structural vibration may not be acceptable.

Author Contributions

Conceptualization: all authors; methodology: C.Z., D.S. and S.U.; software: C.Z. and S.U.; formal analysis: A.H., A.M. and S.U.; investigation: A.M. and A.H.; resources: D.S. and A.H.; data curation: C.Z. and S.U.; writing—original draft preparation: S.U.; writing—review and editing: all authors; visualization: S.U.; supervision: D.S. and A.H.; project administration: D.S., A.M. and A.H.; funding acquisition: D.S., A.M. and A.H. All authors have read and agreed to the published version of the manuscript.

Funding

This research received no external funding.

Data Availability Statement

The complete data is unsuitable to post because it includes sensitive information. Parts of the data that support the findings of this study are available from the corresponding author upon reasonable request.

Conflicts of Interest

Authors Carsten Zerbs and Andreas Müller were employed by the company Müller-BBM Industry Solutions GmbH. The remaining authors declare that the research was conducted in the absence of any commercial or financial relationships that could be construed as a potential conflict of interest.

Abbreviations

AVCActive vibration control
ASACActive Structural Acoustic Control
FxLMSFiltered Reference Least Mean Square
ASDActive Sound Design
ANEActive Noise Equalizer
ASIActive Sound Injection
FFTFast Fourier Transform
CSVDCompact Singular Value Decomposition
RMSRoot Mean Square
CMIFComplex Mode Indicator Function

Appendix A

Natural frequencies of the structural ship model are measured by exposing a random noise signal to each actuator one after another. The resulting frequency response functions are collected in the matrices G ^ h and G ^ a . Subsequently, the CSVD is applied to both matrices according to Equations (5) and (11). The CMIF is used according to [43] to extract frequencies with the high tonal densities:
CMIF a = Σ a T Σ a ,
and
CMIF h = Σ h T Σ h .
The four highest singular values from both equations are displayed in Figure A1. The frequencies of the maxima of the curve of the first singular value in Figure A1a are assumed to be close to a natural frequency of the structure. The corresponding first columns in U a approximate the velocity mode shapes, which are displayed for the frequencies of visible peaks in Figure A2 and Figure A3. Additionally, peaks of the curves in Figure A1b indicate high radiation coupling of the velocity field on the structure to the five virtual hydrophone positions.
Figure A1. Four highest singular values of (a) CMIF a and (b) CMIF h .
Acoustics 07 00034 g0a1
Figure A2. First singular vectors in U a for frequencies between 50 Hz and 120 Hz.
Acoustics 07 00034 g0a2
Figure A3. First singular vectors in U a for frequencies between 130 Hz and 170 Hz.
Acoustics 07 00034 g0a3

Appendix B

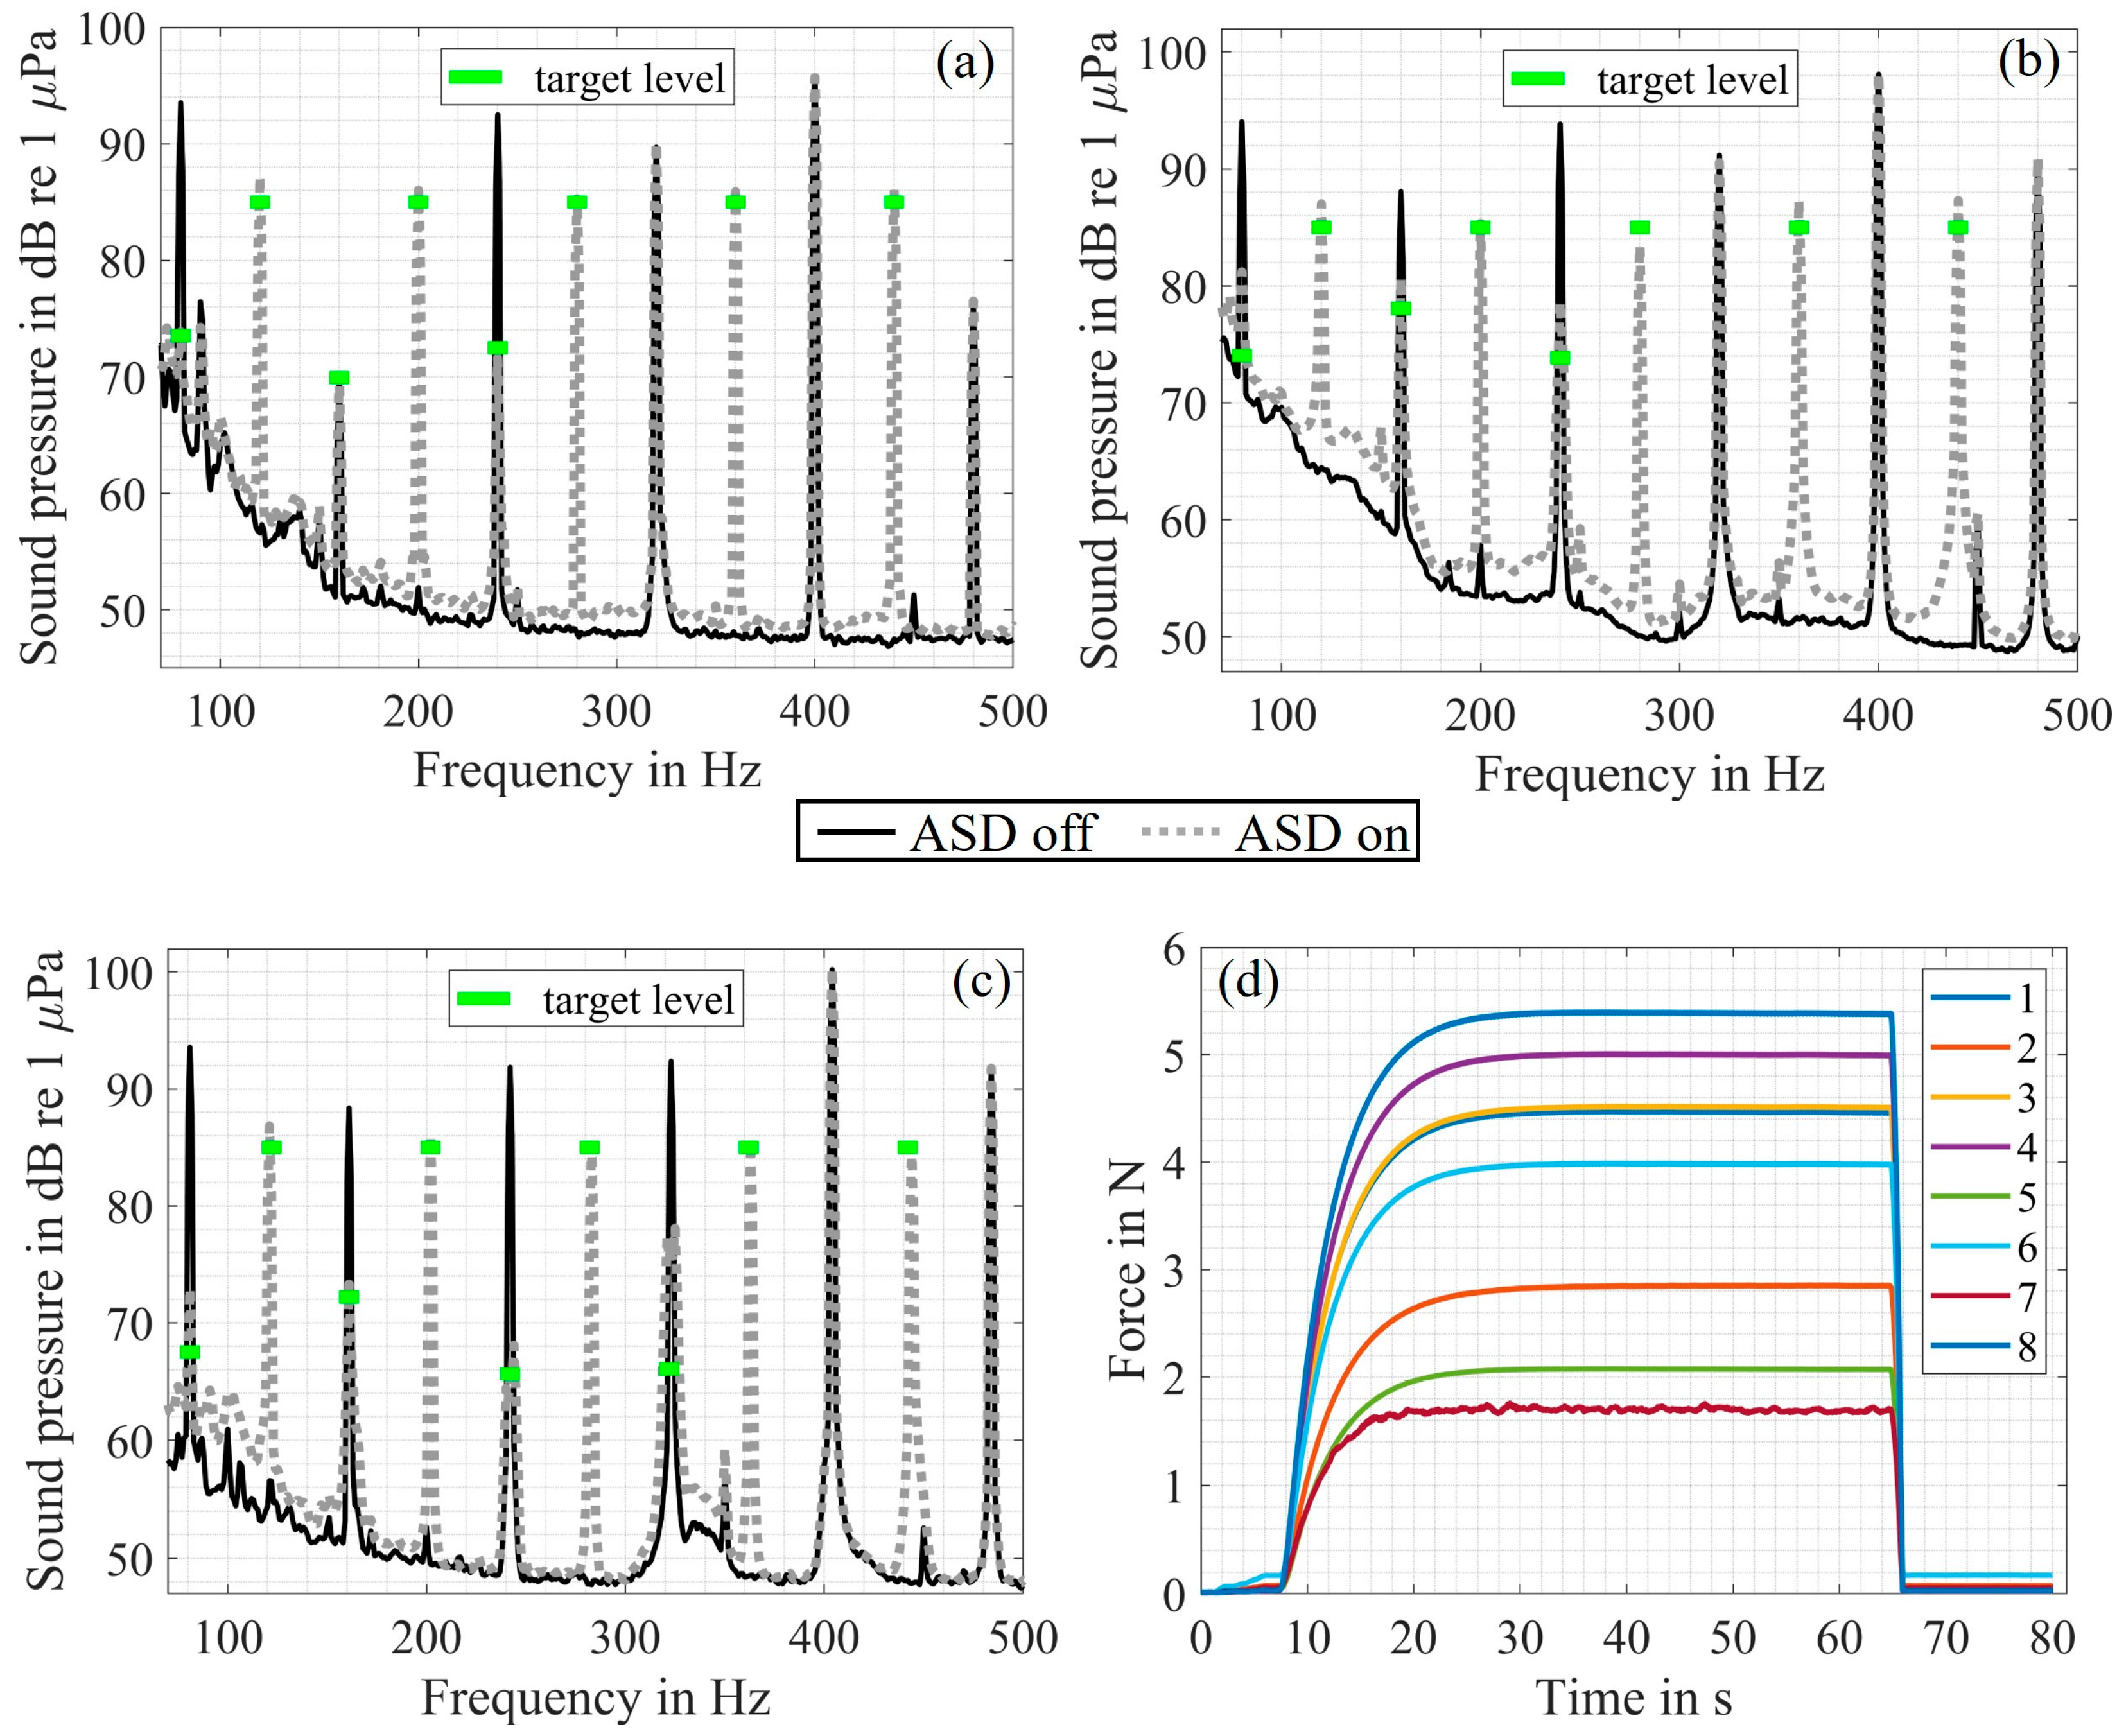
The results in Section 3 are based on one measured data set, which represents the main findings, like the enhanced control effort for the ANE and the increase in vibration velocity while the sound pressure at the hydrophone positions decreases. In order to quantify the variability in these results, a standard deviation of 3 dB for the ANE and of 2 dB for the ASI is calculated based on three repeated measurements with different environmental noise conditions. Measured sound pressures of those repeated measurements are depicted in Figure A4 together with the upper envelope of force signals during adaptation.
Figure A4. (a,c) Repeated measurements of sound pressures at virtual hydrophone positions; graphs result from the RMS over the complete sensor group; (d) measured upper envelope of the force signals for all eight actuator positions over time assigned to the results in (b).
Acoustics 07 00034 g0a4

References

  1. Żak, A. Ships classification basing on acoustic signatures. WSEAS Trans. Signal Process. Arch. 2008, 4, 137–149. [Google Scholar]
  2. Grushetsky, I.V.; Kalyu, V.A.; Shlemov, Y.F.; Tarovik, V.I. Underwater noise radiation, mechanisms, and control. In Encyclopedia of Maritime and Offshore Engineering; Carlton, J., Jukes, P., Choo, Y.S., Eds.; John Wiley & Sons: Chichester, UK; Hoboken, NJ, USA, 2018; pp. 1–12. ISBN 9781118476352. [Google Scholar]
  3. Lou, J.; Zhu, S.; He, L.; Yu, X. Application of chaos method to line spectra reduction. J. Sound Vib. 2005, 286, 645–652. [Google Scholar] [CrossRef]
  4. Müller, G.; Möser, M. Taschenbuch der Technischen Akustik; Heckl, M., Müller, H.A., Eds.; Springer: Berlin/Heidelberg, Germany, 1995; Chapter 17; ISBN 9783642973574. [Google Scholar]
  5. Olson, H.F. Electronic control of noise, vibration, and reverberation. J. Acoust. Soc. Am. 1956, 28, 966–972. [Google Scholar] [CrossRef]
  6. Chaplin, B. Anti-noise: The Essex breakthrough. Chart. Mech. Engr. 1983, 30, 41–47. [Google Scholar]
  7. Iwamoto, H.; Wendt, N.; Takahashi, Y.; Kessissoglou, N. Active structural cloaking using equivalent feedback cancellation. J. Sound Vib. 2025, 602, 118950. [Google Scholar] [CrossRef]
  8. Cho, D.-S.; Lee, S.-M.; Chung, K.-Y. Ship vibration control using a force-adjustable mechanical actuator. J. Vib. Control 1999, 5, 779–794. [Google Scholar] [CrossRef]
  9. Winberg, M.; Johansson, S.; Håkansson, L.; Claesson, I.; Lagö, T. Active vibration isolation in ships: A pre-analysis of sound and vibration problems. Int. J. Acoust. Vib. 2005, 10, 175–196. [Google Scholar] [CrossRef]
  10. Kauba, M.; Herold, S.; Koch, T.; Mayer, D.; Melz, T. Design and application of an active vibration control system for a marine engine mount. In Proceedings of the International Conference on Noise and Vibration Engineering, Leuven, Belgium, 15–17 September 2008. [Google Scholar]
  11. Yang, T.; Wu, L.; Li, X.; Zhu, M.; Brennan, M.J.; Liu, Z. Active vibration isolation of a Diesel generator in a small marine vessel: An experimental study. Appl. Sci. 2020, 10, 3025. [Google Scholar] [CrossRef]
  12. Basten, T.; Berkhoff, A.P.; Vermeulen, R. Active vibration control for underwater signature reduction of a navy ship. In Proceedings of the 17th International Congress on Sound and Vibration, Cairo, Egypt, 18–22 July 2010. [Google Scholar]
  13. Seiler, R.D. Structure-borne noise reduction of gearboxes in maritime application. In Proceedings of the 23rd International Congress on Acoustics, Aachen, Germany, 9–13 September 2019. [Google Scholar]
  14. Zhang, C.; Wang, G.; Wei, D.; Tian, Y.; Yang, L. The research on the transverse vibration active control model of ship propulsion shaft with the active control force on the bearing support. Ocean Eng. 2022, 266, 112722. [Google Scholar] [CrossRef]
  15. Vyalyshev, A.I.; Dubini, A.I.; Tartakovskii, B.D. Active acoustic reduction of a plate. Sov. Phys. Acoust. 1986, 32, 96–98. [Google Scholar]
  16. Fuller, C.R.; Hansen, C.H.; Snyder, S.D. Experiments on active control of sound radiation from a panel using a piezoceramic actuator. J. Sound Vib. 1991, 150, 179–190. [Google Scholar] [CrossRef]
  17. Fuller, C.R.; Elliott, S.J.; Nelson, P.A. Active Control of Vibration; Academic Press: Cambridge, MA, USA, 1996; Chapter 8. [Google Scholar]
  18. Pan, J.; Snyder, S.D.; Hansen, C.H.; Fuller, C.R. Active control of far-field sound radiated by a rectangular panel: A general analysis. J. Acoust. Soc. Am. 1992, 91, 2056–2066. [Google Scholar] [CrossRef]
  19. Snyder, S.D.; Tanaka, N. To absorb or not to absorb: Control source power output in active noise control systems. J. Acoust. Soc. Am. 1993, 94, 185–195. [Google Scholar] [CrossRef]
  20. Cheer, J.; Daley, S. Active structural acoustic control using the remote sensor method. J. Phys. Conf. Ser. 2016, 744, 012184. [Google Scholar] [CrossRef]
  21. Akpan, U.O.; Brenna, D.P.; Koko, T.S.; Besli, O.; Masson, P.; Renault, S. Active Noise and Vibration Control Literature Survey: Controller Technologies. Canadian National Defence Contractor Report, DREA CR 1999-177. 1999. Available online: https://apps.dtic.mil/sti/tr/pdf/ADA636599.pdf (accessed on 30 May 2024).
  22. Morgan, D. An analysis of multiple correlation cancellation loops with a filter in the auxiliary path. In Proceedings of the ICASSP ‘80. IEEE International Conference on Acoustics, Speech, and Signal Processing, Salt Lake City, UT, USA, 16–18 April 1980; Institute of Electrical and Electronics Engineers: Denver, CO, USA, 1980; pp. 457–461. [Google Scholar]
  23. Burgess, J.C. Active adaptive sound control in a duct: A computer simulation. J. Acoust. Soc. Am. 1981, 70, 715–726. [Google Scholar] [CrossRef]
  24. Schirmacher, R. Active design of automotive engine sound. Audio Engineering Society Convention 112. In Proceedings of the Audio Engineering Society Convention 112, München, Germany, 10–13 May 2002. [Google Scholar]
  25. Rees, L.E.; Elliott, S.J. Adaptive algorithms for active sound-profiling. IEEE Trans. Audio Speech Lang. Process. 2006, 14, 711–719. [Google Scholar] [CrossRef]
  26. Mosquera-Sánchez, J.A.; de Oliveira, L.P.R. A multi-harmonic amplitude and relative-phase controller for active sound quality control. Mech. Syst. Signal Process. 2014, 45, 542–562. [Google Scholar] [CrossRef]
  27. Kuo, S.M.; Tsai, J. Residual noise shaping technique for active noise control systems. J. Acoust. Soc. Am. 1994, 95, 1665–1668. [Google Scholar] [CrossRef]
  28. Ji, M.J.; Kuo, S.M. An active harmonic noise equalizer. In Proceedings of the ICASSP, Minneapolis, MN, USA, 27–30 April 1993; pp. 189–192. [Google Scholar]
  29. Park, D.C.; Jo, E.S.; Hong, S.; Csakan, M. Development of personalized engine sound system using active sound design technology. SAE Int. J. Passeng. Cars Mech. Syst. 2015, 8, 862–867. [Google Scholar] [CrossRef]
  30. Liu, J.; Yang, L.; Yang, L.; Zhang, X.; Chen, X. Multiple-harmonic amplitude and phase control method for active noise and vibration reshaping. J. Vib. Control 2018, 24, 3173–3193. [Google Scholar] [CrossRef]
  31. Ungnad, S.; Sachau, D.; Zerbs, C.; Müller, A.; Homm, A. Active control of target sound fields using structural-acoustic brightness applied to a ship model’s acoustic signature. J. Acoust. Soc. Am. 2024, 155, 600–614. [Google Scholar] [CrossRef] [PubMed]
  32. House, C.; Cheer, J.; Daley, S. An experimental investigation into active structural acoustic cloaking of a flexible cylinder. Appl. Acoust. 2020, 170, 107436. [Google Scholar] [CrossRef]
  33. Wittek, G. Measuring facilities and model testing techniques in ship’s acoustic research. In Proceedings of the winter annual meeting of the American Society of Mechanical Engineers, Hydroacoustic Facilities, Instrumentation, and Experimental Techniques, Atlanta, Georgia, 1–6 December 1991; pp. 63–68. [Google Scholar]
  34. Ungnad, S.; Wandel, M. Evaluation of robust position optimization of loudspeakers and microphones for an adaptive active noise control system. In Proceedings of the Inter-Noise 2016: 45th International Congress and Exposition on Noise Control Engineering: Towards a Quiter Future, Hamburg, Germany, 21–24 August 2016; Kropp, W., Ed.; Deutsche Gesellschaft für Akustik e.V: Berlin, Germany, 2016; pp. 3903–3909. [Google Scholar]
  35. Ungnad, S.; Müller, A.; Zerbs, C.; Sachau, D.; Homm, A. Simulation of the active manipulation of acoustic signatures based on measured data. In Proceedings of the DAGA 2022, Online, 21–24 March 2022; pp. 723–726. (In German). [Google Scholar]
  36. Randall, R.B. Frequency Analysis; Brüel & Kjaer: Naerum, Denmark, 1987; Chapter 7. [Google Scholar]
  37. Elliott, S.J.; Boucher, C.C.; Nelson, P.A. The behavior of a multiple channel active control system. IEEE Trans. Signal Process. 1992, 40, 1041–1052. [Google Scholar] [CrossRef]
  38. Kuo, S.M.; Tahernezhadi, M.; Ji, L. Frequency-domain periodic active noise control and equalization. IEEE Trans. Speech Audio Process. 1997, 5, 348–358. [Google Scholar] [CrossRef]
  39. Hansen, P.C. Rank-Deficient and Discrete Ill-Posed Problems; Society for Industrial and Applied Mathematics: Philadelphia, PA, USA, 1998; Chapter 8. [Google Scholar]
  40. Elliott, S.J. Signal Processing for Active Control; Academic Press: San Diego, CA, USA, 2001; Chapter 4.4. [Google Scholar]
  41. Nelson, P.A. Active control of acoustic fields and the Reproduction of Sound. J. Sound Vib. 1994, 177, 447–477. [Google Scholar] [CrossRef]
  42. Choi, J.-W.; Kim, Y.-H. Generation of an acoustically bright zone with an illuminated region using multiple sources. J. Acoust. Soc. Am. 2002, 111, 1695–1700. [Google Scholar] [CrossRef] [PubMed]
  43. Ewins, D.J. Modal testing: Theory, Practice and Application, 2nd ed.; John Wiley & Sons Inc: Hoboken, NJ, USA, 2000; Chapter 4. [Google Scholar]
  44. Maidanik, G. Response of ribbed panels to reverberant acoustic fields. J. Acoust. Soc. Am. 1962, 34, 809–826. [Google Scholar] [CrossRef]
  45. Bies, D.A. Uses of anechoic and reverberant rooms for the investigation of noise sources. Noise Control Eng. 1976, 7, 154–163. [Google Scholar] [CrossRef]
  46. Sachau, D.; Jukkert, S.; Hövelmann, N. Development and experimental verification of a robust active noise control system for a diesel engine in submarines. J. Sound Vib. 2016, 375, 1–18. [Google Scholar] [CrossRef]
  47. Schulz, A.; Simanowski, K.; Delf, S.; Homm, A. Experimental investigation of acoustic emissions from a ship hull. In Proceedings of the DAGA 2025, Copenhagen, Denmark, 17 March 2025; pp. 916–919. [Google Scholar]
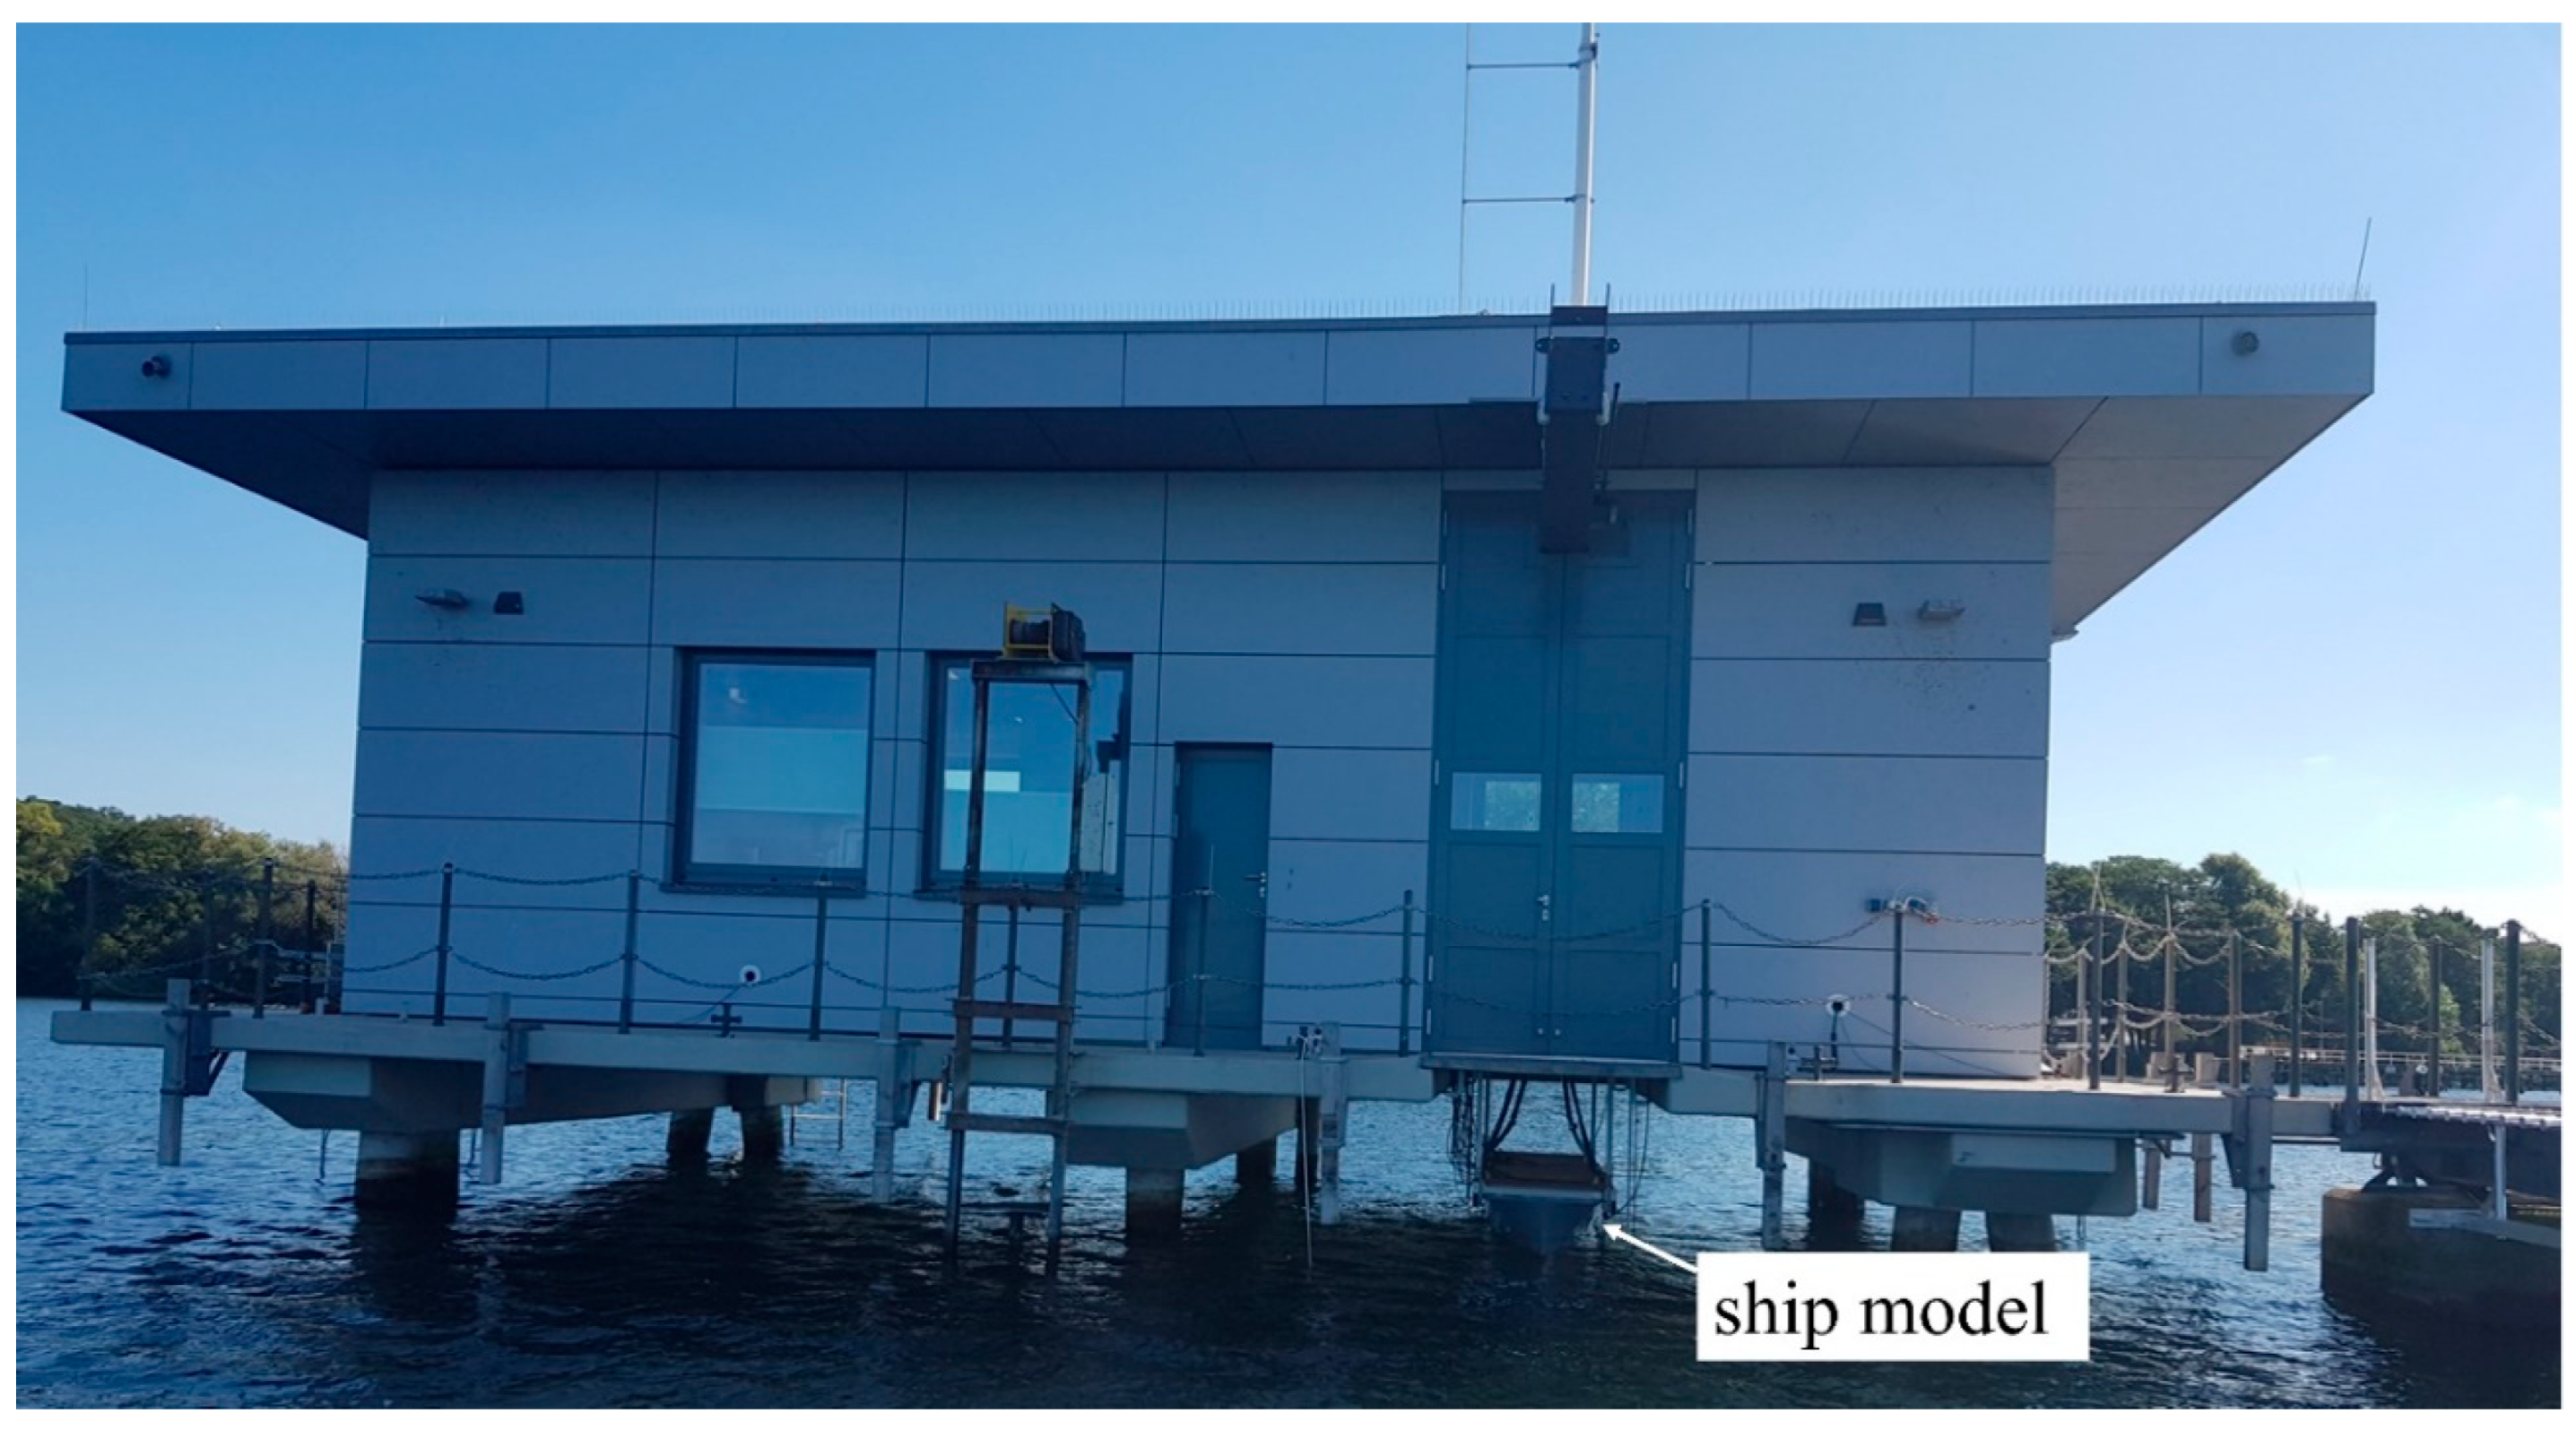
Figure 1. Measurement facility with the ship model fixed underneath.
Acoustics 07 00034 g001
Figure 2. Ship model with its fixed frame and open deck suspended on a roller carriage; ship sections I–IX.
Acoustics 07 00034 g002
Figure 3. Ship model with closed deck under measurement facility at Lake Plön, Germany.
Acoustics 07 00034 g003
Figure 4. Schematic of active control configuration at the measurement facility; ship model sections I–IX; black parts represent underwater pillars.
Acoustics 07 00034 g004
Figure 5. (a) Ship model section VI with disturbance (primary) actuator; (b) accelerometers and force transducer in the height of the waterline; (c) hydrophone h3.
Acoustics 07 00034 g005
Figure 6. Block diagram of adaptive digital processing implementation for the ANE control principle.
Acoustics 07 00034 g006
Figure 7. Block diagram of adaptive digital processing implementation for the ASI control principle.
Acoustics 07 00034 g007
Figure 8. (a) Sound pressure measured at virtual hydrophone positions; (b) structural vibration velocity measured at all 54 accelerometers; (c) forces measured at disturbance (solid line) and control (dotted line) actuators; graphs result from the RMS over the complete sensor group; (d) sound pressure measured at hydrophone h6.
Acoustics 07 00034 g008
Figure 9. Vibration velocity measured at 54 accelerometers; ASI-frequency 120 Hz.
Acoustics 07 00034 g009
Figure 10. Vibration velocity measured at 54 accelerometers; ANE-frequency 160 Hz.
Acoustics 07 00034 g010
Figure 11. Change in sound pressure level at monitoring hydrophone positions (ANE-frequencies).
Acoustics 07 00034 g011
Disclaimer/Publisher’s Note: The statements, opinions and data contained in all publications are solely those of the individual author(s) and contributor(s) and not of MDPI and/or the editor(s). MDPI and/or the editor(s) disclaim responsibility for any injury to people or property resulting from any ideas, methods, instructions or products referred to in the content.