Article

Enhancement of Subharmonic Intensity in a Cavity Filled with Bubbly Liquid Through Its Nonlinear Resonance Shift

by
María Teresa Tejedor-Sastre
and
Christian Vanhille
*,†
NANLA Research Group, Universidad Rey Juan Carlos, Tulipán s/n, 28933 Madrid, Spain
*
Author to whom correspondence should be addressed.
These authors contributed equally to this work.
Acoustics 2025, 7(2), 17; https://doi.org/10.3390/acoustics7020017
Submission received: 20 December 2024 / Revised: 11 March 2025 / Accepted: 25 March 2025 / Published: 28 March 2025

Abstract

:
The aim of this study is to examine the behavior of subharmonics in a one-dimensional cavity filled with a bubbly liquid, leveraging the nonlinear softening phenomenon of the medium at high amplitudes to enhance subharmonic generation. To this purpose, we use a numerical model developed previously that solves a coupled differential system formed by the wave equation and a Taylor-expanded Rayleigh–Plesset equation. This system describes the nonlinear mutual interaction between ultrasound and bubble vibrations. We carry out several different simulations to measure the response of the subharmonic component f / 2 and the acoustic source frequency signal f when the cavity is excited over a range around the linear resonance frequency of the cavity (the resonance value obtained at low pressure amplitudes). Different source amplitudes in three different kinds of medium are used. Our results reveal several new characteristics of subharmonics as follows: their generation is predominant compared to the source frequency; their generation is affected by the softening of the bubbly medium when acoustic pressure amplitudes are raised; this specific behavior is solely an acoustically-related phenomenon; their behavior may indicate that the bubbly liquid medium is undergoing a softening process.

1. Introduction

Bubbly liquids are useful in many applications due to the drastic change that a very small amount of air (of about 0.001 % ) in the form of bubbles produces on the acoustic properties of the liquid. When tiny gas bubbles are added to a liquid, the sound speed, attenuation, compressibility, and nonlinear parameters become dispersive, depending on the resonance of the bubble, and they can grow by several orders of magnitude [1,2,3]. Medicine is one of the areas of great interest for which ultrasound interacts with these media. Bubbly liquids are used as contrast agent to improve the visibility of tissues and organs in diagnostic imaging [4] or in therapy, where bubbles are activated by ultrasound waves to improve drug delivery, destroy cancer cells, or remove blood clots [5,6]. In engineering, ultrasonic cleaning [7] and sonochemistry [8] are fields in which bubbly liquids and ultrasound interact to produce the desired mechanisms and effects.
When an ultrasonic wave of finite amplitude interacts with tiny gas bubbles in a liquid, the generation of harmonics and subharmonics, as well as the sum and difference frequencies from frequency mixing, is due to the high nonlinearity of the medium caused by the presence of the bubbles. On the one hand, the generation of high-frequency components (harmonics, sum frequency) allows us to obtain a better spatial resolution (smaller wavelengths) from signals of lower frequencies that are less attenuated. The high frequencies thus obtained are useful in fields such as medical imaging [9] and bubble detection and characterization [10,11,12]. On the other hand, low-frequency components (difference frequency, subharmonics) are interesting because they are less attenuated than the higher-frequency signals from which they are generated. Moreover, besides its lower attenuation, the difference frequency component has a higher directivity, which is desired in fields such as bubble detection and characterization [10,11], underwater communication, and parametric arrays [12,13,14]. Subharmonics are used to achieve high quality medical imaging because their existence in a liquid is almost exclusively due to bubbles, which makes these a perfect contrast agent, since it reduces filtering and image processing [15,16].
Understanding the generation of subharmonics and enhancing their intensity may thus be of interest in some applications. Several studies have been done to understand their behavior in the case of uncoated bubbles [17,18,19,20,21] and for coated bubbles [22,23,24,25]. In these works the behavior of a single bubble under a linear regime (low pressure at the source) is studied, but the nonlinear mutual interaction of ultrasound with bubble vibrations is not considered. In [26], the mutual interaction of bubbles, with varying density, and ultrasound in a one-dimensional cavity is analyzed, but without taking into account the softening of the medium.
The softening of a medium (a bubbly liquid here) is a well-known nonlinear effect observed when the amplitude of an acoustic wave is raised. It causes the decrease of the sound speed in the medium. It has been analyzed in several works [27,28,29]. This phenomenon was studied in detail in a cavity filled with a bubbly liquid in a previous work [30], and it was used to potentiate the generation of harmonics (with a single-source frequency) and the frequency mixing (with a two-source frequency) [30,31]. However, the generation of subharmonics was not taken into account. It is worth noting that no prior data are available in the literature regarding the relationship between subharmonics and the softening of the bubbly liquid.
The objective of this work is to study the simultaneous contribution of both the softening of the bubbly medium (nonlinear resonance shift of the cavity) and the generation of the subharmonic components of the ultrasonic signal (nonlinear generation). Moreover, our aim here is to take advantage of the first contribution (softening phenomenon) to enhance the intensity of the second one (subharmonic generation). Furthermore, we focus our analysis on checking whether a net bulk pressure applied to the bubbly liquid impacts the nonlinear behavior of subharmonics or not, to derive some conclusions about its acoustic-related nature alone. This study on the influence of static pressure modifications is primarily motivated by a theoretical concern, determining whether such modifications affect the nonlinear behavior in question. To this purpose, the response of the subharmonic and the source frequency components is studied by sweeping around the resonance frequency of the cavity at f / 2 (obtained in linear conditions, at low acoustic pressure amplitudes) for different finite amplitudes of the ultrasonic source. It is shown that the new resonance frequency of the cavity obtained for each amplitude enhances the generation of subharmonics. In Section 2, we describe the physical assumptions and the mathematical model used for the mutual nonlinear interaction between the acoustic field, modeled by the wave equation, and the bubble vibrations, modeled by a Taylor-expanded Rayleigh–Plesset equation. We solve the coupled differential system by means of the numerical model developed in [32]. In Section 3, we study the behavior of the subharmonic f / 2 and the source frequency f components in the following three kinds of medium: free medium (without net bulk pressure, Section 3.1), compressed medium (with positive net bulk pressure, Section 3.2), and decompressed medium (with negative net bulk pressure, Section 3.3). Section 3.4 shows a comparison of the three types of medium. Finally, Section 4 gives the conclusions of this work.

2. Materials and Methods

In this work, we consider a one-dimensional cavity of length L filled with a bubbly liquid, in which an ultrasonic field propagates. We assume a homogeneous distribution of spherical gas bubbles of the same size in the liquid. Furthermore, the initial bubble radius, R 0 g , is small compared to the wavelength of the acoustic field, λ (at least a thousand times lower). We study the mutual nonlinear interaction between ultrasound and bubble oscillations. This interaction is described by the following partial differential equation system that couples the acoustic pressure p ( x , t ) and bubble volume variation v ( x , t ) = V ( x , t ) v 0 g [1,2,3], where x is the one-dimensional space coordinate, t is the time, v 0 g = 4 π R 0 g 3 / 3 is the initial volume of one bubble, and V ( x , t ) is the current volume of the bubble. T l is the last instant considered in the study. Subscrips t and x indicate partial derivatives.
p x x p t t / c 0 l 2 = ρ 0 l N g v t t , ( x , t ) ( 0 , L ) × ( 0 , T l ) ,
v t t + δ ω 0 g v t + ω 0 g 2 v + η p = a v 2 + b 2 v v t t + v t 2 , ( x , t ) [ 0 , L ] × ( 0 , T l ) ,
In the wave equation, Equation (1), c 0 l and ρ 0 l are the sound speed and the density at the equilibrium state of the liquid, and N g is the bubble density in the liquid. In the Taylor-expanded Rayleigh–Plesset equation, Equation (2), δ = 4 ν l / ω 0 g R 0 g 2 is the viscous damping coefficient of the bubbly fluid, in which ν l is the cinematic viscosity of the liquid; ω 0 g = 2 π f 0 g = 3 γ g p 0 g / ρ 0 l R 0 g 2 is the resonance frequency of the bubbles, where γ g is the specific heats ratio of the gas; p 0 g = ρ 0 g c 0 g 2 / γ g is its atmospheric pressure; and ρ 0 g and c 0 g are the density and sound speed at the equilibrium state of the gas. The other parameters are defined as η = 4 π R 0 g / ρ 0 l , a = ( γ g + 1 ) ω 0 g 2 / 2 v 0 g , and b = 1 / 6 v 0 g .
The following initial conditions are imposed by assuming that the variables p and v are at rest at t = 0 :
p ( x , 0 ) = 0 , v ( x , 0 ) = 0 , p t ( x , 0 ) = 0 , v t ( x , 0 ) = 0 , x ( 0 , L ] .
We consider a time-dependent pressure source placed at the end x = 0 of the cavity, which is composed of the net bulk pressure p b (a non-oscillating pressure acting on the whole fluid, the value of which can be null like in Section 3.1, positive like in Section 3.2, and negative like in Section 3.3), and the oscillating pressure (acoustic pressure) of the amplitude (acoustic amplitude) p f , frequency ω = 2 π f , and wavelengh λ , as follows:
p ( 0 , t ) = p b + p f sin ( ω t ) , t [ 0 , T l ] .
We also assume a rigid-wall boundary condition at the other end of the cavity, x = L , as follows:
p x ( L , t ) = 0 , t [ 0 , T l ] .
In the model, the bubbles are the only source of attenuation, dispersion, and nonlinearity in the fluid. They are monodisperse and oscillate at their first radial mode. Their surface tension is neglected. The translational motion of the bubbles relative to the liquid, under Bjerknes, buoyancy, viscous drag, and added-mass forces is not considered [2,33].
We use a previously developed numerical tool [32] to solve the differential system formed by Equations (1)–(5). This model is based on the finite-volume method in the space dimension and on the finite-difference method in the time domain. In Section 3, we use 50 finite volumes per cavity length L and 400 time intervals per period T of the frequency f.

3. Results

The aim of this work is to study the softening effect a bubbly liquid has on the generation of subharmonic components of finite-amplitude ultrasound when acoustic pressure amplitudes are raised. To this end, we use the model presented in Section 2.
The data used in the model are presented in Table 1.
The length of the cavity is set at L = λ f / 2 , where λ f = c f / f is the wavelength and c f is the sound speed in the biphasic and dispersive medium at the frequency f [2], which means that c f = 1216.9 m/s and L = c f / 2 f = 0.002 m at f = 300 kHz. This frequency is close to the linear resonance of the cavity in the medium used here at f / 2 . This means that this value f is the one found in linear conditions, at low acoustic pressure amplitudes, for which the response of the system is close to its maximum at f / 2 .
In the following, T l = 2000 T , where T = 1 / f is a value that ensures the steady regime in the cavity. At each finite volume a Fast Fourier Transform (FFT) without windowing is applied over 50 steady T of the acoustic pressure signal to study the distribution of its frequency components.

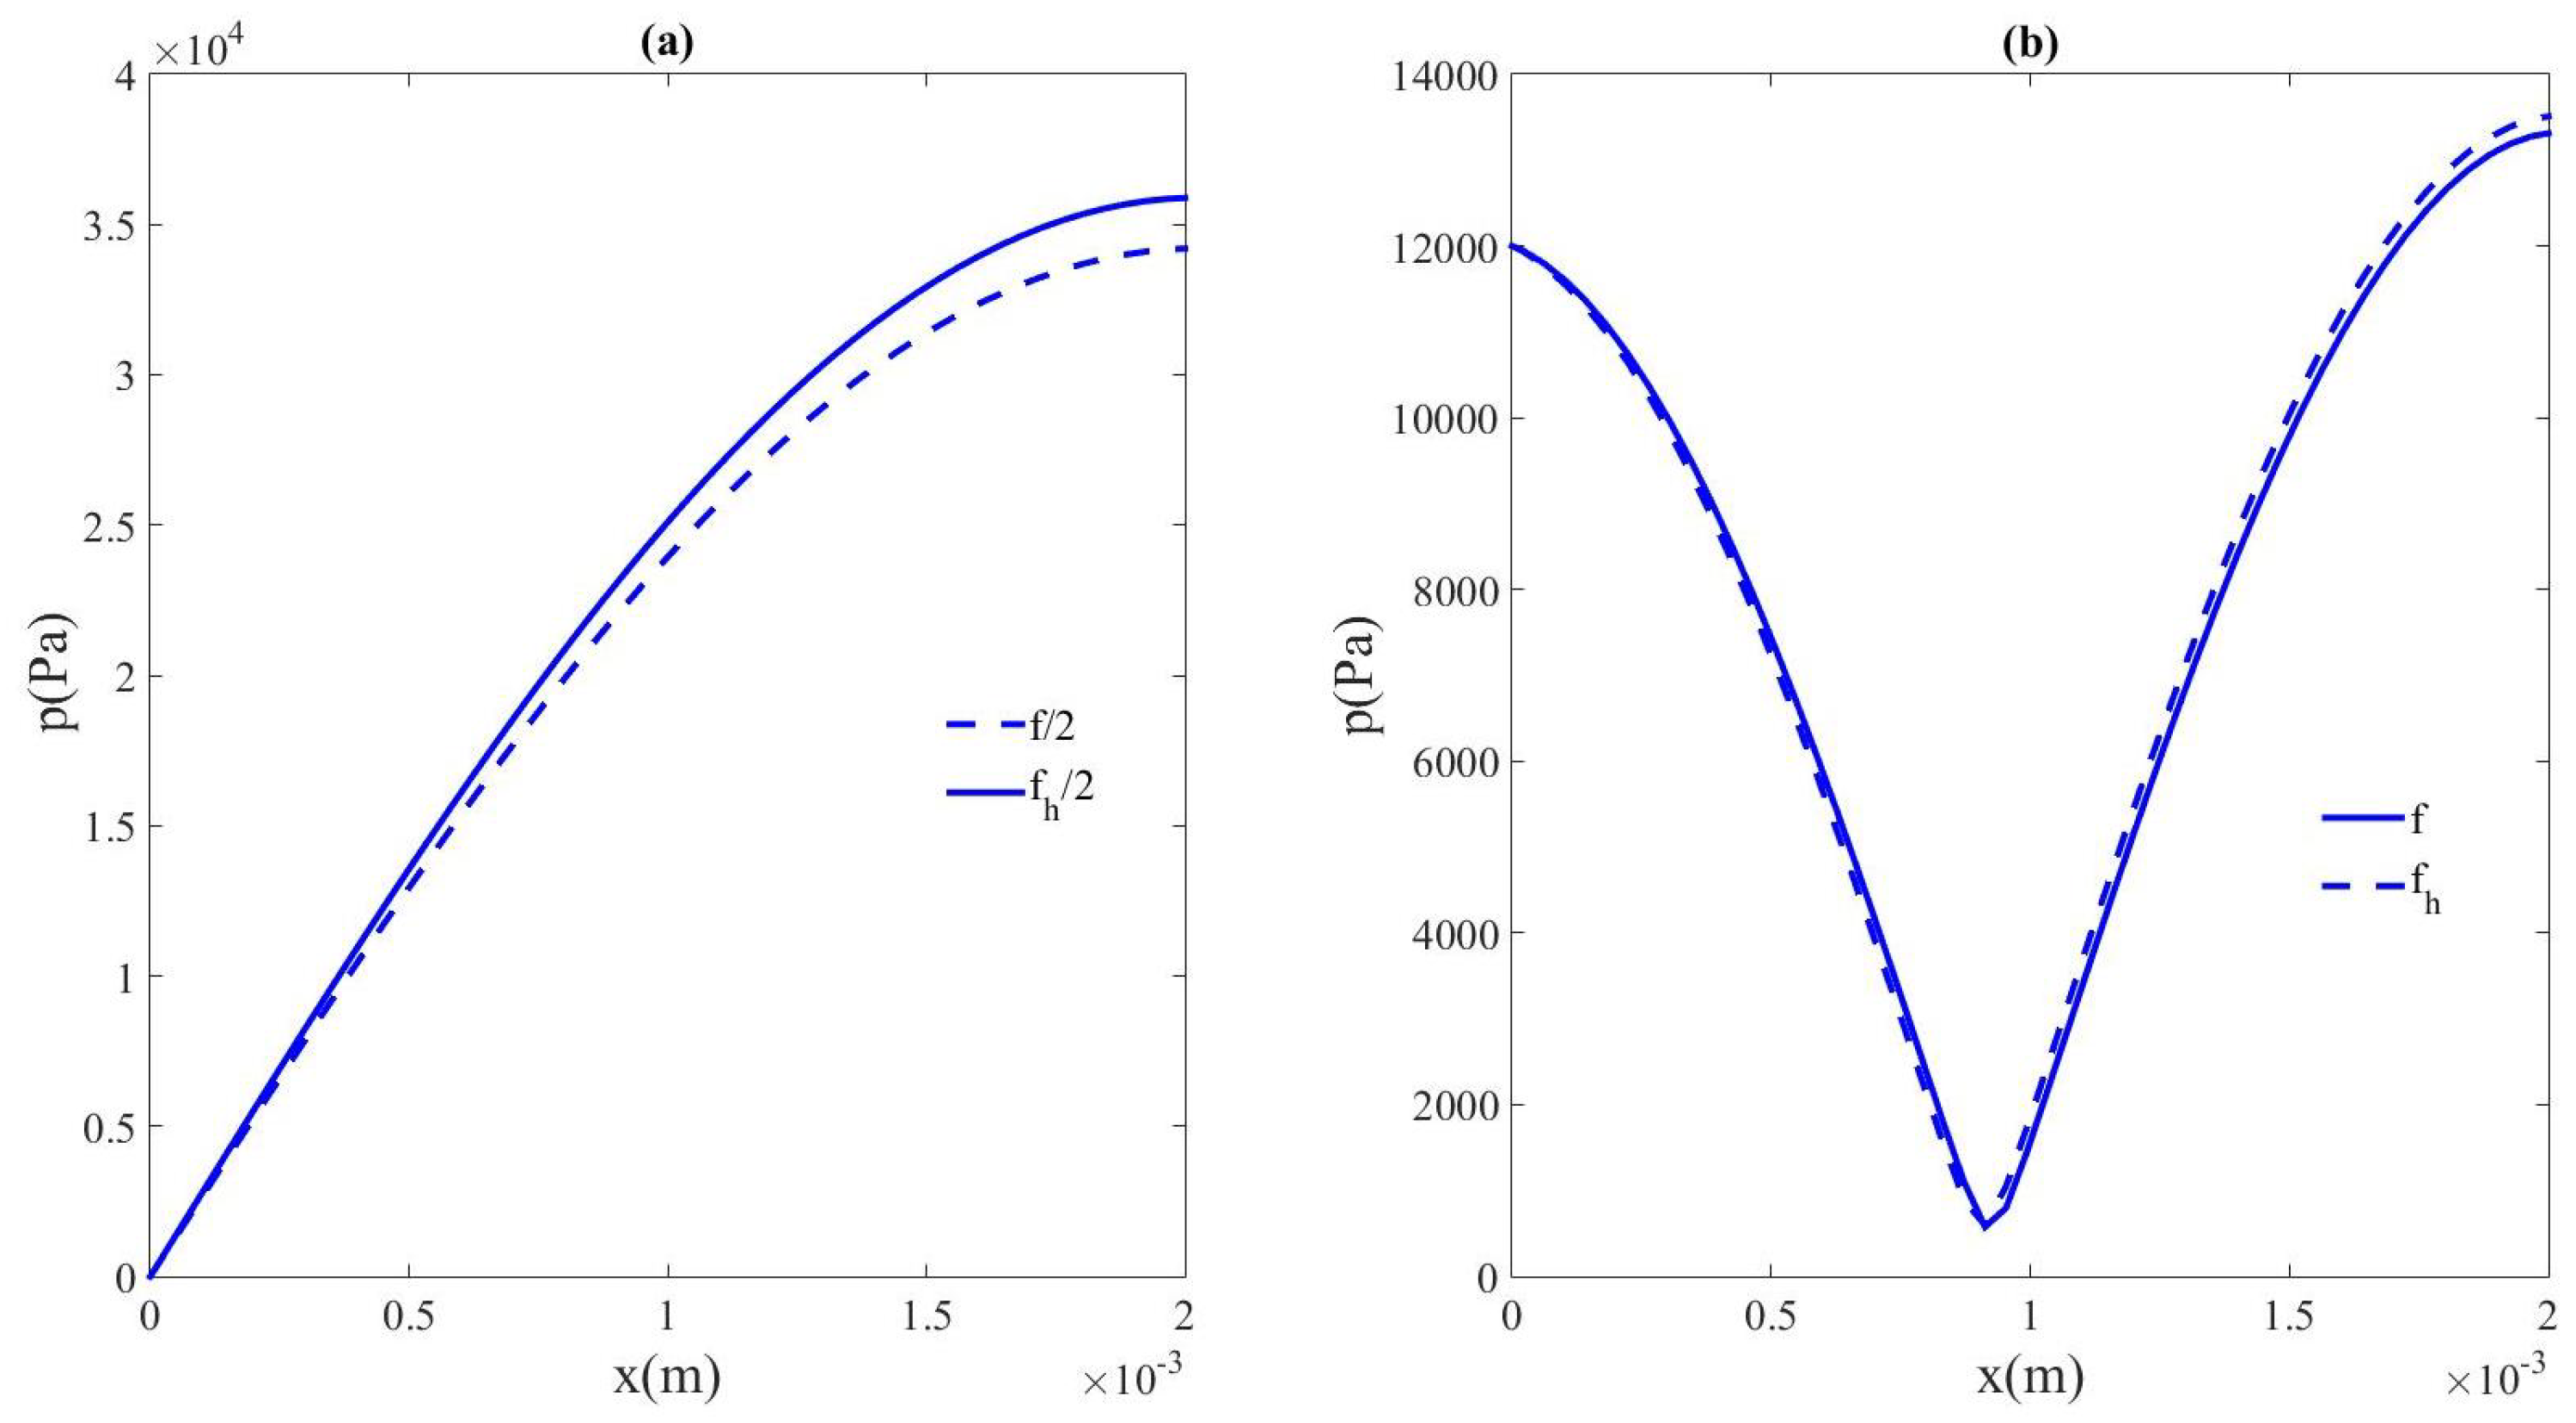
3.1. Nonlinear Resonance of Subharmonics in a Free Bubbly Liquid (Study vs. Acoustic Pressure Amplitude)

In this section, we study the nonlinear resonance shift that affects both the subharmonic f / 2 and the component f in the cavity around f = 300 kHz. In this case, the net pressure applied is null, p b = 0 Pa (free medium), and the acoustic pressure amplitude is varied ( p f = 6 kPa, p f = 8 kPa, p f = 10 kPa, p f = 12 kPa). For each one of these values, a frequency sweep around f is carried out to localize the frequency at which the maximum pressure amplitude is reached in the cavity for the subharmonic f / 2 ( p m f / 2 ) and for the driving signal f ( p m f ). Figure 1 shows these values for the subharmonic f / 2 (Figure 1a) and the component f (Figure 1b) as a function of the source frequency f and for the four different acoustic amplitudes at the source used here. In nonlinear conditions, at a moderate value p f = 6 kPa, the cavity reaches the maximum amplitude for the subharmonic f / 2 , p m f / 2 , i.e., its resonance, at a frequency higher than f = 300 kHz, f h = 300.88 kHz. One could interpret this shift as the hardening of the bubbly liquid in the cavity. However, this is a direct effect of the predominance of the intense generation of subharmonic f / 2 , which was almost resonant and then tends to reach and impose its resonance (due to the dispersive features of the bubbly liquid). The same behavior is observed for the component f. This is due to the predominant character of f / 2 , which tends toward its own resonance, whereas f is non-resonant. This prevalence is in the order of 300–400% of the acoustic source amplitude p f ). However, it can be observed that if we still raise the acoustic amplitude at the source, i.e., increase the nonlinearity of the waves, the resonance of the subharmonic f / 2 is obtained at lower frequency values as follows: f h = 300.39 kHz at p f = 8 kPa, f h = 299.88 kHz at p f = 10 kPa, and f h = 299.32 kHz at p f = 12 kPa. This pattern follows the classical nonlinear behavior describing the softening of a medium, i.e., the decrease of the resonance frequency of the subharmonic f / 2 as the acoustic amplitude increases (the decrease of the sound speed at this frequency), which is the natural trend of the bubbly liquid. These results, shown in Figure 1a, help improve our understanding of subharmonic generation. The existence of a pressure threshold above which the subharmonic generation at f / 2 takes place for f = 300 kHz was p t h = 9.53 kPa in our previous work [26], which is consistent with our results obtained here; at f = 300 kHz, the subharmonic only exists for the source amplitudes p f = 10 kPa and p f = 12 kPa. However, at frequencies a little higher than f = 300 kHz ( f = 302 kHz for example), whose threshold should be higher than p t h = 9.53 kPa, according to [26], the subharmonic is obtained for lower amplitudes ( p f = 8 kPa and p f = 6 kPa). This indicates that the subharmonic generation in cavities comes out only when certain conditions are met at the same time, that is, enough amplitude, nonlinearity, dispersion, geometry, and boundary conditions. Once again, the same behavior is observed for the f component. In Figure 1b, for the f component, it can be seen that the maximum pressure occurs at the same frequency as the subharmonic f / 2 . This is because the amplitude for f / 2 is much larger than the amplitude for f. The higher maximum amplitude for f relative to the oscillating source amplitude p f is due to the contribution of the second harmonic of the subharmonic f / 2 .
Figure 2 shows the pressure amplitude distribution obtained in the cavity at the source frequencies f = 300 kHz and f h = 299.32 kHz for p f = 12 Kpa. As can be seen, accounting for the softening of the medium induces higher maximum amplitudes p m f / 2 = 34.21 kPa, p m h f / 2 = 35.89 kPa, p m f = 13.32 kPa, and p m h f = 13.52 kPa. Thus, if we want to enhance the subharmonic generation we have to slightly modify the frequency or the length of the cavity to obtain more intense components.
It is noted here that additional simulations were performed when the source frequency f coincided with the cavity resonance. The results showed that, in this configuration, no significant subharmonics were generated because the resonant signal at the source frequency is much higher than the subharmonics, preventing their generation. The acoustic energy is retained within the resonant source frequency component. On the other hand, the predominance of f / 2 observed here applies to a specific resonant cavity length. For other cavity lengths, or other bubbly liquids, the frequencies used should be modified. Additionally, it is worth mentioning that future analysis will need to consider other forces, such as surface tension, Bjerknes, buoyancy, viscous drag, and added mass, to study their impact on the behavior of subharmonics. An interesting study to be conducted is on the influence of modifying the fluid viscosity on the generation and nonlinear behavior of subharmonics.
Figure 2. Pressure amplitude distribution of frequency components in the cavity for p f = 12 kPa. (a) f / 2 (solid line) and f h / 2 (dashed line), (b) f (solid line) and f h (dashed line).
Acoustics 07 00017 g002

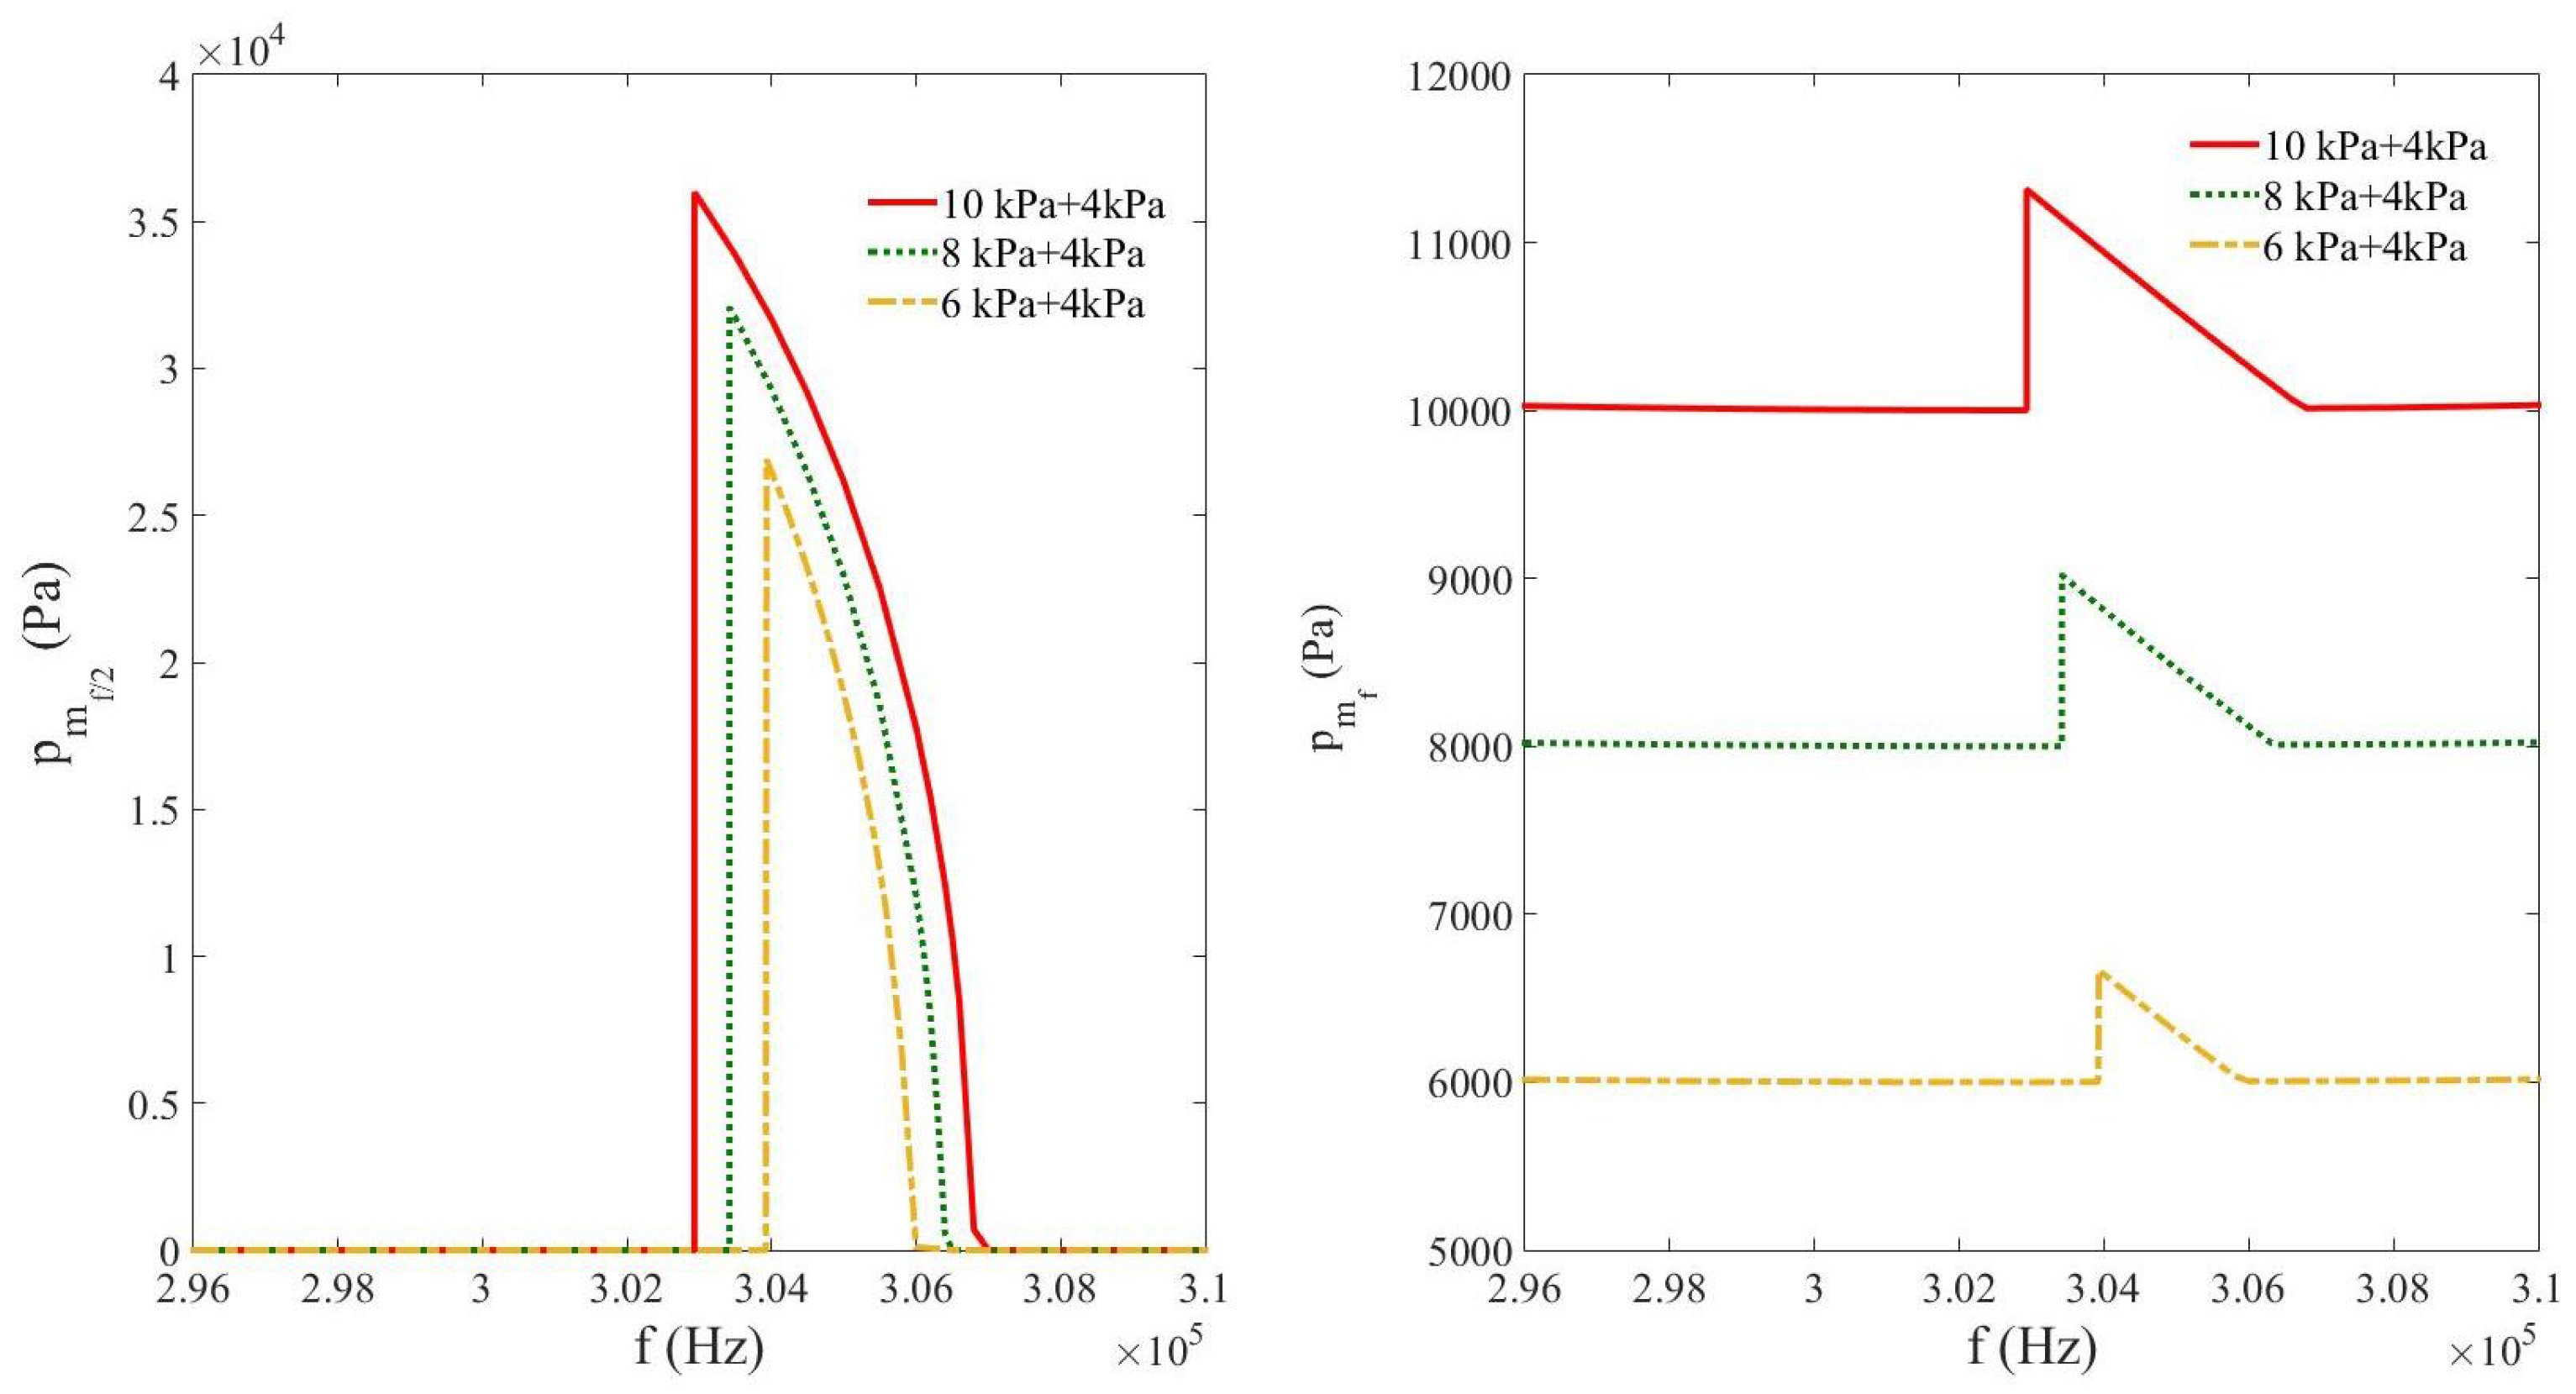
3.2. Nonlinear Resonance of Subharmonics in a Compressed Bubbly Liquid (Study vs. Acoustic Pressure Amplitude)

This section applies the same procedure as the one used in Section 3.1 to study the nonlinear resonance shift of the same frequency components, in a compressed bubbly liquid obtained by applying the net bulk pressure of value p b = 4 kPa (see Equation (4)). Here again, p f = 6 kPa, p f = 8 kPa, and p f = 10 kPa. p m f / 2 and p m f are the displayed vs. the source frequency f for each p f in Figure 3a,b. It is seen that the resonance frequency of the cavity, measured at f / 2 , changes by modifying the acoustic pressure amplitude at the source. By imposing the positive net bulk pressure ( p b = 4 kPa), this resonance frequency shifts toward higher values than in the free-medium case ( p b = 0 Pa, Section 3.1) for the three acoustic amplitudes. This is an artificial hardening of the medium imposed by p b , which means that the sound speed is raised. However, like in the previous section, if we compare the three oscillating sources to each other, we can see that an increase in amplitude causes a softening of the medium, which results in lower resonance frequencies, i.e., the natural nonlinear behavior of the medium finally prevails over the artificial compression mechanism.

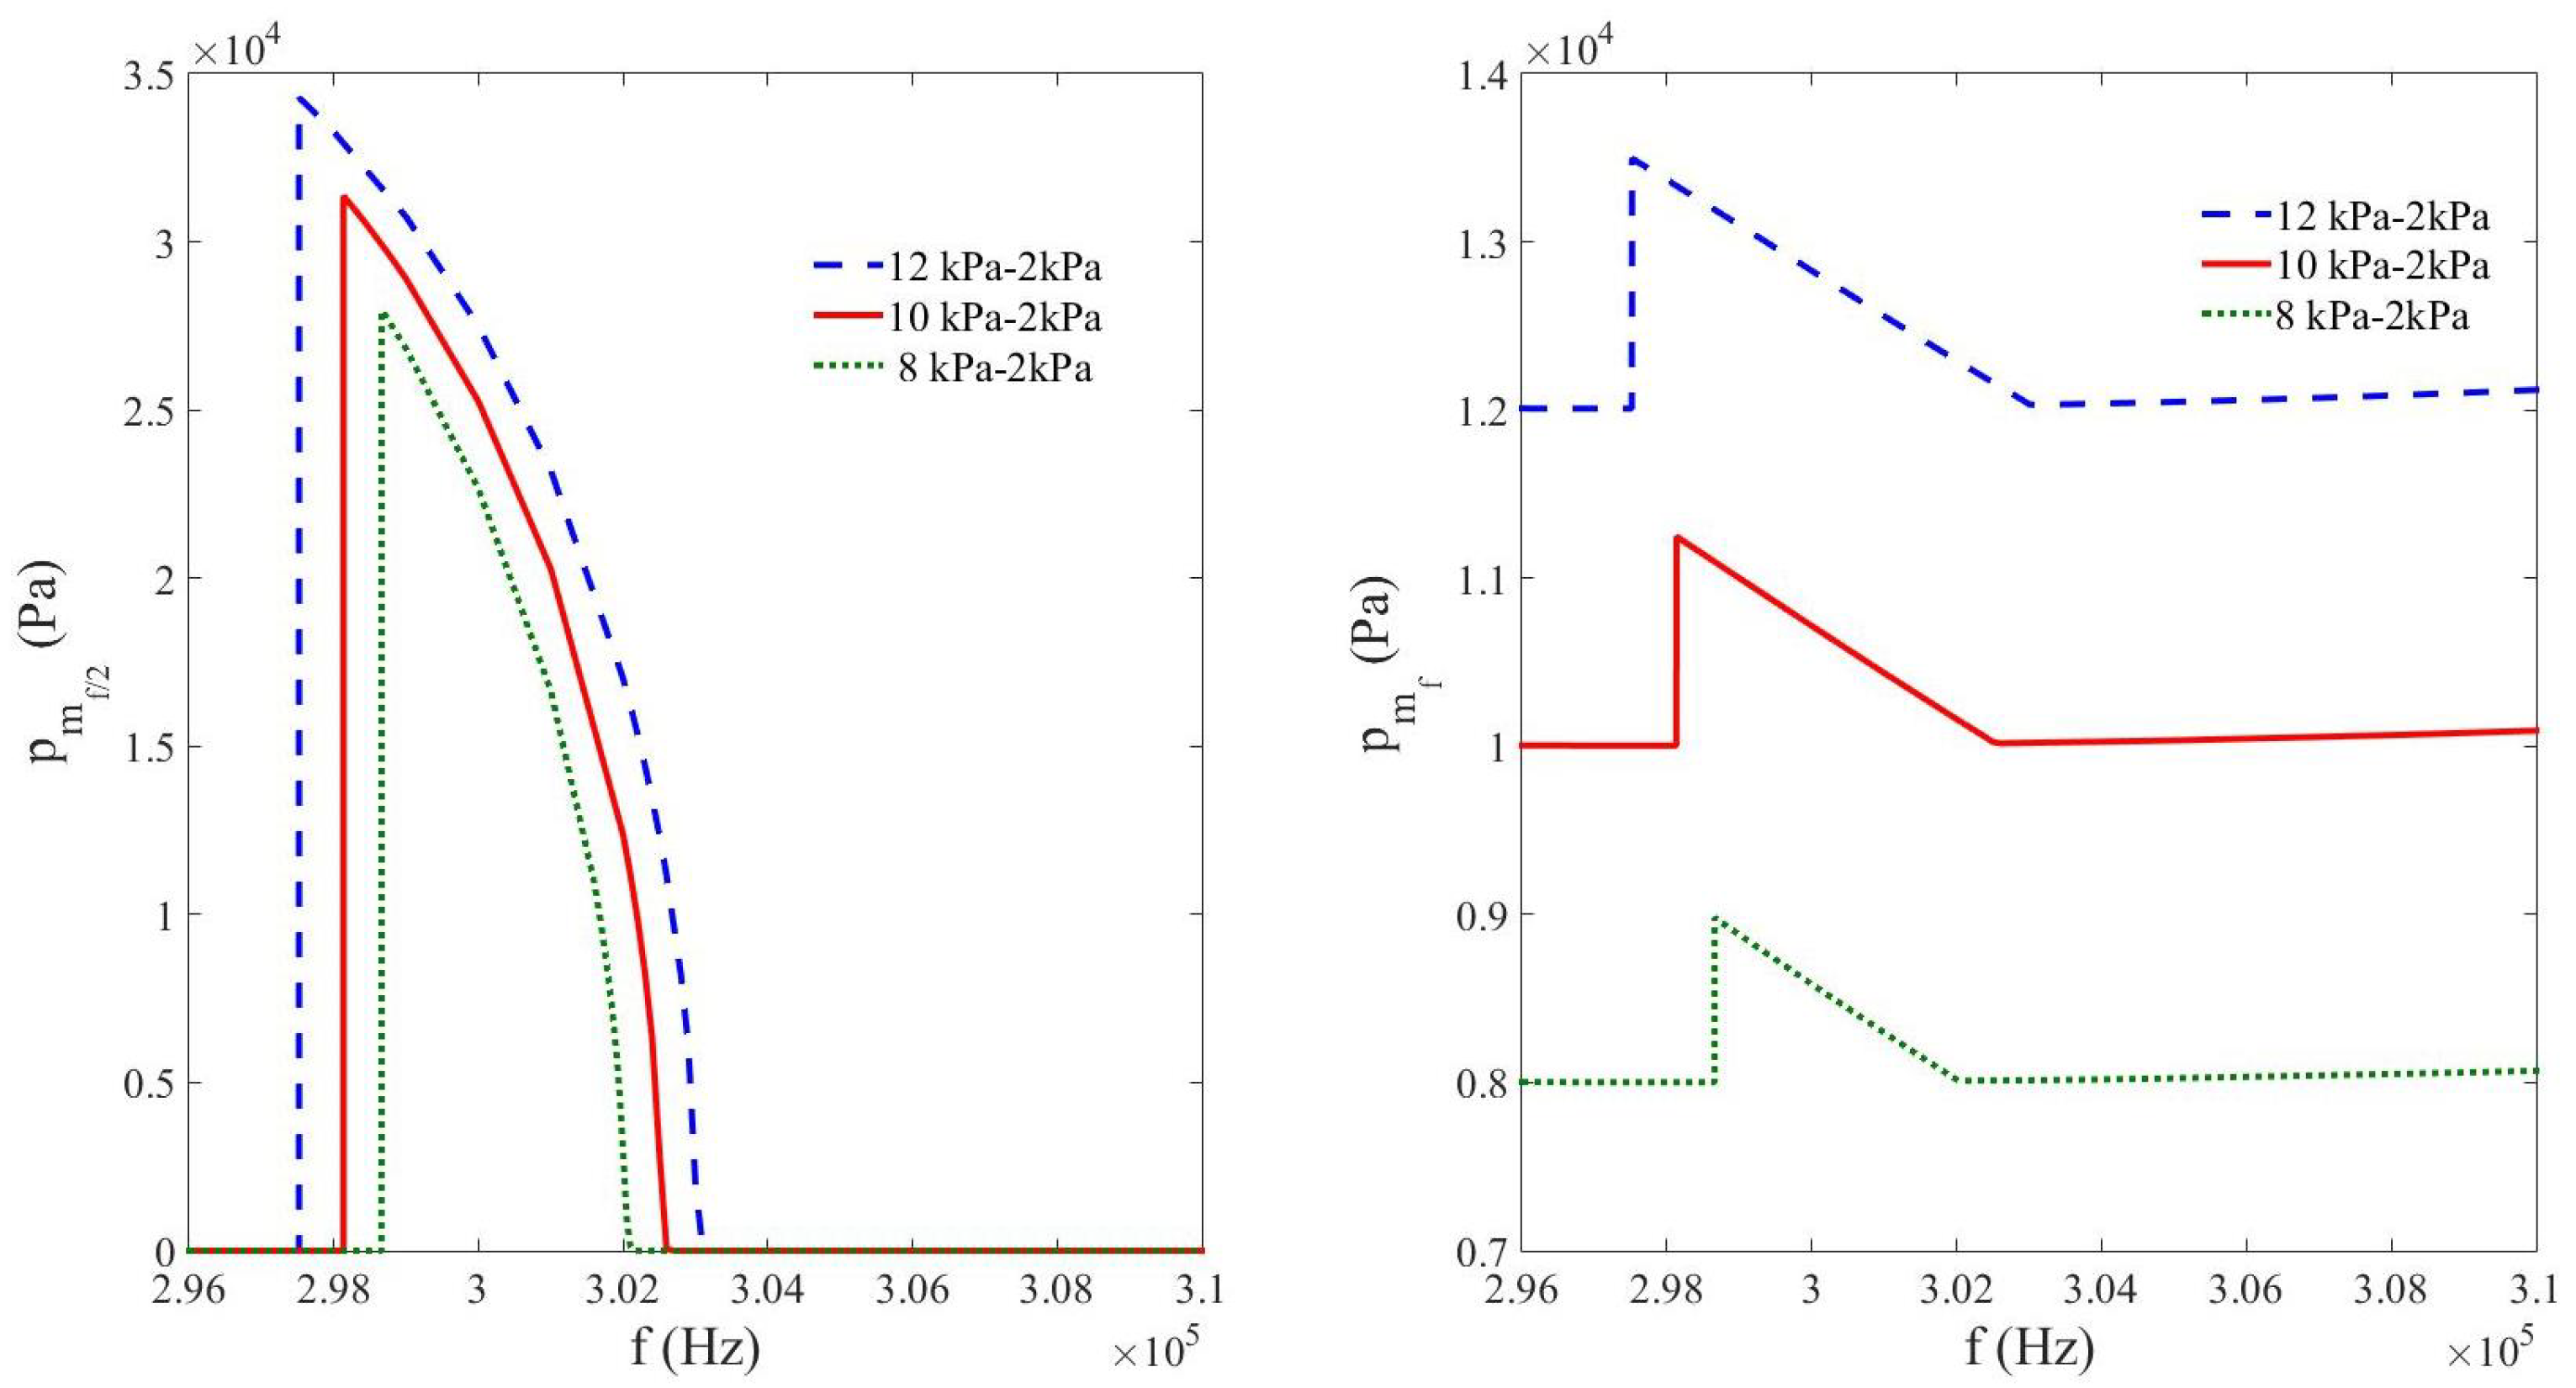
3.3. Nonlinear Resonance of Subharmonics in a Decompressed Bubbly Liquid (Study vs. Acoustic Pressure Amplitude)

In this section, the same procedure as the one used in Section 3.1 and Section 3.2 is applied to study the nonlinear resonance shift of the same frequency components, but considering a decompressed bubbly liquid by applying the net bulk pressure of value p b = 2 kPa (see Equation (4)). In this case, p f = 8 kPa, p f = 10 kPa, and p f = 12 kPa. For each p f , Figure 4 displays p m f / 2 (Figure 4a) and p m f (Figure 4b) as a function of the source frequency f. As in the previous cases, the resonance frequency of the cavity, measured at f / 2 , changes by modifying the acoustic pressure amplitude at the source. In this case, by imposing the negative net bulk pressure ( p b = 2 kPa), it can be seen that the resonance frequency shifts toward lower values than in the free-medium case ( p b = 0 Pa, Section 3.1) for the three acoustic amplitudes. This is an artificial softening imposed by p b , which means that the sound speed is lowered. However, like in the previous sections, the comparison of the three p f shows that an increase in amplitude causes an augmentation of the softening of the medium, which results in lower resonance frequencies. Once again, here, the natural nonlinear behavior of the medium is clearly observed.
Figure 3. Maximum pressure for f / 2 (a), and for f (b) in the cavity vs. source frequency f for three different oscillating source amplitudes p f = 10 kPa (red solid line), p f = 8 kPa (green dashed line (. .)), and p f = 6 kPa (yellow dashed line (- .)) with a fixed net bulk pressure p b = 4 kPa.
Acoustics 07 00017 g003
Figure 4. Maximum pressure for f / 2 (a) and for f (b) in the cavity vs. source frequency f for three different oscillating source amplitudes p f = 12 kPa (blue dashed line (- -)), p f = 10 kPa (red solid line), and p f = 8 kPa (green dashed line (. .)) with a fixed net bulk pressure p b = 2 kPa.
Acoustics 07 00017 g004

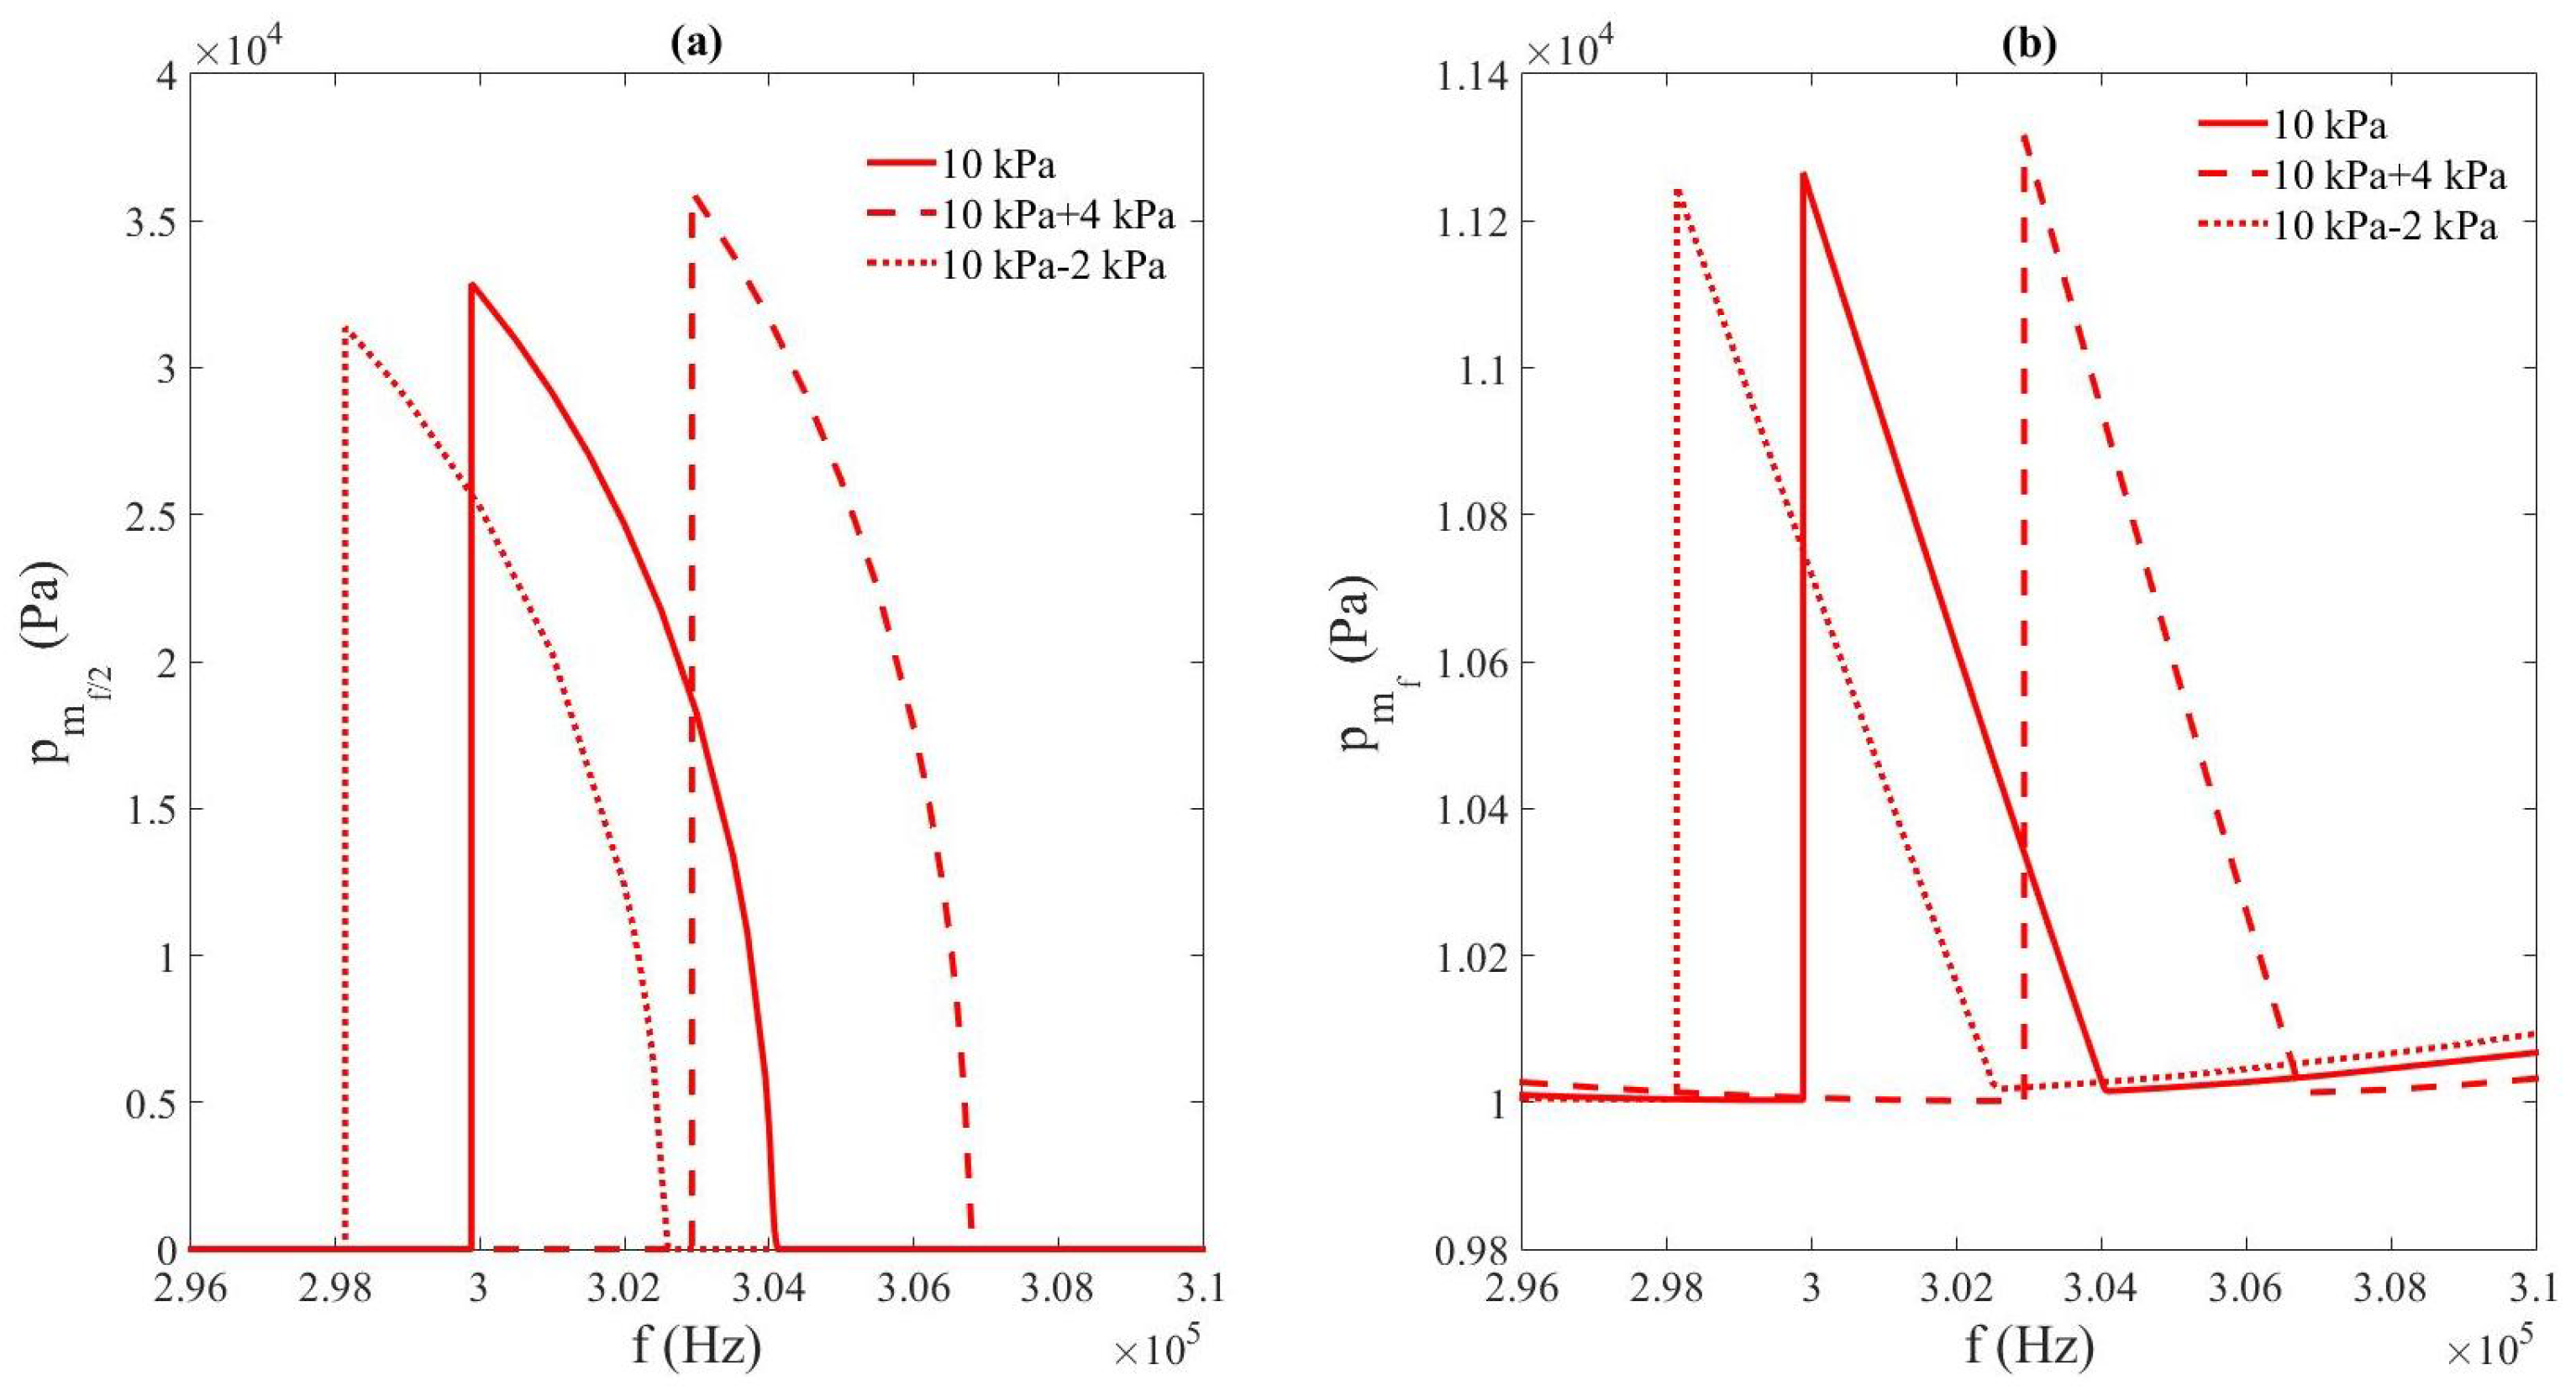
3.4. Comparison of the Nonlinear Resonance of Subharmonics Between Free, Compressed, and Decompressed Bubbly Liquids (Study vs. Net Bulk Pressure)

This section aims to clearly show the behavior described in the above sections by comparing the three different media. Following the methodology used and the results obtained in Section 3.1, Section 3.2, and Section 3.3 for the three values p b = 2 kPa, p b = 0 kPa, and p b = 4 kPa, here, we compare the nonlinear resonance shift of the same frequency components in one case, that is, p f = 10 kPa. p m f / 2 and p m f are displayed in Figure 5a,b vs. the source frequency f. As expected, it can be observed in Figure 5a that the resonance frequency of the cavity is higher when p b is higher, i.e., the resonance frequency is getting higher when the medium is compressed, whereas it is getting lower when the medium is decompressed. However, the amplitude of the frequency components obtained is a consequence of the acoustic pressure signal. The net bulk pressure does influence the medium, and therefore, different amplitudes are obtained in the three different cases, even if they have the same oscillating pressure values. In Figure 5b, we can see a behavior strongly influenced by f / 2 , again, i.e., the peak observed at the f component is due to the second harmonic of the subharmonic f / 2 , which is much more intense (resonant) than the component f (not resonant). It can also be seen that when there is no subharmonics (from 296 to 298 kHz and from 307 to 310 kHz), the maximum amplitude for the component f increases as the source frequency f is getting further away from the resonance of f / 2 , and it decreases as the source frequency f is approaching the resonance of f / 2 .
The phenomenon described in this work may be helpful in verifying the existence of the softening process in a bubbly medium by observing subharmonic behavior. Additionally, measuring subharmonics and their dependence on amplitude may indicate the current presence of bubbles within the liquid, and this may be used for characterizing unknown bubbly liquids.
It is important to note that, since no prior data (theoretical or experimental) are available in the literature describing the relationship between subharmonics and the softening of the bubbly liquid, a comparison of our results is not possible at this time.
The specific computational setting employed in this study enables us to reveal the relationship between the enhancement of subharmonic intensity and the softening of a bubbly liquid as acoustic amplitudes increase (nonlinear resonance shift). This setting was chosen because it was previously used in [26], which demonstrated the hysteretic behavior of subharmonics in bubbly liquids. The computational demands of this particular scenario were substantial, requiring a significant amount of simulation time. We are aware that exploring additional configurations is essential for a more comprehensive understanding; however, future studies should be guided by the conclusions presented in Section 3.1 regarding subharmonic generation in cavities.

4. Conclusions

This study addresses the behavior of subharmonics generated by the nonlinear propagation of ultrasound in a one-dimensional cavity filled with a bubbly liquid. Our analysis focuses on the effects experienced by subharmonics due to medium softening, which occurs as acoustic pressure amplitudes increase, aiming to elucidate the cause of their enhancement when the driving frequency is varying around their resonance in the cavity. The study has been carried out through simulations using a numerical model that allows us to track, in time, the nonlinear mutual interaction between ultrasound and bubble vibrations. These simulations have been conducted to analyze the response of the subharmonic component f / 2 and the component f in the cavity excited over a range around the linear resonance frequency of the cavity. To this purpose, three different kinds of medium have been used. For each one of them, different source amplitudes have been imposed at the acoustic source. It has been shown that the softening of the bubbly medium at higher acoustic pressure amplitudes enhances subharmonic generation, and that this is solely an acoustically-related phenomenon. Furthermore, it has been concluded that the generation of the subharmonic f / 2 is predominant compared to the component f. This can be viewed as a method to verify the existence of the softening process in the bubbly medium by observing subharmonic behavior, as well as a potential technique for characterizing unknown bubbly liquids.

Author Contributions

Conceptualization, M.T.T.-S. and C.V.; methodology, M.T.T.-S. and C.V.; software, M.T.T.-S. and C.V.; validation, M.T.T.-S. and C.V.; formal analysis, M.T.T.-S. and C.V.; investigation, M.T.T.-S. and C.V.; resources, M.T.T.-S. and C.V.; data curation, M.T.T.-S. and C.V.; writing—original draft preparation, M.T.T.-S. and C.V.; writing—review and editing, M.T.T.-S. and C.V.; visualization, M.T.T.-S. and C.V.; supervision, C.V.; project administration, C.V.; funding acquisition, C.V. All authors have read and agreed to the published version of the manuscript.

Funding

This research was funded by the National Agency for Research (Agencia Estatal de Investigación, AEI); the Ministry of Science and Innovation of Spain (Ministerio de Ciencia e Innovación), and the European Regional Development Fund (FEDER), grant number DPI2017-84758-P.

Data Availability Statement

The data are contained within the article.

Acknowledgments

The authors acknowledge Olivier Louisnard for his comments on this paper.

Conflicts of Interest

The authors declare no conflicts of interest.

References

  1. Grieser, F.; Choi, P.; Enomoto, N.; Harada, H.; Okitsu, K.; Yasui, K. Sonochemistry and the Acoustic Bubble; Elsevier: Amsterdam, The Netherlands, 2015. [Google Scholar]
  2. Hamilton, M.; Blackstock, D. Nonlinear Acoustics; Academic Press: Cambridge, MA, USA, 1998. [Google Scholar]
  3. Naugolnykh, K.; Ostrovsky, L. Nonlinear Wave Processes in Acoustics; Cambridge University Press: Cambridge, UK, 1998. [Google Scholar]
  4. Berry, J.; Sidhu, P. Microbubble contrast-enhanced ultrasound in liver transplantation. Eur. Radiol. 2004, 14 (Suppl. S8), 96–103. [Google Scholar]
  5. Gong, Q.; Gao, X.; Liu, W.; Hong, T.; Chen, C. Drug-Loaded Microbubbles Combined with Ultrasound for Thrombolysis and Malignant Tumor Therapy. BioMed Res. Int. 2019, 35, 6792465. [Google Scholar] [CrossRef]
  6. Hernot, S.; Klibanov, A.L. Microbubbles in ultrasound-triggered drug and gene delivery. Adv. Drug Deliv. Rev. 2008, 10, 1153–1166. [Google Scholar] [CrossRef]
  7. Yusof, N.S.; Babgi, B.; Alghamdi, Y.; Aksu, M.; Madhavan, J.A.M. Physical and chemical effects of acoustic cavitation in selected ultrasonic cleaning applications. Ultrason. Sonochem. 2016, 29, 568–576. [Google Scholar]
  8. Mason, T.; Lorimer, J. Applied Sonochemistry: The Uses of Power Ultrasound in Chemistry and Processing; Wiley-VCH: Weinheim, Germany, 2002. [Google Scholar]
  9. Desser, T.; Jeffrey, R. Tissue harmonic imaging tecniques: Physical principles and clinical aplications. Semin. Ultrasound CT MRI 2001, 22, 1–10. [Google Scholar]
  10. Newhouse, V.L.; Shankar, P.M. Bubble size measurements using the nonlinear mixing of two frequencies. J. Acoust. Soc. Am. 1984, 75, 1473–1477. [Google Scholar]
  11. Buckey, J.C.; Knaus, D.A.; Alvarenga, D.L.; Kenton, M.A.; Magari, P.J. Dual-frequency ultrasound for detecting and sizing bubbles. Acta Astronaut. 2005, 56, 1041–1047. [Google Scholar]
  12. Zhang, W.; Liu, Y.; Ratilal, P.; Cho, B.; Makris, N.C. Active Nonlinear Acoustic Sensing of an Object with Sum or Difference Frequency Fields. Remote Sens. 2017, 9, 954. [Google Scholar] [CrossRef]
  13. Westervelt, P.J. Parametric Acoustic Array. J. Acoust. Soc. Am. 1963, 35, 1535–1537. [Google Scholar]
  14. Sinha, D.N.; Pantea, C. Broadband unidirectional ultrasound propagation using sonic crystal and nonlinear medium. Emerg. Mater. Res. 2013, 2, 117–126. [Google Scholar] [CrossRef]
  15. Forsberg, F.; Shi, W.; Goldberg, B. Subharmonic imaging of contrast agents. Ultrasonics 2000, 38, 93–98. [Google Scholar] [CrossRef]
  16. Shankar, P.; Krishna, P.; Newhouse, V. Advantages of Subharmonic Over Second Harmonic Backscatter for Contrast-To-Tissue Echo Enhancement. Ultrasound Med. Biol. 1998, 24, 395–399. [Google Scholar]
  17. Eller, A.; Flynn, H. Generation of subharmonics of order one-half by bubbles in a sound field. J. Acoust. Soc. Am. 1969, 46, 722–727. [Google Scholar]
  18. Lauterborn, W. Numerical investigation of nonlinear oscillations of gas bubbles in liquids. J. Acoust. Soc. Am. 1976, 59, 283–293. [Google Scholar]
  19. Fan, Y.; Li, H.; Fuster, D. Optimal subharmonic emission of stable bubble oscillations in a tube. Phys. Rev. E 2020, 102, 013105. [Google Scholar] [CrossRef] [PubMed]
  20. Sojahrood, A.; Earl, R.; Kolios, M.; Karshafian, R. Investigation of the 1/2 order subharmonic emissions of the period-2 oscillations of an ultrasonically excited bubble. Phys. Lett. A 2020, 384, 126446. [Google Scholar]
  21. Sojahrood, A.; Haghi, H.; Shirazi, N.; Karshafian, R.; Kolios, M. On the threshold of 1/2 order subharmonic emissions in the oscillations of ultrasonically excited bubbles. Ultrasonics 2021, 112, 106363. [Google Scholar]
  22. Shankar, P.; Krishna, P.; Newhouse, V. Subharmonic backscattering from ultrasound contrast agents. J. Acoust. Soc. Am. 1999, 106, 2104–2110. [Google Scholar]
  23. Prosperetti, A. A general derivation of the subharmonic threshold for non-linear bubble oscillations. J. Acoust. Soc. Am. 2013, 133, 3719–3726. [Google Scholar] [PubMed]
  24. Katiyar, A.; Sarkar, K. Excitation threshold for subharmonic generation from contrast microbubbles. J. Acoust. Soc. Am. 2011, 130, 3137–3147. [Google Scholar] [CrossRef] [PubMed]
  25. Katiyar, A.; Sarkar, K. Effects of encapsulation damping on the excitation threshold for subharmonic generation from contrast microbubbles. J. Acoust. Soc. Am. 2012, 132, 3576–3585. [Google Scholar] [PubMed]
  26. Tejedor Sastre, M.T.; Louisnard, O.; Vanhille, C. Generation of subharmonics in acoustic resonators containing bubbly liquids: A numerical study of the excitation threshold and hysteretic behavior. Ultrason. Sonochem. 2022, 88, 106068. [Google Scholar]
  27. Omta, R. Oscillations of a cloud of bubbles of small and not so small amplitude. J. Acoust. Soc. Am. 1987, 82, 1018–1033. [Google Scholar]
  28. Matsumoto, Y.; Yoshizawa, S. Behaviour of a bubble cluster in an ultrasound field. Int. J. Numer. Methods Fluids 2005, 47, 591–601. [Google Scholar]
  29. Doc, J.B.; Conoir, J.M.; Marchiano, R.; Fuster, D. Nonlinear acoustic propagation in bubbly liquids: Multiple scattering, softening and hardening phenomena. J. Acoust. Soc. Am. 2016, 139, 1703–1712. [Google Scholar] [CrossRef] [PubMed]
  30. Tejedor-Sastre, M.; Vanhille, C. Nonlinear Resonance of Cavities Filled with Bubbly Liquids: A Numerical Study with Application to the Enhancement of the Frequency Mixing Effect. Shock Vib. 2018, 2018, 1570508. [Google Scholar]
  31. Tejedor Sastre, M.T.; Vanhille, C. Definition of Bubbly Liquids Parameters for the Optimization of Their Nonlinear Effects on Ultrasound. Appl. Sci. 2023, 13, 3882. [Google Scholar] [CrossRef]
  32. Tejedor-Sastre, M.; Vanhille, C. A numerical model for the study of the difference frequency generated from nonlinear mixing of standing ultrasonic waves in bubbly liquids. Ultrason. Sonochem. 2017, 34, 881–888. [Google Scholar]
  33. Doinikov, A. Bjerknes forces and translational bubble dynamics. Bubble Part. Dyn. Acoust. Fields Mod. Trends Appl. 2005, 661, 95–143. [Google Scholar]
Figure 1. Maximum pressure for f / 2 (a), and f (b) in the cavity vs. source frequency f for four different acoustic amplitudes of the source p f = 12 kPa (blue dashed line (- -)), p f = 10 kPa (red solid line), p f = 8 kPa (green dashed line (. .)), and p f = 6 kPa (yellow dashed line (- .)).
Acoustics 07 00017 g001
Figure 5. Maximum pressure amplitude for f / 2 (a) f (b) components at p f = 10 kPa vs. source frequency f for the three net bulk pressures p b = 2 kPa (dotted line), p b = 0 kPa (solid line), and p b = 4 kPa (dashed line).
Acoustics 07 00017 g005
Table 1. Parameters used in the model.
Liquid (Water)Gas (Air)Bubbles
c 0 l = 1500 m/s c 0 g = 340 m/s R 0 g = 2.5 µm
ρ 0 l = 1000 kg/ m 3 ρ 0 g = 1.29 kg/ m 3 f 0 g = 1.35 MHz
ν l = 1.43 × 10 6   m 2 /s γ g = 1.4 N g = 5 × 10 11 1/ m 3
Disclaimer/Publisher’s Note: The statements, opinions and data contained in all publications are solely those of the individual author(s) and contributor(s) and not of MDPI and/or the editor(s). MDPI and/or the editor(s) disclaim responsibility for any injury to people or property resulting from any ideas, methods, instructions or products referred to in the content.

