Article

Porous Metal Backing for High-Temperature Ultrasonic Transducers

1
INSA Centre Val de Loire, GREMAN Laboratory, UMR CNRS 7347, Université de Tours, 3 rue de la Chocolaterie, CEDEX, 41034 Blois, France
2
CEA-DES\IRESNE\DTN\STCP\LISM, 13108 St-Paul-Lez-Durance, France
*
Author to whom correspondence should be addressed.
Acoustics 2024, 6(4), 1074-1087; https://doi.org/10.3390/acoustics6040058
Submission received: 18 September 2024 / Revised: 9 October 2024 / Accepted: 21 November 2024 / Published: 25 November 2024

Abstract

:
Improving the performance of high-temperature ultrasonic transducers is a goal of major importance in many industrial applications. To this aim, we propose to use porous metals that support high temperatures as backings. Thus, the acoustic properties of stainless steel and porous stainless steel with porosity of 25% and 35% are determined at ambient temperature and up to 400 °C. Over the temperature range, the longitudinal wave velocity variation is comprised between 5% and 6% in the porous metals. We find that temperature does not significantly affect the attenuation in the material. The pulse-echo response and frequency response of a LiNbO3-based transducer with a porous backing are simulated using a one dimensional electroacoustic model. These simulations, compared to those of a reference transducer, show that the axial resolution with such a design allows these transducers to be used for imaging and/or Non-Destructive Testing and evaluation at high temperature.

1. Introduction

In recent years, in parallel with the development of advanced industries where operating environments can be very hostile, there has been a significant evolution in the requirements of new high-performance instrumentation to characterize aging and damage or to monitor and control the operation of systems.
Among the existing non-destructive testing methods, ultrasonic techniques based on the development of piezoelectric materials are widely used in many applications within the nuclear industry. They require ultrasonic transducers whose concept has been well-known for many years. The transducer is generally based on a piezoelectric element electrically solicited around its resonant frequency, radiating an ultrasonic wave in the investigated medium [1]. This active element is mounted on a backing whose role is to damp the vibration, leading to an improvement of the axial resolution and increase in the transducer’s bandwidth. It must also attenuate the ultrasonic wave emitted on the rear face of the active element to avoid parasitic echoes on its rear face. On the front face of the piezoelectric element, one or more matching layers are often added to allow better energy transfer toward the propagation medium. Through these elements, the transducer sensitivity and bandwidth can be adapted to the needs of various applications [2,3,4]. In a context of high-temperature nondestructive testing and evaluation, conventional ceramic-based ultrasonic transducers cannot be used at high temperatures (>150 °C) and for long periods (>24 h) because of the Curie temperature of the piezoelectric element. Even if the transducer can operate for short periods at high temperatures, these temperatures significantly affect its electroacoustic performances by degrading the physical and piezoelectric properties of its components [5,6,7].
Therefore, industrial applications of ultrasonic temperature control are still limited.
Applications at high temperatures (>400 °C) typically require long operating durations, from several hours to several days, or even continuous operation. Therefore, to ensure continuous operation, the transducer must be made from materials capable of withstanding the working temperatures. Most commercially available ultrasonic transducers are currently based on a lead zirconate titanate (PZT) piezoelectric element, which has a maximum Curie temperature of around 400 °C [8]. Indeed, the piezoelectric material loses its piezoelectric properties due to changes in its crystalline structure to a cubic structure. As a result, it becomes unusable if it must operate at temperatures above its Curie temperature.
Piezoelectric single crystals such as lithium niobate, lithium tantalate or langasite can be used because of their high Curie temperature [9,10,11]. Indeed, lithium niobate exhibits a Curie temperature greater than 1200 °C, lithium tantalate has a lower Curie temperature of 610 °C and langasite single crystal can operate at temperatures up to 1400 °C close to its melting point. Lithium niobate and lithium tantalate single crystals belong to the (3 m) crystallographic symmetry class and can operate in the length extensional mode, however, langasite crystals belong to the (32) crystallographic symmetry class, as do quartz single crystals, and cannot directly operate in the length extensional mode. The choice of piezoelectric materials if of major importance but not the only one. Indeed, other passive elements of the transducer, traditionally made from polymers, cannot be used due to chemical degradation at temperatures above 200 °C [12].
For these reasons, the research and development of ultrasonic transducers that can not only withstand high temperatures but also maintain high electroacoustic performance remains a technical challenge to meet the increasingly stringent demands of the nuclear industry [7,10,13,14,15]. Critical applications of these transducers include the continuous monitoring of corrosion, cracks, leaks, object displacement, the presence of bubbles, pressure, and flow rates in high-temperature piping systems in nuclear power plants, as well as the inspection and monitoring of nuclear structures, and the inspection of materials and structures during nuclear decommissioning [12].
To overcome these limitations, various approaches have been explored to manufacture high-temperature ultrasonic transducers. These include the development of active and passive materials that resist thermal degradation [16,17,18,19,20]. Differences in thermal expansion among the transducer’s components lead to internal stresses that may create cracks or fractures, causing the transducer to malfunction [19,20]. The integration of delay lines was also explored [18] as well as the use of surface acoustic waves (SAW) [21,22], guided waves [23], or the implementation of electromagnetic acoustic transducers (EMATs) [24] which effectively insulate the transducer from harsh environments. Nevertheless, in the context of fast neutron-cooled nuclear reactors [25] where the device is required to remain immersed at 500 °C for several tens of years, simple and robust designs based on well-known materials and technologies need to be investigated.
In this context, Lhuillier et al. [26] have proposed the design of a longitudinal wave High Temperature Ultrasonic Transducer (HTUST) to be used in fast neutron-cooled nuclear reactors [25] whose characteristics are given in Table 1. It consists of a Z-cut lithium niobate single crystal disc whose Curie temperature is above 1100 °C, with a thickness mode resonance around 4.5 MHz, mounted on a 2 mm thick metal pad encapsulated in a metallic housing that has a 1.2 mm thick steel front face (Figure 1). Such a structure possesses multiple resonation modes, leading to a very narrow bandwidth and an extremely long time response. Both experimental measurements and simulations illustrate this as shown in Figure 2 which presents the experimental and theoretical pulse-echo response and spectrum of such a transducer radiating in water. The experimental pulse-echo response was obtained using a broadband pulser-receiver (JSR Ultrasonics model DPR300, BYK-Gardner, Chester, NY, USA) using a large planar reflector located at 4.5 cm from the transducer. A description of the electroacoustic model used for simulation can be found in [27]. Here, the pulse duration in water determined from the −6 dB pulse duration of such a transducer is found to be 47 mm, which confines these devices essentially to telemetry.
To fulfill the need for high-temperature imaging systems in industry, improvement of the axial resolution is required since it would bring a real benefit in terms of image quality. Using backing materials that can withstand high temperatures is a way to improve the transducer axial resolution. Such a backing material for high-temperature ultrasonic transducers must satisfy several physical and acoustic criteria [7,9,29]. The attenuation coefficient should be high enough to avoid round-trip echoes in the backing and the acoustic impedance should be a tradeoff between sensitivity and resolution. The physical and mechanical properties should be thermally stable in the operation temperature range and the thermal expansion coefficient should be close to that of the piezoelectric material to avoid thermomechanical stresses.
Among the possible candidates, porous steels are good candidates. Indeed, the presence of pores at different ratios allows control of the acoustic properties of the material, in particular the acoustic impedance and attenuation, which are critical parameters. Being used in filtering systems in various industrial environments, they have been shown to be able to operate at high temperatures.
In this paper, we examine the acoustic properties of porous stainless steels with 25% and 35% porosity from room temperature up to 400 °C. In the first part, we present the materials and their physical properties, then the experimental setup for the measurements at high temperatures. Then, we present the results of wave velocity, attenuation, and acoustic impedance measurements for these two samples. Finally, based on these properties, we report the results of the simulation of an ultrasonic transducer based on lithium niobate mounted on such a backing.

2. Materials and Methods

In this section, the characteristics of the porous metals for high temperature application are presented as well as the experimental methods including experimental set-up and measurement techniques.

2.1. Metallic Porous Materials for High-Temperature Applications

In this study, the selected materials were SS316L stainless steel-based porous materials. They were manufactured by AMESPORE® (Sant Feliu de Llobregat, Spain) by uniaxial compaction of powder, followed by sintering. The pore size was adjusted by modifying the compaction pressure and/or the size of the powder particles. These materials have an open porosity. The average porosity was determined from mass and volume measurements, and the nominal pore size given by the manufacturer is reported in Table 2. The characteristics of the reference material, dense SS 316L stainless steel with the same chemical composition, are also reported.
Figure 3 shows the Scanning Electron Microscopy of sample SSU02 where the pore size heterogeneity can be observed. In this image, the pore size appears much larger than that given by the manufacturer. Indeed, the pore size indicated by the supplier is the minimum pore size that a solid particle can cross through the material.

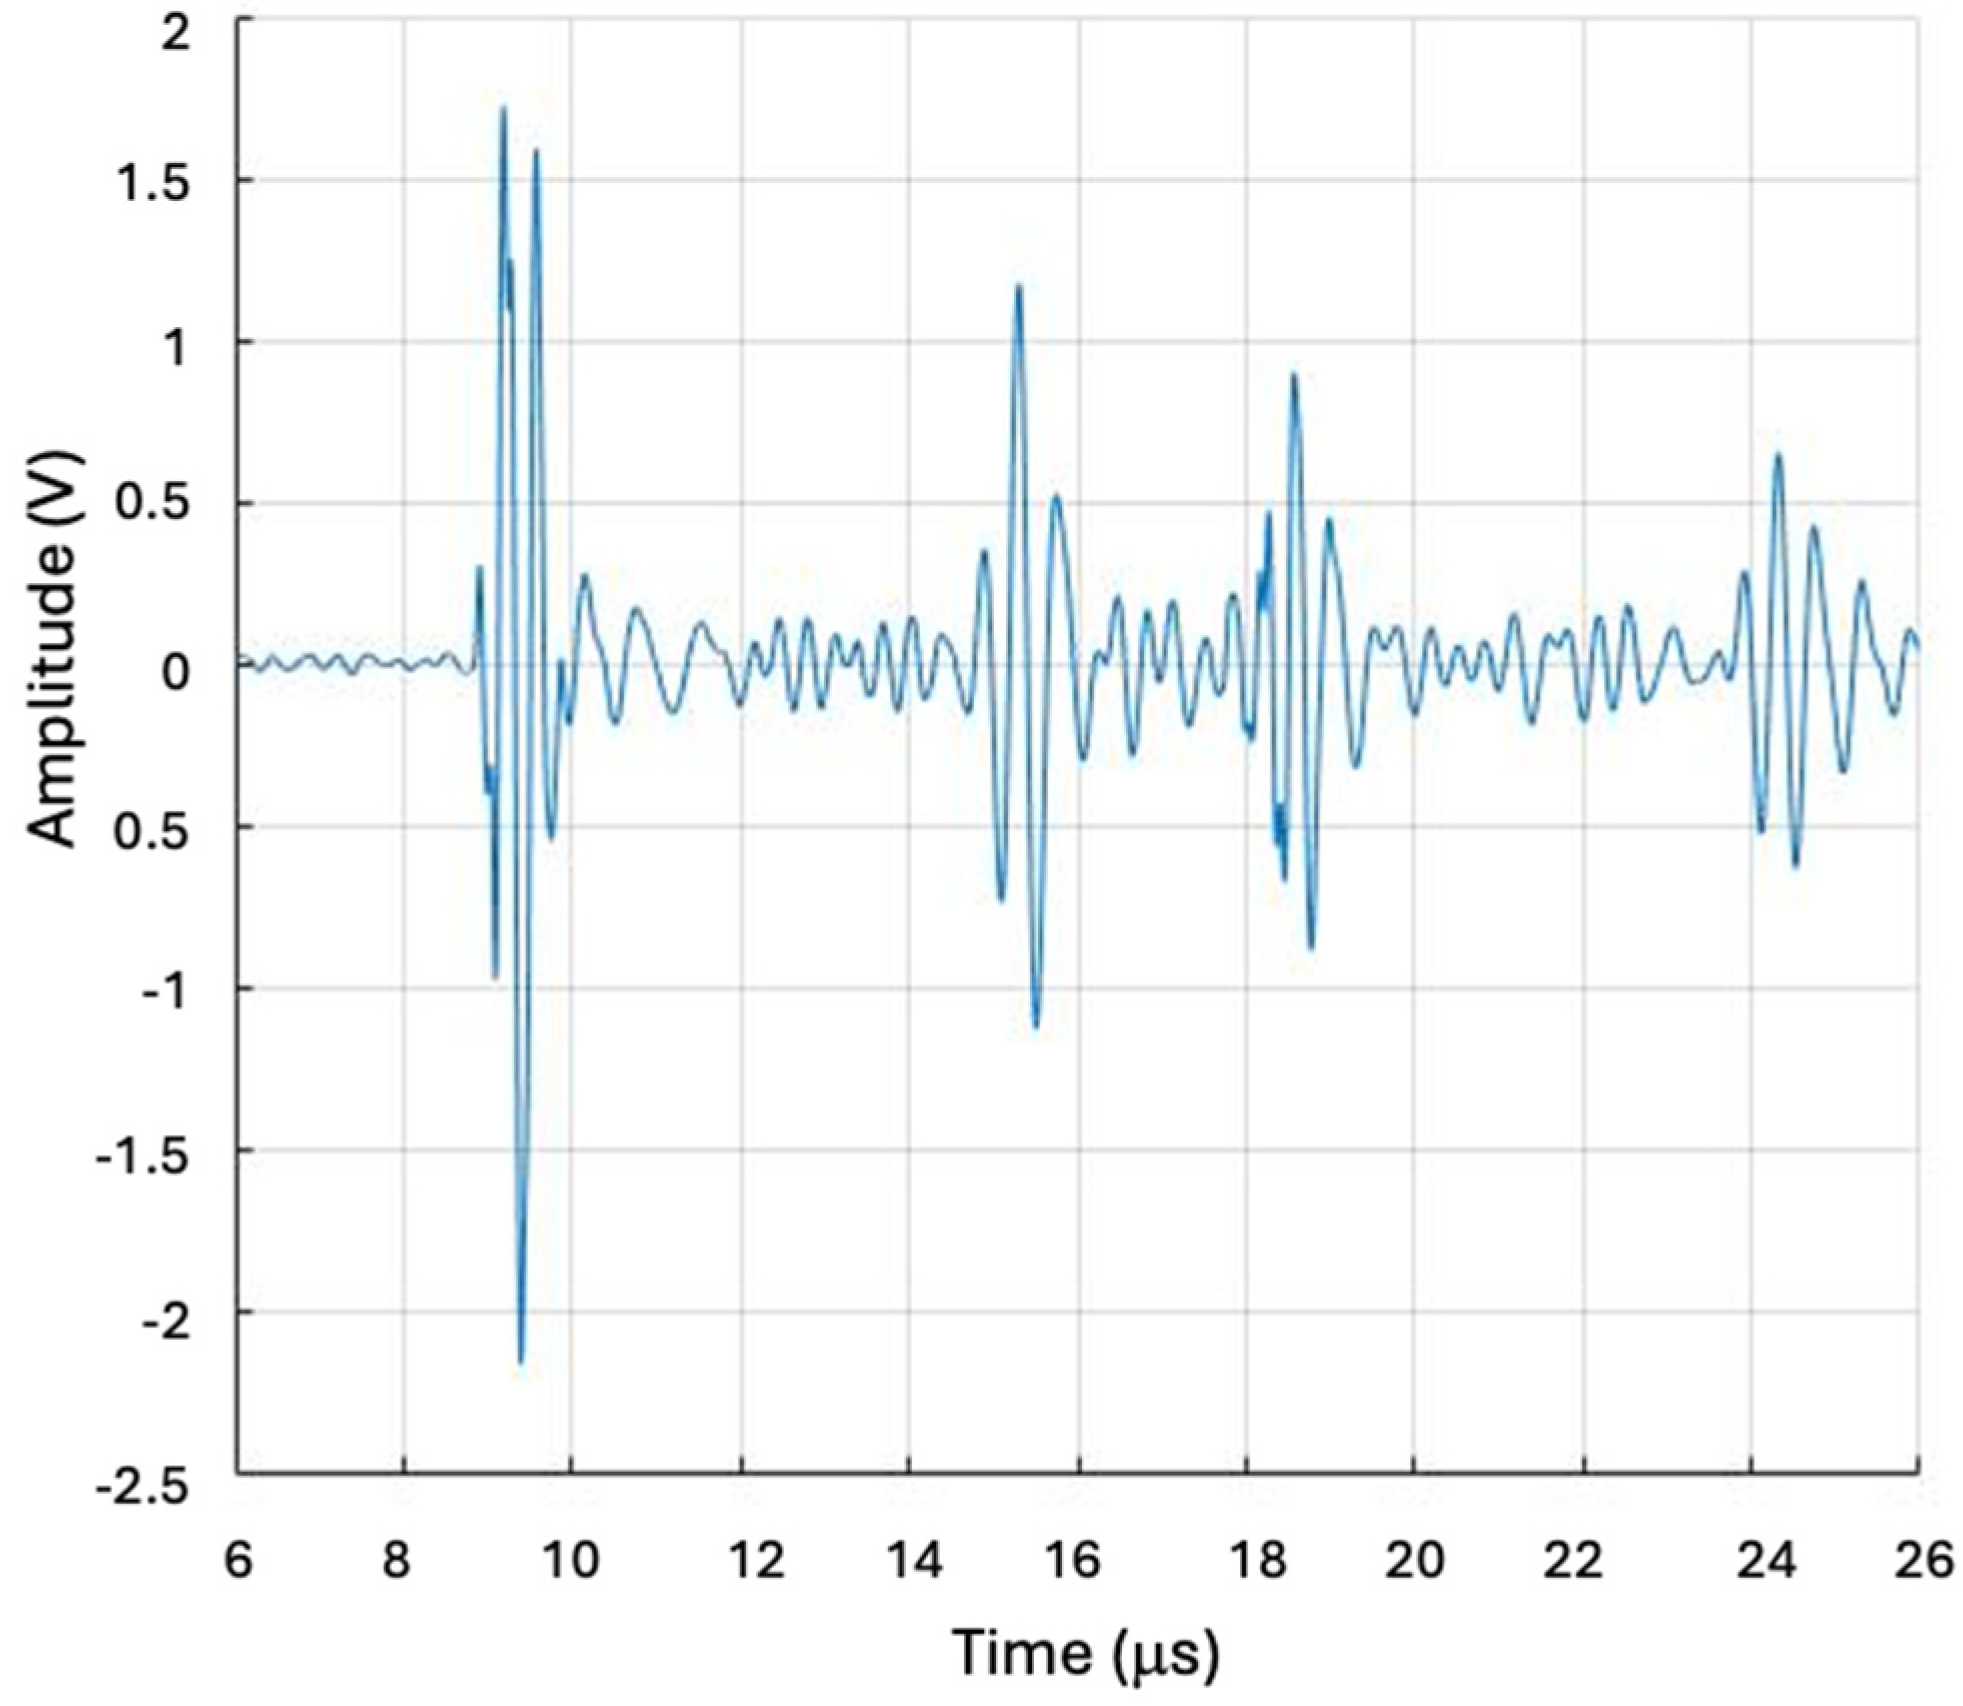
2.2. Experimental Measurements

Properties are deduced from ultrasonic contact measurements (time of flight and amplitude measurements) on the sample as a function of temperature. The experimental setup for the characterization of the sample acoustic properties versus temperature is shown in Figure 4. The sample is placed in a furnace (Nabatherm GmbH model LT20/11/B410, Lilienthal, Germany). It is maintained in contact with the ultrasonic transducer using a high temperature coupling material by the mean of a metallic sample holder (Figure 4b). The samples were characterized using a conventional pulse-echo method with a 2 MHz transducer (Kande International, AlsagerStoke on Trent United Kingdom), allowing to compensate the apparatus response. The transducer was excited by a broadband pulser-receiver (JSR Ultrasonics model DPR300, BYK-Gardner, Pittsford NY, USA) whose output voltage varies between 100 V and 475 V under 50 Ohms. The received signals were then amplified with a gain varying between 40 dB and 70 dB before being digitized at a sampling frequency of 200 MHz by an oscilloscope (Lecroy HDO4024A, Ramapo, NY, USA). The acquired signals were averaged to increase the signal-to-noise ratio before being transferred to the computer for processing using Matlab®R2023b. In addition, three type K thermocouples were placed on the sample and connected to a dedicated computer assigned to the furnace to monitor the temperature of the sample in real time.
In this configuration, the received signal results from multiple reflections at the delay line—sample interface and within the sample. Denoting U 1 the first received signal corresponding to first reflection at the delay line sample interface, its amplitude and phase depends on U 0 ω the frequency response of the electric pulse, as well as A E ω et A R ω the transmit and receive transfer functions of the transducer:
U T 1 = U 0 ω A E ω e j 2 k L A R ω ,
where diffraction effects are considered negligible as we are in near field. Here, k is the wave number in the delay line and L is the length of the delay line. After one reflection in the sample the received signal becomes
U T 1 = U 0 ω A E ω e j 2 k L A R ω T d l c T c s e j 2 k c ε e j 2 k s e ,
where T d l c et T c s are the energy transmission coefficients at the delay line—coupling layer interface and the coupling layer—sample interface. k c and k s are the wave numbers in the interface coupling layer and the sample. ε and e are the thicknesses of the interface coupling layer and the sample.
By taking the ratio of these two signals,
U T 1 U 1 = T d l c T c s e j 2 k c ε e j 2 k s e ,
we can compensate for the apparatus function.
In this case, the sample is 1 cm thick, while the thickness of the coupling layer is typically less than 10 μm. This layer introduces a bias in the absolute velocity measurement, which is why, in the discussion, we will focus on velocity variations rather than absolute velocity as a function of temperature.
Figure 5 shows a typical signal received by the transducer and illustrates the way the material is characterized. The first echo corresponds to the round-trip in the transducer delay line. The second echo corresponds to an added round-trip in the sample. The following echoes correspond, respectively, to a second round-trip in the delay line and the sample. The ultrasonic wave velocity in the sample was determined from the time-of-flight measurement between the first and second echoes using an intercorrelation.
In the experiments, the transducer coupling to the delay line was not controlled. Thus, it is not possible to determine the absolute attenuation coefficient as the energy transmission coefficients between the delay line and the coupling layer and between the coupling layer and the sample are not known. Consequently, it was not possible to obtain the absolute attenuation in the sample. However, all things remaining the same in the experiments, it is possible to examine the variations of attenuation through the variations of the ratio of the amplitudes of the spectra of the second echo to that of the first one.

3. Results

First, we report the acoustic properties of porous steels with 25 and 35% porosity as well as those of the reference steel at 0% porosity, at room temperature by transmission measurements using the conventional insertion substitution method in water [29]. An electric pulse was sent to the emitting transducer using a wideband generator (Olympus-Panametrics 1035 PR, Westborough, MA, USA), and the signal was received after transmission, either with or without the sample. The signal was digitized by an oscilloscope (Lecroy WaveRunner 104Xi, Ramapo, NY, USA) and transferred to a computer for processing. The time difference, ∆t, between the transmitted signal in the reference medium without the sample, and the transmitted signal when the sample is inserted, is related to the speed of the ultrasonic wave in the material and that of the reference medium.
t = e 1 c 1 c w ,
where c w = 1500   m · s 1 is the sound velocity in water, c is the propagation speed of ultrasound in the sample and e is its thickness.
Knowing the wave velocity and the density of the material, the transmission/reflection coefficient in normal incidence between the sample and water can be obtained, then the attenuation in dB m−1 in the sample is given by the following:
α = 20 l o g P ¯ t 1 f T P ¯ R e f f × 1 2 e   ,
where P ¯ t 1 f is the modulus of the transfer function of the signal transmitted through the sample, and P ¯ R e f f is the modulus of the transfer function of the reference signal transmitted through water. T represents the energy transmission coefficient at the water-sample interface. In our case, this attenuation is measured at the center frequency of the transducer.
These properties are given in Table 3. Measurements were performed using 1 MHz transducers and for each nominal porosity, 20 samples were characterized which allows a standard deviation for the acoustic properties to be determined.
Despite different porosities, the two samples SSU02 and SSU10 have the same attenuation coefficient. In porous materials, the attenuation coefficient depends on many parameters including the porosity ratio and pore size. Here, SSU10 sample has a pore size of 10.7   μ m compared to 1.7   μ m for SSU02 which probably explains these results.
In Table 4, the absolute velocity measurement and the variation of attenuation relative to the room temperature value in the 3 samples are reported as a function of temperature. Measurements for varying temperatures were performed on three samples (one for each porosity ratio).

4. Discussion

This section discusses the measurements as a function of temperature in the three samples. In addition, the electroacoustic response of a Lithium Niobate Z cut-based transducer with backing is simulated using the one-dimensional KLM model developed in the laboratory. First, we investigate the influence of the backing acoustic impedance on the electroacoustic response of a high temperature transducer whose design is based on that of a reference transducer developed by authors. Then, we report simulations of transducers based on the two porous materials that were characterized as a function of temperature

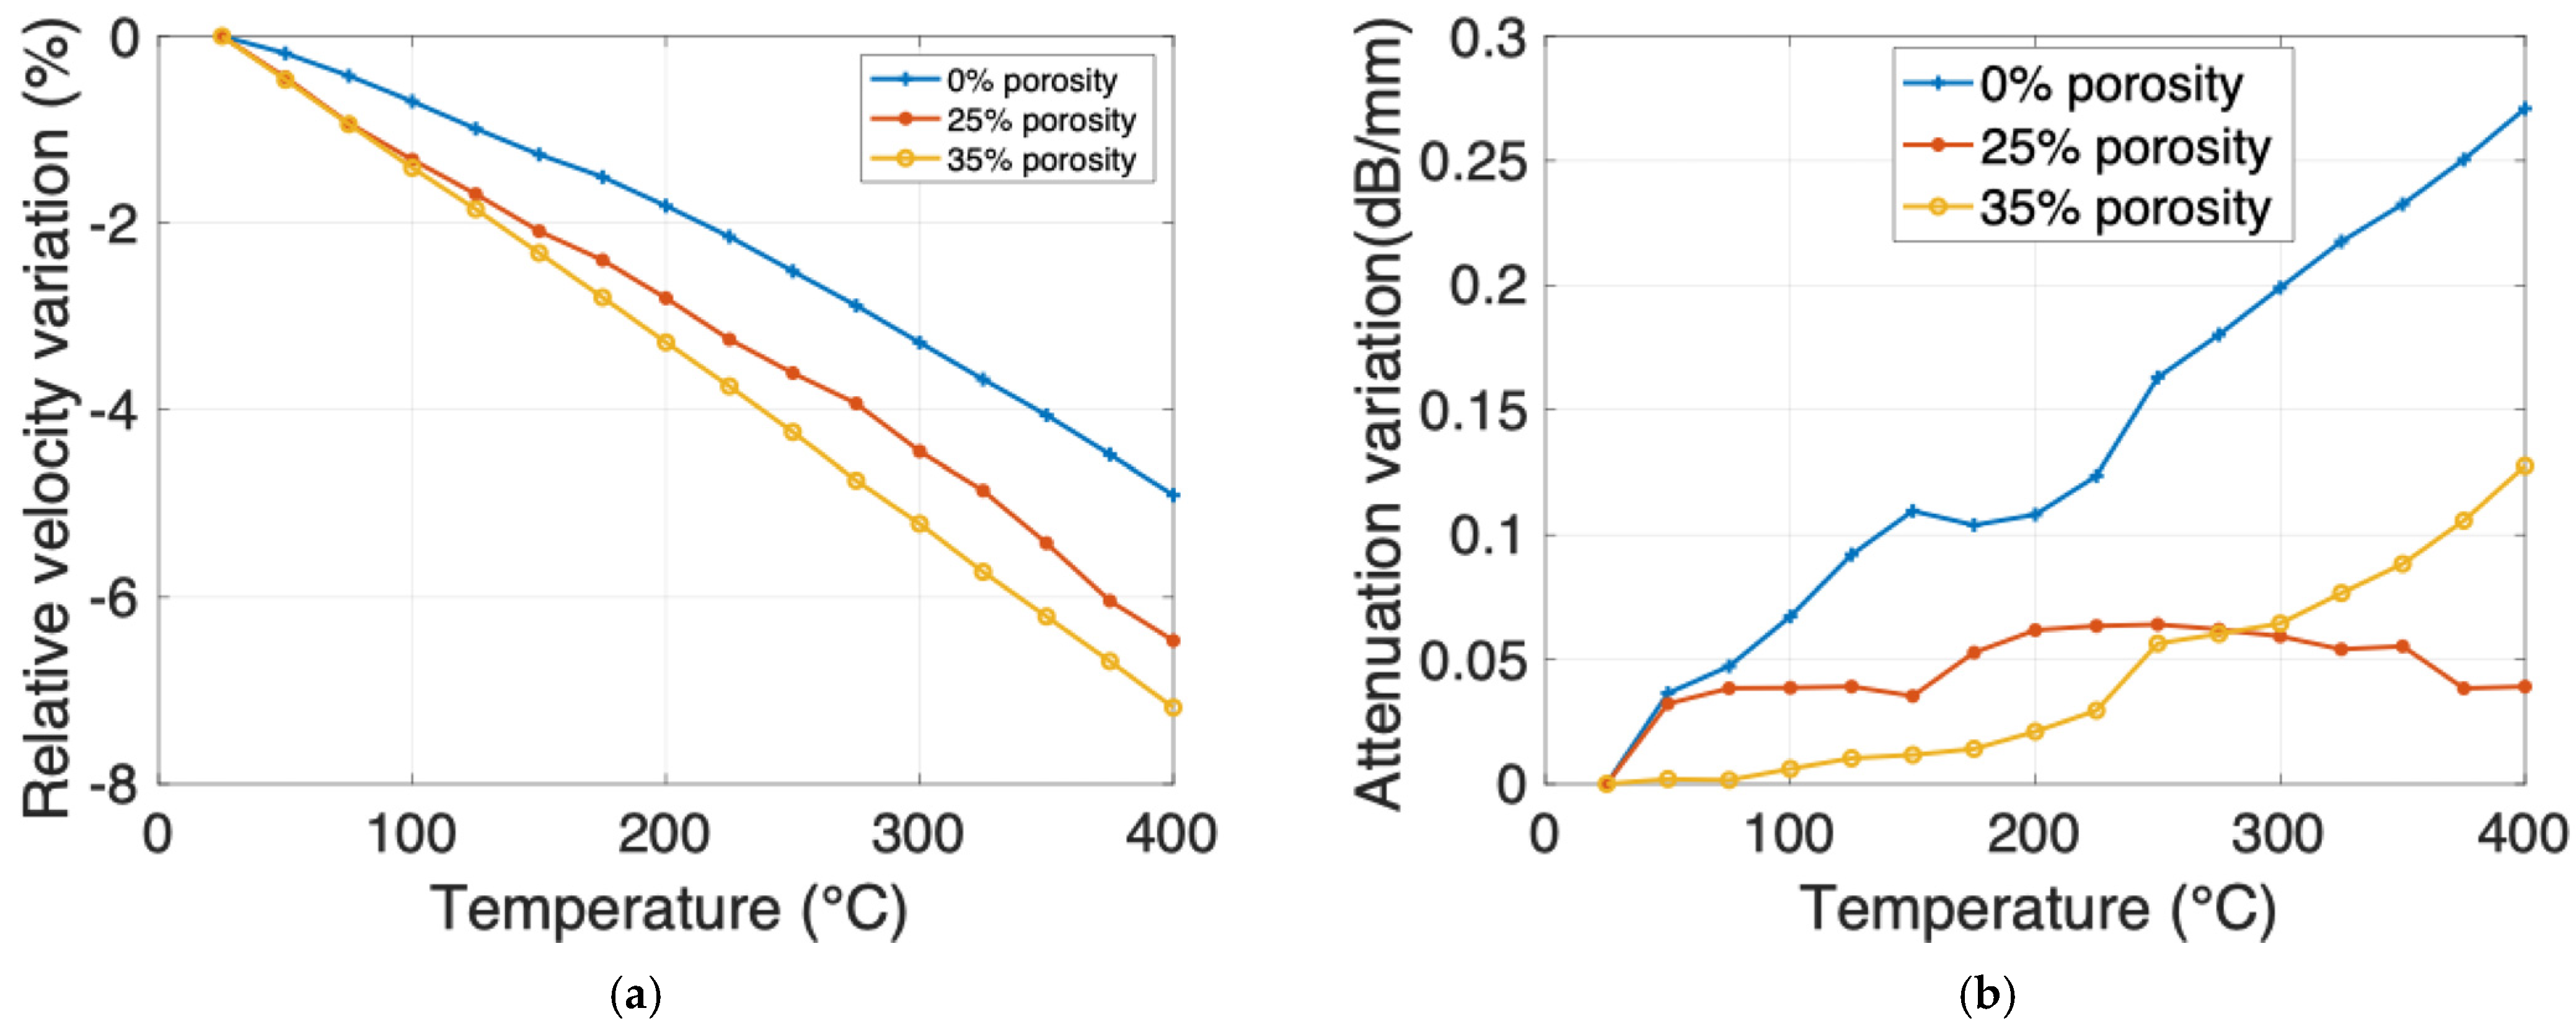
4.1. Measurementsas a Function of Temperature

For all three samples, the ultrasonic wave velocity decreases as the temperature increases (Figure 6a). The relative change is about 6% over a temperature range of 400 °C. For 25% and 35% porosity samples, the temperature coefficient is almost linear. It is, respectively, 16.7 ppm °C−1 and 19.2 ppm °C−1. Concerning the attenuation (Figure 6b), in the dense steel sample, it increases with temperature and the attenuation is 0.25 dB mm−1 greater at 400 ° C than at room temperature. For porous steel, with 25% and 35% porosity, the attenuation tends to increase slightly as a function of temperature. However, this variation is less than 0.05 dB mm−1 for samples with 25% porosity and less than 0.15 dB mm−1 for samples with 35% porosity. The attenuation mechanisms in these materials depend little on temperature, so attenuation is probably mainly dominated by ultrasonic wave diffusion mechanisms. Therefore, it seems reasonable to use the attenuation values measured at room temperature to estimate the performance of this material in the constitution of a high-temperature transducer.

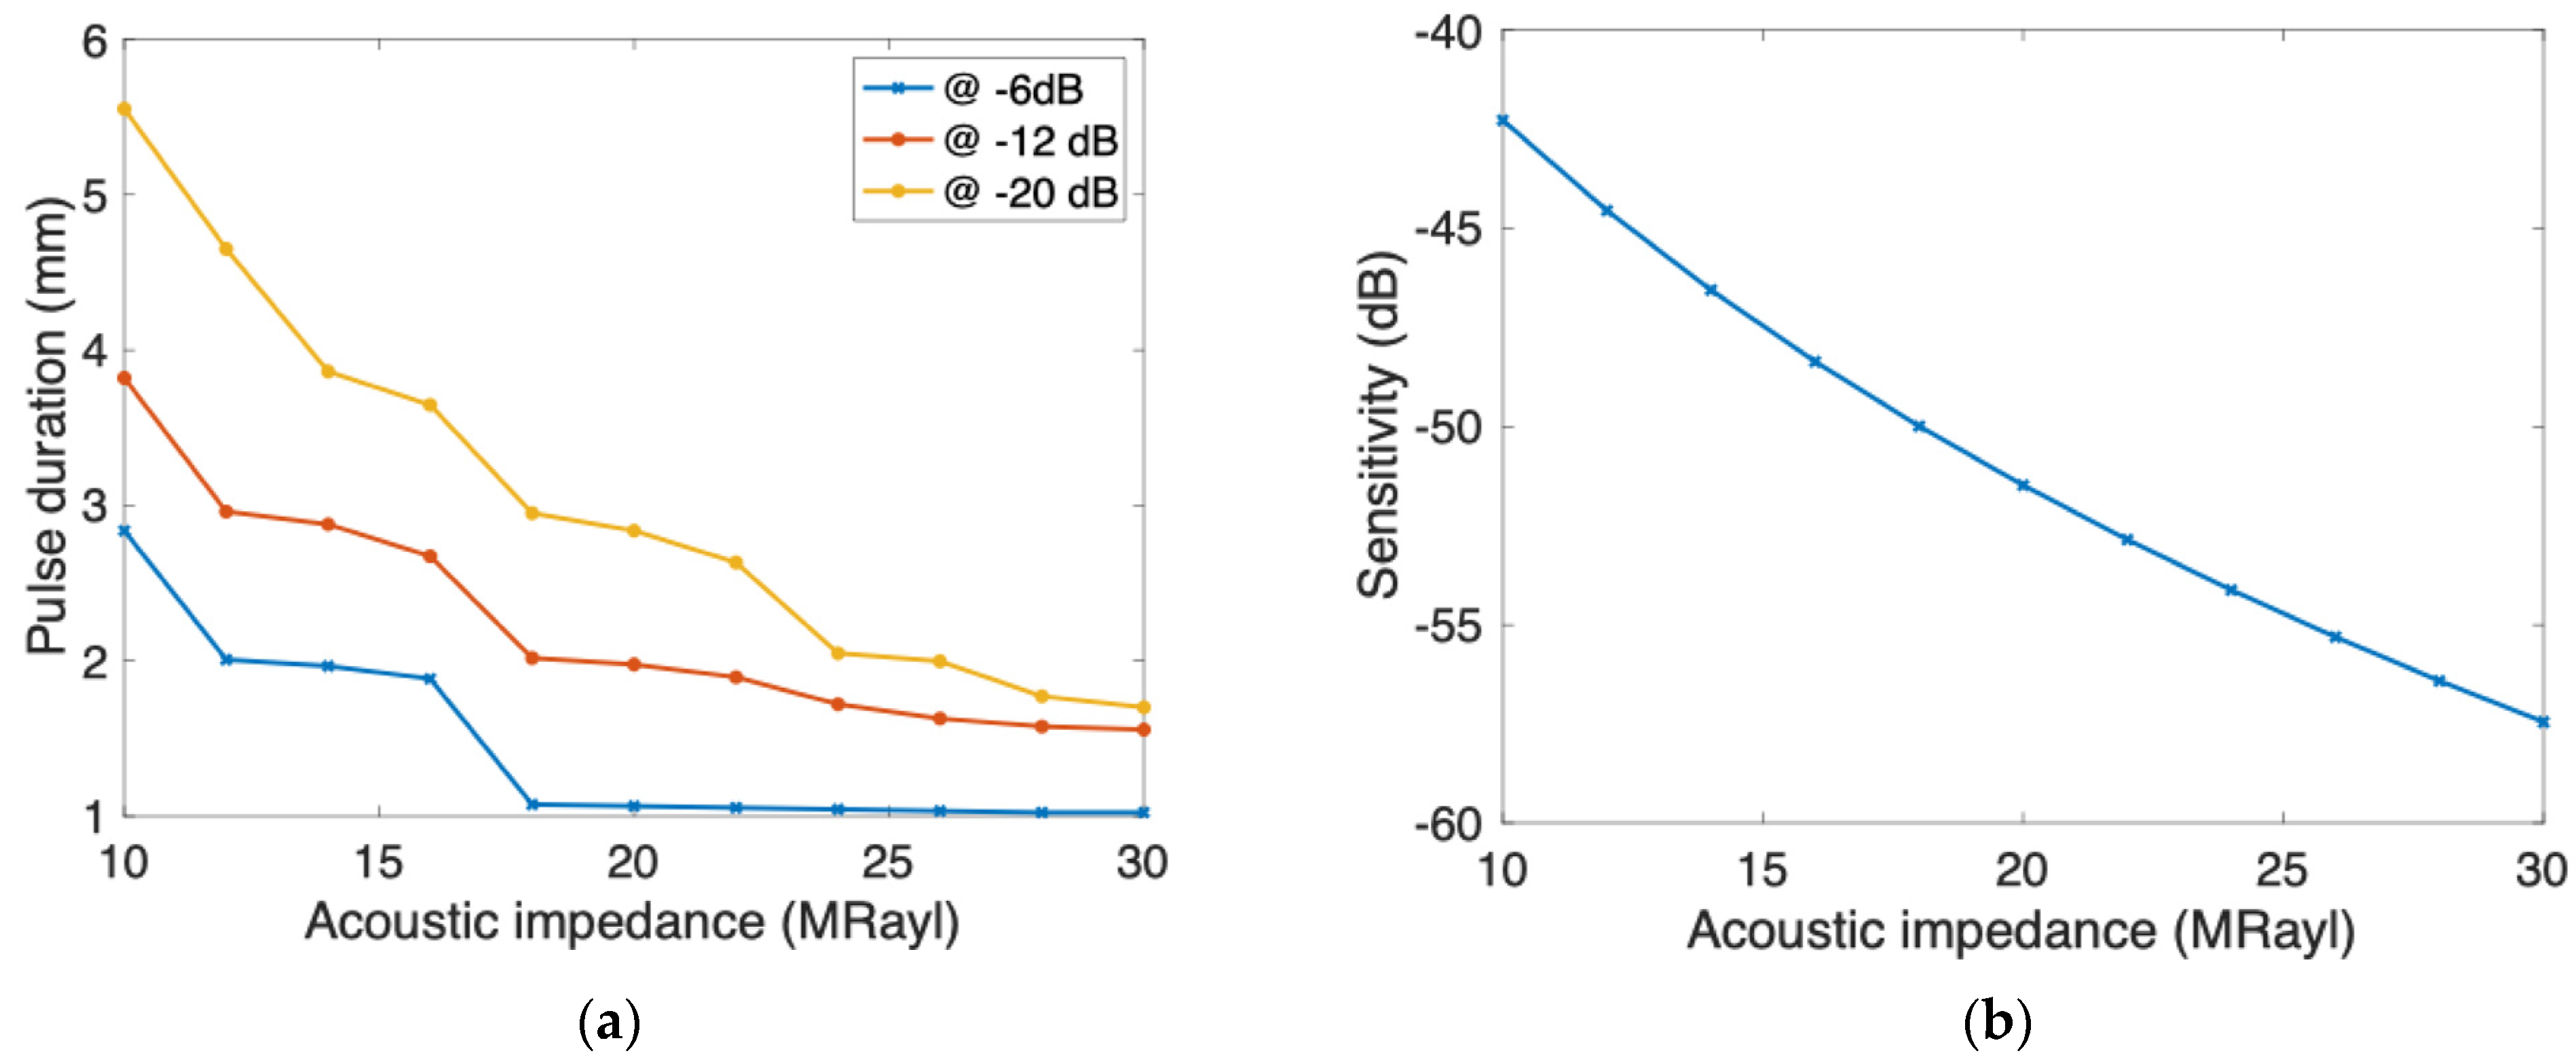
4.2. Influence of the Backing Acoustic Impedance

Starting from the simulation parameters of the reference transducer, the metallic pad on the rear face of the transducer was replaced by an infinite-length backing with an acoustic impedance value ranging from 10 to 30 MRayl. As expected, and can be seen in Figure 7a,b, the backing plays an important role in the electroacoustic response of the transducer. Increasing the acoustic impedance shortens the pulse-echo response and strongly reduces the resonances that are observed in the transfer function. However, these resonances still exist due to the 1.2 mm thick protective front layer in the transducer design. The main resonance is around 4.2 MHz, which is close to the natural half-wavelength thickness-mode resonance of the Lithium Niobate disc.
Figure 8 shows the evolution of the pulse duration in water expressed in millimeters and round-trip sensitivity defined as 20 times the log of the ratio of the received voltage to the input voltage in 50 Ω environment. The axial resolution, measured as the −6 dB pulse duration, varies from less than 1 mm for a backing impedance of 30 MRayl to approximately 3 mm for an impedance of 10 MRayl, while the sensitivity varies from −42 to −57 dB.
Comparing these results to those of the reference transducer, the resolution is strongly improved which makes this design suitable for high-temperature imaging applications. As the backing acoustic impedance increases, the sensitivity of the transducer decreases. Indeed, the acoustic impedance becomes closer to that of Lithium Niobate and more energy is radiated in the backing, which leads to a lower sensitivity.

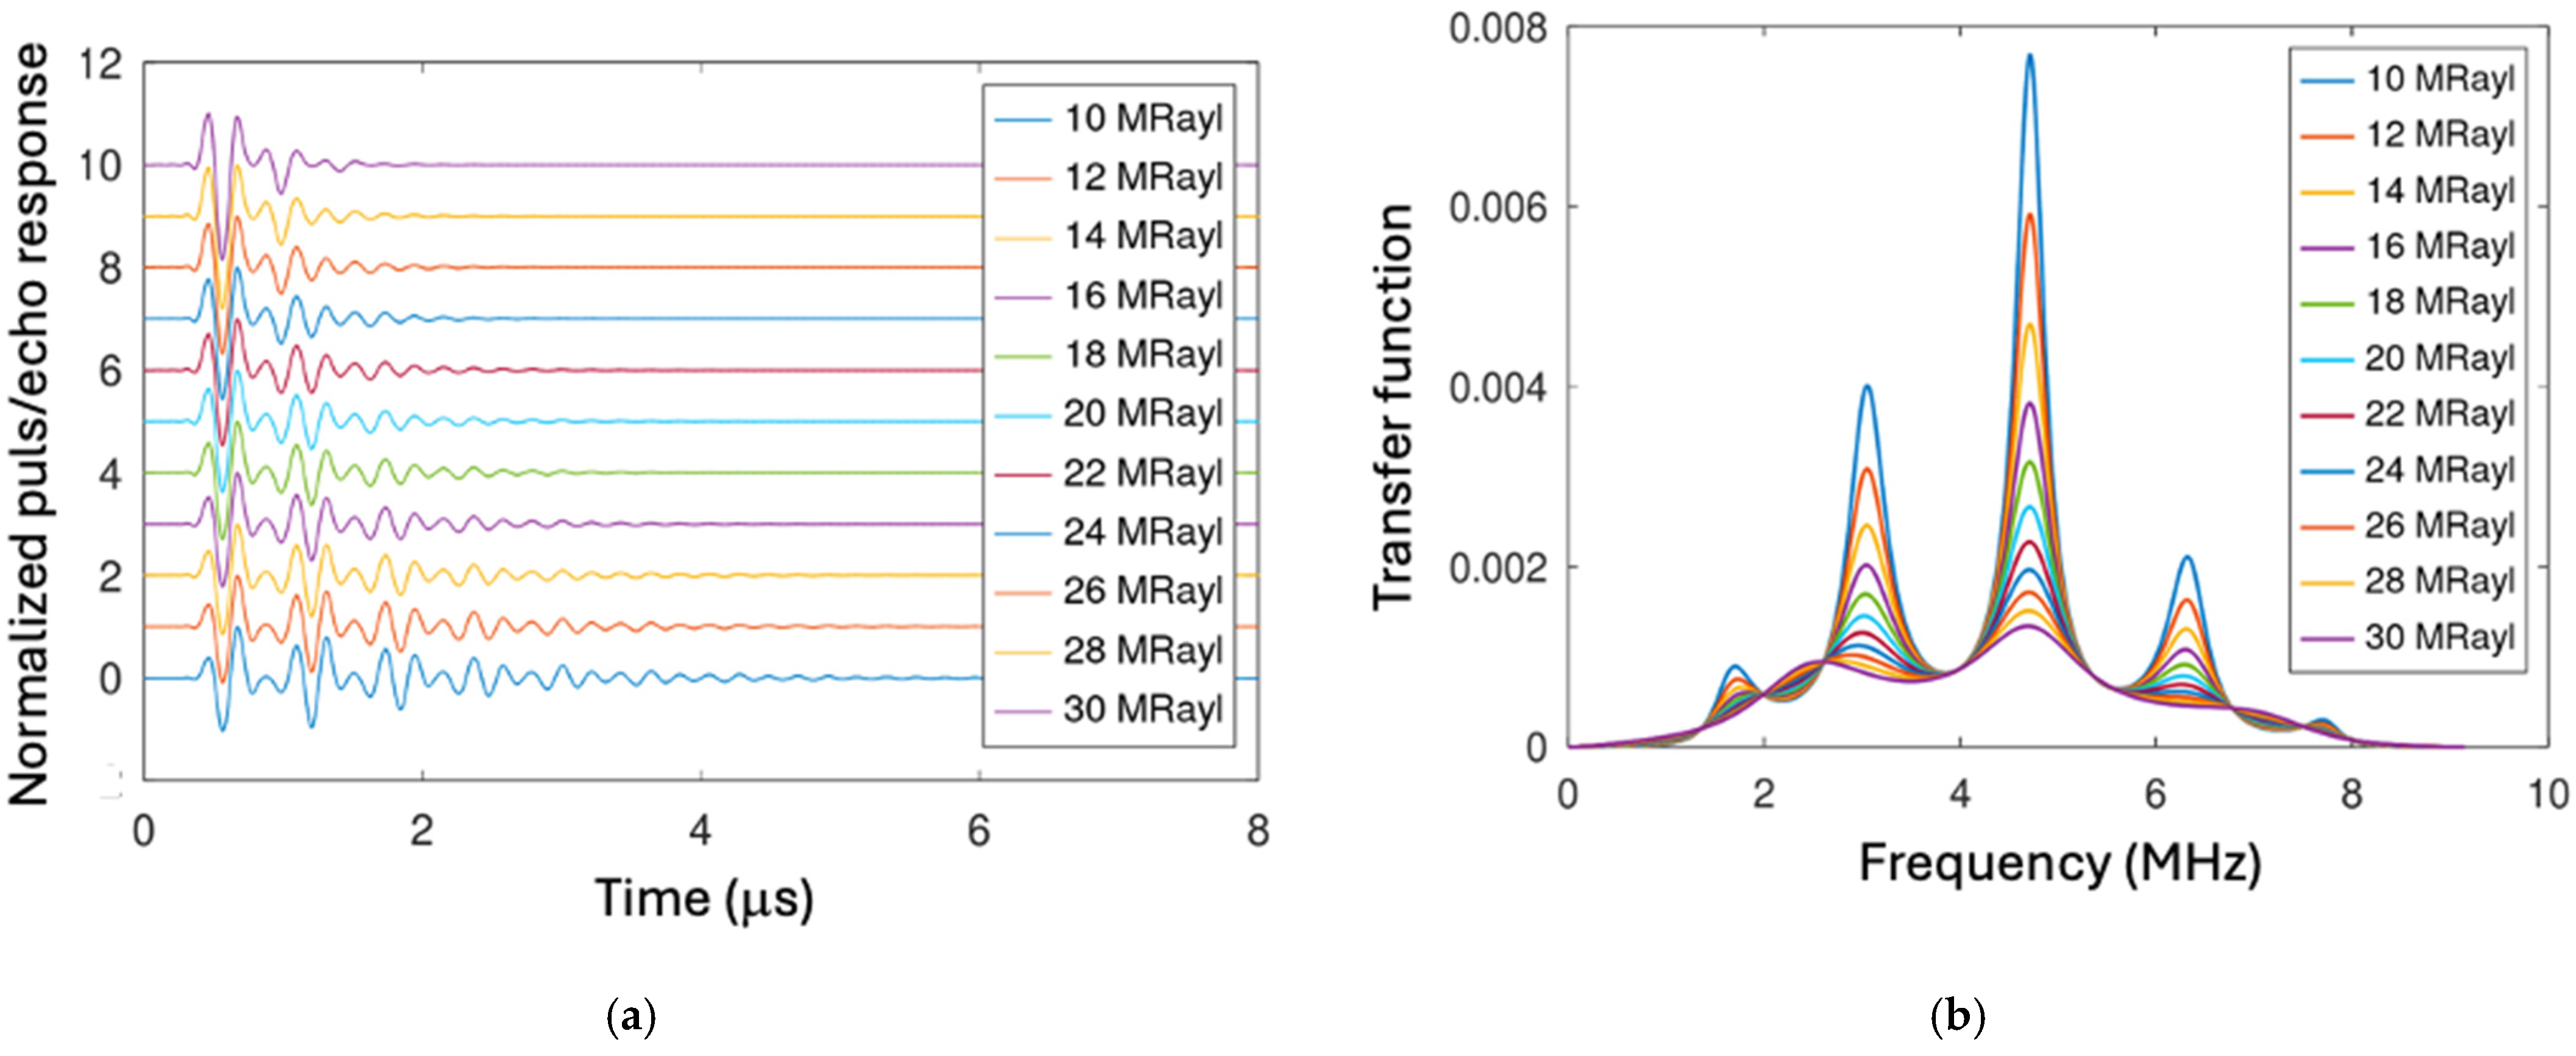
4.3. Transducer Simulation

For these simulations, the original configuration of the transducer given in Table 1 was modified so that the rear layer, made of steel, was replaced by a 2 cm thick, porous backing whose characteristics are given in Table 3. Figure 9 and Figure 10 show the pulse-echo and frequency response of such a transducer.
In the case of the nominal configuration, measurements of the pulse durations converted in distance in water at −6 dB and −20 dB are, respectively, 47 mm and 69.9 mm. Simulations of the transducer mounted on a 25% porous backing predict values of 1.04 mm at −6 dB and 2.04 mm at −20 dB. Simulations of the transducer mounted on a 35% porosity backing predict values of 1.07 mm at −6 dB and 2.97 mm at −20 dB. These results are compatible with the development of a high-temperature nondestructive imaging system. However, it should be noted that the attenuation is relatively low both for 25% and 35% porosity. The simulation of a transducer with a 2 cm thick backing leads to the presence of a backing echo, at a level of about 20 dB below that of the main echo 9   μ s after the main response. As mentioned earlier in the text, the attenuation coefficients were determined at 1 MHz, but in a diffusive regime we expect a very strong frequency dependence. It is, therefore, reasonable to assume that the attenuation coefficient at the center frequency of the transducer, i.e., around 4 to 4.5 MHz, would be strong enough to avoid round-trip echoes in the backing.
At the resonance frequency, the round-trip sensitivity in a 50 Ohms environment is −54.6 dB with a backing at 25% porosity and −49.8 dB with a backing at 35% porosity. This sensitivity is relatively low; however, in the context of the applications related to the nuclear industry, the excitation energy levels can be very high, which would compensate for this drawback.

5. Conclusions

Developing a new high-temperature transducer is a goal of major importance in many industrial applications, including the nuclear industry. We have shown that porous steel materials have a strong potential in designing a new type of broadband transducer for high-temperature imaging systems. We report measurements on stainless steel dense samples and porous ones with 25% and 35% porosity up to temperatures of 400 °C. In all samples, the ultrasonic wave velocity decreases with temperature with relative velocity variations of about 5–6% for the two porous samples. For both porous samples, the attenuation mechanism seems to be very little sensitive to temperature. Consequently, we have simulated the response of an ultrasonic transducer based on these two materials taking as input the measurements performed at room temperature. The results show a significant improvement in the axial resolution of the transducer and demonstrate the interest of these materials for non-destructive testing and evaluation applications. Future work will focus on the fabrication and electroacoustic characterization of such a transducer as a function of temperature.

6. Patents

There are no patents resulting from the work reported in this manuscript.

Author Contributions

Conceptualization, G.F. and D.C.N.; investigation D.C.N., M.J. and F.N.; supervision, G.F. and F.N.; validation, G.F., F.N. and M.L.; writing original draft—G.F.; writing—review and editing, G.F., M.J. and M.L. All authors have read and agreed to the published version of the manuscript.

Funding

This research was supported by the CEA contract DES 5506 C38304.

Data Availability Statement

The original contributions presented in the study are included in the article, further inquiries can be directed to the corresponding author.

Conflicts of Interest

The authors declare no conflicts of interest.

References

  1. Cochran, S. Piezoelectricity and Basic Configurations for Piezoelectric Ultrasonic Transducers. In Ultrasonic Transducers: Materials and Design for Sensors, Actuators and Medical Applications; Nakamura, K., Ed.; Woodhead Publishing Series in Electronic and Optical Materials; Woodhead Publishing: Sawston, UK, 2012; pp. 3–35. ISBN 978-0-85709-630-2/978-1-84569-989-5. [Google Scholar]
  2. Jensen, J.A. Medical Ultrasound Imaging. Prog. Biophys. Mol. Biol. 2007, 93, 153–165. [Google Scholar] [CrossRef] [PubMed]
  3. Drinkwater, B.W.; Wilcox, P.D. Ultrasonic Arrays for Non-Destructive Evaluation: A Review. NDT E Int. 2006, 39, 525–541. [Google Scholar] [CrossRef]
  4. Song, S.-J.; Shin, H.J.; Jang, Y.H. Development of an Ultra Sonic Phased Array System for Nondestructive Tests of Nuclear Power Plant Components. Nucl. Eng. Des. 2002, 214, 151–161. [Google Scholar] [CrossRef]
  5. Tang, L.; Cao, W. Temperature Dependence of Self-Consistent Full Matrix Material Constants of Lead Zirconate Titanate Ceramics. Appl. Phys. Lett. 2015, 106, 052902. [Google Scholar] [CrossRef]
  6. Baptista, F.G.; Budoya, D.E.; de Almeida, V.A.D.; Ulson, J.A.C. An Experimental Study on the Effect of Temperature on Piezoelectric Sensors for Impedance-Based Structural Health Monitoring. Sensors 2014, 14, 1208–1227. [Google Scholar] [CrossRef]
  7. Amini, M.H.; Sinclair, A.N.; Coyle, T.W. A New High-Temperature Ultrasonic Transducer for Continuous Inspection. IEEE Trans. Ultrason. Ferroelectr. Freq. Control 2016, 63, 448–455. [Google Scholar] [CrossRef]
  8. Kazys, R.; Vaskeliene, V. High Temperature Ultrasonic Transducers: A Review. Sensors 2021, 21, 3200. [Google Scholar] [CrossRef]
  9. Baba, A.; Searfass, C.T.; Tittmann, B.R. High Temperature Ultrasonic Transducer up to 1000 °C Using Lithium Niobate Single Crystal. Appl. Phys. Lett. 2010, 97, 232901. [Google Scholar] [CrossRef]
  10. Zhang, S.; Yu, F. Piezoelectric Materials for High Temperature Sensors. J. Am. Ceram. Soc. 2011, 94, 3153–3170. [Google Scholar] [CrossRef]
  11. Yamada, T.; Iwasaki, H.; Niizeki, N. Piezoelectric and Elastic Properties of LiTaO3: Temperature Characteristics. Jpn. J. Appl. Phys. 1969, 8, 1127. [Google Scholar] [CrossRef]
  12. Sinclair, A.N.; Malkin, R. Sensors for Ultrasonic Nondestructive Testing (NDT) in Harsh Environments. Sensors 2020, 20, 456. [Google Scholar] [CrossRef] [PubMed]
  13. Lee, H.J.; Zhang, S.; Bar-Cohen, Y.; Sherrit, S. High Temperature, High Power Piezoelectric Composite Transducers. Sensors 2014, 14, 14526–14552. [Google Scholar] [CrossRef] [PubMed]
  14. Kazys, R.; Voleisis, A.; Sliteris, R.; Mazeika, L.; Van Nieuwenhove, R.; Kupschus, P.; Abderrahim, H.A. High Temperature Ultrasonic Transducers for Imaging and Measurements in a Liquid Pb/Bi Eutectic Alloy. IEEE Trans. Ultrason. Ferroelectr. Freq. Control 2005, 52, 525–537. [Google Scholar] [CrossRef]
  15. Kobayashi, M.; Jen, C.-K. Transducers for Non-Destructive Evaluation at High Temperatures. In Ultrasonic Transducers: Materials and Design for Sensors, Actuators and Medical Applications; Nakamura, K., Ed.; Woodhead Publishing Series in Electronic and Optical Materials; Woodhead Publishing: Sawston, UK, 2012; pp. 408–443. ISBN 978-0-85709-630-2/978-1-84569-989-5. [Google Scholar]
  16. Parks, D.A.; Zhang, S.; Tittmann, B.R. High-Temperature (>500/Spl Deg C) Ultrasonic Transducers: An Experimental Comparison among Three Candidate Piezoelectric Materials. IEEE Trans. Ultrason. Ferroelectr. Freq. Control 2013, 60, 1010–1015. [Google Scholar] [CrossRef]
  17. Song, W.; Yuan, X.; Yu, S.; Yu, X. A Novel Design of Piezoelectric Ultrasonic Transducer with High Temperature Resistance. In Proceedings of the 2018 IEEE International Ultrasonics Symposium (IUS), Kobe, Japan, 22–25 October 2018; pp. 1–9. [Google Scholar]
  18. Bhadwal, N.; Torabi Milani, M.; Coyle, T.; Sinclair, A. Dry Coupling of Ultrasonic Transducer Components for High Temperature Applications. Sensors 2019, 19, 5383. [Google Scholar] [CrossRef]
  19. Bilgunde, P.N.; Bond, L.J. Resonance Analysis of a High Temperature Piezoelectric Disc for Sensitivity Characterization. Ultrasonics 2018, 87, 103–111. [Google Scholar] [CrossRef]
  20. Saillant, J.-F.; Marlier, R.; Navacchia, F.; Baqué, F. Ultrasonic Transducer for Non-Destructive Testing of Structures Immersed in Liquid Sodium at 200 °C. Sensors 2019, 19, 4156. [Google Scholar] [CrossRef]
  21. Zu, H.; Wu, H.; Wang, Q.-M. High-Temperature Piezoelectric Crystals for Acoustic Wave Sensor Applications. IEEE Trans. Ultrason. Ferroelectr. Freq. Control 2016, 63, 486–505. [Google Scholar] [CrossRef]
  22. Hamidon, M.N.; Skarda, V.; White, N.M.; Krispel, F.; Krempl, P.; Binhack, M.; Buff, W. High-Temperature 434 MHz Surface Acoustic Wave Devices Based on GaPO/Sub 4/. IEEE Trans. Ultrason. Ferroelectr. Freq. Control 2006, 53, 2465–2470. [Google Scholar] [CrossRef]
  23. Cheong, Y.-M.; Kim, K.-M.; Kim, D.-J. High-Temperature Ultrasonic Thickness Monitoring for Pipe Thinning in a Flow-Accelerated Corrosion Proof Test Facility. Nucl. Eng. Technol. 2017, 49, 1463–1471. [Google Scholar] [CrossRef]
  24. Pucci, L.; Raillon, R.; Taupin, L.; Baqué, F. Design of a Phased Array EMAT for Inspection Applications in Liquid Sodium. Sensors 2019, 19, 4460. [Google Scholar] [CrossRef] [PubMed]
  25. CEA. Sodium-Cooled Nuclear Reactors; François, P.J., Ed.; Edition du Moniteur: Saclay, France, 2016; ISBN 978-2-281-14055-2. [Google Scholar]
  26. Lhuillier, C.; Marchand, B.; Augem, J.-M.; Sibilo, J.; Saillant, J.-F. Generation IV Nuclear Reactors: Under Sodium Ultrasonic Transducers for Inspection and Surveillance. In Proceedings of the 2013 3rd International Conference on Advancements in Nuclear Instrumentation, Measurement Methods and Their Applications (ANIMMA), Marseille, France, 23–27 June 2013; pp. 1–6. [Google Scholar]
  27. Feuillard, G.; Hue, L.P.T.H.; Saadaoui, N.; Nguyen, V.T.; Lethiecq, M.; Saillant, J.F. Symmetric Reflector Ultrasonic Transducer Modeling and Characterization: Role of the Matching Layer on Electroacoustic Performance. IEEE Trans. Ultrason. Ferroelectr. Freq. Control 2021, 68, 3608–3615. [Google Scholar] [CrossRef] [PubMed]
  28. Warner, A.W.; Onoe, M.; Coquin, G.A. Determination of Elastic and Piezoelectric Constants for Crystals in Class (3m). J. Acoust. Soc. Am. 1967, 42, 1223–1231. [Google Scholar] [CrossRef]
  29. Nguyen, D.C.; Navacchia, F.; Tran-Huu-Hue, L.P.; Feuillard, G. Ultrasonic Characterization, Simulation of Porous Metal in the Interest of High Frequency Applications. In Proceedings of the 4th Singapore International Non-Destructive Testing Conference and Exhibition, Singapore, 7–8 November 2022. [Google Scholar]
Figure 1. Conventional structure of a high temperature ultrasonic transducer.
Acoustics 06 00058 g001
Figure 2. Experimental (blue) and theoretical (red) pulse-echo response (a), and transfer function (b) of a high temperature ultrasonic transducer.
Acoustics 06 00058 g002
Figure 3. SEM of sample SSU02, whose porosity volume ratio is 25.2%.
Acoustics 06 00058 g003
Figure 4. (a) Experimental set-up; (b) sample holder and transducer.
Acoustics 06 00058 g004
Figure 5. RF signal received at 300 °C.
Acoustics 06 00058 g005
Figure 6. (a) Relative wave velocity variation as a function of temperature; (b) variation of attenuation as a function of temperature.
Acoustics 06 00058 g006
Figure 7. (a) Simulated pulse echo responses of the transducer; (b) simulated transfer function of the transducer.
Acoustics 06 00058 g007
Figure 8. (a) Evolution of pulse durations as a function of backing acoustic impedance; (b) evolution of transmit/receive sensitivity as a function of backing acoustic impedance.
Acoustics 06 00058 g008
Figure 9. Pulse echo and frequency response of a LiNbO3-based transducer radiating in water. Backing material: porous stainless steel with 25% of porosity.
Acoustics 06 00058 g009
Figure 10. Pulse echo and frequency response of a LiNbO3 based transducer radiating in water. Backing material: porous stainless steel with 35% of porosity.
Acoustics 06 00058 g010
Table 1. Simulation parameters of a conventional HTUST. The propagation medium is water.
Active Element
Single crystalLiNbO3 Z-cut *
Diameter (mm)40
Thickness (mm)0.78
Density (kg m−3)4700
Wave velocity (m s−1)7220
Acoustic impedance (MRayl)33.9
Relative dielectric constant29
Thickness coupling coefficient0.17
Front layer/rear layer
Thickness (mm)1.2/2
Wave velocity (m.s−1)5740
Loss tangent0.001
Acoustic impedance (MRayl)46.2
Propagation medium (water)
Acoustic impedance (MRayl)1.5
* Lithium Niobate properties were deduced from [28].
Table 2. Material density, porosity and pore size [29].
MaterialMeasured
Thickness (mm)
Measured
Density (kg m−3)
Measured
Porosity (%)
Nominal Pore Size (µm)
SSU0010.007918--
SSU029.98605925.201.7
SSU1010.13526834.229710.9
Table 3. Acoustic properties of porous stainless steel measured at 1 MHz in water (SS 316L).
MaterialAverage Porosity (%)Average Wave Velocity
(m s−1)
Standard Deviation (%)Average Acoustic Impedance (MRayls)Standard Deviation (%)Average Attenuation (dB mm−1)Standard Deviation (%)
SSU00057801.1045.111.070.127.13
SSU0225.2044021.9026.732.460.4612.75
SSU1034.9737511.5719.752.800.4626.05
Table 4. Acoustic properties of porous samples at different temperatures.
SSU00SSU02SSU10
Temperature (°C)Wave Velocity (m s−1)Attenuation Variation (dB mm−1)Wave Velocity (m s−1) Attenuation Variation (dB mm−1)Wave Velocity (m.s−1)Attenuation Variation (dB mm−1)
255807.500.004417.500.003511.700.00
505796.900.044398.000.033495.300.00
755782.900.054376.300.043478.600.00
1005767.000.074359.100.043462.200.01
1255750.000.094342.900.043446.700.01
1505734.000.114325.300.043430.200.01
1755720.000.104311.600.053413.500.01
2005702.000.114293.600.063396.600.02
2255682.900.124274.100.063380.100.03
2505661.400.164258.200.063362.900.06
2755640.000.184243.800.063344.800.06
3005617.000.204221.200.063328.600.06
3255594.200.224202.800.053310.500.08
3505572.000.234178.000.063293.700.09
3755547.500.254150.700.043276.900.11
4005522.400.274131.900.043259.500.13
Disclaimer/Publisher’s Note: The statements, opinions and data contained in all publications are solely those of the individual author(s) and contributor(s) and not of MDPI and/or the editor(s). MDPI and/or the editor(s) disclaim responsibility for any injury to people or property resulting from any ideas, methods, instructions or products referred to in the content.

