Article

Feasibility Analysis for Active Noise Cancellation Using the Electrical Power Steering Motor

1
Department of Mechanical Engineering, Munich University of Applied Sciences, Lothstr. 64, 80335 Munich, Germany
2
Department of Electrical Engineering and Information Technology, Munich University of Applied Sciences, Lothstr. 64, 80335 Munich, Germany
3
Department of Electrical and Computer Engineering, Technical University of Munich, Theresienstr. 90, 80333 Munich, Germany
*
Author to whom correspondence should be addressed.
Acoustics 2024, 6(3), 730-753; https://doi.org/10.3390/acoustics6030040
Submission received: 12 April 2024 / Revised: 28 May 2024 / Accepted: 19 June 2024 / Published: 31 July 2024
(This article belongs to the Special Issue Active Control of Sound and Vibration)

Abstract

:
This paper describes the use of an electric drive as an acoustic actuator for active noise cancellation (ANC). In the presented application, the idea is to improve the noise, vibration, harshness (NVH) characteristics of passenger cars without using additional active or passive damper systems. Many of the already existing electric drives in cars are equipped with the required hardware components to generate noise and vibration, which can be used as compensation signals in an ANC application. To demonstrate the applicability of the idea, the electrical power steering (EPS) motor is stimulated with a control signal, generated by an adaptive feedforward controller, to reduce harmonic disturbances at the driver’s ears. As it turns out, the EPS system generates higher harmonics of the harmonic compensation signal due to nonlinearities in the acoustic transfer path using a harmonic excitation signal. The higher harmonics impair an improvement in the subjective hearing experience, although the airborne noise level of the harmonic disturbance signal can be clearly reduced at the driver’s ears. Therefore, two methods are presented to reduce the amplitude of the higher harmonics. The first method is to limit the filter weights of the algorithm to reduce the amplitude of the harmonic compensation signal. The filter amplitude limitation also leads to a lower amplitude of the higher harmonics, generated by the permanent magnet synchronous machine (PMSM). The second method uses a parallel structure of adaptive filters to actively reduce the amplitude of the higher harmonics. Finally, the effectiveness of the proposed ANC system is demonstrated in two real driving situations, where in one case a synthetic noise/vibration induced by a shaker on the front axle carrier is considered to be the disturbance, and in the other case, the disturbance is a harmonic vibration generated by the combustion engine. In both cases, the subjective hearing experience of the driver could be clearly improved using the EPS motor as ANC actuator.

1. Introduction

It is becoming more and more difficult to meet the increasing acoustical requirements of modern passenger cars (see, e.g., [1]). The reasons for this are the use of lightweight structures and fuel-saving technologies (e.g., cylinder-on-demand). To improve the NVH characteristics, expensive and heavy active and passive damper systems are used, with additional negative aspects regarding the packaging inside the car (see, e.g., [2,3]). This paper focuses on the use of existing electrical drives for the active reduction of disturbing noise and vibrations instead of additional components. This is possible because many electrical drives in cars are already equipped with power electronics and control units used to follow a required torque or speed, and, therefore, these drives may also be employed to generate noise and vibrations that can be used as compensation signals in an ANC system. So, it is possible to use existing hardware for ANC, which allows for a reduction in the cost and weight of passenger cars. One advantage of the method presented here is that it is possible to act directly in the structure-borne sound path and thus actively damp vibrations of components before they cause a diffuse airborne sound field. In existing ANC systems, several loudspeakers are used to reduce the sound pressure of a diffuse airborne sound field. This usually requires several expensive sensors (e.g., microphones) and actuators to accomplish at several positions in the vehicle. In Section 3, it is shown that a global reduction in the sound pressure level in the vehicle is possible with only one sensor and one actuator. In this paper, as an example, the EPS motor is used to actively reduce harmonic disturbance noise at the driver’s ears. This contribution is based on the work published in [4]. While [4] shows a reduction in a constant synthetic disturbance signal under laboratory conditions, this paper focuses on the reduction in a synthetic disturbance signal in a real driving situation, as well as the reduction in a real harmonic disturbance of the combustion engine, while effects on the lifetime of the PMSM are not investigated in this context, as this is purely a feasibility analysis. This is performed by using a feedforward control structure, which is a widely used approach in ANC applications to generate the control signal [5,6,7,8]. In the controller, the coefficients of a finite impulse response (FIR) filter are adapted with the filtered-x least mean squares (FxLMS) algorithm using a specific error signal [9,10]. Depending on the physical quantity that should be compensated for, an accelerometer or a microphone is usually used to provide an error signal to the adaptive algorithm. The so-called secondary path S ( z ) describes the transfer path between the output of the control signal and the measurement signal of the error sensor [10]. It influences the performance and the stability of the algorithm [9]. To avoid instabilities, a model of the secondary path is used. Hence, it is common to use a system identification scheme to minimize the model errors resulting from time variant parameters of the secondary path [11,12]. In this case, the secondary path consists of the electric drive as well as the mechanical transfer path. As both parts contain time variant parameters, a plant identification is carried out by using the least mean squares (LMS) algorithm. For this purpose, only small changes to the structure of the algorithm, which is also used in the controller, are necessary.
This article mainly focuses on the basic principle of using an EPS motor to reduce harmonic disturbance noise. Section 2.1 gives a short introduction of the control structure for an EPS motor. The schematic overview of the experimental setups and the hardware used are presented in Section 2.2. In Section 2.3, the implemented ANC algorithm is introduced and the ability of reducing harmonic disturbances with the EPS motor using the proposed control structure is investigated. It is shown that at harmonic excitation, the EPS system used in this study generates higher harmonics of the fundamental frequency due to nonlinearities in the acoustical transfer path. Two methods are proposed for suppressing these higher harmonics generated by the EPS system. Finally, the algorithm is investigated under real conditions in Section 3.

2. Materials and Methods

2.1. Control Structure

In steering control, a standard approach is to use a field oriented control (FOC) for controlling the torque demand of a 3-phase PMSM. This was already proposed by Blaschke. The concept is to transform the time varying quantities of a PMSM into constants using the Clarke Transform and the Park Transform. As the ANC algorithm uses this control structure to stimulate the magnetic field of the EPS motor, this section provides a short introduction to the basic principle of a FOC.
As can be seen in Figure 1, the 3-phase system is transformed ( d / q -transformation) by
i d i q = 2 3 cos ( θ ) cos ( θ 2 π 3 ) cos ( θ 4 π 3 ) sin ( θ ) sin ( θ 2 π 3 ) sin ( θ 4 π 3 ) · i a i b i c
into an equivalent 2-phase system with two orthogonal axes (d- and q-axes), where θ is the electrical angle of the rotor and i d / q are the transformed currents in the d / q -plane, while i a / b / c are the physical currents of the corresponding phases. The abscissa (d-axis) aligns to the magnetic flux and the ordinate (q-axis) is orthogonal to it, while the coordinate system is fixed to the rotor. This leads to a static, time-independent model of the PMSM. As there is a coupling between the d- and q-axes for a rotor angular speed ω 0 , an additional decoupling network is used. The orthogonality of the two axes allows for the independent control of the currents in the d- and q-directions, where the d-current influences the radial force F d and the q-current the tangential force F q on the rotor. Two separate proportional–integral (PI) controllers are used to control each current component. The steering control function influences the q-component to generate a torque at the rotor of the EPS depending on the demanded torque at the steering wheel. The d-component is set to zero in normal mode, but it can be used for weakening the magnetic field in the air gap of the machine. This allows for a higher angular speed of the rotor due to the induction law. The ANC algorithm adds a signal to the current components in the d / q -plane to stimulate the magnetic field of the PMSM and to generate vibrations. A feedforward controller is used for ANC in order to reduce the influence on the performance and stability of the existing PI controllers. This can be seen in Figure 2, where i d r and i q r are the reference variables for the current controllers, and the parameters R d / q and L d / q correspond to the resistance and the inductance of the PMSM in the d / q -plane. The amplitude and phase of the additional current i d / q * to generate the compensation signal are adapted by an ANC algorithm using a narrowband-FxLMS (NFxLMS) algorithm, which is explained in Section 2.3. The additional currents i d / q * are filtered using a feedforward structure to prevent the additional compensation signal from being influenced by the current controllers. Both the dynamic behavior of the controller and the dynamic behavior of the electrical subsystem of the PMSM are taken into account.

2.2. Experimental Setup

Two experimental setups were built to investigate the suitability of using an EPS motor as an acoustical actuator for ANC. The first setup is a test bench which only consists of the EPS motor that is extracted from the other steering components as well as the modules needed to control the motor. This setup is used to investigate the acoustic characteristics of the EPS motor. The second setup is a passenger car with the full EPS system.
To access the EPS motor, the original power electronics and the electrical control unit (ECU) were replaced by prototyping devices. Both setups contain an identical schematic structure, as can be seen in Figure 3.
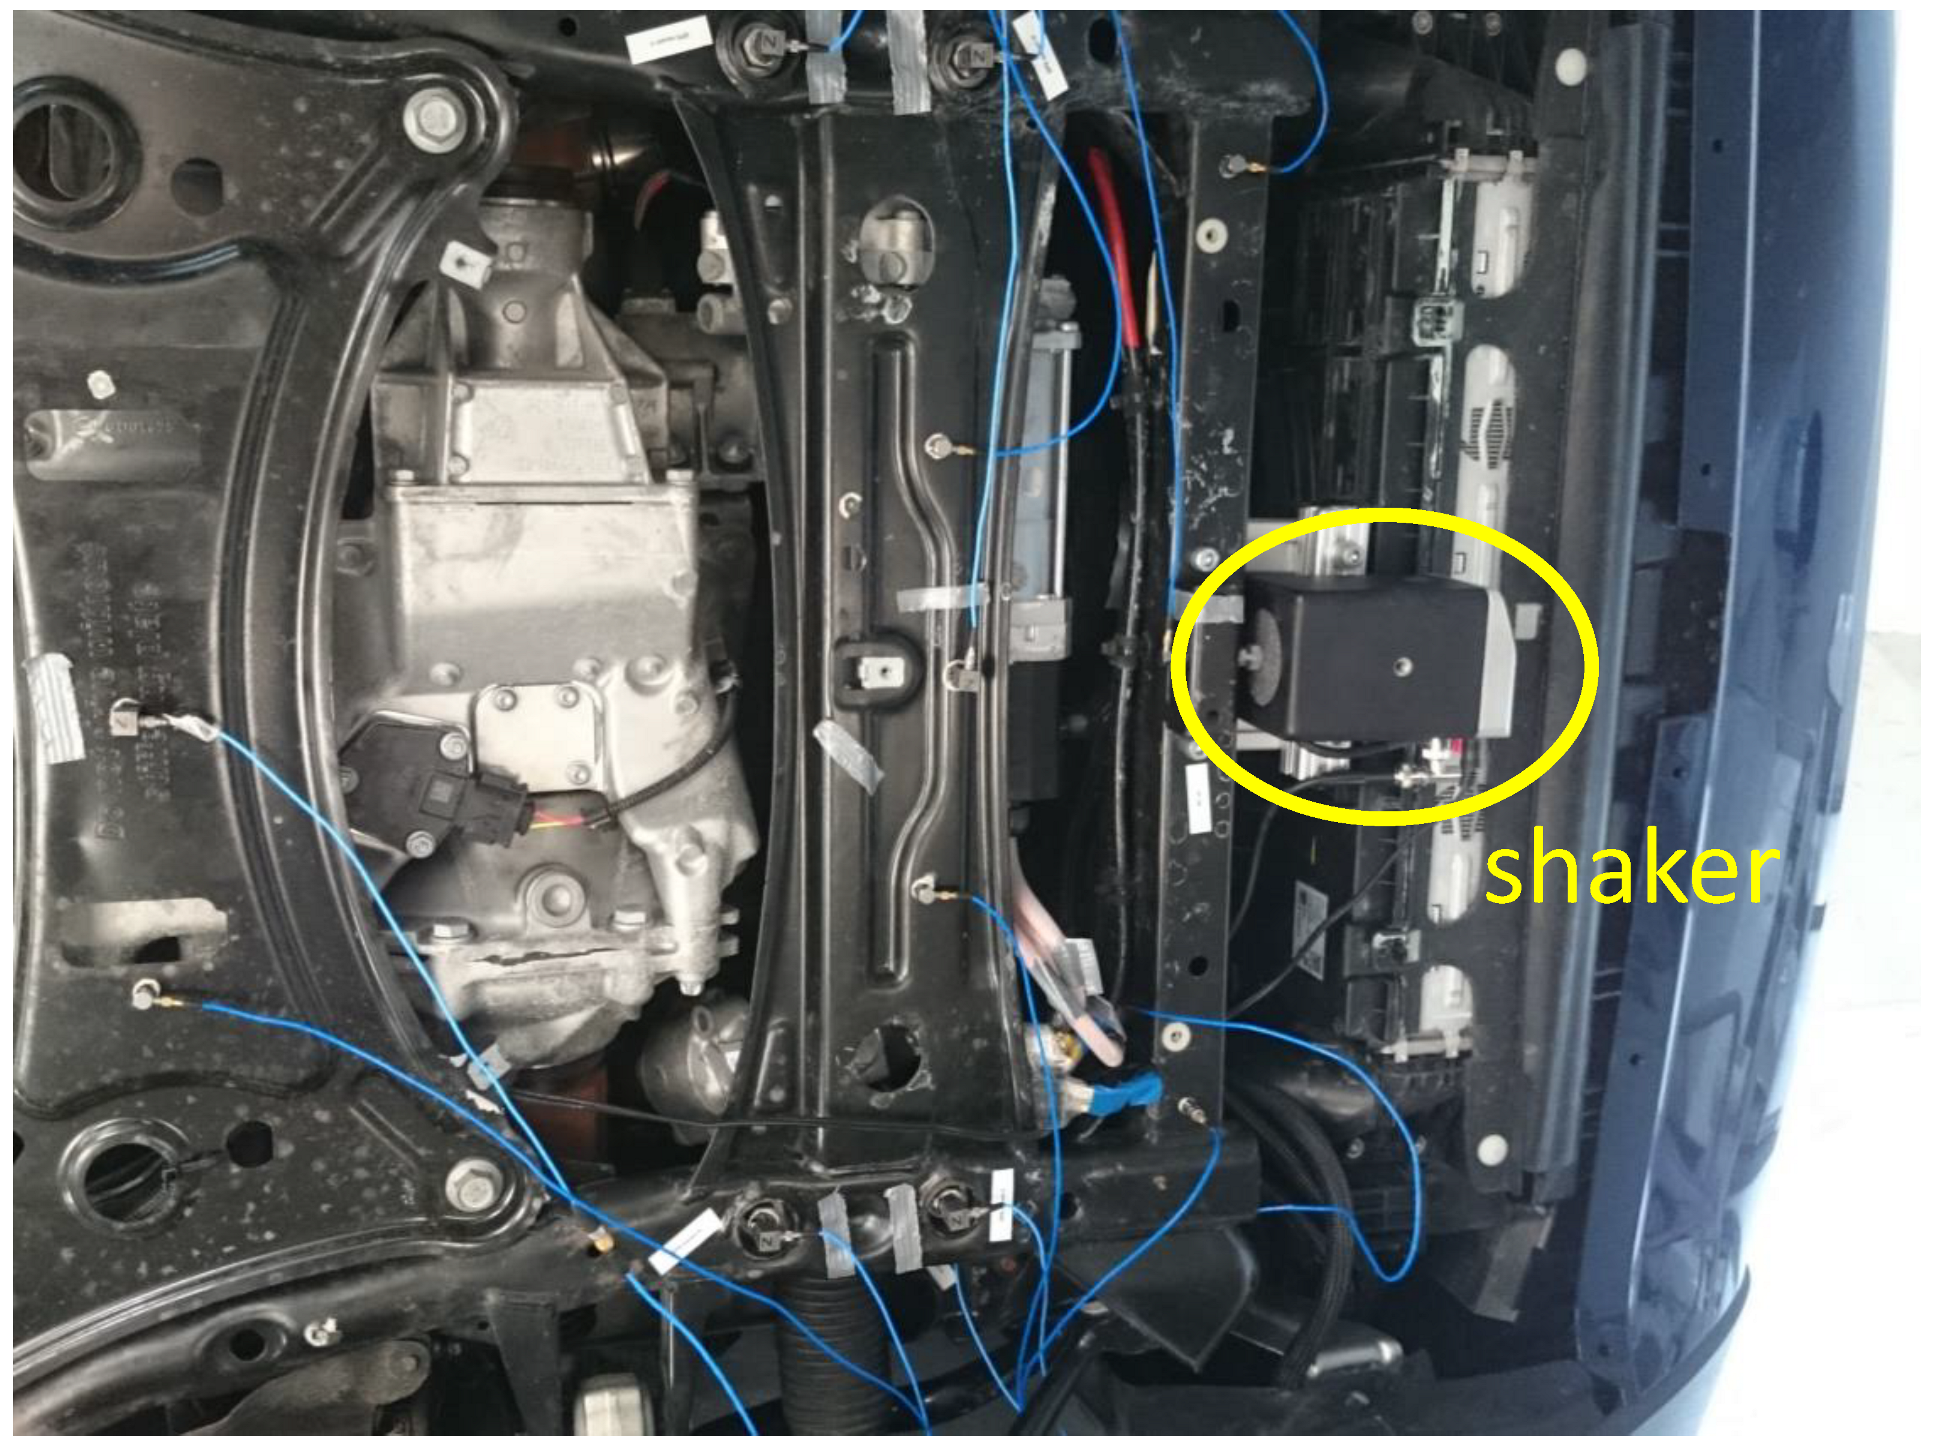
As a prototyping real-time ECU, a MicroAutoBox II from dSPACE was used to run the ANC algorithm. To ensure the primary function of the EPS, speed, torque, and current controllers were also implemented using a FOC, as is described in Section 2.1. Furthermore, a sine generator to generate a synthetic disturbance signal was executed on the same ECU. This signal is used as input to a shaker to generate specific structure-borne noise.
A 3-phase inverter board was used to drive the EPS motor, while the pulse width modulation (PWM) pattern was generated by the ECU using a space vector modulation (SVM) [13]. The current was measured in every phase using a shunt resistor. The EPS motor was an unmodified PMSM as it is used in series applications. It is shown in Section 2.3 that the acoustical transfer function includes nonlinear components. The acoustic sensors and data acquisition systems are described as follows:
  • Acoustic Sensors:
    Accelerometers: To measure the structure-borne noise level, a PCB Piezotronics triaxial accelerometer is used. It has a linear frequency range from 2 Hz to 6 kHz. Its sensitivity is 1.02 mV/(m/s2).
    Microphones: The airborne level is measured using a 1/2” condenser microphone mafufactured by Microtech Gefell GmbH (07926 Gefell, Germany). It has a linear frequency range from 20 Hz to 10 kHz. Its sensitivity is 50 mV/Pa.
  • Measurement Systems:
    PAK MK II: A frontend MK II with highly sensitive measurement inputs from Müller-BBM is used for acoustic data acquisition. Its measurement inputs support the IEPE standard with a 24-bit resolution in the measuring range ±1 V.
    SQuadriga II: For acoustical data acquisition during test drives, a SQuadriga II mobile recording and playback system from HEAD acoustics is used. The inputs with a 24-bit resolution are used in the measuring range ±2.83 V.
All results presented in the following sections were generated with the experimental setups described above.

2.3. Active Noise Cancellation

To compensate for harmonic disturbance noise with a known frequency, the phase and amplitude of the generated compensation signal have to be adapted. As the EPS motor is not an ideal acoustic actuator, the acoustic transfer path is nonlinear. Hence, higher harmonics are generated when using a sinusoidal input signal. In this section, the control algorithm is explained, and different methods to reduce the higher harmonics are investigated.

2.3.1. ANC Algorithm

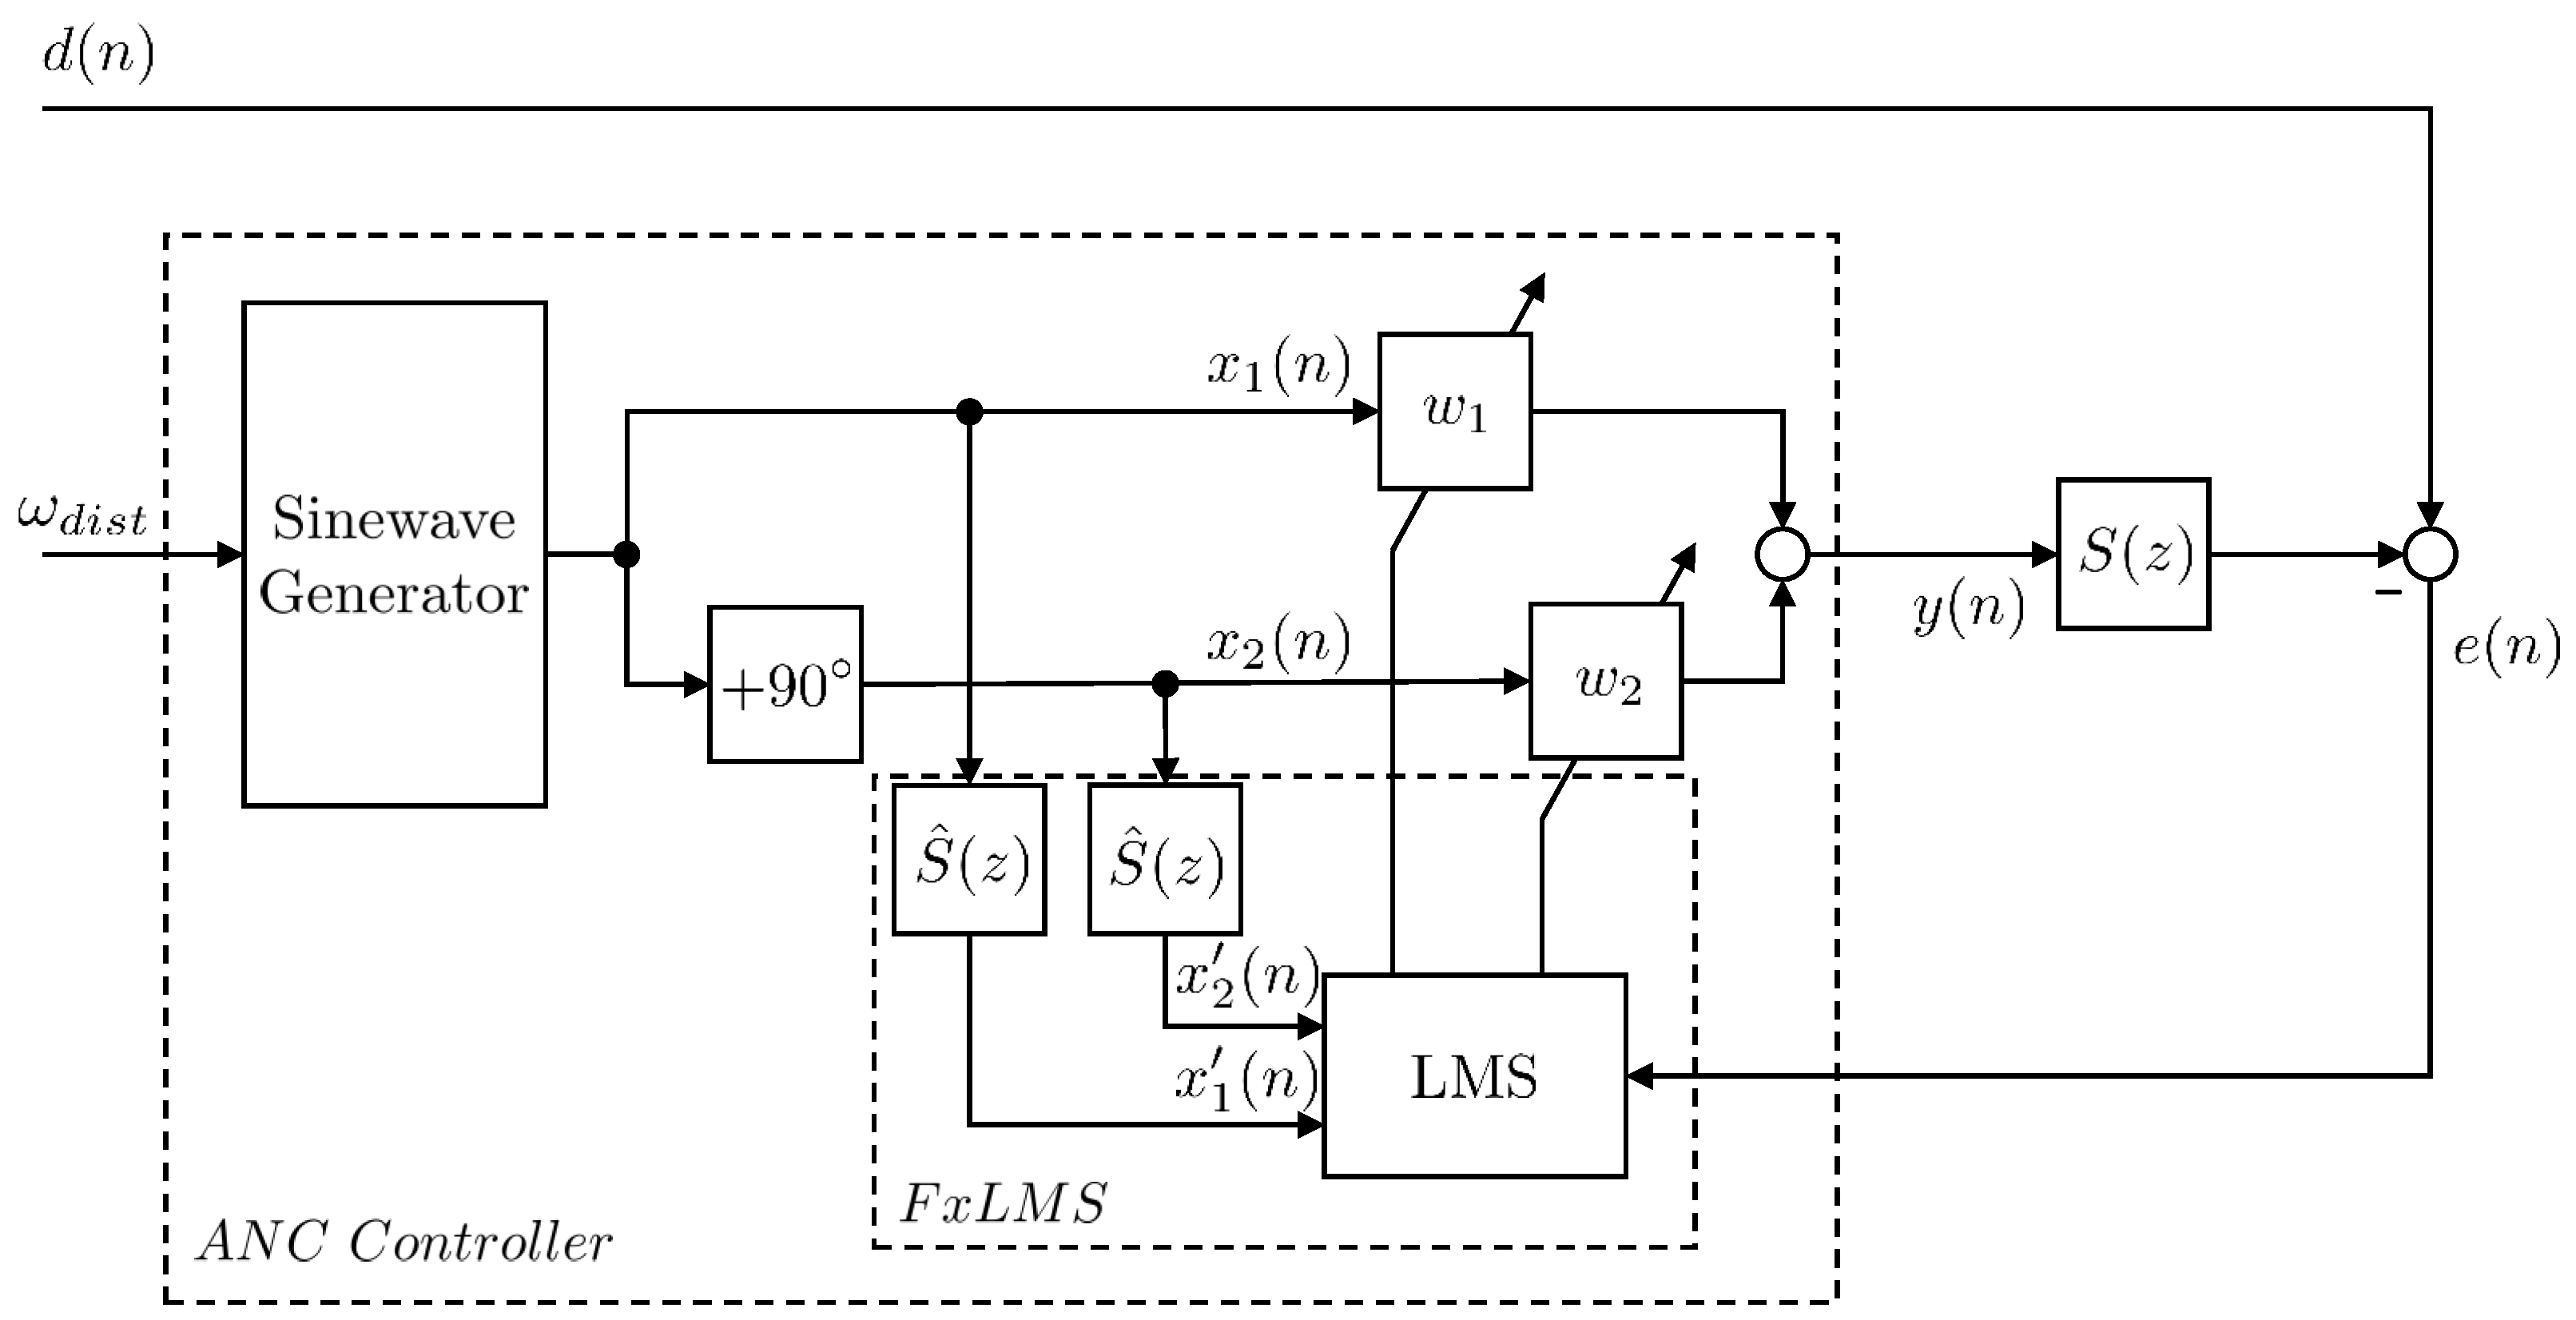
A widespread adaption scheme for tuning the amplitude and phase of the generated vibrations in ANC applications is the least mean squares (LMS) algorithm [14]. The basic idea is to use a gradient-based method to minimize the instantaneous squared error e 2 ( n ) at an error sensor. Ref. [6] proposed the so-called filtered-x-LMS (FxLMS) algorithm with an additional filter in the cancellation path of the adaptive filter. The focus of this study is to reduce a harmonic disturbance signal at the driver’s ears using the EPS motor. Therefore, a narrowband FxLMS (NFxLMS) algorithm was used to adapt the amplitude and phase of the generated compensation signal, as proposed by [5]. This section provides an introduction to the NFxLMS algorithm. It could be used to reduce tonal disturbances and to identify the amplitude and phase of the transfer path from the filter’s output to the error sensor at a specific frequency. Figure 4 shows the block diagram of the NFxLMS algorithm. Here, the error signal E ( z ) is the superposition of the compensation signal S ( z ) Y ( z ) and the disturbance signal D ( z ) and can be described by
E ( z ) = D ( z ) S ( z ) Y ( z ) .
Y ( z ) is the output of the adaptive filter and S ( z ) is the so-called secondary path, which represents the transfer function between the filter’s output and the error sensor.
It is assumed that the angular frequency ω d i s t of the harmonic disturbance signal d ( n ) is well known. For the reduction of harmonic disturbance of the combustion engine (typically an integer multiple of the engine frequency), the engine frequency ω e can be obtained from the crankshaft tachometer and is multiplied by the required order number k (integer value), yielding ω d i s t = k · ω e . With the knowledge of the frequency of the disturbance signal, it is possible to generate the two harmonic reference signals
x 1 ( n ) = sin ( ω d i s t n h )
and
x 2 ( n ) = cos ( ω d i s t n h )
where h is the sample time of the ANC algorithm. The output signal y ( n ) is calculated by the addition of the weighted reference signals:
y ( n ) = w 1 ( n ) sin ( ω d i s t n h ) + w 2 ( n ) cos ( ω d i s t n h ) = G ( n ) cos ( ω d i s t n h + Φ ( n ) )
with
G ( n ) = w 1 2 ( n ) + w 2 2 ( n )
and
Φ ( n ) = a r c t a n w 1 ( n ) w 2 ( n )
The filter weights w i , i = 1 , 2 are updated according to
w i ( n + 1 ) = w i ( n ) + 2 μ x i ( n ) e ( n )
in order to adapt the phase and amplitude of the signal S ( z ) Y ( z ) so that it becomes equal to the signal D ( z ) . The signal x i ( n ) describes the convolution of the signal x i ( n ) with the impulse response of a model of the secondary path S ^ ( z ) that should be as accurate as possible. The factor μ is the step size and influences the convergence time as well as the stability of the algorithm. For narrowband applications, the following stability condition has to be fulfilled [10]:
| 1 2 μ S ^ * ( e j ω d i s t h ) S ( e j ω d i s t h ) | < 1
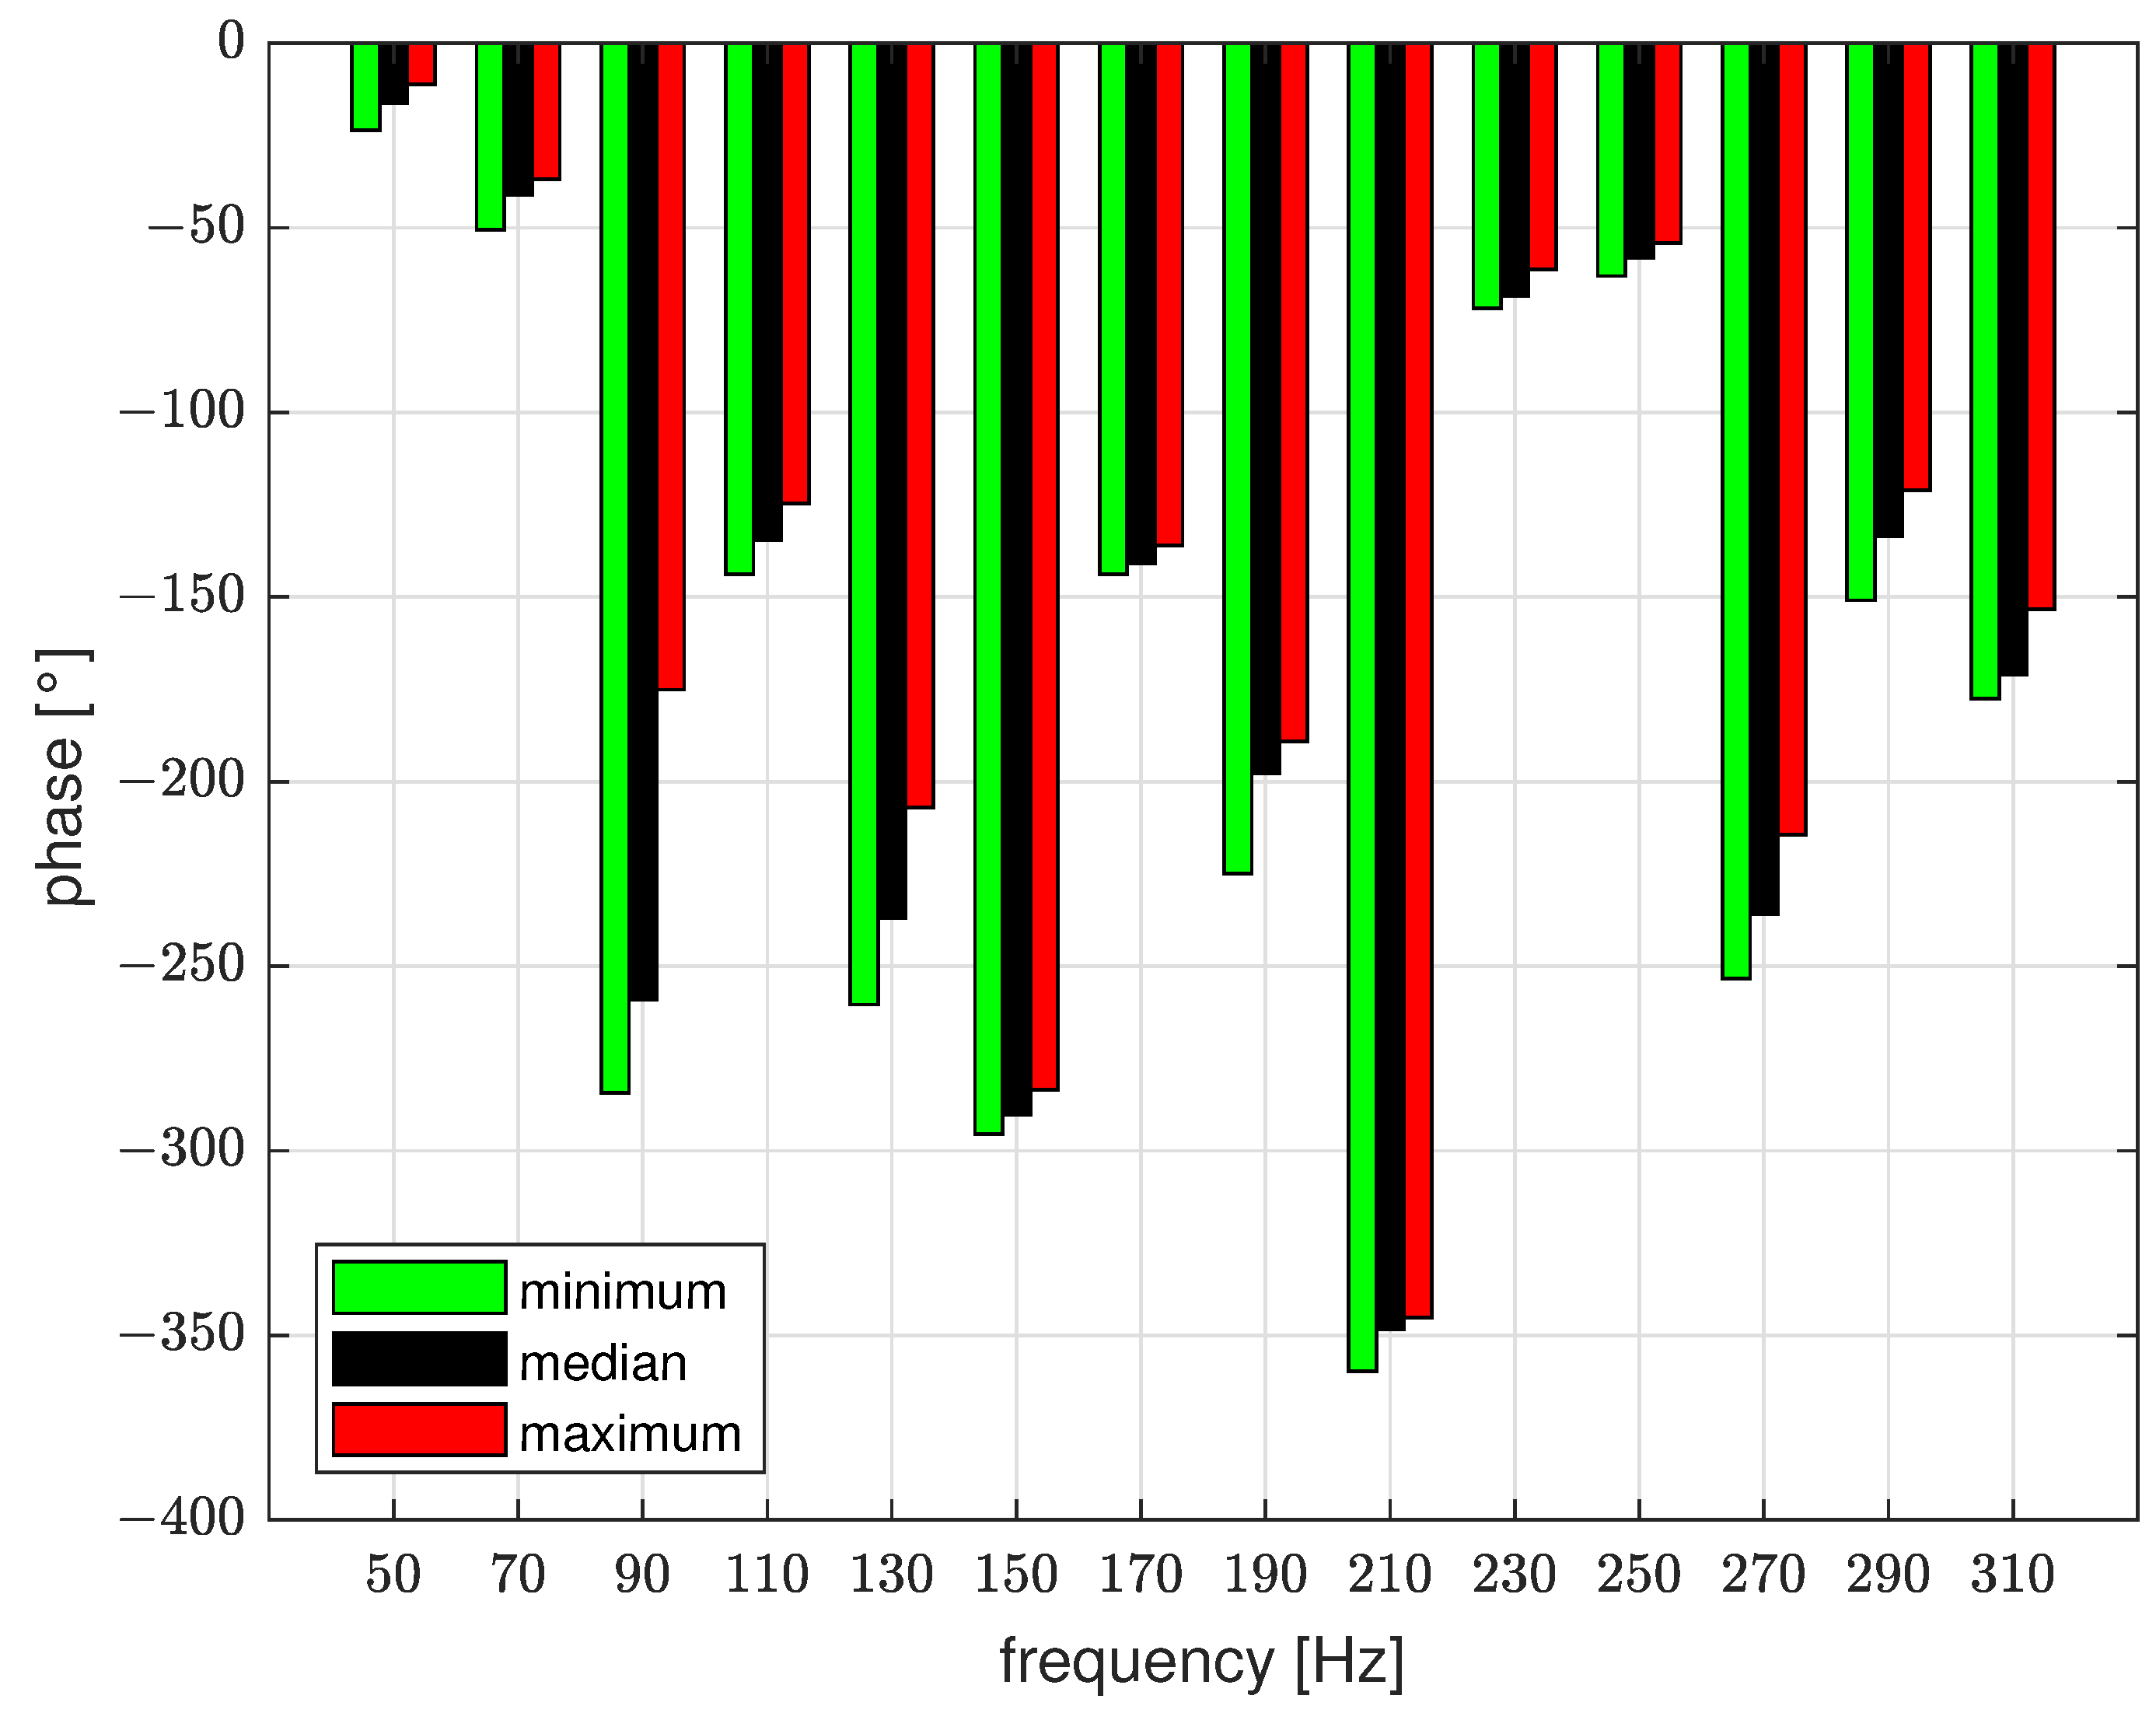
Here, S ^ * ( e j ω d i s t h ) is the complex conjugate of the estimated secondary path at a specific frequency ω d i s t . The accuracy of the estimated transfer function S ^ ( z ) is of significant importance, as model errors may lead to the performance degradation or even instability of the system (see, e.g., [6,15,16,17,18]). If the absolute value of the phase error between the secondary path S ( z ) and its estimate model S ^ ( z ) is larger than | π 2 | , the algorithm may become unstable. As shown in [19], adaptive algorithms performing in the time domain could become unstable even for phase errors below | π 2 | . In many applications, the secondary path includes time variant parameters. Therefore, it is important to identify the secondary path in sufficiently short time intervals depending on the rate of change of these parameters.
Figure 5 shows the variation of the secondary path’s phase at various frequencies for a temperature of the combustion engine in the test vehicle rising from 30 to 85 degrees Celsius in about 20 min. The identification was performed at discrete frequency points in the interval from 50 Hz to 310 Hz . The step size between two identification points is 20 Hz . It can be seen that the secondary path phase changes up to 90 during the measurement.
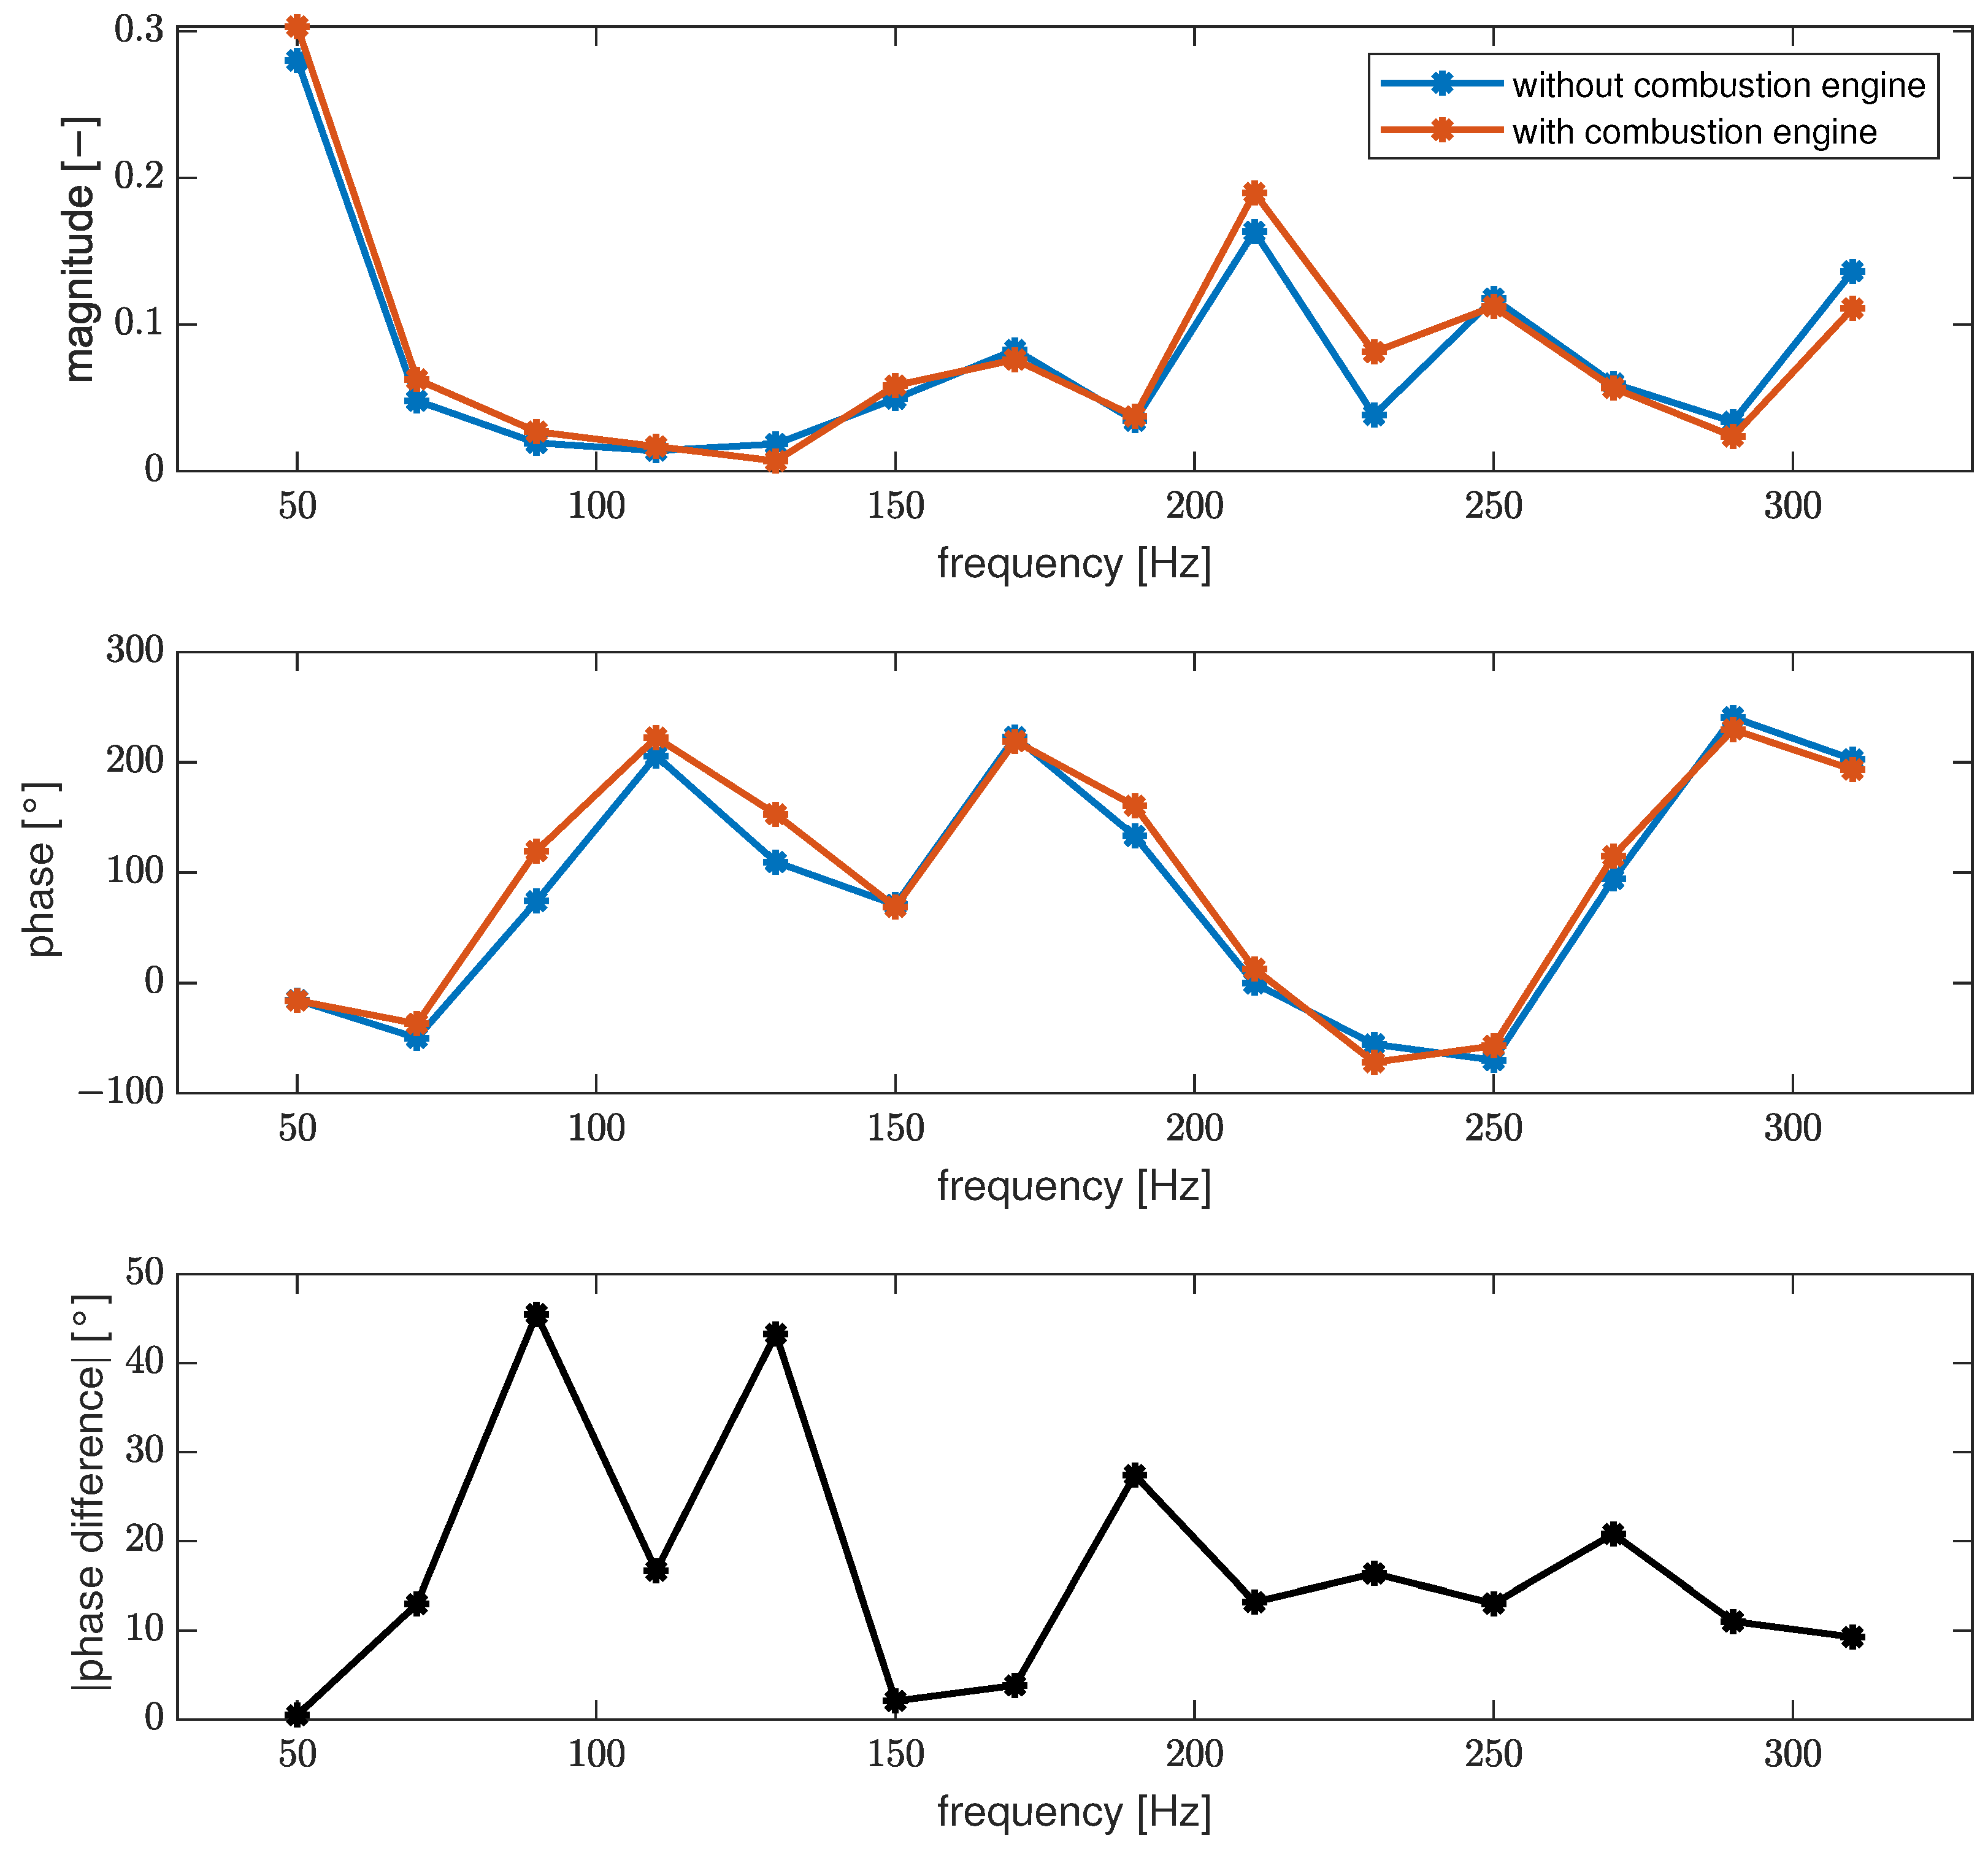
As the accuracy of the estimated transfer function S ^ ( z ) can be influenced by uncorrelated noise, the secondary path estimation can be seen in Figure 6 with and without a running combustion engine. In Figure 6, it can be seen that the influence of the uncorrelated noise due to the combustion engine affects the secondary path estimation. This may lead to performance degradation. As the phase errors is below | π 2 | , the algorithm will not become unstable.
To identify the secondary path at discrete frequency points, only small changes to the proposed NFxLMS algorithm are necessary (Figure 7).
The secondary path is stimulated by the reference signal x 1 ( n ) . The filter weights are adapted using the presented adaption scheme to minimize the instantaneous squared error e 2 ( n ) . With the assumption that the algorithm is stable and no disturbances occur, the error e ( n ) becomes equal to zero. As there is a fixed relationship between the reference signal x 1 ( n ) and the filter’s output signal y ( n ) and with
e ( n ) = y ( n ) s ( n ) x 1 ( n ) = 0
the phase and the amplitude of the secondary path can be calculated using Equations (6) and (7).
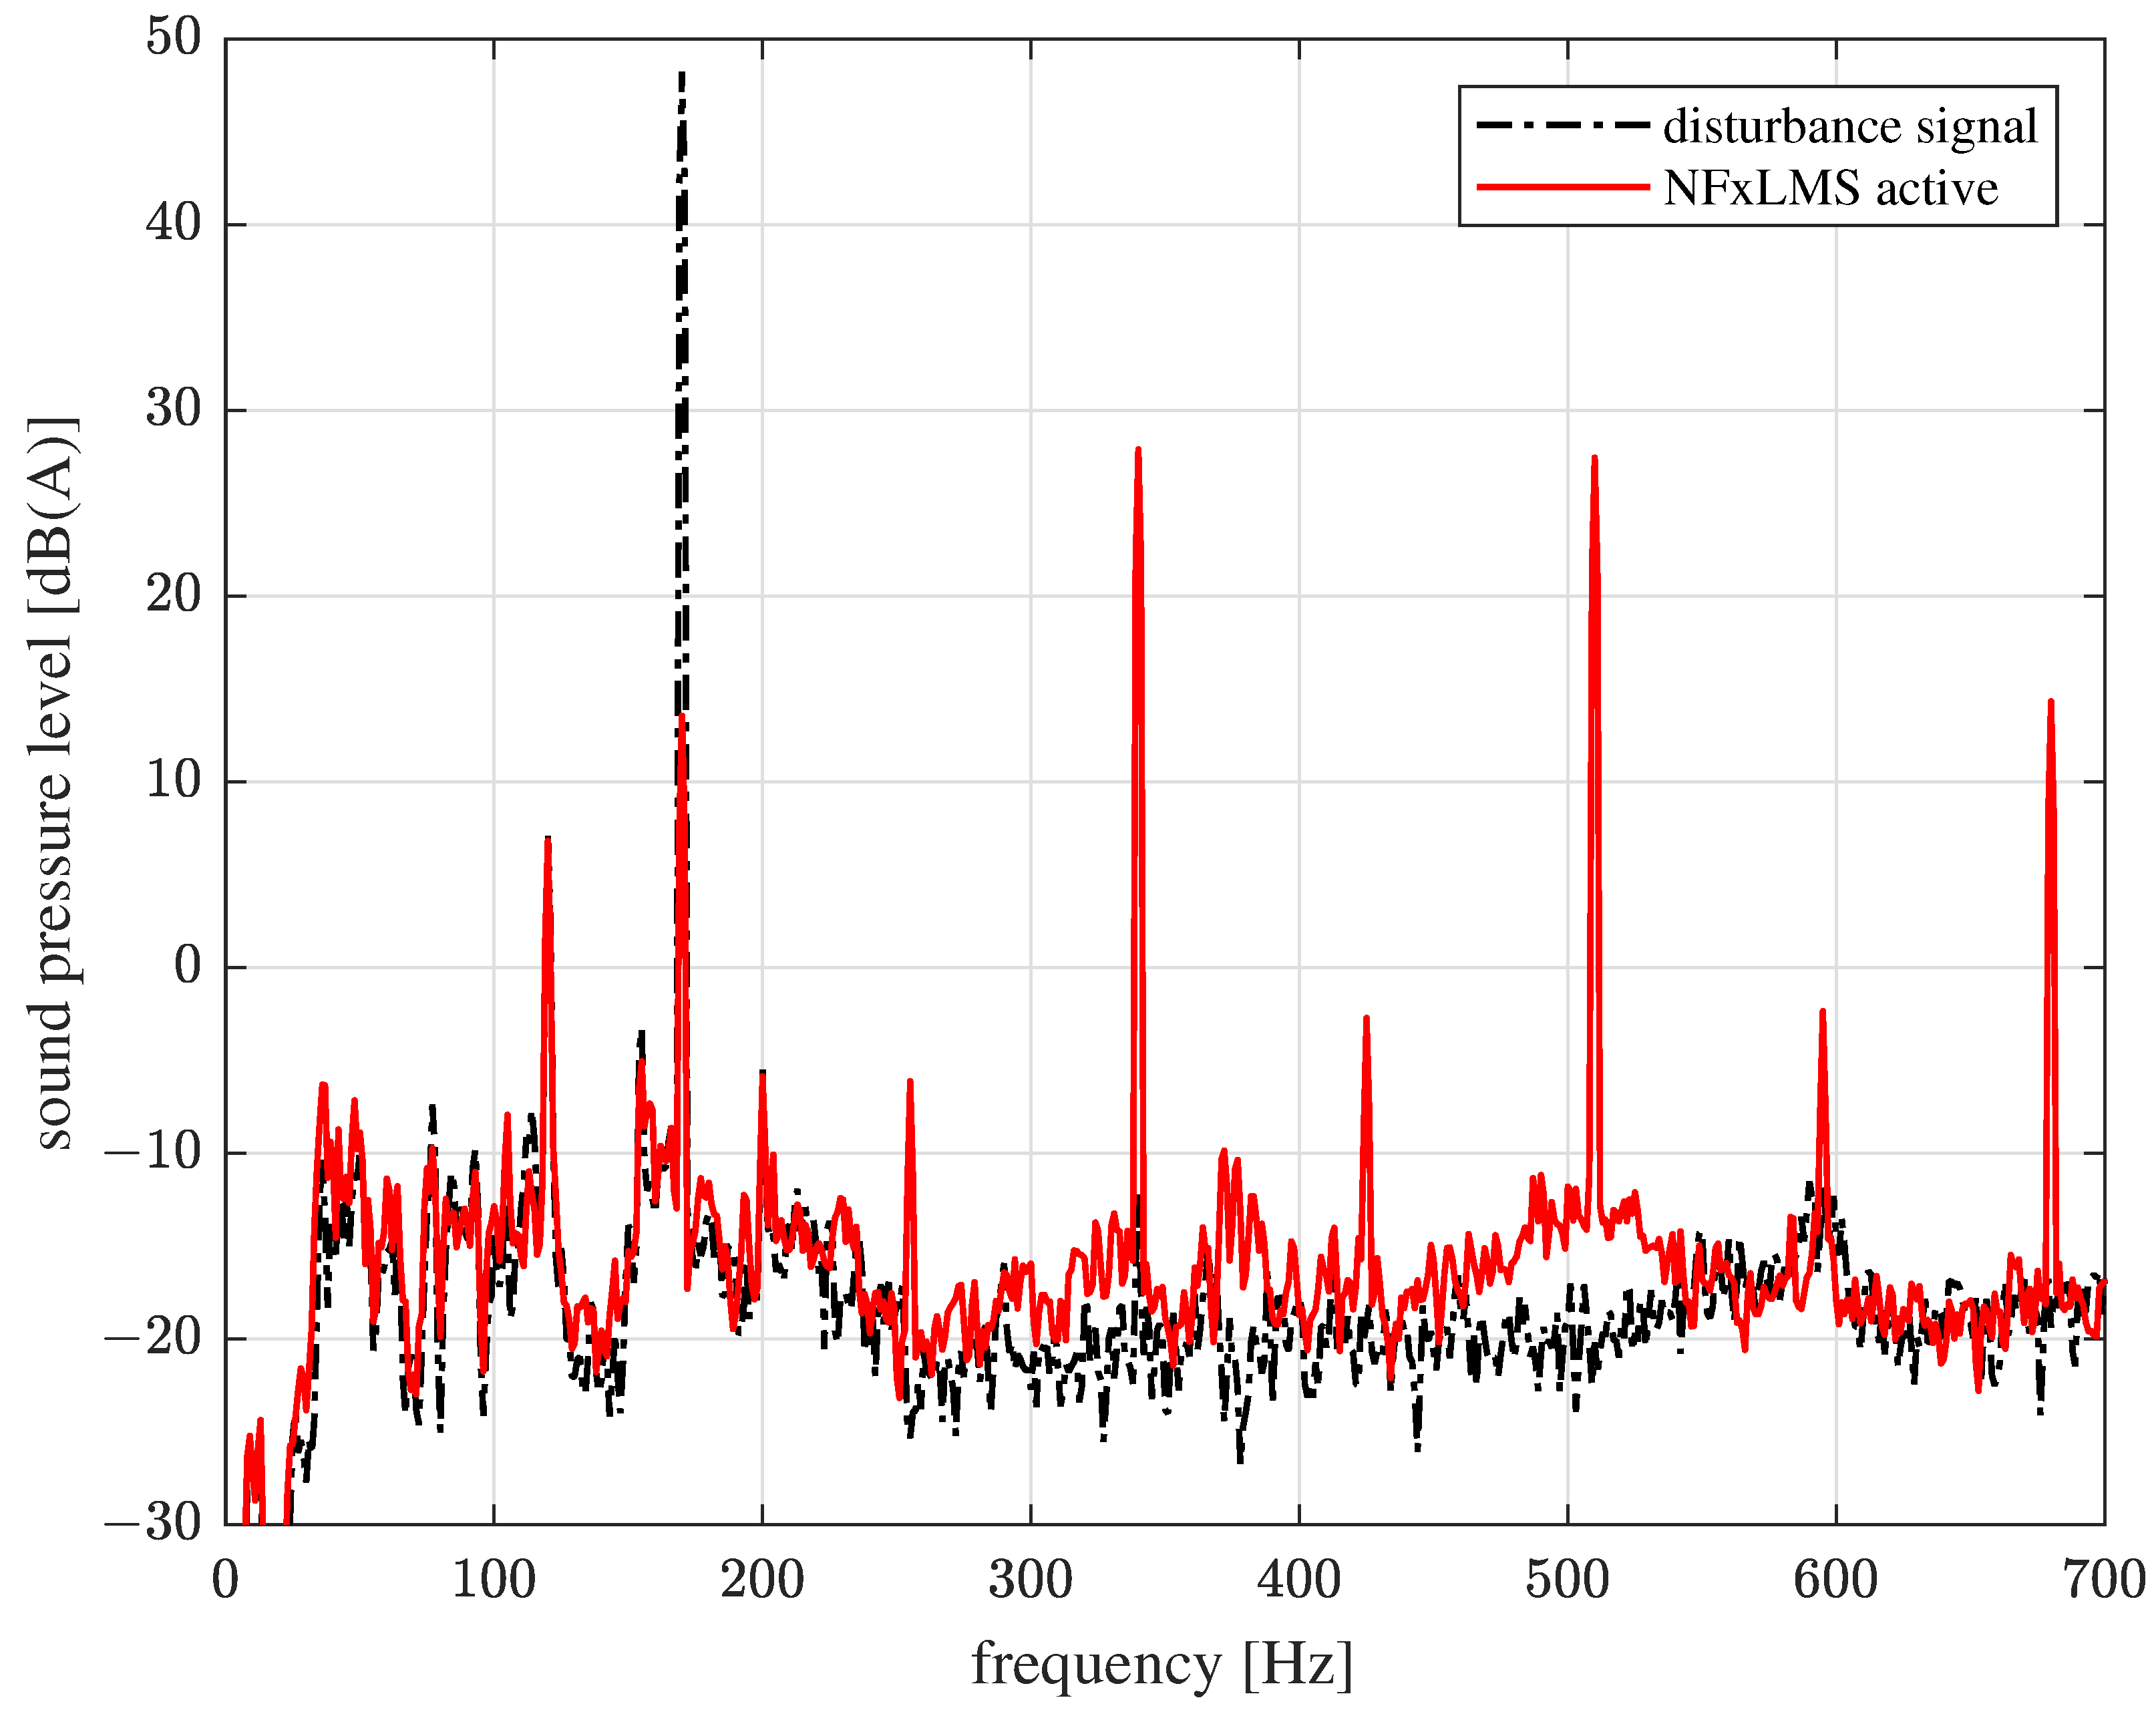
Figure 8 illustrates the frequency spectrum of the A-weighted airborne noise level measured at the driver’s ears. The black line shows a tonal disturbance signal with a frequency of 170 Hz generated by a shaker mounted at the front axle carrier (Figure 9).
The red line shows the frequency spectrum after the FxLMS algorithm has converged. It can be seen that it is possible to reduce the harmonic error signal at a frequency of 170 Hz using the introduced control structure after identifying the secondary path. Here, the reduction of the disturbance signal at 170 Hz is approximately 35 dB. However, an EPS system contains several nonlinear elements. Therefore, a harmonic excitation of the EPS motor produces, in addition to the first harmonic at 170 Hz, several higher harmonics at the error sensor due to the described nonlinear distortions. The increase in the level of some higher harmonics is approximately 40 dB. Consequently, there is no improvement in the subjective hearing experience because of the additional higher harmonics. This is the reason for using different methods to reduce the higher harmonics at the error sensor, which are described in the following subsections.

2.3.2. Reduction of the Higher Harmonics

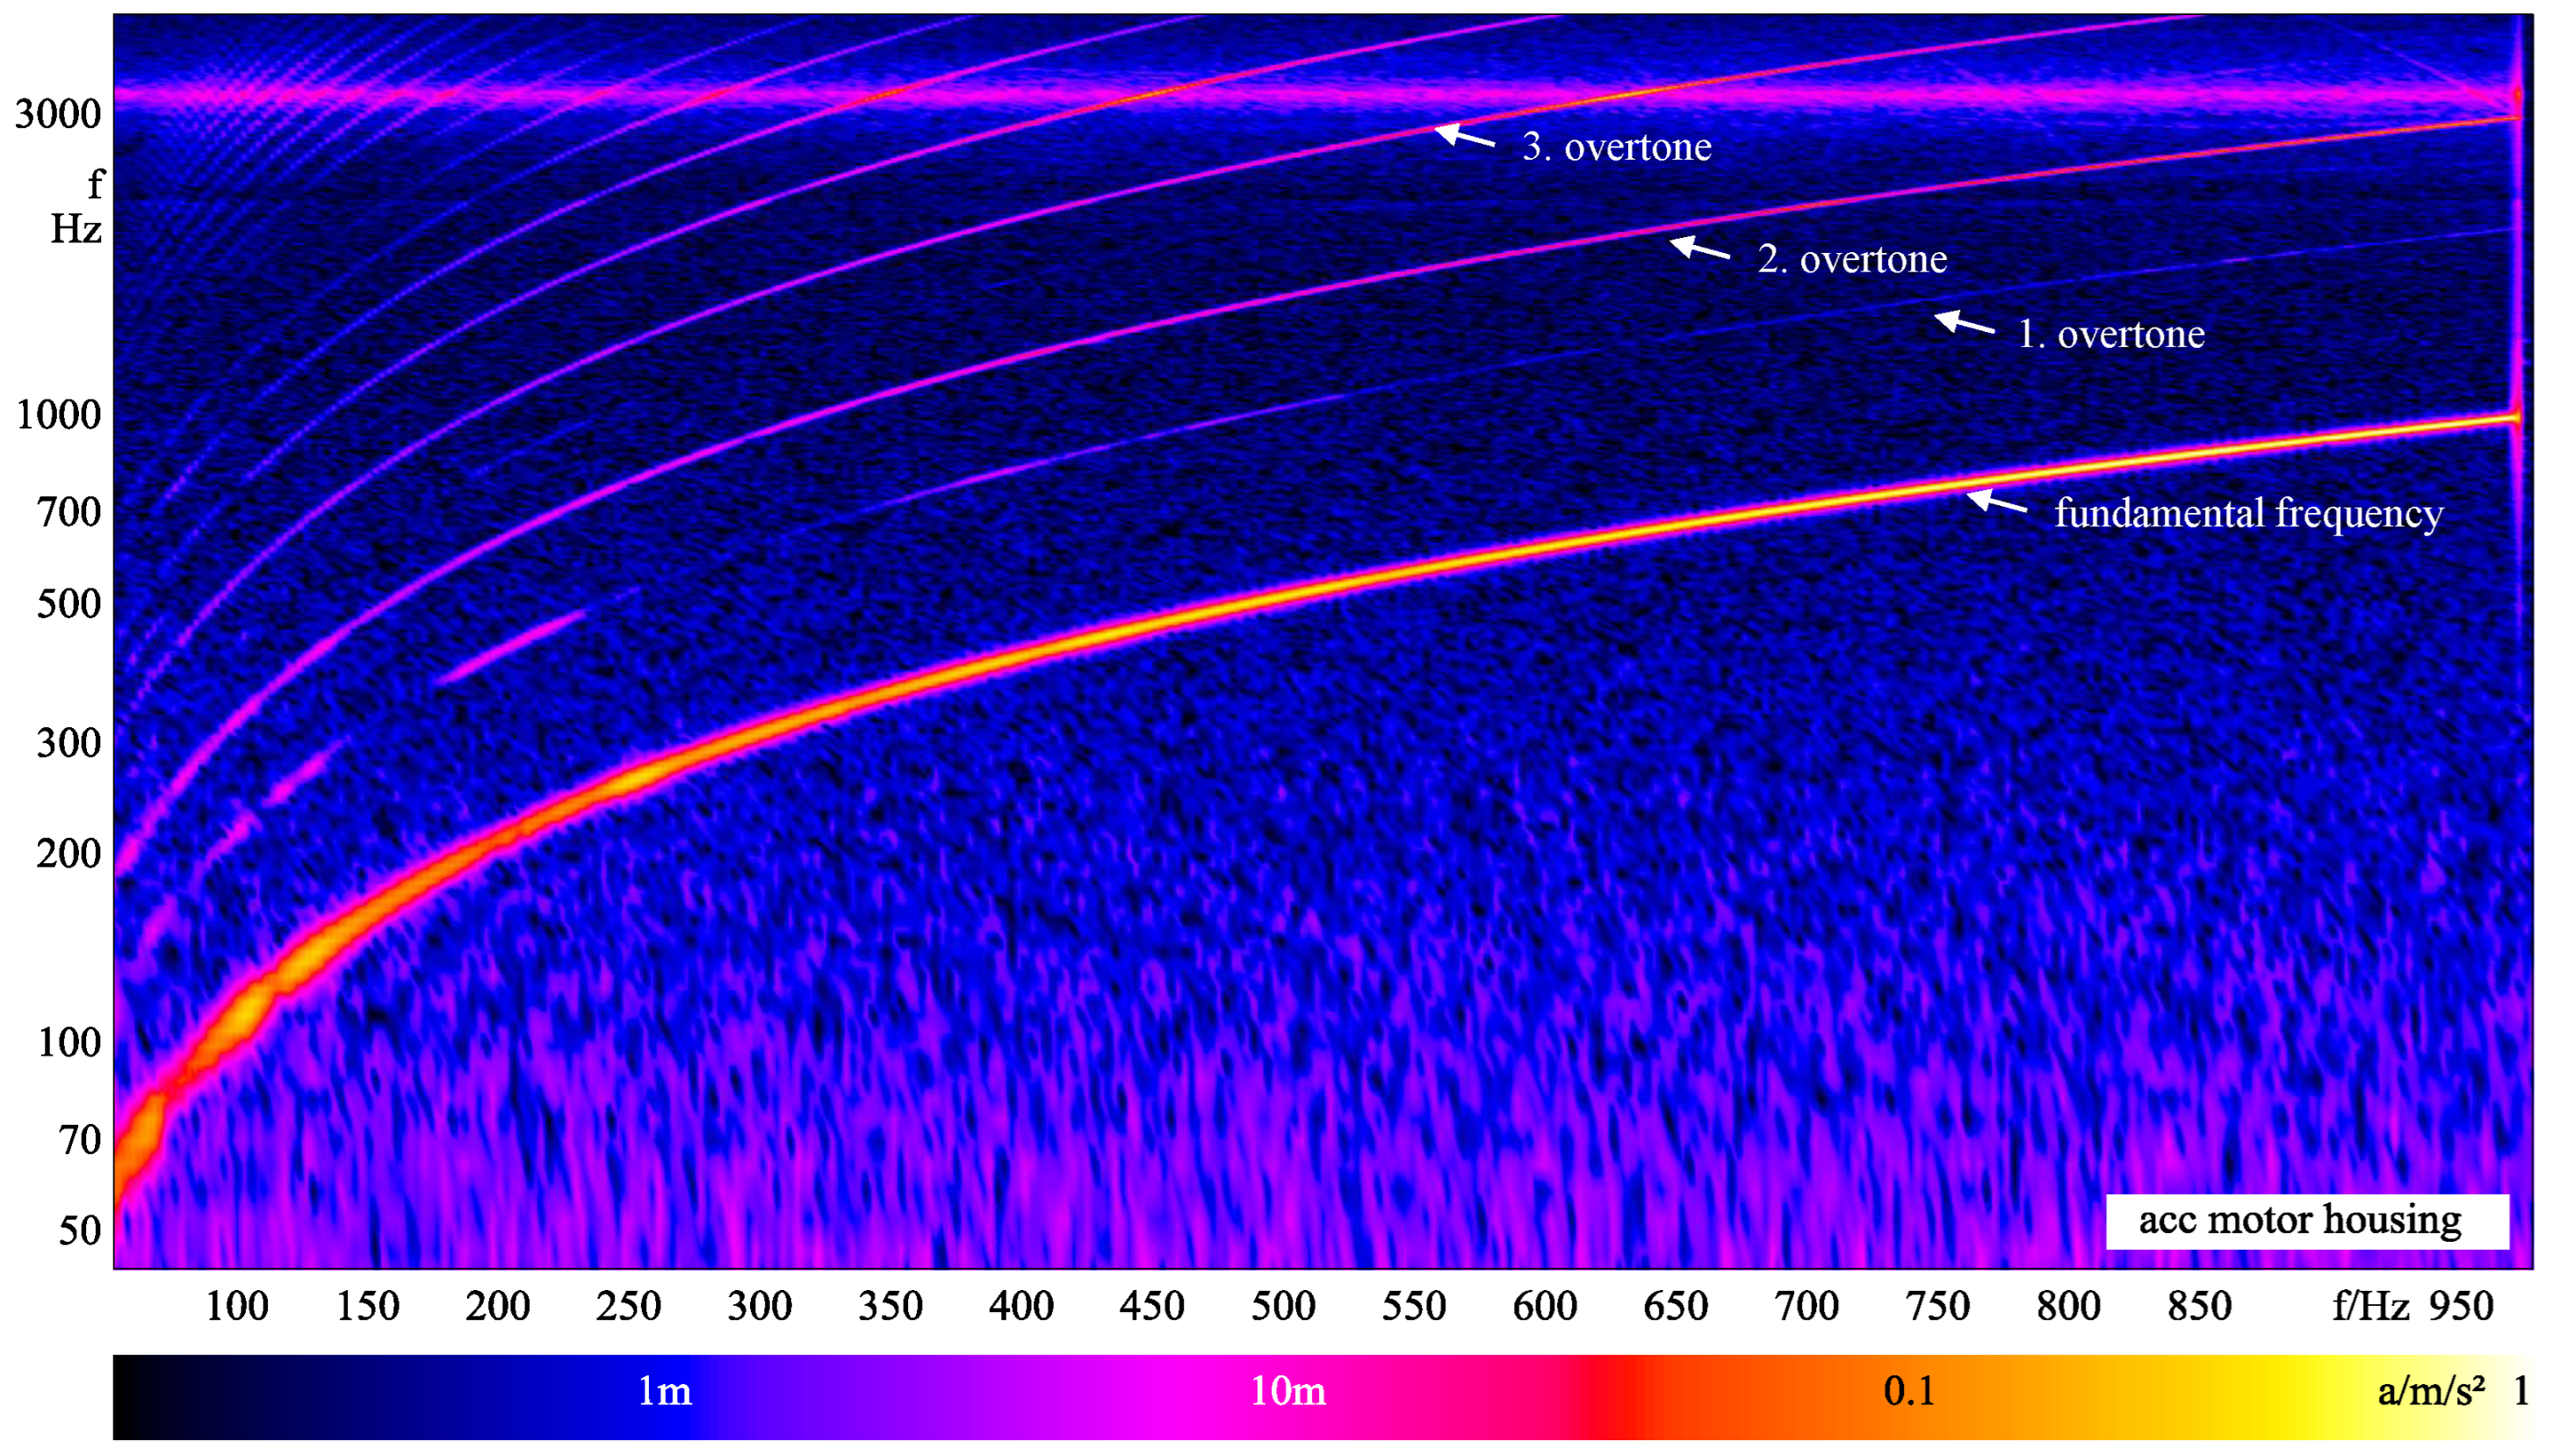
This section deals with the nonlinear distortion behavior of the EPS system considered as the acoustical actuator. The NFxLMS algorithm, which is described in Section 2.3.1, is a narrowband algorithm. For a compensation of the harmonic disturbance signal, a harmonic compensation signal is also needed. Common vehicle ANC systems use the electrodynamic speaker from the multimedia system as a compensation actuator. Typical electromagnetic speakers have a low harmonic distortion (<1%) in the defined working frequency range, and thus higher harmonics of the fundamental frequency signal are not noticeable. If an EPS system is used as the acoustic actuator, the acoustic behavior is not known at first. Therefore, a system identification was accomplished by generating a sine sweep signal on the desired i q current. The system response was detected by measuring the radial acceleration on the motor housing. The results are shown in Figure 10.
The highest signal amplitude is given by the fundamental frequency of the sine sweep. But higher harmonics are also clearly identifiable as well as subjectively noticeable. These higher harmonics dominate the frequency range up to 2 kHz and are called overtones. This is also a highly sensitive area of the human auditory system. The frequency of the n-th overtone f o , n is given by
f o , k 1 = k · f 0
while f 0 is the frequency of the excitation signal and k 2 is an integer. If harmonic signals are compensated for by the EPS system, higher harmonics are still noticeable, which may not lead to any subjective improvements during the compensation.
In addition to the excitation signal and the overtones, a constant frequency component can be seen at about 3100 Hz in Figure 10. It is independent of the excitation frequency. This is a resonant frequency of the EPS motor, which is excited by the current controller.

Higher Harmonics Reduction Method 1: Filter Weight Limitation

Trial Hypotheses

The NFxLMS, in general, minimizes the instantaneous squared error signal e 2 ( n ) . This means that a disturbance signal with a high amplitude will be canceled by a corresponding compensation signal with a high amplitude as well. It is assumed that a lower signal amplitude of the compensation signal y ( n ) will result in a lower harmonic distortion of the compensation signal. In practice, a partially compensated disturbance signal can also be useful if masking effects of other signals are available (e.g., broadband noise from wind or tires).
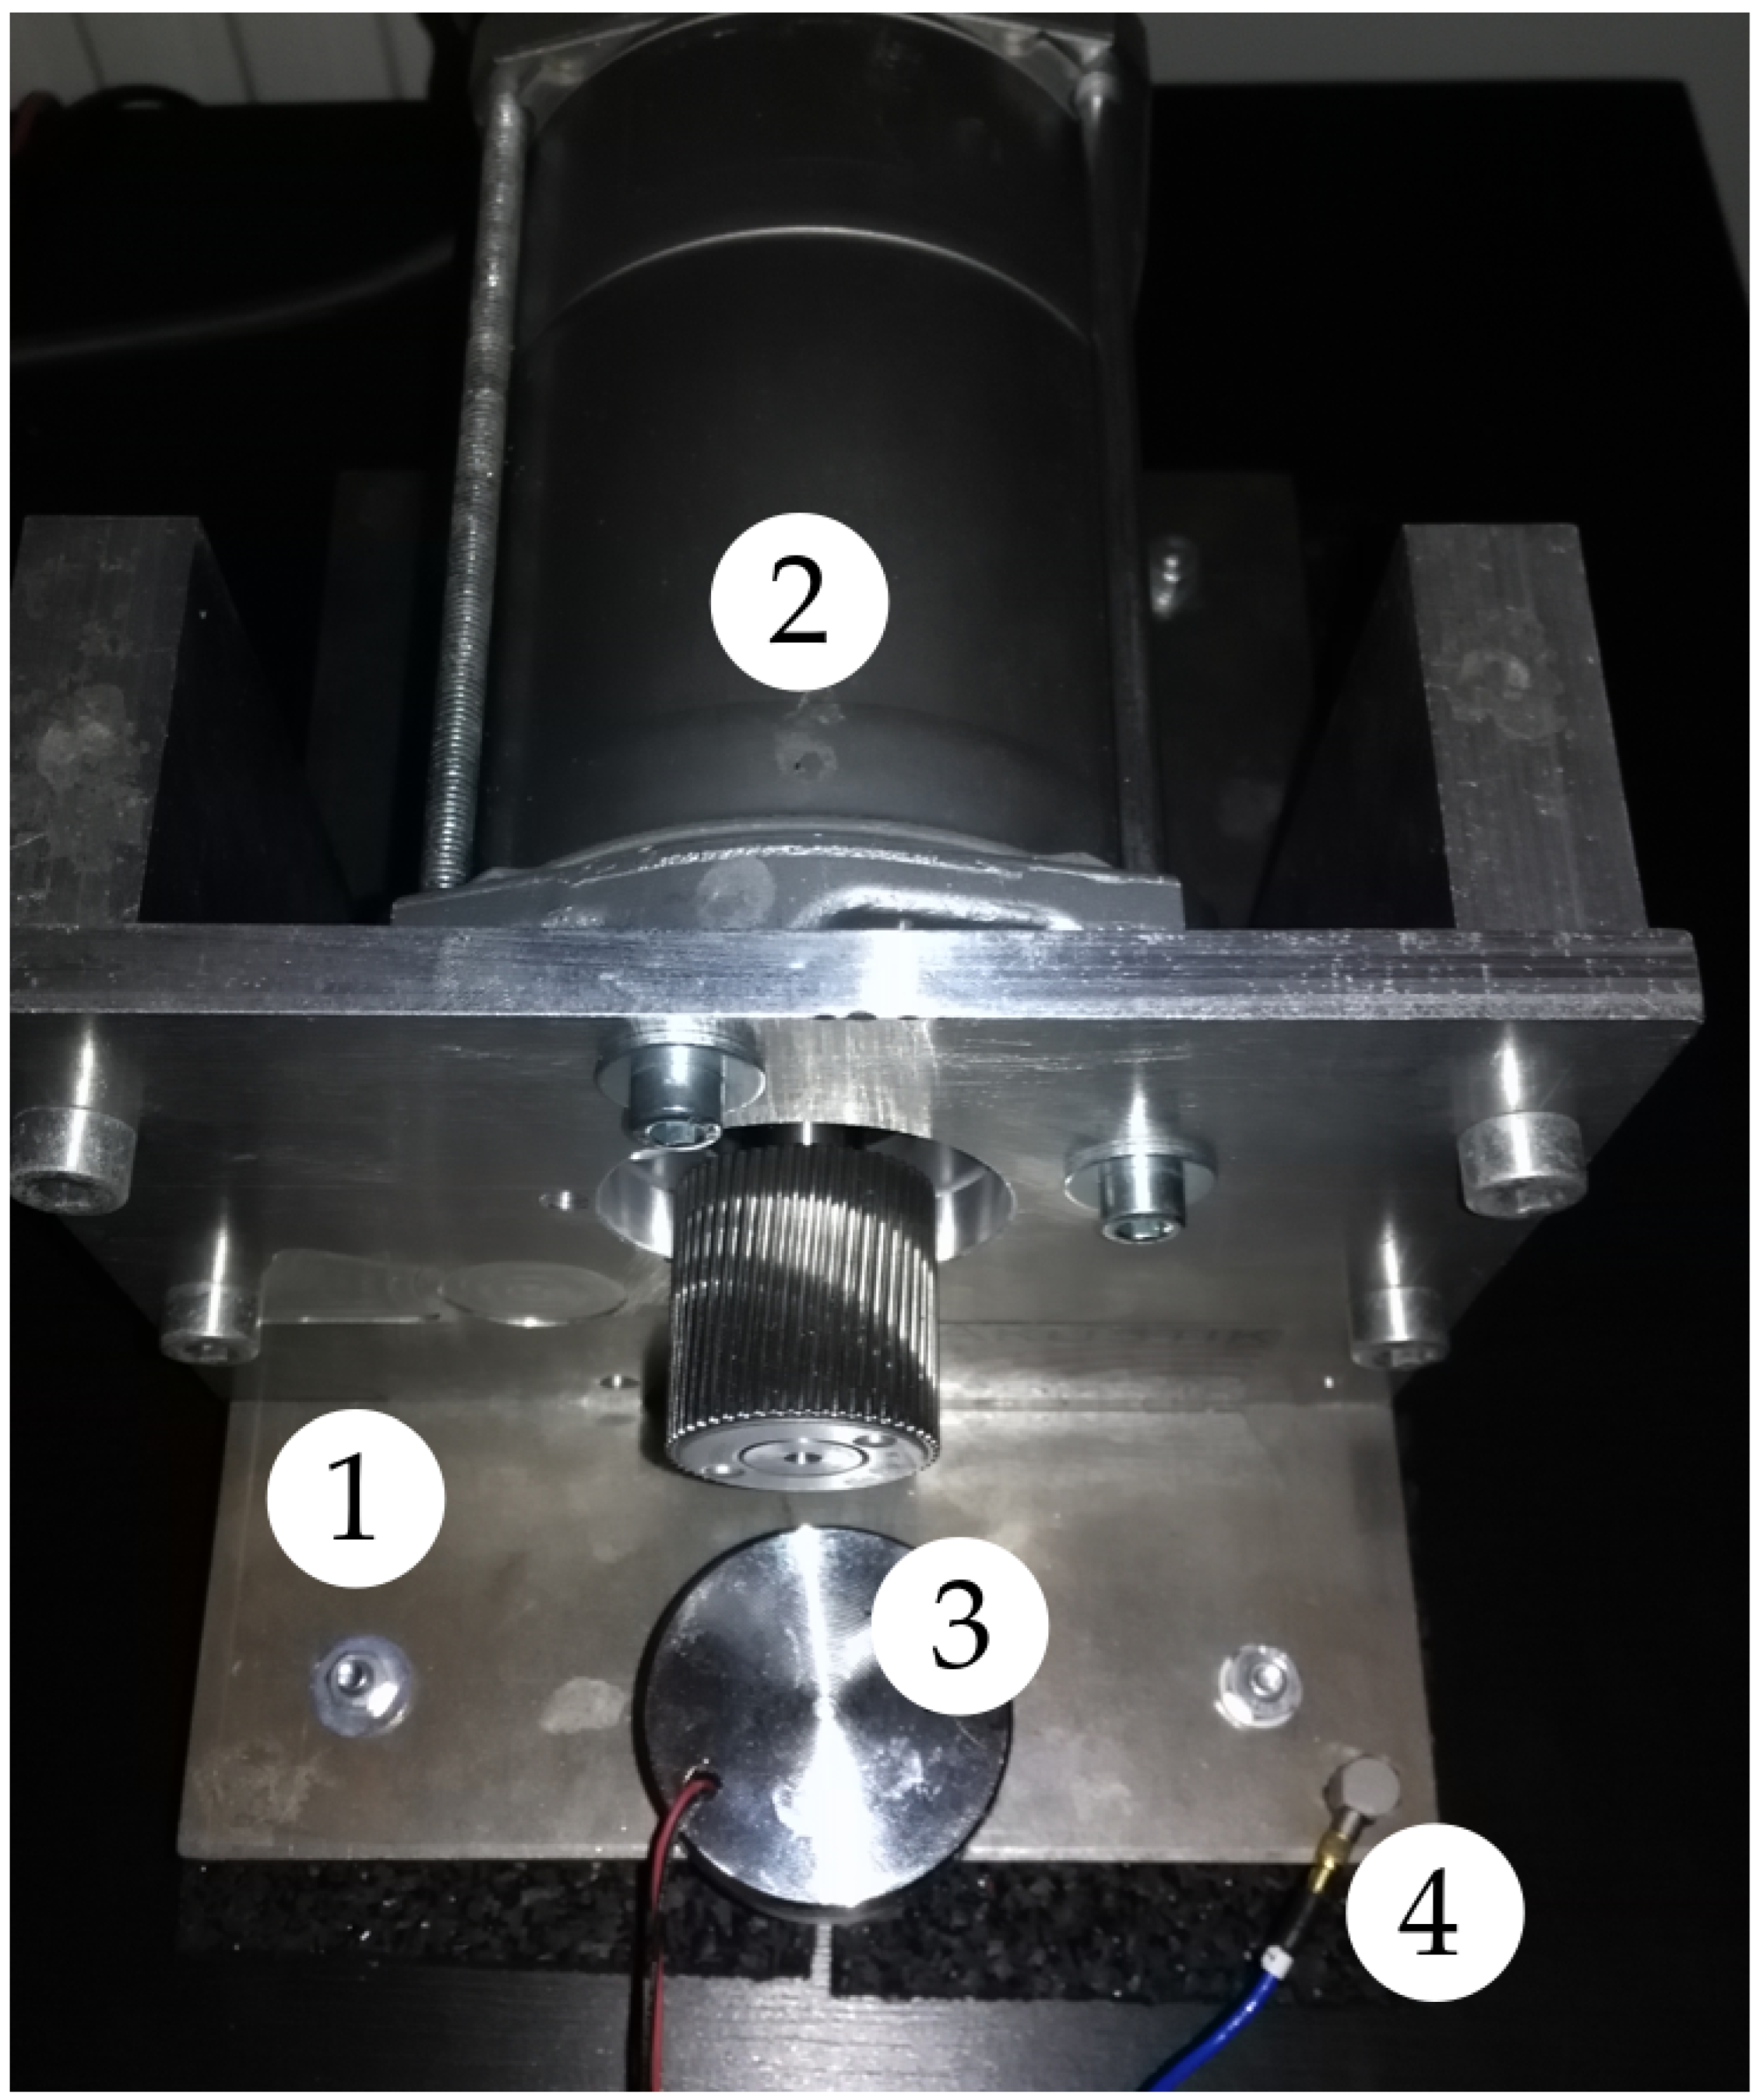
To study the trial hypotheses, a testing setup (see Figure 11) was assembled. The PMSM test rig was mounted on a solid structure. In this structure, a harmonic disturbance signal was induced by a modal shaker. The error signal was detected by an IEPE-ready accelerometer on the solid structure. After determining the secondary path, several harmonic signals with the same amplitude were canceled on the error position. Following that, the error signal was monitored during a stepwise limitation of the filter weights w ( n ) = [ w 1 w 2 ] T . The filter weight limitation was implemented as proposed by [20,21]:
w u n l i m ( n + 1 ) = w ( n ) + μ e ( n ) x ( n ) A ( n + 1 ) = w u n l i m T ( n + 1 ) w u n l i m ( n + 1 ) w ( n + 1 ) = w u n l i m ( n + 1 ) , if A ( n + 1 ) A m a x w u n l i m ( n + 1 ) A m a x A ( n + 1 ) , if A ( n + 1 ) > A m a x
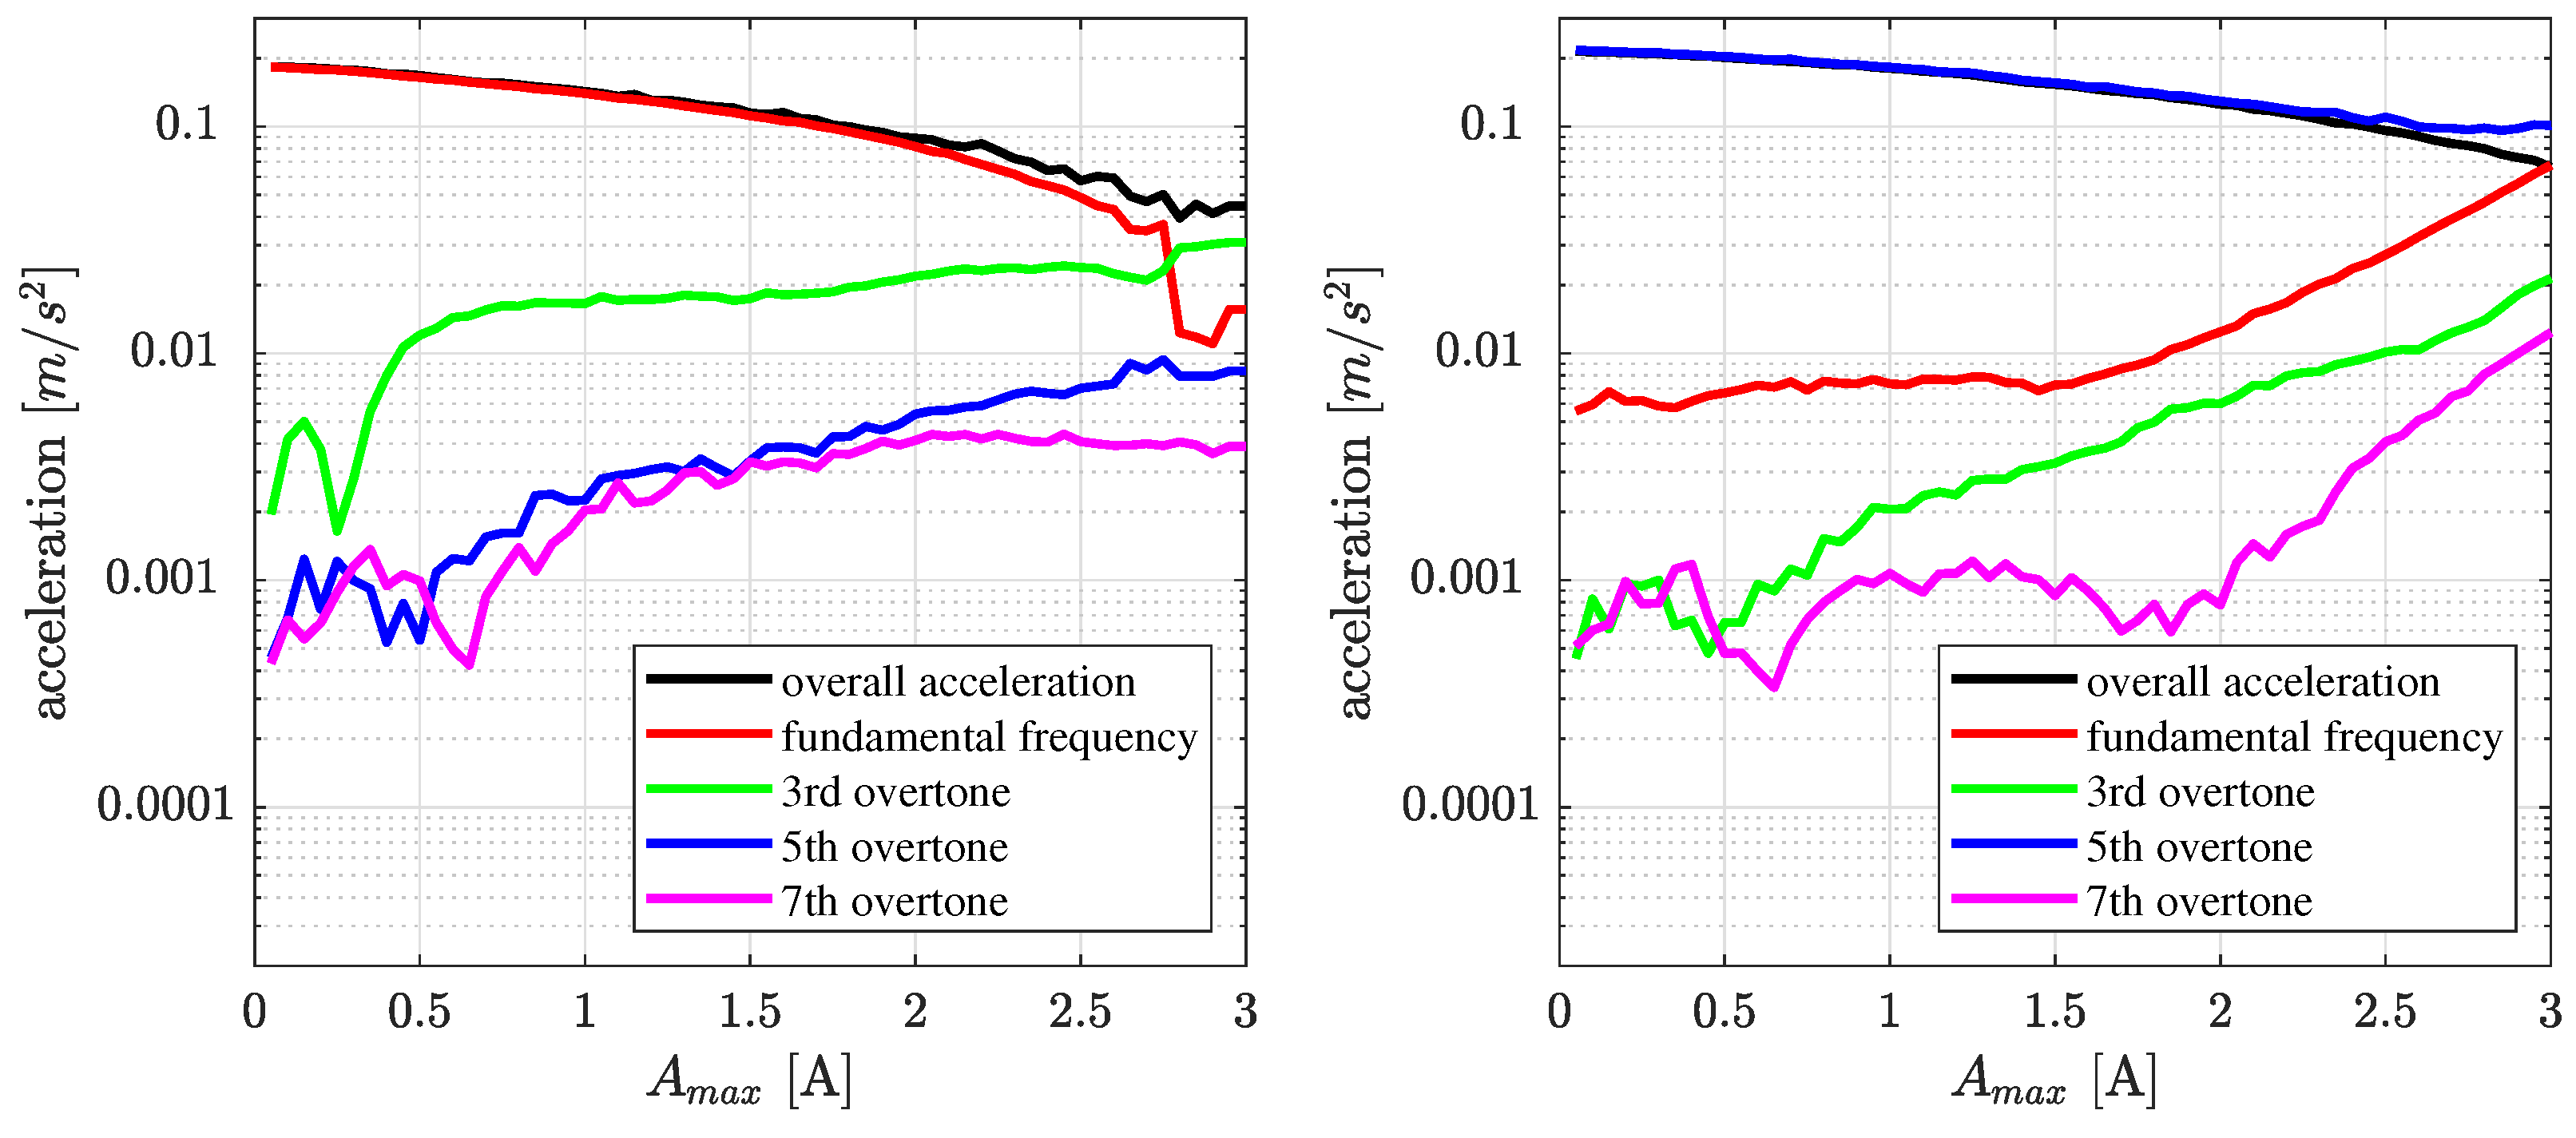
The idea is to limit the amplitude of the harmonic compensation signal by A m a x but to keep its phase (given by the quotient of w 1 and w 2 ), which in the optimal case should be shifted by 180 degrees compared to the harmonic disturbance signal. Figure 12 shows the results of structure-borne noise compensation for two frequencies. The amplitude of the compensation signal A ( n ) is limited by A m a x . The amplitude of the fundamental frequency component and the overtones of the acceleration signal are shown in Figure 12 at different values of A m a x , while A m a x corresponds to the maximum amplitude of the motor currents i d / q * , which are generated by the ANC algorithm (see Figure 2). Both diagrams show that the overall error signal decreases with increasing filter weight limitation. To a certain point, the fundamental signal dominates the overall signal. But the odd harmonics 3 , 5 , and 7 also increase. At maximum filter performance (see the right-hand side of the abscissa), the fundamental signal is compensated for, but the amplitudes of the higher harmonics are high. In the 200 Hz compensation mode, the overall signal is even dominated by the harmonic distortion from a limitation of A m a x = 2.5 . This observation at several signal frequencies fulfills the trial hypotheses. The filter amplitude limitation leads to a lower level of the overtones, generated by the PMSM. Therefore, by using this idea, a compromise between the degree of compensation and the amount of distortion (generation of overtones) may be found. As in many applications, a disturbance reduction of 5–10 dB already yields a significant acoustic improvement; this method allows for the ANC to be stopped at a certain extent in order to avoid a further excitation/generation of overtones in the PMSM.
A method to actively reduce the higher harmonics with a parallel version of the FxLMS algorithm is presented in the next section.

Higher Harmonics Reduction Method 2: Parallel NFxLMS Controller

In some situations, the airborne noise level of masking effects is not enough to mask the higher harmonics when using the proposed Filter Weight Limitation. Therefore, an active method to reduce the higher harmonics is presented in this section.
In [22], a set of multiple FxLMS algorithms were used to reduce broad-band low-frequency noise in a tractor cabin. In [10,23,24], a nonlinear adaptive controller for the attenuation of harmonic disturbances was presented, which acts in the frequency domain. The adaption scheme proposed in this section uses the weak coupling of the single harmonics of the EPS motor (when used as an acoustic actuator) to adapt the coefficients of a set of parallel NFxLMS controllers in the time domain. Without loss of generality, a discrete time description is provided to show the steady-state behavior of the secondary path, as the controller acts in the discrete time domain. It is assumed that the sample time h is small enough to prevent aliasing effects and the sampled signals describe the steady state behavior of the secondary path in an accurate way. It has already been shown in [10,23,24] that the steady state error signal e ( n ) can be written as
e ( n ) = k = 1 e ^ k · e j ( k · ω d i s t n h )
using the real part ( · ) of an infinite series of complex harmonic components (Fourier series), as the nonlinear plant produces a periodic output. The excitation signal y ( n ) can also be described using a Fourier series:
y ( n ) = k = 1 y ^ k · e j ( k · ω d i s t n h )
So, the steady-state behavior of the error signal can be completely described by
e ( n ) = d ( n ) e j ( 1 · ω d i s t n h ) e j ( 2 · ω d i s t n h ) S y ^ 1 y ^ 2 T
where
d ( n ) = d ^ · e j ( ω d i s t n )
is the harmonic disturbance signal. The matrix S describes the influence of the harmonic excitation terms y ^ k · e j ( k · ω d i s t n h ) on the harmonic terms of the error sensor and has an infinite number of entries in general:
S = S 11 ( e j · 1 · ω d i s t h ) S 12 ( e j · 1 · ω d i s t h ) S 21 ( e j · 2 · ω d i s t h ) S 22 ( e j · 2 · ω d i s t h )
a finite number of harmonics are considered to approximate the steady state behavior of the secondary plant. Furthermore, the non-diagonal elements, which describe the coupling between the harmonics with different frequencies, can be neglected if they are weak compared to the diagonal elements. So, the acoustical steady state behavior of the secondary path can be approximately described by the diagonal matrix
S a p p = S 11 ( e j · 1 · ω d i s t h ) 0 0 0 S 22 ( e j · 2 · ω d i s t h ) 0 0 0 S N N ( e j · N · ω d i s t h )
for N harmonics. Additionally, the higher harmonics can be formally assigned to the disturbance signal
d a p p ( n ) = k = 1 N d ^ a p p , k · e ( j · k ω d i s t n h )
Using these assumptions, the error signal e ( n ) becomes
e ( n ) = d a p p ( n ) y ^ 1 e j ( 1 · ω d i s t n h ) S 11 ( e j · 1 · ω d i s t h ) + + y ^ N e j ( N · ω d i s t n h ) S N N ( e j · N · ω d i s t h ) = { ( d ^ a p p , 1 y ^ 1 S 11 ( e j · 1 · ω d i s t h ) ) e j ( 1 · ω d i s t n h ) + + ( d ^ a p p , N y ^ N S N N ( e j · N · ω d i s t h ) ) e j ( N · ω d i s t n h ) }
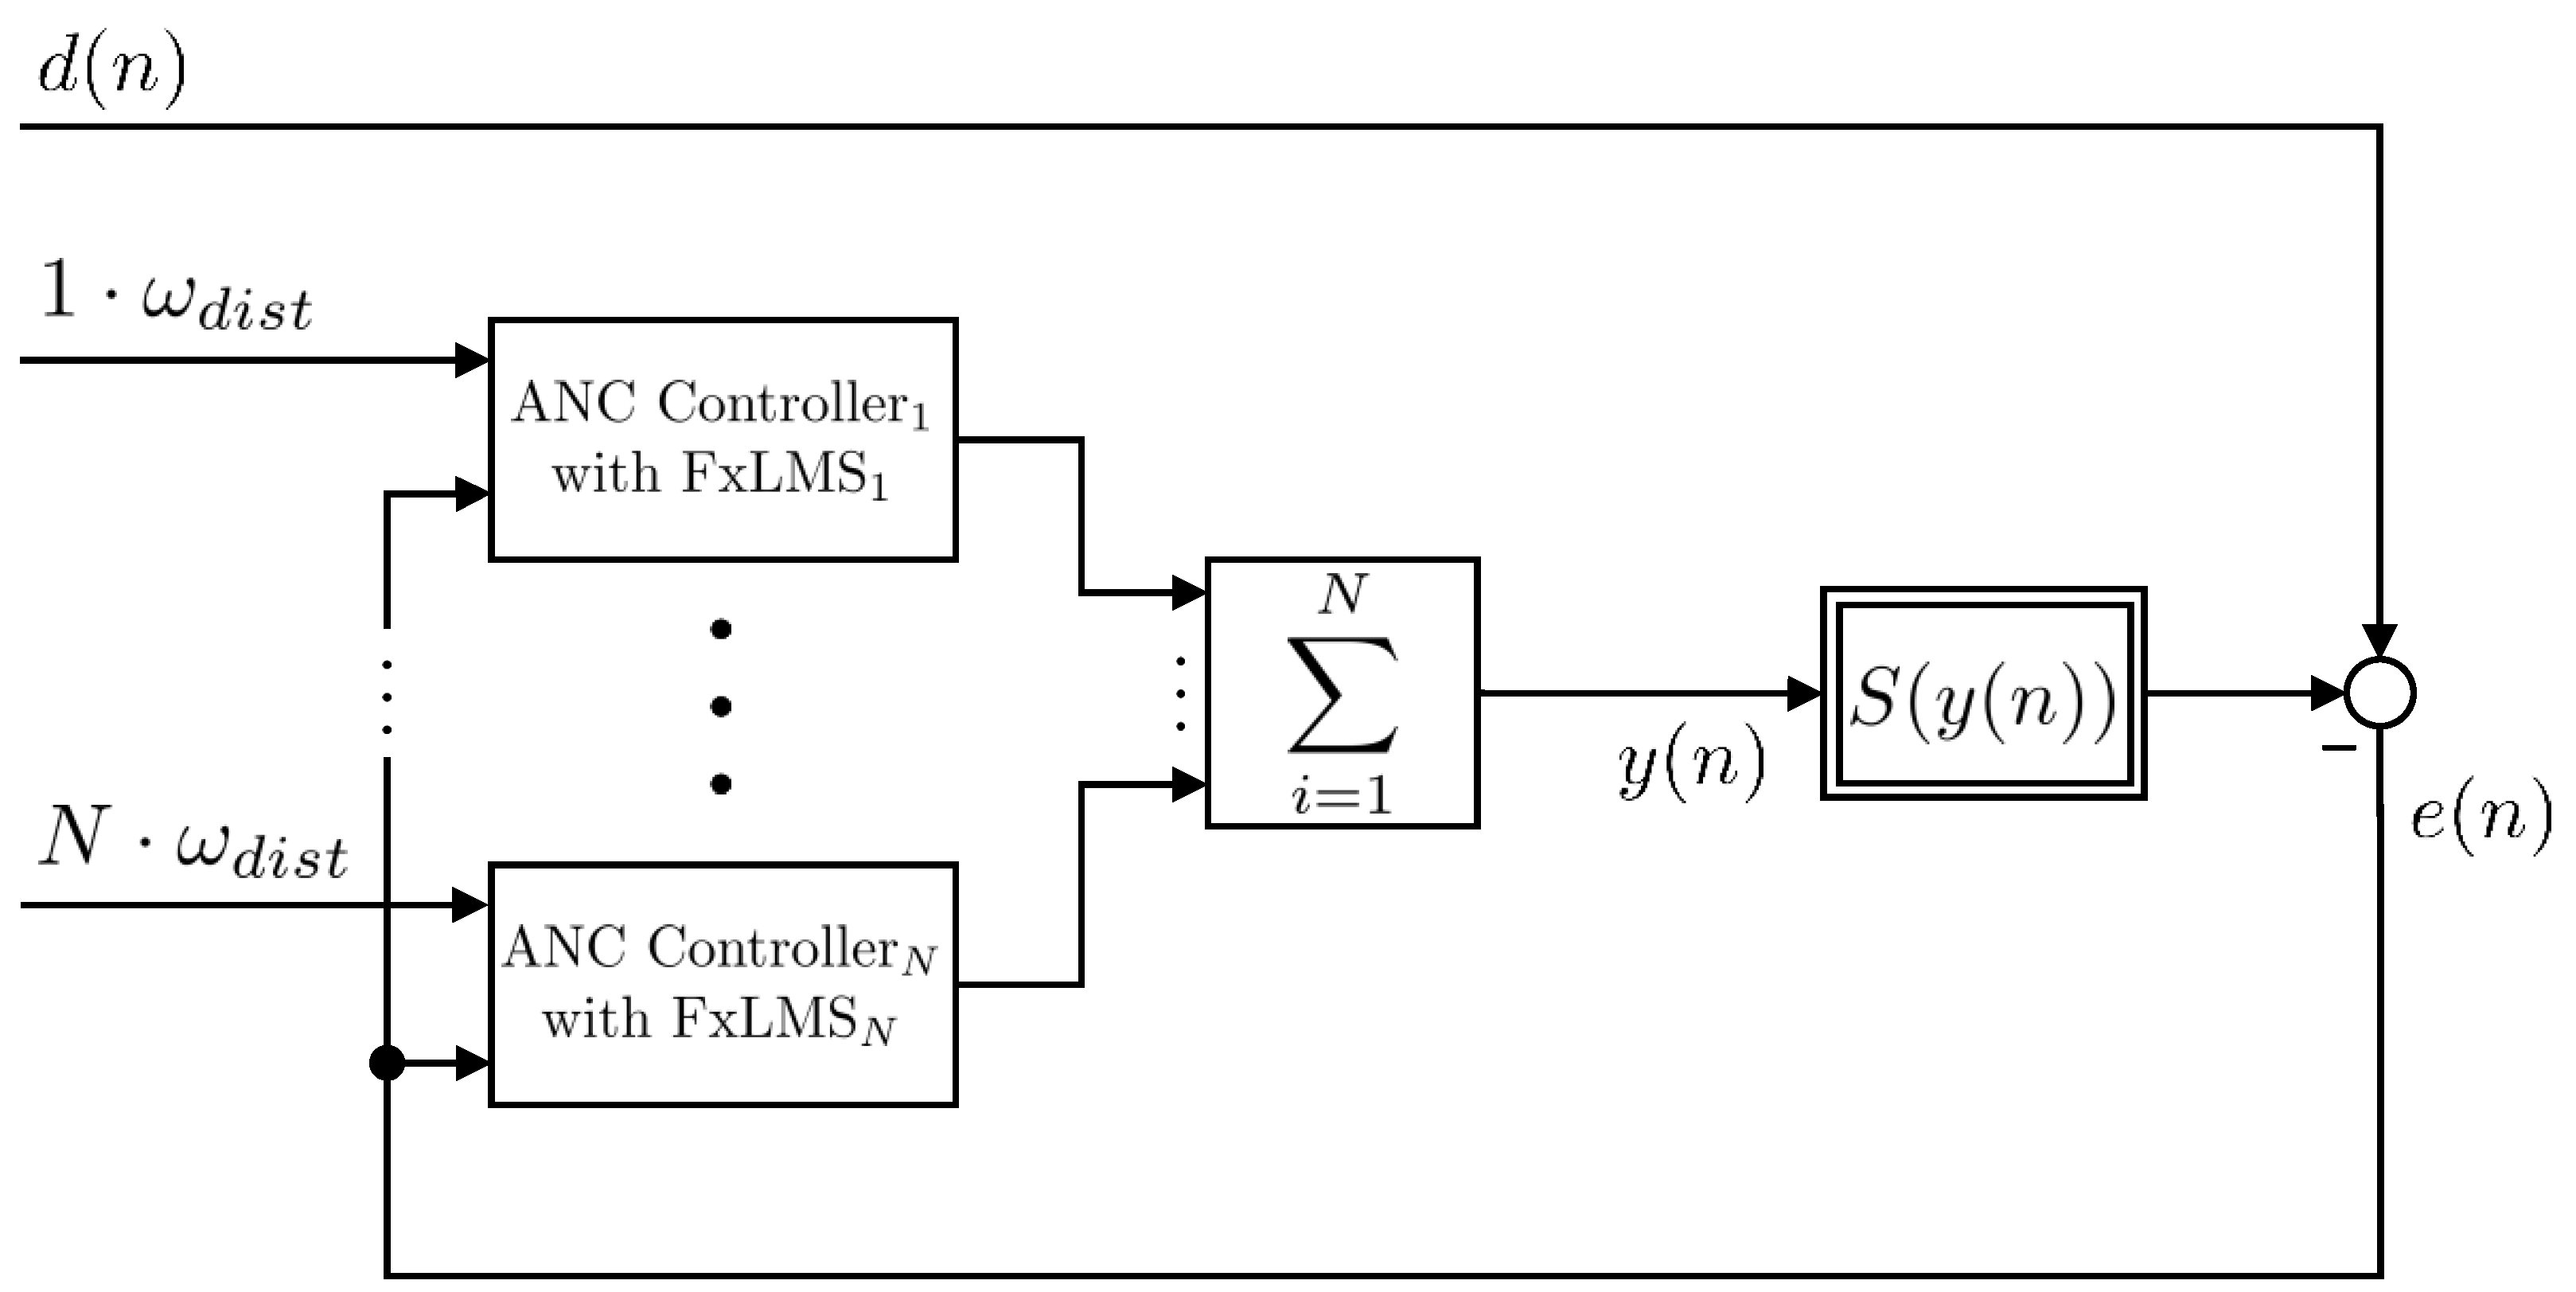
The phase and the amplitude of every considered harmonic in the compensation signal y ^ k e j ( k · ω d i s t n h ) S k k ( e j · k · ω d i s t h ) are being adapted to be ideally equal to the corresponding harmonic in the disturbance signal d ^ a p p , k e ( j · k ω d i s t n h ) in order to minimize the instantaneous squared error of the N harmonics. So, the controller output signal y ( n ) can be synthesized using a finite set of harmonic signals with different magnitudes and phases. This is performed by using a parallel version of the FxLMS to reduce the disturbance signal at the fundamental frequency as well as the higher harmonics. As the frequency of each harmonic signal is an integer multiple of the fundamental frequency ω d i s t , which is assumed to be well known, the structure of the parallel narrowband FxLMS (PNFxLMS) algorithm shown in Figure 13 is used.
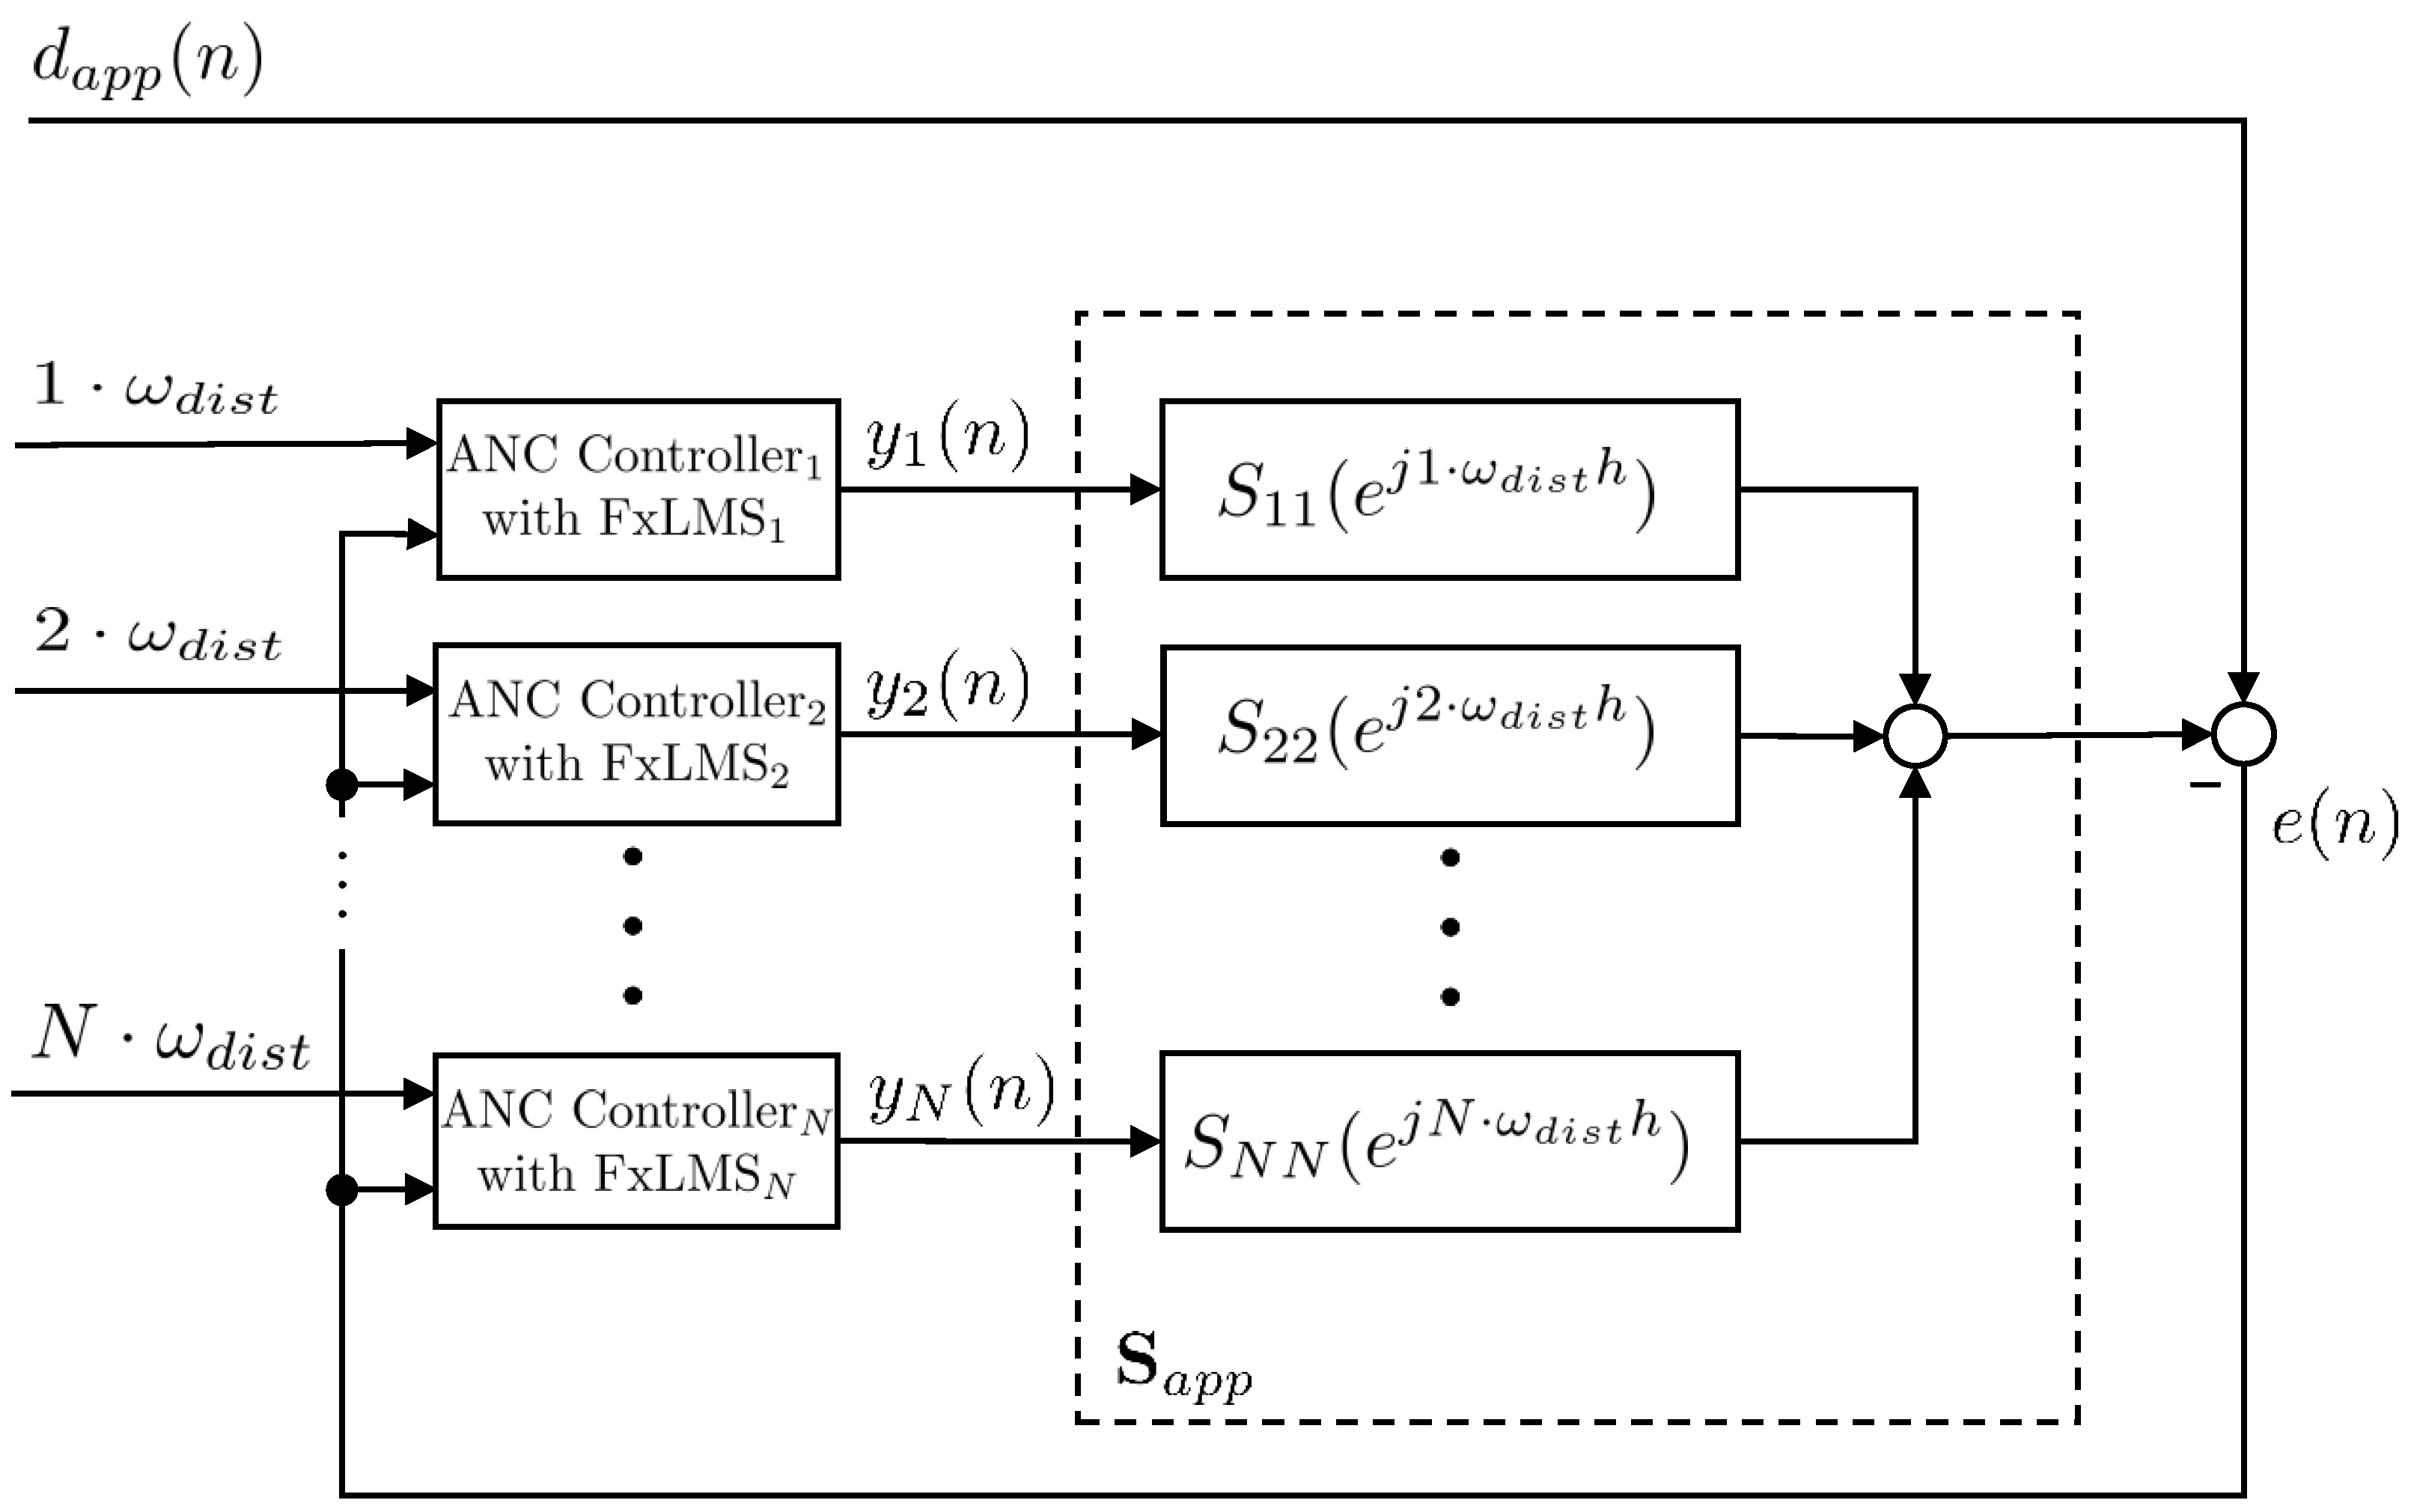
Considering the assumptions above, each individual controller can be seen as a decentralized feedforward controller for one harmonic (Figure 14), as there is almost no influence on a controller due to unreferenced harmonic signal components if the convergence factor μ is small enough [25]. In this case, each part of the secondary path S i i ( e j · i · ω d i s t h ) can be identified by using the identification scheme described in Section 2.3.1.
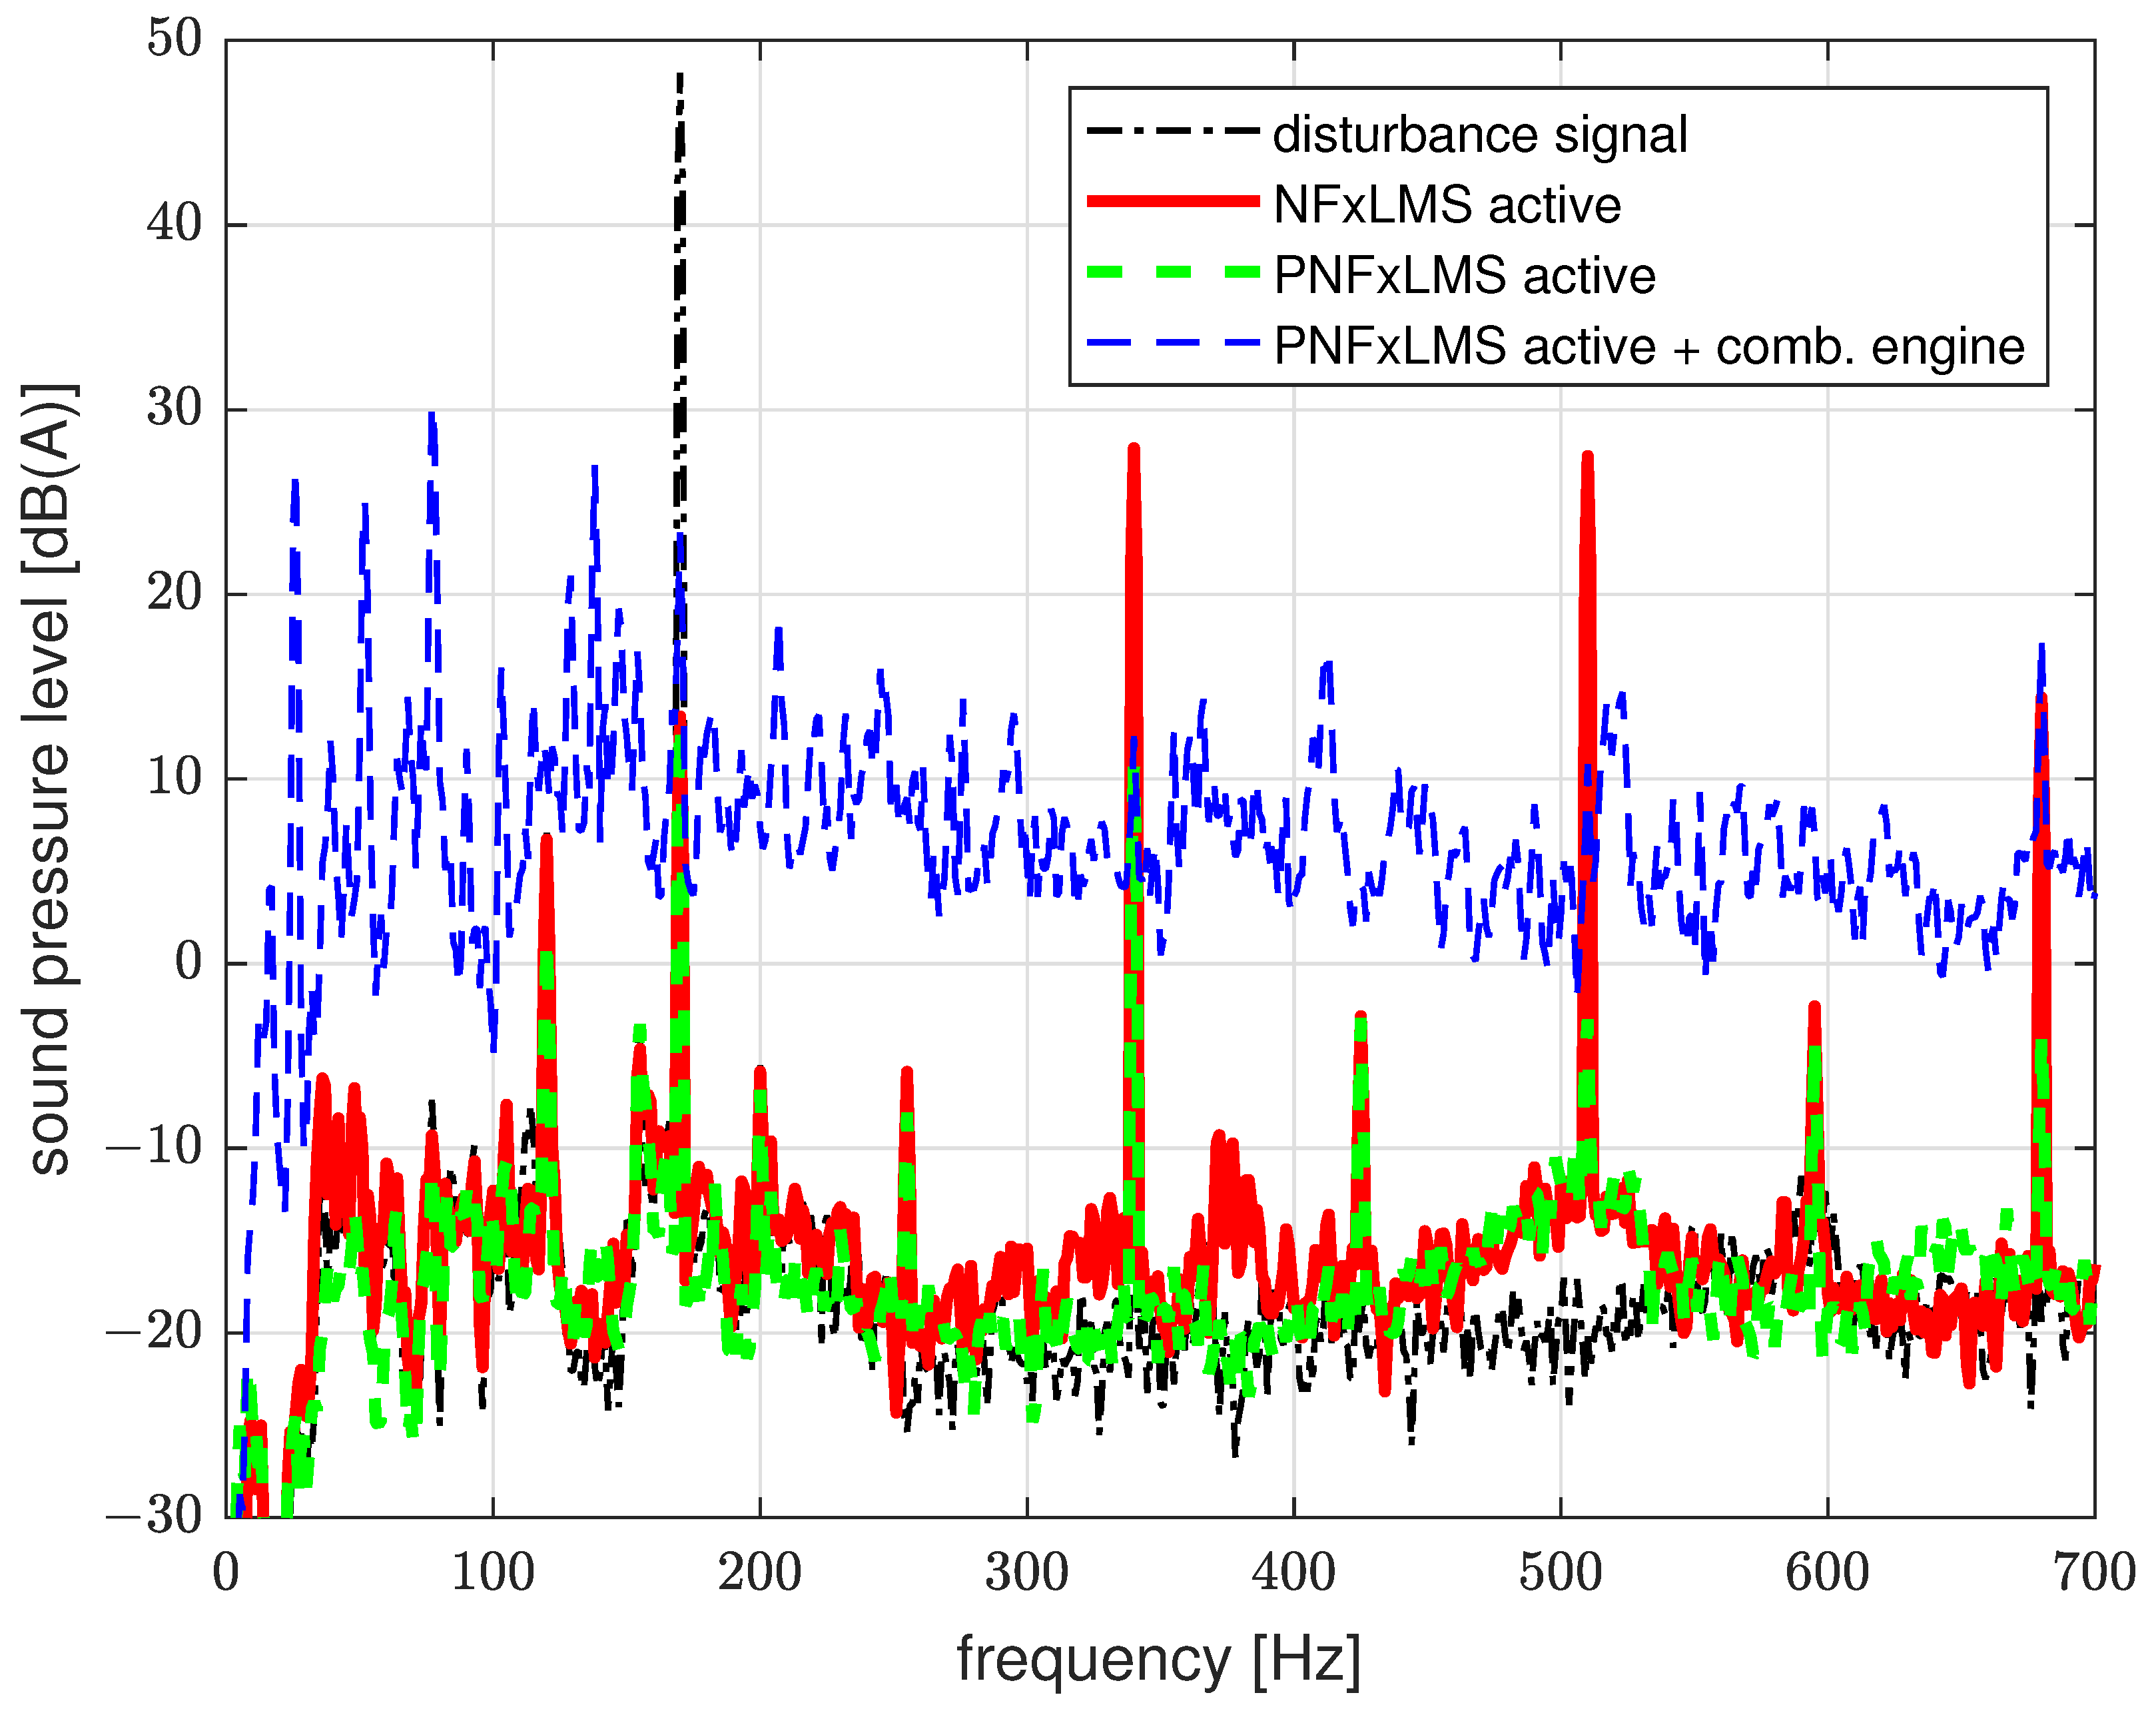
As can be seen in Figure 15, the higher harmonics can be clearly reduced by using the parallel form of the NFxLMS algorithm. It is not necessary to actively reduce more than four harmonics to improve the subjective acoustic impression at the driver’s ear since the electromechanical system of the test vehicle shows low pass characteristics.
This knowledge leads to two ways to deal with the harmonic distortion:
  • Dependency of the compensation level on the noise level: this can be more sensitive during traffic light phases, for example, than during highway driving and high interference levels. The noise level and the associated filter limitation could be implemented in a control unit in the form of a lookup table.
  • Compensation of the higher harmonics due to a parallel form of the FxLMS algorithm: several adaptive filters will be connected in parallel to reduce the dominating harmonics.

3. Results

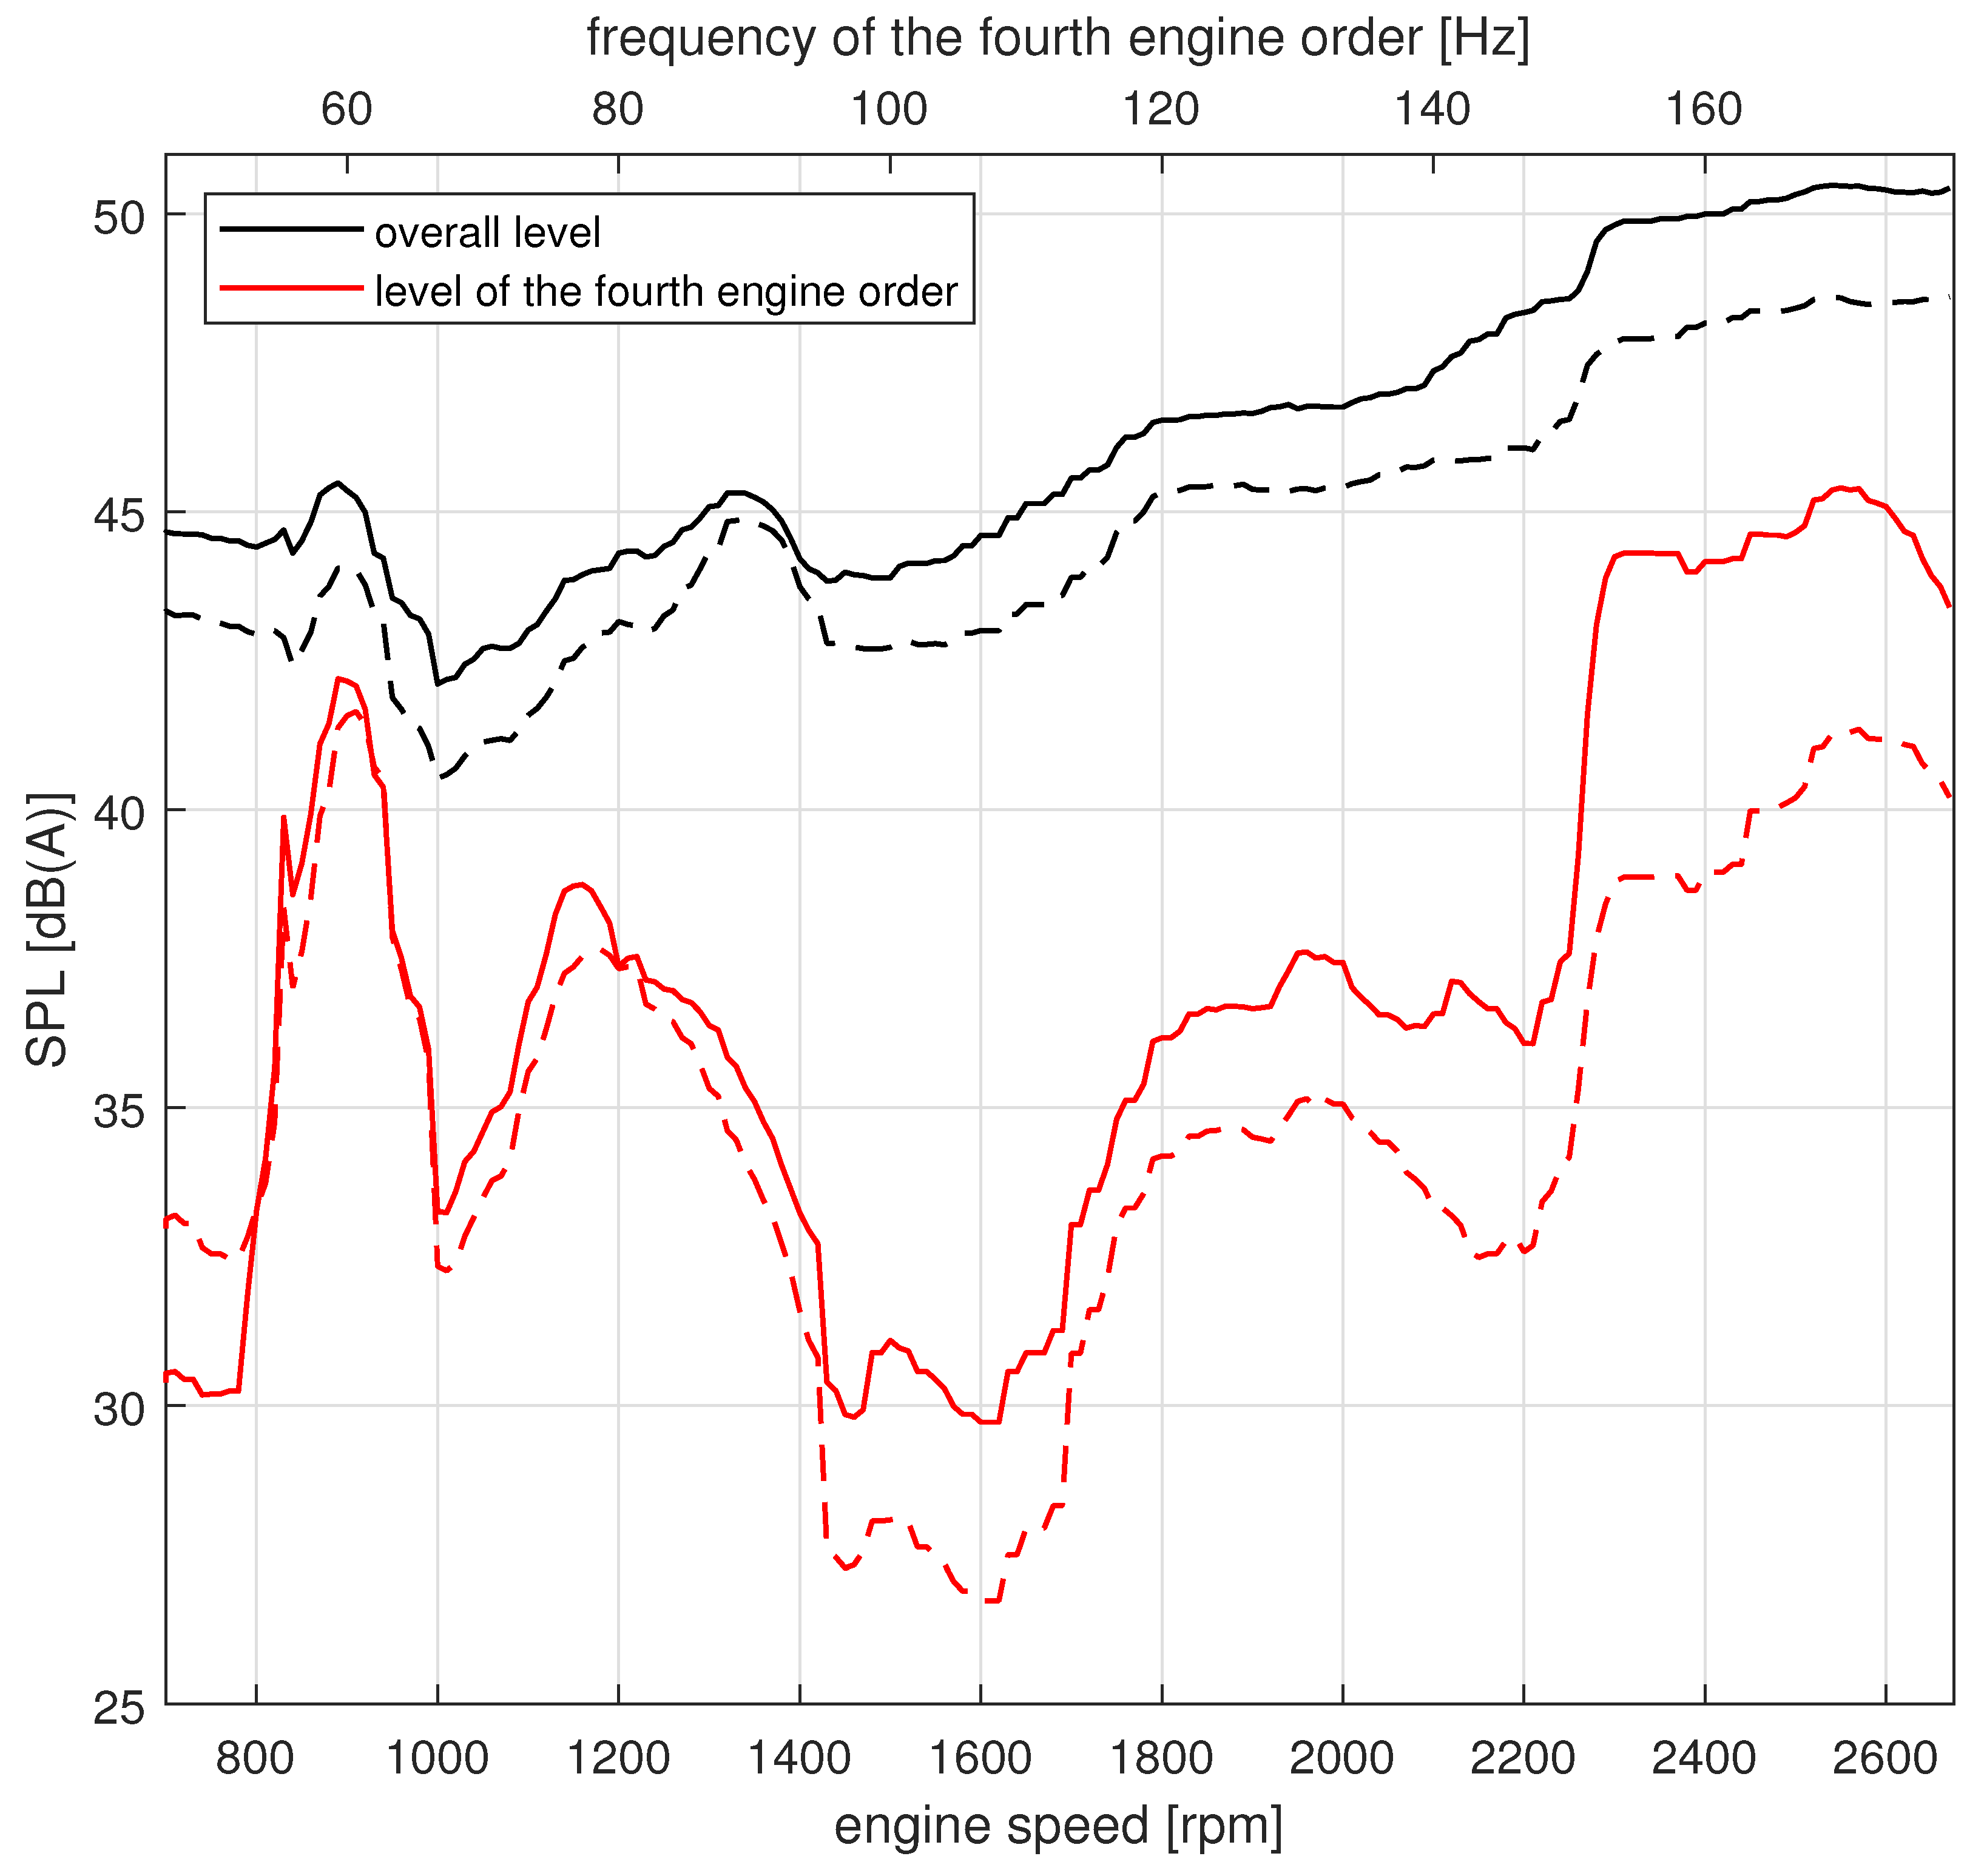
In this section, the ANC algorithm is investigated under real conditions, while the proposed active method is used to reduce the higher harmonics. In a first step, a synthetic disturbance source was used to excite the front axle carrier with a tonal vibration with constant frequency, which leads to an airborne noise disturbance in the driver’s cabin. The first case was to show the effectiveness of the ANC algorithm during a real steering situation. The second step was to reduce the harmonic disturbance signal of the combustion engine instead of the synthetic disturbance signal while the vehicle is not moving. Furthermore, the reduction in a real combustion engine disturbance was investigated at different positions in the driver’s cabin. The chosen frequencies of the disturbance signals were between 155 Hz and 175 Hz , as there is poor isolation in the acoustical transfer path from the disturbance source to the driver’s cabin, and so motor orders are clearly audible while the fourth order is dominant. This can be seen in Figure 16.

3.1. Constant Synthetic Disturbance Source

To create reproducible conditions, a modal shaker mounted at the front axle carrier (Figure 9) was used to excite the mechanical structure of the test vehicle with a constant harmonic vibration. This resulted in an airborne disturbance in the driver’s cabin. Therefore, it was possible to investigate disturbance noises, such as cavity noise (which naturally only occur at higher velocities of the passenger car) under laboratory conditions at slower speeds. This was necessary because the functional safety of the steering system, which is a safety-critical system, cannot be fully guaranteed with the control algorithm used for the EPS motor.
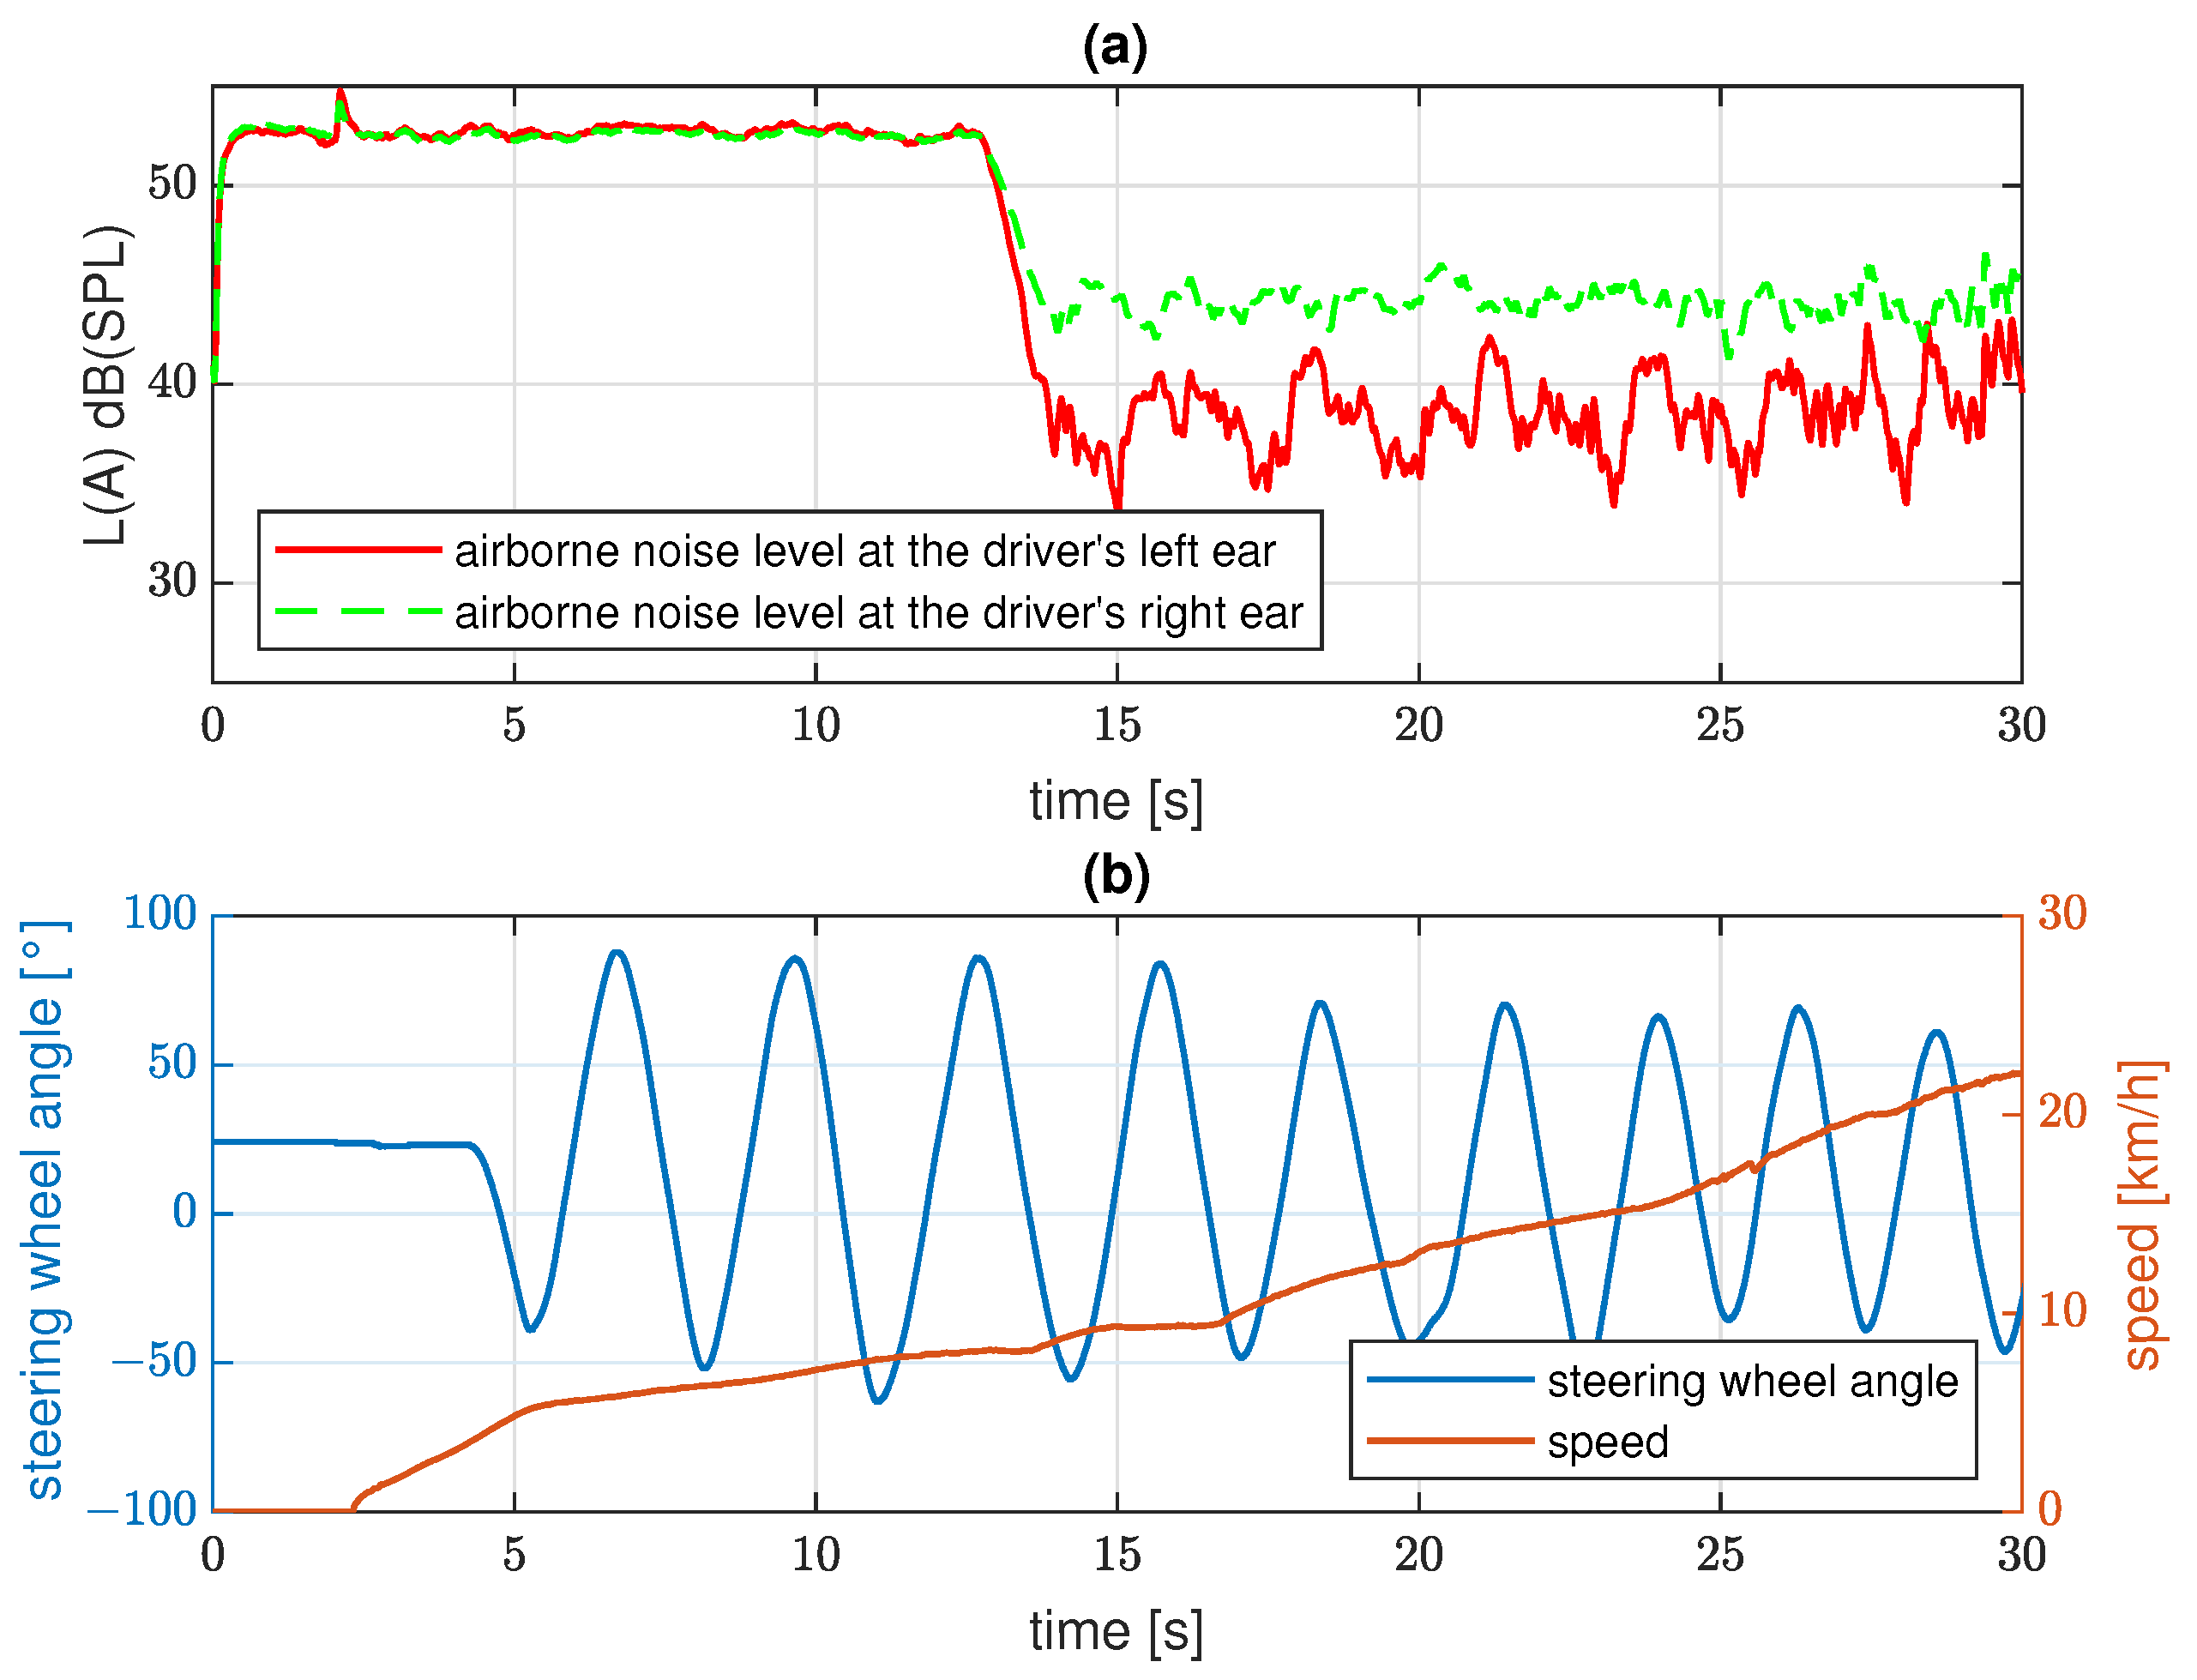
Figure 17a shows the airborne noise level at the driver’s ears. The measurement was performed using a headband microphone while reducing the instantaneous squared error at an error microphone placed at the headrest of the driver seat. The signal shown in Figure 17a was filtered with a bandpass filter with a center frequency of 170 Hz. At approximately 13 s, the ANC algorithm was switched on. It can clearly be seen that there was a significant reduction in the airborne noise level at both of the driver’s ears. This led to a considerable improvement in the subjective hearing experience, since the higher harmonics could be reduced with the described methods and there is a broadband acoustical masking due to the combustion engine and rolling noises. The reduction in the airborne noise level at the left ear was lower than the reduction at the right ear. This is because the error sensor was mounted on the left side of the headrest, and so the left headband microphone was closer to the error sensor. The experiment shows the effectiveness of the ANC algorithm during a real steering procedure. In Figure 17b, the actual vehicle speed as well as the steering wheel angle during the measurement procedure are illustrated.

3.2. Reduction in Combustion Engine Order

In the second case, the harmonic order of the real combustion engine was canceled using the ANC system. The number of revolutions of the engine was nearly constant at about 2380 rpm, which corresponds to about 40 Hz . At this frequency, the fourth order of the combustion engine is dominant. Figure 18 shows that the dominant order at the driver’s ears was clearly reduced using the ANC algorithm. The actual number of revolutions of the engine was read from a vehicle bus system to provide the actual frequency of the fourth engine order to the algorithm, while the sample frequency of the signal was 25 Hz . This is sufficient as the throttle position is constant for the described measurement.
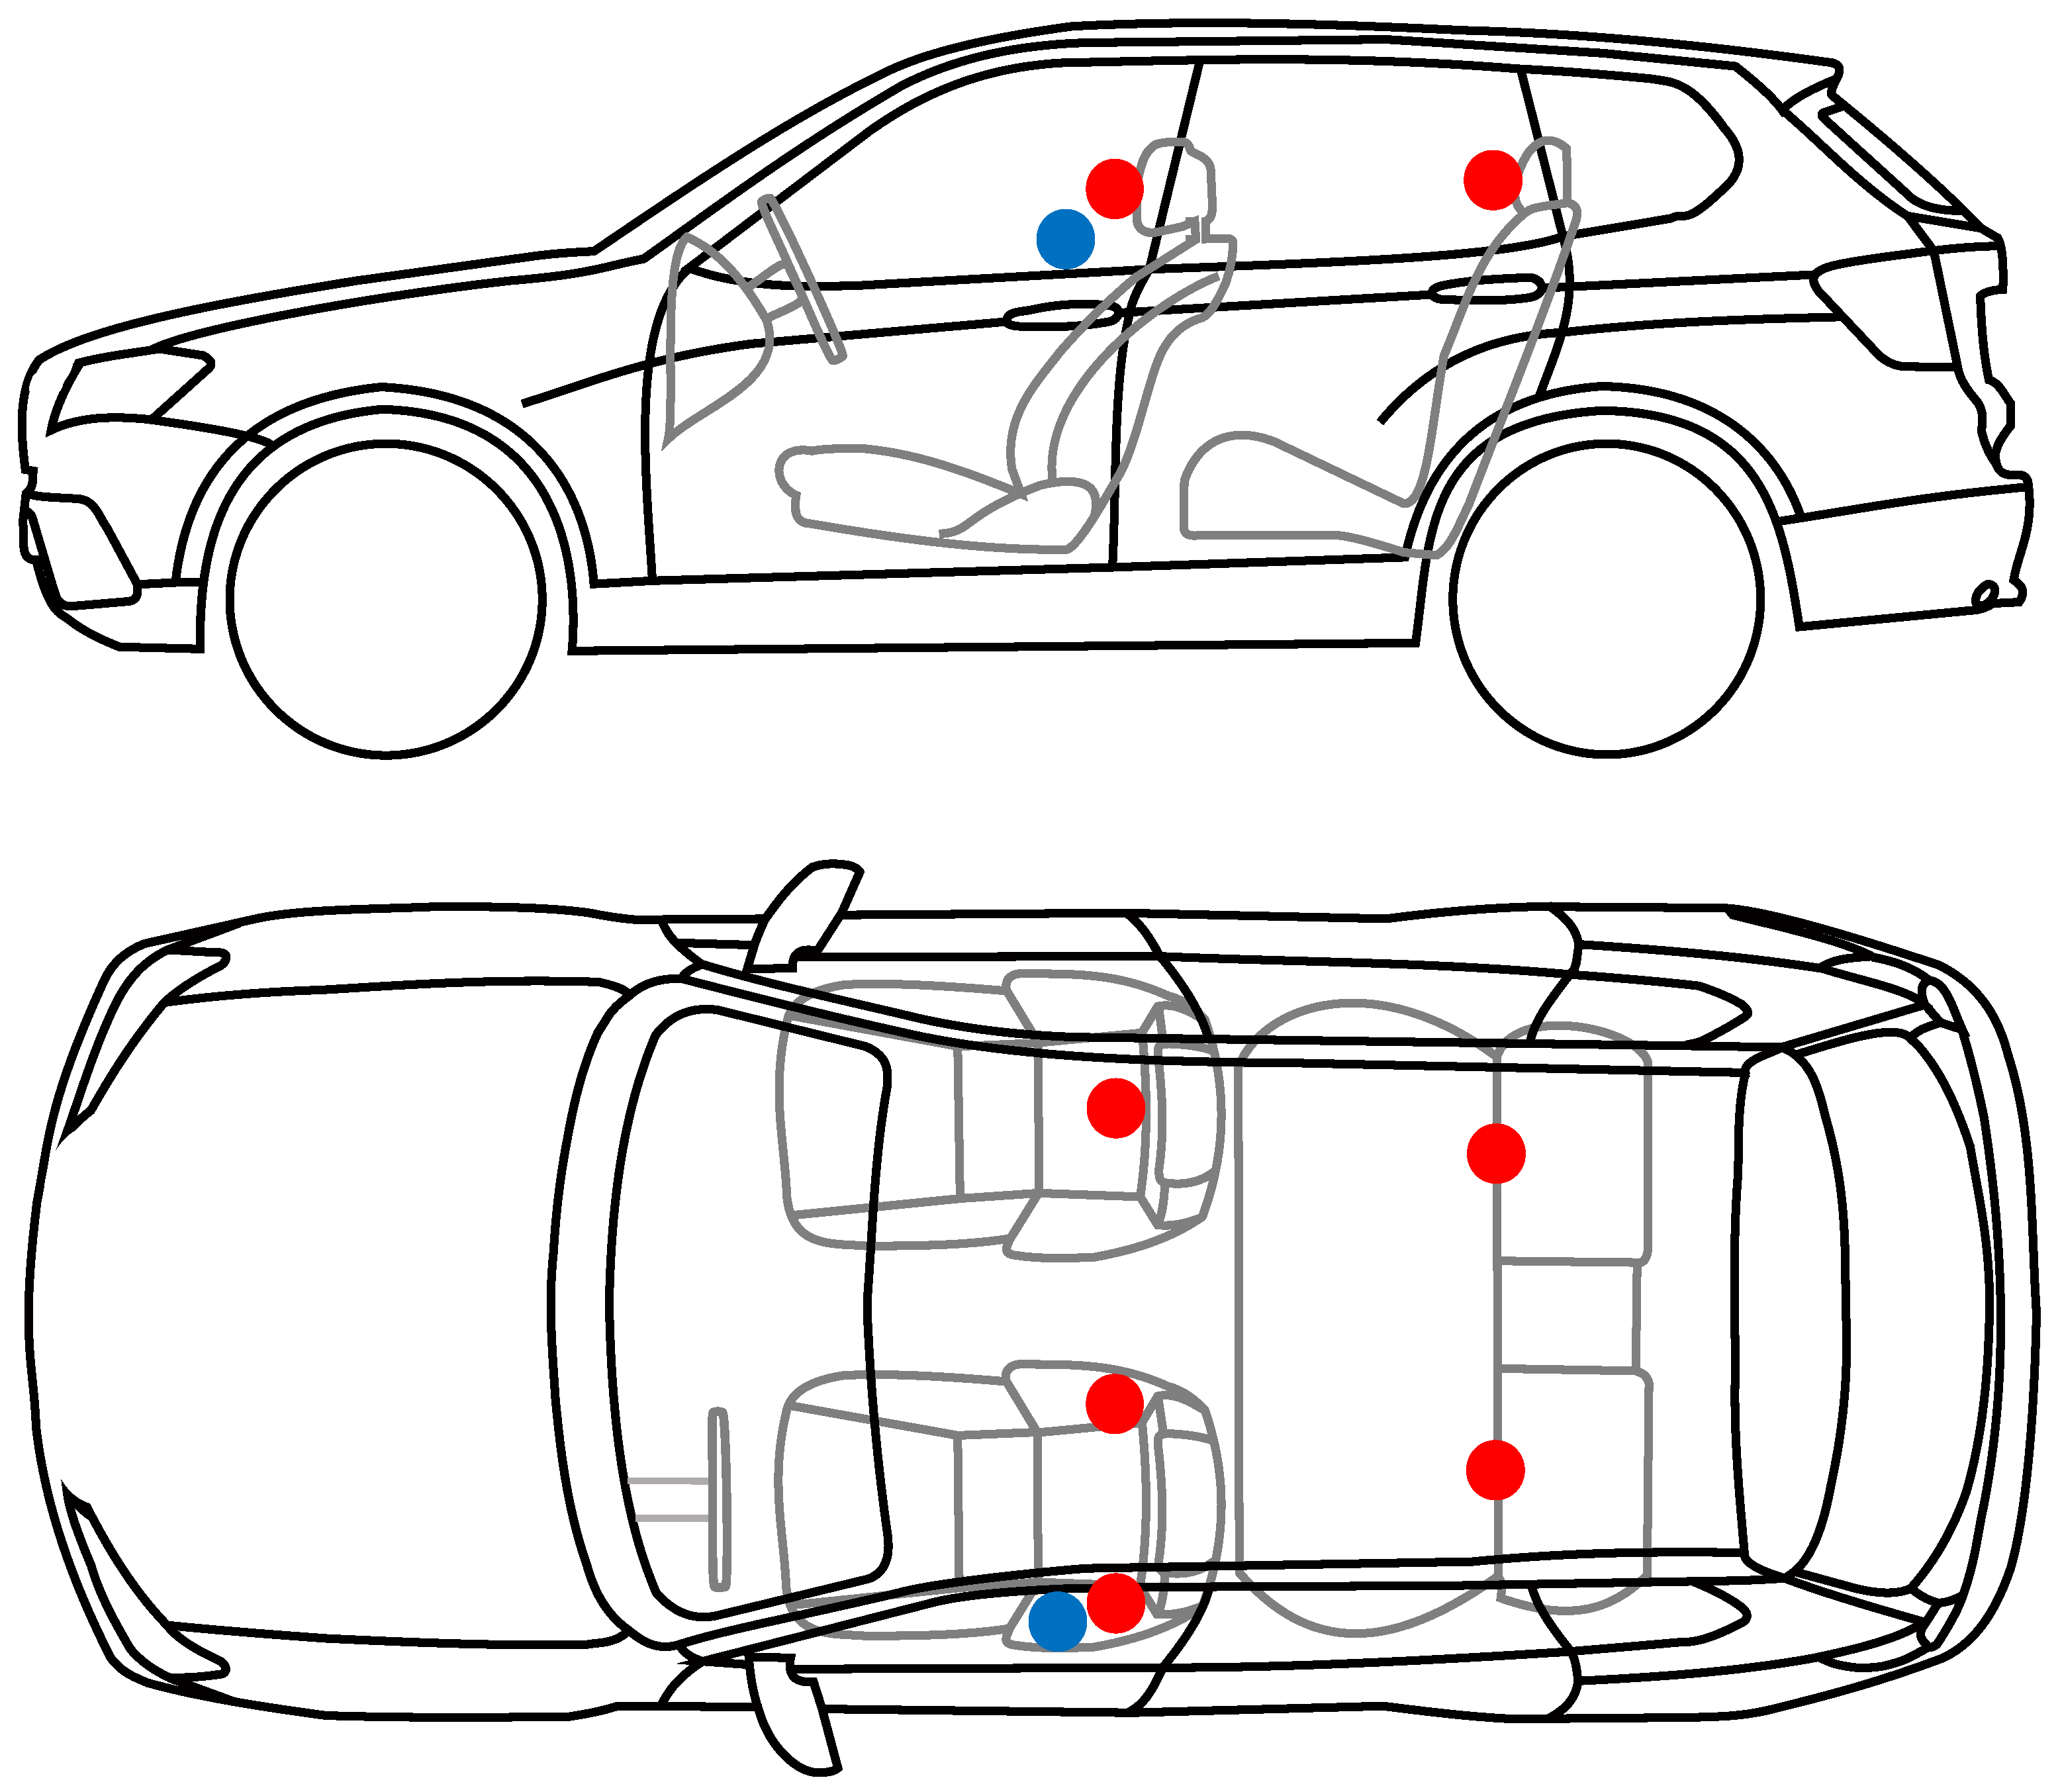
Sometimes, there are more people inside a car. Therefore, the airborne noise level was measured at different positions. For this purpose, microphones were installed on the four passenger seats (front left, front right, back left, back right) (Figure 19). The error signal was generated by just one microphone at the driver’s ear. There are two reasons to use only one of the microphones as an error sensor instead of using a combined error signal of the microphones at different position. First, the control structure is simpler when using only one sensor. The main reason is that additional sensors lead to an increase in the production costs of vehicles, and so the number of sensors was kept to a minimum here.
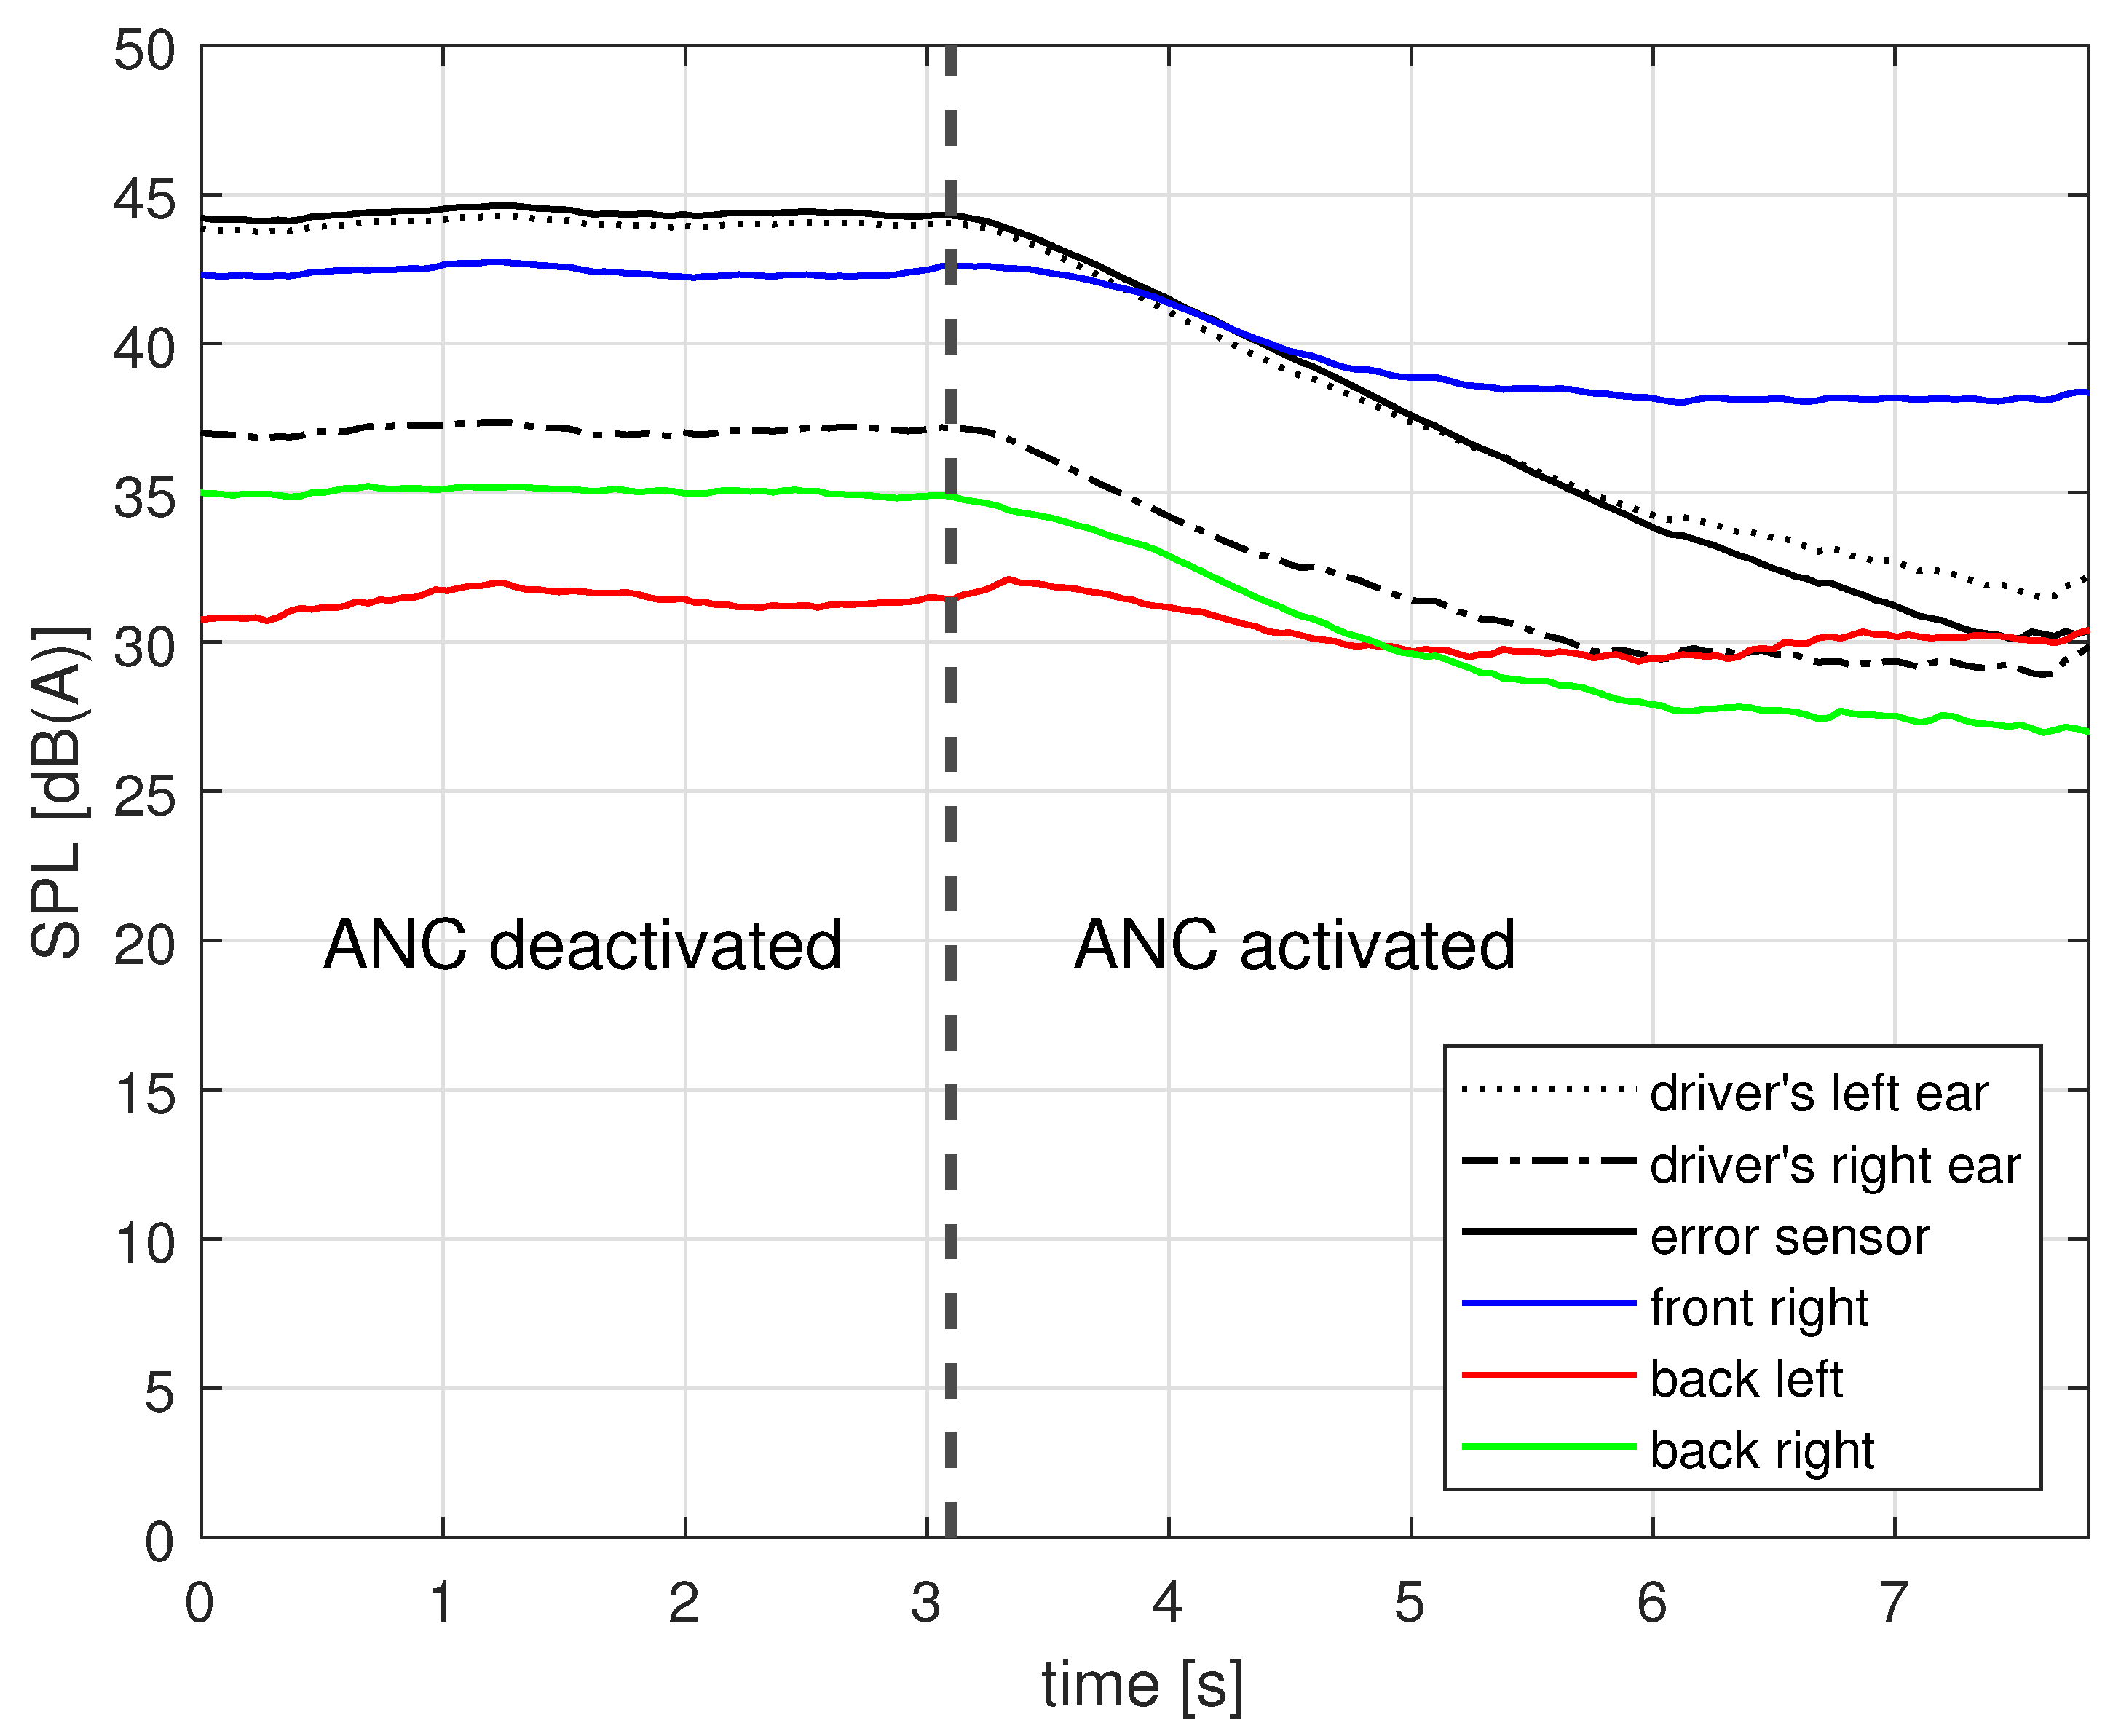
In Figure 20, the A-weighted sound pressure level (SPL) of the fourth order of the combustion engine at these positions is plotted.
Before closing the control loop, the considered engine order is clearly audible at every position, while the SPL is in the range from about 31 dB at the left side of the rear row of the seats up to about 44 dB at the driver’s left ear. It can be seen that there is a reduction at all positions. The highest reduction is visible at the error sensor and at the driver’s left ear. At the positions in the back part of the driver’s cabin, the sound pressure level of the fourth order of the combustion engine is lower than in the front part in general. While the reduction at the front seats is higher on the left position, the reduction at the back seats is higher on the right-hand side. Table 1 provides a short overview of the sound pressure level of the considered engine order. The averaged values for the closed control loop and for the open control loop are given along with the difference in both values. The overall result is positive, since there is a reduction in the fourth order of the combustion engine at every measured position in the interior of the test vehicle using only one error sensor and one compensation actuator.
Vibrations at the steering wheel are not subjectively perceptible at the magnitudes used here for the amplitude of the compensation signal at a frequency of 160 Hz due to the low-pass characteristic of the steering system. This was confirmed by several subjective tests.
It should be mentioned that a reduction in a disturbance noise at the location of the error sensor in other frequency ranges may lead to an increase in the disturbance noise at one or more measurement positions. For example, the reduction in the airborne noise level of the fourth engine order at an engine speed of about 2100 rpm at the chosen error sensor leads to an increase in the airborne noise level of the fourth engine order at the measurement position at the right passenger seat in the front part of the car. For this reason, in future studies, other sensor positions will be investigated to achieve a reduction in dominating orders of the combustion engine in a larger frequency range. Furthermore, the proposed method will be extended for transient engine speed by using an approach explained in [26]. Thus, the method proposed here can be extended to the reduction in transient noise.
This section shows that it is possible to use the EPS motor to reduce a harmonic disturbance from the combustion engine in the driver’s cabin. The next subsection deals with the power needed for the shown reduction and the increasing temperature as a result of the additional excitation of the EPS motor due to the ANC algorithm.

3.3. Energetic Considerations

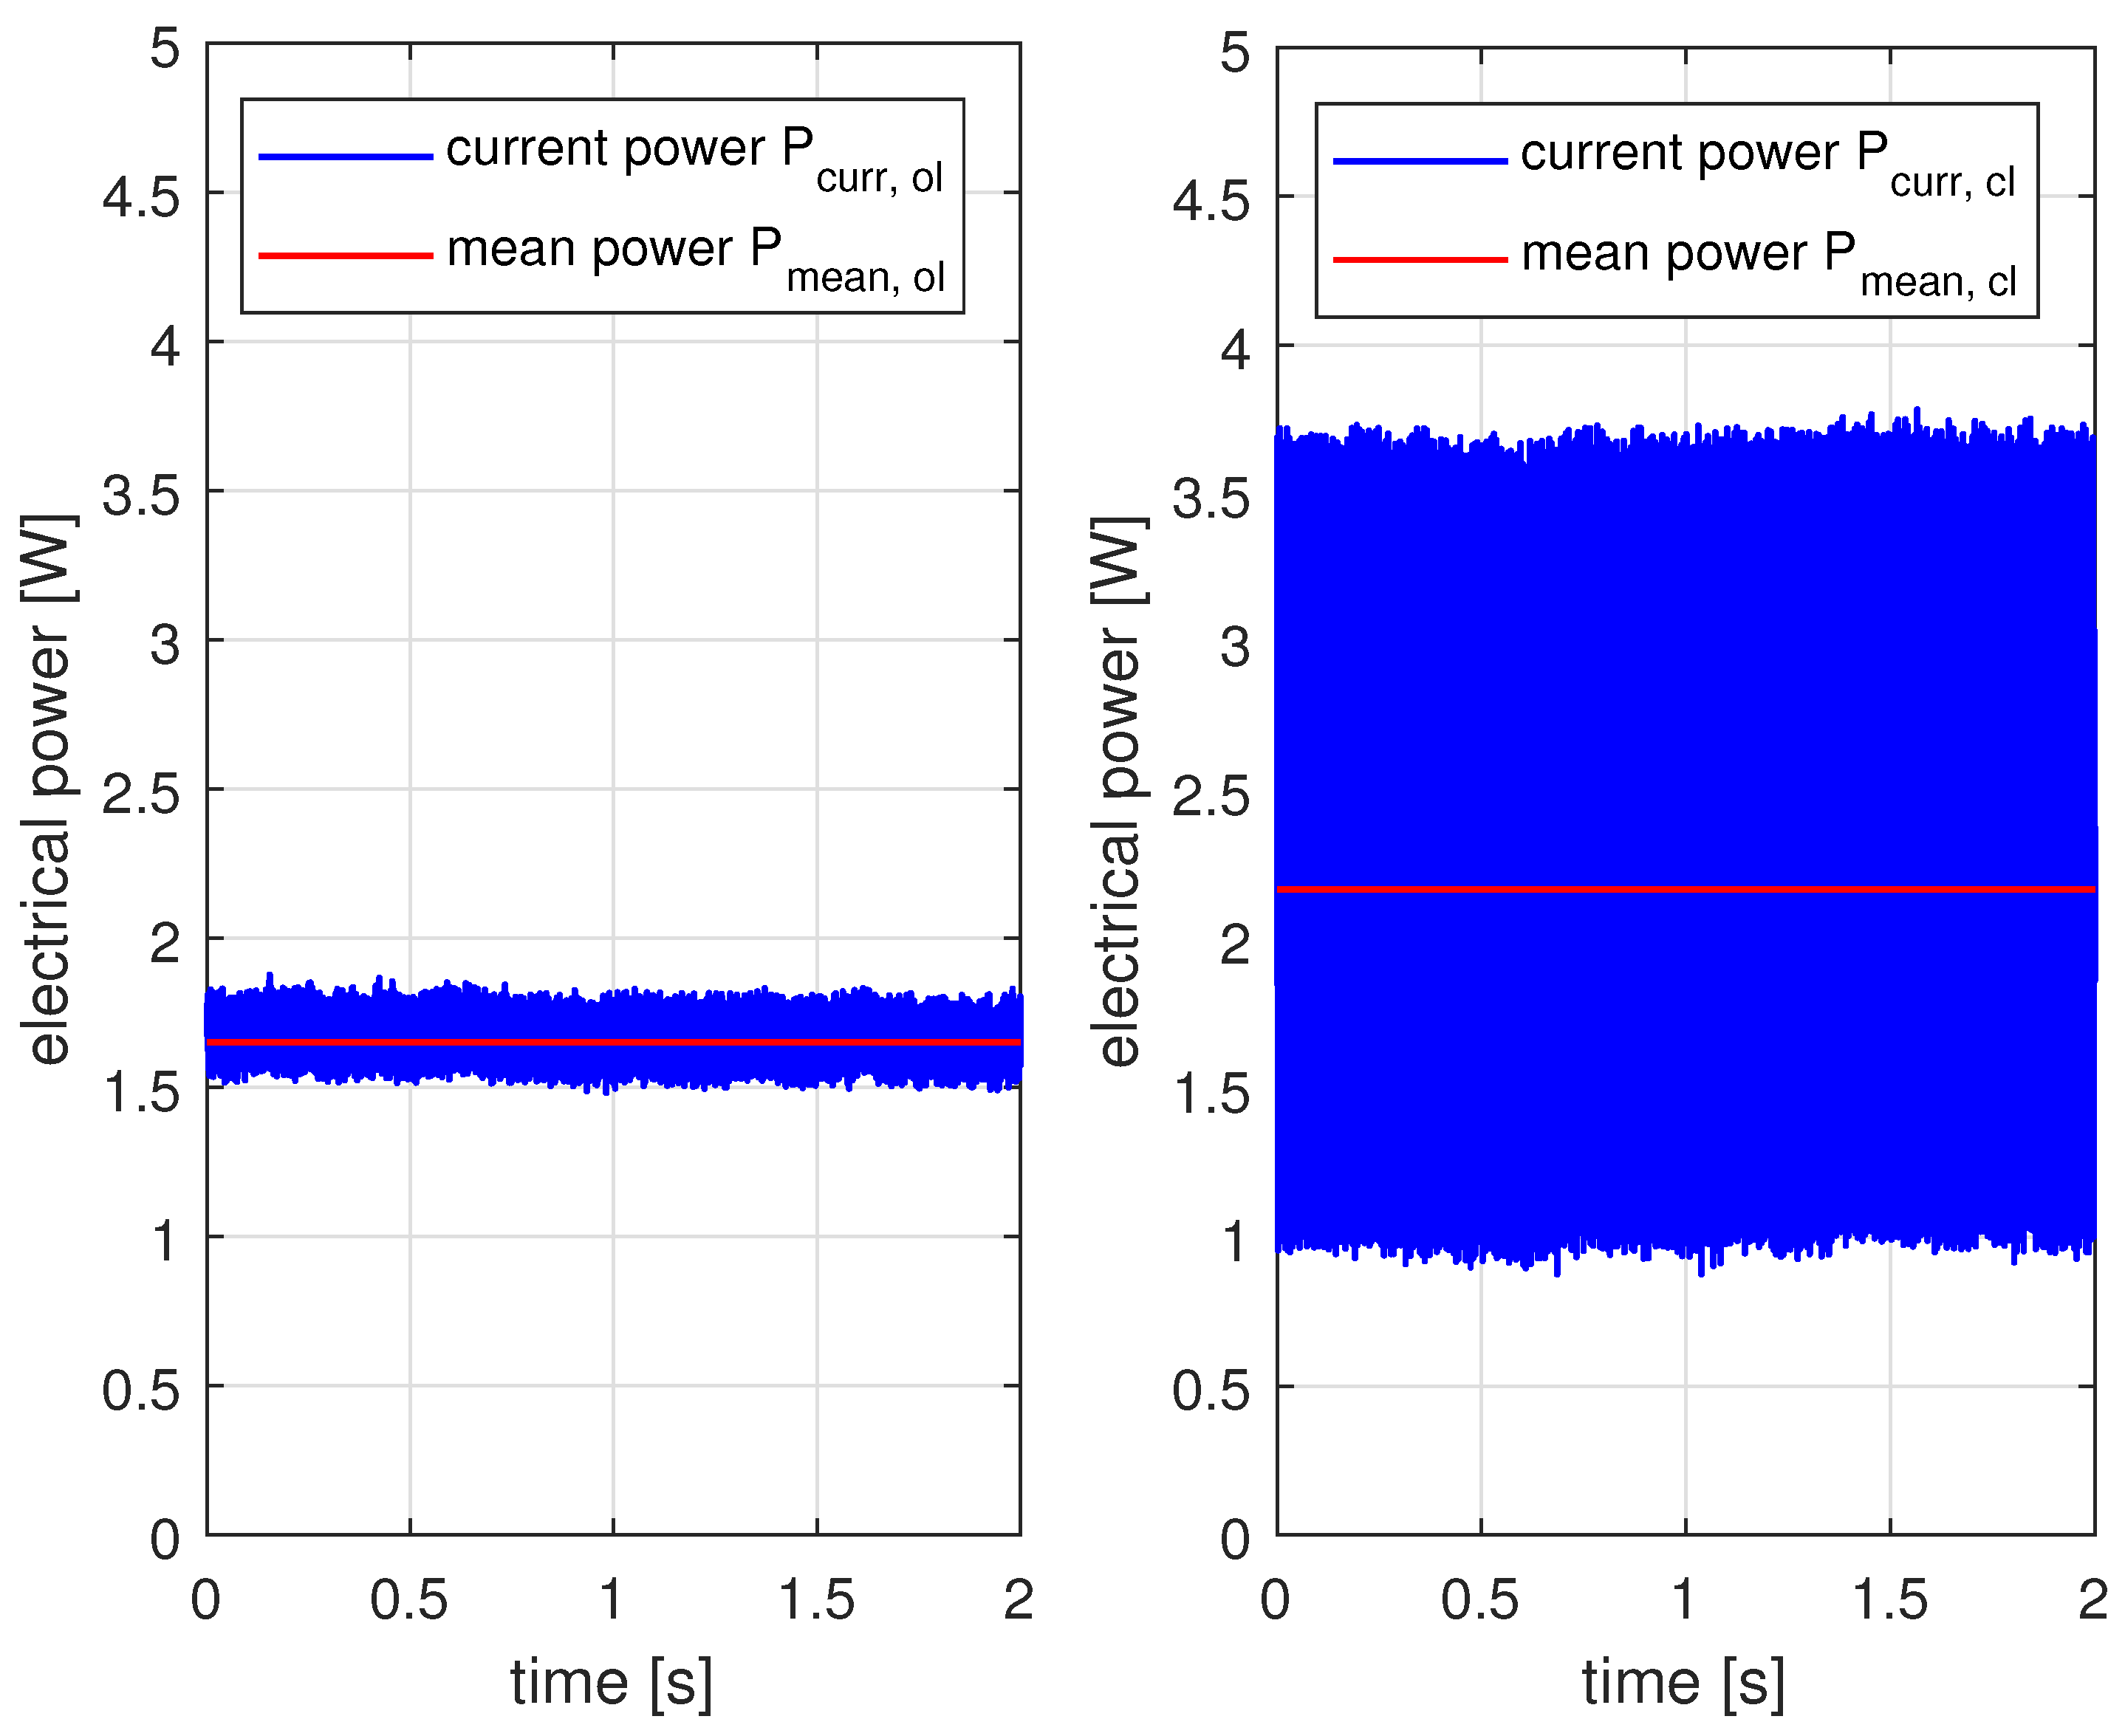
As it can be seen in Section 3.1, it is possible to reduce a harmonic disturbance of the combustion engine in the interior of a passenger car. The harmonic excitation of the EPS motor requires additional energy for the generation of the compensation signal. In this subsection, the energetic considerations are discussed. For this purpose, the current and the voltage were measured while reducing an order of the combustion engine as described in Section 3.1. As measurement quantities, the input current i i n v ( n ) as well as the voltage u i n v ( n ) at the connection terminals of the inverter board were chosen. To calculate the additional power, the measurement was performed in two steps. First, the quantities were measured while the ANC algorithm was deactivated (Figure 21, left). The second measurement was performed after the ANC algorithm had been activated and the filter coefficients had converged (Figure 21, right). The current power
P c u r r ( n ) = u i n v ( n ) · i i n v ( n )
and the mean power
P m e a n = 1 N · n = 1 N P c u r r ( n )
are plotted in Figure 21.
It can be seen that the additional required mean power due to the ANC algorithm is P a d d = P m e a n , c l P m e a n , o l = 2.17 W 1.65 W = 0.52 W , where P m e a n , o l is the mean power without the ANC algorithm and P m e a n , c l is the mean power after the filter weights of the ANC algorithm have converged.
A procedure as described below was chosen to investigate the impact on the surface temperature of the EPS motor due to the additional excitation by the ANC algorithm:
  • The procedure described in the previous section is used to determine the amplitude of the ANC algorithm needed to cancel the order of the combustion engine. After the ANC algorithm has converged, the values of the constant filter weights are stored. The output amplitude can be calculated using Equation (6).
  • To eliminate the thermal impact due to the combustion engine, the ANC algorithm is replaced by a harmonic signal with the calculated amplitude and a constant frequency. Therefore, it is possible to stimulate the motor with a realistic signal without using an error signal.
  • Since the ambient temperature is also not constant and to obtain an identical dynamic behavior of the temperature without the ANC function, a second EPS motor of the same type is placed near the stimulated one, while the surface temperature is also measured.
The results are shown in Figure 22. The surface temperature of the stimulated EPS motor as well as the ambient temperature can be seen. The resulting temperature increase due to the additional excitation is calculated by subtracting the ambient temperature from the surface temperature of the compensation actuator. It can be seen that the temperature rise due to the ANC function is about 1.3 K after 3 h.

4. Conclusions

The aim of this study was to conduct a feasibility analysis of using an EPS motor for ANC applications under real conditions. The ANC function, which is based on the narrowband FxLMS algorithm, was executed in addition to the primary function by the EPS motor. A feedforward structure was used in order to avoid influence on the performance and stability of the steering control system. Higher harmonics resulting from nonlinearities in the acoustic transfer path could be reduced by using different methods. As one method, the filter weights and thus the amplitude of the output signal were limited. As a second method, a parallel form of the narrowband FxLMS was used. It is shown that it is possible to reduce a synthetic harmonic disturbance noise with a constant frequency generated by a shaker mounted at the front axle carrier during a real steering situation in the driver’s cabin. Furthermore, an order of the combustion engine at a nearly constant engine speed was reduced, while the additional required mean power was 0.52 W and the increase in the temperature was only 1.3 K after 3 h. Due to the low power consumption and the already installed hardware in most modern passenger cars, except for the error sensor, it is possible to use the proposed method to improve the NVH characteristics of a passenger car in an economic way.
Future studies will focus on the reduction of time-varying harmonic disturbances of the combustion engine. Therefore, it is necessary to measure the frequency and the angle of the combustion engine accurately, and the nonlinear transfer path of the EPS system has to be known in a larger frequency range. Further investigations will be conducted to obtain an accurate model of the linear and nonlinear behaviors of the EPS system within the required frequency range. It is also planned to use acceleration sensors placed at the structure of the vehicle instead of the error microphone in the driver’s cabin.

Author Contributions

Conceptualization, D.S., S.H. and S.S.; methodology, D.S. and S.H.; software, D.S.; validation, D.S., S.H., S.S. and M.B.; formal analysis, D.S.; investigation, D.S.; resources, S.H. and S.S.; data curation, D.S.; writing—original draft preparation, D.S.; writing—review and editing, D.S. and S.H.; visualization, D.S.; supervision, S.H., S.S. and M.B.; project administration, S.H. and S.S.; funding acquisition, S.H. and S.S. All authors have read and agreed to the published version of the manuscript.

Funding

This work was funded by the Bavarian State Ministry of Economic Affairs, Regional Development and Energy (StMWi) as part of the “ELSYS Bayern” program.

Data Availability Statement

The data presented in this study are available in the article.

Acknowledgments

The authors would like to thank Dirk Hirschmann for the support he provided by commissioning the FOC and the motor controller. A special thanks goes to Florian Schaschko and Leonhard Angerpointner, who performed a large part of the software implementation. Moreover, we would like to thank Matthias Becker, Fabian Ebner, Anian Brosch, and Marcus Becker for the hardware integration in the test vehicle.

Conflicts of Interest

The authors declare no conflicts of interest.

Abbreviations

The following abbreviations are used in this manuscript:
ANCActive Noise Cancellation
NVHNoise, Vibration, Harshness
EPSElectrical Power Steering
PMSMPermanent Magnet Synchronous Machine
FIRFinite Impulse Response
LMSLeast Mean Squares
FxLMSFiltered-x Least Mean Squares
NFxLMSNarrowband Filtered-x Least Mean Squares
PNFxLMSParallel Narrowband Filtered-x Least Mean Squares
FOCField Oriented Control
ECUElectrical Control Unit
PWMPulse Width Modulation
SVMSpace Vector Modulation
IEPEIntegrated Electronics Piezo Electric

References

  1. Wolf, A.; Portal, E. Requirements to Noise Reduction Concepts and Parts in Future Engine Compartments. In SAE Technical Paper Series; SAE International: Warrendale, PA, USA, 2000. [Google Scholar] [CrossRef]
  2. Hausberg, F.; Scheiblegger, C.; Pfeffer, P.; Plöchl, M.; Hecker, S.; Rupp, M. Experimental and analytical study of secondary path variations in active engine mounts. J. Sound Vib. 2014, 340, 22–38. [Google Scholar] [CrossRef]
  3. Bohn, C.; Cortabarria, A.; Härtel, V.; Kowalczyk, K. Active control of engine-induced vibrations in automotive vehicles using disturbance observer gain scheduling. Control Eng. Pract. 2004, 12, 1029–1039. [Google Scholar] [CrossRef]
  4. Schubert, D.; Henneberger, R.; Hecker, S.; Sentpali, S.; Marburg, S. Active Noise Cancellation in Passenger Cars using the Electrical Power Steering Motor. In Proceedings of the 2017 IEEE Conference on Control Technology and Applications (CCTA), Maui, HI, USA, 27–30 August 2017; pp. 255–260. [Google Scholar] [CrossRef]
  5. Widrow, B.; McCool, J.; Ball, M. The Complex LMS Algorithm. In Proceedings of the IEEE; IEEE: Piscataway, NJ, USA, 1975. [Google Scholar] [CrossRef]
  6. Morgan, D. An Analysis of Multiple Correlation Cancellation Loops with a Filter in the Auxiliary Path. IEEE Trans. Acoust. Speech Signal Process. 1980, 28, 454–467. [Google Scholar] [CrossRef]
  7. Widrow, B.; Walach, E. Adaptive Inverse Control: A Signal Processing Approach, Reissue Edition; IEEE Press Series on Power Engineering; IEEE Press Wiley-Interscience and IEEE Xplore: Piscataway, NJ, USA, 2008. [Google Scholar]
  8. Burgess, J.C. Active adaptive sound control in a duct: A computer simulation. J. Acoust. Soc. Am. 1981, 70, 715–726. [Google Scholar] [CrossRef]
  9. Kuo, S.M.; Morgan, D.R. Active Noise Control Systems: Algorithms and DSP Implementations; A Wiley-Interscience Publication; Wiley: New York, NY, USA, 1996. [Google Scholar]
  10. Elliott, S.J. Signal Processing for Active Control; Academic Press: San Diego, CA, USA, 2005. [Google Scholar]
  11. Hillis, A.J. Multi-input multi-output control of an automotive active engine mounting system. Proc. Inst. Mech. Eng. Part D J. Automob. Eng. 2011, 225, 1492–1504. [Google Scholar] [CrossRef]
  12. Bao, C.; Sas, P.; van Brussel, H. Comparison of two-on-line identification algorithms for active noise control. In Proceedings of the 2nd Conference on Recent Advances in Active Control of Sound and Vibration, Blacksburg, VA, USA, 1 January 1993; pp. 38–54. [Google Scholar]
  13. van der Broeck, H.W.; Skudelny, H.C.; Stanke, G.V. Analysis and Realization of a Pulsewidth Modulator Based on Voltage Space Vectors. IEEE Trans. Ind. Appl. 1988, 24, 142–150. [Google Scholar] [CrossRef]
  14. Widrow, B.; Hoff, M.E. Adaptive Switching Circuits. In Proceedings of the 1960 IRE WESCON Convention Record, Part 4, Los Angeles, CA, USA, 23–26 August 1960; pp. 96–104. [Google Scholar]
  15. Morgan, D.R.; Sanford, C. A Control Theory Approach to the Stability and Transient Analysis of the Filtered-X LMS Adaptive Notch Filter. IEEE Trans. Signal Process. 1992, 40, 2341–2346. [Google Scholar] [CrossRef]
  16. Snyder, S.D.; Hansen, C.H. The Influence of Transducer Transfer Functions and Acoustic Time Delays on the Implementation of the LMS Algorithm in Active Noise Control Systems. J. Sound Vib. 1990, 141, 409–424. [Google Scholar] [CrossRef]
  17. Elliott, S.; Stothers, I.; Nelson, P. A Multiple Error LMS Algorithm and Its Application to the Active Control of Sound and Vibration. IEEE Trans. Acoust. Speech Signal Process. 1987, 35, 1423–1434. [Google Scholar] [CrossRef]
  18. Rupp, M.; Sayed, A.H. Robust FxLMS Algorithms with Improved Convergence Performance. IEEE Trans. Speech Audio Process. 1998, 6, 78–85. [Google Scholar] [CrossRef]
  19. Hansen, C.H. Active Control of Noise and Vibration, 2nd ed.; CRC Press Taylor & Francis Group: Boca Raton, FL, USA, 2012. [Google Scholar]
  20. Qiu, X.; Hansen, C.H. A study of time-domain FXLMS algorithms with control output constraint. J. Acoust. Soc. Am. 2001, 109, 2815–2823. [Google Scholar] [CrossRef] [PubMed]
  21. Lan, H.; Zhang, M.; Ser, W. A Weight-Constrained FxLMS Algorithm for Feedforward Active Noise Control Systems. IEEE Signal Process. Lett. 2002, 9, 1–4. [Google Scholar] [CrossRef]
  22. Belicchi, C.; Opinto, A.; Martalo, M.; Tira, A.; Pinardi, D.; Farina, A.; Ferrari, G. ANC: A Low-Cost Implementation Perspective. In SAE Technical Paper Series 2022; SAE International: Warrendale, PA, USA, 2022. [Google Scholar] [CrossRef]
  23. Sutton, T.J.; Elliott, S.J. Active Attenuation of Periodic Vibration in Nonlinear Systems Using an Adaptive Harmonic Controller. J. Vib. Acoust. 1995, 117, 355. [Google Scholar] [CrossRef]
  24. Blondel, L.A.; Elliott, S.J. Electropneumatic Transducers as Secondary Actuators for Active Noise Control. Part III: Experimental Control in Ducts with the Subsonic Source. J. Sound Vib. 1999, 219, 451–481. [Google Scholar] [CrossRef]
  25. Kuo, S.M.; Ji, M. Passband Disturbance Reduction in Periodic Active Noise Control Systems. IEEE Trans. Speech Audio Process. 1996, 4, 96–103. [Google Scholar] [CrossRef]
  26. Hausberg, F.; Plöchl, M.; Rupp, M.; Pfeffer, P.; Hecker, S. Combination of map-based and adaptive feedforward control algorithms for active engine mounts. J. Vib. Control 2016, 23. [Google Scholar] [CrossRef]
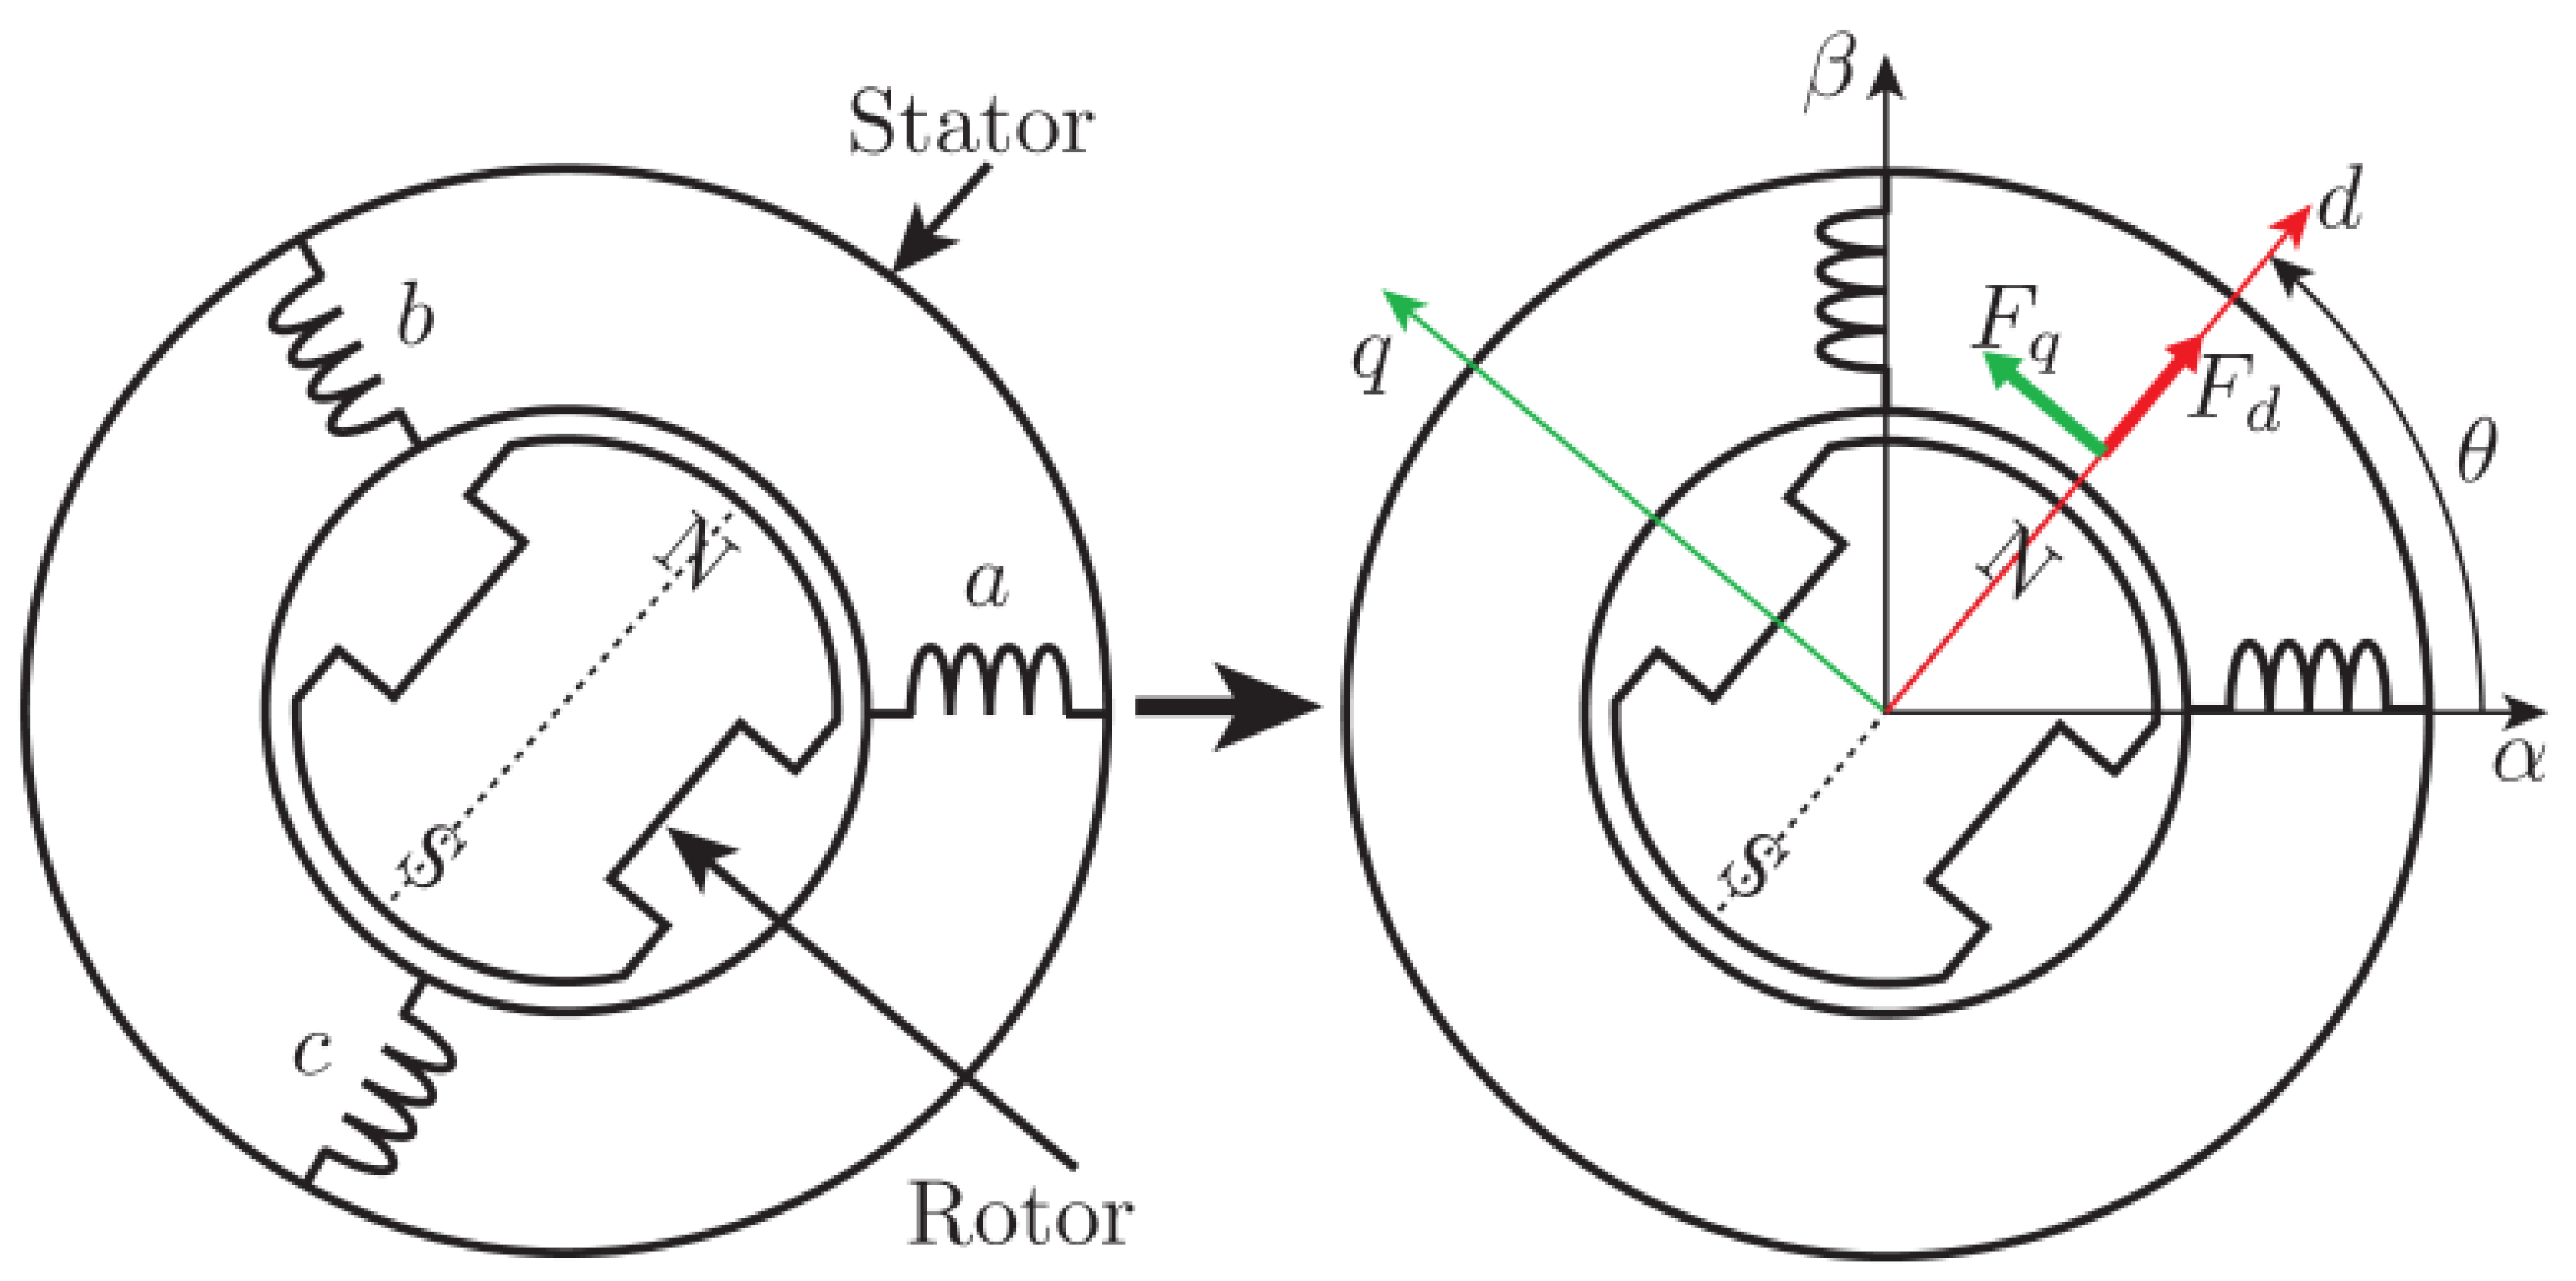
Figure 1. Basic principle of the FOC [4] (©2017 IEEE).
Acoustics 06 00040 g001
Figure 2. Control loop in d / q plane. Blue box: model of the electrical subsystem of the PMSM. Green boxes: decoupling network.
Acoustics 06 00040 g002
Figure 3. Schematic overview of the experimental setup. i * is the output of the ANC Algorithm. Red box: Measurement device.
Acoustics 06 00040 g003
Figure 4. Block diagram of the NFxLMS algorithm to reduce a tonal disturbance signal d ( n ) .
Acoustics 06 00040 g004
Figure 5. Phase information of the secondary path in a temperature range of the combustion engine from 30 to 85 degrees Celsius. Green bar: minimum value of the identified phases. Black bar: median value of the identified phases. Red bar: maximum value of the identified phases.
Acoustics 06 00040 g005
Figure 6. Identified secondary plant with and without running combustion engine.
Acoustics 06 00040 g006
Figure 7. Block diagram of the NFxLMS algorithm for online system identification.
Acoustics 06 00040 g007
Figure 8. Sound pressure level (SPL), A−weighted at right driver ear. Black line: only disturbance signal (170 Hz). Red line: active NFxLMS [4] (©2017 IEEE).
Acoustics 06 00040 g008
Figure 9. Location of the shaker in the test vehicle.
Acoustics 06 00040 g009
Figure 10. Auto power spectrum of the motor housing acceleration (radial component) during sine sweep stimulation. Abscissa: Actual sine sweep frequency (lin. scale). Ordinate: Frequency of the acceleration (log. scale). Applicate: Acceleration amplitude given by different colors (see bottom line).
Acoustics 06 00040 g010
Figure 11. Experimental confirm all. setup: PMSM (2), shaker (3), and acceleration sensor (4) attached to the mounting plate (1).
Acoustics 06 00040 g011
Figure 12. Error sensor signal e ( n ) over filter weight amplitude limitation A m a x . Left: compensation of a 160 Hz disturbance signal. Right: compensation of a 200 Hz disturbance signal. Z e r o means no filter performance. The fundamental signal and the harmonics are bandpass filtered with a bandwidth of 10 Hz .
Acoustics 06 00040 g012
Figure 13. Block diagram of the parallel narrowband FxLMS with N parallel ANC controllers (see Figure 4).
Acoustics 06 00040 g013
Figure 14. Block diagram of the decentralized parallel narrowband FxLMS.
Acoustics 06 00040 g014
Figure 15. SPL, A-weighted at driver’s ears. Red line: active NFxLMS (170 Hz). Green line: active PNFxLMS. Blue line: active PNFxLMS + combustion engine at 800 rpm.
Acoustics 06 00040 g015
Figure 16. A-weighted sound pressure level at the driver’s ear over the speed of the combustion engine. Solid line: left ear. Dashed line: right ear.
Acoustics 06 00040 g016
Figure 17. ANC during sinusoidal change in the steering wheel angle and increasing vehicle speed. (a) Sound pressure level at the driver’s ears. (b) Vehicle speed (red) and steering wheel angle (blue).
Acoustics 06 00040 g017
Figure 18. ANC of the fourth order of the combustion engine at the driver’s ears.
Acoustics 06 00040 g018
Figure 19. Measurement positions in the test vehicle. Red dots: measurement positions. Blue dot: error sensor for the ANC algorithm.
Acoustics 06 00040 g019
Figure 20. Sound pressure level of the fourth order of the combustion engine while activating the ANC algorithm at about 3 s.
Acoustics 06 00040 g020
Figure 21. Electrical power required by the EPS motor and inverter board. Left: ANC algorithm deactivated. Right: ANC algorithm activated.
Acoustics 06 00040 g021
Figure 22. Temperature rise of the EPS motor surface due to the activated ANC function.
Acoustics 06 00040 g022
Table 1. Averaged amplitude reduction of the fourth order of the combustion engine at several passenger positions.
PositionANC DeactivatedANC ActivatedReduction
error sensor44.4 dB(A)29.6 dB(A)14.8 dB(A)
driver’s seat
left44.1 dB(A)31.8 dB(A)12.3 dB(A)
right37.3 dB(A)29.9 dB(A)7.4 dB(A)
front right42.5 dB(A)38.4 dB(A)4.1 dB(A)
back left31.4 dB(A)31.1 dB(A)0.3 dB(A)
back right35.0 dB(A)26.1 dB(A)8.9 dB(A)
Disclaimer/Publisher’s Note: The statements, opinions and data contained in all publications are solely those of the individual author(s) and contributor(s) and not of MDPI and/or the editor(s). MDPI and/or the editor(s) disclaim responsibility for any injury to people or property resulting from any ideas, methods, instructions or products referred to in the content.