Article

Measurement and Simulation of the Propagation of Impulsive Acoustic Emission Sources in Pipes

by
Chika Judith Abolle-Okoyeagu
1,*,
Samuel Fatukasi
1 and
Bob Reuben
2
1
School of Engineering, Robert Gordon University, Garthdee Road, Aberdeen AB10 7GJ, UK
2
School of Engineering and Physical Sciences, Heriot-Watt University, Edinburgh EH14 4AS, UK
*
Author to whom correspondence should be addressed.
Acoustics 2024, 6(3), 620-637; https://doi.org/10.3390/acoustics6030034
Submission received: 29 April 2024 / Revised: 5 June 2024 / Accepted: 20 June 2024 / Published: 30 June 2024
(This article belongs to the Special Issue Duct Acoustics)

Abstract

:
Acoustic Emission (AE) testing is a non-destructive evaluation technique that has gained significant attention in pipeline monitoring. Pencil-lead breaks (PLBs) are commonly used in reproducing and characterising sensors used in AE applications and have emerged as a valuable tool for calibration processes. This technique involves breaking a pencil lead by pressing it on the surface of the test structure and applying a bending moment at a given angle on a surface. The applied force produces a local deformation on the test surface, which is released when the lead breaks. The fracture in these PLBs is assumed to be a step unload; however, this is not the case. In this work, a series of PLB source experiments complemented with parallel numerical simulations were carried out to investigate the actual unload rate by correlating the relationship between AE speed, frequency, and power from PLBs. This was achieved by varying the simulation unload rates recorded over a duration of 2 s on a steel pipe and comparing to the experiment. Analysis of the investigated results from the experimental and numerical models suggests that although the AE line structure of a PLB can be reproduced by simulation for short times only (1 µs), the actual unload rate for PLBs is in the region of 10–8 s. It is concluded that FEA has the potential to help in the recovery of the temporal structure from real AE structures. The establishment of this model will provide a theoretical basis for future studies on the monitoring of non-impulsive AE sources such as impact on pipelines using finite element analysis.

1. Introduction

The global rise in population and living standards has led to an increase in energy demand, and pipelines have been marked as the best alternative for the transport of both oil and gas [1,2]. However, these pipelines are susceptible to accidents [3], and damages to pipelines have severe consequences on both people and the environment [4]; therefore, the safety in the use of these pipelines is of paramount importance to pipeline owners. One of the main concerns for pipeline owners is a reliable and efficient monitoring system.
Over the years, acoustic emission monitoring (AEM) has been shown to be a reliable monitoring technique [5,6,7]. Over the past decade, AE has gained momentum in pipeline monitoring [8,9]. Although AE has been proposed as a method for identifying and tracing leaks in pipelines, this has been as an inspection technique, rather than a monitoring technique. Consequently, much of the literature on AE in pipelines addresses this application, concentrating on methods for noise rejection, improved specificity, and source location for continuous or semi-continuous sources [10,11] Calibration is a critical aspect of ensuring the accuracy and reliability of various instruments and devices. The PLB, which is often used as a quick way to determine the apparent AE wave speed in the test structure, is a frequently used AE source for calibration due to its simplicity of application and remarkable reproducibility [12,13]. It provides real-time monitoring capabilities during calibration procedures and is useful for the verification of sensor coupling and determining the acoustic attenuation of a structure.
The Hsu–Nielsen source has traditionally been used as a controllable means to generate acoustic emissions in order to facilitate non-destructive testing studies. It facilitates the interpretation and comparison of experimental results by standardising the source description across different AE systems and configurations [14]. It is especially useful in systems to calibrate sensors, study wave propagation in test materials, and find suitable sensor locations for specific objectives. Because the Hsu–Nielsen source is a known and controllable source of acoustic waves, all resulting signals and their characteristics are also known and can therefore be used to study the response of the system to specific features of the wave. The ease of use and relative safety of the Hsu–Nielsen source have led it to be the most widely utilized artificial source in AE research.
Despite being widely used in AE research, the Hsu–Nielsen source has so far been largely overlooked as a tool that can be used in source characterisation and AE sensor calibration. This work sets the foundation for relating the Hsu–Nielsen source to the field of source physics and source characterisation.
Numerical modelling has gained momentum as a technique for simulating elastic wave propagation associated with acoustic emission phenomena [15,16] porous media, plates, etc. [17,18,19]. FEA has been successfully used to model and analyse the AE generated by fatigue cracking, which allows for effective health monitoring and life prediction of materials [20]. It has also been used to model AE signal propagation via various shaped waveguides, which can be validated against experimental data to ensure accuracy [21]. There are several benefits of using finite element analysis (FEA) for acoustic emission (AE) modelling. One of the main advantages directly related to this study is the ability to predict the impact of different factors on the AE signal. Another benefit of using FEA for AE modelling is the ability to achieve numerical stability and resolve high-frequency components accurately [22,23]. Much of the work applying FEA has been focussed on a description of propagation [24], but relatively little has been carried out on the relationship between what goes in at the source and what is recorded at a sensor. Therefore, the focus of this study is on what information can be deduced about the identity of an AE source from an array of sensors distributed along a pipe. To do this, it is essential that the simulations are complemented with a series of parallel experiments where as much control as possible is exerted over the source and the test object boundaries.
Most relevant to the current study [13,25] modelled the interaction between the PLB and a metal surface including the contact stresses and lead fracture and explained the sensitivity of the source to handling by the operator. In this paper, we tackle the more general issue of the effect of unloading rate on the AE recorded after a wave has propagated into the material. For this, a rather simpler AE generation mechanism is adopted for the sake of focusing on a single variable. Nevertheless, the simulations are grounded in an estimate of the step unload of an H-N source, as this provides a touchstone for comparison with actual experimental observations. Although the fracture of the lead is effectively a natural source, the generated AE is highly reproducible [26]. Generating the event involves breaking a 0.3 mm diameter pencil lead by pressing it on the surface of the test structure and applying a bending moment, as illustrated in Figure 1.
The applied force produces a local deformation on the target surface, which is released when the lead breaks. The fracture is normally assumed to be a step unload, which generates an AE disturbance that then propagates over the surface and through the material, where it can be detected by sensors placed on the surface of the test structure. To improve the trustworthiness of PLBs as a technique for AE calibration, it is important to evaluate the extent to which this fracture could be regarded as a step unload, and the work presented here is directed at evaluating the fidelity with which a step surface unload is reproduced by a sensor with a known distance from the source.
Through meticulous measurement and simulation, this study will contribute to the development of advanced AE monitoring systems that are capable of providing reliable and timely assessments of pipe integrity. The findings of this research will have significant implications for improving the safety and efficiency of industrial piping systems, ultimately leading to better maintenance strategies, reduced downtime, and prevention of unexpected failures. By bridging the gap between theoretical simulations and practical measurements, this paper aims to advance the field of acoustic emission testing and set a foundation for future innovations in non-destructive evaluation technologies.
The next sections provide an overview of the AE technique, detailing the generation, recording, and analysis of elastic waves. This is succeeded by a description of the setup and parameters for the FEA simulations used to model stress wave propagation from a Hsu–Nielsen source. An analysis and discussion of the results follow. The paper concludes with a summary of the key findings and suggestions for future research directions.

2. Materials and Methods

A series of PLB source experiments that were complemented with a series of parallel numerical simulations was carried out to investigate and corelate the relationship between AE wave speed, frequency, and power from PLB on simulations and experiments. Experiments and simulations were carried out in order to study the behaviour of the AE wave propagation from a simulated source. These experiments and simulations were carried out on a short pipe of 100 mm diameter and 10 mm wall thickness; the external cylindrical surface was used as the test surface with both source and sensor being mounted on it and the propagating AE waves measured from both sources.

2.1. Experimental Setup

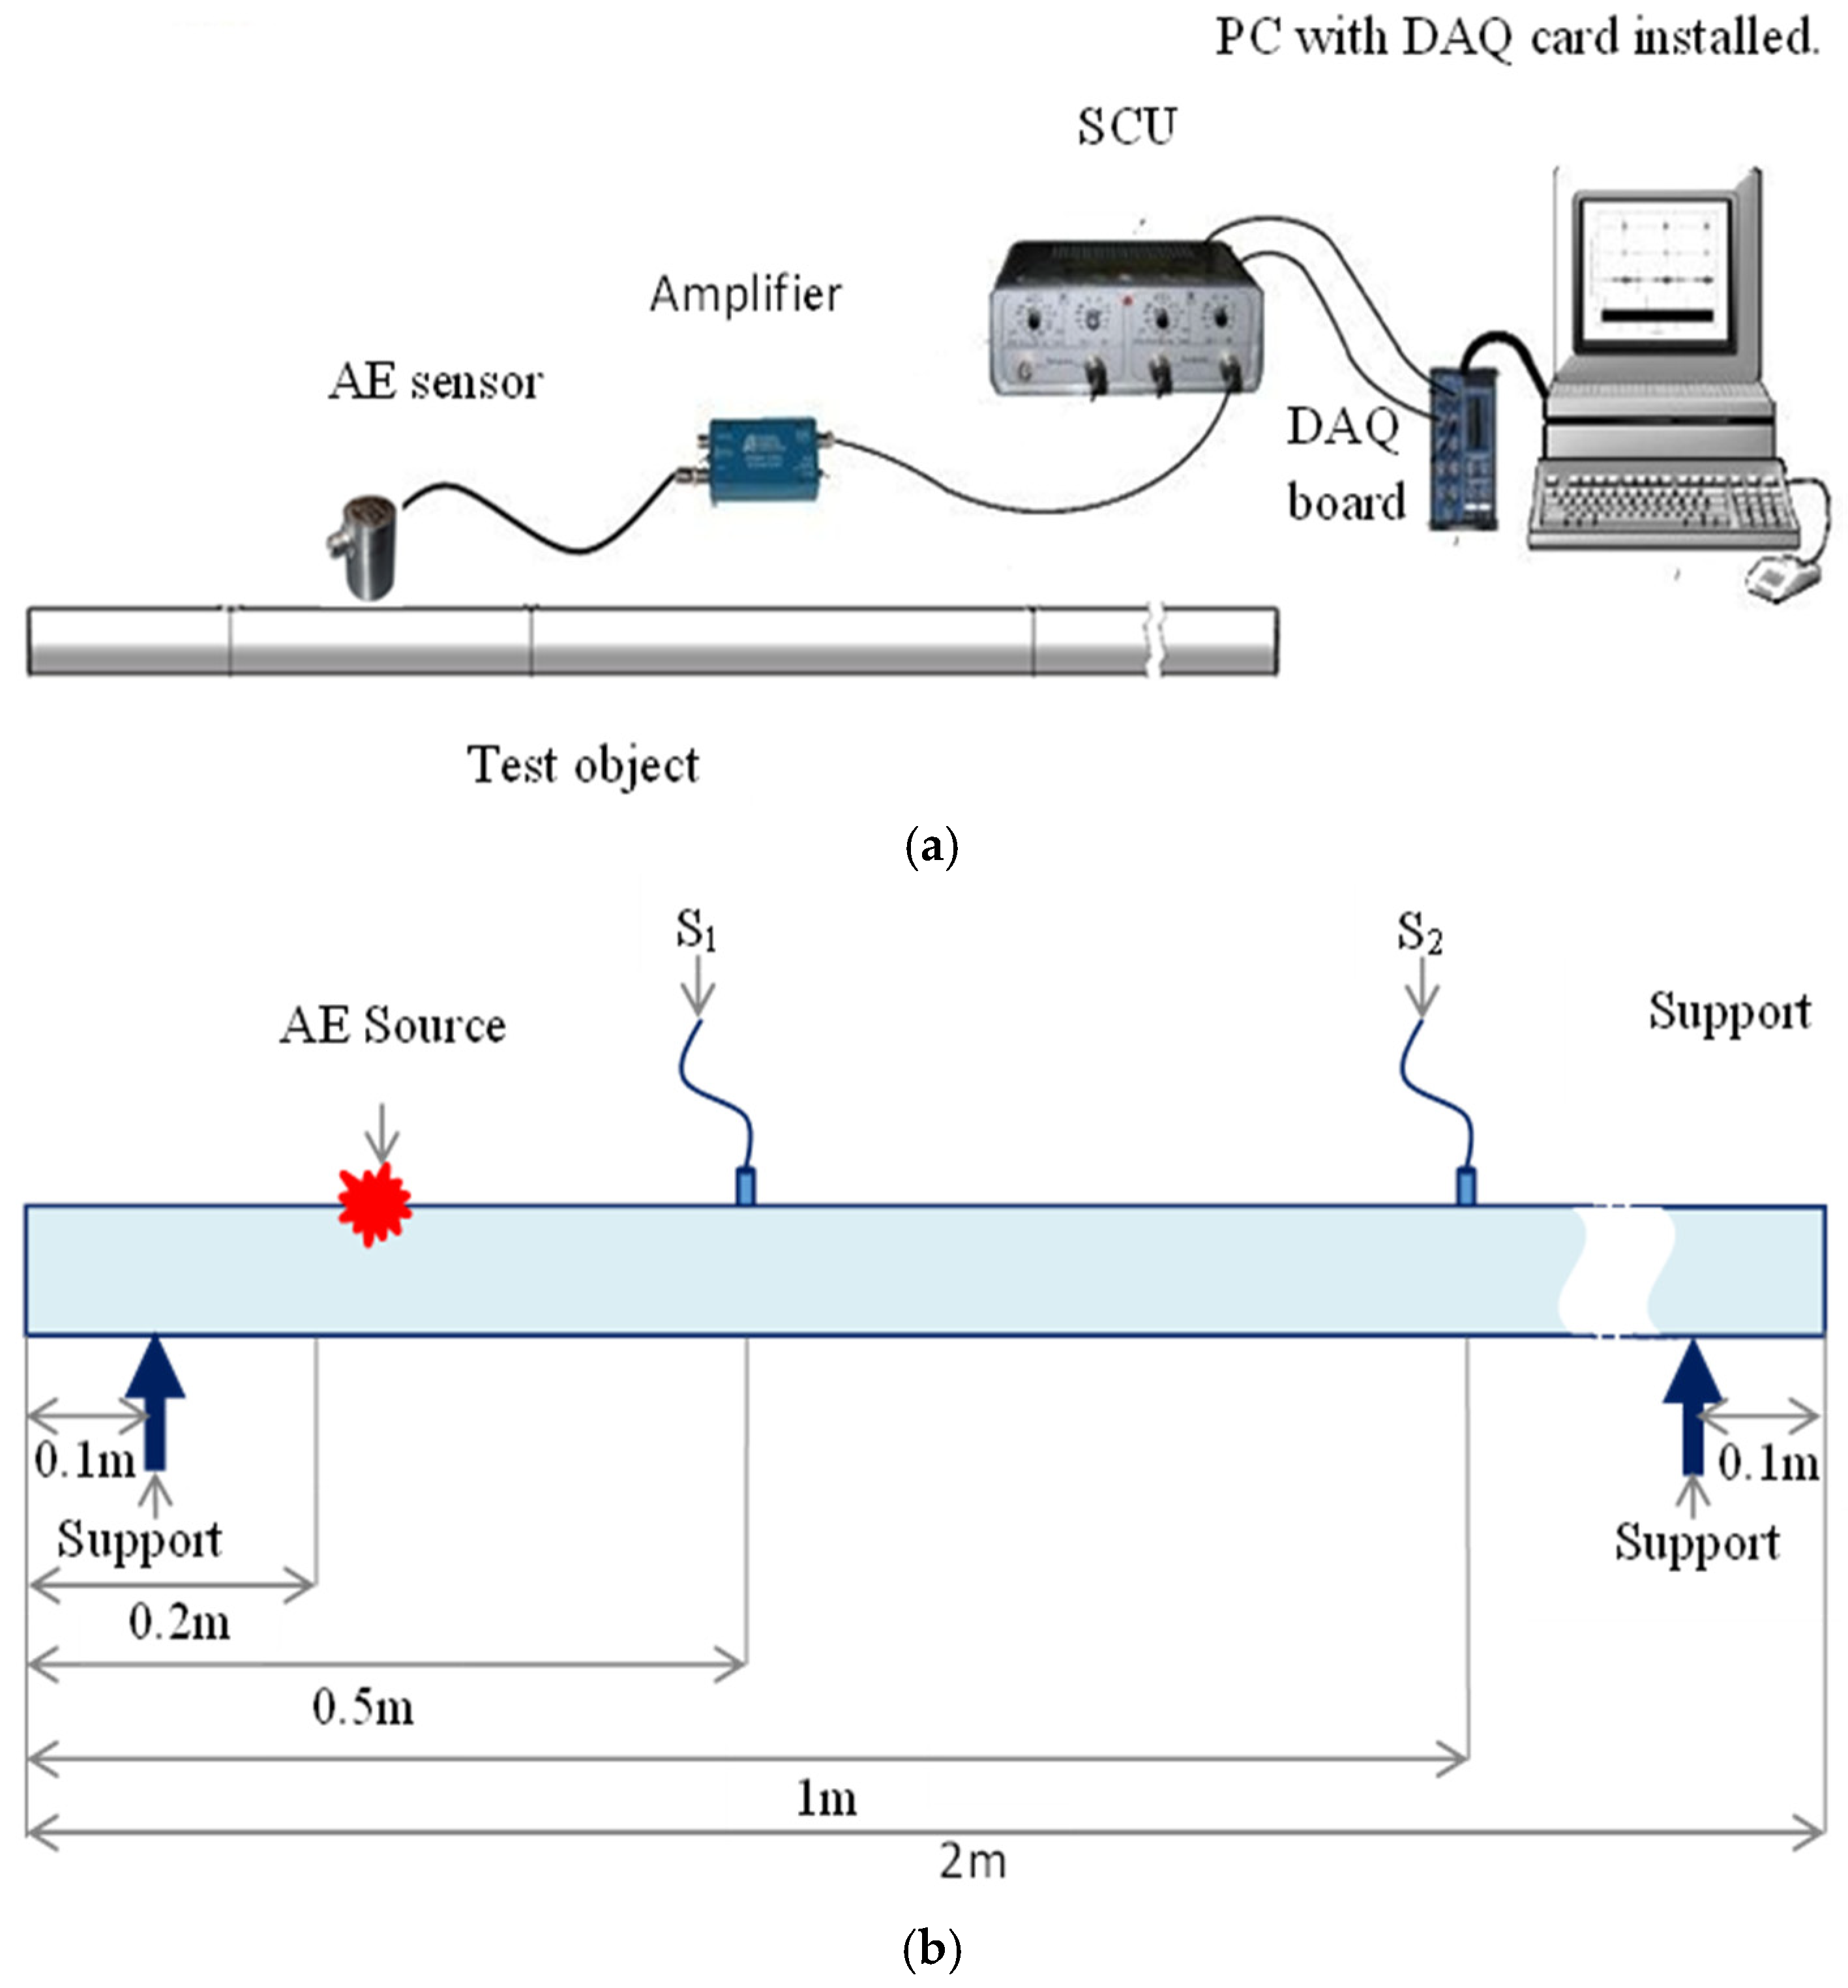
The main approach was to carry out a systematic investigation of the AE wave generated as a result of a PLB on a steel pipe; the main aim of these experiments was to study practical AE wave propagation parameters on a pipe for comparison with matching simulations. To achieve this, a commercial mechanical pencil with an in-house-machined guide ring was used to generate a simulated AE source (PLB source) on the test object. Since the analytical focus is on the very early parts of the signal, it is important that arrival times can be estimated with reasonable accuracy, and the pre-trigger is helpful in doing this. Two sensors were mounted on the pipe in positions shown in Figure 2; one sensor, S1, acted as the trigger; and 20 pencil lead break records were taken.
The signal conditioning unit (SCU) utilized was an in-house-designed programmable 4-channel device capable of both powering the AE sensors (+28 V) and pre-processing signals from the sensors before ADC acquisition. Although the SCU has the ability to perform analogue RMS processing with associated amplification or de-amplification, this feature was not employed in the current work. This setup is illustrated schematically in Figure 2.
As the experiments aimed to acquire raw AE signals within the 0.1 to 1 MHz frequency range, a high-performance data acquisition system was necessary. The DAQ system used is a multifunctional analogue, digital, and timing device without on-board switches or jumpers, allowing for it to be configured and calibrated via software. It is based on an in-house-built desktop PC equipped with a 12-bit National Instruments PCI-6115 board. This board can simultaneously acquire raw AE signals at 10 M samples/s for four channels and fits into a full-length PCI slot. The software-programmable ADC gain can be set to 0.2, 0.5, 1, 2, 5, 10, or 50, covering an input range from ±200 mV to ±42 V. Data can be sampled from 20k samples/s up to 10 M samples/s per channel, with a total onboard memory of 32 MB. The board only supports differential input configurations and has over-voltage protection at ±42 V. For all the work reported here, the system was set up for source location applications, recording raw AE signals (sampled at 5 M samples/s) over two channels.
Sensor calibration was carried out using two measures: the energy of the signal across the entire spectrum, and on the distribution of the energy across the spectrum. This latter measure was determined by dividing the spectrum into two bands, 100–400 kHz and 400 kHz–1 MHz, and calculating the ratio of the energy into high-frequency band to the low-frequency band. Two commercial broadband AE sensors of Physical Acoustics Micro-80D type were used throughout the experiment. These AE sensors are omnidirectional, sensitive over the frequency range from 175 kHz to 1000 kHz and are based on lead zirconate titanate (PZT) active elements. These sensors were used due to their ubiquity in industrial condition monitoring and relatively broad frequency response with good sensitivity. They are 10 mm in diameter and 12 mm high and have a flat frequency response of over 0.1 MHz to 1 MHz, but with two bands of relatively high sensitivity at about 150 kHz and 350 kHz. The sensors were held onto the test object using magnetic clamps to avoid air gaps. The preamplifiers were set at a gain of 40 dB and, once the trigger was activated, the system acquired 50,000 points at a sampling rate of 5 M samples/s with a pre-trigger of 1000 points. The system also acquired 50,000 points from the second sensor interlaced with the trigger so that the two sensors were essentially time correlated.
To ensure consistency and avoid any variation in spectral content, 20 pencil lead break records were taken at the same position on the test surface, using the same orientation and the same angle of the pencil. The experimental results were recorded as a time series, which starts 1000 points (pre-trigger) before the disturbance caused by the source arrives at the trigger sensor. The results from these PLB experiments are discussed later in this paper.

2.2. Finite Element Model

The key aim of the FE simulations carried out in this work is to compare experiments to the simulation (no damping or attenuation) as a means of evaluating how the AE signal recorded at two virtual sensor positions on the surface a pipe changes as the unloading rate at the source changes, the objective being to determine the extent to which a PLB can be regarded as a step unload. The FE simulation was based on the ABAQUS 6.14-2 explicit dynamic software; this software was specifically chosen for the simulations because it offers accurate analysis techniques to determine the local element failure and can then adjust the element stiffness to precede damage analysis and is thus quite suited for linear and nonlinear explicit dynamics problems such as those involving pressure and impact [27]. The material properties used were those of steel with a density of 7800 kg/m3 and a Poisson ratio of 0.3. The ABAQUS explicit dynamic analysis was applied to obtain the transient stresses resulting from a rapid change in pressure.
Just as with the experiment, the pipe model was simulated as a three-dimensional elastic deformable solid with pipe of diameter 100 mm and wall thickness 10 mm fixed at both ends and subject to pressure loading one metre from one end (Figure 3).
The force and unloading rates studied were chosen to be in the region of the estimated time it would take a fracture, propagating at the speed of sound, to cross the diameter of a 0.5 mm pencil lead so that the simulated responses could be compared with the observed responses of pencil lead breaks. This time (about 0.3 μs) is reasonably close to that simulated in [22]. To implement the FEA model, several key issues need to be resolved beyond the time step increment. The most important of these are element type, mesh size, boundary conditions, and introduction of external loads, discussed in turn below. When dealing with stress wave propagation, there are additional computational challenges due to the dynamic nature of the stress distribution, especially considering that the frequency range of AE propagation typically falls within the MHz range. In this work, symmetry was employed whenever possible to optimize the simulations. Also, to limit computational time and avoid excessive complications from reflections at the model’s ends, the pipe was fixed at both ends (Figure 3a). A time step of 1 × 10⁻⁹ s and a total simulation time of 2 s were used for the finite element simulations.
Also, just as with the corresponding experimental setup, both ends of the pipes where fixed to achieve zero transverse displacement at both ends. Fixed boundary conditions were implemented in this work by restricting the displacement of nodes at the pipe boundaries to zero, this was achieved by constraining the pipe ends. The C3D8R elements were specifically chosen for the simulation of AE because the integration point is located in the middle of the element and small elements are generally required to capture a stress concentration at the boundary of structures such as the one used in this work [28].
The finite element size (mesh density) is a very important aspect of the FE simulations as the accuracy and simulation computing time are directly related to mesh size and time step. Several authors have studied the effect of mesh size density in FE analysis [29,30,31] Generally, models with fine mesh yield highly accurate results but with a longer computing time, and coarse meshes mostly lead to less accurate results with more economical computing time. The general approach used in this work was to refine the mesh size until acceptable behaviour (results stay consistent between meshes) was obtained. Therefore, a number of different mesh size densities were investigated, and a mesh size of 0.01 mm was chosen as, beyond this mesh size, there were no appreciable differences recorded in the resultant stress waves generated.
In wave propagation modelling, the actual time step used for a model is expressed in terms of its ratio to the critical time step. The Courant–Friedrichs–Lewy (CFL) number and is given by:
C F L = t t c r
If L is the smallest element size and C L is the velocity of the wave:
t = C F L   t c r =   C F L = L C L
A large increment number is usually required to solve wave propagation models because the space is normally discretized such that the wavelength in the model is at least 7 nodes per shortest wavelength. However, global mass and stiffness matrices are neither created nor inverted, so increments are computationally inexpensive [32]. Therefore, in this work, to capture the dynamics of the model, the CFL condition was used to determine the maximum allowable size of the time increment t :
t t c r = m i n L e c d
where L e is the element length and c d is the dilatational wave speed and is given by the following:
c d = ( λ + 2 µ ) ρ
where λ and μ are the first and second Lame constants and ρ represents the density of the material so a time step of 1 × 10⁻⁹ s was used for all the FE simulations in this work.
The loading conditions are a key element of the current work, since they represent the source function and the boundary conditions. Most of the published work on simulating AE propagation considers the source to be a step unload. Much of the calibration work carried out on structures uses sources, such as a pencil-lead break, which approximates a step unload. As stated earlier, the unloading rates were chosen to be in the region of the expected time it would take a fracture, propagating at the speed of sound, to cross the diameter of a 0.3 mm pencil lead so that the simulated responses could be compared with observed responses of pencil-lead breaks.
All the PLB simulations used a 100 N force spread over a surface area of 0.003 m2 with three different time profiles. Each unloading rate being preceded by a dwell and ramp time of 10−8 s. The key variable being the rate of unloading, with unloading times 10−9 s, 10−8 s, and 10−7 s, respectively. The rise times were chosen to be in the range reported in the literature [21], while the surface area (0.003 m2) and force (100 N) are the estimated approximate area and force obtained from the PLB experiment.
For linear elastic media, and using Hooks law:
σ = D · ε
where:
  • D is elastic coefficient;
  • σ is a vector with six independent components;
  • τ is shear stress and a component of the vector.
From the principle of virtual work:
δ W = i F i δ u i = 0
The external virtual work applied equals the internal virtual work, for a deformable body with volume V and surface S, this leads to a state of deformation characterised by new internal stress and strain components.
To minimise the amount of data stored and the consequent post-processing, only the surface stress at the positions of the virtual sensors was recorded. This record commenced (at time zero) when the source was applied to the pipe and ended at the end of the simulation (0.02 s after application of the source). The simulated results were recorded as a time series, each at a given (virtual) sensor position.
As the simulation as an explicit one, the explicit central difference integration method was used to solve for the displacement, u ( x , y , z , t ) from increment i (time t ) to increment i + 1 ( t i m e   t + t ) :
u ˙ i + 1 2     =   u ˙ i + 1 2   + t i + 1 +   t i 2 u ¨ i
u i + 1 = u i     + t i + 1
where u ˙ represents the velocity, u ¨ is acceleration, the superscript ( i ) is an increment number and ( i ± 1 2 ) is the value of a variable midway between the increments.
The input acceleration at the source was obtained using the following:
u ¨ ( i ) = M 1   · P i I i    
where M is the mass matrix, P is the vector of applied loads, and I the vector of internal forces.

3. Results and Discussion

The proprietary signal processing software MATLAB 8.2 R2013b was used in this work due to its capacity to process and display very large array of data such as those used in this study. FFT was used in demodulated resonance analysis; here, the AE wave is regarded as a carrier frequency for the lower frequency information. To implement this, the signal is treated using a sliding root mean square (RMS) to reveal lower frequencies in the envelope of the signal [32]. The recorded AE signals in this work were discrete bipolar time series and were left in that format for much of the comparison with simulated signals. A thresholding technique [25] was then used to identify the arrival time and duration of the record. The trigger sensor was set to have 1000 points of pre-trigger, which allowed for the noise amplitude to be easily determined, with the wave arrival time being the time at which the signal level first exceeds this threshold. The energy E was calculated from the raw signal by integrating over the entire time record:
E 0 = 0 t v 2 t d t
where E is acoustic emission signal energy, v ( t ) is the signal voltage, and ‘ t ‘ is time in seconds (s).

3.1. Experimental Pipe Model

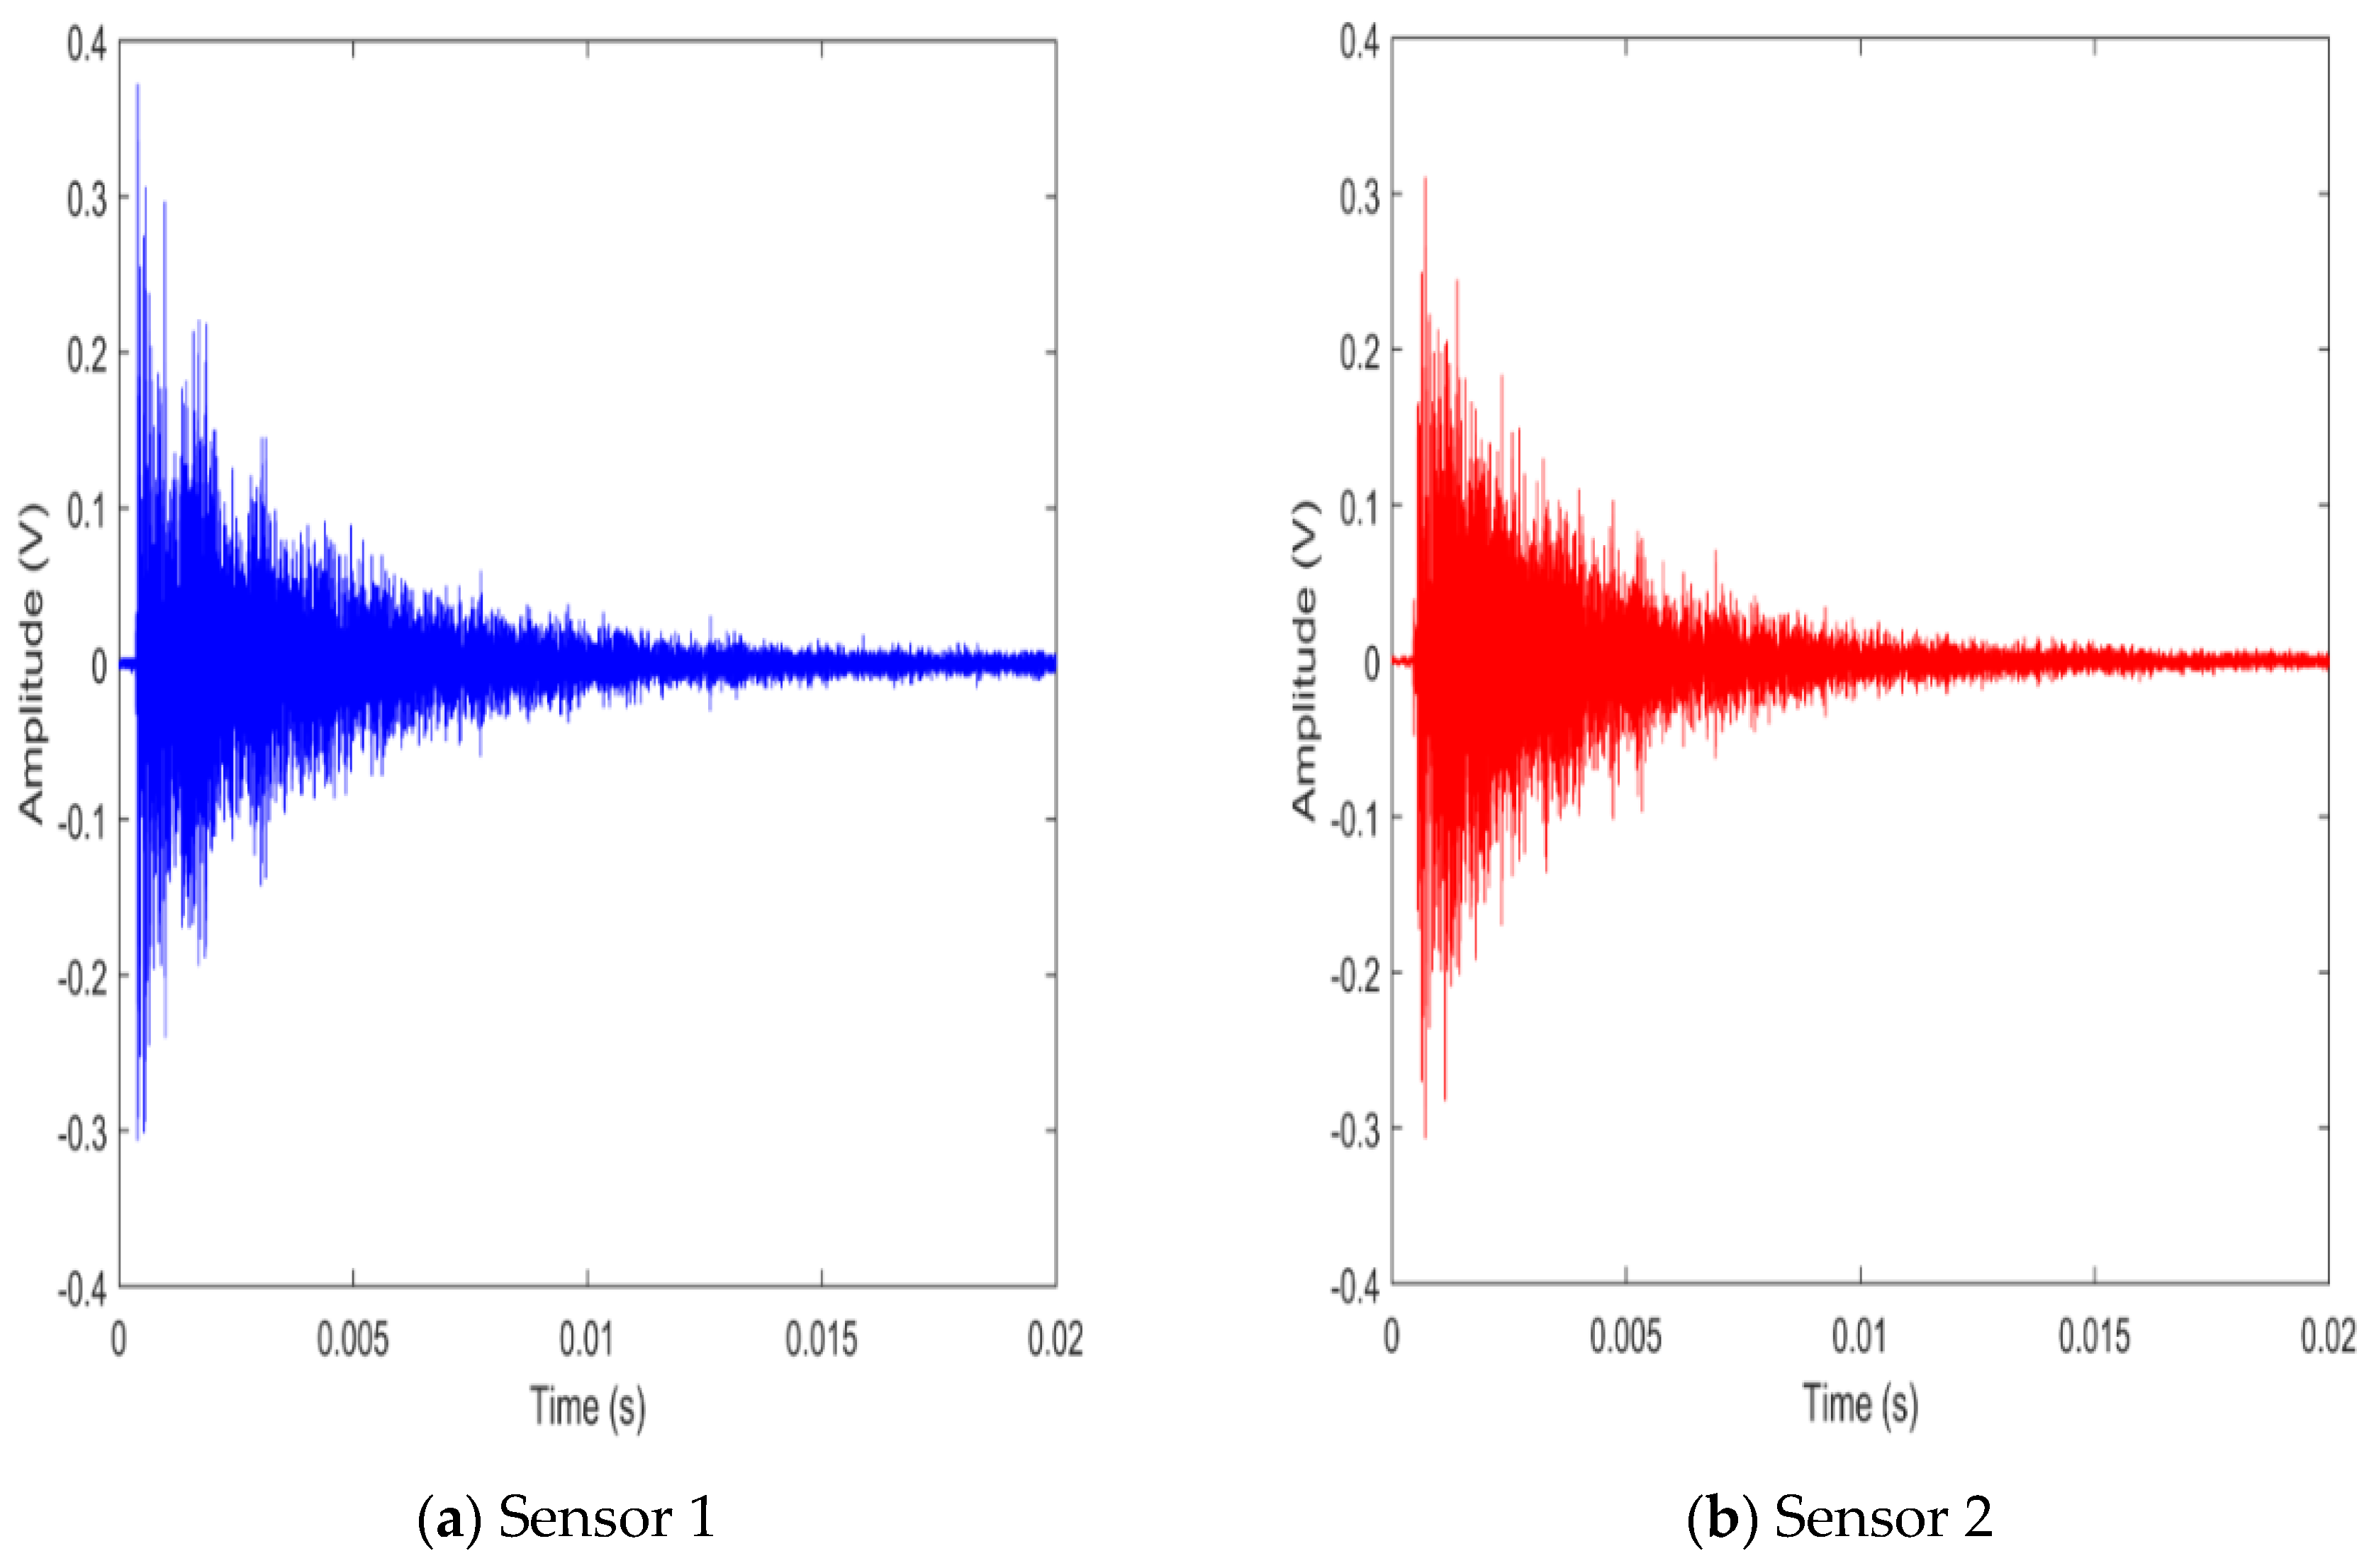
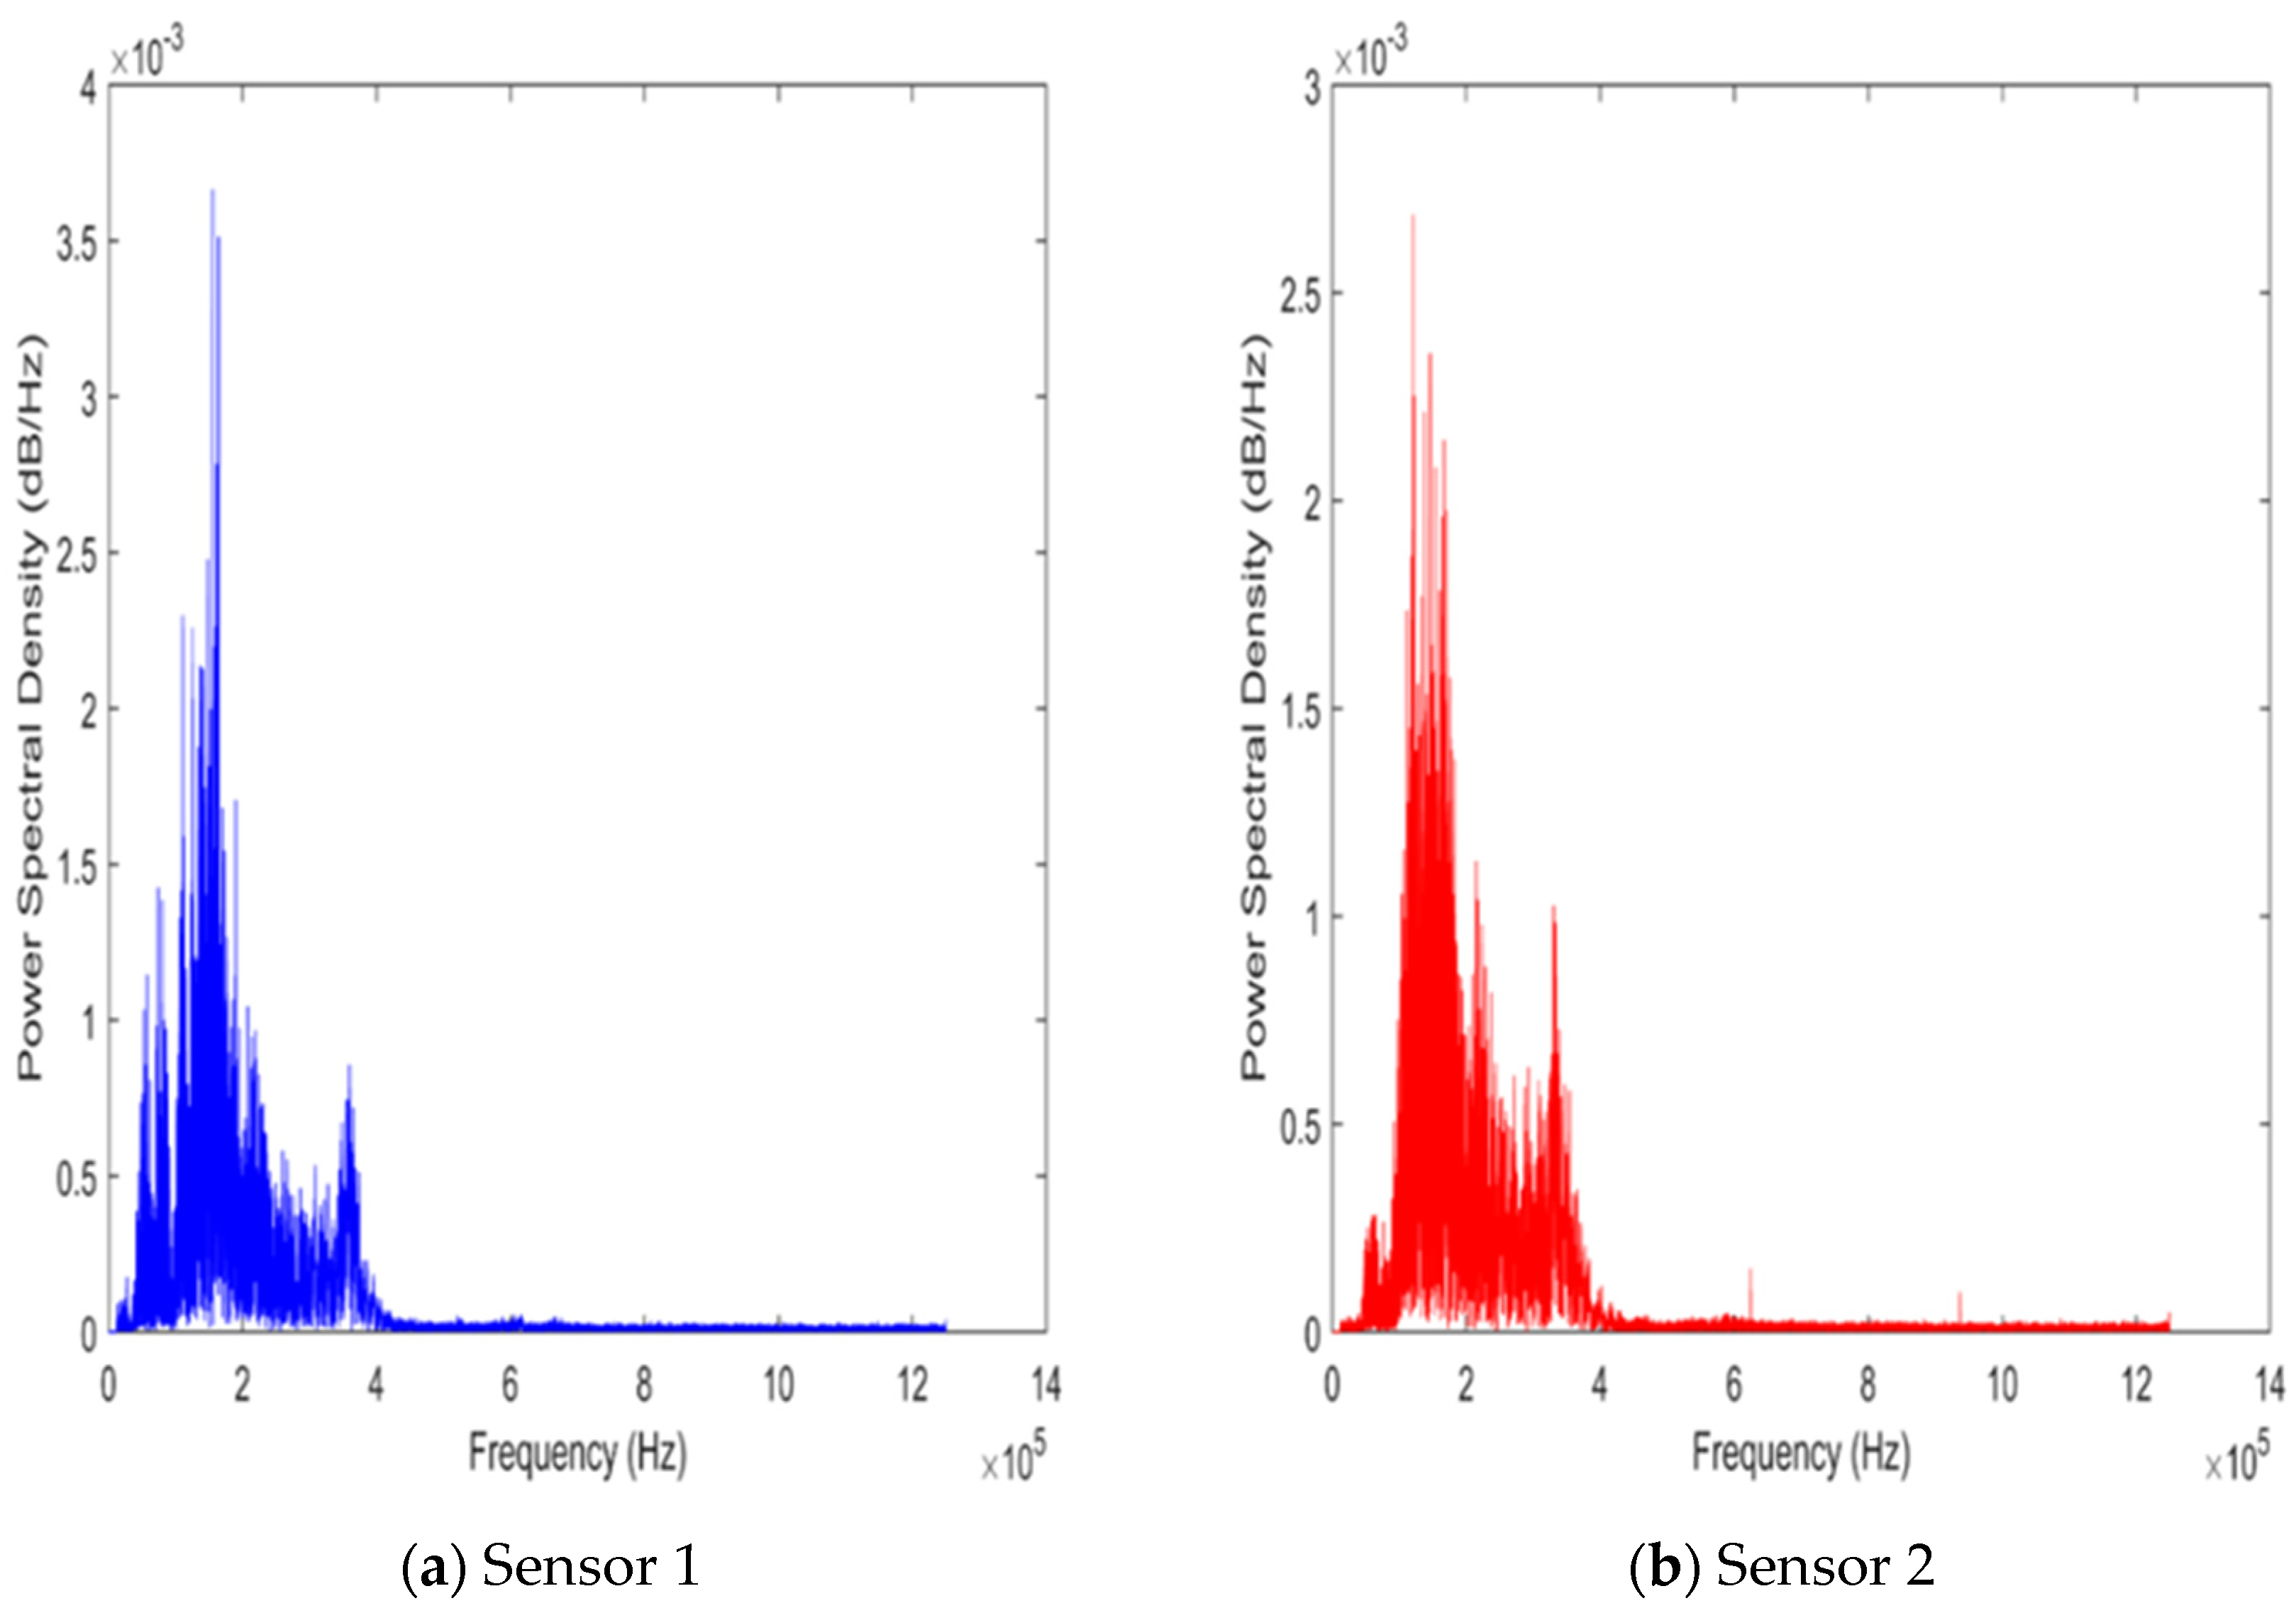
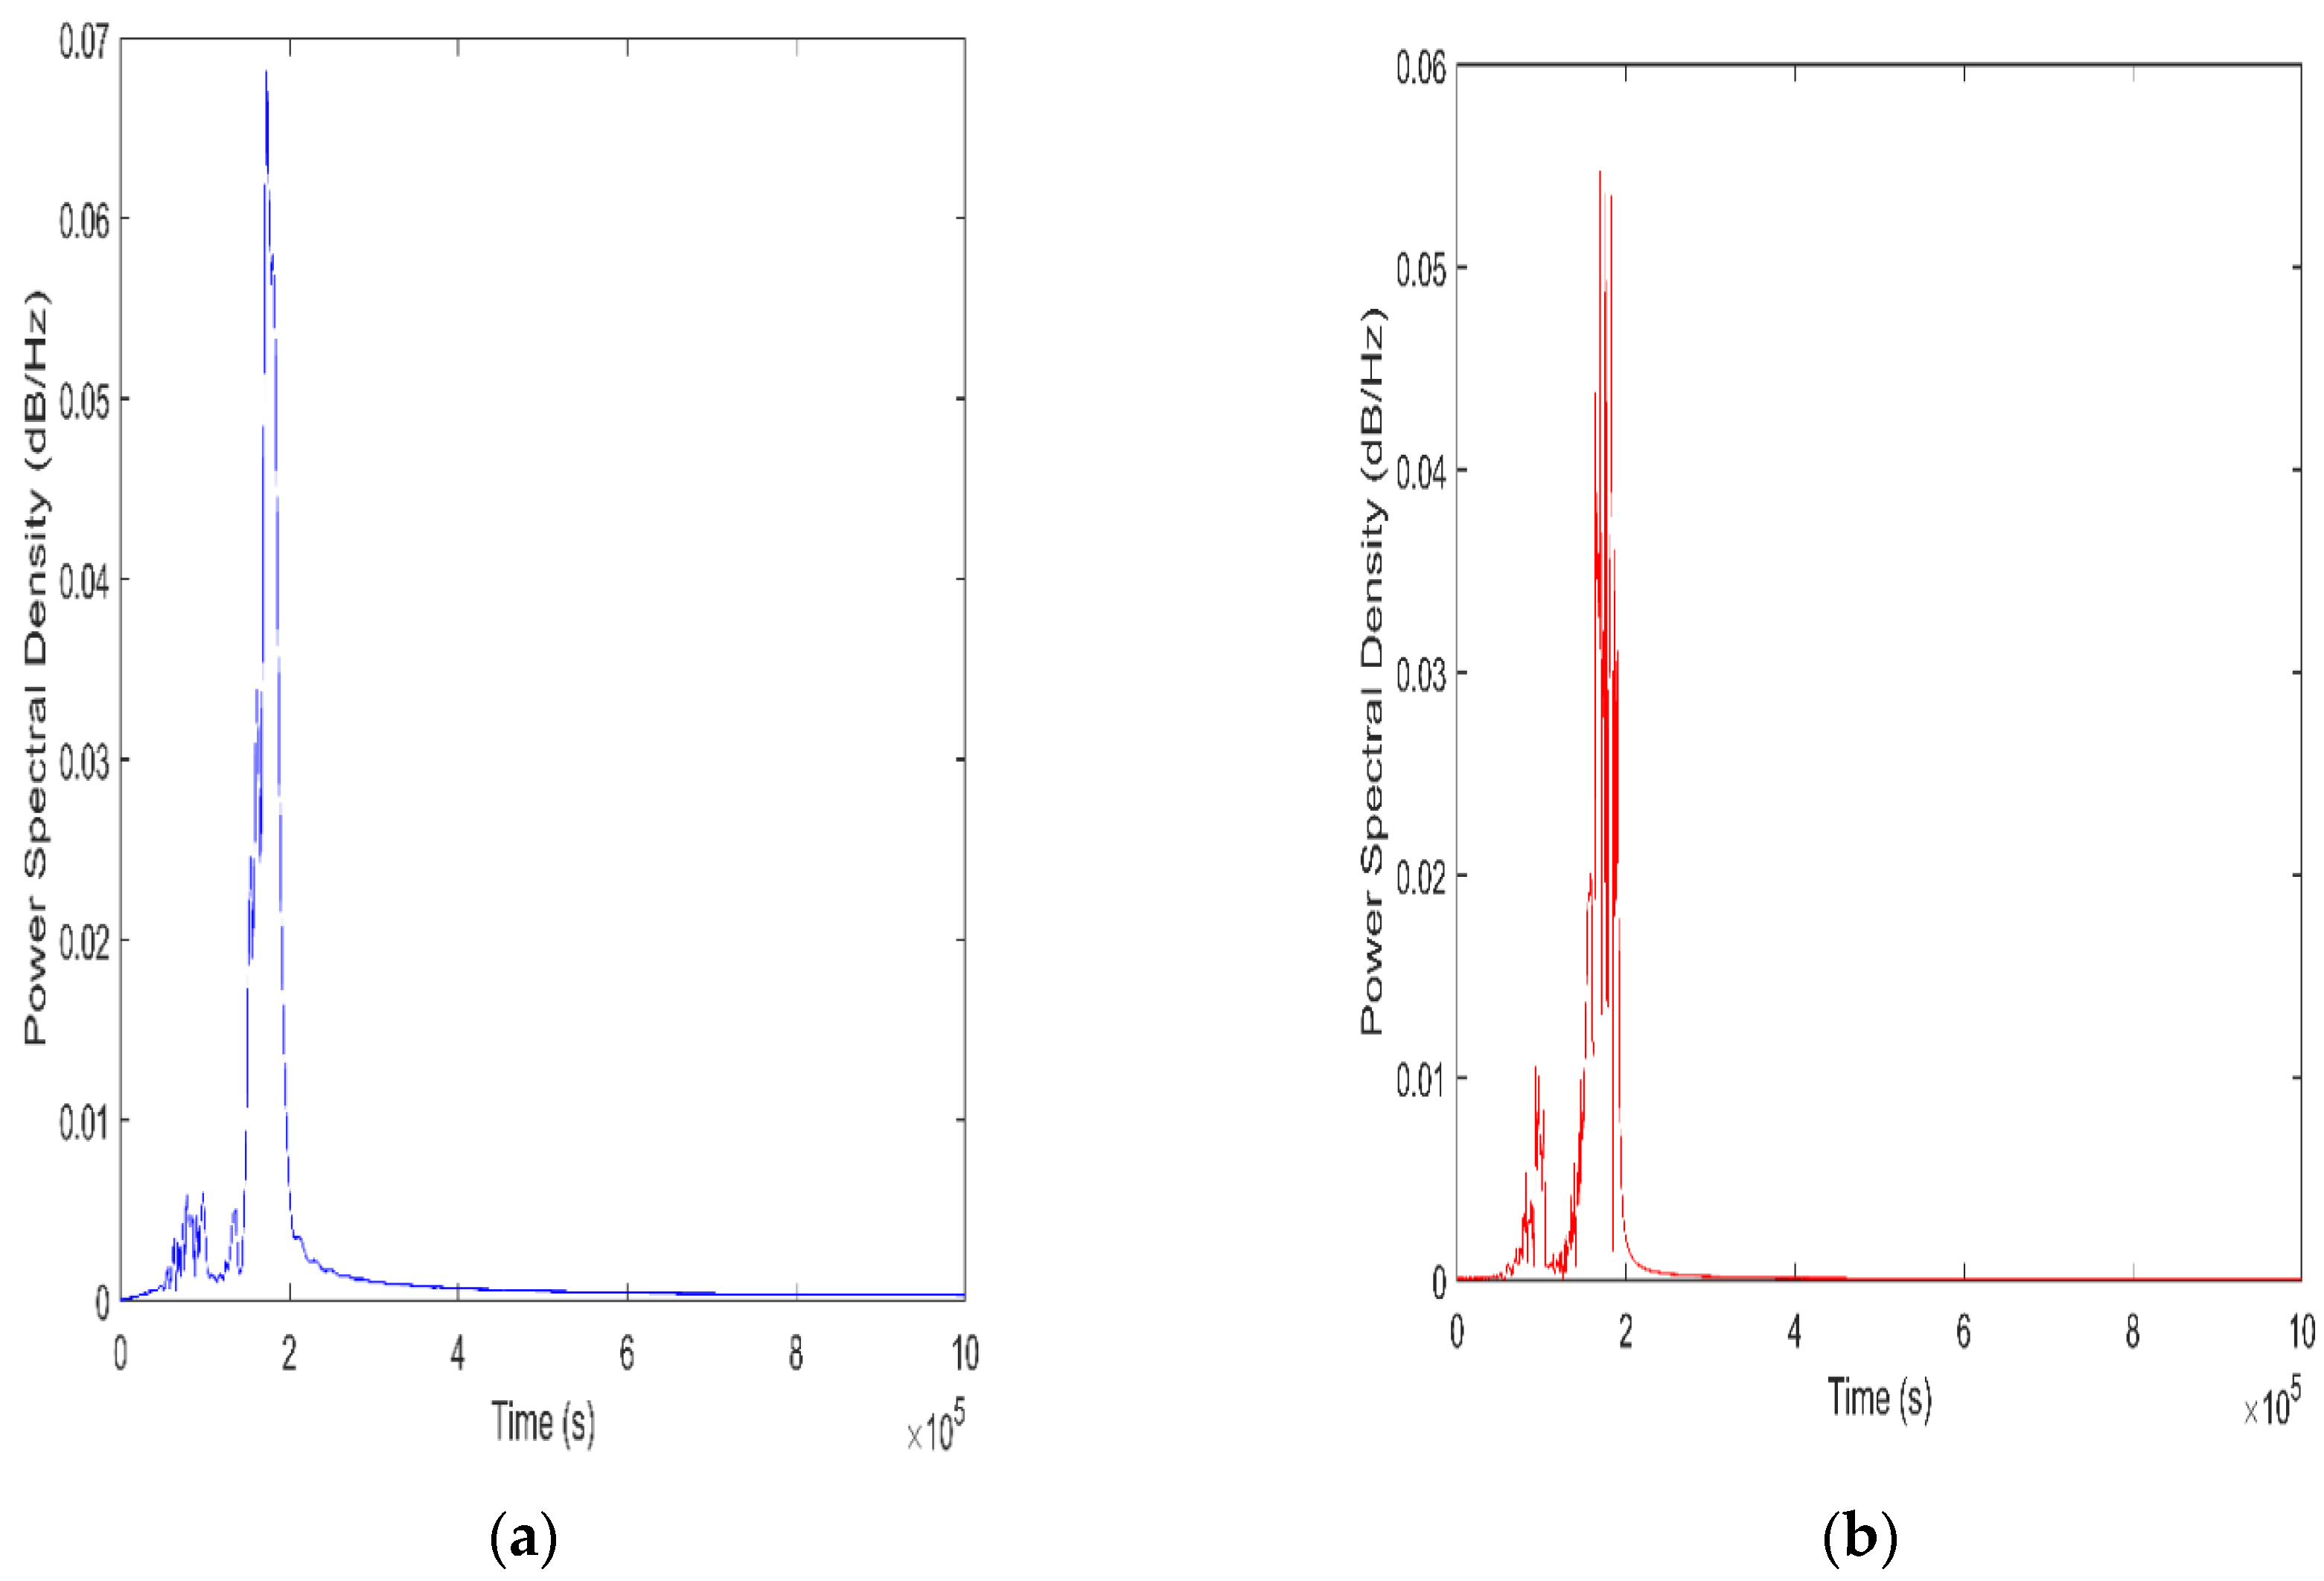
Figure 4 and Figure 5 show typical raw AE time domain and the corresponding frequency spectra at both sensors 1 and 2, respectively. The spectrum for the whole record indicates that there is a shift from lower frequencies to higher frequencies with increase in source-sensor distance and this is reasonable agreement with studies measuring relationship between AE source sensor distance and frequency [33,34]. This shift can be attributed to several factors inherent in the propagation of the AE waves, one primary reason being the phenomenon of frequency-dependent attenuation [35]. As sound waves travel through the pipe, higher-frequency components are absorbed more rapidly than those with lower frequencies. Consequently, over shorter distances, the lower frequencies are more prominent in the spectrum. However, as the distance increases, the lower frequencies diminish more rapidly, allowing for the higher frequencies to become more dominant in the spectrum received by the sensor [36].
There are also two key peaks at about 150 kHz and 400 kHz; therefore, the spectra were divided into two bands: low frequency (100 kHz–400 kHz) and high frequency (400 kHz–1 MHz). The relative power was then evaluated by integrating the spectra and calculating the ratio between both bands. For all 20 records, the ratio of high- to low-frequency power for both sensor positions was calculated as 0.1516 and 0.1702 for the trigger and second sensors, respectively.
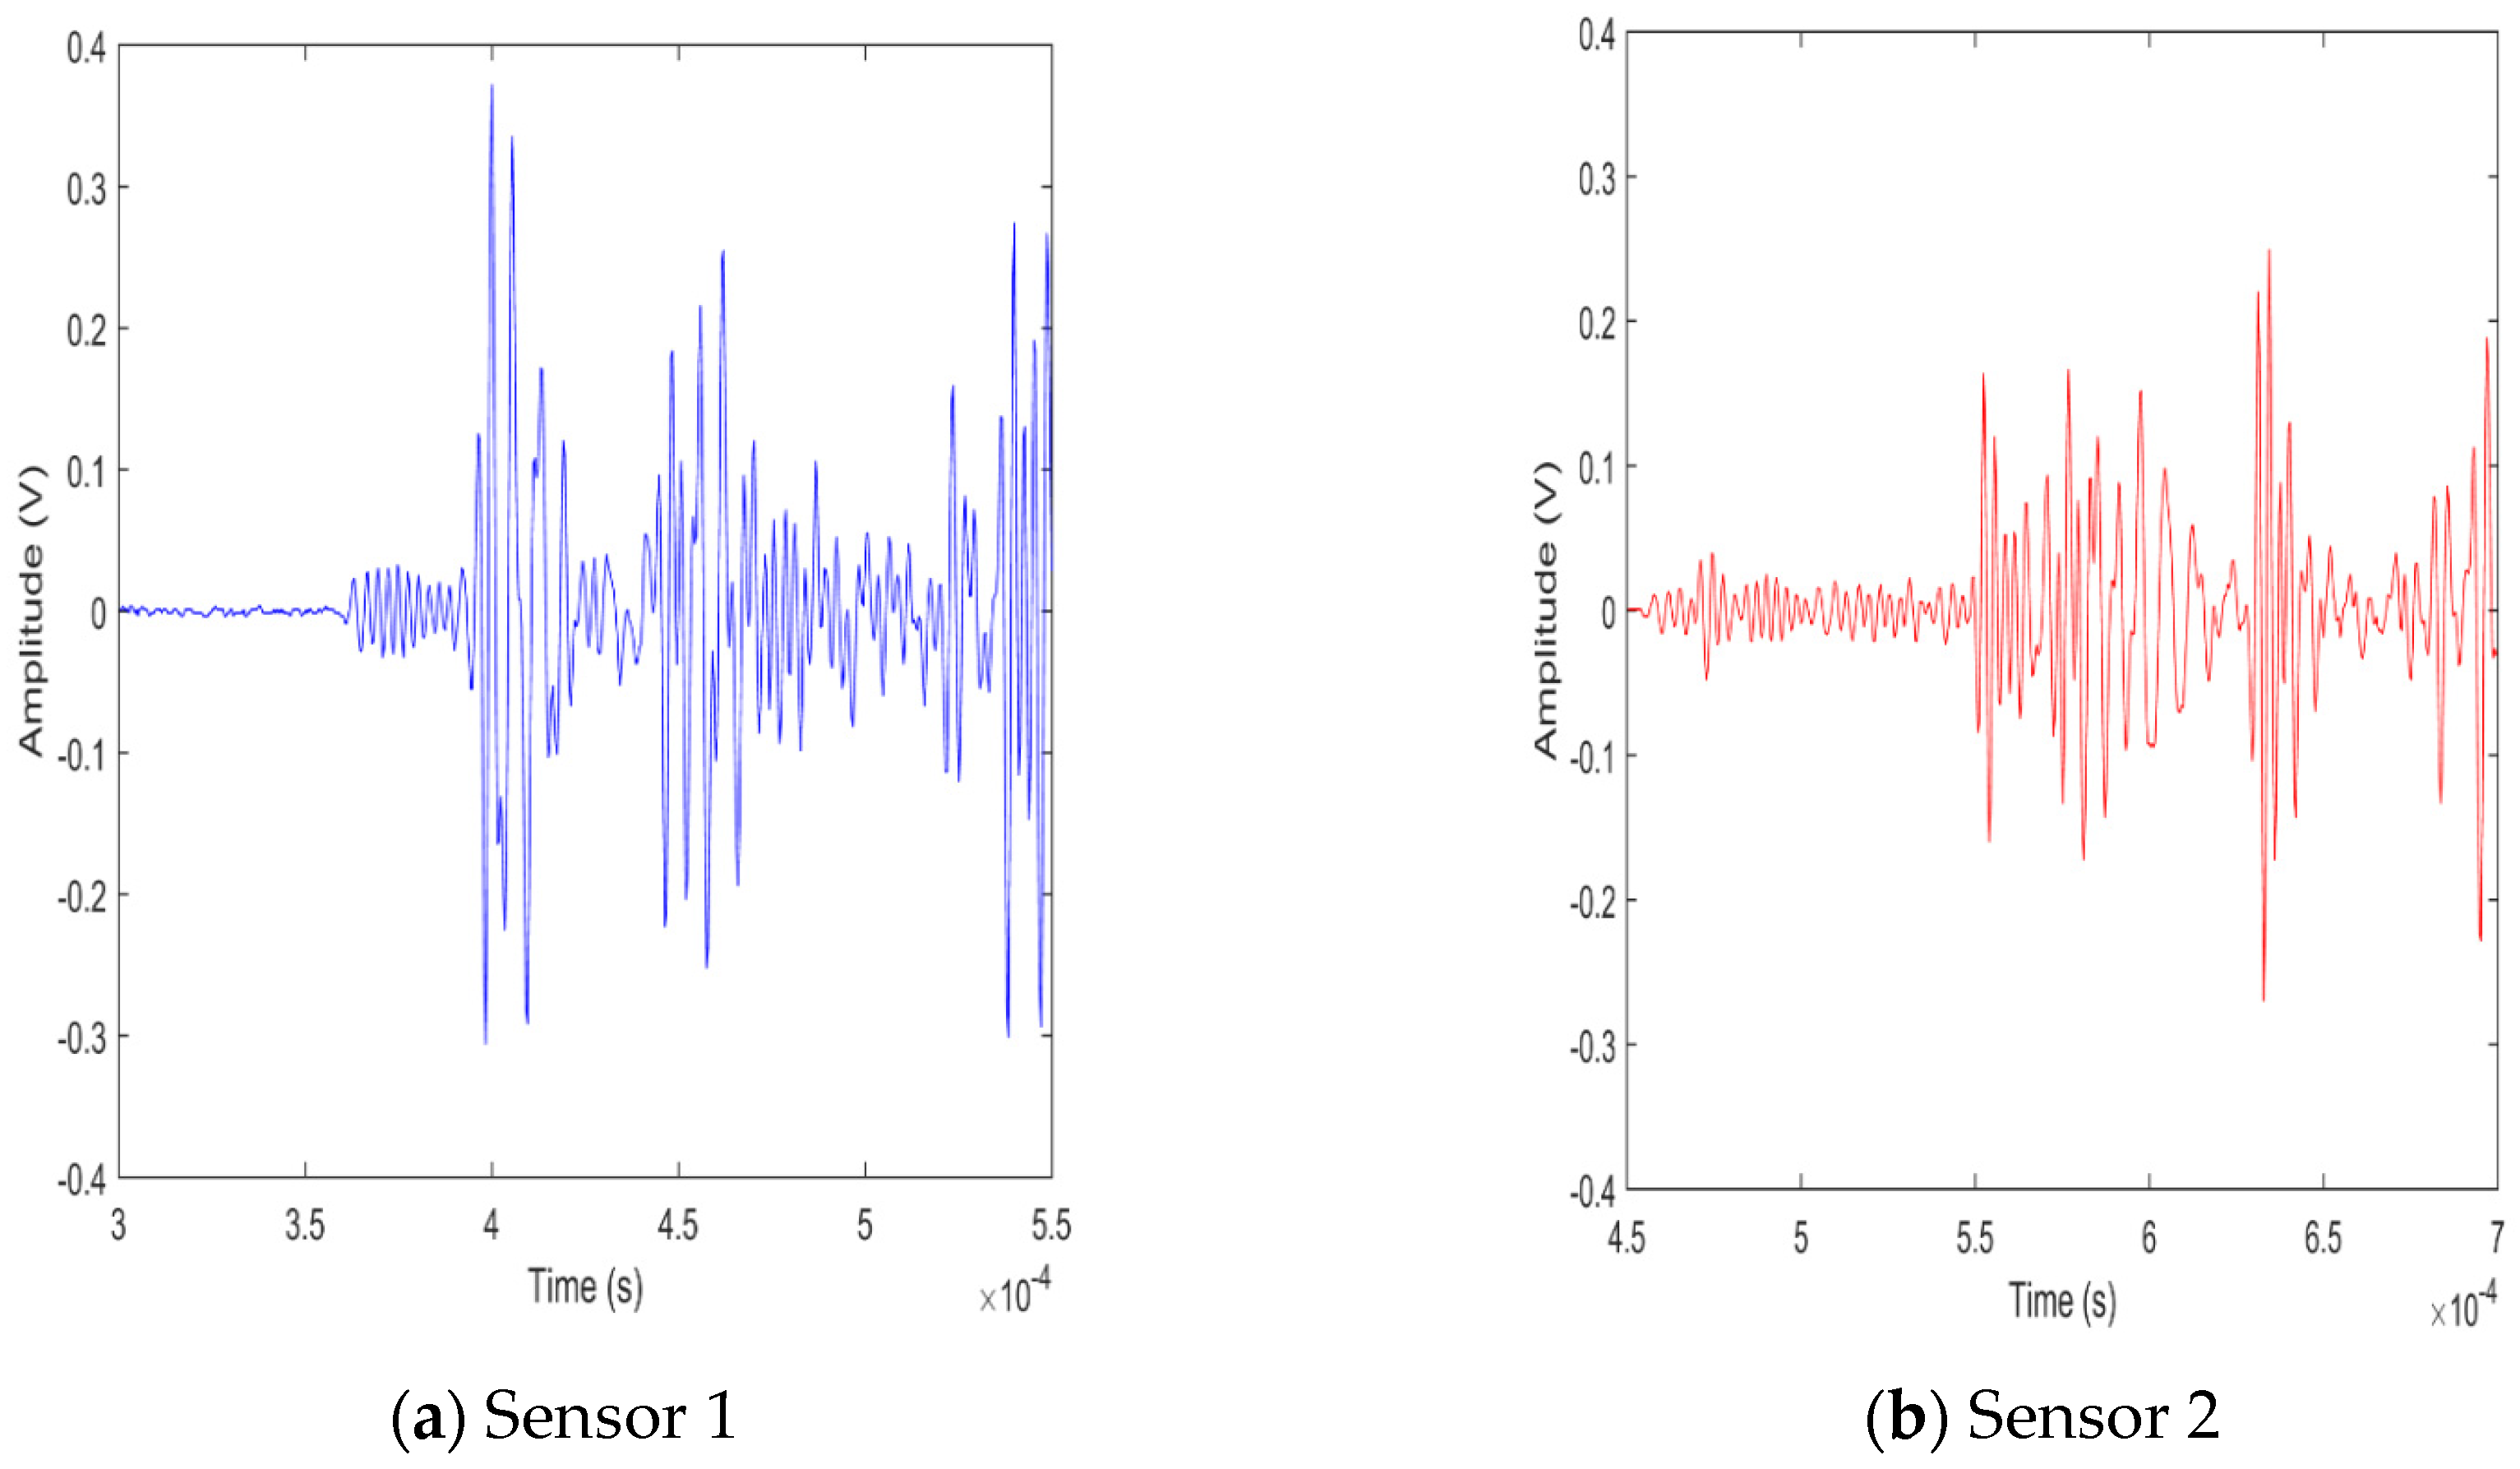
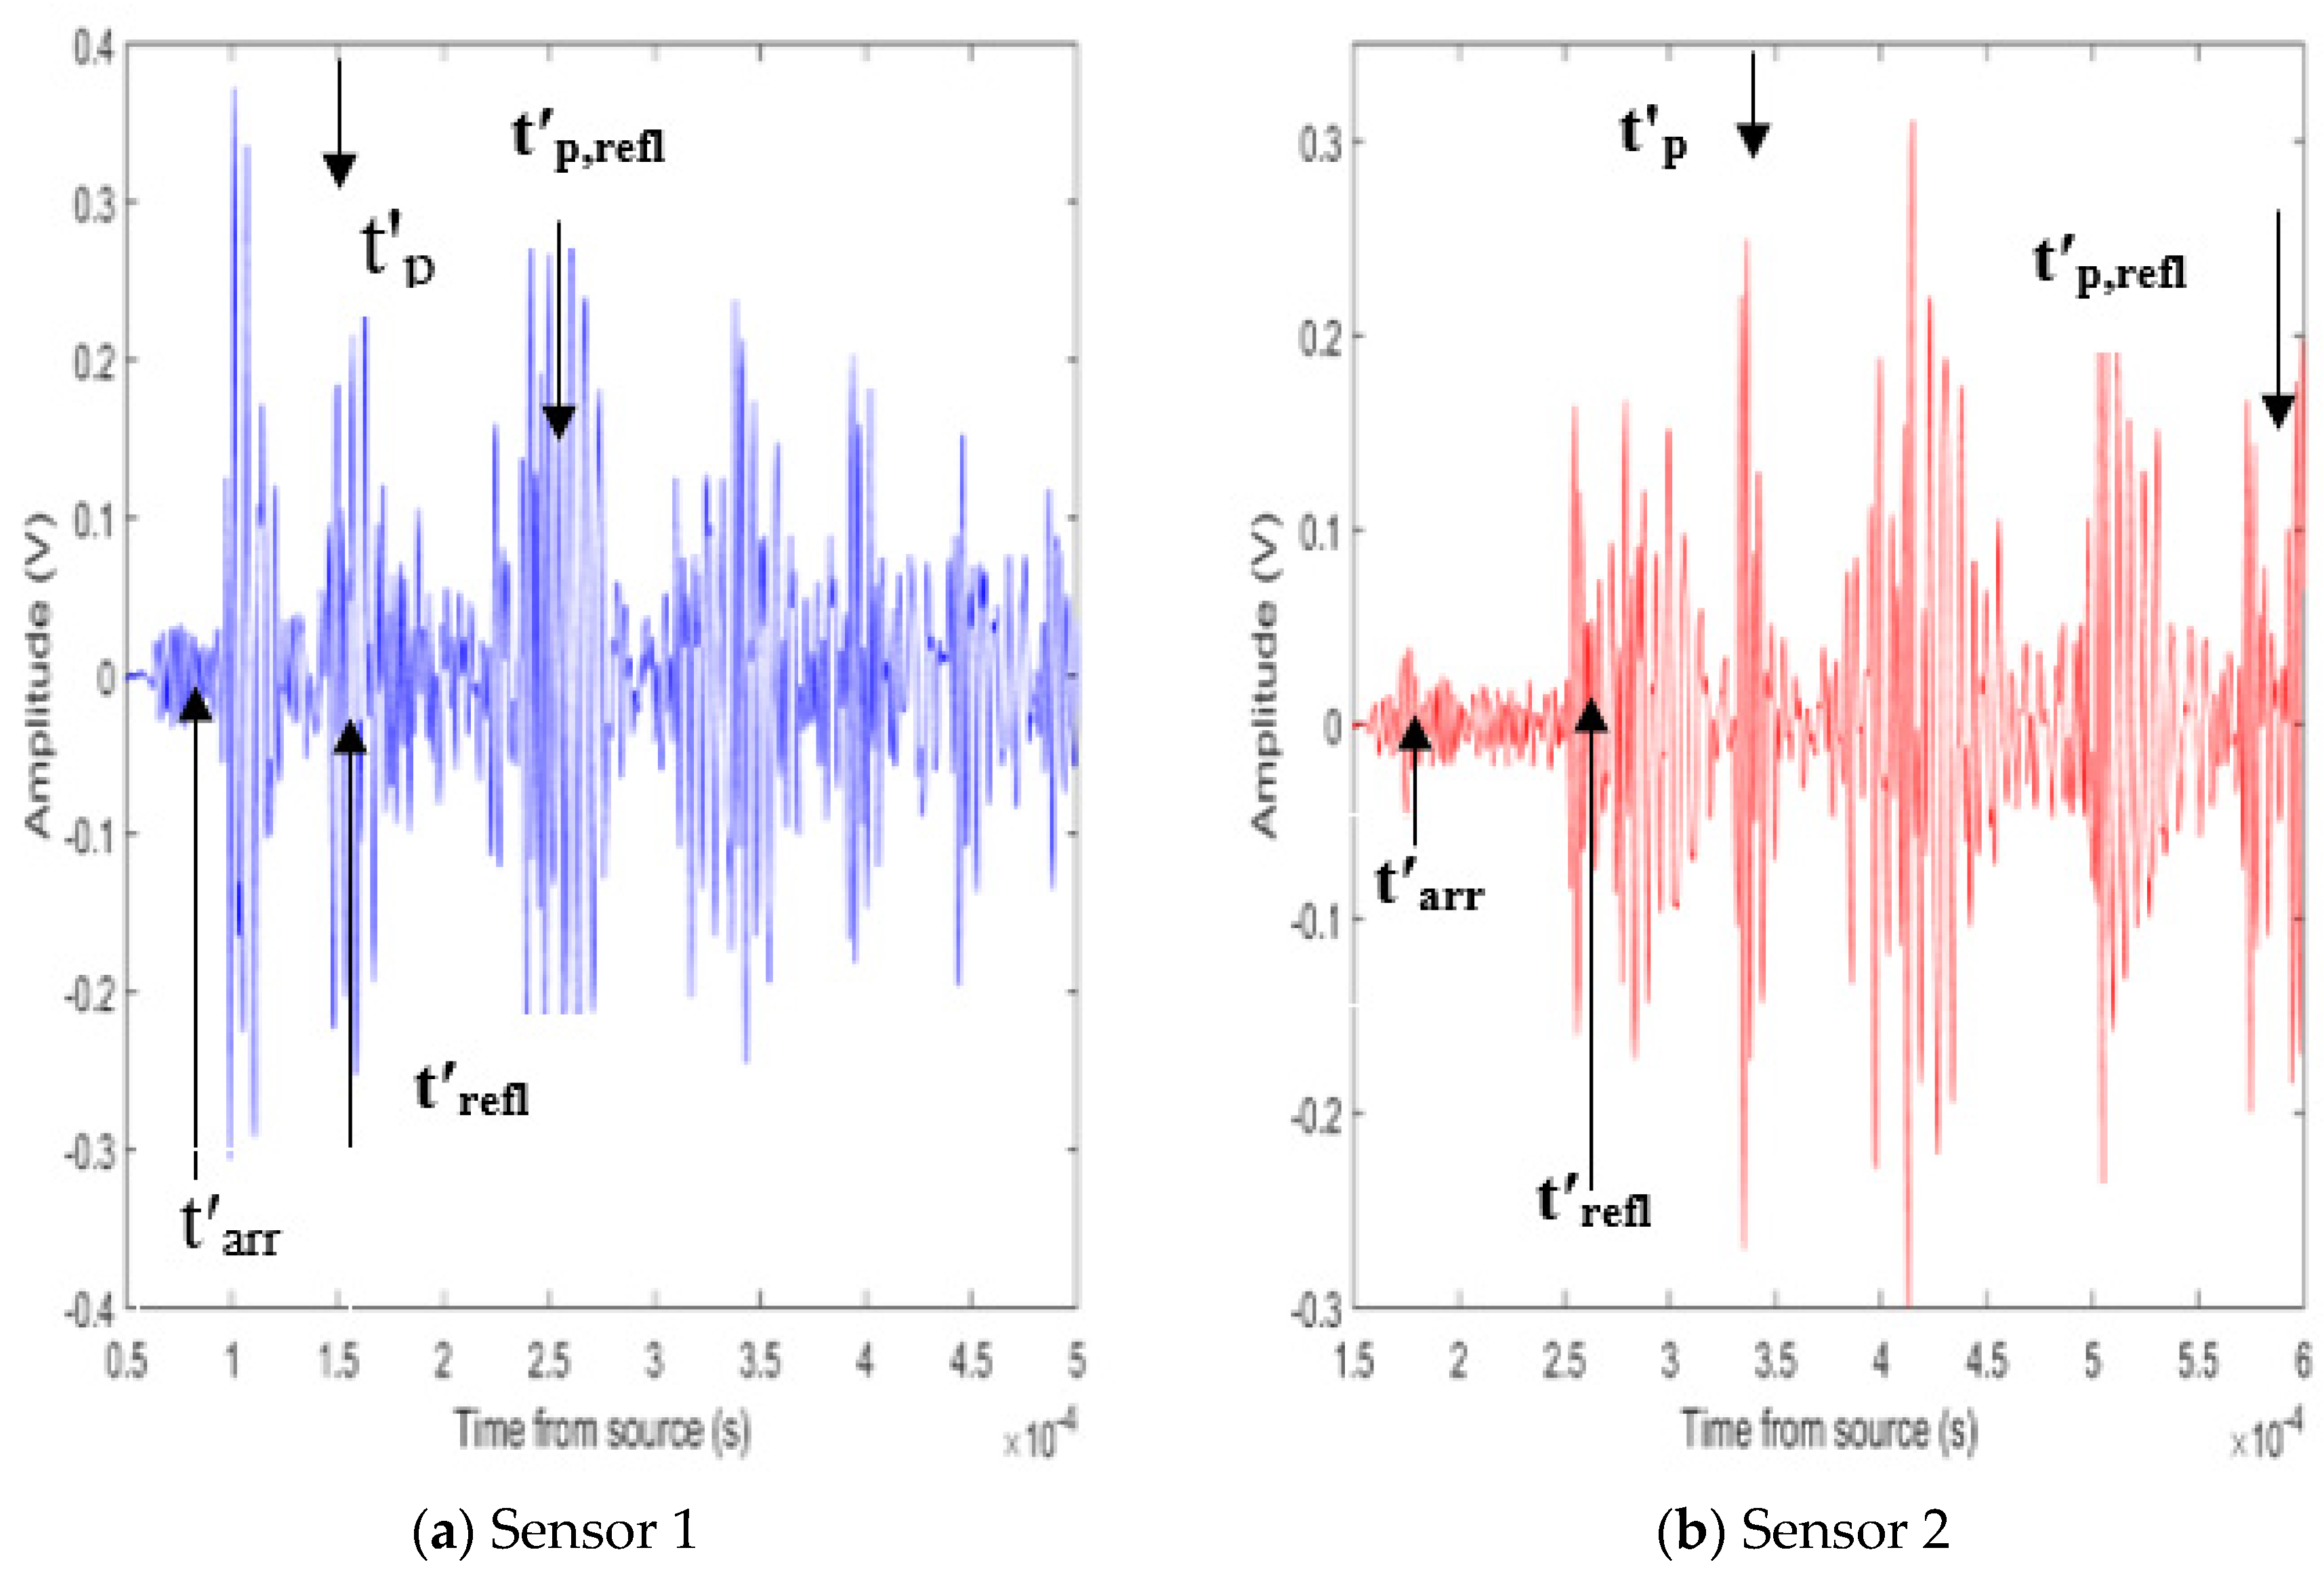
Figure 6 shows the first wave arrival time of both the trigger and second sensor for a typical Hsu–Nielsen source on the pipe, the first arrival for the trigger sensor is composed of a low amplitude component that is succeeded by a high amplitude component containing the peak amplitude (tp). The length increase between the trigger and second sensor indicates that the low amplitude is travelling faster than the peak bearing amplitude.
Once more, the thresholding technique was applied using the trigger sensor as the first sensor (tarr on Figure 6a). Again, the same technique was used at the second sensor (tarr on Figure 6b). In order to attain a concession between classifying the wave components, a second wave speed was calculated using the time difference between the two tp values (Figure 6b) and this allowed for the calculation of the second return time (t′p,refl) in Figure 7. The faster-moving component (between t′arr and t′p) and both the faster- and slower-moving components (t′p and t′refl) where chosen for further analysis [37].
Several researchers [38,39] have observed that in practical scenarios, AE signals often comprise an initial wave of lower amplitude and lower attenuation, followed by a higher amplitude, slower wave with greater attenuation, a pattern that seems to be present here as well. Therefore, by using the thresholding and time–frequency analysis [25] and focusing on the latter wave as the more probable of the two, the difference in arrival time can be calculated. This is carried out by determining the duration for a P-wave to travel 1.2 × 10⁻⁵ s, minus the time it takes for an S-wave to travel 2.38 × 10⁻⁵ s.
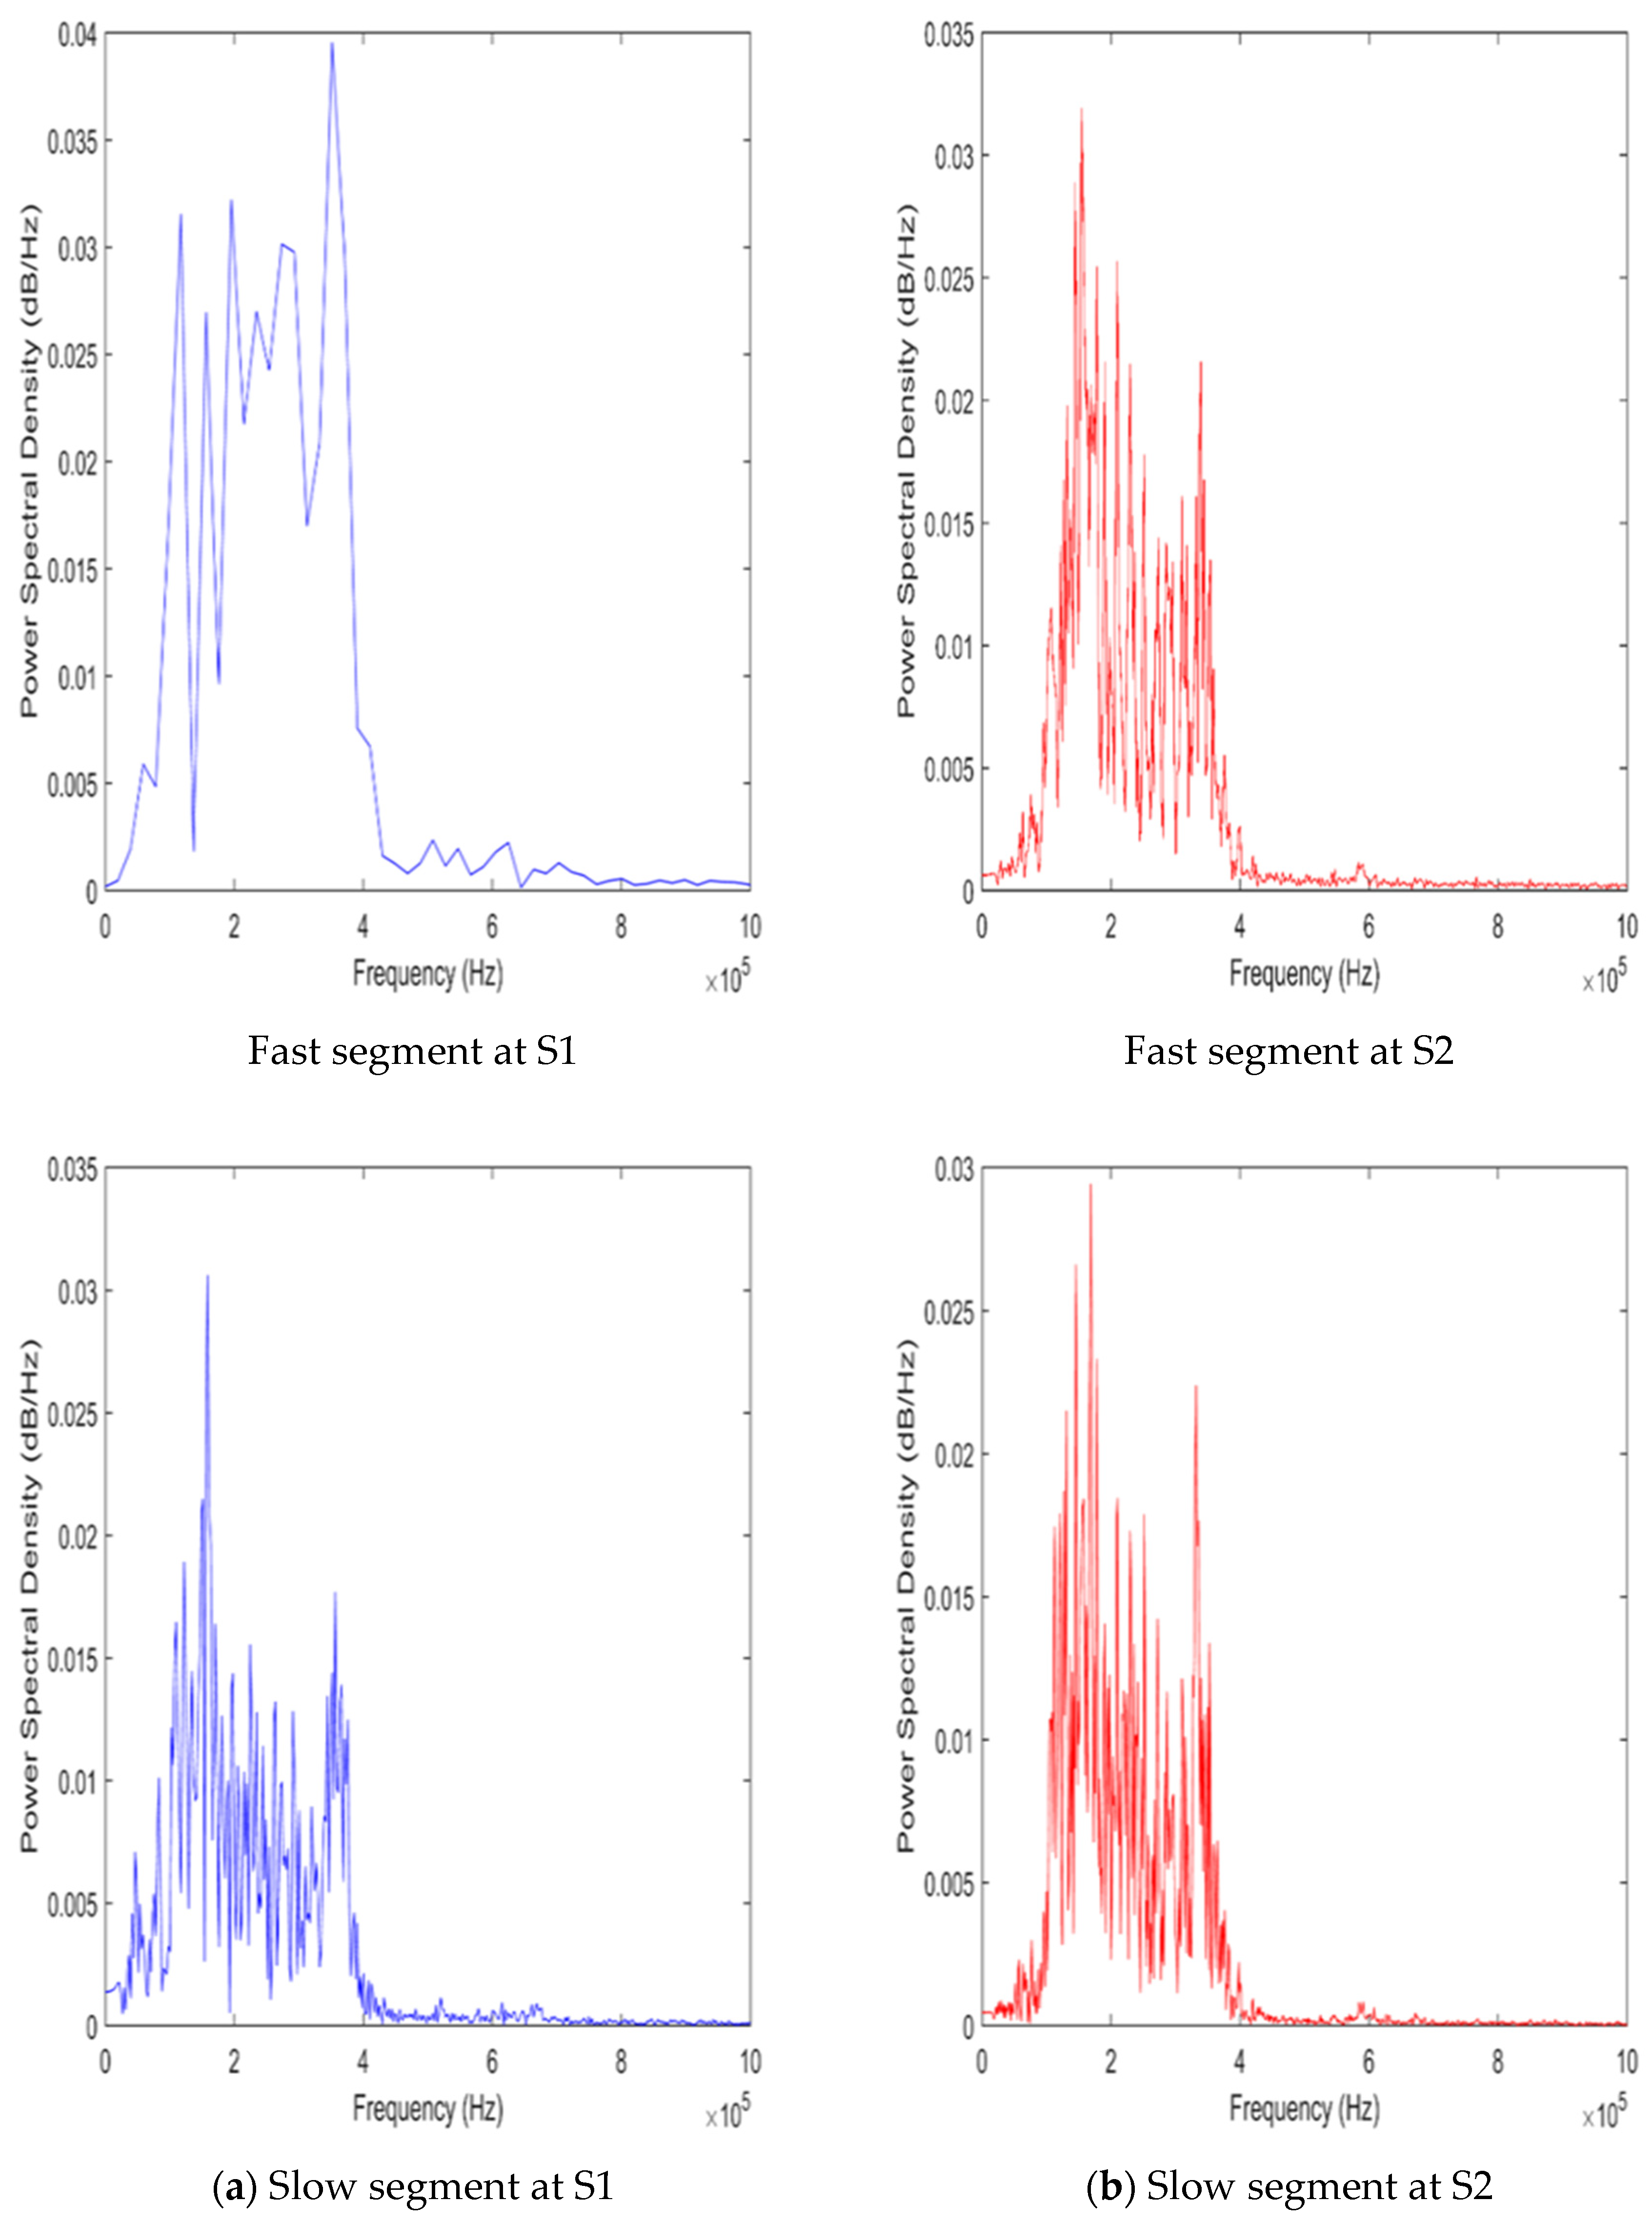
Figure 8 shows the equivalent frequency spectra for the sections shown in Figure 7; a grouping of the frequency spectrum into two bands did not indicate most of the spectral dissimilarities shown in Figure 8; therefore, three new bands, LF (<200 kHz), MF (200–500 kHz), and HF (>500 kHz), were selected, and a proportion of their power values is shown below:
f 1 = P 1 P L F + P M F + P H F

3.2. Pipe Simulation Model

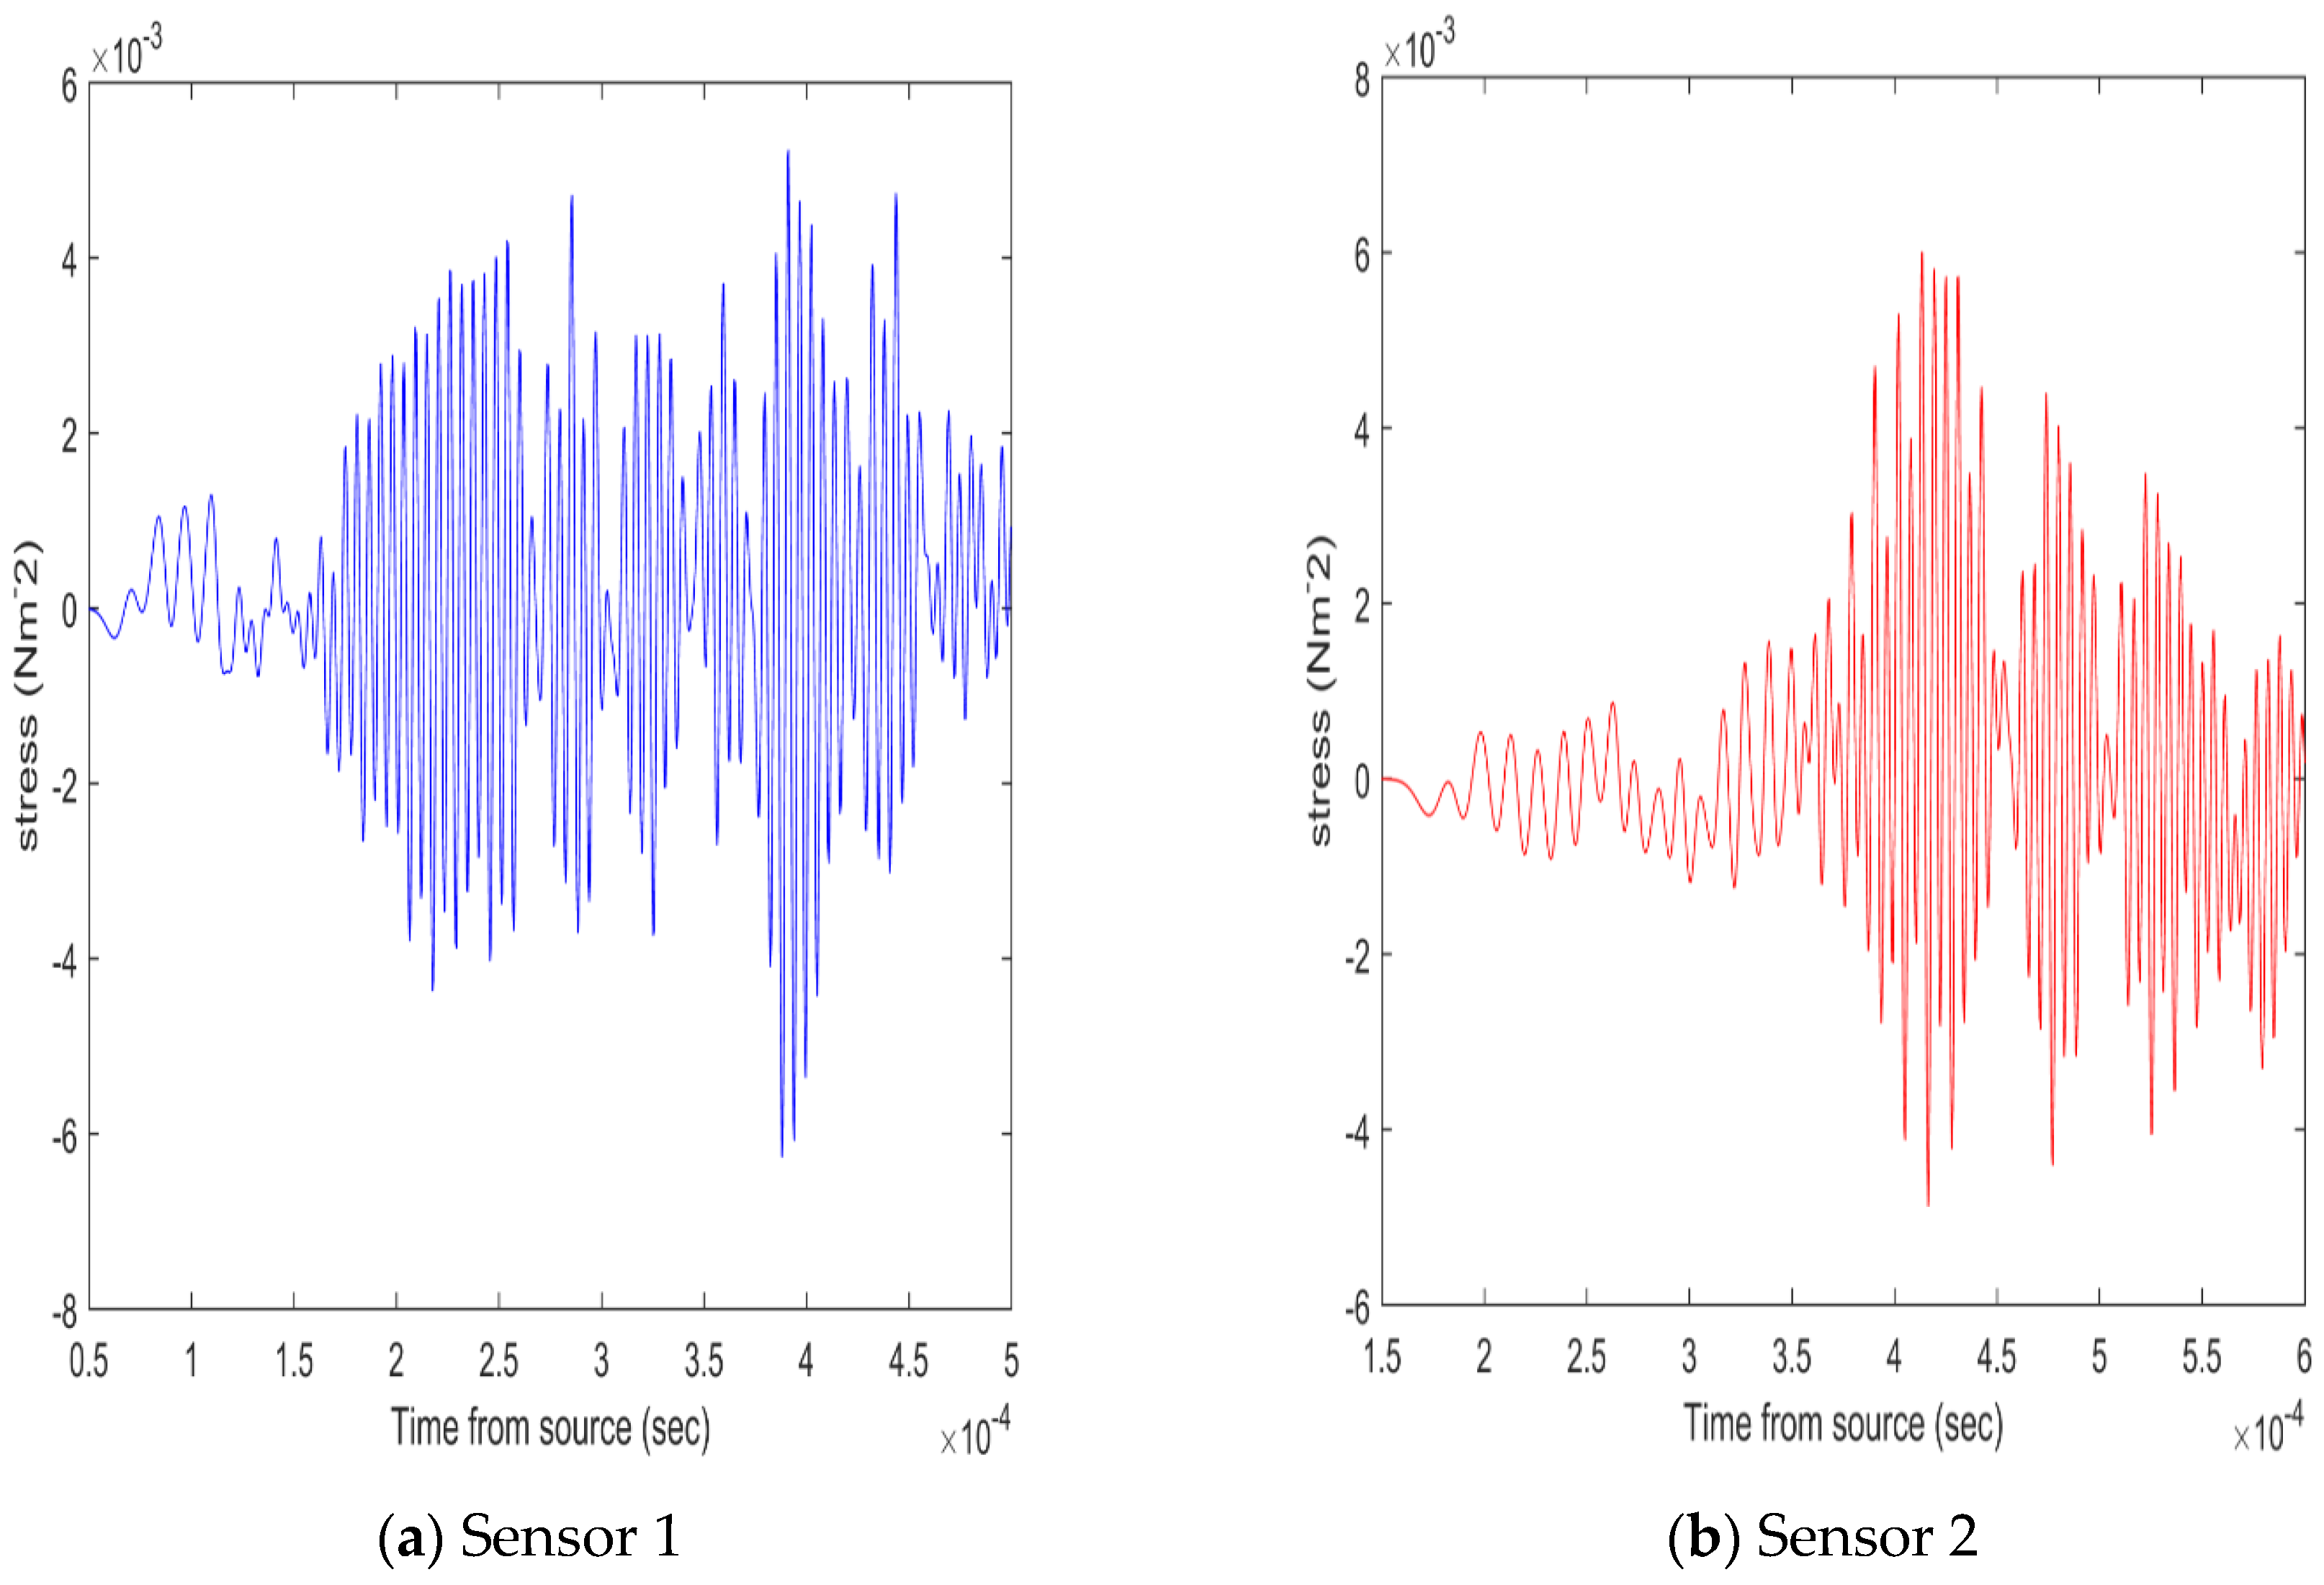
Figure 9 shows a plot of the stress time series from the simulation at the two sensor positions for the first 20 ms. As predicted, there is no indication of the damping from the experimental equivalent (Figure 4). These results are consistent with FEA simulations and previously reported AE studies [17,40]. The top trace shows the entire record and it can be seen that there is little or no attenuation of the wave, which is hardly surprising, given that the elastic model does not have any damping, and this is discussed in detail in [41,42]. Also, this happens due to reflection at boundaries, and constructive and destructive interference [42]. When these signals interact at boundaries, the inherent multimodal and dispersive properties of Lamb waves give rise to complex phenomena, including reflection, transmission, interference, and mode conversion [43].
The spectra for the simulated segments in Figure 10 resemble those depicted in Figure 8; however, significant differences are observed between the sensor positions, although these variations are less pronounced for the unload rate.
Based on these observations, it is obvious that the wave has reverberated in the relatively short length of pipe inherent in the experimental model [44].

3.3. Comparison of Experiments to Simulation

Figure 11 shows the frequency spectral composition for the mean experimental measurements for individual position and section. There are more similarities between the simulations and experiments. Firstly, the high-frequency band is very common in the fast section, as shown on the trigger sensor, implying that the lower amplitude, first arriving wave is of higher frequency. Furthermore, the high-frequency power in the fast section is significantly lowered by the time it reaches the second sensor—this supports the studies by [43,45] which is largely as a result of selective attenuation of the higher-frequency wave components [34,46]. A comparison with the mean of the simulations for all unload rates confirms that higher-frequency elements are commonly less obvious in the simulations than in the actual experiments.
Also, both simulation and experiment show a lower high-frequency composition; this move in the spectral composition between the low-frequency and medium-frequency bands is highlighted in Figure 12 where the fast components are consistent for both simulation and experiment. This result is consistent with the observations made by Yiting et al. in their study of AE characteristics on steel specimens [47].
A comparison of the simulated and experimental results indicates that the actual unloading rate is at the high end of those investigated, which agrees with findings reported by Sause et al. [22], who modelled the source unloading rate as a linear ramp function with parameters. Although the frequency content of the resulting wave was not highly sensitive to unloading rate, the amplitude of the simulated signal was, however, rather sensitive to unloading rate. Similarly, an analysis of the unload rates studies shows that the faster unload rates in the simulations gave rise to increased high-frequency contents in the first-arriving waves but resulted in a considerable reduction in signal amplitude and total signal power. Also, a comparison of the first few tens of microseconds of the simulated and experimental waveform shows that the first arrival is consistent with a wave speed of around 5000 ms−1, which agrees well with the experimental values obtained by [47,48].

4. Conclusions

This study presents a novel systematic investigation of AE wave propagation in pipes by combining both PLB experiments and matching FE simulations. The key objective of this study is the feasibility of utilising FE modelling to determine the actual structure of AE wave propagation, specifically the actual unload rate for PLBs.
The results of the simulations align closely with the experimental work conducted in this project, as well as with prior research documented in the literature. Furthermore, these outcomes bring to light several compelling aspects. First, it was established that an unloading time in the simulations of around 10−8 s gave a reasonable representation of the frequency structure of experimentally observed stress waves in PLBs. It was also observed from both experiments and simulations that a low-amplitude wave travelling at around 5500 ms−1 was the first to arrive at any surface sensor. The structure thereafter was complex due to reflections from the inner wall of the pipe and geometric interference as the wave spreads around the circumference of the pipe.
A further comparison of the first few tens of microseconds of the simulated an experimental waveform suggests that, although the first arrival is consistent with a wave speed of around 5000 ms−1, the real wave generated by a pencil-lead break is not due to a simple compressive direct stress unload. Also, an analysis of the unload rates studies shows that the faster unload rates in the simulations gave rise to increased high-frequency contents in the first-arriving waves but resulted in a considerable reduction in signal amplitude and total signal power. Another key finding in this work is that the AE line structure of an impulsive source can be reproduced by simulation for short times; for longer times, the damping associated with reflections would require being measured and introduced into the simulations to fully represent the real practical simulation. The degree of damping is important in making a cumulative assessment of multiple impulsive sources.
By analysing the frequency shift in the spectral contents from both experimental and simulated waves, valuable insights have been gained about the source characteristics. Such insights are crucial for accurately interpreting acoustic emission data and applying it effectively in practical scenarios. The approach taken here, in which the FEA technique has been combined with matching experiments, has the potential to be very useful for AE monitoring of structures.
A limitation of this work is that as attenuation is likely to be crucial in any practical application, as sensors would need to be spaced kilometres or even tens of kilometres apart to be cost-effective for monitoring purposes. The literature suggests that this is feasible, although understanding the selective attenuation of certain frequencies and the separation of different wave speeds is essential. This work has developed methodologies to address this practical problem, but several key issues remain:
  • Experiments on near full-scale pipes over longer lengths (tens of meters): These experiments would help understand attenuation at practical scales and could include variations in the internal and external environment of the pipe.
  • Incorporating realistic attenuation mechanisms in simulations: Currently, the simulations only account for geometrical attenuation, which is minimal in pipes. Comparing simulations with experiments, as suggested above, would enable the development of a more accurate attenuation model.

Author Contributions

C.J.A.-O. conceived the original idea presented in the work, developed the theory, acquired funding, and planned the experimental and simulation set up. S.F. aided in drafting and editing the manuscript. B.R. aided in interpreting the simulation and experimental results. All authors have read and agreed to the published version of the manuscript.

Funding

Funding for this project was kindly provided by the Petroleum Technology Development Fund (PTDF), and the funding number is PTDF/E/OSS/PHD/OJC/320.

Data Availability Statement

The raw data supporting the conclusions of this article will be made available by the authors on request.

Acknowledgments

The authors gratefully acknowledge financial support from the Petroleum Technology Development Fund Nigeria for the research project via the Heriot Watt University on the project titled ‘Acoustic emission monitoring of pipes, combining finite element simulation and experiment for advanced source location and identification’.

Conflicts of Interest

The authors declare that they have no known competing financial interests or personal relationships that could have appeared to influence the work reported in this paper.

References

  1. Lu, H.; Guo, L.; Azimi, M.; Huang, K. Oil and Gas 4.0 era: A systematic review and outlook. Comput. Ind. 2019, 111, 68–90. [Google Scholar] [CrossRef]
  2. Wang, H.; Tong, Z.; Zhou, G.; Zhang, C.; Zhou, H.; Wang, Y.; Zheng, W. Research and demonstration on hydrogen compatibility of pipelines: A review of current status and challenges. Int. J. Hydrogen Energy 2022, 47, 28585–28604. [Google Scholar] [CrossRef]
  3. Biezma, M.V.; Andrés, M.A.; Agudo, D.; Briz, E. Most fatal oil & gas pipeline accidents through history: A lesson learned approach. Eng. Fail. Anal. 2020, 110, 104446. [Google Scholar]
  4. Kraidi, L.; Shah, R.; Matipa, W.; Borthwick, F. An investigation of mitigating the safety and security risks allied with oil and gas pipeline projects. J. Pipeline Sci. Eng. 2021, 1, 349–359. [Google Scholar] [CrossRef]
  5. Verstrynge, E.; Lacidogna, G.; Accornero, F.; Tomor, A. A review on acoustic emission monitoring for damage detection in masonry structures. Constr. Build. Mater. 2021, 268, 121089. [Google Scholar] [CrossRef]
  6. Rong, X.; Xie, A.; Zhao, P.; Wang, S.; Wei, X. Damage Detection and Evaluation of Stud Connectors for Composite Girder Bridge Using Acoustic Emission. J. Bridge Eng. 2024, 29, 4024001. [Google Scholar] [CrossRef]
  7. Tonelli, D.; Luchetta, M.; Rossi, F.; Migliorino, P.; Zonta, D. Structural health monitoring based on acoustic emissions: Validation on a prestressed concrete bridge tested to failure. Sensors 2020, 20, 7272. [Google Scholar] [CrossRef]
  8. Brunner, A.J. Structural health and condition monitoring with acoustic emission and guided ultrasonic waves: What about long-term durability of sensors, sensor coupling and measurement chain. Appl. Sci. 2021, 11, 11648. [Google Scholar] [CrossRef]
  9. Grazion, S.V.; Mukomela, M.V.; Erofeev, M.N.; Spiryagin, V.V.; Amelin, S.S. Experimental estimation of the waveguide effect on the acoustic emission signal parameters in monitoring facilities with a long surface radius of curvature. J. Mach. Manuf. Reliab. 2020, 49, 971–979. [Google Scholar] [CrossRef]
  10. Prajna, K.; Mukhopadhyay, C.K. Fractional Fourier transform based adaptive filtering techniques for acoustic emission signal enhancement. J. Nondestruct. Eval. 2020, 39, 1–15. [Google Scholar] [CrossRef]
  11. Wang, J.; Huo, L.; Liu, C.; Song, G. A new acoustic emission damage localization method using synchro squeezed wavelet transforms picker and time-order method. Struct. Health Monit. 2021, 20, 2917–2935. [Google Scholar] [CrossRef]
  12. Madarshahian, R.; Ziehl, P.; Caicedo, J.M. Acoustic emission Bayesian source location: Onset time challenge. Mech. Syst. Signal Process. 2019, 123, 483–495. [Google Scholar] [CrossRef]
  13. Sause, M.G.R. Investigation of pencil-lead breaks as acoustic emission sources. J. Acoust. Emiss. 2011, 29, 184–196. [Google Scholar]
  14. Šofer, M.; Cienciala, J.; Fusek, M.; PavlíCek, P.; Moravec, R. Damage analysis of composite CFRP tubes using acoustic emission monitoring and pattern recognition approach. Materials 2021, 14, 786. [Google Scholar] [CrossRef]
  15. Adamczak-Bugno, A.; Lipiec, S.; Adamczak, J.; Vičan, J.; Bahleda, F. Identification of Destruction Processes and Assessment of Deformations in Compressed Concrete Modified with Polypropylene Fibers Exposed to Fire Temperatures Using Acoustic Emission Signal Analysis, Numerical Analysis, and Digital Image Correlation. Materials 2023, 16, 6786. [Google Scholar] [CrossRef]
  16. Adamczak-Bugno, A.; Lipiec, S.; Vavruš, M.; Koteš, P. Non-destructive methods and numerical analysis used for monitoring and analysis of fibre concrete deformations. Materials 2022, 15, 7268. [Google Scholar] [CrossRef]
  17. Komijani, M.; Gracie, R.; Yuan, Y. Simulation of fracture propagation induced acoustic emission in porous media. Eng. Fract. Mech. 2020, 229, 106950. [Google Scholar] [CrossRef]
  18. Yu, Z.; Sun, J.; Xu, C.; Du, F. Locating of acoustic emission source for stiffened plates based on stepwise time-reversal processing with time-domain spectral finite element simulation. Struct. Health Monit. 2023, 22, 927–947. [Google Scholar] [CrossRef]
  19. Oz, F.E.; Calik, E.; Ersoy, N. Finite element analysis and acoustic emission monitoring of progressive failure of corrugated core composite structures. Compos. Struct. 2020, 253, 112775. [Google Scholar] [CrossRef]
  20. Mu, W.; Gao, Y.; Wang, Y.; Liu, G.; Hu, H. Modeling and analysis of acoustic emission generated by fatigue cracking. Sensors 2022, 22, 1208. [Google Scholar] [CrossRef]
  21. Sause, M.G.R.; Richler, S. Finite element modelling of cracks as acoustic emission sources. J. Nondestruct. Eval. 2015, 34, 4. [Google Scholar] [CrossRef]
  22. Sause, M.G.R.; Hamstad, M.A. Numerical modeling of existing acoustic emission sensor absolute calibration approaches. Sens. Actuators A Phys. 2018, 269, 294–307. [Google Scholar] [CrossRef]
  23. Angulo, Á.; Yang, H.; Tang, J.; Khadimallah, A.; Soua, S. Structural Health Monitoring of Crack Initiation and Growth in Mooring Chains using FEA Methods for Acoustic Emission Characterisation. J. Acoust. Emiss. 2019, 36, S107. [Google Scholar]
  24. Banjara, N.K.; Sasmal, S.; Voggu, S. Machine learning supported acoustic emission technique for leakage detection in pipelines. Int. J. Press. Vessel. Pip. 2020, 188, 104243. [Google Scholar] [CrossRef]
  25. Quy, T.B.; Kim, J.-M. Crack detection and localization in a fluid pipeline based on acoustic emission signals. Mech. Syst. Signal Process. 2021, 150, 107254. [Google Scholar] [CrossRef]
  26. Abolle-Okoyeagu, C.J. Acoustic Emission Monitoring of Pipes; Combining Finite Element Simulation and Experiment for Advanced Source Location and Identification. Ph.D. Thesis, Heriot-Watt University, Edinburgh, UK, 2019. [Google Scholar]
  27. Bolander, J.E.; Eliáš, J.; Cusatis, G.; Nagai, K. Discrete mechanical models of concrete fracture. Eng. Fract. Mech. 2021, 257, 108030. [Google Scholar] [CrossRef]
  28. Al-Azzawi, A.S.M.; Kawashita, L.F.; Featherston, C.A. Buckling and postbuckling behaviour of Glare laminates containing splices and doublers. Part 2: Numerical modelling. Compos. Struct. 2017, 176, 1170–1187. [Google Scholar] [CrossRef]
  29. Zhang, W.; Tong, M.; Harrison, N.M. Resolution, energy and time dependency on layer scaling in finite element modelling of laser beam powder bed fusion additive manufacturing. Addit. Manuf. 2019, 28, 610–620. [Google Scholar] [CrossRef]
  30. Motamarri, P.; Das, S.; Rudraraju, S. DFT-FE-A massively parallel adaptive finite-element code for large-scale density functional theory calculations. Comput. Phys. Commun. 2019, 246, 106853. [Google Scholar] [CrossRef]
  31. Pled, F.; Desceliers, C. Review and recent developments on the perfectly matched layer (PML) method for the numerical modeling and simulation of elastic wave propagation in unbounded domains. Arch. Comput. Methods Eng. 2022, 29, 471–518. [Google Scholar] [CrossRef]
  32. Crawford, A.; Droubi, M.G.; Faisal, N.H. Analysis of acoustic emission propagation in metal-to-metal adhesively bonded joints. J. Nondestruct. Eval. 2018, 37, 33. [Google Scholar] [CrossRef]
  33. Kaphle, M.; Tan, A.C.C.; Thambiratnam, D.P.; Chan, T.H.T. Identification of acoustic emission wave modes for accurate source location in plate-like structures. Struct. Control Health Monit. 2012, 19, 187–198. [Google Scholar] [CrossRef]
  34. Shehadeh, M.F.; Elbatran, A.H.; Mehanna, A.; Steel, J.A.; Reuben, R.L. Evaluation of acoustic emission source location in long steel pipes for continuous and semi-continuous sources. J. Nondestruct. Eval. 2019, 38, 40. [Google Scholar] [CrossRef]
  35. Asamene, K.; Hudson, L.; Sundaresan, M. Influence of attenuation on acoustic emission signals in carbon fiber reinforced polymer panels. Ultrasonics 2015, 59, 86–93. [Google Scholar] [CrossRef]
  36. Tayfur, S.; Zhang, T.; Mahdi, M.; Issa, M.; Ozevin, D. Cluster-based sensor selection framework for acoustic emission source localization in concrete. Measurement 2023, 219, 113293. [Google Scholar] [CrossRef]
  37. Karakozova, A.; Kuznetsov, S. Oscillating Nonlinear Acoustic Waves in a Mooney–Rivlin Rod. Appl. Sci. 2023, 13, 10037. [Google Scholar] [CrossRef]
  38. Das, A.K.; Leung, C.K.Y. A new power-based method to determine the first arrival information of an acoustic emission wave. Struct. Health Monit. 2019, 18, 1620–1632. [Google Scholar] [CrossRef]
  39. Haider, M.F.; Giurgiutiu, V. Theoretical and numerical analysis of acoustic emission guided waves released during crack propagation. J. Intell. Mater. Syst. Struct. 2019, 30, 1318–1338. [Google Scholar] [CrossRef]
  40. Nsengiyumva, W.; Zhong, S.; Lin, J.; Zhang, Q.; Zhong, J.; Huang, Y. Advances, limitations and prospects of nondestructive testing and evaluation of thick composites and sandwich structures: A state-of-the-art review. Compos. Struct. 2021, 256, 112951. [Google Scholar] [CrossRef]
  41. Fu, J.; Xu, M.; Zhang, Z.; Kang, W.; He, Y. Muffler structure improvement based on acoustic finite element analysis. J. Low Freq. Noise Vib. Act. Control 2019, 38, 415–426. [Google Scholar] [CrossRef]
  42. van Gemmeren, V.; Graf, T.; Dual, J. Modeling the acoustic emissions generated during dynamic fracture under bending. Int. J. Solids Struct. 2020, 203, 84–91. [Google Scholar] [CrossRef]
  43. Han, C.; Yang, G.; Wang, J.; Guo, X. The research on propagation characteristics of acoustic emission signals in stiffened plates based on the multipath propagation model. Ultrasonics 2020, 108, 106177. [Google Scholar] [CrossRef] [PubMed]
  44. Ebrahimkhanlou, A.; Dubuc, B.; Salamone, S. A generalizable deep learning framework for localizing and characterizing acoustic emission sources in riveted metallic panels. Mech. Syst. Signal Process. 2019, 130, 248–272. [Google Scholar] [CrossRef]
  45. Khon, H.; Bashkov, O.V. The study of acoustic emission waves generated from different types of sources. Mater. Today Proc. 2019, 19, 2243–2247. [Google Scholar] [CrossRef]
  46. Thiyagarajan, J.S. Non-destructive testing mechanism for pre-stressed steel wire using acoustic emission monitoring. Materials 2020, 13, 5029. [Google Scholar] [CrossRef] [PubMed]
  47. Yang, Y.; Wang, Y.; Li, K. Differences in the acoustic emission characteristics of 345 MPa normal-strength steel and 460 MPa high-strength steel. Int. J. Steel Struct. 2021, 21, 154–166. [Google Scholar] [CrossRef]
  48. Mukherjee, A.; Banerjee, A. Analysis of acoustic emission signal for crack detection and distance measurement on steel structure. Acoust. Aust. 2021, 49, 133–149. [Google Scholar] [CrossRef]
Figure 1. The Hsu–Nielson source.
Acoustics 06 00034 g001
Figure 2. Schematic representation of (a) AE experimental system setup (b) PLB experiments on pipe.
Acoustics 06 00034 g002
Figure 3. Schematic diagram of (a) full pipe (b) section of the simulation model.
Acoustics 06 00034 g003
Figure 4. Typical raw AE signals acquired at (a) S1 and (b) S2 on the pipe (full record).
Acoustics 06 00034 g004
Figure 5. Power spectra of entire time series shown in Figure 4 for (a) S1 and (b) S2 on the pipe.
Acoustics 06 00034 g005
Figure 6. Raw AE signal acquired at (a) S1 and (b) S2 on the pipe (first wave arrival).
Acoustics 06 00034 g006
Figure 7. Sections of typical AE signal acquired at S1 and S2 on the pipe, identifying reflection arrivals for slow and fast wave packets.
Acoustics 06 00034 g007
Figure 8. AE frequency spectra of time series sections for S1 and S2 on the pipe.
Acoustics 06 00034 g008
Figure 9. Sections of simulated stress AE signal for fastest unload rate at positions (a) S1 and (b) S2.
Acoustics 06 00034 g009
Figure 10. AE frequency spectra of simulated stress time series between tarr and t′prefl for the slowest unload rate at positions (a) S1 and (b) S2.
Acoustics 06 00034 g010
Figure 11. Comparison of measured (E) and simulated (Sim) power spectral composition for each of the sensor positions and time series components.
Acoustics 06 00034 g011
Figure 12. Comparison of measured (E) and simulated (Sim) low-frequency power spectral ratio (PLF/PMF) for each of the sensor positions and time series components.
Acoustics 06 00034 g012
Disclaimer/Publisher’s Note: The statements, opinions and data contained in all publications are solely those of the individual author(s) and contributor(s) and not of MDPI and/or the editor(s). MDPI and/or the editor(s) disclaim responsibility for any injury to people or property resulting from any ideas, methods, instructions or products referred to in the content.