
Perforated Steel Stud to Improve the Acoustic Insulation of Drywall Partitions


Abstract
1. Introduction
2. Materials and Methods
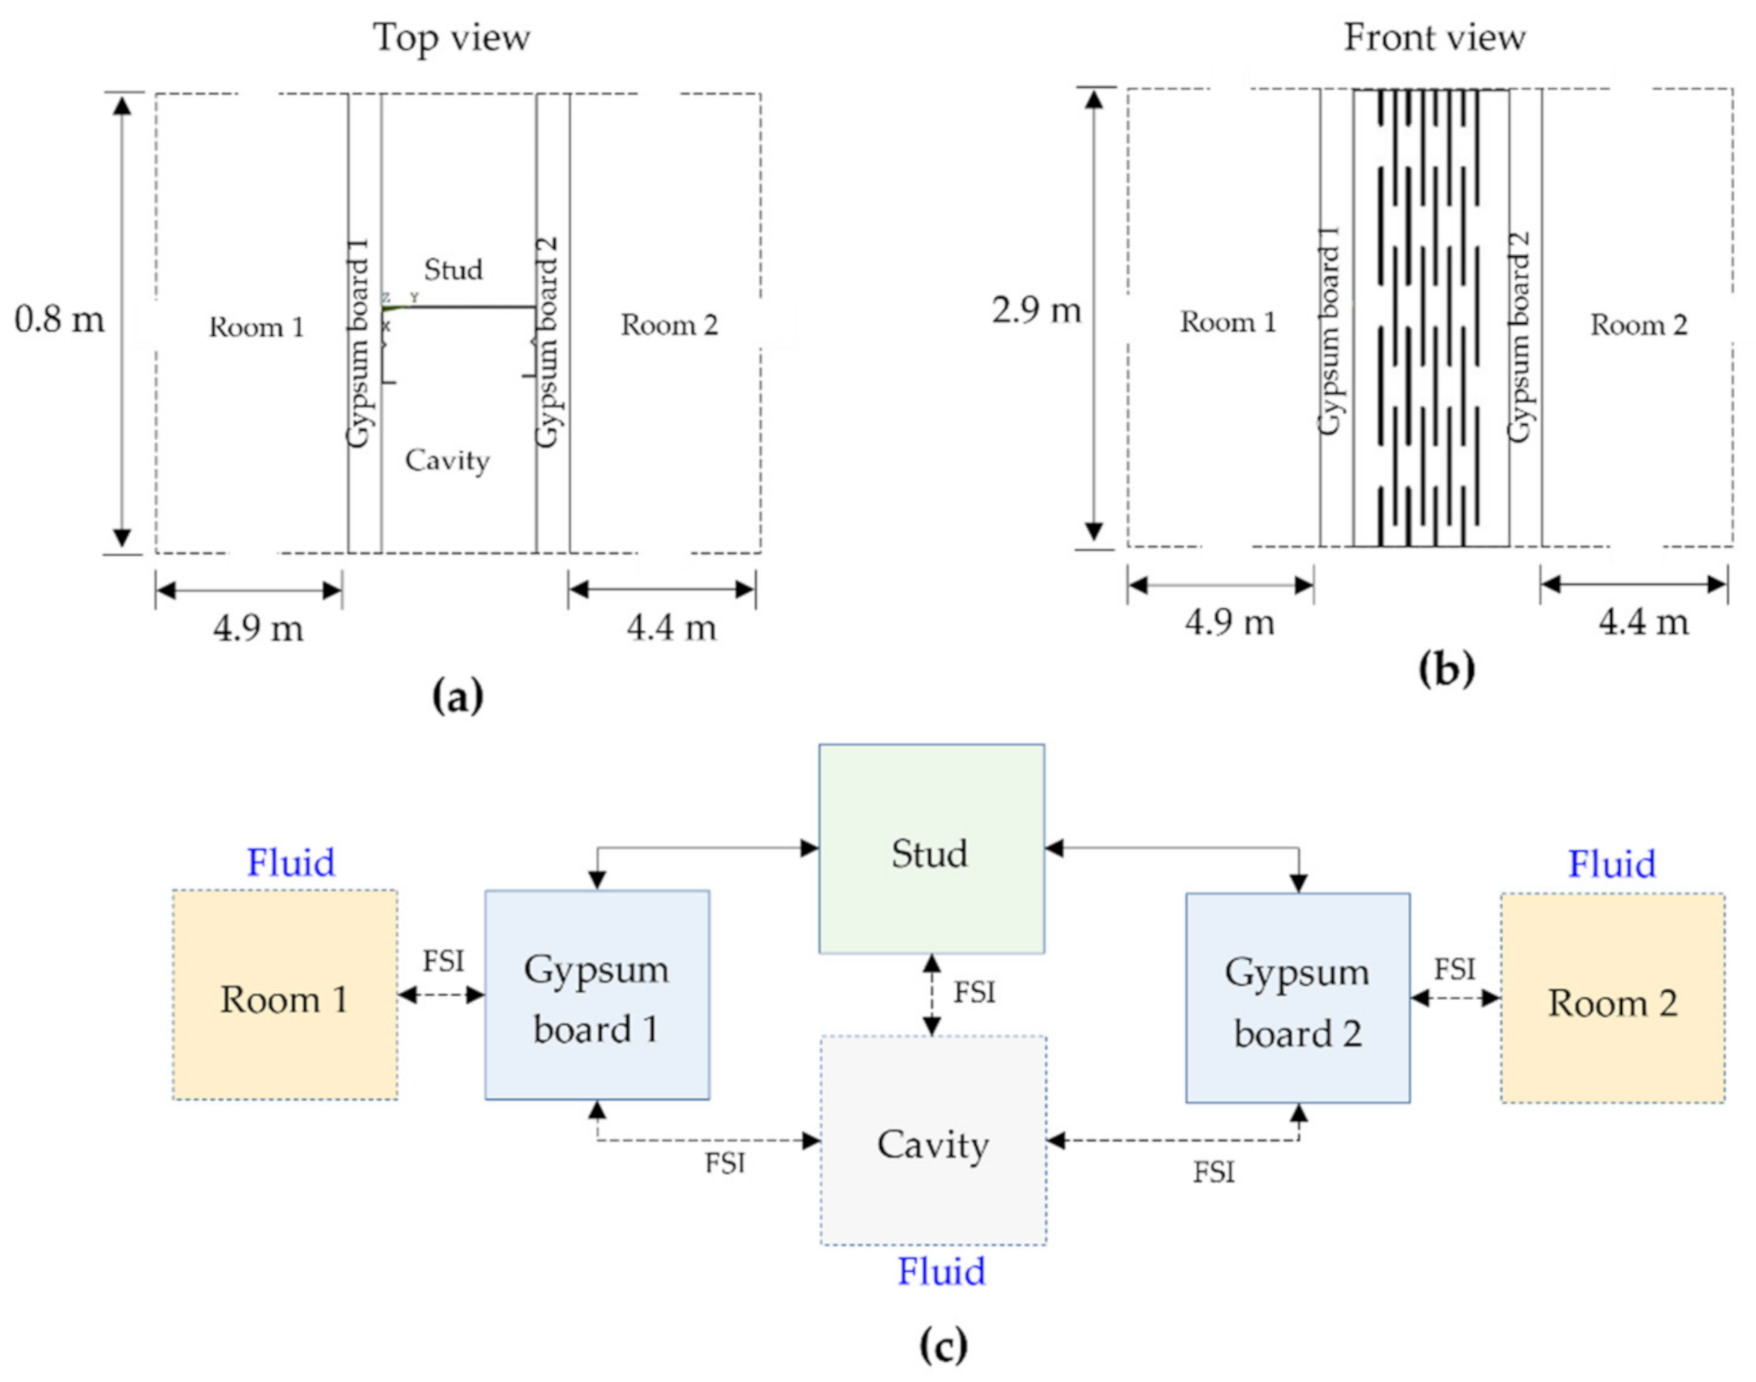
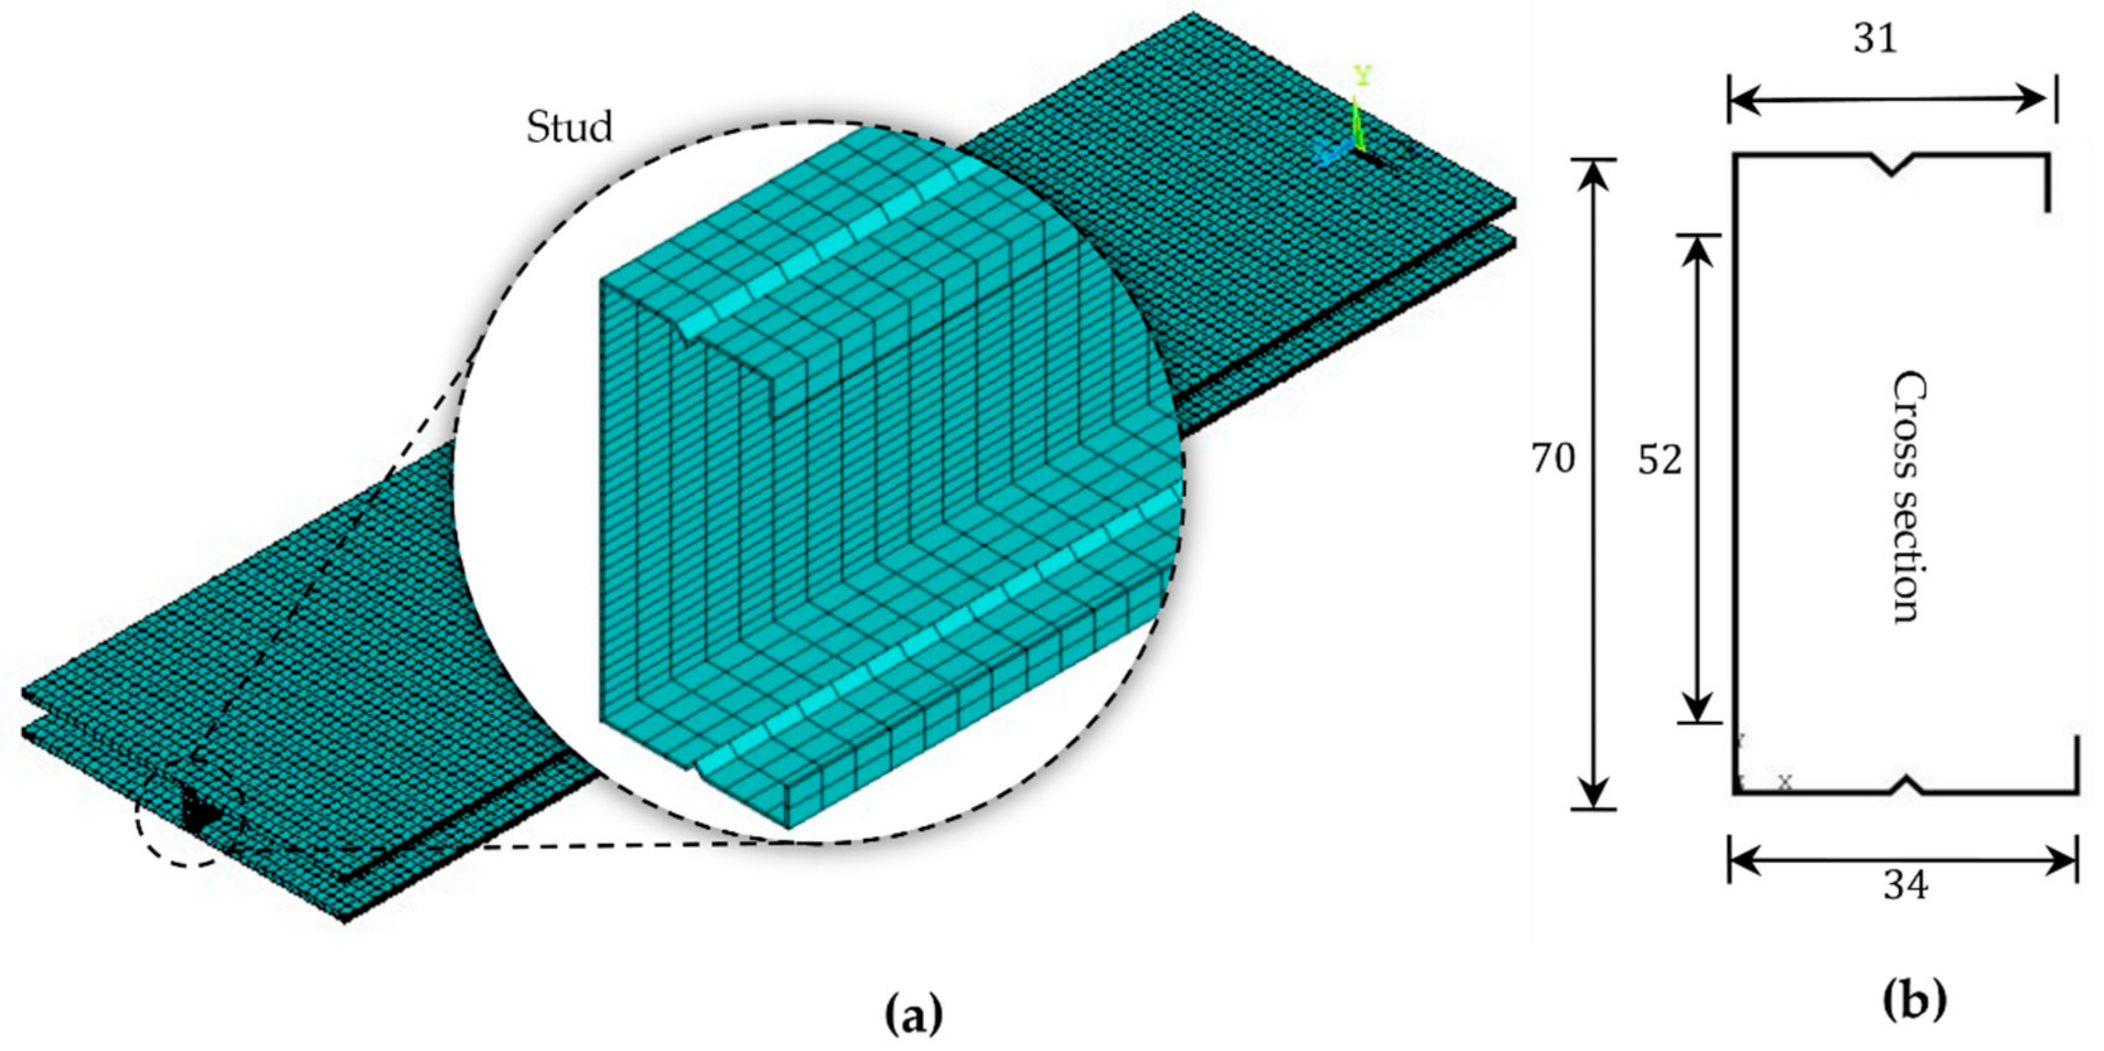
2.1. Finite Element Acoustic Model
2.2. Material and Element Properties
2.3. Experimental Test
3. Results and Discussion
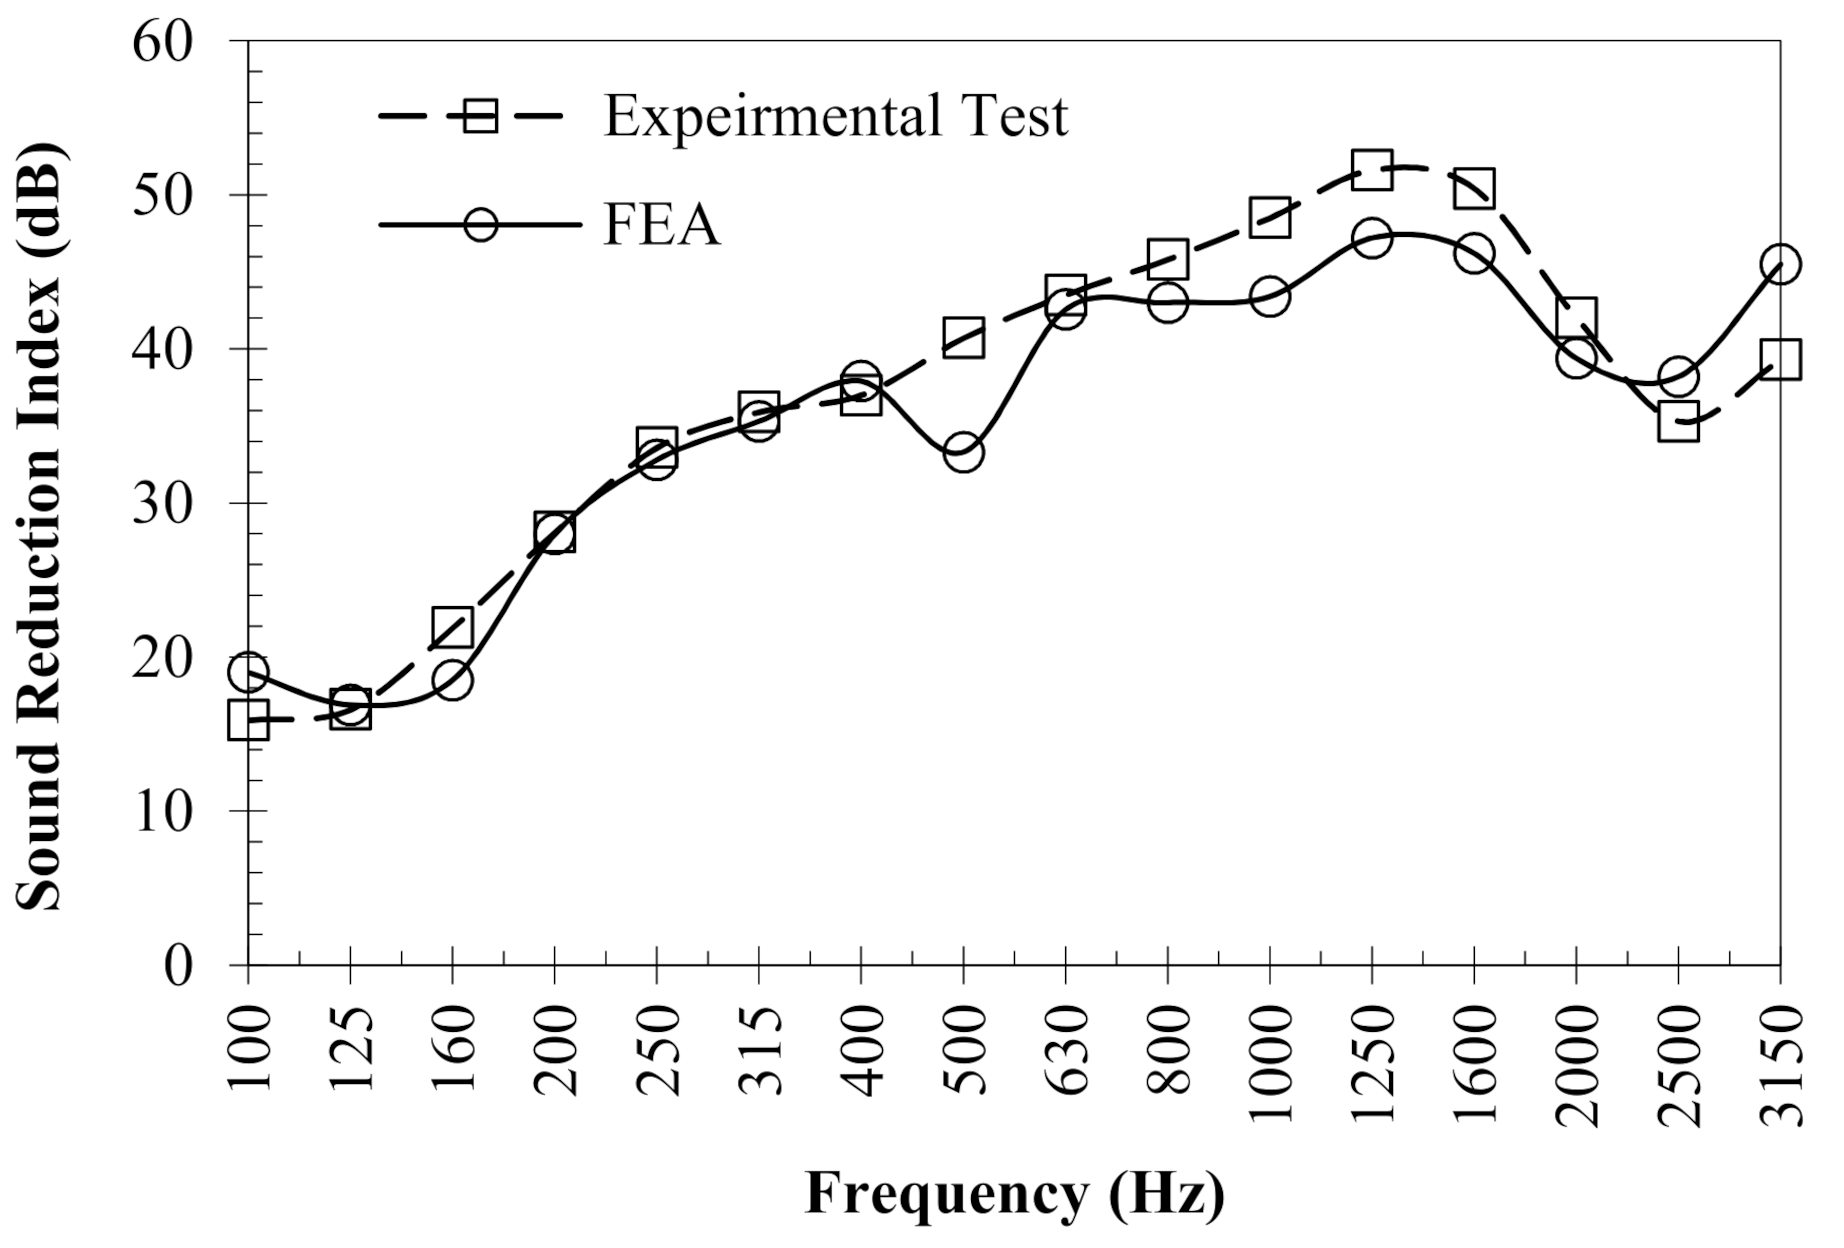
3.1. Validation of the Acoustic Model
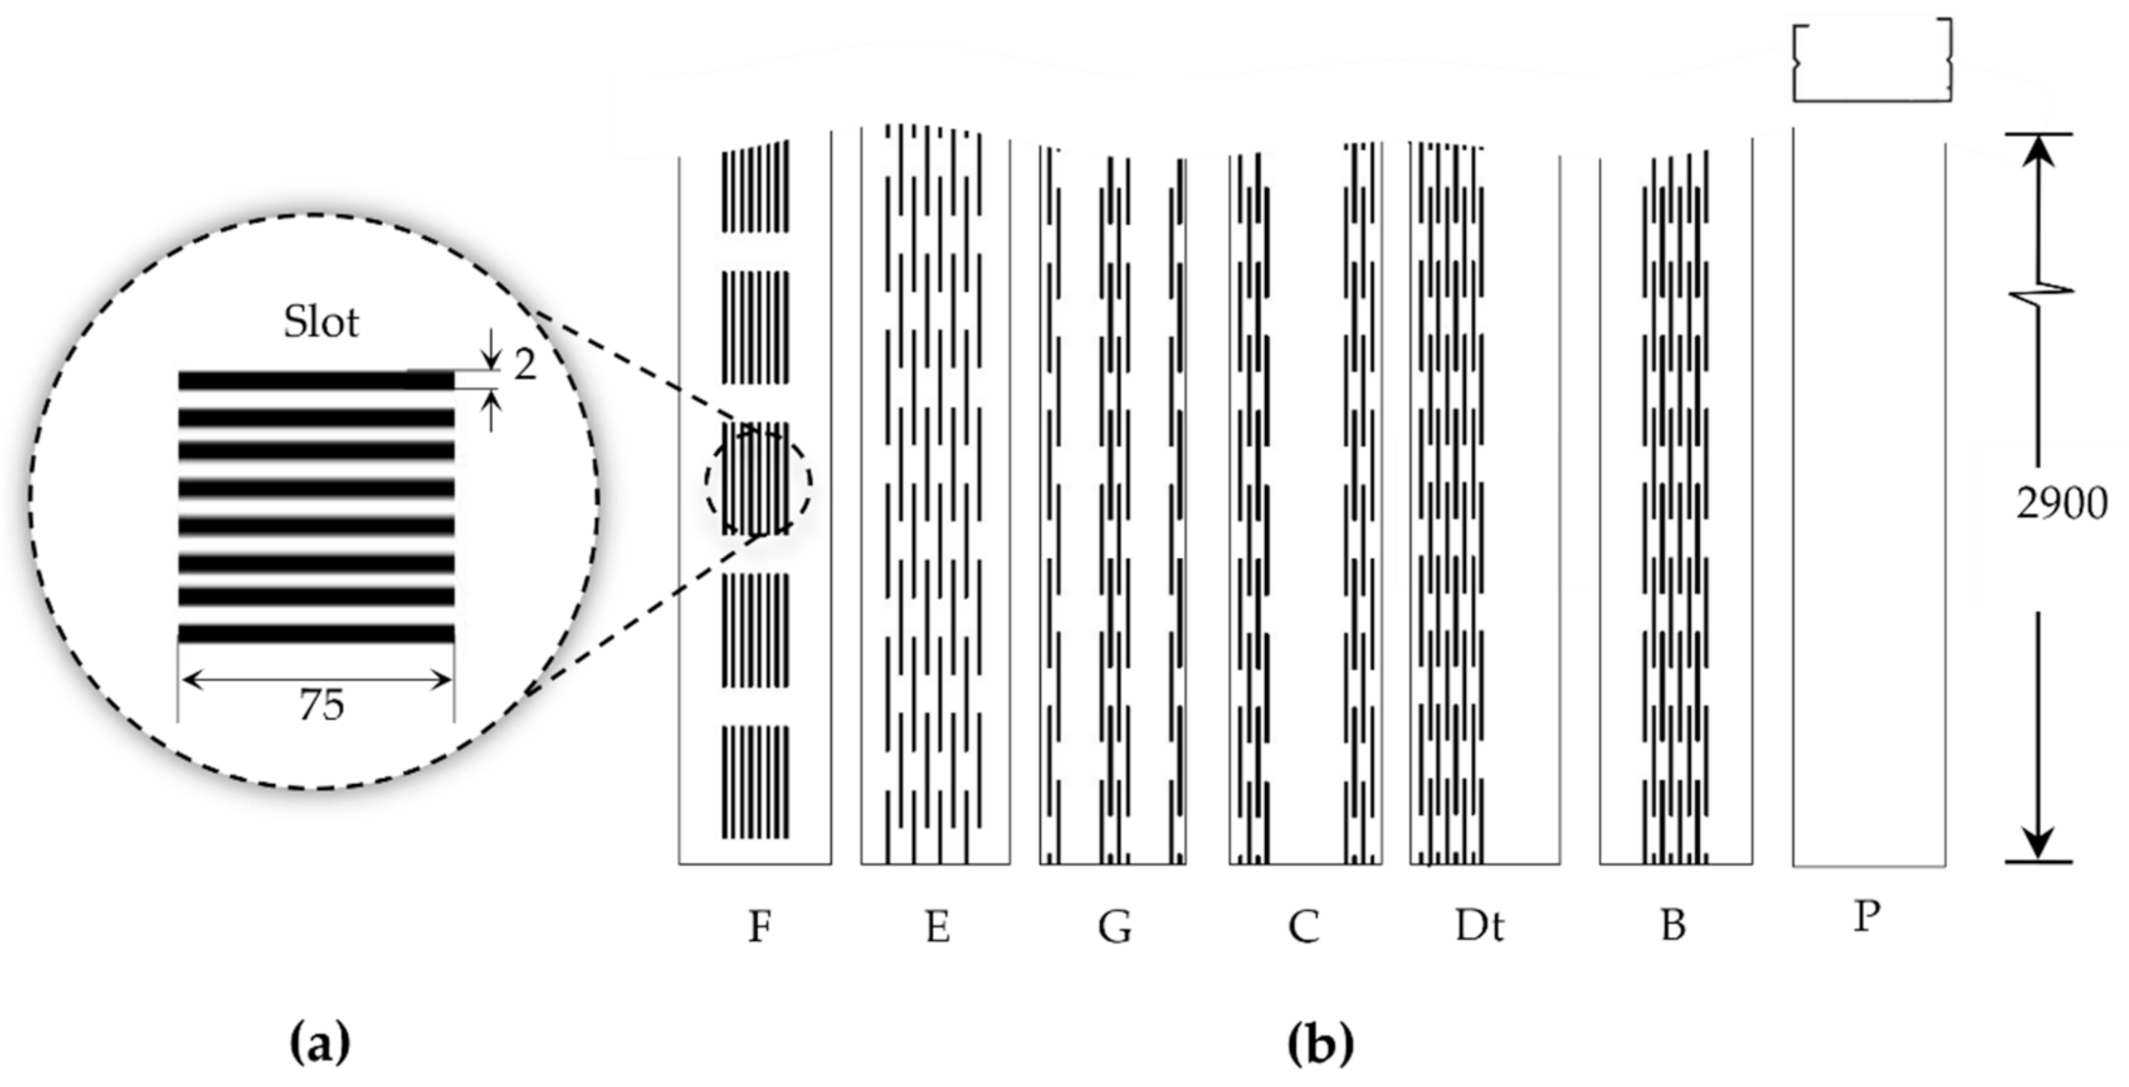
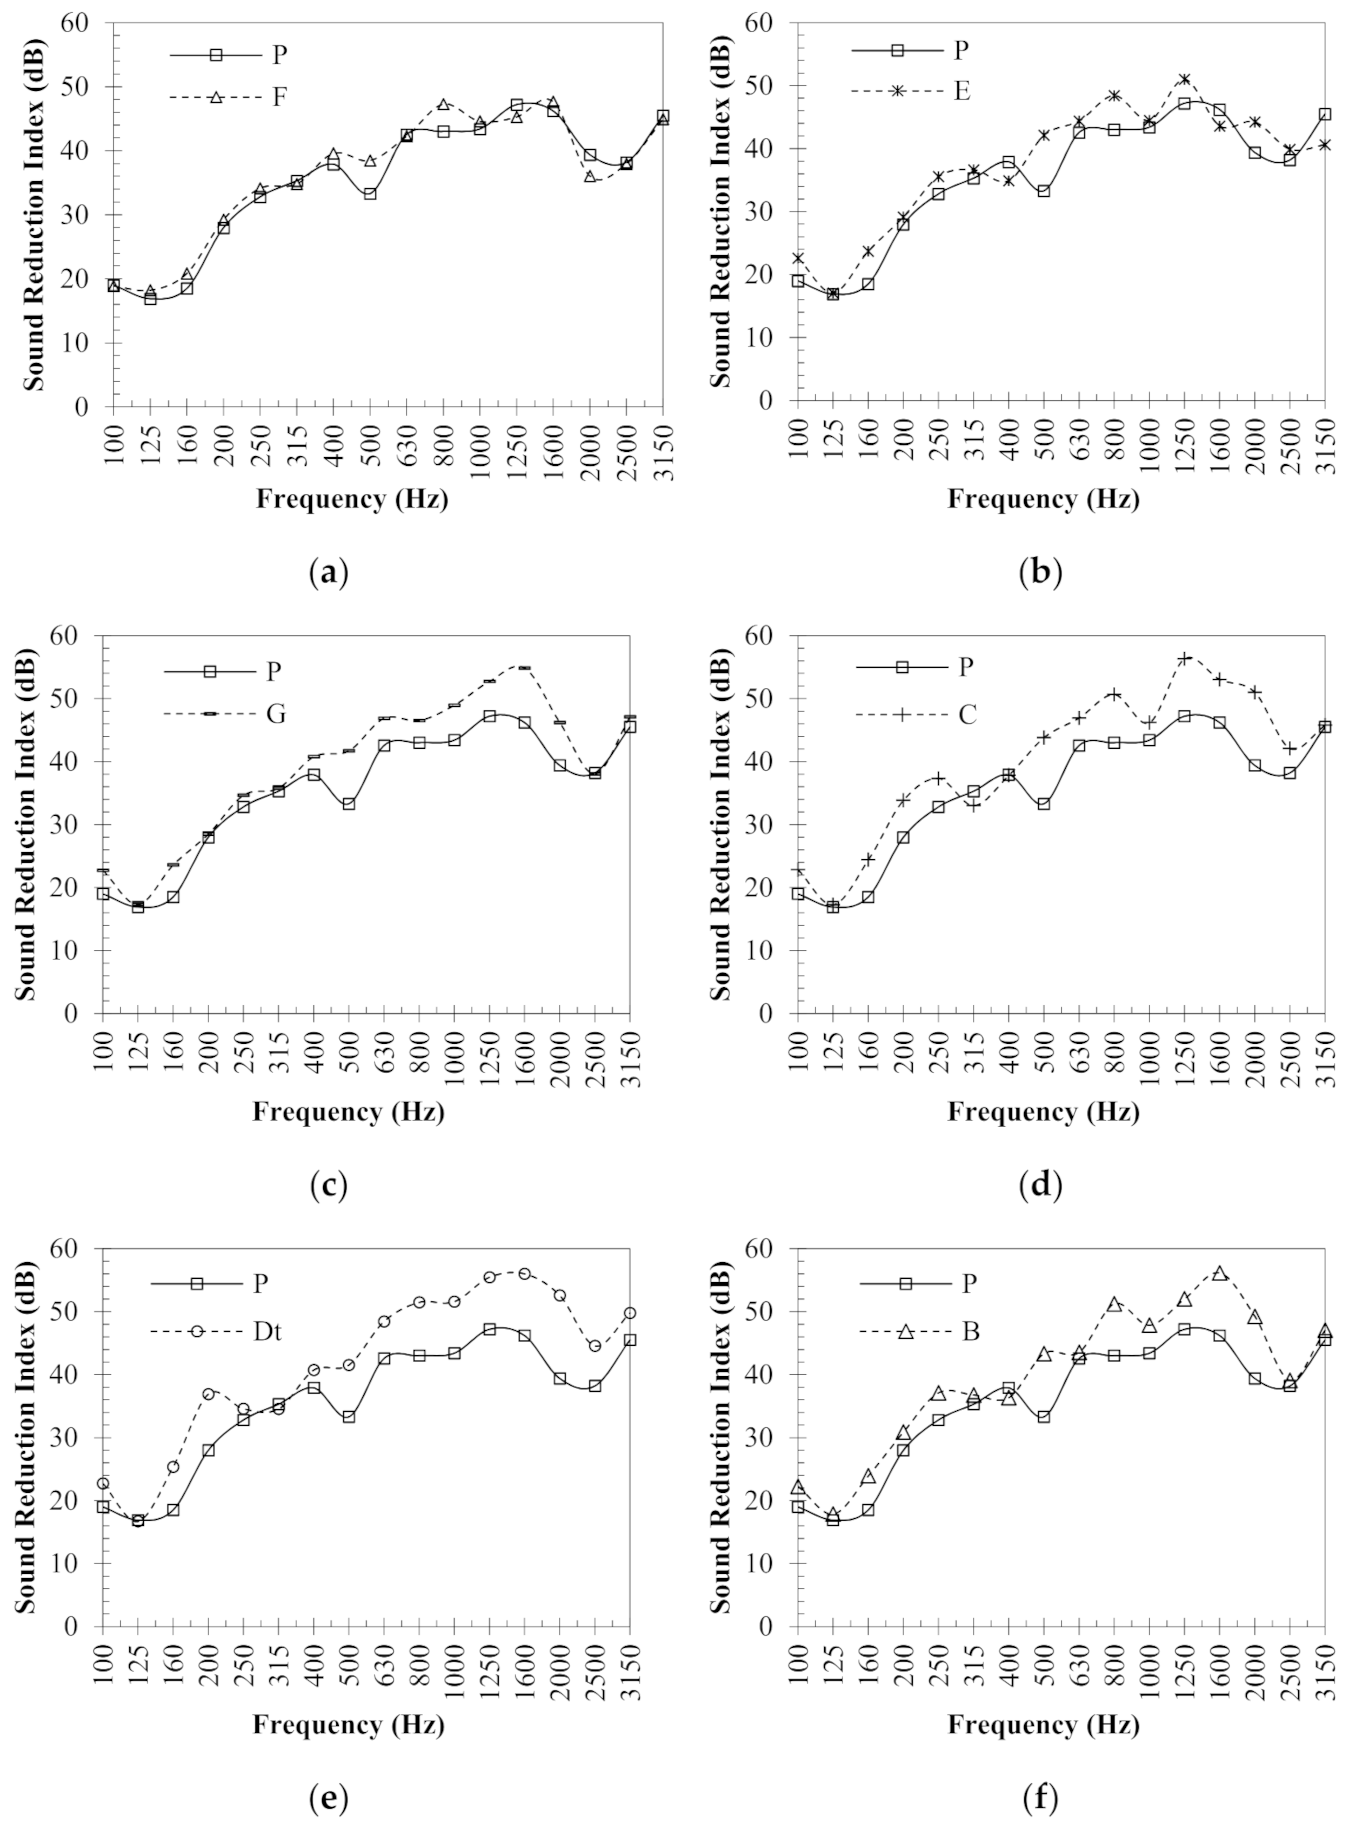
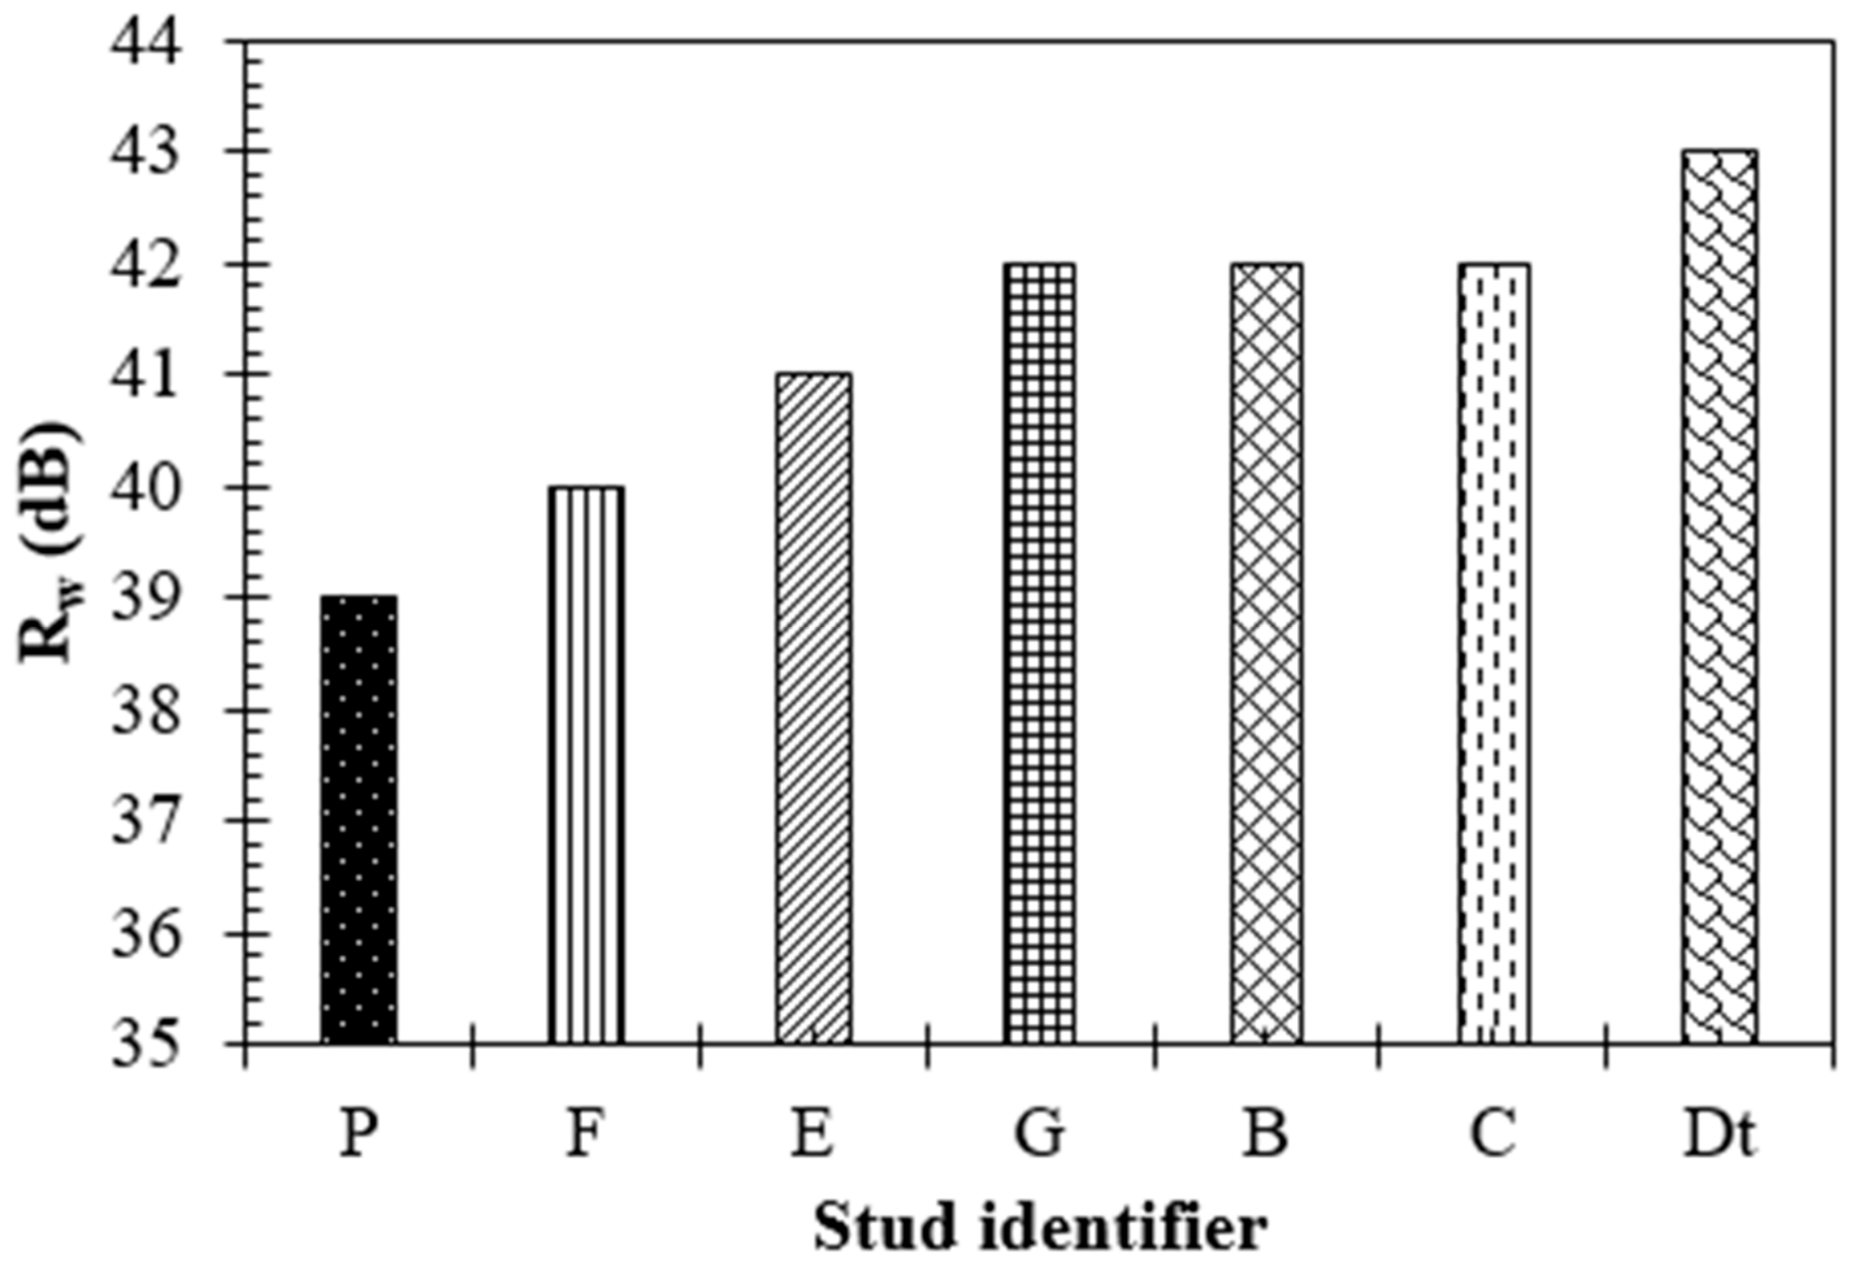
3.2. Influence of Perforated Studs on Sound Insulation
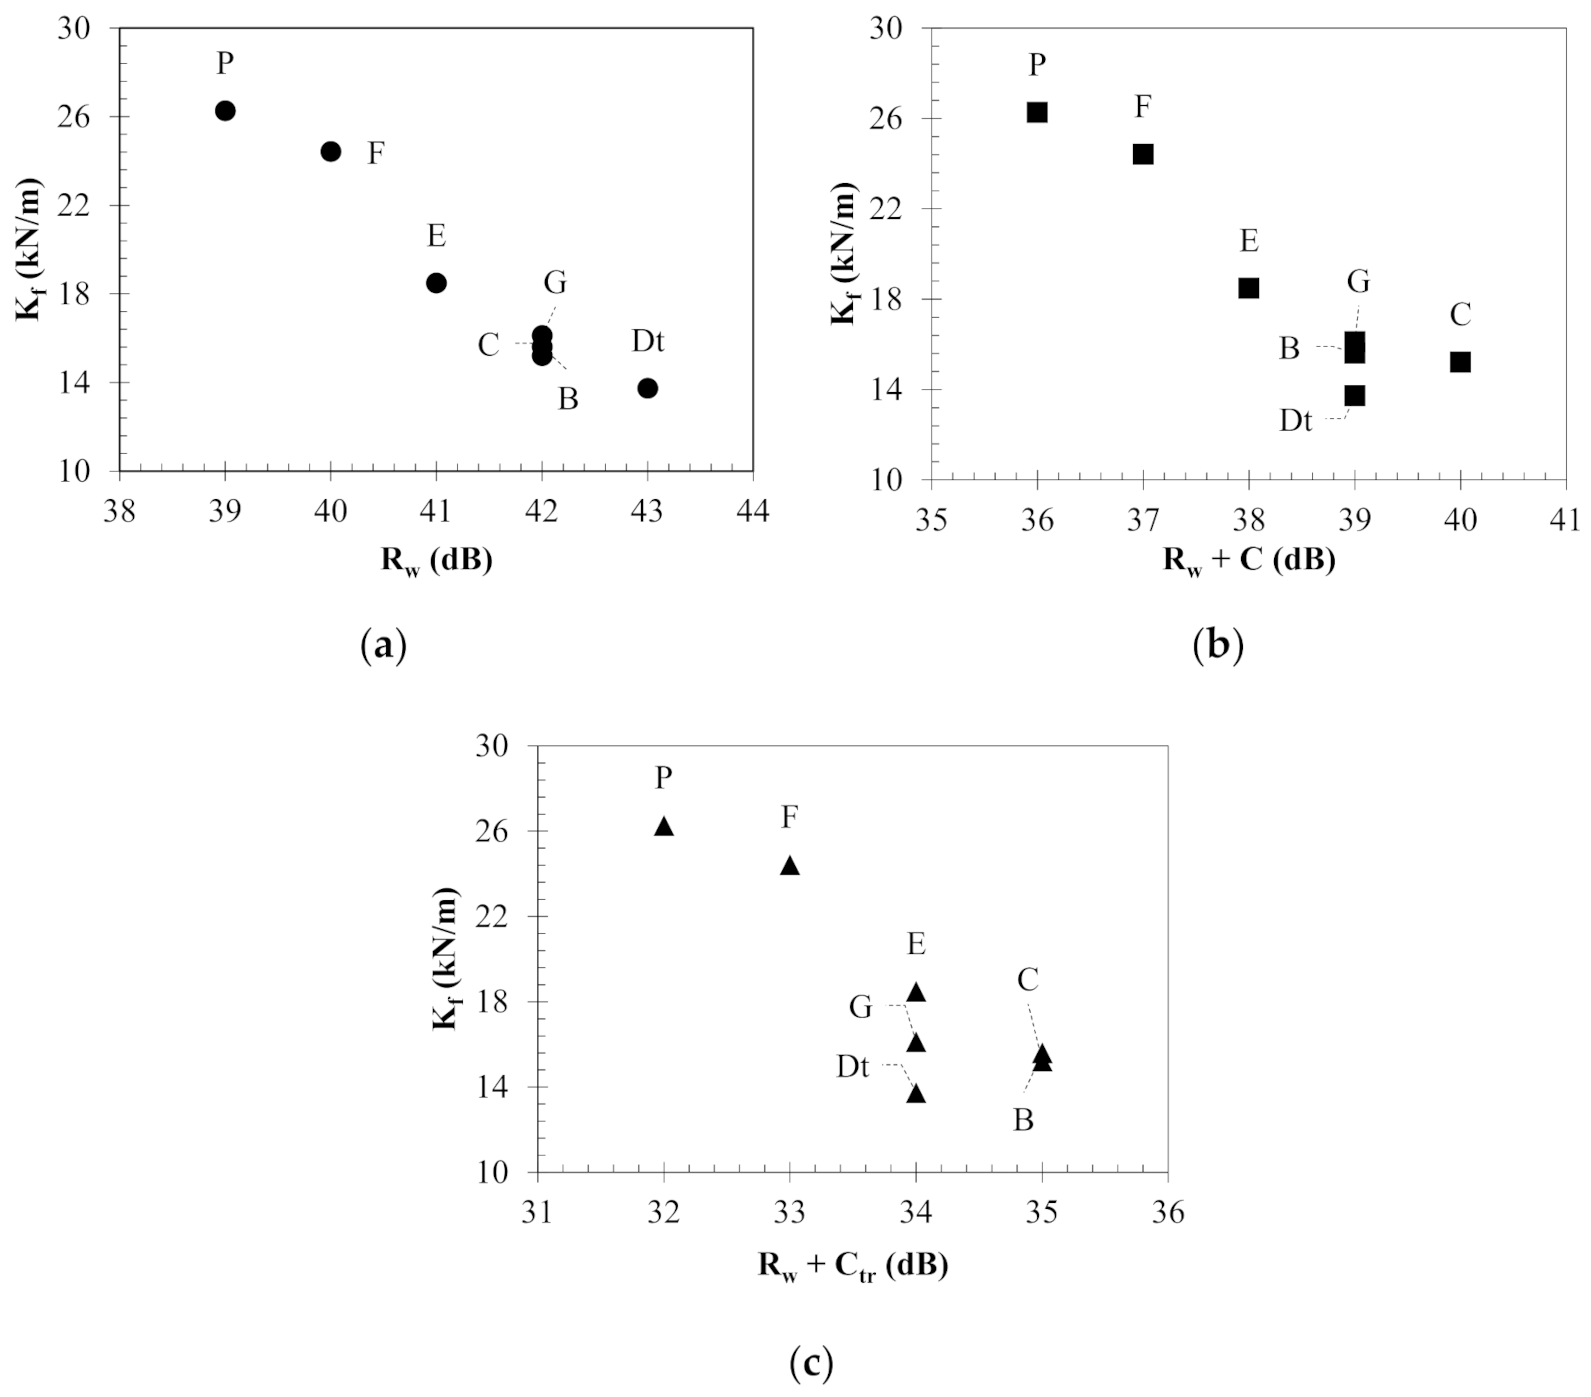
3.3. Correlation between Flexural Stiffness and Acoustic Response
3.4. Structural Compliance
4. Conclusions
Author Contributions
Funding
Institutional Review Board Statement
Informed Consent Statement
Data Availability Statement
Conflicts of Interest
References
- Garg, N.; Kumar, A.; Maji, S. Significance and implications of airborne sound insulation criteria in building elements for traffic noise abatement. Appl. Acoust. 2013, 74, 1429–1435. [Google Scholar] [CrossRef]
- Hongisto, V.; Mäkilä, M.; Suokas, M. Satisfaction with sound insulation in residential dwellings—The effect of wall construction. Build. Environ. 2015, 85, 309–320. [Google Scholar] [CrossRef]
- Guillen, I.; Uris, A.; Estelles, H.; Llinares, J.; Llopis, A. On the sound insulation of masonry wall façades. Build. Environ. 2008, 43, 523–529. [Google Scholar] [CrossRef]
- Uris, A.; Maria Bravo, J.; Llinares, J.; Estelles, H. Influence of plastic electrical outlet boxes on sound insulation of gypsum board walls. Build. Environ. 2007, 42, 722–729. [Google Scholar] [CrossRef]
- Arjunan, A.; Baroutaji, A.; Praveen, A.S.; Olabi, A.G.; Wang, C.J. Acoustic performance of metallic foams. In Reference Module in Materials Science and Materials Engineering; Elsevier: Amsterdam, The Netherlands, 2019; ISBN 978-0-12-803581-8. [Google Scholar]
- Júnior, O.J.S.; Pinheiro, M.A.S.; Silva, J.J.R.; Pires, T.A.C.; Alencar, C.O.S. Sound insulation of gypsum block partitions: An analysis of single and double walls. J. Build. Eng. 2021, 39, 102253. [Google Scholar] [CrossRef]
- Li, X.; Mo, J.; Cai, H.; Liu, S.; Zhu, Z.; Jiang, Z.; Ma, Y. Optimal design and test study on sound insulation property of exterior wall enclosure of prefabricated substation. In Proceedings of the IOP Conference Series, Earth and Environmental Science, Shanghai, China, 7–9 August 2020; Volume 571. [Google Scholar]
- Novak, R.A. Sound insulation of lightweight double walls. Appl. Acoust. 1992, 37, 281–303. [Google Scholar] [CrossRef]
- Wang, J.; Lu, T.J.; Woodhouse, J.; Langley, R.S.; Evans, J. Sound transmission through lightweight double-leaf partitions: Theoretical modelling. J. Sound Vib. 2005, 286, 817–847. [Google Scholar] [CrossRef]
- Späh, M.; Weber, L. Flanking transmission of metal stud walls with different junction details. Appl. Acoust. 2016, 111, 86–95. [Google Scholar] [CrossRef]
- Umnova, O.; Tuev, D.; Giyasov, T. Design of low-rise buildings from thin-walled steel frame structures. MATEC Web Conf. 2018, 193, 3037. [Google Scholar] [CrossRef][Green Version]
- Arjunan, A.; Wang, C.; English, M.; Stanford, M.; Lister, P. A computationally-efficient numerical model to characterize the noise behavior of metal-framed walls. Metals 2015, 5, 1414–1431. [Google Scholar] [CrossRef]
- Mak, C.M.; Wang, Z. Recent advances in building acoustics: An overview of prediction methods and their applications. Build. Environ. 2015, 91, 118–126. [Google Scholar] [CrossRef]
- Van den Wyngaert, J.C.E.; Schevenels, M.; Reynders, E.P.B. Shape optimization of studs in double-leaf plasterboard walls for maximal broadband sound insulation and minimal material use. Appl. Acoust. 2021, 183, 108307. [Google Scholar] [CrossRef]
- Narang, P.P. Transforming wall studs to slit resonator studs for improving sound insulation in walls. Appl. Acoust. 1994, 43, 81–90. [Google Scholar] [CrossRef]
- Isaac, C.W.; Pawelczyk, M.; Wrona, S. Comparative Study of Sound Transmission Losses of Sandwich Composite Double Panel Walls. Appl. Sci. 2020, 10, 1543. [Google Scholar] [CrossRef]
- Nowotny, Ł.; Nurzyński, J. The Influence of Insulating Layers on the Acoustic Performance of Lightweight Frame Floors Intended for Use in Residential Buildings. Energies 2020, 13, 1217. [Google Scholar] [CrossRef]
- Tadeu, A.; António, J.; Mateus, D. Sound insulation provided by single and double panel walls—a comparison of analytical solutions versus experimental results. Appl. Acoust. 2004, 65, 15–29. [Google Scholar] [CrossRef]
- Wareing, R.R.; Davy, J.L.; Pearse, J.R. Predicting the sound insulation of plywood panels when treated with decoupled mass loaded barriers. Appl. Acoust. 2015, 91, 64–72. [Google Scholar] [CrossRef]
- Yairi, M.; Koga, T.; Takebayashi, K.; Sakagami, K. Transmission of a spherical sound wave through a single-leaf wall: Mass law for spherical wave incidence. Appl. Acoust. 2014, 75, 67–71. [Google Scholar] [CrossRef][Green Version]
- Poblet-Puig, J.; Rodríguez-Ferran, A.; Guigou-Carter, C.; Villot, M. The role of studs in the sound transmission of double walls. Acta Acust. United Acust. 2009, 95, 555–567. [Google Scholar] [CrossRef]
- Roozen, N.B.; Muellner, H.; Labelle, L.; Rychtáriková, M.; Glorieux, C. Influence of panel fastening on the acoustic performance of light-weight building elements: Study by sound transmission and laser scanning vibrometry. J. Sound Vib. 2015, 346, 100–116. [Google Scholar] [CrossRef]
- Vigran, T.E. Sound transmission in multilayered structures—Introducing finite structural connections in the transfer matrix method. Appl. Acoust. 2010, 71, 39–44. [Google Scholar] [CrossRef]
- Díaz-Cereceda, C.; Hetherington, J.; Poblet-Puig, J.; Rodríguez-Ferran, A. A deterministic model of impact noise transmission through structural connections based on modal analysis. J. Sound Vib. 2011, 330, 2801–2817. [Google Scholar] [CrossRef]
- Bradley, J.S.; Birta, J.A. A simple model of the sound insulation of gypsum board on resilient supports. Noise Control Eng. J. 2001, 49, 216–223. [Google Scholar] [CrossRef]
- Xu, Z.; Zhu, W.; Wang, J. Practical considerations on the sound insulation of gypsum board. In Proceedings of the INTER-NOISE and NOISE-CON Congress and Conference Proceedings, Beijing, China, 15 September 1987. [Google Scholar]
- Cambridge, J.E.; Davy, J.L.; Pearse, J. The Influence of the Wall Cavity on the Transmission Loss of Wall Systems—Experimental Trends. Build. Acoust. 2013, 20, 87–106. [Google Scholar] [CrossRef]
- Fausti, P.; Pompoli, R.; Smith, R.S. An Intercomparison of Laboratory Measurements of Airborne Sound Insulation of Lightweight Plasterboard Walls. Build. Acoust. 2016, 6, 127–140. [Google Scholar] [CrossRef]
- Smith, R.S.; Pompoli, R.; Fausti, P. An Investigation into the Reproducibility Values of the European Inter-Laboratory Test for Lightweight Walls. Build. Acoust. 2016, 6, 187–210. [Google Scholar] [CrossRef]
- Hwang, S.; Kim, J.; Lee, S.; Kwun, H. Prediction of sound reduction index of double sandwich panel. Appl. Acoust. 2015, 93, 44–50. [Google Scholar] [CrossRef]
- Piana, E.A. A method for determining the sound reduction index of precast panels based on point mobility measurements. Appl. Acoust. 2016, 110, 72–80. [Google Scholar] [CrossRef]
- Buzzi, T.; Courné, C.; Moulinier, A.; Tisseyre, A. Prediction of the sound reduction index: A modal approach. Appl. Acoust. 2003, 64, 793–814. [Google Scholar] [CrossRef]
- Pelton, H.L.; Carnes, T.N. 2 principles of acoustics and noise control for broadcast applications. In National Association of Broadcasters Engineering Handbook; Routledge: London, UK, 2007; pp. 419–454. ISBN 1136034102. [Google Scholar]
- Metzen, H.A. ISO ratings and descriptors for the built acoustical environment. In Handbook of Noise and Vibration Control; John Wiley & Sons: Hoboken, NJ, USA, 2007; pp. 1283–1296. ISBN 0471395994. [Google Scholar]
- Garg, N.; Kumar, A.; Maji, S. Practical Concerns Associated with Single-Number Ratings in Measuring Sound Transmission Loss Properties of Partition Panels. Arch. Acoust. 2013, 38, 115–124. [Google Scholar] [CrossRef]
- ISO. Acoustics—Rating of Sound Insulation in Buildings and of Building Elements. Part 1: Airborne Sound Insulation; ISO BS EN ISO 717-1:2020; ISO: Geneva, Switzerland.
- London, A. Transmission of Reverberant Sound through Double Walls. J. Acoust. Soc. Am. 1950, 22, 270–279. [Google Scholar] [CrossRef]
- Gerretsen, E. Predicting the sound reduction of building elements from material data. J. Acoust. Soc. Am. 1999, 105, 1200. [Google Scholar] [CrossRef]
- Van den Wyngaert, J.C.E.; Schevenels, M.; Reynders, E.P.B. Predicting the sound insulation of finite double-leaf walls with a flexible frame. Appl. Acoust. 2018, 141, 93–105. [Google Scholar] [CrossRef]
- Lin, G.; Garrelick, J.M. Sound transmission through periodically framed parallel plates. J. Acoust. Soc. Am. 1977, 61, 1014–1018. [Google Scholar] [CrossRef]
- Takahashi, D. Sound radiation from periodically connected double-plate structures. J. Sound Vib. 1983, 90, 541–557. [Google Scholar] [CrossRef]
- Skelton, E.A.; Broadbent, E.G. Acoustic scattering by parallel plates with periodic connectors. Proc. R. Soc. Lond. A Math. Phys. Sci. 1990, 427, 419–444. [Google Scholar] [CrossRef]
- Arjunan, A.; Wang, C.J.; Yahiaoui, K.; Mynors, D.J.; Morgan, T.; Nguyen, V.B.; English, M. Development of a 3D finite element acoustic model to predict the sound reduction index of stud based double-leaf walls. J. Sound Vib. 2014, 333, 6140–6155. [Google Scholar] [CrossRef]
- Yang, Y.; Mace, B.R.; Kingan, M.J. Wave and finite element method for predicting sound transmission through finite multi-layered structures with fluid layers. Comput. Struct. 2018, 204, 20–30. [Google Scholar] [CrossRef]
- Løvholt, F.; Norèn-Cosgriff, K.; Madshus, C.; Ellingsen, S.E. Simulating low frequency sound transmission through walls and windows by a two-way coupled fluid structure interaction model. J. Sound Vib. 2017, 396, 203–216. [Google Scholar] [CrossRef]
- Qiao, H.; He, Z.; Jiang, W.; Peng, W. Sound transmission of periodic composite structure lined with porous core: Rib-stiffened double panel case. J. Sound Vib. 2019, 440, 256–276. [Google Scholar] [CrossRef]
- Arjunan, A.; Wang, C.J.; Yahiaoui, K.; Mynors, D.J.; Morgan, T.; Nguyen, V.B.; English, M. Sound frequency dependent mesh modelling to simulate the acoustic insulation of stud based double-leaf walls. In Proceedings of the ISMA 2014—Conference on Noise and Vibration Engineering and USD 2014—International Conference on Uncertainty in Structural Dynamics, Leuven, Belgium, 15–17 September 2014. [Google Scholar]
- Ehrig, T.; Dannemann, M.; Luft, R.; Adams, C.; Modler, N.; Kostka, P. Sound Transmission Loss of a Sandwich Plate with Adjustable Core Layer Thickness. Materials 2020, 13, 4160. [Google Scholar] [CrossRef] [PubMed]
- ISO. ISO 10140-1:2021—Acoustics—Laboratory Measurement of Sound Insulation of Building Elements—Part 1: Application Rules for Specific Products. Available online: https://www.iso.org/standard/73910.html (accessed on 4 September 2021).
- BSI. Code of Practice. Internal Non-Loadbearing Partitioning; BSI BS 5234:1975; BSI: Singapore, 1975; p. 30. [Google Scholar]
- Kinsler, L.; Frey, A.R.; Coppens, A.; Sanders, J.V. Fundamental of Acoustics; John Wiley & Sons: New York, NY, USA, 2000; p. 548. [Google Scholar]
- Bathe, K.J. Finite Element Procedures; Pearson Education, Inc.: Watertown, MA, USA, 1996; ISBN 0133014584. [Google Scholar]
- Zienkiewicz, O.C.; Newton, R.E. Coupled vibrations of a structure submerged in a compressible fluid. In University of Wales, Swansea, Department of Civil Engineering, ISD, ISSC, Symposium on Finite Element Techniques at the Institut für Statik und Dynamik der luft- und Raumfahrtkonstruktionen; Report No. C/R/101/69; TUDelft: Stuttgart, Germany, 1969. [Google Scholar]
- ASTM. Standard Specification for Installation of Steel Framing Members to Receive Screw-Attached Gypsum Panel Products; ASTM C754-20; ASTM: West Conshohocken, PA, USA, 2020. [Google Scholar]
- Long, M. Fundamentals of acoustics. In Architectural Acoustics, 2nd ed.; Long, M., Ed.; Academic Press: Boston, MA, USA, 2014; pp. 39–79. ISBN 978-0-12-398258-2. [Google Scholar]
- Arjunan, A.; Baroutaji, A.; Latif, A. Acoustic behaviour of 3D printed titanium perforated panels. Results Eng. 2021, 11, 100252. [Google Scholar] [CrossRef]
- Hongisto, V.; Lindgren, M.; Helenius, R. Sound insulation of double walls—An experimental parametric study. Acta Acust. United Acust. 2002, 88, 904–923. [Google Scholar]
- Wyngaert, V. Den Numerical Prediction and Optimization of the Sound Insulation of Wall Systems; KU Leuven: Leuven, Belgium, 2020. [Google Scholar]


| Parameter | Name | Context | Advantage | Consideration |
|---|---|---|---|---|
| Weighted sound reduction index | Airborne sound insulation rating in decibels of the reference curve at 500 Hz after shifting it in accordance with the method specified in ISO717-1 [36] | A single number allows for easy acoustic characterization | Performance below 100 Hz is not considered | |
| Weighted sound reduction index corresponding to pink noise | Value in decibels to be added to to take account of the characteristics of the pink noise spectra | Suitable to characterize insulation against living activities, children playing, railway traffic at medium and high speed, highway road traffic, jet aircraft, factories emitting medium to high frequency noise | Often adversely characterize lightweight construction such as dry walls | |
| Weighted sound reduction index corresponding to urban noise | Value in decibels to be added to to take account of the characteristics of the road traffic noise spectra | Suitable to characterize insulation against urban road traffic, low speed railway, aircraft, disco music, factories emitting low and medium frequency noise. | Emphasis is primarily towards low noise |
| Material | E (GPa) | ||||
|---|---|---|---|---|---|
| Steel | 206 | 7929 | 0.31 | - | 0.25 |
| Gypsum | 2.5 | 848 | 0.25 | - | 0.1 |
| Mortar | 20 | 2000 | 0.17 | - | - |
| Acoustic fluid | - | 1.25 | - | 338 | - |
| Item | |||
|---|---|---|---|
| FEA | 39 | 36 | 31 |
| Experiment | 39 | 37 | 32 |
| Difference 1 | - | 1 dB | 1 dB |
| Stud Type | P | F | E | G | B | C | Dt |
|---|---|---|---|---|---|---|---|
| (mm) | 1.1 | 1.4 | 2.5 | 4.1 | 4.4 | 4.7 | 5.6 |
| /(/240) (%) | 9.10 | 11.59 | 20.69 | 33.93 | 36.41 | 38.90 | 46.34 |
Publisher’s Note: MDPI stays neutral with regard to jurisdictional claims in published maps and institutional affiliations. |
© 2021 by the authors. Licensee MDPI, Basel, Switzerland. This article is an open access article distributed under the terms and conditions of the Creative Commons Attribution (CC BY) license (https://creativecommons.org/licenses/by/4.0/).
Share and Cite
Arjunan, A.; Baroutaji, A.; Robinson, J. Perforated Steel Stud to Improve the Acoustic Insulation of Drywall Partitions. Acoustics 2021, 3, 679-694. https://doi.org/10.3390/acoustics3040043
Arjunan A, Baroutaji A, Robinson J. Perforated Steel Stud to Improve the Acoustic Insulation of Drywall Partitions. Acoustics. 2021; 3(4):679-694. https://doi.org/10.3390/acoustics3040043
Chicago/Turabian StyleArjunan, Arun, Ahmad Baroutaji, and John Robinson. 2021. "Perforated Steel Stud to Improve the Acoustic Insulation of Drywall Partitions" Acoustics 3, no. 4: 679-694. https://doi.org/10.3390/acoustics3040043
APA StyleArjunan, A., Baroutaji, A., & Robinson, J. (2021). Perforated Steel Stud to Improve the Acoustic Insulation of Drywall Partitions. Acoustics, 3(4), 679-694. https://doi.org/10.3390/acoustics3040043