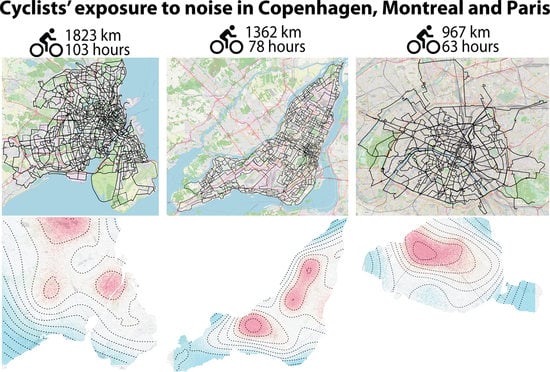
Cyclists′ Exposure to Road Traffic Noise: A Comparison of Three North American and European Cities
Abstract
1. Introduction
1.1. Research Objectives
1.2. Description and Justification for the Selection of Cities
2. Materials and Methods
2.1. Data Collection and Design
2.2. Statistical Analyses
3. Results
3.1. Descriptive Statistics
3.2. GAMMAR Models
3.2.1. Assessment of the Models
3.2.2. Analysis of the Random Linear Terms
3.2.3. Analysis of the Fixed Linear Terms
3.2.4. Analysis of the Non-Linear Terms
4. Discussion
4.1. Limitations of the Study
4.2. Comparison with Previous Studies
4.3. Potential Health Implications
4.4. Implications for Policy
5. Conclusions
Supplementary Materials
Author Contributions
Funding
Ethics Approval and Consent to Participate
Acknowledgments
Conflicts of Interest
References
- Pucher, J.; Buehler, R.; Seinen, M. Bicycling renaissance in North America? An update and re-appraisal of cycling trends and policies. Transp. Res. A 2011, 45, 451–475. [Google Scholar] [CrossRef]
- Bigazzi, A.Y.; Figliozzi, M.A. Review of urban bicyclists’ intake and uptake of traffic-related air pollution. Transp. Rev. 2014, 34, 221–245. [Google Scholar] [CrossRef]
- Oja, P.; Vuori, I.; Paronen, O. Daily walking and cycling to work: Their utility as health-enhancing physical activity. Patient Educ. Couns. 1998, 33, S87–S94. [Google Scholar] [CrossRef]
- Oja, P.; Titze, S.; Bauman, A.; De Geus, B.; Krenn, P.; Reger-Nash, B.; Kohlberger, T. Health benefits of cycling: A systematic review. Scand. J. Med. Sci. Sports 2011, 21, 496–509. [Google Scholar] [CrossRef] [PubMed]
- De Hartog, J.J.; Boogaard, H.; Nijland, H.; Hoek, G. Do the health benefits of cycling outweigh the risks? Environ. Health Perspect. 2010, 118, 1109–1116. [Google Scholar] [CrossRef] [PubMed]
- Garrard, J.; Rissel, C.; Bauman, A. Health benefits of cycling. In City Cycling; Pucher, J., Buehler, R., Eds.; MIT Press: Cambridge, MA, USA, 2012; Volume 31. [Google Scholar]
- Rojas-Rueda, D.; de Nazelle, A.; Tainio, M.; Nieuwenhuijsen, M.J. The health risks and benefits of cycling in urban environments compared with car use: Health impact assessment study. BMJ 2011, 343, d4521. [Google Scholar] [CrossRef] [PubMed]
- Elvik, R. The non-linearity of risk and the promotion of environmentally sustainable transport. Accid. Anal. Prev. 2009, 41, 849–855. [Google Scholar] [CrossRef]
- Pucher, J.; Dijkstra, L. Promoting safe walking and cycling to improve public health: Lessons from the Netherlands and Germany. Am. J. Public Health 2003, 93, 1509–1516. [Google Scholar] [CrossRef]
- Kaur, S.; Nieuwenhuijsen, M.J.; Colvile, R.N. Fine particulate matter and carbon monoxide exposure concentrations in urban street transport microenvironments. Atmos. Environ. 2007, 41, 4781–4810. [Google Scholar] [CrossRef]
- Badland, H.M.; Duncan, M.J. Perceptions of air pollution during the work-related commute by adults in Queensland, Australia. Atmos. Environ. 2009, 43, 5791–5795. [Google Scholar] [CrossRef]
- Adams, H.; Nieuwenhuijsen, M.; Colvile, R.; McMullen, M.; Khandelwal, P. Fine particle (PM2.5) personal exposure levels in transport microenvironments, London, UK. Sci. Total Environ. 2001, 279, 29–44. [Google Scholar] [CrossRef]
- Cole-Hunter, T.; Morawska, L.; Stewart, I.; Jayaratne, R.; Solomon, C. Inhaled particle counts on bicycle commute routes of low and high proximity to motorised traffic. Atmos. Environ. 2012, 61, 197–203. [Google Scholar] [CrossRef]
- De Nazelle, A.; Fruin, S.; Westerdahl, D.; Martinez, D.; Ripoll, A.; Kubesch, N.; Nieuwenhuijsen, M. A travel mode comparison of commuters’ exposures to air pollutants in Barcelona. Atmos. Environ. 2012, 59, 151–159. [Google Scholar] [CrossRef]
- Dirks, K.N.; Sharma, P.; Salmond, J.A.; Costello, S.B. Personal exposure to air pollution for various modes of transport in Auckland, New Zealand. Open Atmos. Sci. J. 2012, 6. [Google Scholar] [CrossRef]
- Fajardo, O.A.; Rojas, N.Y. Particulate matter exposure of bicycle path users in a high-altitude city. Atmos. Environ. 2012, 46, 675–679. [Google Scholar] [CrossRef]
- Hatzopoulou, M.; Weichenthal, S.; Dugum, H.; Pickett, G.; Miranda-Moreno, L.; Kulka, R.; Andersen, R.; Goldberg, M. The impact of traffic volume, composition, and road geometry on personal air pollution exposures among cyclists in Montreal, Canada. J. Expo Sci. Environ. Epidemiol. 2013, 23, 46–51. [Google Scholar] [CrossRef] [PubMed]
- Kingham, S.; Longley, I.; Salmond, J.; Pattinson, W.; Shrestha, K. Variations in exposure to traffic pollution while travelling by different modes in a low density, less congested city. Environ. Pollut. 2013, 181, 211–218. [Google Scholar] [CrossRef]
- MacNaughton, P.; Melly, S.; Vallarino, J.; Adamkiewicz, G.; Spengler, J.D. Impact of bicycle route type on exposure to traffic-related air pollution. Sci. Total Environ. 2014, 490, 37–43. [Google Scholar] [CrossRef]
- Panis, L.I.; De Geus, B.; Vandenbulcke, G.; Willems, H.; Degraeuwe, B.; Bleux, N.; Mishra, V.; Thomas, I.; Meeusen, R. Exposure to particulate matter in traffic: A comparison of cyclists and car passengers. Atmo. Environ. 2010, 44, 2263–2270. [Google Scholar] [CrossRef]
- Rank, J.; Folke, J.; Jespersen, P.H. Differences in cyclists and car drivers exposure to air pollution from traffic in the city of Copenhagen. Sci. Total Environ. 2001, 279, 131–136. [Google Scholar] [CrossRef]
- Thai, A.; McKendry, I.; Brauer, M. Particulate matter exposure along designated bicycle routes in Vancouver, British Columbia. Sci. Total Environ. 2008, 405, 26–35. [Google Scholar] [CrossRef]
- Weichenthal, S.; Kulka, R.; Belisle, P.; Joseph, L.; Dubeau, A.; Martin, C.; Wang, D.; Dales, R. Personal exposure to specific volatile organic compounds and acute changes in lung function and heart rate variability among urban cyclists. Environ. Res. 2012, 118, 118–123. [Google Scholar] [CrossRef] [PubMed]
- Zuurbier, M.; Hoek, G.; Oldenwening, M.; Lenters, V.; Meliefste, K.; van den Hazel, P.; Brunekreef, B. Commuters’ exposure to particulate matter air pollution is affected by mode of transport, fuel type, and route. Environ. Health Perspect. 2010, 118, 783–789. [Google Scholar] [CrossRef] [PubMed]
- Apparicio, P.; Carrier, M.; Gelb, J.; Séguin, A.-M.; Kingham, S. Cyclists’ exposure to air pollution and road traffic noise in central city neighbourhoods of Montreal. J. Transp. Geogr. 2016, 57, 63–69. [Google Scholar] [CrossRef]
- Apparicio, P.; Gelb, J.; Carrier, M.; Mathieu, M.-È.; Kingham, S. Exposure to noise and air pollution by mode of transportation during rush hours in Montreal. J. Transp. Geogr. 2018, 70, 182–192. [Google Scholar] [CrossRef]
- Kumar, K.; Jain, V. A study of noise in various modes of transport in Delhi. Appl. Acoust. 1994, 43, 57–65. [Google Scholar] [CrossRef]
- Boogaard, H.; Borgman, F.; Kamminga, J.; Hoek, G. Exposure to ultrafine and fine particles and noise during cycling and driving in 11 Dutch cities. Atmos. Environ. 2009, 43, 4234–4242. [Google Scholar] [CrossRef]
- Okokon, E.O.; Yli-Tuomi, T.; Turunen, A.W.; Taimisto, P.; Pennanen, A.; Vouitsis, I.; Samaras, Z.; Voogt, M.; Keuken, M.; Lanki, T. Particulates and noise exposure during bicycle, bus and car commuting: A study in three European cities. Environ. Res. 2017, 154, 181–189. [Google Scholar] [CrossRef]
- Lam, K.-C.; Chan, P.-K.; Chan, T.-C.; Au, W.-H.; Hui, W.-C. Annoyance response to mixed transportation noise in Hong Kong. Appl. Acoust. 2009, 70, 1–10. [Google Scholar] [CrossRef]
- Yao, C.M.; Ma, A.K.; Cushing, S.L.; Lin, V.Y. Noise exposure while commuting in Toronto-a study of personal and public transportation in Toronto. J. Otolaryngol.-Head Neck Surg. 2017, 46, 62. [Google Scholar] [CrossRef]
- Gelb, J.; Apparicio, P. Noise exposure of cyclists in Ho Chi Minh City: A spatio-temporal analysis using non-linear models. Appl. Acoust. 2019, 148, 332–343. [Google Scholar] [CrossRef]
- Moya-Gómez, B.; García-Palomares, J.C. The impacts of congestion on automobile accessibility. What happens in large European cities? J. Transp. Geogr. 2017, 62, 148–159. [Google Scholar] [CrossRef]
- Copenhagenize Design Company. The 2019 Copenhagenize Indez of Bicycle-Friendly Cities. Available online: https://copenhagenizeindex.eu/ (accessed on 17 December 2019).
- Furth, P.G. Bicycling infrastructure for mass cycling: A trans-Atlantic comparison. In City Cycling; Pucher, J., Buehler, R., Eds.; MIT Press: Cambridge, MA, USA, 2012; Volume 38, pp. 105–140. [Google Scholar]
- Buehler, R.; Pucher, J. Big city cycling in Europe, North America, and Australia. In City Cycling; Pucher, J., Buehler, R., Eds.; MIP Press: Cambridge, MA, USA, 2012; pp. 287–318. [Google Scholar] [CrossRef]
- Houde, M.; Apparicio, P.; Séguin, A.-M. A ride for whom: Has cycling network expansion reduced inequities in accessibility in Montreal, Canada? J. Transp. Geogr. 2018, 68, 9–21. [Google Scholar] [CrossRef]
- Haklay, M.; Weber, P. Openstreetmap: User-generated street maps. IEEE Pervasive Comput. 2008, 7, 12–18. [Google Scholar] [CrossRef]
- Contributors, O. OpenStreetMap. 2012. Available online: www.openstreetmap.org (accessed on 20 October 2019).
- Team R Core. A Language and Environment for Statistical Computing; Team R Core: Vienna, Austria, 2019. [Google Scholar]
- Bürkner, P.-C. brms: An R package for Bayesian multilevel models using Stan. J. Stat. Softw. 2017, 80, 1–28. [Google Scholar] [CrossRef]
- Bürkner, P.-C. Advanced Bayesian multilevel modeling with the R package brms. R J. 2018, 10, 395–411. [Google Scholar] [CrossRef]
- Wood, S.N.; Pya, N.; Säfken, B. Smoothing Parameter and Model Selection for General Smooth Models. J. Am. Stat. Assoc. 2016, 111, 1548–1563. [Google Scholar] [CrossRef]
- Hoffman, M.D.; Gelman, A. The No-U-Turn sampler: Adaptively setting path lengths in Hamiltonian Monte Carlo. J. Mach. Learn. Res. 2014, 15, 1593–1623. [Google Scholar]
- World Health Organization. Available online: https://apps.who.int/iris/handle/10665/279952 (accessed on 15 November 2019).
- Guski, R.; Schreckenberg, D.; Schuemer, R. WHO environmental noise guidelines for the European region: A systematic review on environmental noise and annoyance. Int. J. Environ. Res. Public Health 2017, 14, 1539. [Google Scholar] [CrossRef]
- Berger, E.H. The Noise Manual; American Industrial Hygiene Association: Fairfax, VA, USA, 2003. [Google Scholar]
- Teschke, K.; Harris, M.A.; Reynolds, C.C.; Winters, M.; Babul, S.; Chipman, M.; Cusimano, M.D.; Brubacher, J.R.; Hunte, G.; Friedman, S.M. Route infrastructure and the risk of injuries to bicyclists: A case-crossover study. Am. J. Public Health 2012, 102, 2336–2343. [Google Scholar] [CrossRef]
- Beck, B.; Chong, D.; Olivier, J.; Perkins, M.; Tsay, A.; Rushford, A.; Li, L.; Cameron, P.; Fry, R.; Johnson, M. How much space do drivers provide when passing cyclists? Understanding the impact of motor vehicle and infrastructure characteristics on passing distance. Accid. Anal. Prev. 2019, 128, 253–260. [Google Scholar] [CrossRef] [PubMed]
- Winters, M.; Davidson, G.; Kao, D.; Teschke, K. Motivators and deterrents of bicycling: Comparing influences on decisions to ride. Transportation 2011, 38, 153–168. [Google Scholar] [CrossRef]
- Buehler, R.; Pucher, J. International Overview: Cycling Trends in Western Europe, North America, and Australia. In City Cycling; Pucher, J., Buehler, R., Eds.; MIT Press: Cambridge, MA, USA, 2012; pp. 9–29. [Google Scholar] [CrossRef]
- Minet, L.; Stokes, J.; Scott, J.; Xu, J.; Weichenthal, S.; Hatzopoulou, M. Should traffic-related air pollution and noise be considered when designing urban bicycle networks? Transp. Res. D 2018, 65, 736–749. [Google Scholar] [CrossRef]
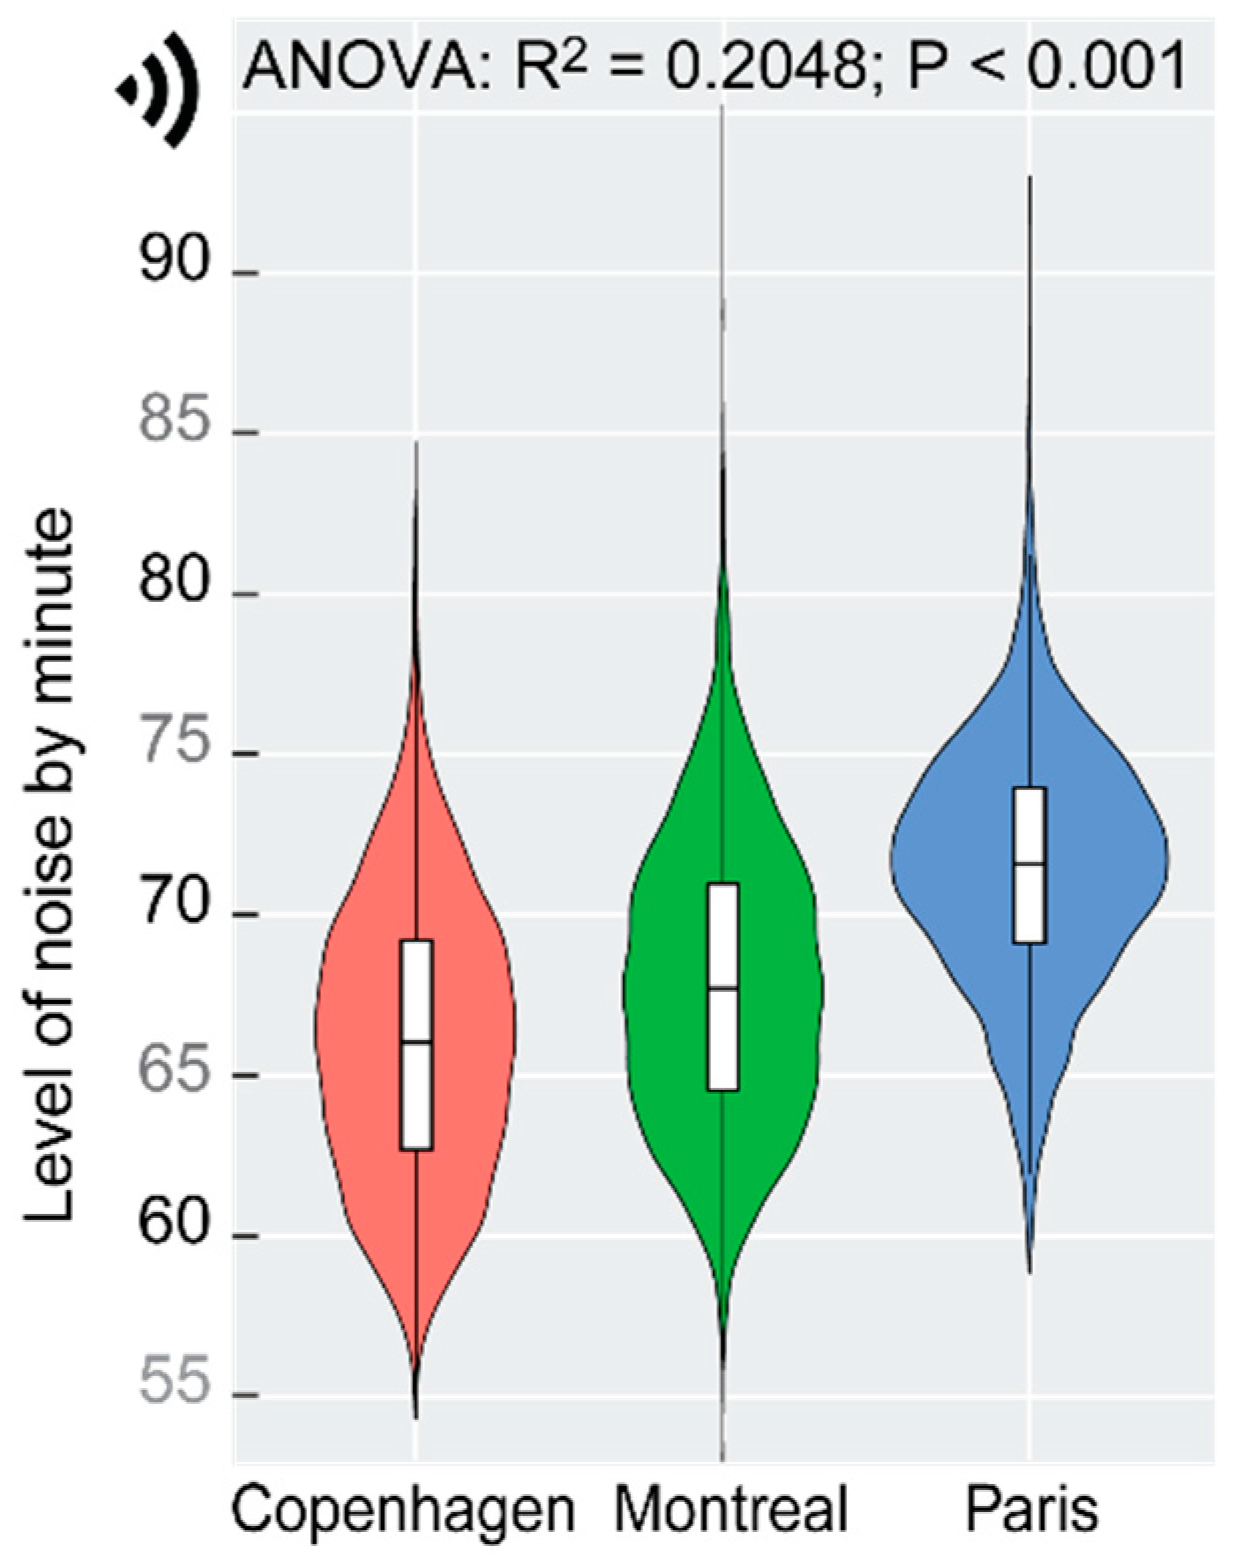
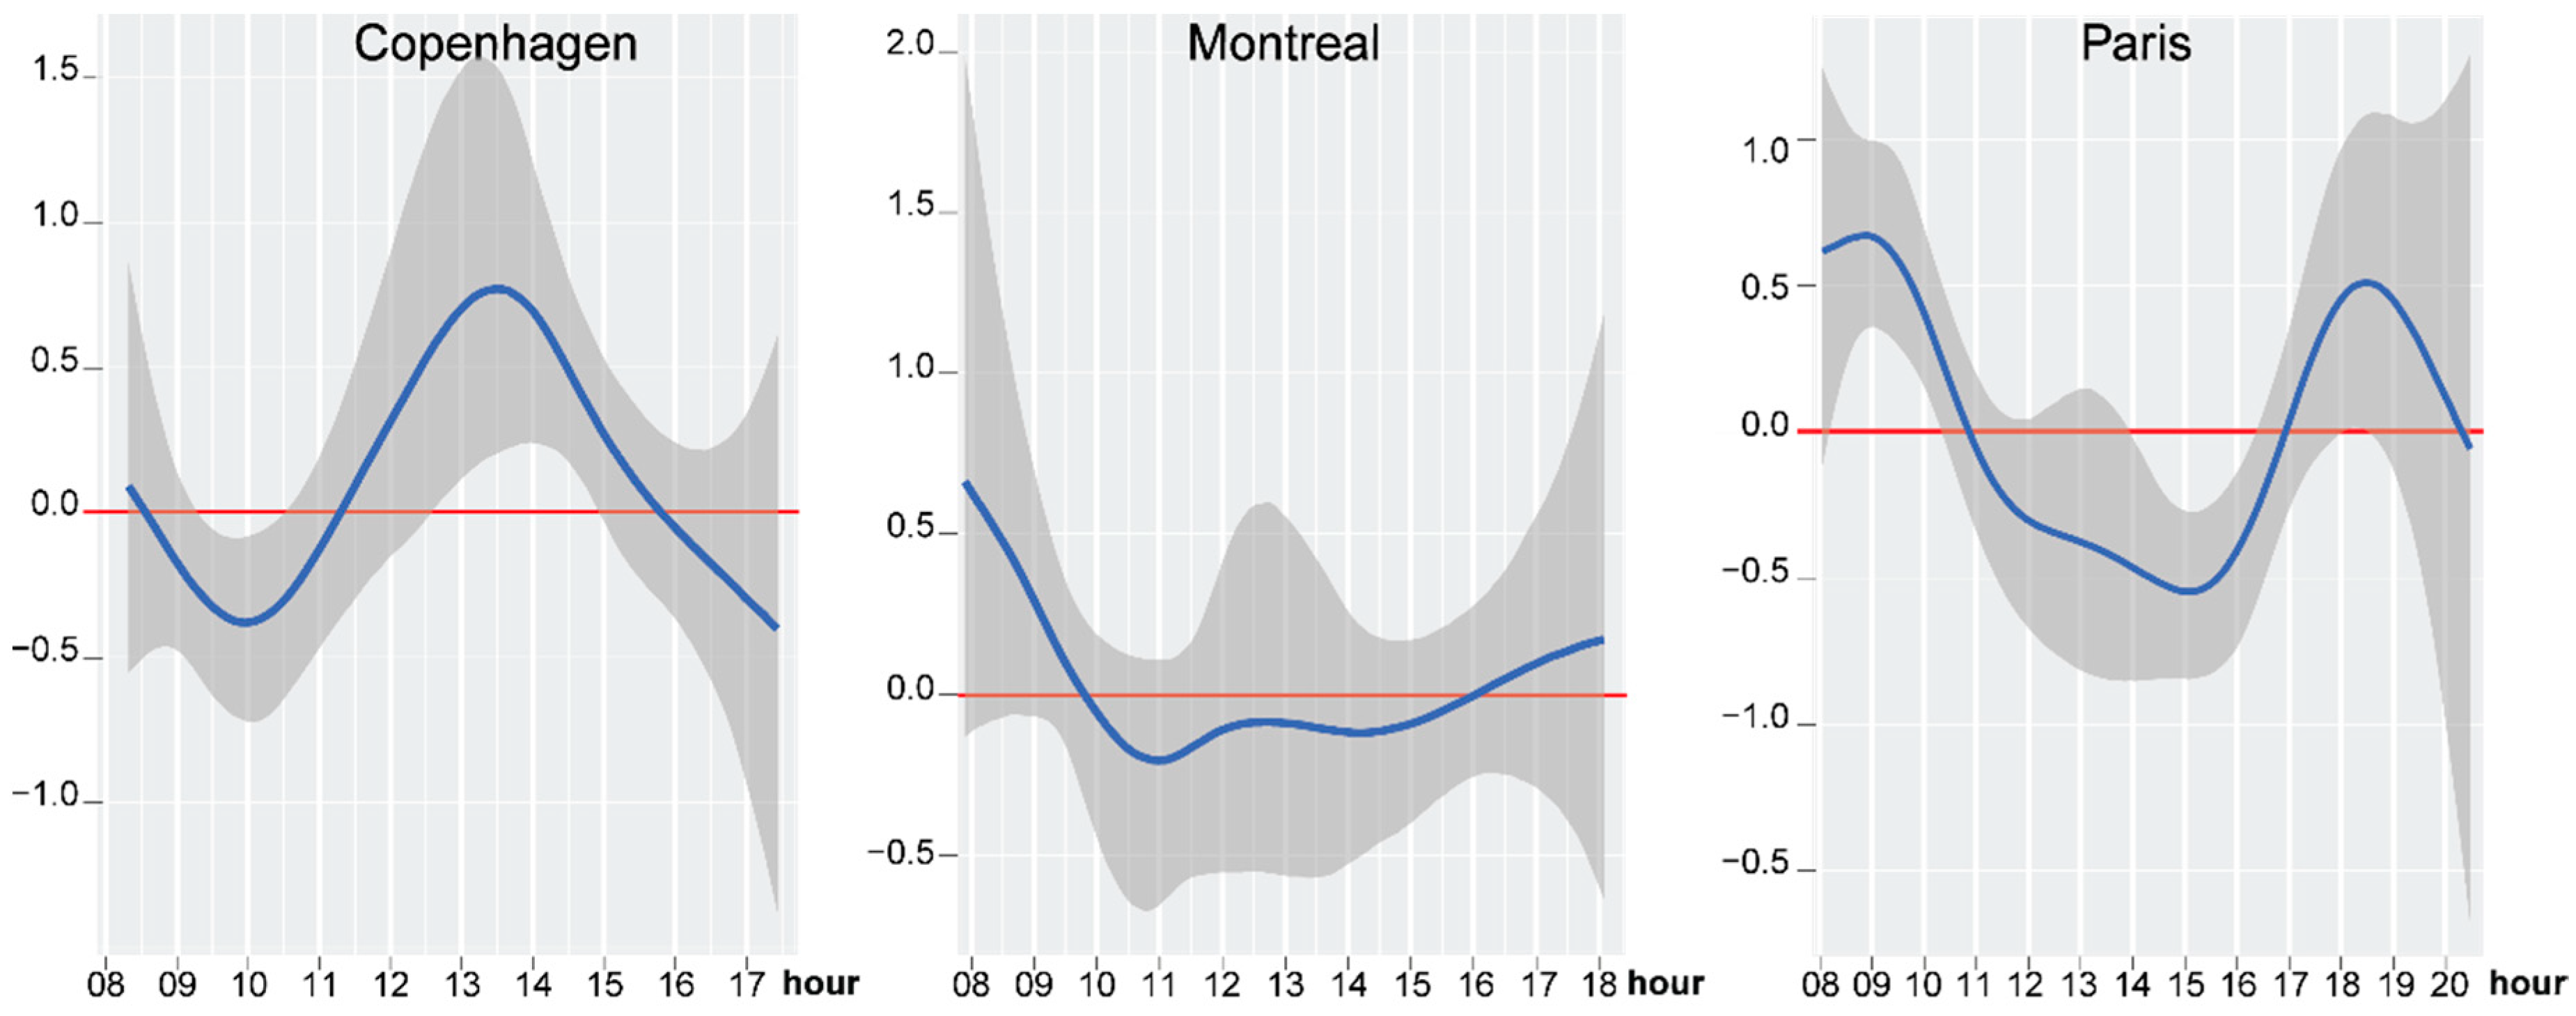
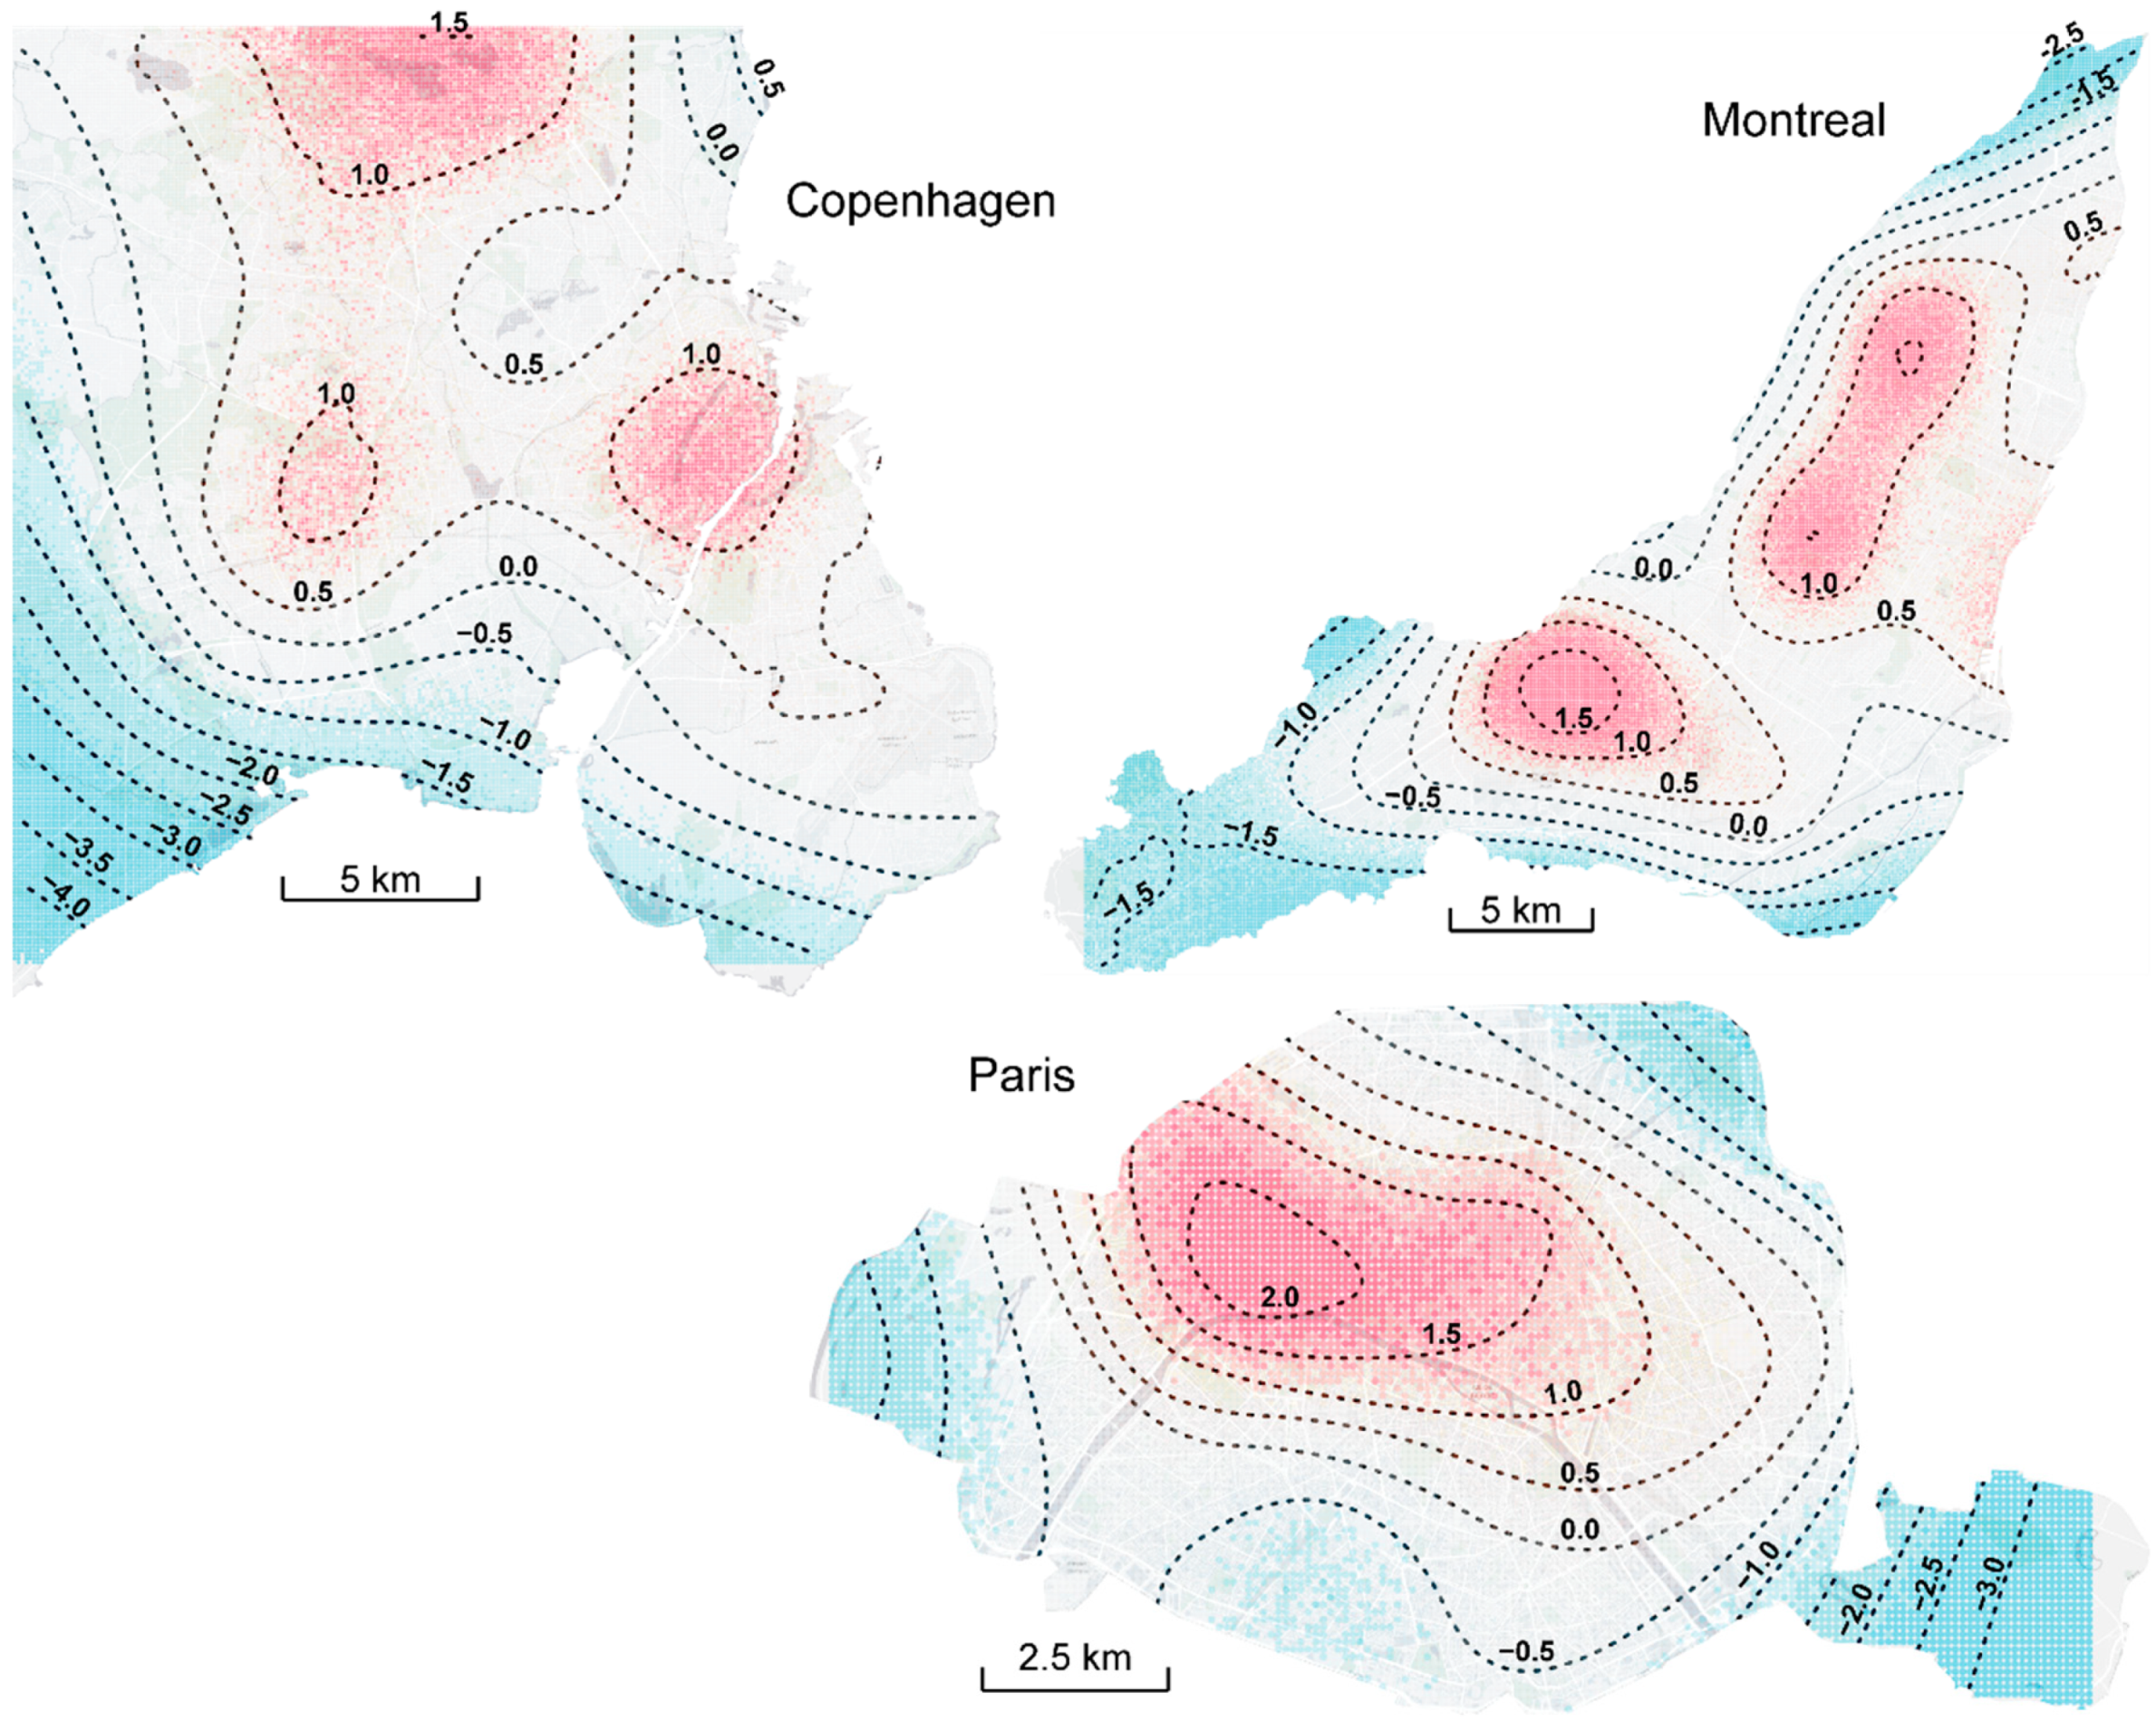
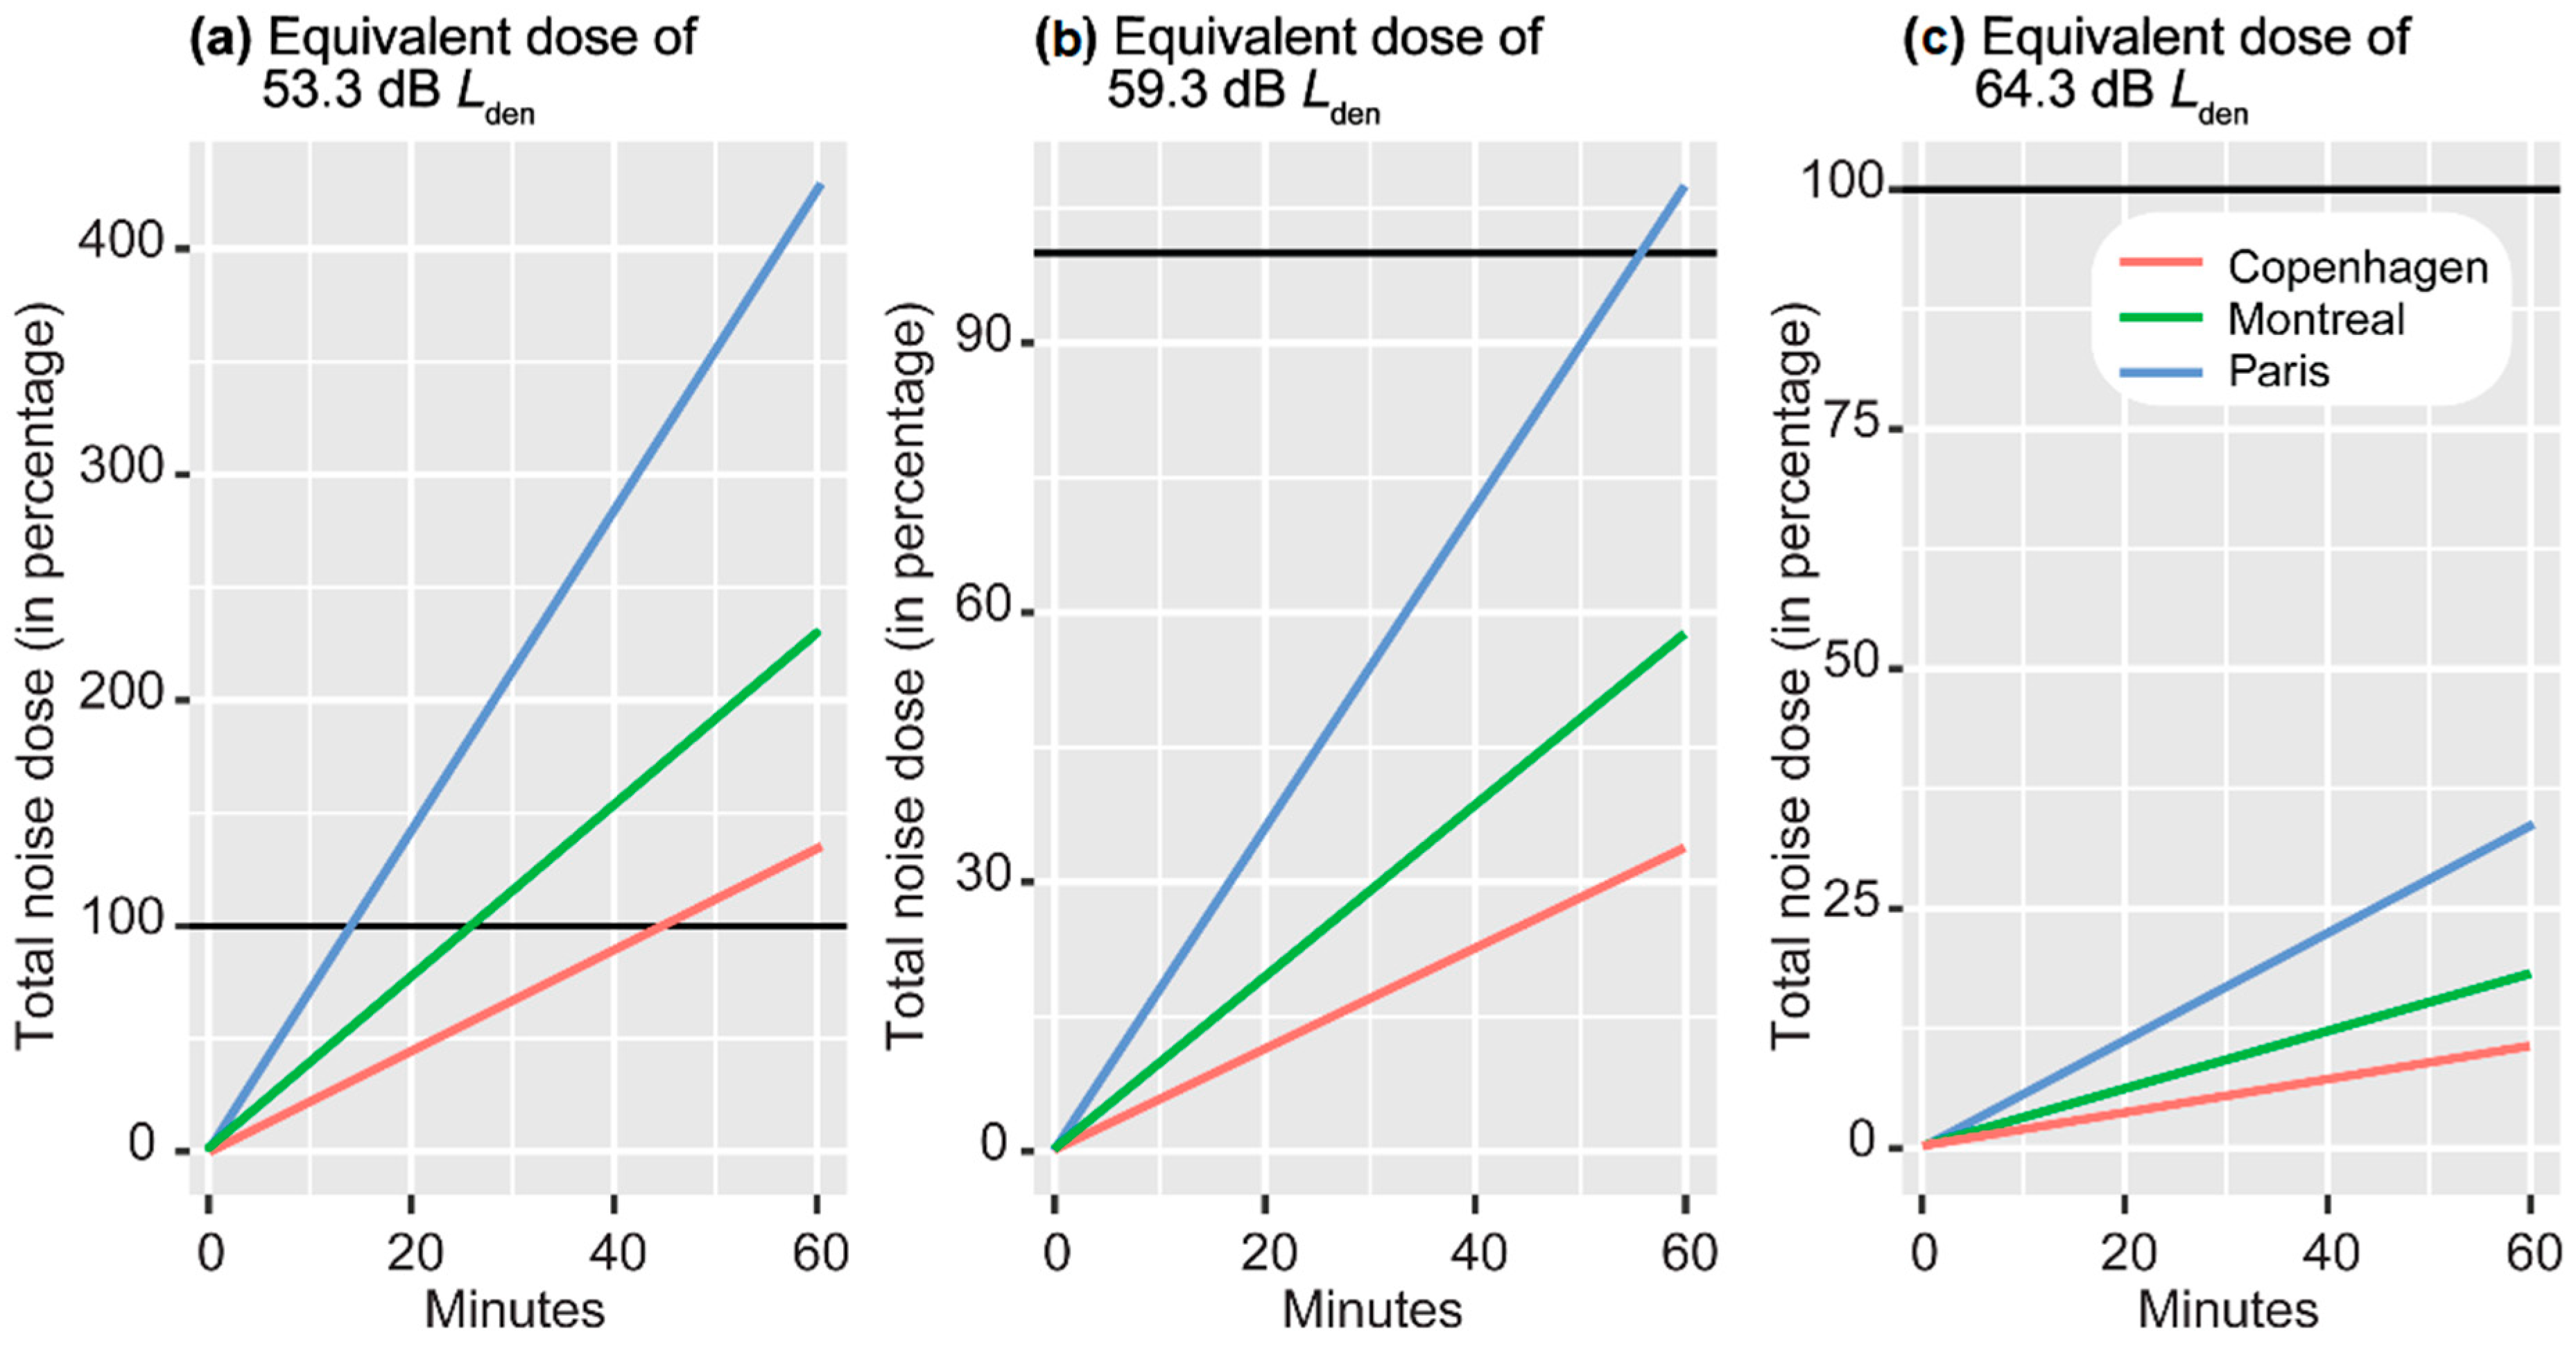
| Copenhagen | Montreal | Paris | |
|---|---|---|---|
| N | 6212 | 4723 | 3793 |
| Percentiles | |||
| 1 | 57.5 | 59.2 | 62.3 |
| 5 | 59.1 | 61.1 | 65.0 |
| 10 | 60.3 | 62.3 | 66.5 |
| 25 (first quartile) | 62.7 | 64.5 | 69.1 |
| 50 (median) | 66.0 | 67.7 | 71.6 |
| 75 (third quartile) | 69.2 | 71.0 | 74.0 |
| 90 | 71.9 | 73.7 | 76.0 |
| 95 | 73.3 | 75.2 | 77.2 |
| 99 | 76.5 | 78.9 | 81.0 |
| Standard deviation | 4.4 | 4.4 | 3.8 |
| Bootstrapped statistics (8000 replications) | |||
| Arithmetic mean | 66.1 [66.0–66.2] | 67.9 [67.8–68.0] | 71.5 [71.4–71.6] |
| Noise mean | 68.4 [68.3–68.6] | 70.7 [70.2–72.5] | 73.4 [71.3–71.8] |
| Median | 66.0 [65.9–66.2] | 67.1 [67.6–67.9] | 71.6 [71.5–71.8] |
| Copenhagen | Montreal | Paris | ||||
|---|---|---|---|---|---|---|
| Est. | 95% CI | Est. | 95% CI | Est. | 95% CI | |
| Fixed effects | ||||||
| (Intercept) | 68.10 | [66.83 69.36] | 70.95 | [69.48 72.41] | 73.11 | [72.25 74.00] |
| Intersections crossed | −0.05 | [−0.09 −0.01] | −0.03 | [−0.12 −0.02] | 0.04 | [0.01 0.07] |
| Primary road | Ref | Ref | Ref | |||
| Secondary road | 0.37 | [−0.56 1.30] | −1.12 | [−1.77 −0.46] | −1.02 | [−1.42 −0.63] |
| Tertiary road | −1.11 | [−1.76 −0.46] | −2.97 | [−3.64 −2.32] | −2.27 | [−2.74 v1.79] |
| Service | −2.82 | [−3.80 −1.84] | −4.27 | [−5.67 −2.88] | −1.66 | [−2.27 −1.06] |
| Residential street | −3.11 | [−3.82 −2.41] | −4.68 | [−5.35 −4.02] | −4.95 | [−5.38 −4.52] |
| Footway, pedestrian or steps | −3.14 | [−4.05 −2.25] | −3.81 | [−4.84 −2.76] | −3.93 | [−4.91 −2.95] |
| Track or path | −2.79 | [−3.63 −1.95] | −6.32 | [−8.01 −4.63] | −2.16 | [−3.79 −0.49] |
| Unclassified | −3.27 | [−4.17 −2.38] | −3.38 | [−4.33 −2.40] | −3.10 | [−3.72 −2.48] |
| Cycleway | −2.56 | [−3.27 −1.85] | −4.01 | [−4.84 −3.19] | −2.07 | [−2.47 −1.67] |
| Cycle track | 0.03 | [−0.29 0.34] | −0.89 | [−1.74 −0.03] | 0.41 | [−0.48 1.28] |
| Cycle lane | −0.60 | [−1.28 0.08] | −0.17 | [−0.68 0.34] | 0.09 | [−0.34 0.52] |
| Shared lane | 1.45 | [−0.64 3.52] | −1.26 | [−2.10 −0.43] | 0.95 | [−4.13 6.01] |
| Random effects (intercept) | ||||||
| Monday | −0.02 | [−1.16 1.14] | -- | -- | −0.43 | [−1.33 0.42] |
| Tuesday | −0.50 | [−1.64 0.64] | −0.12 | [−152 1.27] | 0.35 | [−0.48 1.29] |
| Wednesday | −0.32 | [−1.46 0.84] | 0.82 | [−0.52 2.23] | 0.04 | [−0.81 0.95] |
| Thursday | 0.95 | [−0.16 2.16] | 0.04 | [−1.32 1.42] | 0.08 | [−0.76 1.02] |
| Friday | 1.07 | [−0.05 2.28] | −0.76 | [−2.16 0.60] | -- | -- |
| Saturday | −1.20 | [−2.35 −0.06] | -- | -- | -- | -- |
| Moving average | ||||||
| MA [1] | 0.71 | [0.68 0.73] | 0.62 | [0.59 0.65] | 0.47 | [0.44 0.51] |
| MA [2] | 0.34 | [0.31 0.37] | 0.25 | [0.21 0.28] | 0.16 | [0.12 0.19] |
| MA [3] | 0.15 | [0.13 0.18] | 0.09 | [0.06 0.12] | 0.04 | [0.01 0.07] |
| Bayes marginal R-squared | 0.491 | [0.479 0.501] | 0.505 | [0.492 0.517] | 0.439 | [0.422 0.455] |
| Bayes conditional R-squared | 0.507 | [0.497 0.518] | 0.516 | [0.504 0.528] | 0.441 | [0.424 0.457] |
| WAIC | 31,550 | 23,832 | 18,513 | |||
© 2020 by the authors. Licensee MDPI, Basel, Switzerland. This article is an open access article distributed under the terms and conditions of the Creative Commons Attribution (CC BY) license (http://creativecommons.org/licenses/by/4.0/).
Share and Cite
Apparicio, P.; Gelb, J. Cyclists′ Exposure to Road Traffic Noise: A Comparison of Three North American and European Cities. Acoustics 2020, 2, 73-86. https://doi.org/10.3390/acoustics2010006
Apparicio P, Gelb J. Cyclists′ Exposure to Road Traffic Noise: A Comparison of Three North American and European Cities. Acoustics. 2020; 2(1):73-86. https://doi.org/10.3390/acoustics2010006
Chicago/Turabian StyleApparicio, Philippe, and Jérémy Gelb. 2020. "Cyclists′ Exposure to Road Traffic Noise: A Comparison of Three North American and European Cities" Acoustics 2, no. 1: 73-86. https://doi.org/10.3390/acoustics2010006
APA StyleApparicio, P., & Gelb, J. (2020). Cyclists′ Exposure to Road Traffic Noise: A Comparison of Three North American and European Cities. Acoustics, 2(1), 73-86. https://doi.org/10.3390/acoustics2010006


