1. Introduction
In recent years, advances in colorectal cancer (CRC) screening have contributed to a significant decrease in mortality, mainly through the early detection and removal of precancerous lesions [
1,
2]. However, CRC remains a global burden, standing as the third most commonly diagnosed malignancy and the second leading cause of cancer-related deaths worldwide, accounting for roughly 10 of all cancer cases. Many well-established screening guidelines have played a role in improving outcomes, yet these recommendations typically rely on generalized, age-based recommendations, advising average-risk individuals to begin screening at age 50 [
3,
4]. This one-size-fits-all approach does not account for individual variability in risk factors such as genetics, lifestyle, and family history, potentially leading to suboptimal screening outcomes, nor does it offer a straightforward means for clinicians to discuss personalized risks with patients.
Risk prediction models have been used to address these limitations by facilitating personalized, risk-based screening [
4,
5]. This strategy can optimize resource allocation in screening by focusing efforts and resources on those who are most likely to benefit, ensuring that high-risk individuals are prioritized for early detection. At the same time, it reduces unnecessary procedures in average-risk individuals, minimizing the potential for overdiagnosis, reducing patient burden, and preventing unnecessary costs and complications associated with unnecessary screening procedures [
6].
Recent systematic reviews have evaluated existing CRC risk prediction models, revealing moderate to high discriminatory accuracy. Yet, despite encouraging developments in model-based risk assessment, recent reviews have highlighted recurrent hurdles. First, several existing tool algorithms that produce a risk score with little explanation of the contributing factors, such as lack of interpretability, impede clinicians’ ability to counsel patients effectively [
7]. Second, many existing tools rely on difficult-to-gather data, such as precise dietary intake, detailed genomics, or extensive lifestyle inventories, making them challenging to implement in settings with limited consultation time or in under-resourced clinics [
8,
9]. Third, while some models have reported promising discriminatory accuracy, they fail to include potentially relevant populations and risk factors, use inadequate statistical methods, select arbitrary thresholds that do not adapt to the needs of different populations or healthcare environments, and provide insufficient reporting on model stability and clinical applicability [
7].
Among widely used models, QCancer is a primary care-based risk algorithm designed for integrated use in electronic health records (EHRs) [
10]. While it incorporates multiple clinical and demographic variables, including family history, BMI, smoking status, and comorbidities, it did not include lifestyle factors (e.g., processed meat intake and physical activity) and is primarily trained on UK-based datasets, limiting its generalizability to other populations. Additionally, its reliance on pre-existing medical records may not fully capture modifiable risk factors that patients can address through lifestyle changes. Similarly, the APCS risk score predicts advanced colorectal neoplasia (ACN) using age, gender, smoking, BMI, diabetes, and alcohol intake, but it does not integrate modifiable lifestyle factors beyond smoking and alcohol [
11,
12]. The Kaminski risk score [
13] and NCI-CRC Risk Assessment Tool include additional variables, such as polyp history and NSAID use, but their reliance on detailed clinical data limits their feasibility in primary care settings, where rapid risk assessment is crucial [
14].
Even among models with high discriminatory accuracy, challenges such as complex risk stratification approaches and unclear cutoffs hindered their practical implementation. For optimal clinical use, these models should be well-integrated into EHRs to automatically display patient-specific risk scores, making them easy to use during consultations [
15,
16]. Additionally, these models must be interpretable, allowing clinicians to understand the factors driving predictions and communicate them effectively to individuals [
7,
15]. To address these limitations, we utilized data from the Prostate, Lung, Colorectal, and Ovarian (PLCO) Cancer Screening Trial, a large randomized controlled trial, focusing on clinical feasible variables that could be collected within a typical consultation. Using this robust dataset, we aimed to develop and internally validate an interpretable ML-based CRC risk prediction model that estimates an individual’s probability of developing CRC using readily available clinical and lifestyle factors. The model also provides transparent, feature-level insights enabling clinicians to refine risk stratification, personalize screening recommendations, and support informed decision making in healthcare settings.
2. Methods
2.1. Study Design and Population
This study utilized secondary data from the Prostate, Lung, Colorectal, and Ovarian (PLCO) Cancer Screening Trial, a large randomized controlled trial that enrolled approximately 155,000 participants, aged from 55 to 74 years, between November 1993 and July 2001. Participants were recruited in 10 PLCO Screening Centers across the United States. They were randomly assigned to either the intervention arm, receiving specific cancer screenings, or the control arm, receiving standard medical care.
Participants were eligible if they met the original inclusion criteria established by the PLCO trial as follows: aged 55–74 years at enrollment; no personal history of CRC; not currently undergoing treatment for any cancer (except basal or squamous cell skin cancer); and no prior complete removal of the entire colon. Additionally, from April 1995 onwards, individuals who had undergone a colonoscopy, sigmoidoscopy, or barium enema within the last three years were excluded. Participants involved in other cancer screening or prevention trials were also excluded.
For CRC screening, intervention arm participants underwent two flexible sigmoidoscopies (FSGs) as follows: one at baseline and another three or five years later, depending on protocol adjustments. Cancer diagnoses were collected until 31 December 2009 and mortality data through 2015, providing a median follow-up of 11.3 years. The dataset was obtained through the Cancer Data Access System (CDAS) by submitting a project proposal and adhering to data use policies (approval reference:
https://cdas.cancer.gov/approved-projects/3478/) (accessed on 15 August 2022).
2.2. Outcome Measure
CRC was assessed using detailed records from various sub-datasets of the PLCO Trial [
17]. CRC diagnoses included all stages from I to IV and cases where the carcinoid could not be assessed. FSG exam results were categorized as negative, abnormal suspicious, abnormal non-suspicious, or inadequate, with the adequacy of exams recorded. Lesion details included the largest lesion’s location (rectum, sigmoid colon, descending colon, and splenic flexure) and size (diminutive, small, and large).
Advanced adenomas were identified if polyps were villous, had dysplasia, or were large (≥1 cm), including in situ carcinomas. Polyps were further classified based on whether they were completely villous (not applicable, not completely villous, completely villous, and unknown), the level of dysplasia (none, severe, moderate, mild, and unknown), and histology (adenoma, hyperplastic, benign polyp, colonic mucosa, other, and not available).
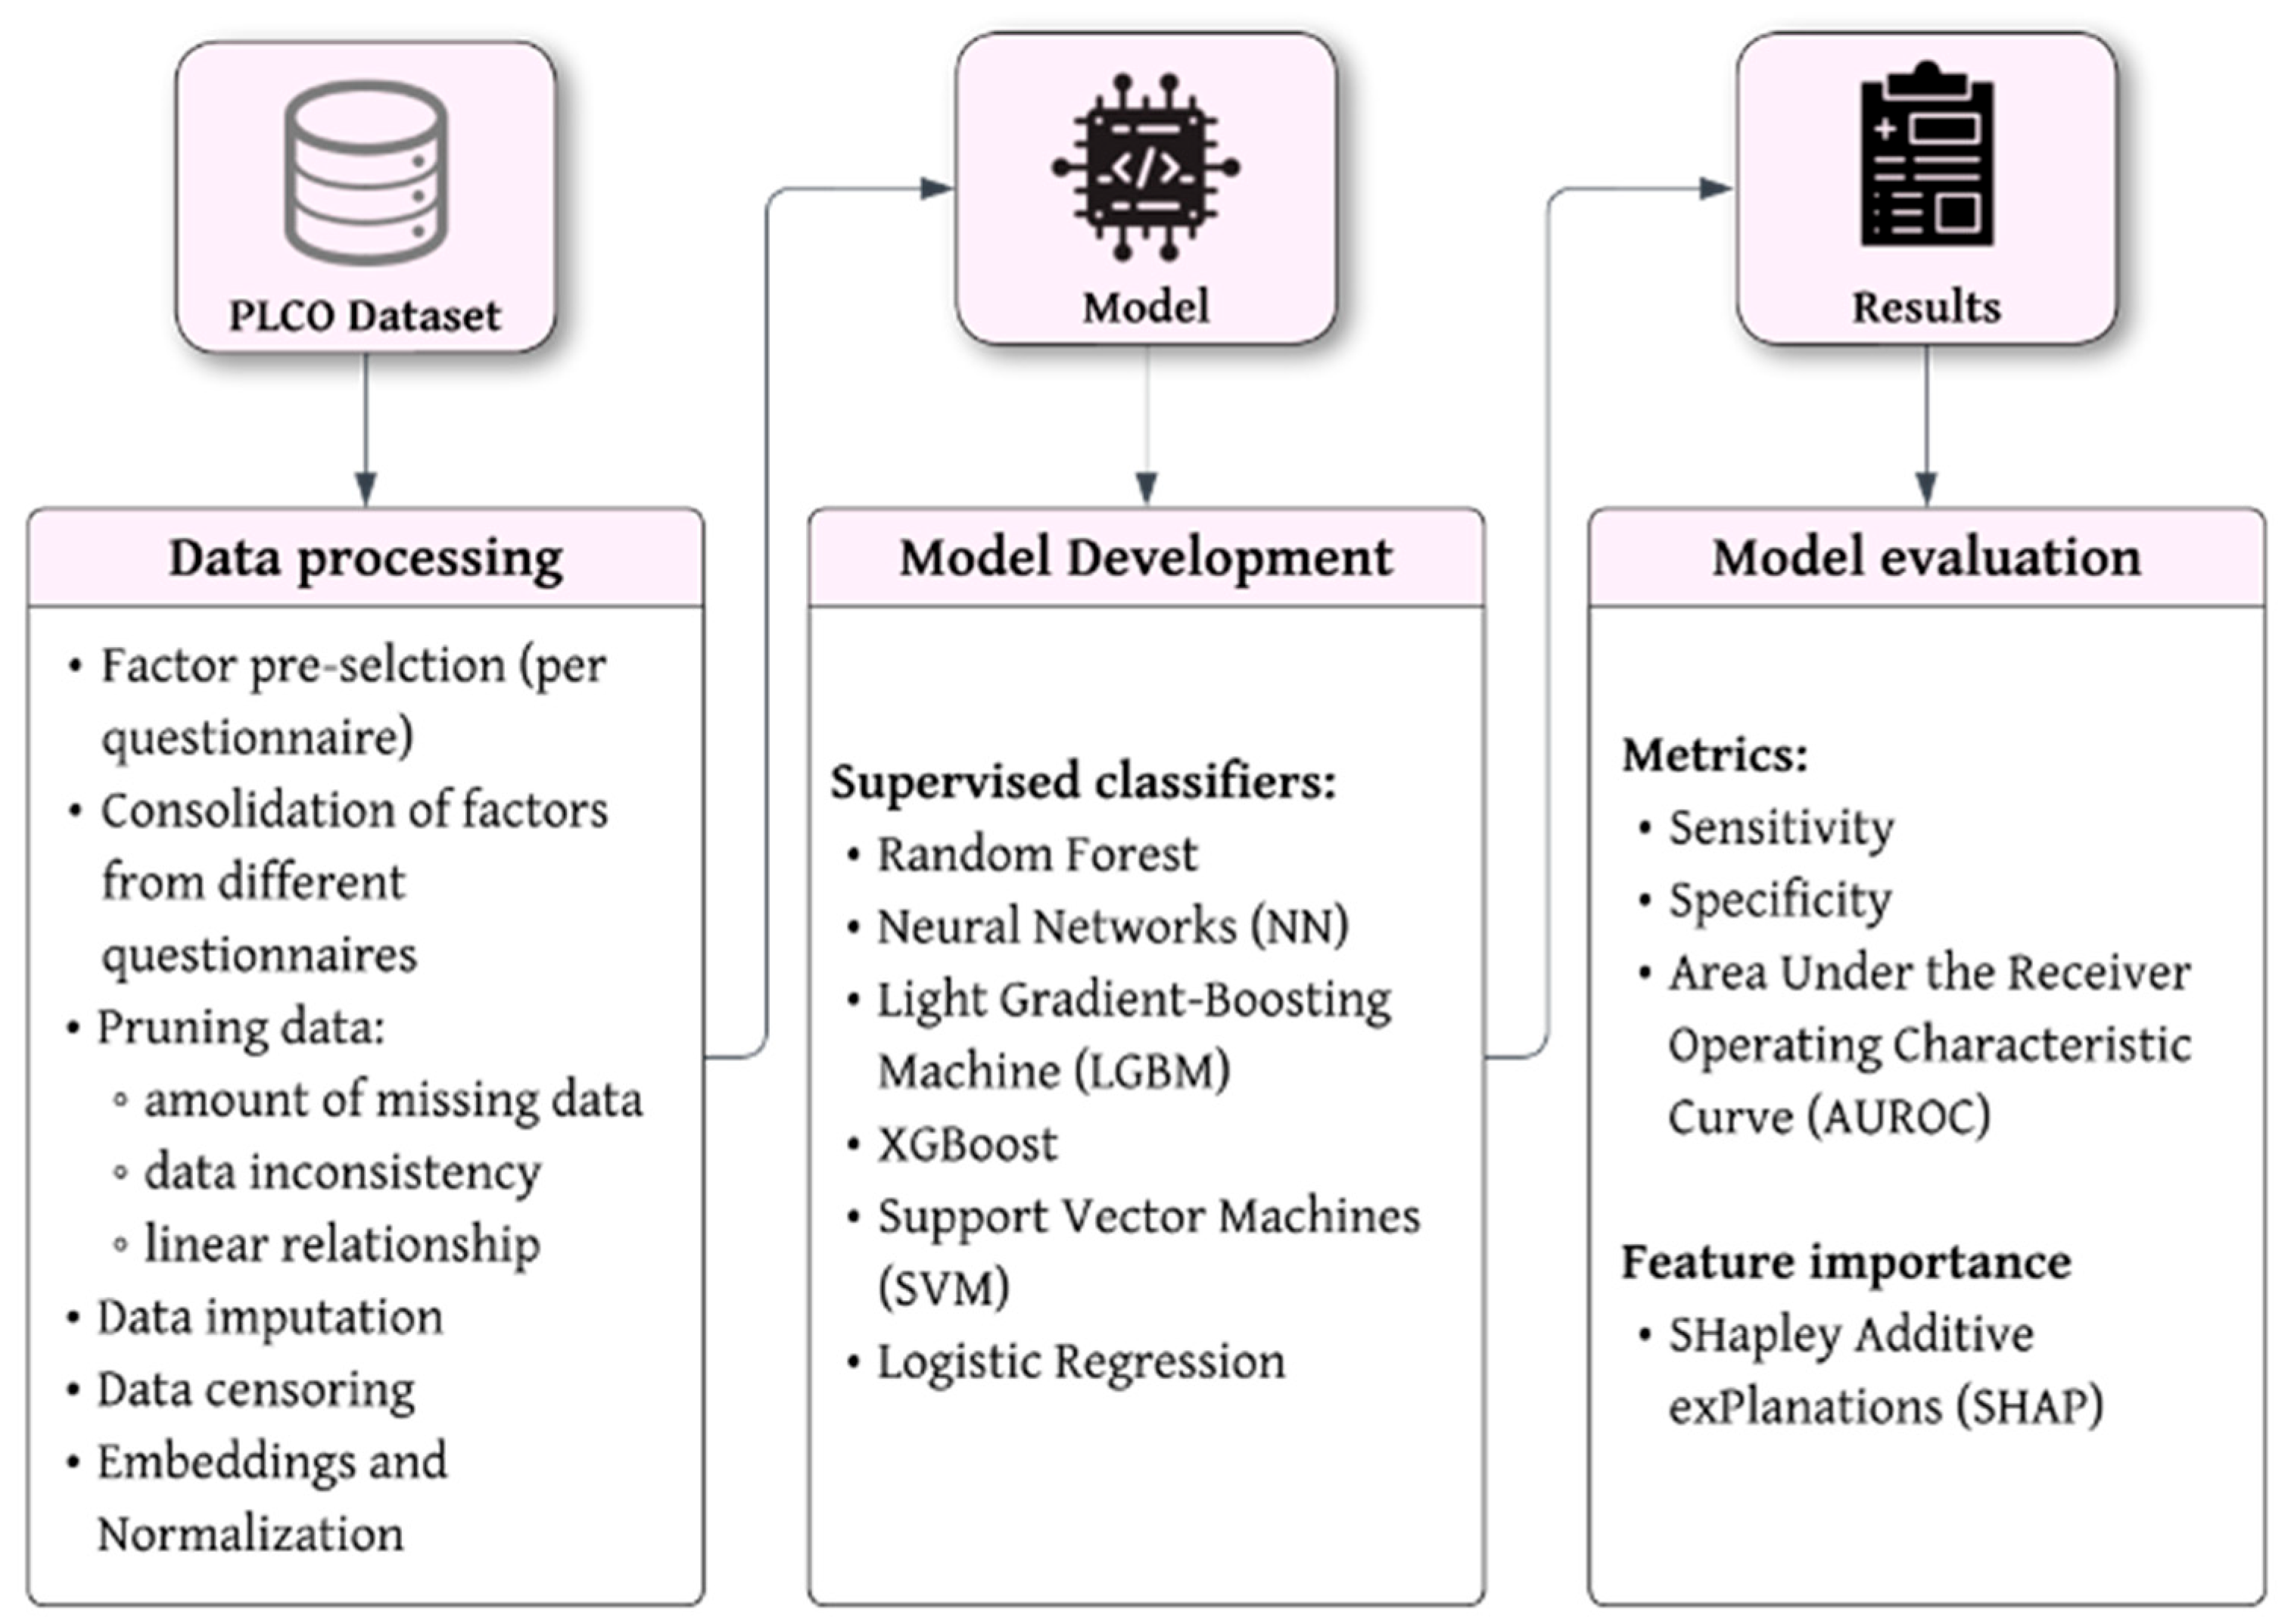
2.3. Data Processing
We followed a structured process of data handling, from factor preselection to model validation. A schematic overview of the entire data processing workflow and the definition of key terms and definitions to machine learning are shown in
Figure 1 and
Table S1 (Supplementary Materials), respectively.
2.3.1. Factor Preselection
We identified the relevant risk factors based on our systematic review of existing models, which synthesized evidence on advanced neoplasia in CRC screening [
9]. The review highlighted key risk factors commonly used across studies, and we selected those available in the PLCO dataset that are known to have a strong association with CRC risk. While we focused on factors well-established in the literature, we also tested different factors available in the dataset to assess their potential relevance to our model.
2.3.2. Pruning of Data
The initial data pruning was performed with patients that did not handle any questionnaire to the study (4106 cases). The first feature selection process was conducted manually, excluding factors that were geographically related, unrelated, or following screening for CRC (e.g., fractures and chemotherapy). Additionally, factors exhibiting high collinearity (Pearson’s r ≥ 0.85) and those with negligible correlation with the target variable (Pearson’s ≤ 0.001) were excluded.
Variables that patients may find difficult to answer accurately were also excluded. For instance, asking patients to report the exact grams of red meat or fiber consumed daily can be challenging and may lead to unreliable data due to recall bias or estimation errors. Instead, we favored more practical variables such as general drinking habits (e.g., consumption of alcoholic drinks per week) that are easier for patients to report and for clinicians to assess.
Further feature selection was conducted based on the existing literature on CRC screening, ensuring that the selected variables align with the constraints of a standard medical consultation, which typically lasts 15 min. Additionally, variables that are impractical to obtain within a clinical setting were excluded to enhance the model’s applicability in real-world medical practice. With a final set of 12 factors, 267 cases were found with more than 30% missing data, which were excluded to ensure data integrity and reliability for model training. Furthermore, 796 cases missing age were also removed, as age is a critical factor in cancer risk prediction.
2.3.3. Handling Missing Data
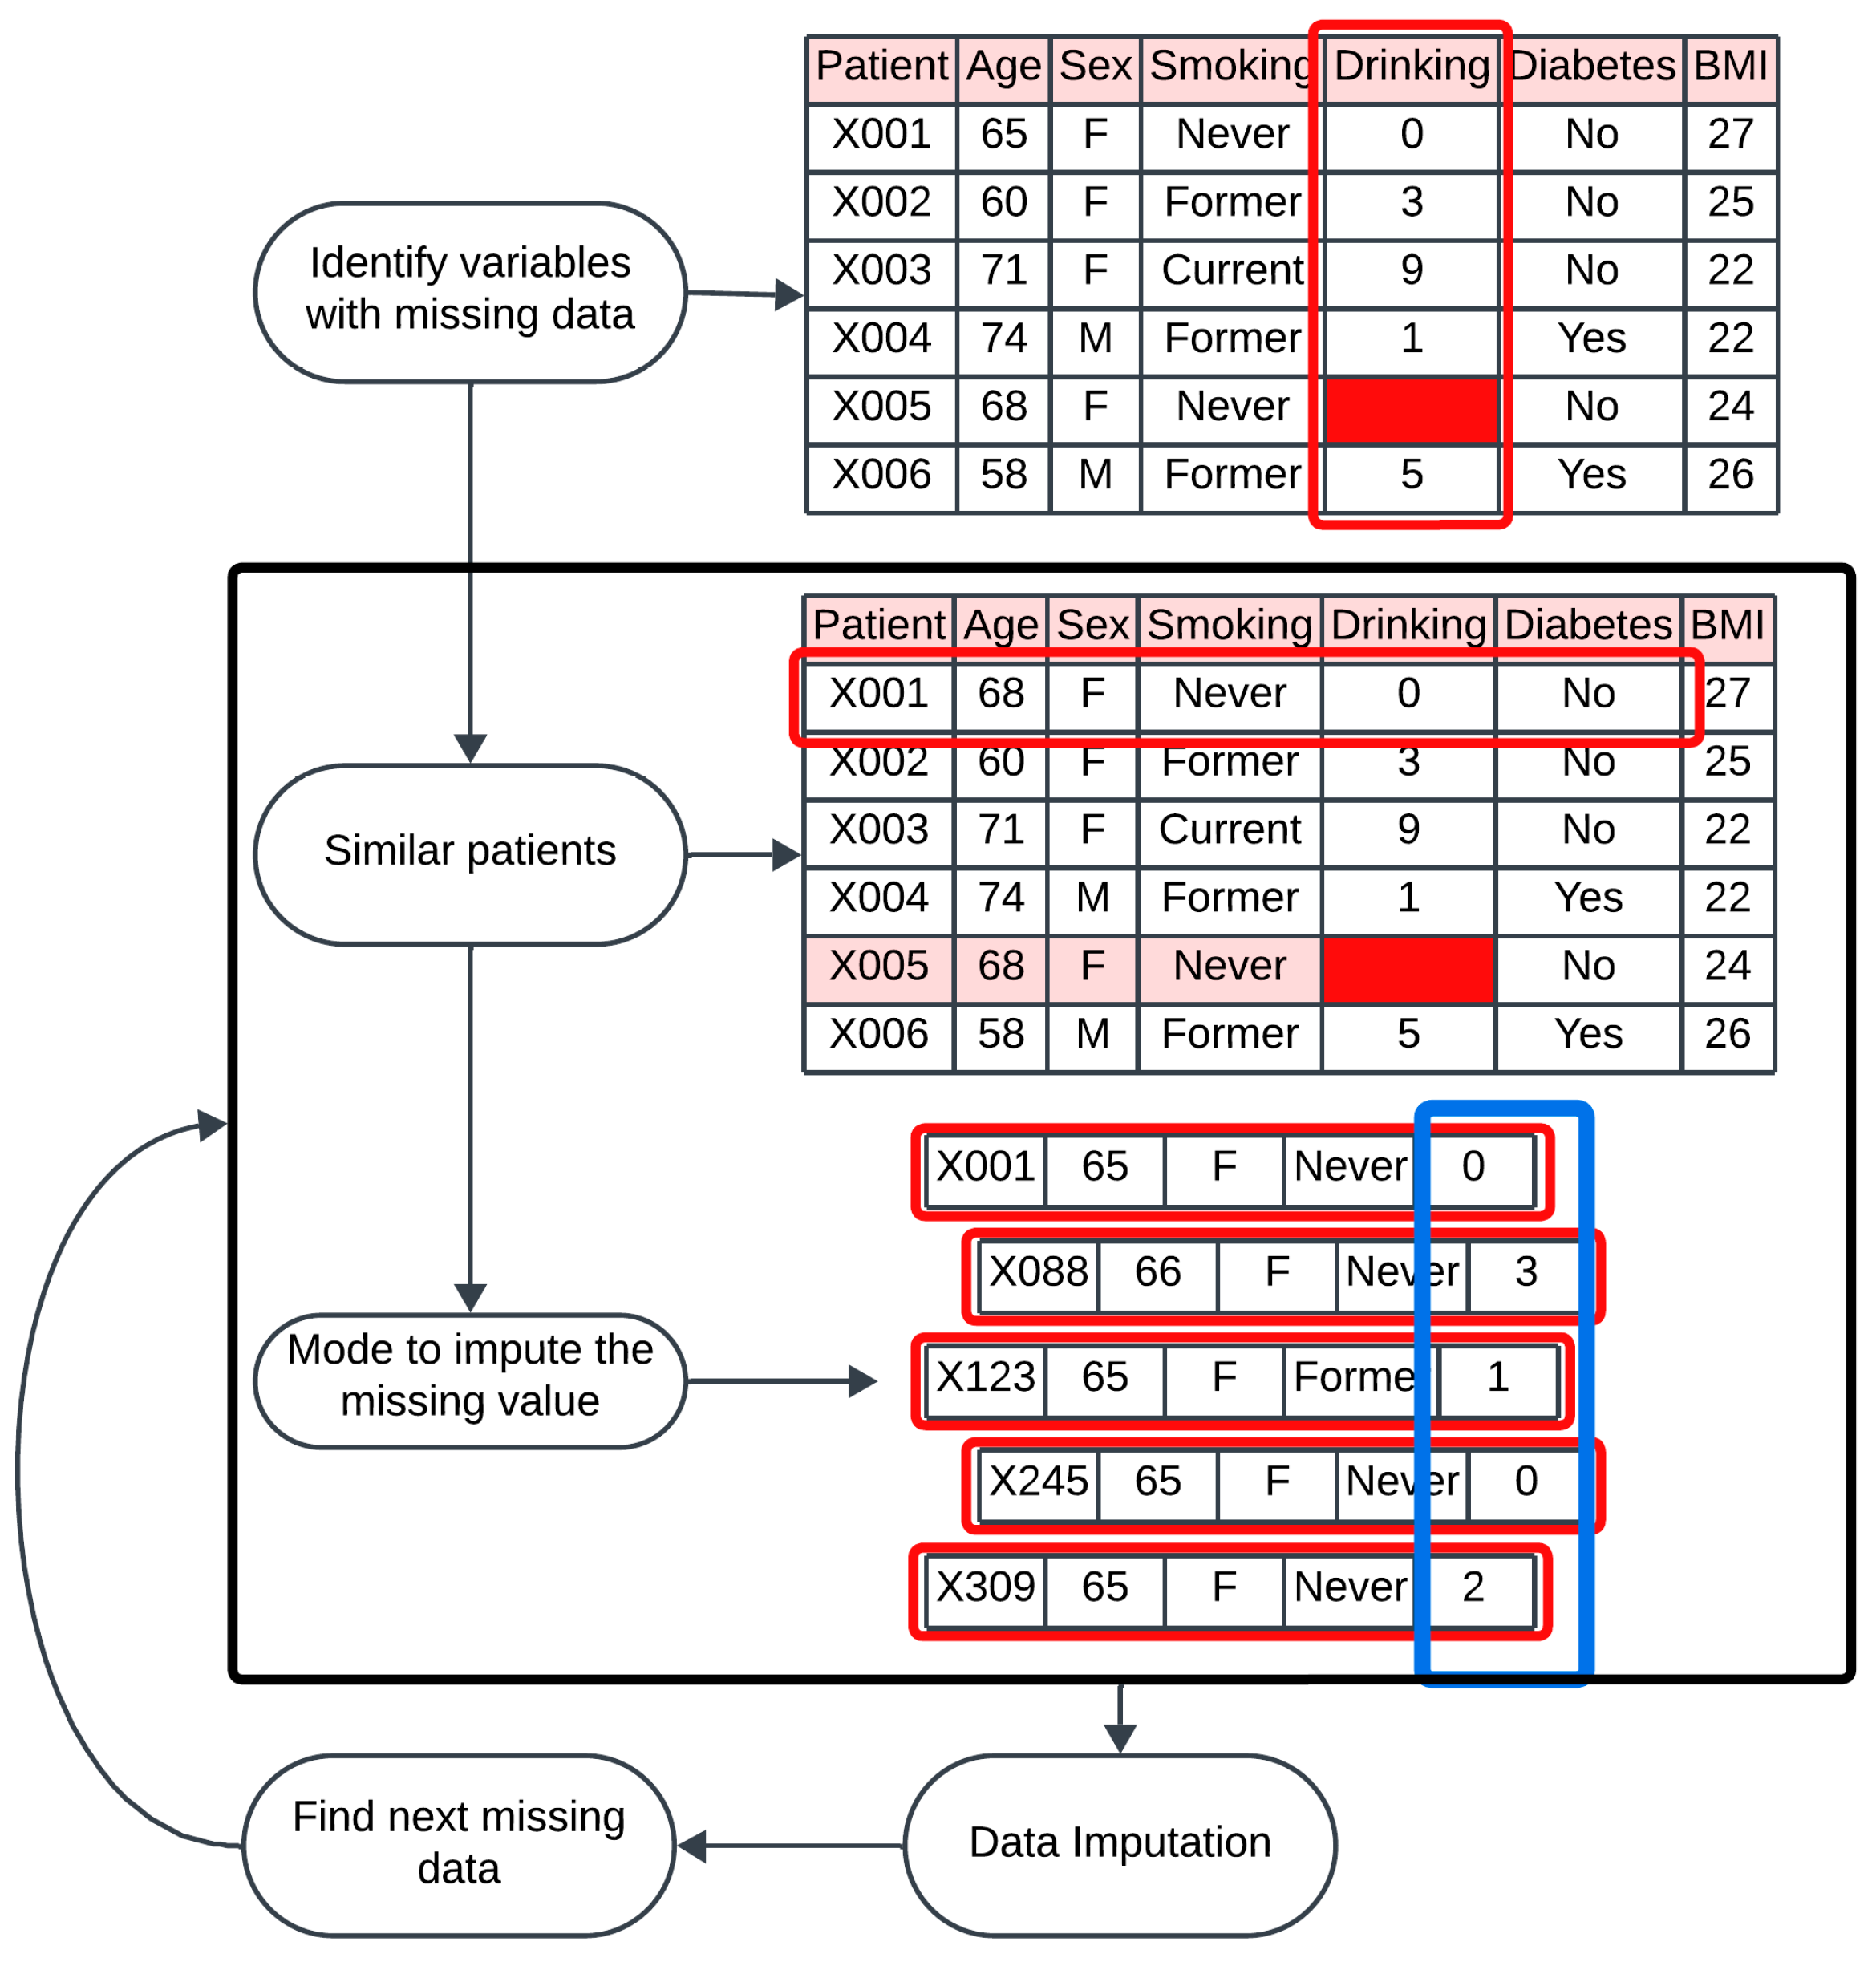
To address missing values in the dataset, we applied mode imputation based on similarity for categorical factors and k-nearest neighbors for numerical features. These approaches are grounded according to the principle that imputing missing data using records similar to the one with missing values yields more accurate results than methods relying on the entire dataset [
18].
Correlated factors and similar patients were used to predict and fill in missing data points. In practice, for each participant with missing data, we identified a subset of participants with similar demographic and clinical profiles. Correlated factors were used to define the similarity among participants. For example, if the hypertension factor was missing for a participant, we imputed this value using the mode for hypertension of participants who shared at least 4 similar characteristics. The characteristics used for the imputation of the categorical factors—diabetes, hypertension, heart problems, and smoking status—are age, sex, BMI, number of cigarettes per day, and alcohol-related factors (
Figure 2). On the other hand, for the numerical factors, the number of neighbors used for imputation was 10, meaning that the 10 most similar cases were used to perform the imputation of the missing value.
2.3.4. Data Restriction by Age
For patients diagnosed with CRC, we restricted data based on the age at which CRC was detected or the age at colonoscopy to ensure consistent data handling. Additionally, a second form of censoring was applied to patients initially categorized as negative for CRC but who later died from CRC (missed diagnoses or post-colonoscopy CRCs (PCCRCs)). These cases often arise from missed lesions, incomplete polyp removal, or rapidly developing cancers that were undetectable during colonoscopy. Between these cases, inconsistencies were found where deaths initially attributed to CRC were later identified to be due to other causes. To reduce uncertainty and potential biases, we decided to exclude these patients from our analysis.
2.4. Model Development
Supervised Classifiers
Several ML algorithms were tested to develop the CRC risk prediction model. Following the sensitivity analysis, we decided to use LightGBM due to its demonstrated efficiency and accuracy in handling large-scale datasets (see
Table S1 for the definition of LightGBM). This method followed a gradient boosting framework, combining weak models (decision trees), where each new model (tree) aims to correct the errors of the previous ones.
2.5. Model Evaluation
2.5.1. AUROC of the Model
In evaluating the performance of our machine learning model, we focused on three key metrics as follows: [
1] the Area Under the Receiver Operating Characteristic curve (AUROC) [
2], sensitivity, and [
3] specificity. The AUROC provides an aggregate measure of the model’s performance across all classification thresholds. The AUROC value ranges from 0 to 1, with higher values indicating better overall performance. An AUROC of 0.5 suggests no discriminative power, while an AUROC of 1.0 signifies perfect discrimination.
2.5.2. Sensitivity and Specificity of the Model
Sensitivity, or the true positive rate, measures the model’s ability to correctly identify positive instances. It is calculated as the ratio of true positives (
TP) to the sum of true positives and false negatives (
FN), expressed as
Specificity, or the true negative rate, assesses the model’s ability to correctly identify negative instances. It is defined as the ratio of true negatives (
TN) to the sum of true negatives and false positives (
FP), given by
These metrics provide a clear understanding of the model’s performance and a balance in the detection of true positives, the exclusion of false positives, and the overall classification ability across various thresholds.
2.6. Regressor Model and Threshold Selection
The model used is a regressor that outputs a percentage representing the probability of a patient having CRC. Unlike a classifier that would simply return a binary outcome—1 for cancer cases and 0 for non-cancer cases—a regressor analyzes historical data to identify patterns and provides a probability that quantifies the individual’s likelihood of CRC. This probabilistic output allows for more nuanced decision making in healthcare settings.
To determine whether patients are classified as positive or negative for CRC, a threshold percentage was selected. To obtain this threshold, we conducted a validation process utilizing the test dataset that comprised 15% of the total dataset, separate from the training dataset (70%) and the evaluation dataset (15%).
2.7. Feature Importance
To enable clinicians to give personalized information to patients about their CRC risk, SHapley Additive exPlanations (SHAP) analysis was performed to identify the most important factors that predict the risk of CRC. SHAP values are calculated by inputting patient data to the trained model to explain each prediction’s feature-level importance. This results in a ranked list of factors showing their contributions to the risk prediction.
3. Results
3.1. Participant Selection
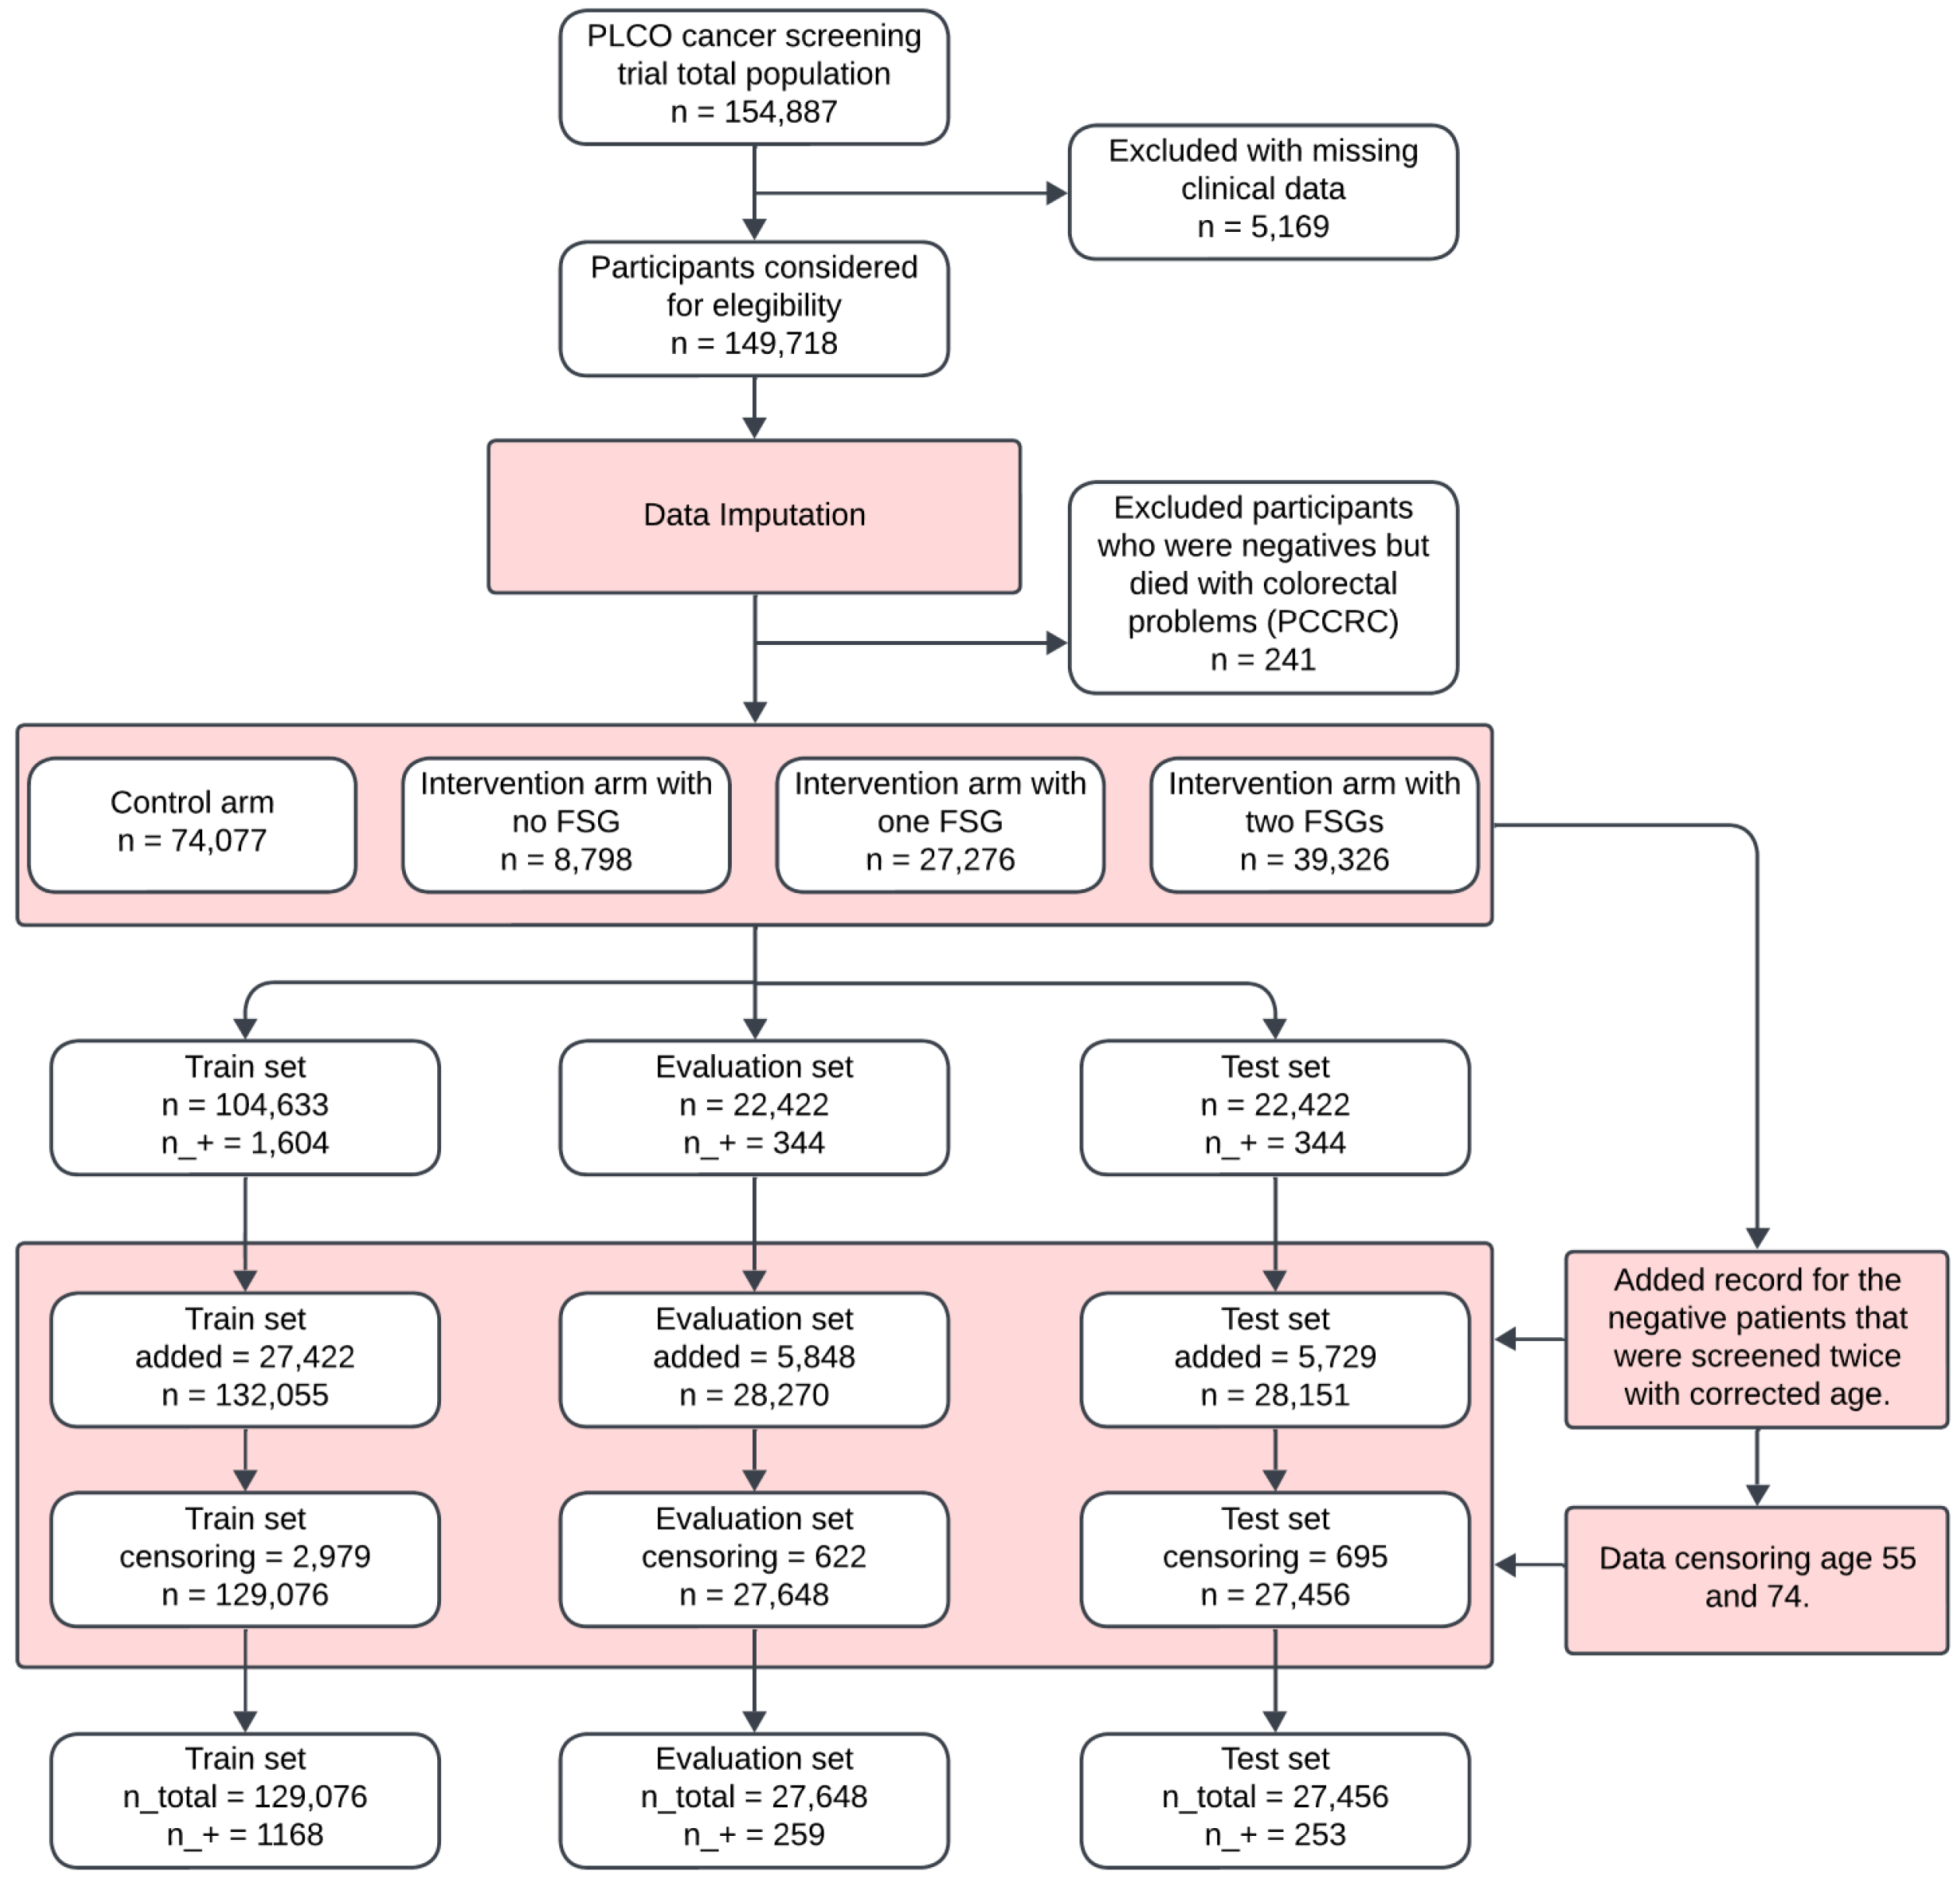
The flowchart in
Figure 2 outlines the participant selection and dataset preparation process for the development of the ML-based CRC model. Out of a total of 154,887 observations, 5169 (3.34%) were excluded due to excessive missing clinical data.
Following data imputation, an additional 241 cases were removed, as they were negative cases who later died from post-colonoscopy colorectal cancer (PCCRC). The final eligible participants consisted of 149,718 individuals, who were divided into the following four groups: 74,077 (49.5%) in the control arm, 8798 (5.9%) in the intervention arm with no flexible sigmoidoscopy (FSG), 27,276 (18.2%) in the intervention arm with one FSG, and 39,326 (26.3%) in the intervention arm with two FSGs. These groups were further split into training, evaluation, and test sets (
Figure 3).
3.2. Participants’ Demographic and Clinical Characteristics
The demographic and clinical characteristics of the study population were comparable across the training, evaluation, and test sets, as summarized in
Table 1. The average age of participants was 62.64 years (SD ± 5.36), with a nearly equal gender distribution of 50.76% females and 49.24% males.
Health conditions were prevalent in the dataset, with 34.26% of participants diagnosed with hypertension, 13.63% reporting heart problems, and 7.77% diagnosed with diabetes. In terms of smoking history, 10.70% were current smokers, 43.09% were former smokers, and 46.21% had never smoked. Alcohol consumption was generally low across the population, with an average of 0.71 drinks per day (SD ± 1.88).
The demographic and clinical characteristics of participants were comparable across the training, evaluation, and test sets, with consistent mean age, sex distribution, BMI, and prevalence of health conditions (
Table 2).
3.3. Model Development and Performance
To develop a reliable machine learning model for predicting colorectal cancer (CRC) risk, we incorporated key clinical and lifestyle factors, including sex, age, weight, height, body mass index (BMI), hypertension, heart pathology, diabetes, smoking history, smoking quantity, and alcohol consumption. These factors were selected based on their established association with CRC risk.
3.3.1. Model Selection and Evaluation
To determine the most effective predictive model, we tested multiple machine learning algorithms on the PLCO dataset, comparing their ability to differentiate between individuals at risk of CRC and those not at risk.
Table 3 presents a comparison of the most effective machine learning models, excluding those with poor performance. The LightGBM (LGBM) model demonstrated the best balance between sensitivity (correctly identifying individuals with CRC) and specificity (correctly identifying those without CRC). The Neural Network (NN) model exhibited a slightly higher accuracy (0.616) but a lower sensitivity (0.711) than LGBM. The Random Forest (RF) model performed similarly to LGBM, achieving 0.692 sensitivity and 0.601 specificity. Meanwhile, XGBoost showed the highest accuracy (0.649), with a more balanced sensitivity (0.68) and specificity (0.649).
3.3.2. Model Performance Metrics
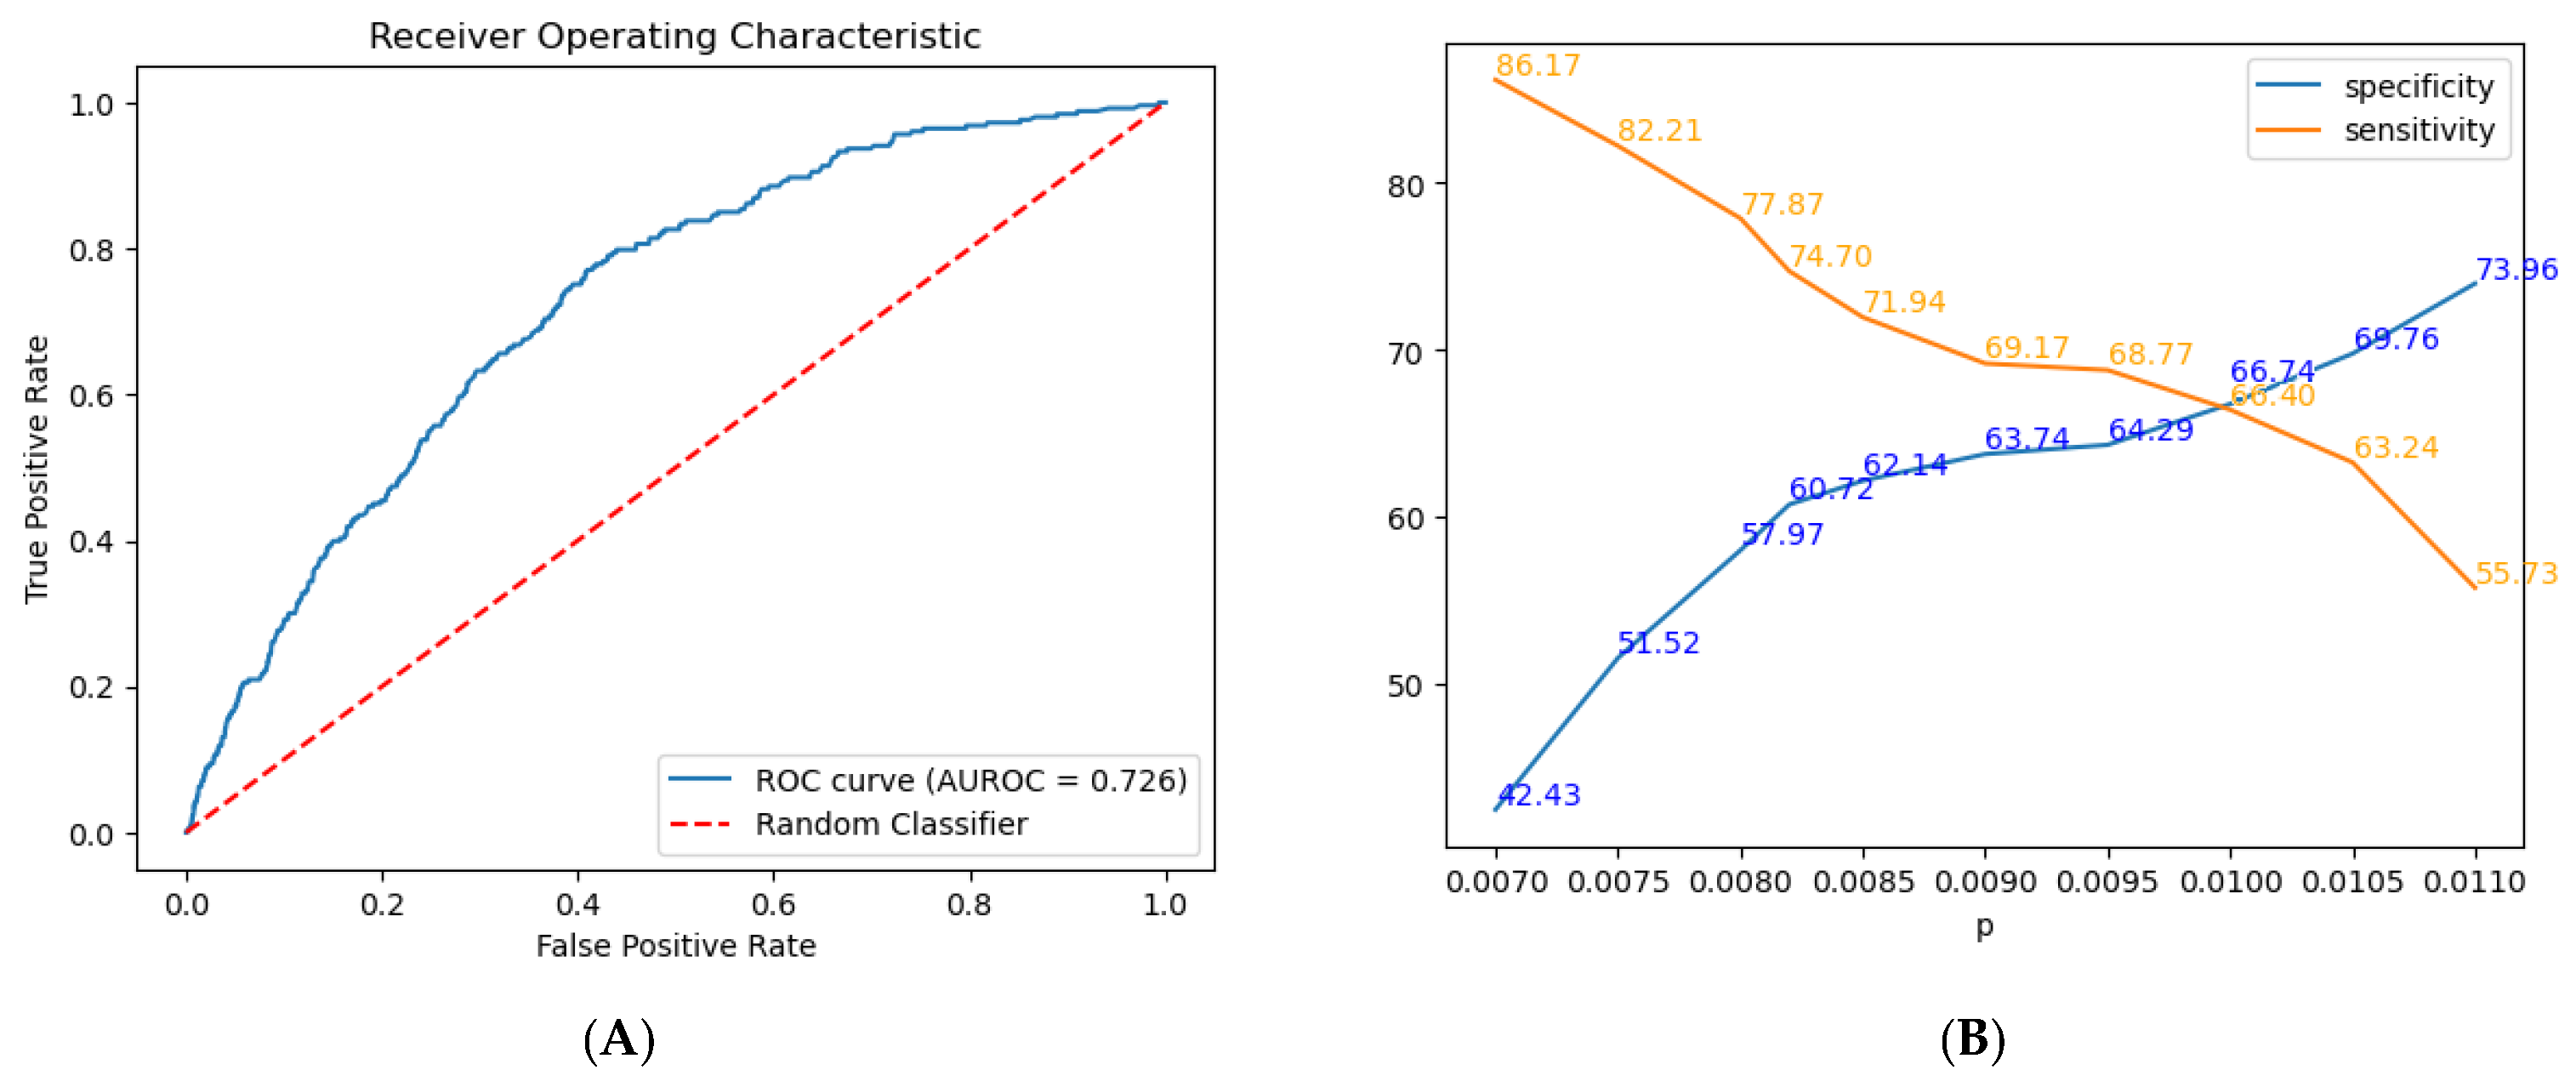
The model included the following factors: sex, age, weight, height, BMI, hypertension, heart pathology, diabetes, family history of CRC smoking history, smoking quantity, and alcohol consumption. Following hyperparameter tuning, the LightGBM model achieved an AUROC of 0.726 (
Figure 4A and
Table 3), reflecting moderate discriminative power for differentiating between positive and negative CRC cases. Furthermore, the model exhibits a sensitivity of 0.747, correctly identifying 74.7% of true positive cases, and a specificity of 0.6072, correctly identifying 60.72% of true negative cases.
Additional commonly used metrics include the Positive Predictive Value (PPV) and Negative Predictive Value (NPV). The LGBM model achieved an NPV of 0.996 and a PPV of 0.017. However, due to the highly imbalanced nature of our dataset, with one positive case for every 89 negative cases, these metrics are significantly affected by class distribution.
3.4. Regressor Model
Figure 4B shows the trade-off between specificity and sensitivity at various probability thresholds (
p) for our model. Specifically, we evaluated predictions across a range of thresholds, selecting a specific threshold for analysis. As
p increases from 0.007 to 0.011, specificity improves from 42.43% to 73.96%, while sensitivity decreases from 86.17% to 55.73%.
3.5. Threshold Selection
To support screening, we prioritized sensitivity, selecting a lower threshold of 0.0082 to better identify at-risk individuals, balancing the risk of false positives with the need for early CRC detection. We considered the optimal threshold (0.0082) to maximize sensitivity and specificity at 0.7470 and 0.6072, respectively.
While the F2 score (0.007796), which weighs sensitivity twice as much as specificity, could have been used, with sensitivity at 0.798 and specificity at 0.560, it may overemphasize sensitivity at the cost of specificity, making our chosen threshold a more practical choice (
Figure 4B). The probability threshold for categorizing CRC risk was based on the incidence of positive cases with higher risk scores (
Table 4).
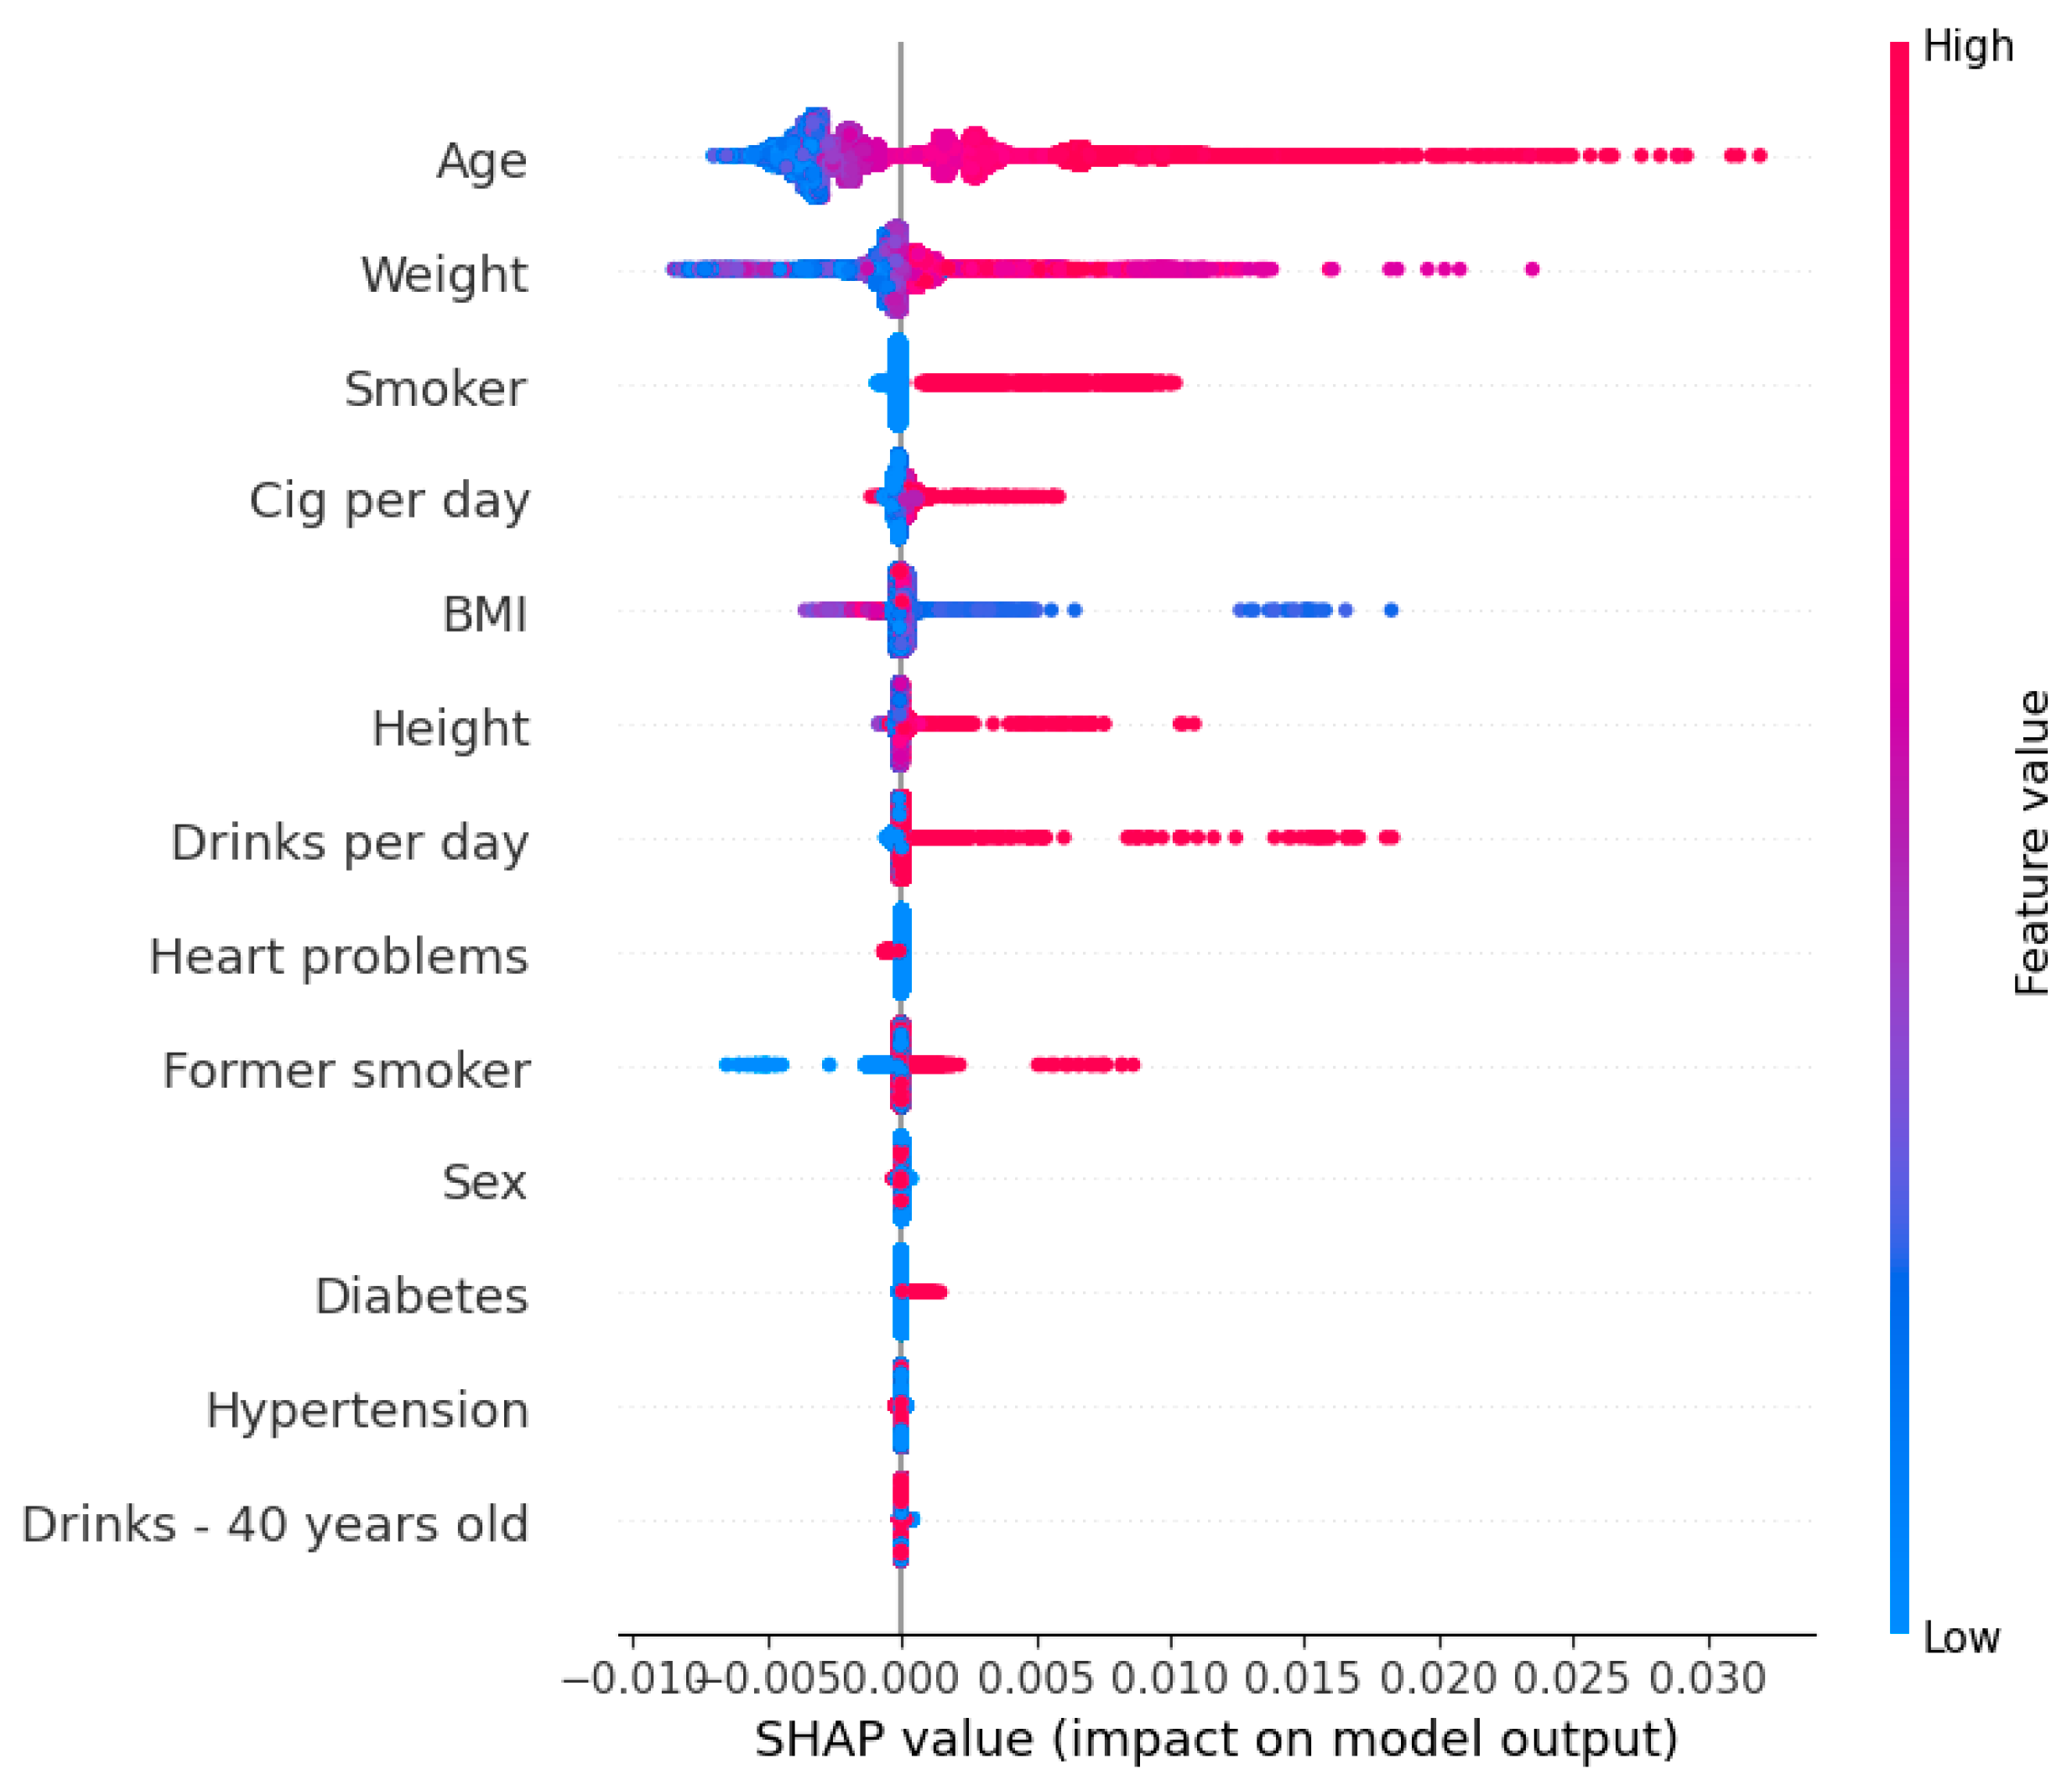
3.6. Feature Importance
Figure 5 displays the contribution of each factor to the CRC risk prediction model, utilizing SHAP. Factors are ordered along the
y-axis based on their significance in the model’s predictions. SHAP quantifies the impact of each factor on an individual’s prediction, with positive values indicating an increased risk of CRC and negative values indicating a decreased risk.
Our analysis identified age, weight, and smoking status as significant factors of increased CRC risk, implying that higher values in these factors are associated with higher predicted risk. Conversely, cases of regular use of medications for heart conditions are slightly correlated with a reduced risk of CRC.
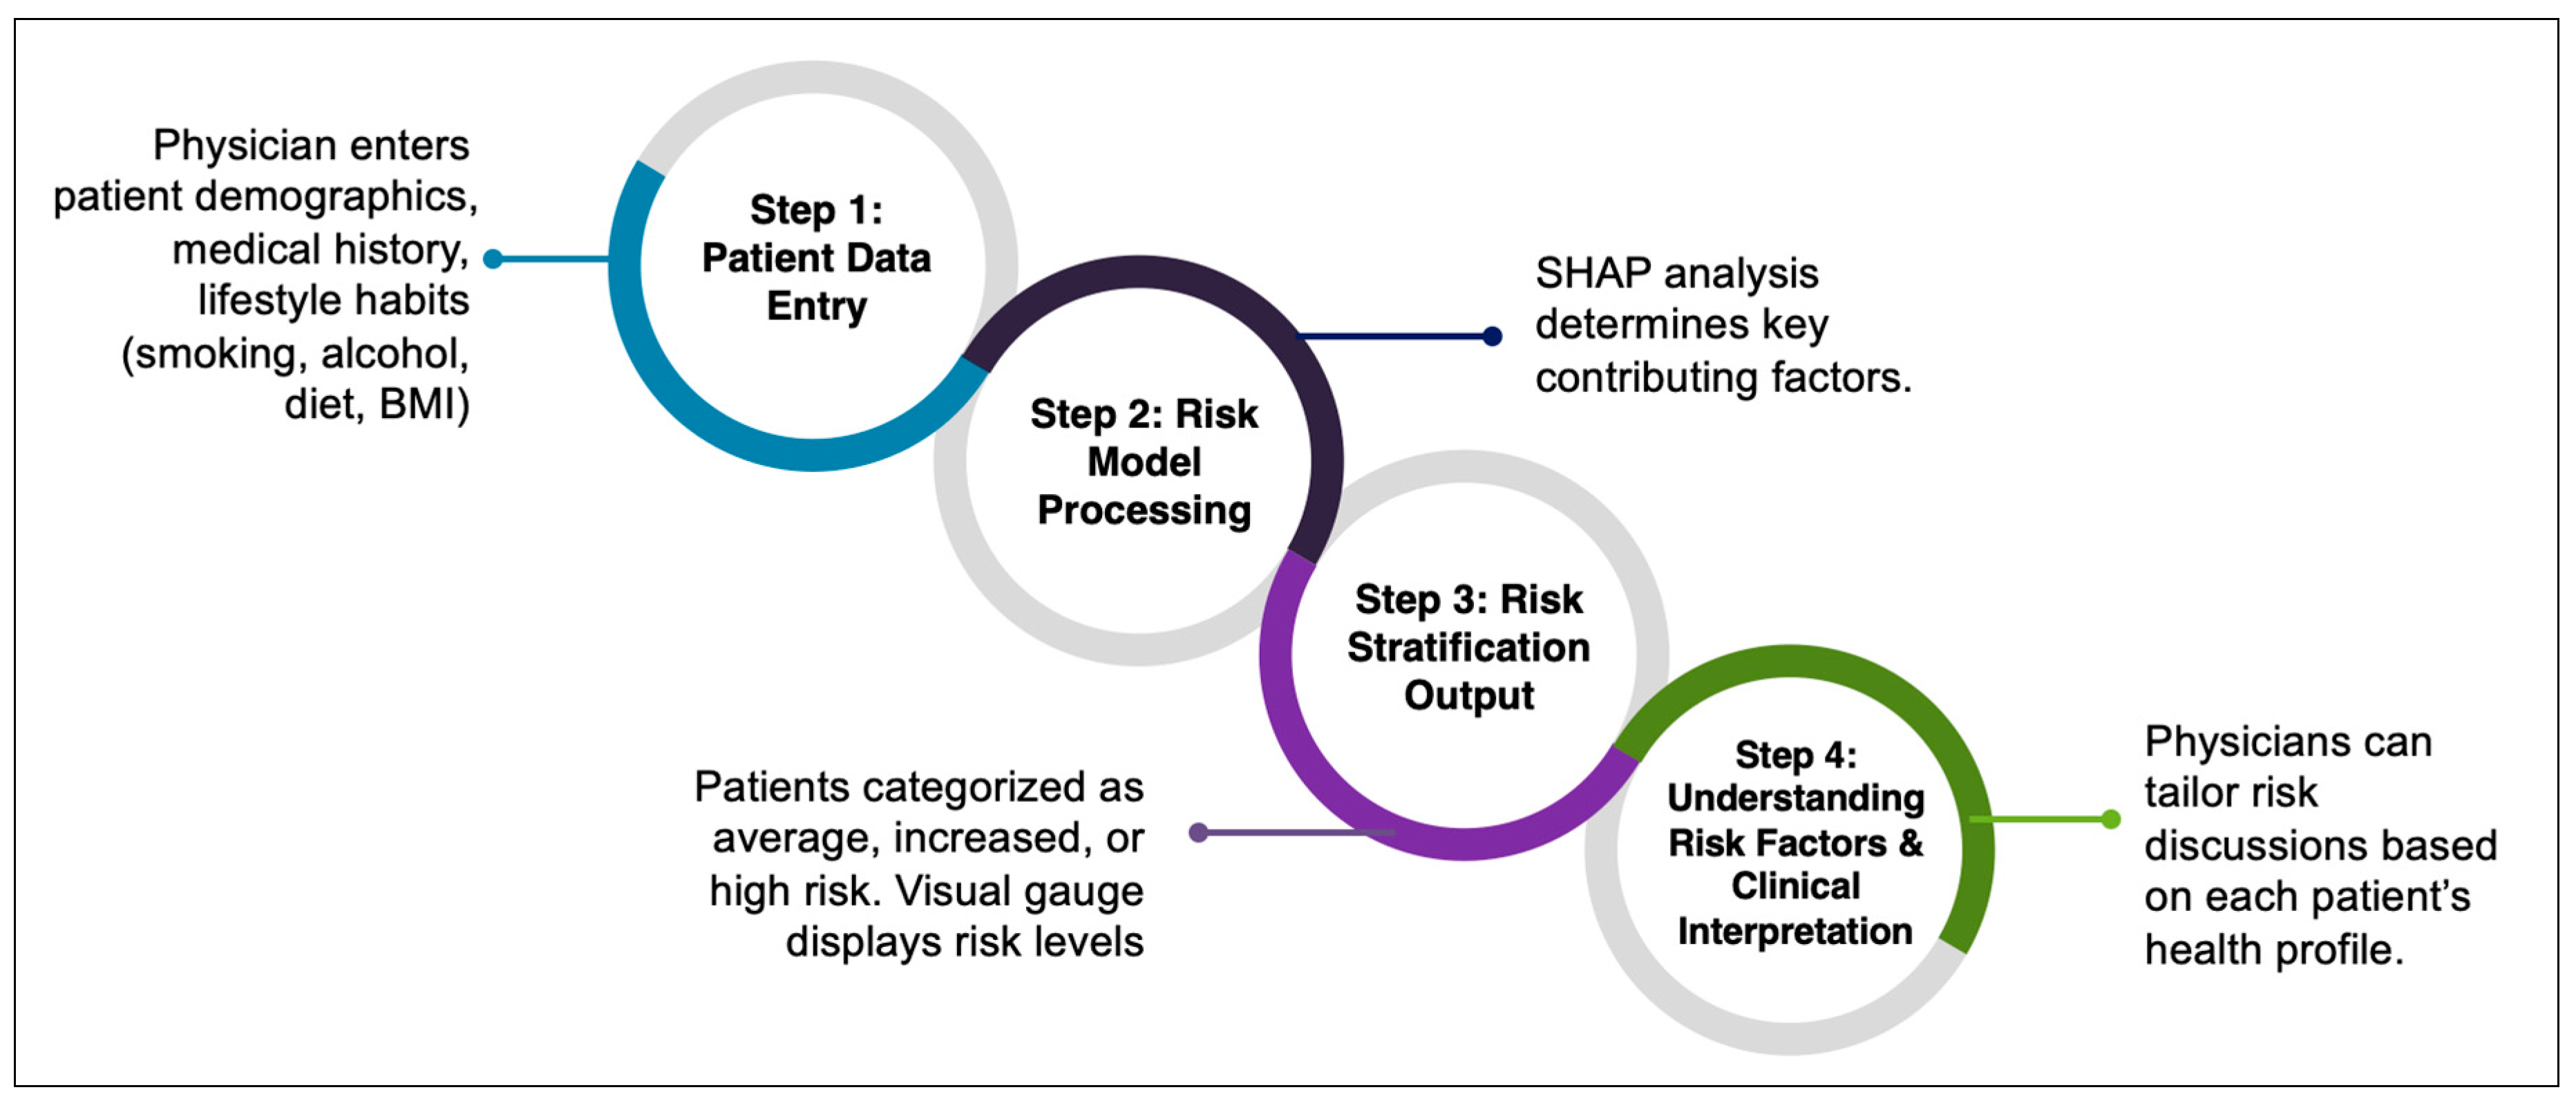
3.7. Clinical Applicability of the Model
To facilitate real-world implementation, we integrated our CRC risk prediction model into an interactive risk estimator tool designed for use in primary care consultations. This tool dynamically adapts its assessment based on patient responses and provides personalized screening recommendations to support clinical decision making (
https://bibopp-acc.vito.be/orient/deelnemen) (accessed on 6 March 2025) (
Figure 6).
The model generates a personalized risk score, categorizing patients into average-, increased-, or high-risk groups. Results are presented in an easy-to-understand, color-coded gauge, allowing both physicians and patients to quickly interpret their risk level and make informed decisions about screening and lifestyle modifications.
For high-risk patients with a family history of CRC, the tool automatically recommends a colonoscopy, ensuring they receive timely screening. For individuals without a family history, the tool assesses modifiable lifestyle risk factors such as diet, smoking, alcohol use, BMI, hypertension, and diabetes, offering personalized advice on reducing risk.
4. Discussion
4.1. Summary of Findings
While FIT is a widely used non-invasive screening tool with high sensitivity and specificity for detecting CRC [
19], it does not inform patients about modifiable behaviors or conditions contributing to their risk. As a result, patients with positive FIT results may not understand the factors behind their outcome or ways to reduce future risk. Our primary goal was to develop and internally validate a machine learning-based risk prediction model that not only estimates CRC risk with reasonable performance but also addresses the key limitations of existing models, including interpretability, real-world applicability, and adaptability to different clinical settings.
Our model demonstrated moderate discriminatory power, achieving an AUROC of 0.726. This indicates that the model can moderately distinguish between individuals with and without CRC. This falls within the range reported for existing logistic regression-based models (0.60–0.75), demonstrating comparable predictive capability while incorporating machine learning advantages. We incorporated the following 12 easily obtainable clinical factors into the model: sex, age, weight, height, body mass index (BMI), hypertension status, heart conditions, diabetes status, smoking history, smoking quantity, and alcohol consumption. Unlike many existing CRC risk models that require genetic markers, biochemical tests, or complex dietary assessments, our model was designed for use in routine clinical consultations, where data collection time and resources may be limited.
4.2. Comparison with Conventional Risk Models
To assess the added value of our model over traditional logistic regression-based approaches, we compared its performance to existing CRC risk models. While many logistic regression models have been developed to estimate CRC risk [
20,
21], our model incorporates advanced ML techniques, improving predictive performance by capturing non-linear relationships and interactions among risk factors.
Previous logistic regression models report AUC values ranging from 0.60 to 0.75 [
9], with many relying on family history, genetic risk scores, or laboratory values that are not always practical for real-world implementation. In contrast, our model does not require genetic markers or invasive testing, making it more applicable in routine clinical settings. Additionally, our model demonstrated comparable or superior performance (AUROC 0.726) to traditional logistic regression models, without requiring additional laboratory assessments. Moreover, the use of SHAP interpretability techniques enhances clinical transparency, allowing clinicians to see which factors drive individual risk scores, an advantage over conventional regression models that often provide limited interpretability.
4.3. Risk Stratification and Threshold Selection
A key feature of our predictive model is the generation of a risk score that categorizes patients into average-, increased-, or high-risk groups for CRC. This stratification is based on the probability threshold we selected and enables clinicians to tailor their communication and recommendations according to the patient’s risk level. For instance, patients identified as increased or high risk can be counseled on specific lifestyle modifications, the importance of regular screening, or referred for further diagnostic evaluations.
In selecting the probability threshold for categorizing CRC risk, we prioritized sensitivity (0.747) to minimize the likelihood of overlooking individuals at risk. A highly sensitive threshold ensures that fewer at-risk individuals are missed, which is particularly important in early cancer detection. However, an overly sensitive model may increase false positives, leading to unnecessary follow-ups, patient anxiety, and additional healthcare costs. Conversely, a stricter threshold that improves specificity would reduce false positives but might miss individuals who could benefit from early intervention.
To balance these factors, we evaluated multiple threshold levels and selected 0.0082 as the most appropriate cut-off for risk classification. At a threshold of 0.0082, the model achieves a sensitivity of 74.7%, meaning that nearly 75% of patients with CRC risk are correctly identified. While the specificity at this threshold was around 61%, we considered this acceptable for a screening-oriented tool where the emphasis is on maximizing the detection of potential CRC cases. Compared to a lower threshold (e.g., 0.0078), which would have increased sensitivity to 79.8% but reduced specificity to 56%, the selected threshold provides a practical balance between detecting high-risk cases and minimizing false positives. This selection aligns with clinical priorities, where early detection is emphasized over avoiding false positives. In a screening setting, it is generally preferable to flag more at-risk individuals and conduct further testing rather than miss potential CRC cases. Supporting this approach, Osborne et al. found that both patients and healthcare professionals consider gains in true-positive diagnoses for CRC worth the trade-off of increased false positives, with participants willing to accept up to a 45% decrease in specificity to achieve a 10% gain in sensitivity [
22].
While 0.0082 is an optimal general-use threshold, it can be adjusted based on clinical priorities. In high-risk populations (e.g., individuals with strong family history, chronic inflammation, or multiple risk factors), a lower threshold (e.g., 0.0078) could be used to increase sensitivity and identify more patients needing earlier intervention. In settings where resources are limited, a slightly higher threshold could be applied to reduce unnecessary follow-ups, ensuring that only the highest-risk individuals are referred for further testing.
4.4. Interpretability and Feature Importance
To interpret the contributions of individual risk factors, we employed SHAP analysis. This method allowed us to understand how each factor influences CRC risk on a per-patient basis. Our findings indicated that age, weight, and smoking history are the most significant contributors to increased CRC risk, corroborating the existing literature that identifies these factors as important risk determinants [
9,
23]. Conversely, regular use of medications for heart conditions appeared to have a protective effect, which may be attributed to the potential anti-inflammatory properties of certain cardiovascular drugs or the associated healthier lifestyle behaviors among these patients.
However, evidence on this association remains mixed. Some studies have reported no association between CRC risk or recurrence and the use of common cardiovascular medications like statins and antihypertensives [
24,
25]. These discrepancies may be due to limitations such as small sample sizes, inadequate power to detect small to moderate associations, and the potential misclassification of medication adherence. Given these conflicting findings, further research with larger cohorts and careful control of confounding factors is warranted to clarify the potential protective effects of heart medications on CRC risk.
Comparing our model to existing predictive tools for CRC risk, we note that many require extensive clinical data, invasive procedures, or specialized laboratory tests, limiting their practicality for widespread use [
9,
26,
27,
28,
29,
30]. For instance, some models incorporate genetic markers or detailed biochemical profiles that are not routinely available in primary care settings [
30,
31]. In contrast, our model relies on information typically collected during standard healthcare visits, enhancing its feasibility for integration into everyday clinical practice without imposing additional burdens on patients or clinicians.
4.5. How Primary Care Physicians Can Use the Model
To make our CRC risk prediction model practical for routine clinical use, we have integrated it into an interactive risk estimator tool that primary care physicians can use during patient consultations. This tool adapts in real time based on patient responses and provides personalized screening recommendations, making it easier to discuss risk and prevention with patients.
4.5.1. Immediate Referral for High-Risk Patients
If a patient reports a family history of CRC, the tool automatically recommends a colonoscopy, following the established screening guidelines. This ensures that those at the highest genetic risk are fast-tracked for further evaluation.
4.5.2. Assessing Lifestyle Risk Factors
For patients without a family history, the tool continues by evaluating modifiable risk factors, things they can control to lower their CRC risk. These include diet, smoking, alcohol consumption, BMI, and existing conditions like hypertension and diabetes.
4.5.3. Personalized Risk Score and Easy-to-Understand Results
After gathering patient data, the model calculates a personalized risk score and classifies individuals as average, increased, or high risk. To make results easier to understand, the risk level is visualized using a color-coded gauge, helping both clinicians and patients quickly grasp what the score means.
4.5.4. Providing Practical Steps for Prevention
The model automatically calculates a personalized CRC risk score, with certain factors weighing more heavily than others. For instance, age is a dominant factor in CRC risk assessment, which means that even if a patient engages in unhealthy lifestyle habits, their overall risk score might still appear moderate due to their age-related risk. However, not all risk factors, such as smoking or alcohol consumption, are always reflected directly in the risk gauge. Instead, these behaviors are visually flagged as potential risks, allowing clinicians to assess their significance in a broader clinical context.
4.6. Temporal Limitations
A key limitation to our study is the reliance on an older dataset, the Prostate, Lung, Colorectal, and Ovarian (PLCO) Cancer Screening Trial (1993–2001), which may not fully capture the evolving risk factors and epidemiological patterns of CRC in contemporary populations. Over the past two decades, CRC incidence has shifted, with an increasing prevalence of early-onset CRC (E-O CRC) in individuals under 50 years old, in particular [
32].
Lifestyle changes, including rising obesity rates, altered dietary patterns, increased consumption of ultra-processed foods, sedentary behavior, and changes in gut microbiome composition, have significantly contributed to the growing burden of CRC in younger populations [
33,
34]. These newer risk factors may not be adequately reflected in older datasets, limiting the generalizability of models trained on historical cohorts.
4.6.1. Changes in Risk Factor Profiles over Time
Several studies have documented changes in modifiable CRC risk factors over time, leading to evolving risk profiles compared to those observed in earlier cohorts. Dietary patterns, obesity rates, and sedentary behavior have increased significantly in recent decades, altering exposure to key lifestyle-based risk factors.
For example, Deng et al. (2023) emphasized the growing role of ultra-processed food consumption, sweetened beverages, and sedentary behavior in CRC risk among younger populations in China (2015–2021) [
35], whereas earlier models focused more on total caloric intake and general dietary habits [
36,
37]. Similarly, the rising prevalence of obesity and metabolic syndrome has introduced new risk pathways that were less prominent in older datasets [
38].
Despite these changes, traditional lifestyle factors, such as smoking, diet, and family history, remain the cornerstone of CRC risk prediction, as they are both strong predictors and actionable intervention points. While recent studies have explored polygenic risk scores (PRS) for CRC stratification [
7], PRS remains impractical for routine clinical use due to cost, accessibility, and the complexity of genetic counseling [
8].
Furthermore, individuals with a strong family history of CRC are already referred for colonoscopy [
39,
40], making additional genetic risk models redundant in many cases. Thus, while modifiable risk factors have evolved, shifting toward concerns about obesity, processed food consumption, and metabolic changes, CRC prediction models must continue prioritizing clinically accessible lifestyle factors to ensure widespread clinical applicability, facilitate real-time risk assessment during consultations, and provide actionable guidance for preventive interventions.
4.6.2. Evolving Screening Practices and Their Impact on Risk Prediction
The screening landscape has also changed significantly since the PLCO trial, affecting how risk models should be calibrated. When the PLCO trial was conducted, flexible sigmoidoscopy (FSG) was a commonly used screening tool, whereas modern screening practices now emphasize non-invasive tests like FIT and FIT-DNA, along with risk-adapted strategies [
41,
42]. Models trained on PLCO data may not account for changes in CRC detection rates due to improved screening uptake and more sensitive diagnostic tools.
New guidelines recommend CRC screening initiation at age 45 instead of 50, a crucial adjustment that is not reflected in older datasets [
40]. Risk prediction models must be re-calibrated to account for this shift, as applying older risk thresholds could misclassify younger high-risk individuals who would benefit from earlier screening interventions. Given these concerns, external validation using more recent population-based datasets is necessary to confirm the applicability of our model to contemporary clinical settings.
4.7. Strengths and Practical Implications
Our study offers several key strengths that enhance its clinical applicability, interpretability, and usability in real-world settings. First, we employed a rigorous, evidence-based approach to feature selection, using a systematic review to identify clinically relevant CRC risk factors. Unlike models that rely on hard-to-obtain data such as polygenic risk scores or precise dietary intake, our model prioritizes routinely collected variables, improving feasibility for standard consultations. Second, our model is trained on a large, prospectively collected dataset (PLCO Cancer Screening Trial), ensuring longitudinal follow-up and reducing recall bias. The dataset’s demographic diversity also enhances generalizability across populations.
Furthermore, a major advantage of our study is the development of a user-friendly risk estimator that can be used by clinicians during consultations. This estimator automatically interprets the model’s probabilistic output and categorizes individuals into average-, increased-, or high-risk groups. Unlike conventional risk models that only provide a risk score, our tool generates personalized recommendations based on the patient’s specific risk profile. These recommendations include lifestyle modifications, preventive measures, and guidance on future screening strategies, enabling clinicians to offer tailored advice in real time. This functionality supports shared decision making by simplifying complex risk predictions into actionable insights for both clinicians and patients.
5. Conclusions
Our findings show that age, weight, and smoking history are the strongest predictors of colorectal cancer (CRC) risk, while heart medication use appeared to have a potentially protective effect. The model correctly identified high- and average-risk individuals in 73 out of 100 cases, demonstrating its potential to complement existing screening tools like FIT by providing personalized risk assessments and additional insights for CRC prevention. Additionally, we provided multiple threshold options to balance sensitivity and specificity, allowing physicians to adjust the threshold based on clinical priorities. This flexibility helps to detect more high-risk individuals while minimizing unnecessary follow-ups, making the model adaptable to different healthcare settings.
To translate these findings into clinical practice, we developed and internally validated a CRC risk prediction model based on health and lifestyle factors, which has been integrated into an interactive risk estimator for clinical use. This tool categorizes individuals as average, increased, or high risk while also identifying modifiable risk factors to support informed decision making and personalized lifestyle modifications. After clinicians input patient responses, the tool provides risk stratification and relevant health insights, helping guide prevention strategies. However, before clinical implementation, external validation is necessary to confirm the model’s reliability across diverse populations and assess its effectiveness in real-world healthcare settings. Additionally, usability testing in clinical practice is needed to evaluate whether the risk estimator enhances clinician-patient discussions and facilitates shared decision making for CRC prevention.


 ,
, 
