Article

Corrosion–Cavitation Behaviour of the Extra-Low-Lead Brass CB773S in Marine Environments

by
Lourdes Merino-Galván
and
María V. Biezma-Moraleda
*
Department of Science and Engineering of Earth and Materials, Universidad de Cantabria, 39004 Santander, Spain
*
Author to whom correspondence should be addressed.
Corros. Mater. Degrad. 2026, 7(2), 25; https://doi.org/10.3390/cmd7020025
Submission received: 25 February 2026 / Revised: 28 March 2026 / Accepted: 1 April 2026 / Published: 13 April 2026

Abstract

This study analyses the behaviour of brass CB773S with extra-low-lead content in relation to corrosion and the corrosion–cavitation phenomenon. Electrochemical corrosion tests, both potentiodynamic and potentiostatic, as well as corrosion–cavitation tests, were conducted. Various potentials were applied to brass, alongside cavitation generated by an ultrasonic bath. Artificial seawater and artificial brackish water were used as electrolytes. Surface damage was evaluated using a stereo microscope and scanning electron microscopy. The results indicate that the interfaces between alpha and beta phases of brass serve as preferential sites for the nucleation and collapse of vapour bubbles under cavitation conditions, leading to a deep pitting, especially in artificial brackish water under this synergy. Susceptibility to a selective corrosion of the Zn-rich phase was observed, highly dependent on the test solution, as well as on the applied potential during the tests. The corrosion–cavitation synergistic damage was strongly dependent on the electrochemical parameters, particularly the applied potential, which plays a key role under cathodic protection conditions. In general, it can be concluded that low-lead brass behaviour is governed by a complex interaction between applied potential, electrolyte chemistry, microstructure, and mechanical effect. These findings provide valuable insights into brass’s performance under service conditions where corrosion and cavitation may appear simultaneously in marine environments.

1. Introduction

Brass alloys have significant industrial applications in the naval sector, and they are used for critical components such as valves, shut-off valves, and even economic low-power propellers [1,2]. Among the numerous brass alloys listed in the standard EN 1982:2017 [3], CB773S is characterized by an extra-low-lead content (max. 0.1 wt.-%) compared to the other brass alloys (ca. 1 up to 3.5 wt.-%), making it a more environmentally friendly alternative material for marine applications. Recent studies have suggested that lead-free brass alloys are promising candidates for the replacement of commonly used leaded brass alloys, such as CW614N, at least as far as the mechanical properties are concerned [4]. This, however, raises questions about its performance under corrosion and cavitation conditions since it has been reported that a lead content of 1 to 3.4% wt enhances the corrosion resistance in chloride and sulphate environments [5]. On the other hand, lead precipitates were identified as the preferred sites for bubble implosion under cavitation, inducing mechanical damage to the surface [6]. Moreover, a clear influence of the test solution on both corrosion and cavitation behaviour of brass has been reported, where seawater promotes the formation of a Cu2O-rich corrosion product layer that can partially mitigate cavitation-induced mechanical damage [7]. In contrast, in deionized water, where electrochemical effects are negligible, the damage is governed predominantly by the mechanical action of cavitation bubble collapse [8].
Biphasic, or so-called duplex brass, with an alpha–beta phase microstructure, is susceptible to selective corrosion of the β phase rich in zinc. It is characterized by the dezincification phenomenon, leaving porous and brittle copper zones, which significantly impair the mechanical properties of the material [9]. Dezincification of the β phase is significantly dependent of pH, being less relevant in alkaline conditions; moreover, the highest applied potential aggravated the phenomenon [10,11]. Selective β-phase corrosion (rich Zn phase) is conditioned by the size, shape, and distribution of both phases present in the microstructure, as well as by their relative area relations [12]. It has been reported that the presence of sulphides in sea water has a negative effect on the dezincification of brass, since it leads to a porous and uncompact protective layer [13,14]. The performance of extra-low-lead brass alloys in brackish water, with a relevant role of some sulphur species, has not yet been studied extensively [15,16].
Cavitation is a phenomenon that originates from the formation and implosion of vapour bubbles in a fluid due to local pressure variations, mostly occurring near a surface. Shock wave impacts can cause locally a significant erosive damage; typically, components such as propellers, valves, pipes, and impellers whose damage level depends mainly on hardness, surface finish, microstructure, and the physicochemical properties of the fluid [17,18]. Generally, harder materials tend to resist the mechanical damage better. It has been observed that laser surface alloying with Ni–Cr–Si–B produces a hard coating on brass, increasing the resistance to cavitation, as well as corrosion [19]. Nevertheless, when excessive hardness is combined with limited ductility, the material may become more susceptible to crack initiation and propagation. Uniform surface finish minimizes the nucleation sites of bubbles and, similarly, a more homogeneous microstructure enhances resistance to cavitation, while discontinuities such as phase boundaries are sites prone to bubble nucleation [20].
Moreover, microcracks serve as bubble nucleation catalyzers, penalizing the mechanical properties of metallic systems [21]. It has been reported that α phase undergoes plastic deformation, and damage occurs typically at the α/β phase boundaries in duplex brass after cavitation tests, accelerating the material detachment from the α phase; meanwhile β phase seems to better withstand the mechanical damage from cavitation [22]. However, other studies suggest that cavitation, along with the effect of selective corrosion, contributes to a greater degradation and erosion of the β phase [23]. This indicates a kind of synergy where both the mechanical effect of cavitation and the chemical effect of corrosion participate [24,25]. Some authors conclude that cavitation–erosion resistance, as well corrosion resistance, cannot be assessed simultaneously in the same specimen due to the nature of both [26].
In general, cavitation can accelerate corrosion by breaking the surface, removing protective layers, and exposing blank metal prone to reacting anodically. Such localized corrosion causes the accumulation of corrosion products at the surface, which, in turn, may act as nucleation sites for bubble formation, thus enhancing the effects of cavitation [27]. For conventional biphasic brass in neutral or alkaline solutions, it has been assessed that mechanical attack dominates the cavitation–erosion process, while corrosion is dominant in acidic media in duplex brass [28,29]. Consequently, the influence of cavitation under negligible corrosion conditions, e.g., established by cathodic protection, is expected to be much lower compared to the conditions of intense corrosion [30,31].
There are numerous studies on corrosion–cavitation of copper-based alloys, but only few are related to low-lead content brass alloys [32]. In the present study, the corrosion behaviour and the synergy between corrosion and cavitation is investigated with the aim of better understanding of an extra-low-lead brass, so-called ecobrass, for industrial applications, in particular in marine environments.

2. Materials and Methods

2.1. Material and Sample Preparation

Low-lead brass corresponds to the alloy CB773S, according to the standard EN 1982:2017 [3]; the chemical composition of the material is shown in Table 1. A hardness of 158 HV 0.5 was determined using a Vickers hardness tester.
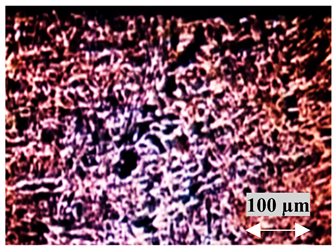
For potentiodynamic and potentiostatic corrosion tests, specimens of ca. 10 × 15 × 3 mm 3 were prepared, and the surface finish was established through wet polishing with 120, 320, 500, and 800 silicon carbide (SiC) abrasive papers. For corrosion–cavitation tests, an arrangement of three contacted and resin-embedded specimens was used: specimens of dimensions of 5 × 10 × 4 mm3 were soldered with an insulated copper, as shown in Figure 1a. The side with metal faces was wet polished with 120, 320, 500, 800, 1000, 1200 silicon carbide (SiC) abrasive papers and polished with 0.25 μm diamond paste solution. Polish surface finish was found useful to appreciate the cavitation effect on the specimen surface after each test. Figure 1b shows the microstructure of brass after polishing [33]. It consists of a copper-rich α phase (light) and a zinc-rich β phase (dark).

2.2. Test Media

For the corrosion and corrosion–cavitation tests, artificial seawater (ASW) (pH = 7.1) and artificial brackish water (ABW) (pH = 7.7) were used, as specified in Sections 4.1 and 4.2 of DIN 50905-4 [34], respectively. Table 2 shows the chemical composition of both electrolytes. All chemicals were of analytical grade and used as received without further purification. The major difference between ASW and ABW lies in the content of organic sulphur compound, thioacetamide, mimicking the presence of such substances in brackish water from microbial activity, as well the presence of tri-sodiumcitrate in ABW. It is well-known that the most relevant anions (chloride, sulphate, nitrate, and bicarbonate) may be absent, individually dominating, or form complex mixtures in combination with the typically abundant cations calcium, magnesium and sodium, resulting in a particular corrosivity.

2.3. Electrochemical Corrosion Tests

Potentiodynamic (PD) and potentiostatic (PS) polarization tests are used in a complementary manner to evaluate both the initial electrochemical activation and the evolution of the corrosion response of the material. While PD tests allow the identification of critical potentials, corresponding to current densities of approximately 100 µA/cm2, above which the corrosion rate is considered to be significant, and the relative susceptibility under transient conditions, whereas PS tests conducted at constant potential over extended periods are particularly suitable for analyzing the formation, stability, and potential protective character of corrosion product layers, a key aspect of the corrosion behaviour of copper-based alloys.

2.3.1. Potentiodynamic Corrosion Test

The potentiodynamic (PD) corrosion tests were carried out with a BANK Wenking POS 2 potentiostat (Bank Elektronik, Göttingen, Germany), connected to a computer for control and data acquisition using a conventional three-electrode configuration. The reference electrode (RE) was a silver/silver chloride electrode with saturated potassium chloride electrolyte, Ag/AgCl (saturated KCl). The counter electrode (CE) was a coiled stainless steel 316 wire (0.3 mm diameter, 150 mm length). The specimen was connected as a working electrode (WE) by clamping it to a suitably bent stainless steel wire, which remained passive during the experiments.
After immersion and an equilibration time of 20 min, potentiodynamic scans were run from the open circuit potential (OCP) in anodic direction up to +150 mVAg/AgCl in ASW and +400 mVAg/AgCl in ABW, respectively, at a scan rate of 0.02 mV/s. Then, the scan direction was reversed, and the scanning was continued until the current changed to negative/cathodic. The upper potential limits of the scans are selected based on the high current levels observed upon repeating the potentiodynamic electrochemical test. The low scan rate facilitates the formation of a protective layer.

2.3.2. Potentiostatic Corrosion Test

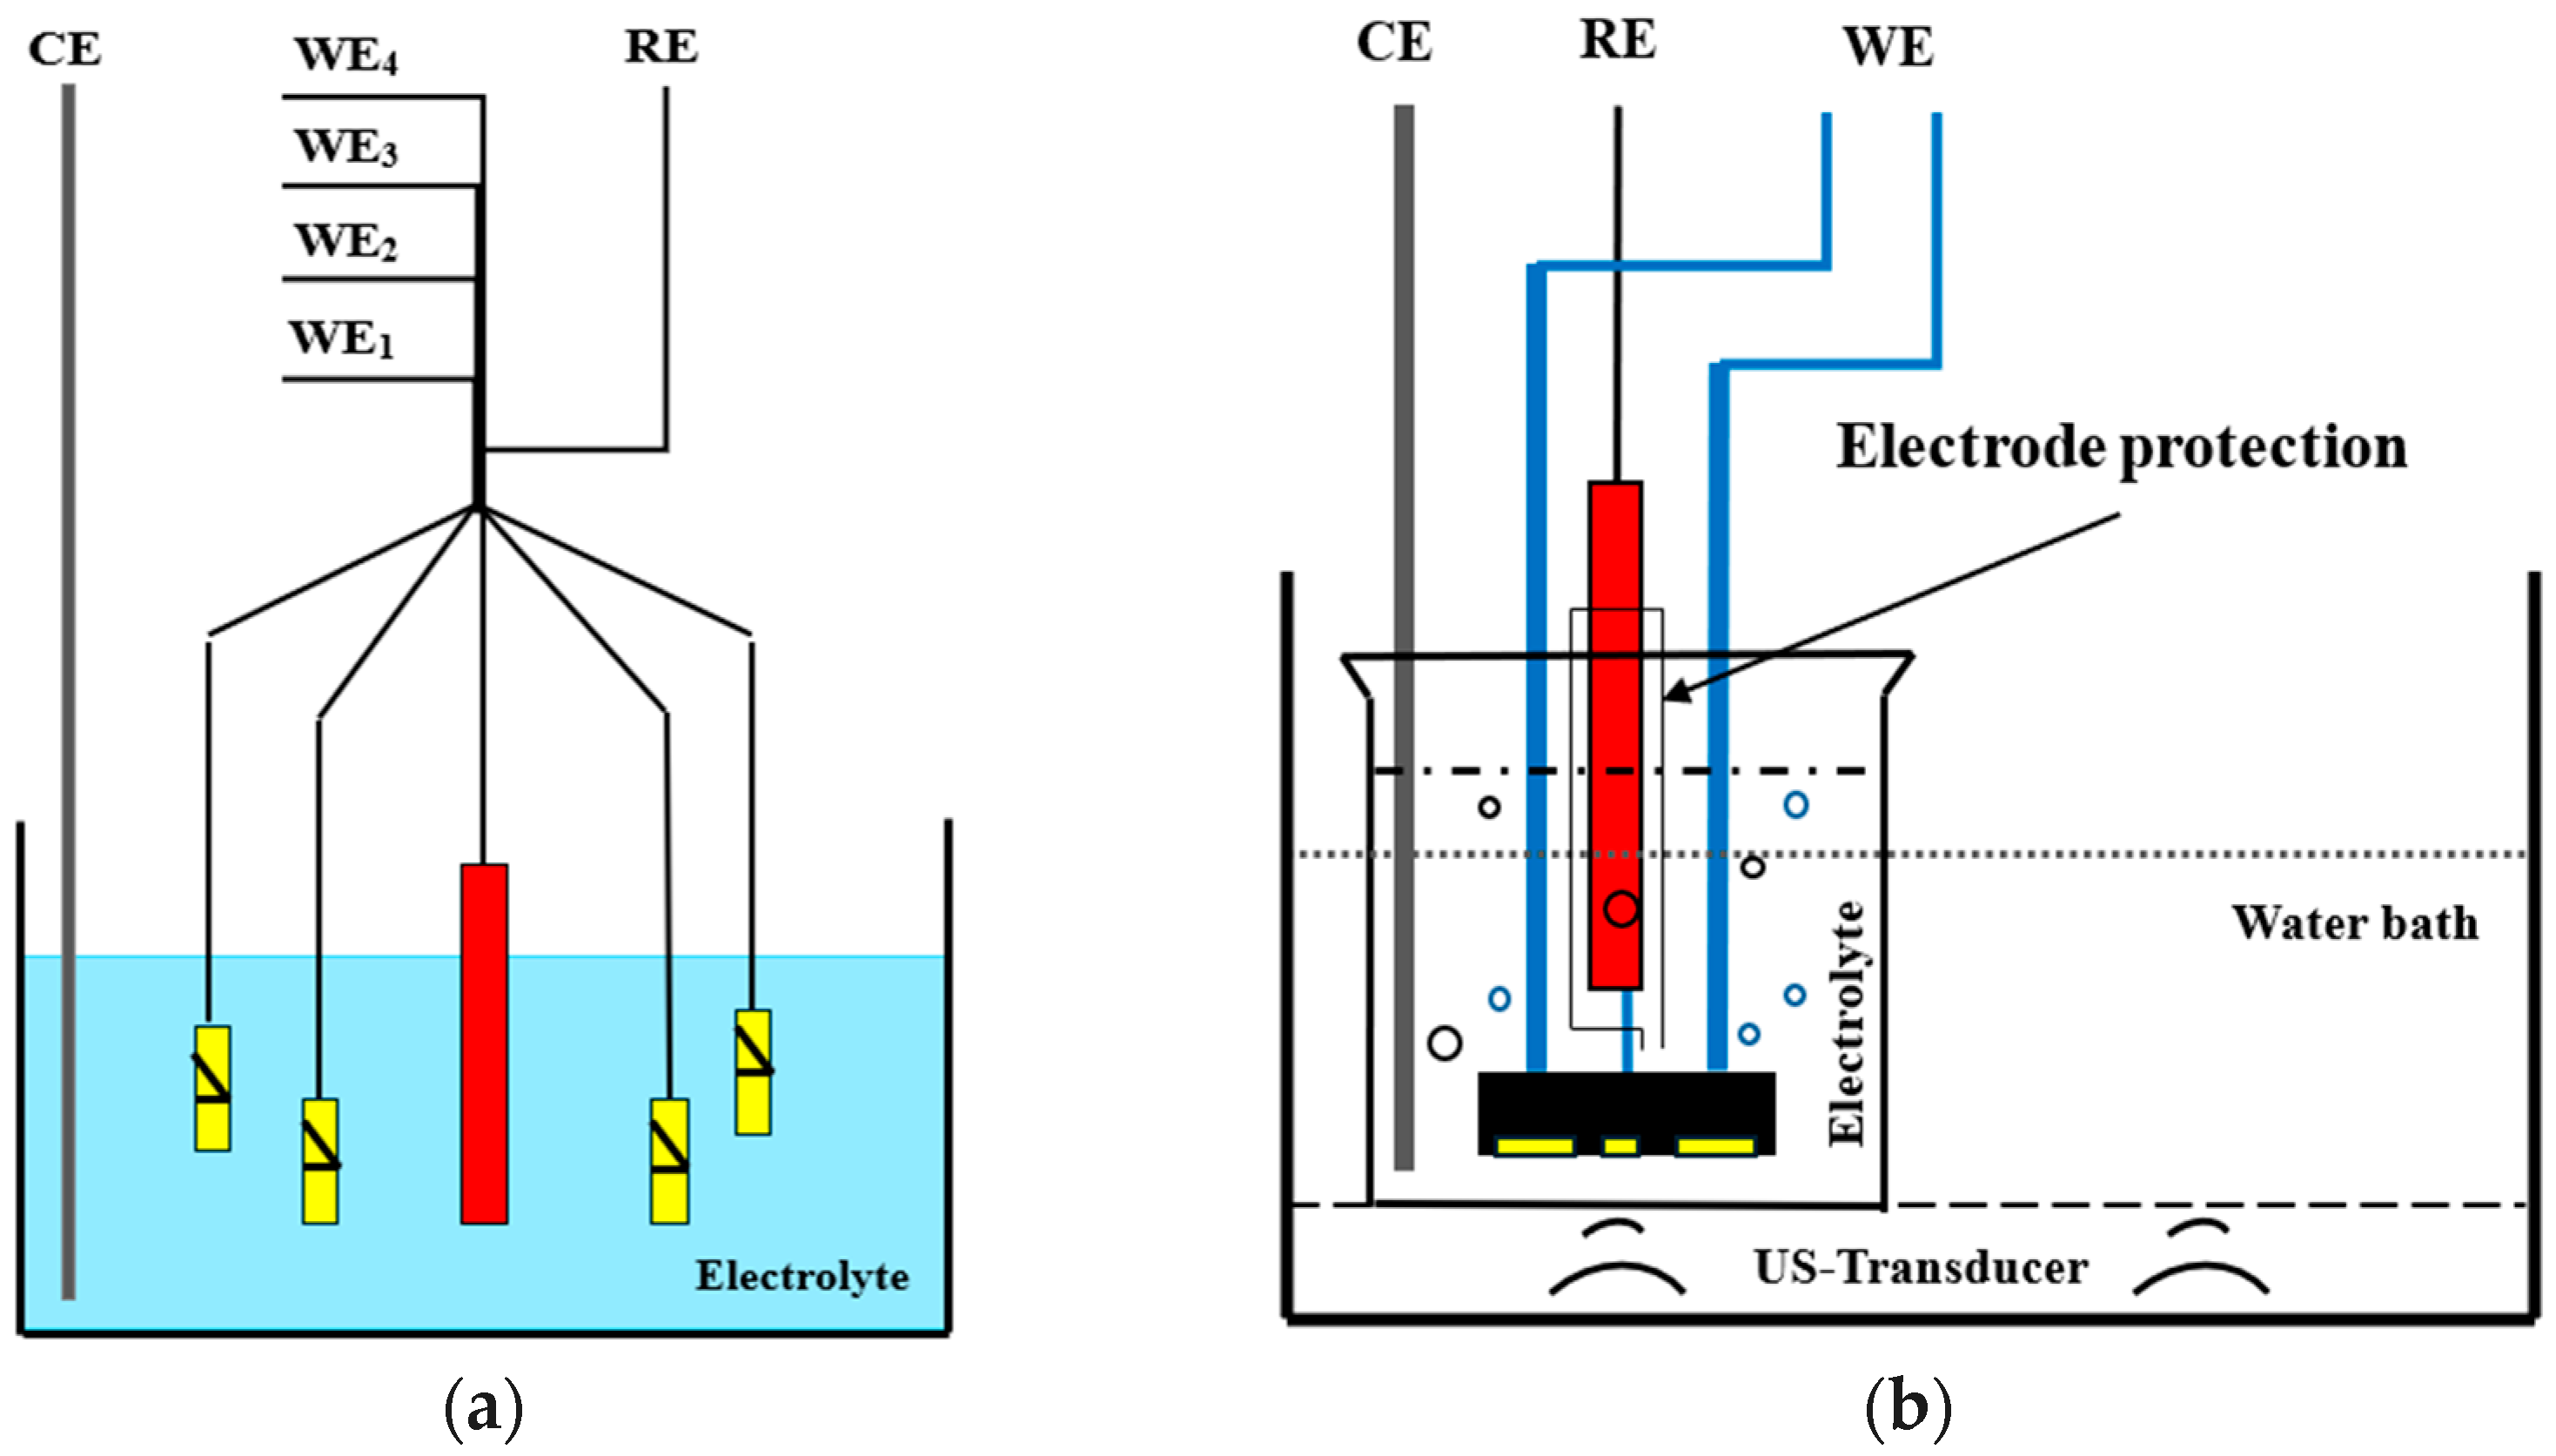
A custom-built multichannel potentiostat developed at the University of Vienna (Vienna, Austria) [35] was used for simultaneous testing of four specimens at different potentials during potentiostatic tests (PS). They were conducted in a cylindrical container filled with 2.5 L of electrolyte, and a stainless steel 316 mesh along the inner container wall served as the CE. The RE (Ag/AgCl) was inserted from the top into the centre of the container. The four brass samples, acting as WEs, were connected by clamping to stainless steel wires and were placed equidistantly around the RE in the electrolyte. Figure 2a provides the test cell setup.
Different potentials for the electrolytes were selected in the following way: the samples were polarized to −250, −200, −150, and −100 mVAg/AgCl for ASW tests and to −200, −150, −100, and −50 mVAg/AgCl for ABW tests. The lowest values were estimated to be close to or just slightly above the open circuit potential (OCP) for each electrolyte, while the ones with the highest potential were estimated from the potentiodynamic test results. The test duration was 68 h, and the individual currents were logged every 10 min. In ABW, after 48 h of testing, the samples were manually cleaned very gently with a smooth cloth to ensure that hydrophobic corrosion products adhering to the specimen did not interfere with the equipment connection.

2.4. Corrosion–Cavitation Tests

The Octopoti device [35] was used, since the tests were under potentiostatic control (Figure 2a). As a test cell, a beaker was filled with 350 mL of electrolytes, and the three specimen arrangements were inserted with the blank metal facing down and serving as a WE. A stainless steel 316 wire, 500 mm long and 0.6 mm in diameter, served as CE, and the RE was an Ag/AgCl (saturated KCl), which was protected from cavitation impact by a closed-end plastic tube with a based small hole to provide electrolytic contact. The polished specimens, WEs, were immersed in a horizontal position, at a distance of approximately 1 mm from the bottom, in an Emerson Branson 2800 ultrasonic bath, US, operating at 40 kHz with a power of 100 W (Emerson, Brookfield, CT, USA). The bath is equipped with a heater and 40 kHz transducers, offering a sweep frequency that eliminates stationary waves and creates an uniform cavitation pattern while immersed in the selected electrolytes. The temperature during the test did not exceed 30 °C. Figure 2b provides a schematic of the corrosion–cavitation test setup.
Test potentials of −300, −250, and −200 mVAg/AgCl were selected for ASW, while those of −300, −200, −150 mVAg/AgCl were chosen for ABW, based on the combined results of the previous PD and PS tests, in the following way: the lowest potential is well within the cathodic region relative to the open circuit potential (OCP), the highest potential corresponds to the range of high anodic current density, and the intermediate potential lies within the transition region between these regimes. Test duration was 300 min in total, combining corrosion/corrosion–cavitation cycles, following this pattern: 30 min of corrosion tests, four cycles of 30 min of corrosion/corrosion–cavitation tests, and one cycle of corrosion/corrosion–cavitation test for 10 min. The individual currents were logged every 3.5 min.

2.5. Damage Characterization

The samples were manually cleaned by soft brushing in order to remove the weakly adhering corrosion products. The visual inspection offers the first valuable information on surface damage; moreover, cross-sections of the tested specimens were observed using a Leica EZ4 HD stereo microscope (Leica Microsystems, Wetzlar, Germany), a Leica DM 4000-U optical microscope (Leica Microsystems, Wetzlar, Germany), and a JEOL JSM-6460LV scanning electron microscope equipped with energy-dispersive spectroscopy (EDS) (JEOL Ltd., Tokyo, Japan), in order to highlight the microstructural changes due to chemical, as well as mechanical, effects.

3. Results and Discussion

3.1. Electrochemical Corrosion Tests: PD and PS

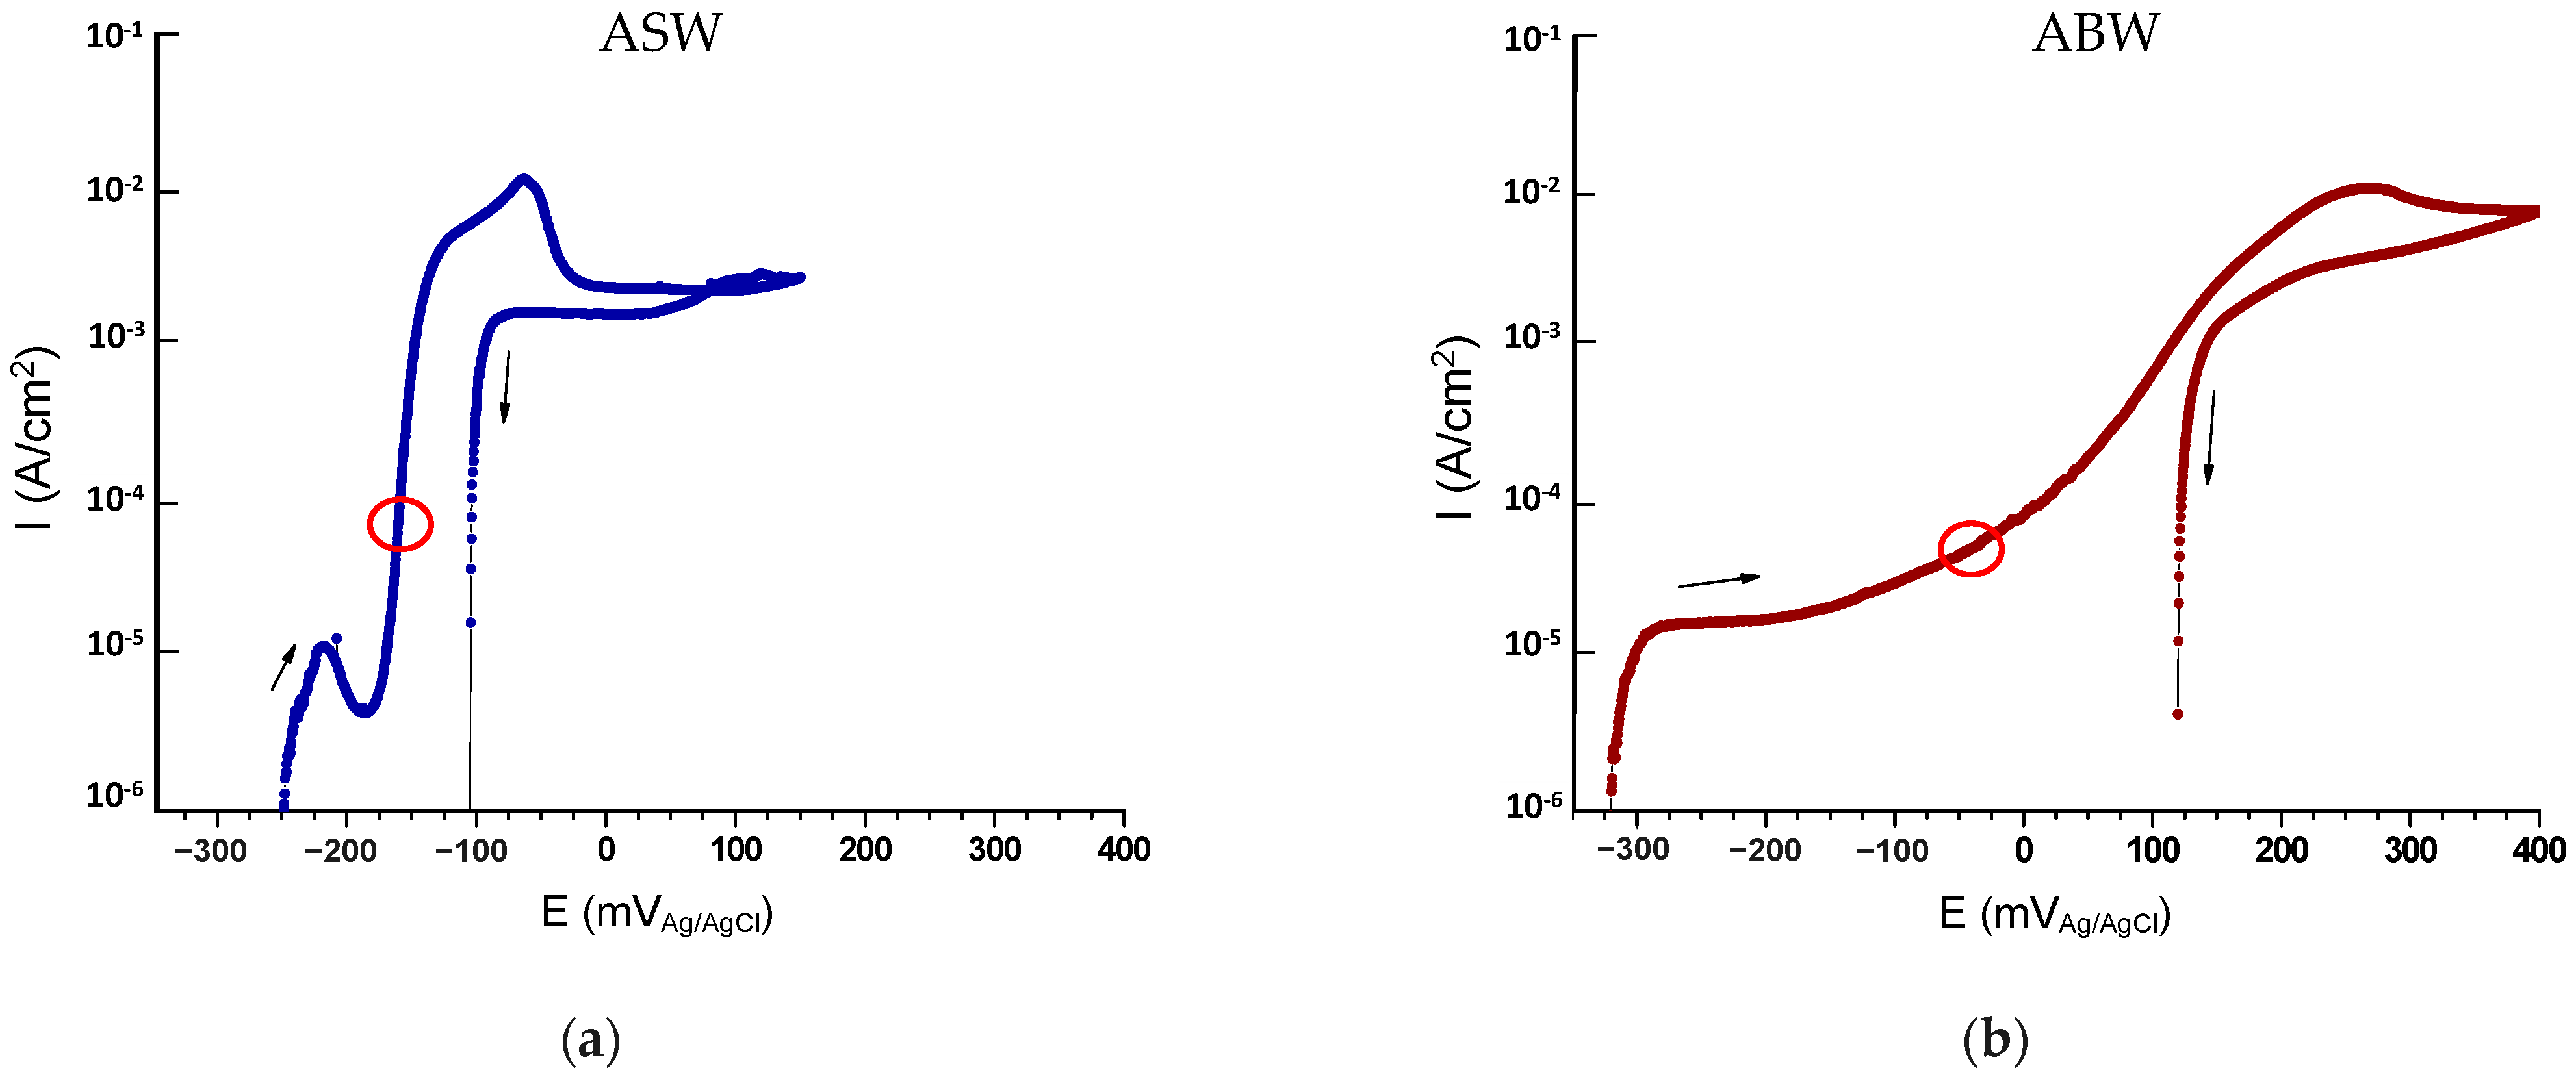
Figure 3 presents the results of the potentiodynamic (PD) polarization tests in both electrolytes: ASW (Figure 3a) and ABW (Figure 3b). The potential sweeps are in the ranges from −260 mVAg/AgCl (open-circuit start) to 150 mVAg/AgCl for the ASW tests, and from −350 mVAg/AgCl (open-circuit start) to the maximum limit of 400 mVAg/AgCl for the ABW tests. The anodic direction (upward) and the cathodic direction (downward) are indicated in the graph.
In ASW, the critical potential defined in Section 2.3 starts from approximately −170 mVAg/AgCl (red circle on Figure 3a). Beyond this potential, the anodic branch shows a rapid increase in current density, indicating an early activation of anodic dissolution and a high susceptibility of the alloy to corrosion. No stable passive region is observed within the investigated potential range.
In contrast, in ABW, the critical potential is shifted to more positive values, occurring at approximately −50 mVAg/AgCl (red circle on Figure 3b). The anodic branch in ABW is more continuous and exhibits a significantly lower slope than in ASW, reflecting slower corrosion kinetics and a more stable surface response under anodic polarization. The increase in current density occurs progressively and at higher potentials compared to ASW.
Overall, the comparison of the PD curves demonstrates that ABW provides a less aggressive electrochemical environment than ASW, as evidenced by the positive shift in the critical potential and the reduced anodic current densities over the checked potential range.
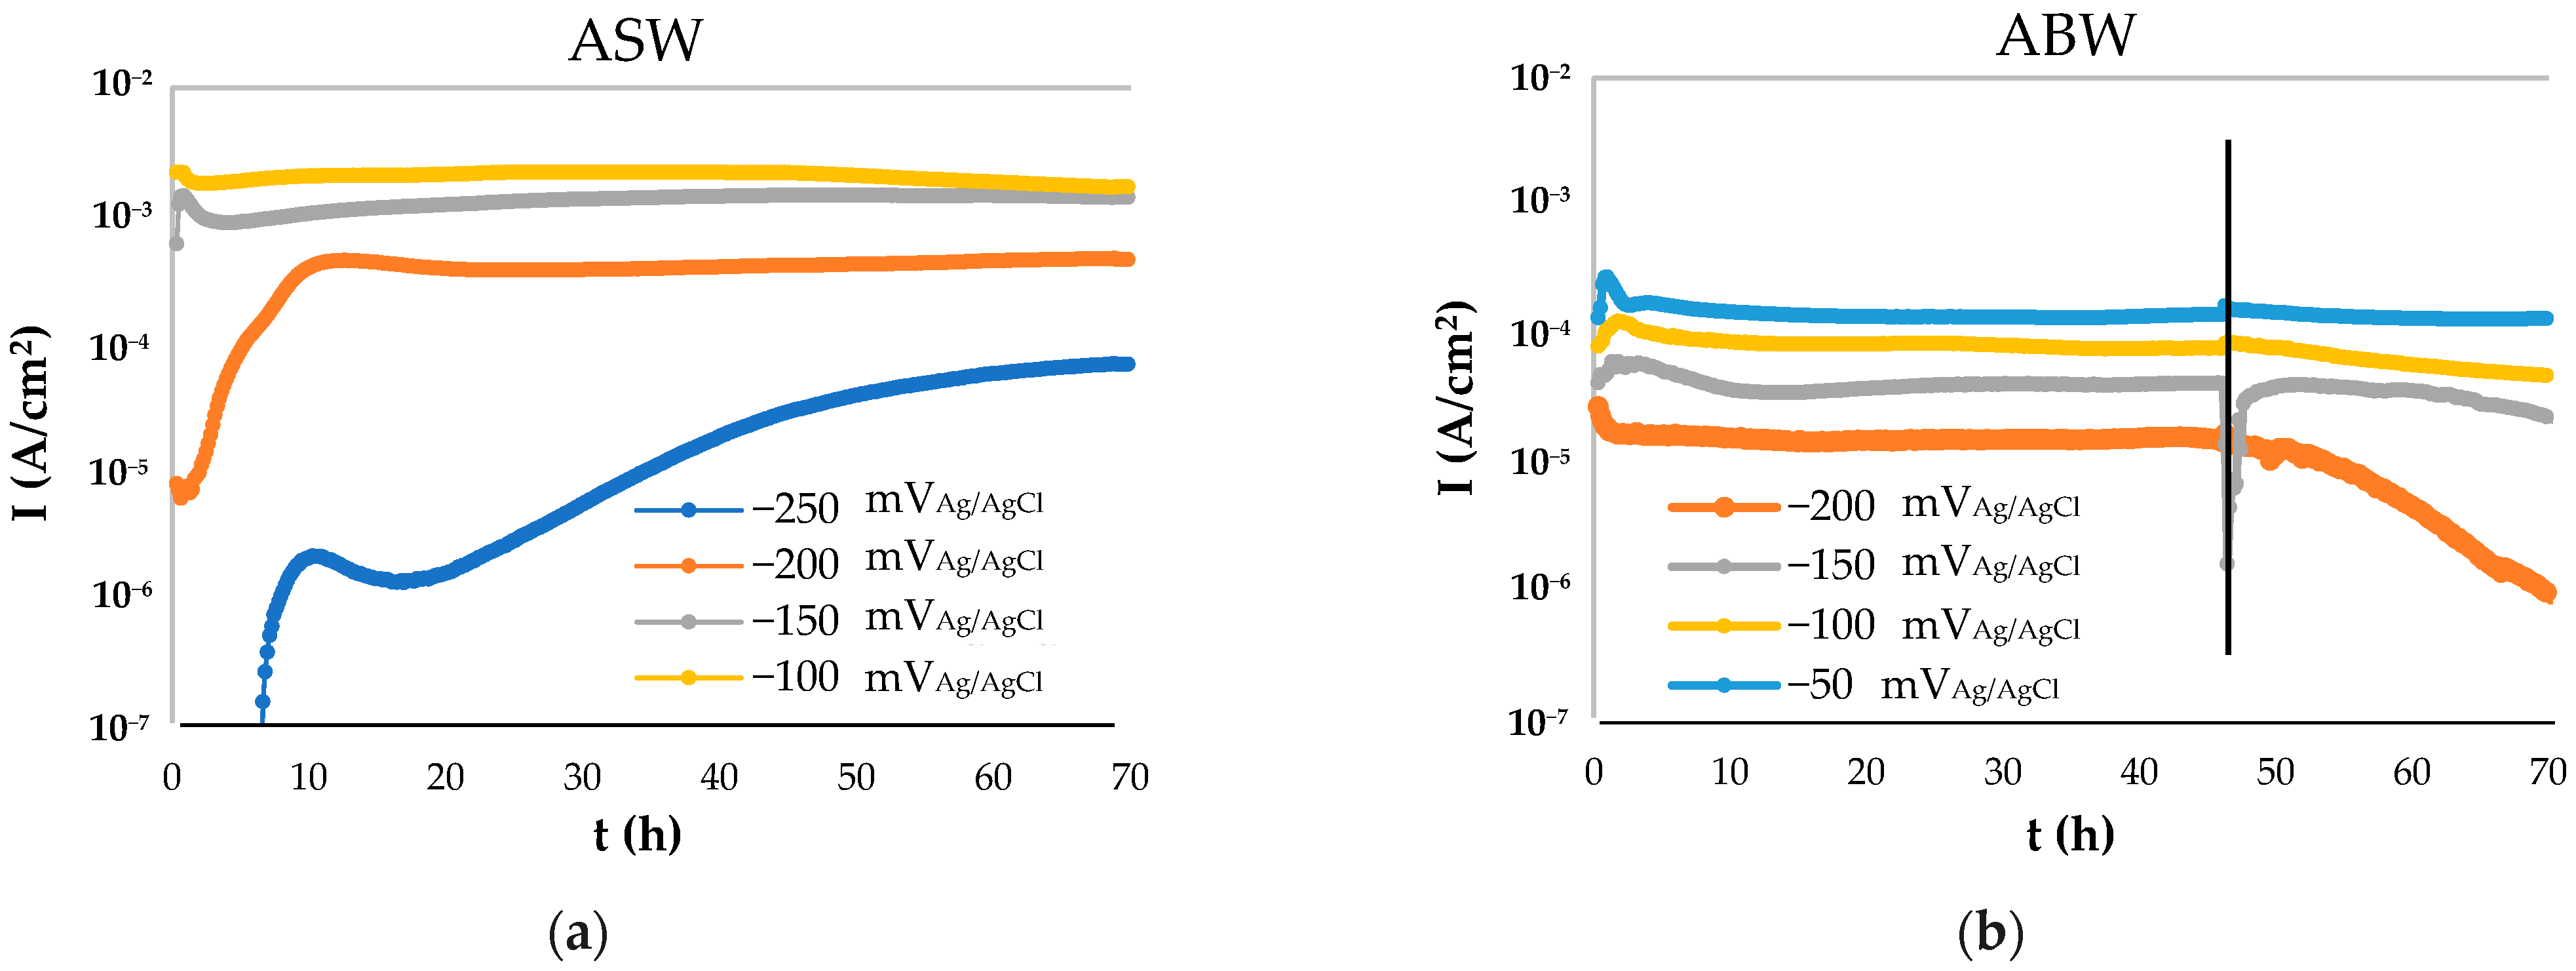
The results obtained from the PD tests were used to define the application potentials for the potentiostatic (PS) polarization test; the results are shown in Figure 4. A passive/active transition is observed in the potential range from −250 to −200 mVAg/AgCl, in the case of ASW tests (Figure 4a). Meanwhile, no critical passive/active transition is detected within the range of selected potentials, which go from −200 to −50 mVAg/AgCl, in ABW tests (Figure 4b). This suggests a higher brass susceptibility to corrosion in ASW compared to ABW in the selected PS test conditions.
Steady-state currents were stabilized after approximately 42 h and 8 h in ASW and ABW, respectively. In addition, it was observed that the lowest selected potential tests revealed different tendencies for both solutions: at −200 mVAg/AgCl, only cathodic currents were generated at the end of the ABW test. Meanwhile, for brass tested in ASW at the test potential of −250 mVAg/AgCl, the initial currents were cathodic. However, by the end of the test, anodic current densities were recorded to be increasing with exposure time (up to 80 µA/cm2). Moreover, in ASW, potentials from −200 to −100 mVAg/AgCl led to a noticeable increase in current density with throughout the test. This tendency was not observed in ABW, where low anodic current densities close to zero were recorded at test potentials of −150 and −100 mVAg/AgCl. Under these conditions, current density did not exhibit such an abrupt transition. At −50 mVAg/AgCl, current density reached a maximum value of 200 µA/cm2 in contrast to 1200 µA/cm2 at −100 mVAg/AgCl in ASW.
Table 3 summarizes current densities as a function of the applied potential values after PS corrosion tests. It can be observed that brass corrosion susceptibility is higher in ASW than in ABW, and there is a notorious influence of applied potential on it. At −200 mVAg/AgCl, current density is 600 µA/cm2 in ASW and 20 µA/cm2 in ABW. High corrosion current values have been observed during ASW tests in potential ranges did not have much effect on the material in ABW. In particular, under the potential of −100 mVAg/AgCl, current density was only 90 µA/cm2 in ABW compared to 1200 µA/cm2 in ASW.
The comparison between PD and PS tests indicates that the polarization mode significantly affects the material’s corrosion behaviour. In PD tests, the potential sweep restricts the formation of a stable and protective corrosion product layer, whereas PS tests facilitate its development, resulting in a shift in the critical potential and in passive-to-active transitions occurring at potentials that, according to PD measurements, would be considered less aggressive.
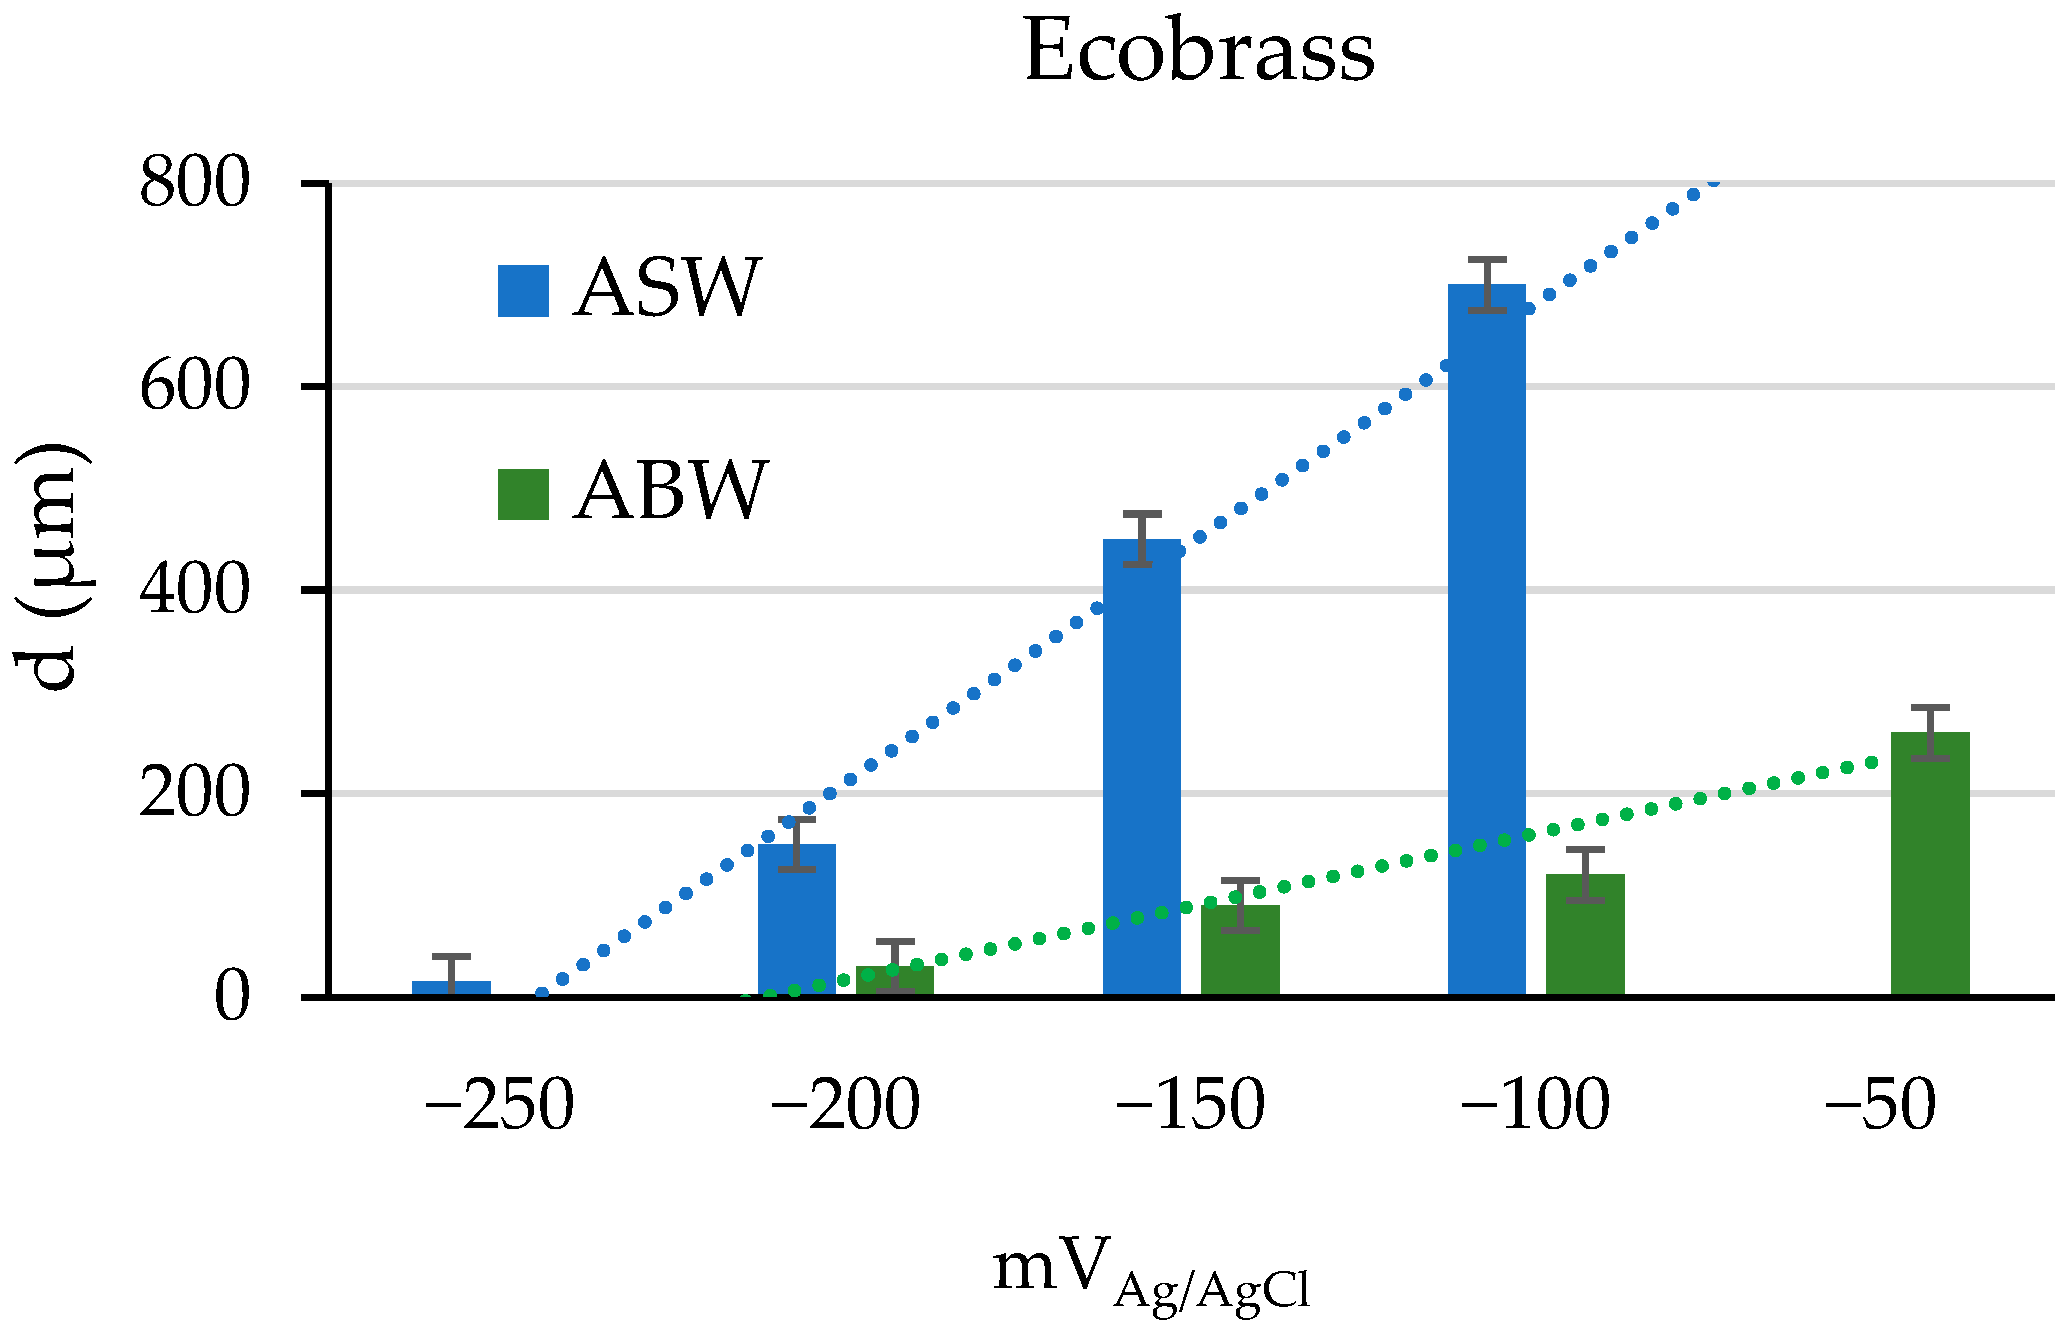
Table 4 presents the cross-section of the brass samples after the PS test, from the lowest to the highest working potential in both electrolytes (ASW and ABW). This allowed for the determination of the damage depths for each case, with an uncertainty of ±25 μm (Figure 5). An increase in damage depth was observed with anodic polarization for both test solutions; this trend is more pronounced in ASW, reaching a maximum of 700 μm at −100 mVAg/AgCl. In all cases, the damage is relatively uniform across the entire surface, indicating a predominantly uniform corrosion process.
The analysis of the cross-sections reveals a notable susceptibility of the β phase to selective corrosion, which is different in both electrolytes. The susceptibility of brass is strongly governed by the applied external potential, leading to preferential and severe damage of the β phase, which becomes almost completely dissolved. The analysis of the damage depth reveals an increase from approximately 150 µm to nearly 700 µm, as the potential shifts from −200 mVAg/AgCl to −100 mVAg/AgCl, respectively, in ASW tests. Once a critical potential range is reached, corrosion shifts to a markedly more aggressive regime, which is characterized by the rapid progression of damage into the bulk material. The extensive dissolution of the β phase increases electrolyte accessibility, promoting a deeper penetration and further accelerating damage propagation.
In contrast, specimens exposed to ABW exhibit a markedly different degradation behaviour. Although the β phase shows pronounced surface alteration, with the possible formation of copper-rich deposits, it is not completely detached from the microstructure. The electrolyte appears to exert a less aggressive corrosive influence, and the damage depth is limited to approximately 250 µm.
These results highlight the critical role of the electrolyte chemical composition in controlling both the extent and the nature of corrosion damage in duplex brasses. The combined analysis of the applied potential, damage depth, and solution chemical composition confirms that ASW is the most corrosive electrolyte, promoting uniform and extensive damage under the investigated conditions.
These considerations led to the development of a correlation between the electrochemical results and the microstructural observations. In particular, the nature of the electrolyte not only modulates the corrosion kinetics but also governs the composition, structure and potential protective character of the corrosion products. In ABW, the low current densities and reduced damage depth indicate the formation of a more stable and partially protective corrosion product layer, which limits electrolyte access to the underlying substrate and effectively restricts selective β phase dissolution. In addition, although trisodium citrate has been reported as a potential inhibitor in copper alloys [15] and steel [36], previous results for a multiphase copper-based alloy under slow potentiodynamic conditions (20 µV/s) showed a slightly detrimental effect with earlier activation, higher corrosion current densities at low potentials, and no hysteresis loop [37].

Discussion on Corrosion Mechanisms

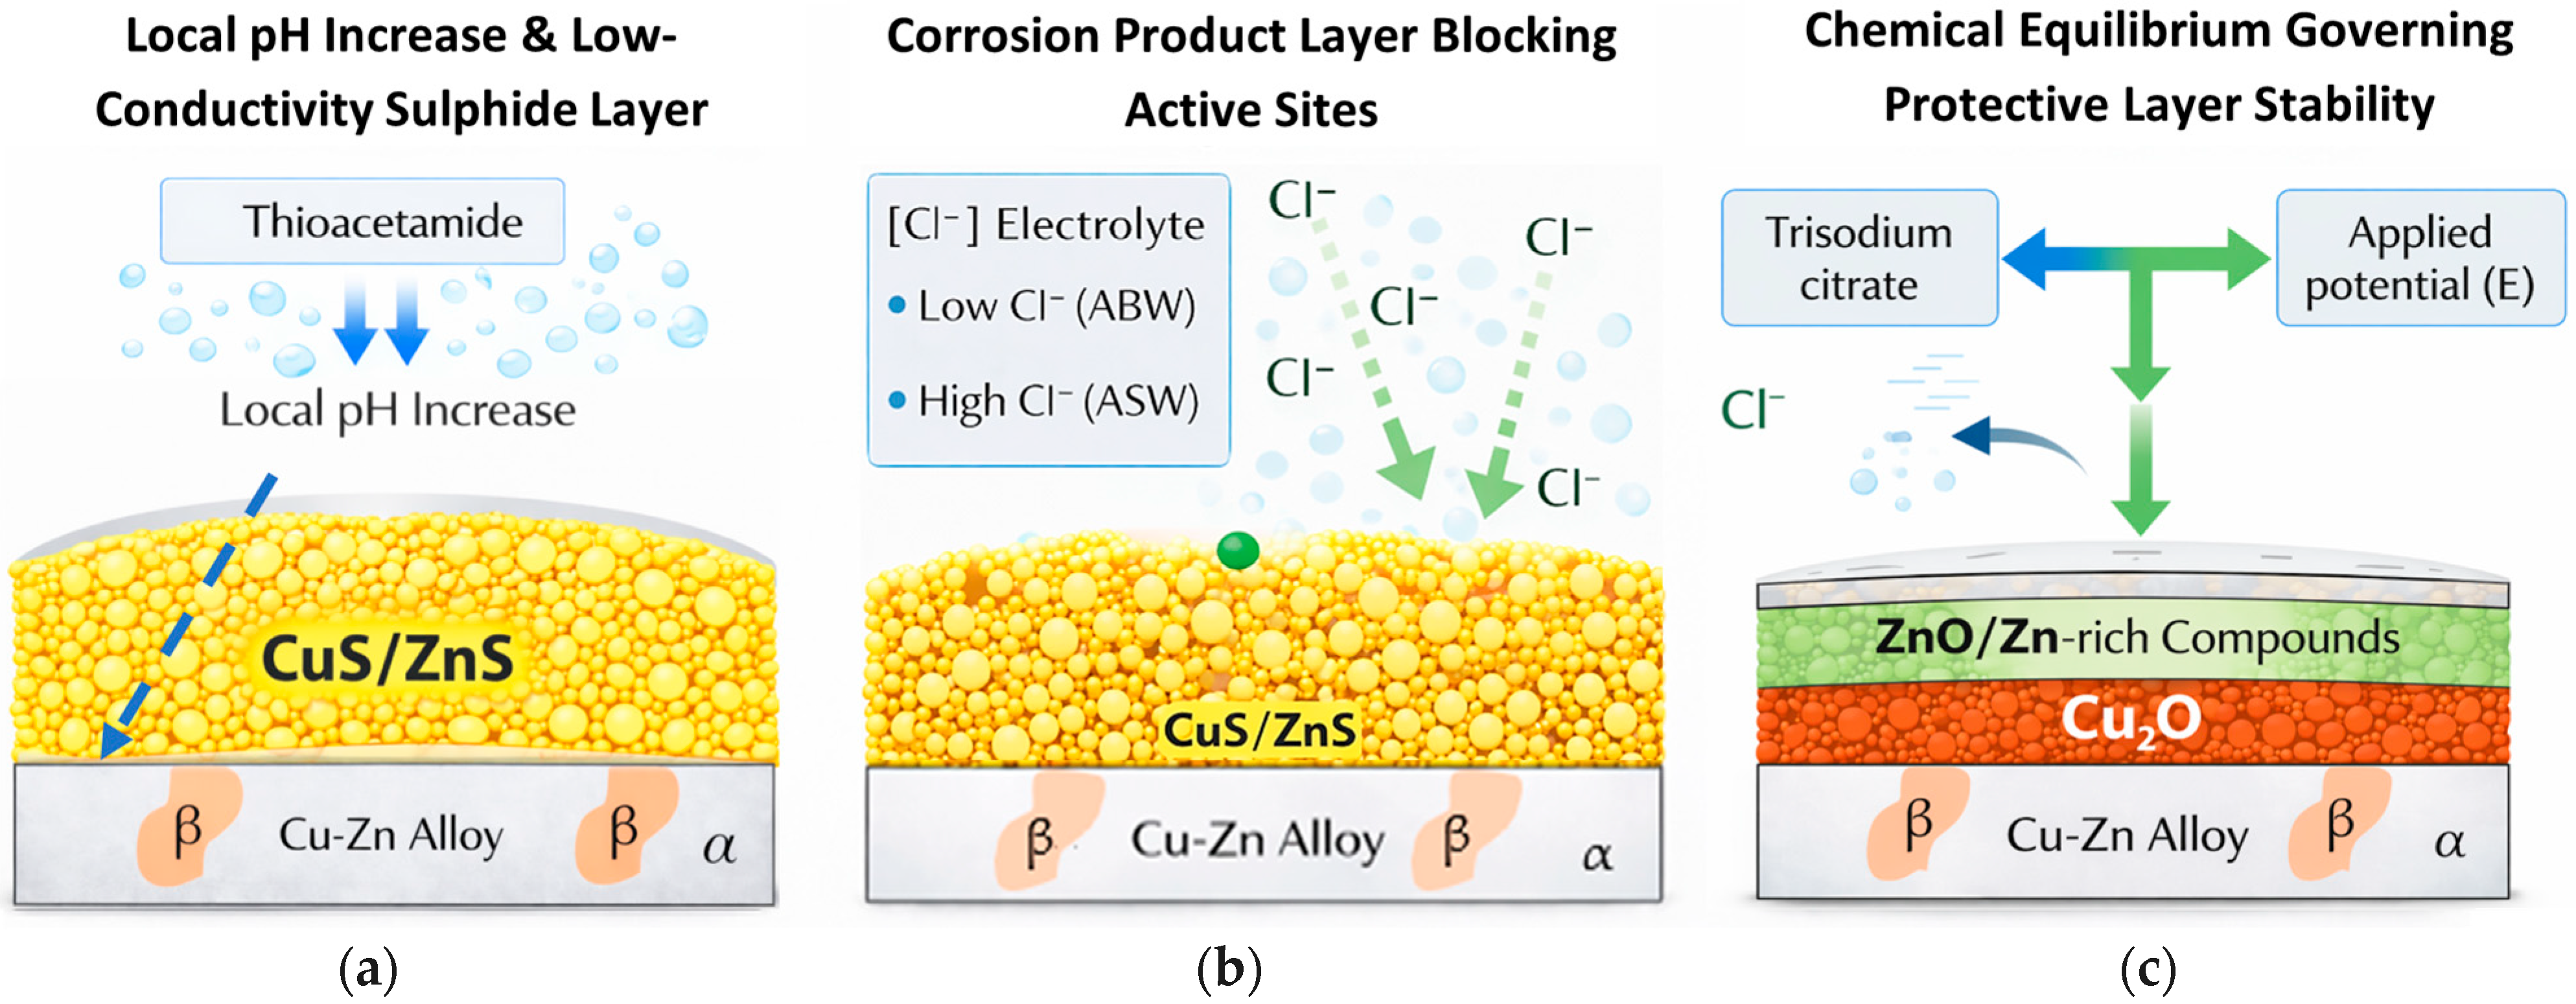
Thioacetamide is a sulphur-rich compound present in the ABW electrolyte, which could influence the observed corrosion scenarios in the way schematically illustrated in Figure 6, where the hypotheses proposed in this work are presented for clarity as follows:
(1)
It has been reported that the decomposition of thioacetamide up to a concentration of 1.33 mM (equivalent to approximately 45 ppm of sulphur in solution) can modify the local pH levels at the metal surface, creating a less favourable environment for corrosion reactions [37]. A more alkaline local pH level reduces the solubility of certain corrosion products and promotes the formation of more stable protective layers [38,39]. In addition, the possible formation of poorly soluble rich sulphide layer, such as CuS or ZnS, may result in a physical barrier that acts as an electrical insulator, thereby reducing corrosion rates [40,41]; it can also justify the observed corrosion inhibition effect [42,43].
(2)
The formation of a corrosion product layer that, although highly porous, can act as a physical barrier by blocking active sites on the metal surface [44], particularly those associated with selective β phase corrosion [45]. This effect is especially relevant in copper alloys, where chloride ions can be highly aggressive [46]; it also supports the observed higher corrosivity of ASW related to ABW associated with chloride content.
(3)
The formation of chemical species, such as ZnO, within the corrosion product layer, mainly composed of Cu2O [46,47,48], as well the presence of trisodium citrate in the electrolyte, could participate in a complex chemical equilibrium that governs the effectiveness of corrosion protection under different electrolyte compositions and applied electrochemical potential conditions.

3.2. Corrosion–Cavitation Tests

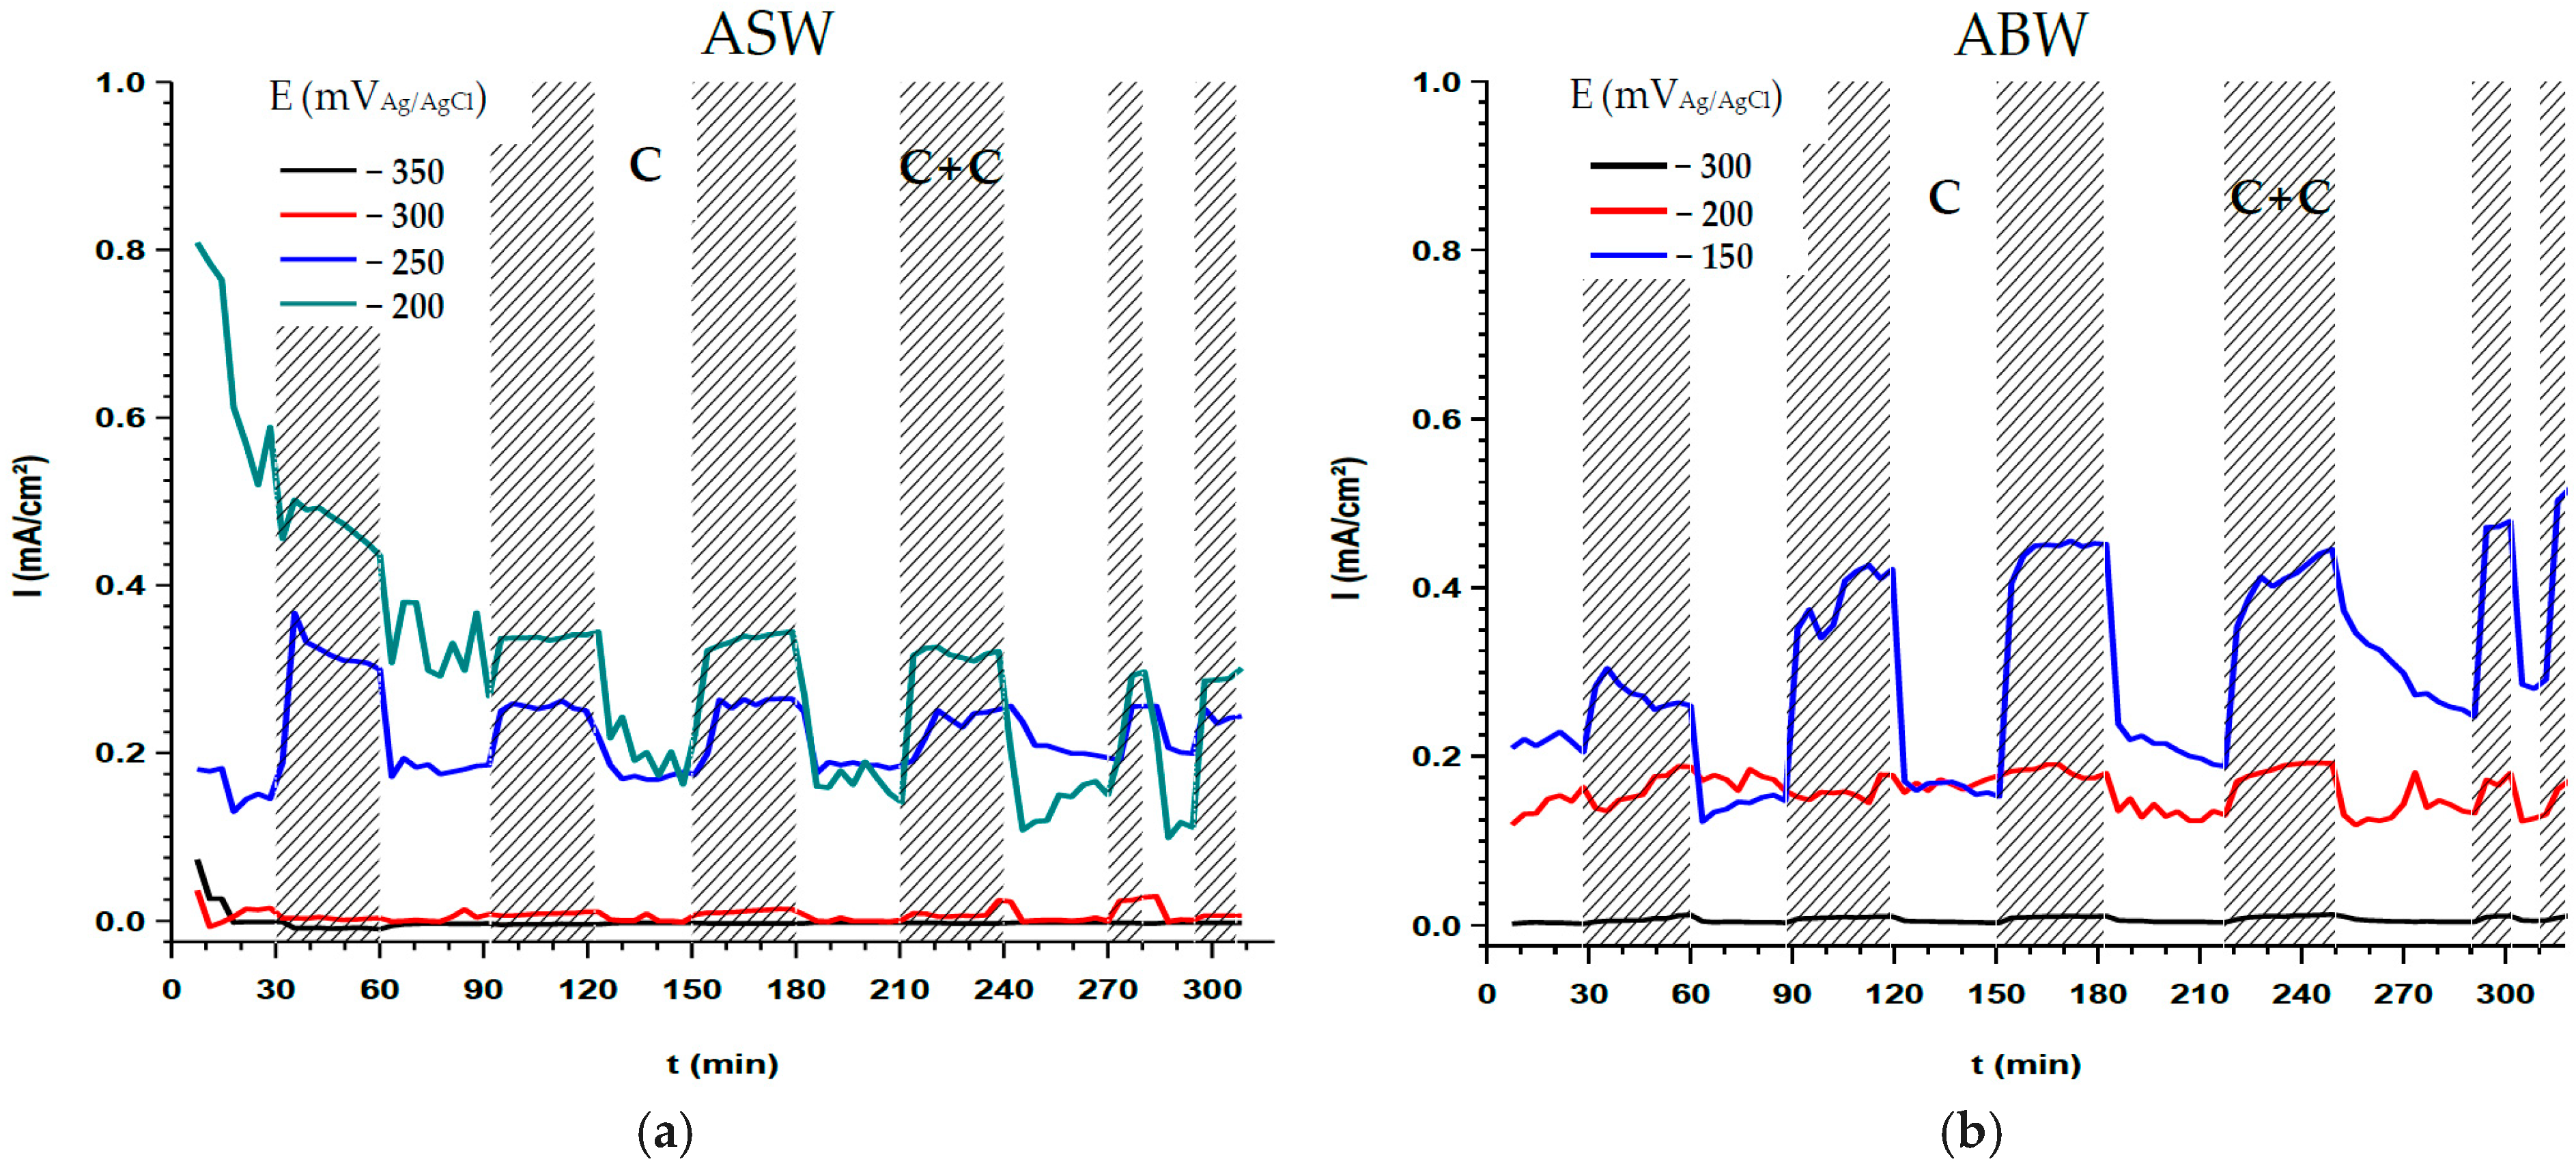
Figure 7 shows current density evolution of the CB773S alloy under potentiostatic conditions at different applied potentials in ASW and ABW, with intermittent cavitation (US) indicated by the shaded areas. The electrochemical response and its interaction with mechanical damage strongly depend on both the applied potential and the electrolyte chemical composition. It has been observed that an increase in anodic polarization makes the corrosion process more active, while cavitation cycles accelerate the electrochemical reactions. In turn, corrosion weakens the surface, promoting susceptible sites for a cumulative mechanical damage.
Under a cathodic polarization regime, close to cathodic protection conditions (−300 mVAg/AgCl) [37], the material remains in a state of immunity in both ASW and ABW, with current density values close to zero throughout the test. The cycle of cavitation promoted by ultrasound scarcely perturbs the electrochemical material behaviour, indicating that, at this operating potential, the mechanical action of cavitation is not sufficient to destabilize the brass surface. This behaviour suggests that, in this regime, the chemical variable dominates over the mechanical one in the corrosion–cavitation process.
At the transition potentials, −250 mVAg/AgCl in ASW (≈80 µA·cm2 in the corresponding PD tests) and −200 mVAg/AgCl in ABW (≈20 µA·cm2 in PD test), the corrosion rate remains at levels comparable to those obtained under dynamic polarization conditions. When cavitation cycle is introduced, a slight increase in current density is observed in ASW, whereas its effect in ABW is barely noticeable. At these potentials, the material begins to exhibit some difficulty in recovering the protective layer between the cavitation cycles. This effect is more pronounced in ASW, where the impact of collapsing bubbles contributes to a localized mechanical damage, while in ABW, the response is largely governed by its corrosivity and the limited mechanical resistance of the corrosion products.
A marked increase in current density is observed under an applied critical anodic polarization (−200 mVAg/AgCl in ASW and −150 mVAg/AgCl in ABW), and cavitation exerts a significant influence on the system with different tendencies, highly linked with the selected electrolyte. In ASW, although the severity of damage increases with the applied potential, current density initially reaches high values (around 2000 µA·cm2) and progressively decreases with successive cavitation cycles to approximately 400 µA·cm2, indicating repeated formation and disruption of corrosion products. In contrast, in ABW, current density ranges between 500 and 1200 µA·cm2 during the cavitation cycles, increasing with prolonged exposure and further intensifying when the cavitation cycle duration is reduced to 10 min.
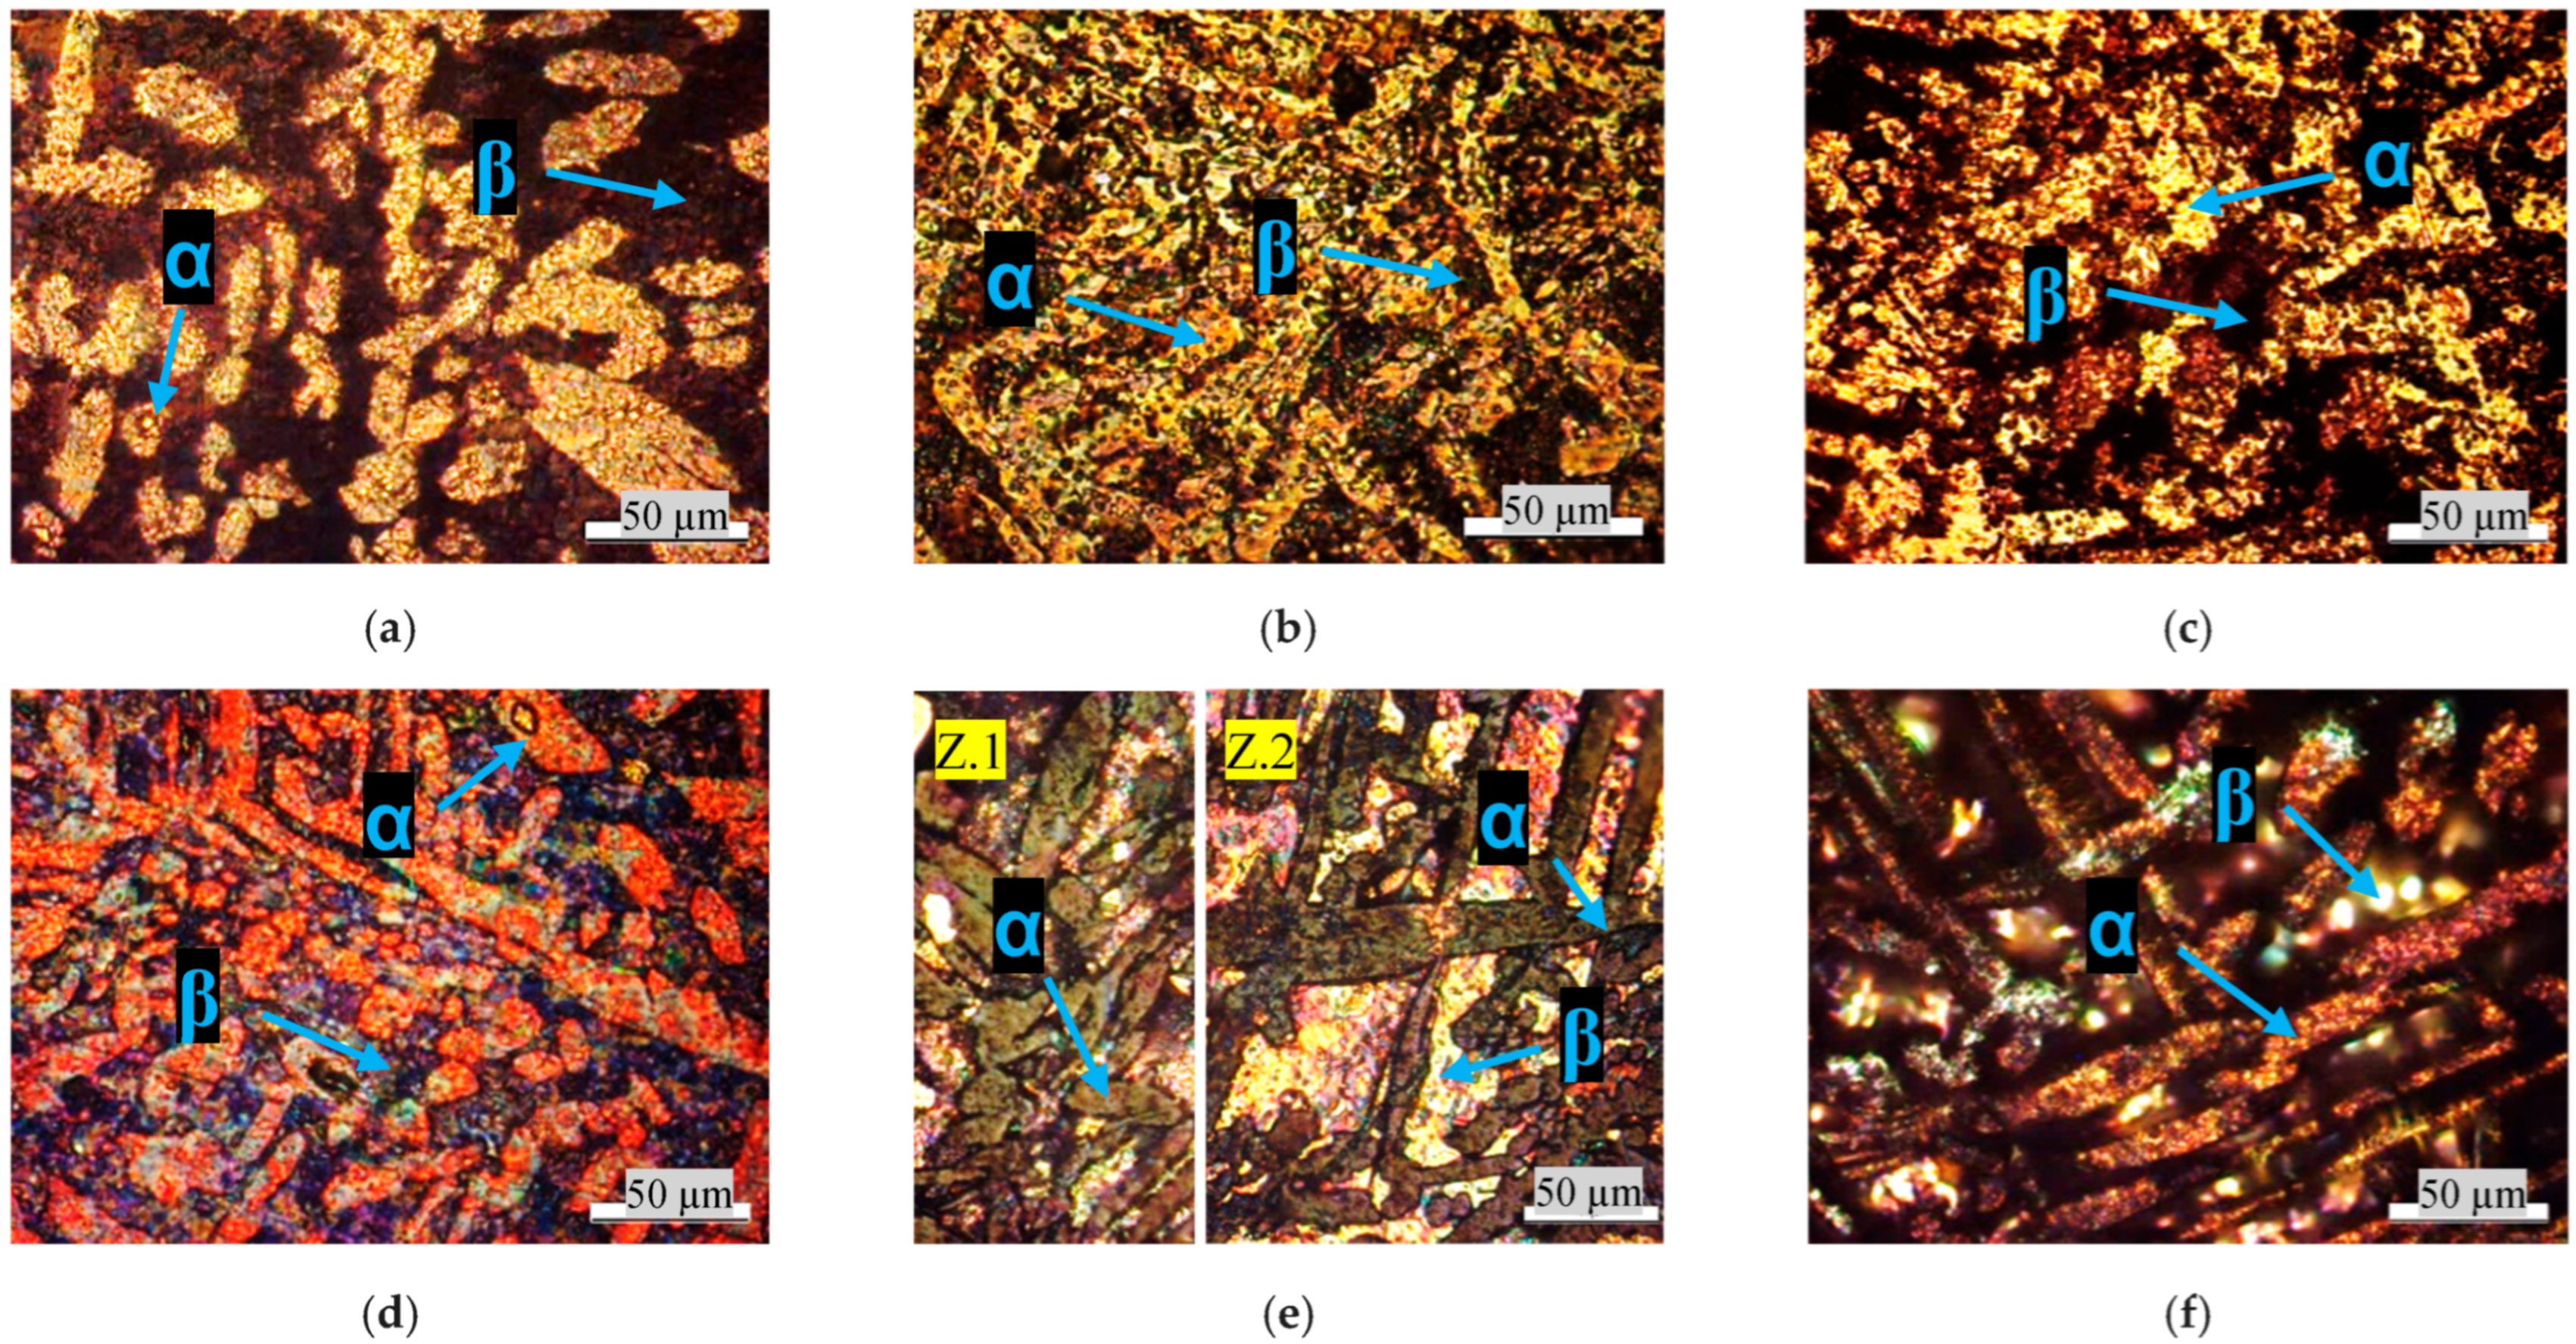
Figure 8 shows that cavitation–corrosion damage is generally more severe in ASW than in ABW. In ASW, the surface is characterized by pronounced plastic deformation of the α phase and a deeper cavitation attack, particularly at the α/β interfaces. In contrast, at low and intermediate potentials in ABW, brass exhibits a lower damage depth and a more uniform surface morphology, in exception to the severe β phase damage detected for the highest potential, which is consistent with the corrosion rates.
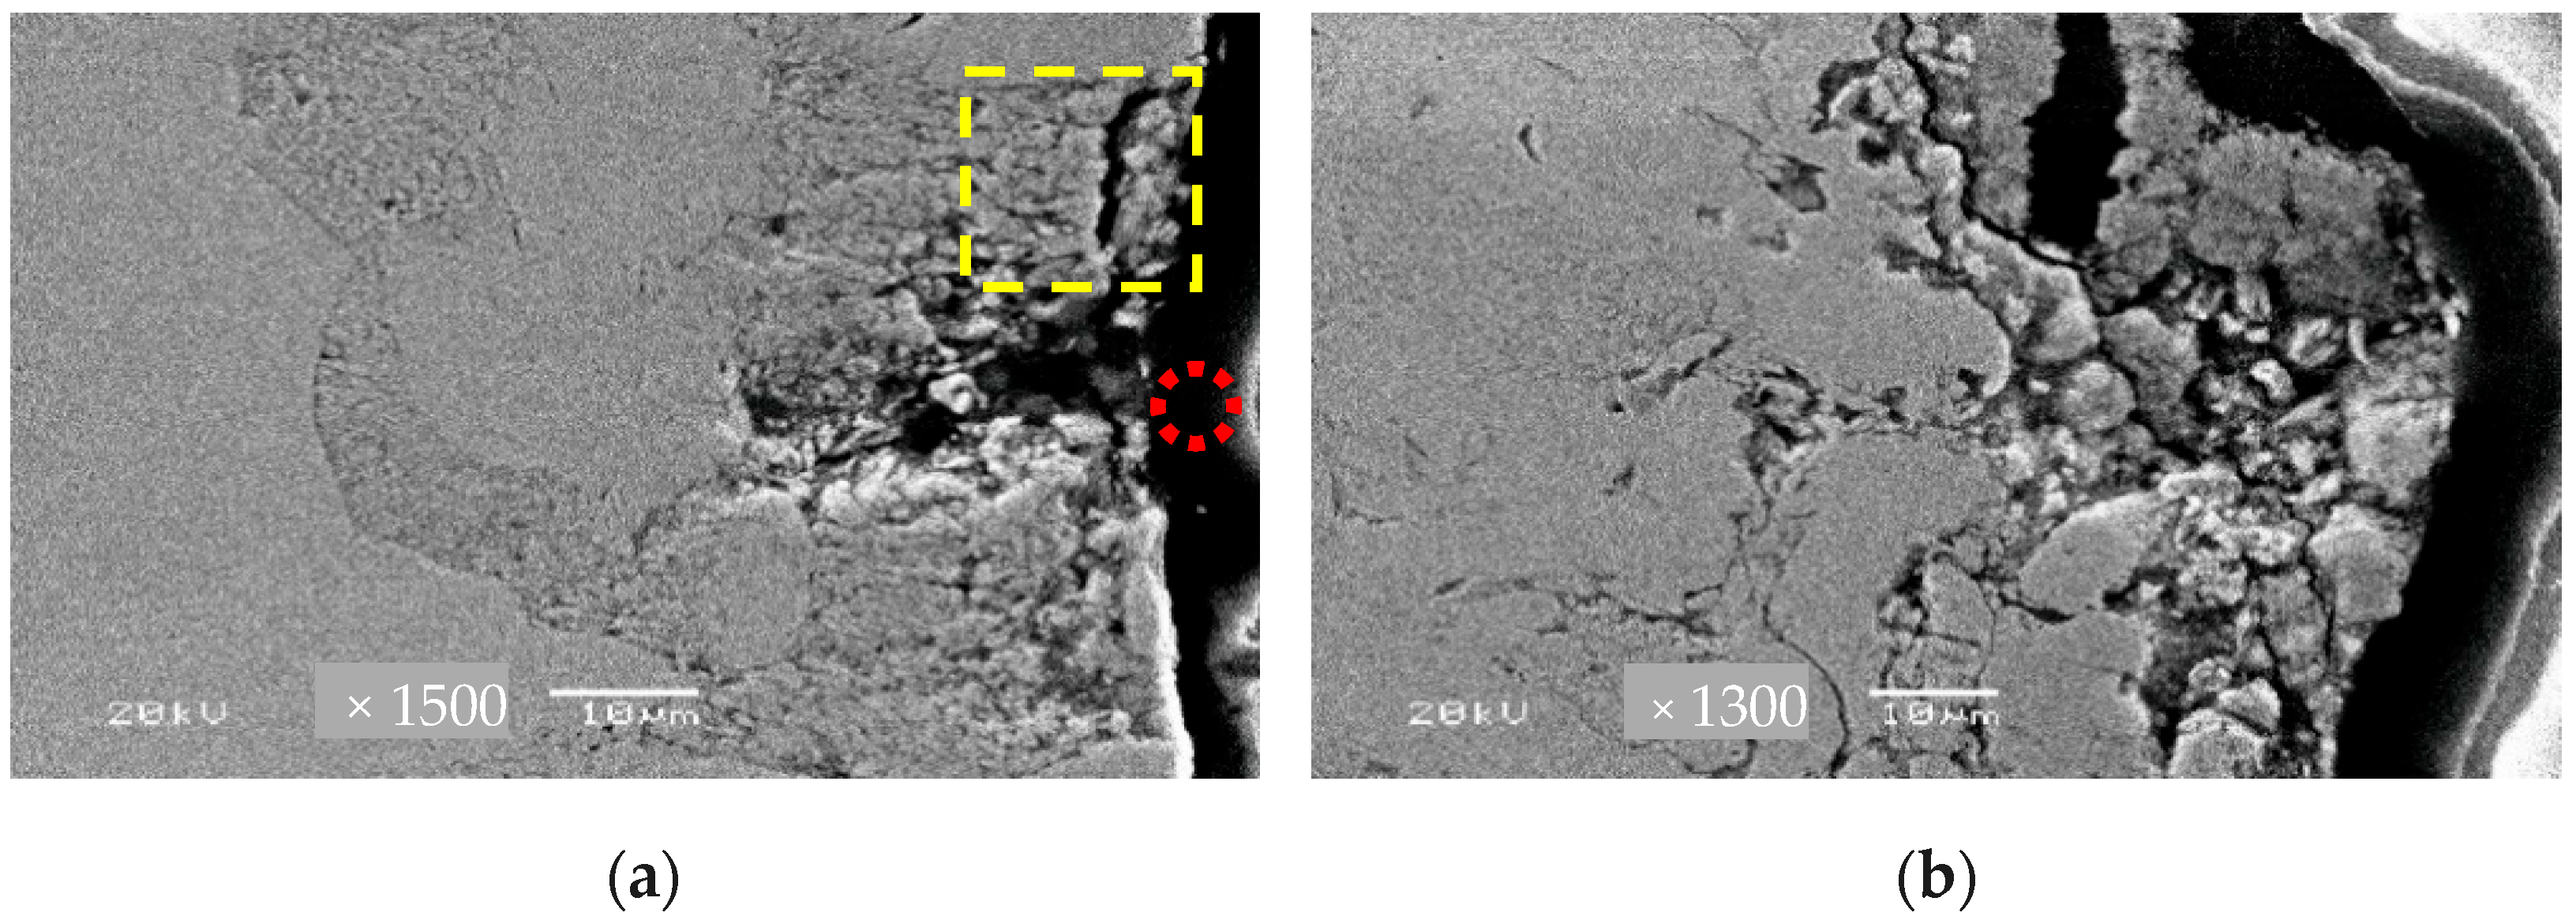
The SEM cross-section of the specimens after corrosion–cavitation tests (ABW, −150 mVAg/AgCl) is shown in Figure 9. Figure 9a illustrates a notorious material damage, where the formation of internal cavities (channel-like features) is observed, possibly influenced by bubble implosion (red circle). This observation suggests an interaction between cavitation and selective corrosion, which contributes to the penetration of damage into the material. In Figure 9b, a noticeably thick and porous layer of corrosion products is observed. This weak layer is a consequence of synergistic interaction between corrosion and cavitation: the material loses its continuity due to a selective removal of the beta phase, leaving unbound alpha-phase grains, with a penalized mechanical resistance and with a protective less porous and non-adherent corrosion products, easily removed along the cavitation cycles, leading to a continuous exposure of the material to the electrolyte corrosiveness.
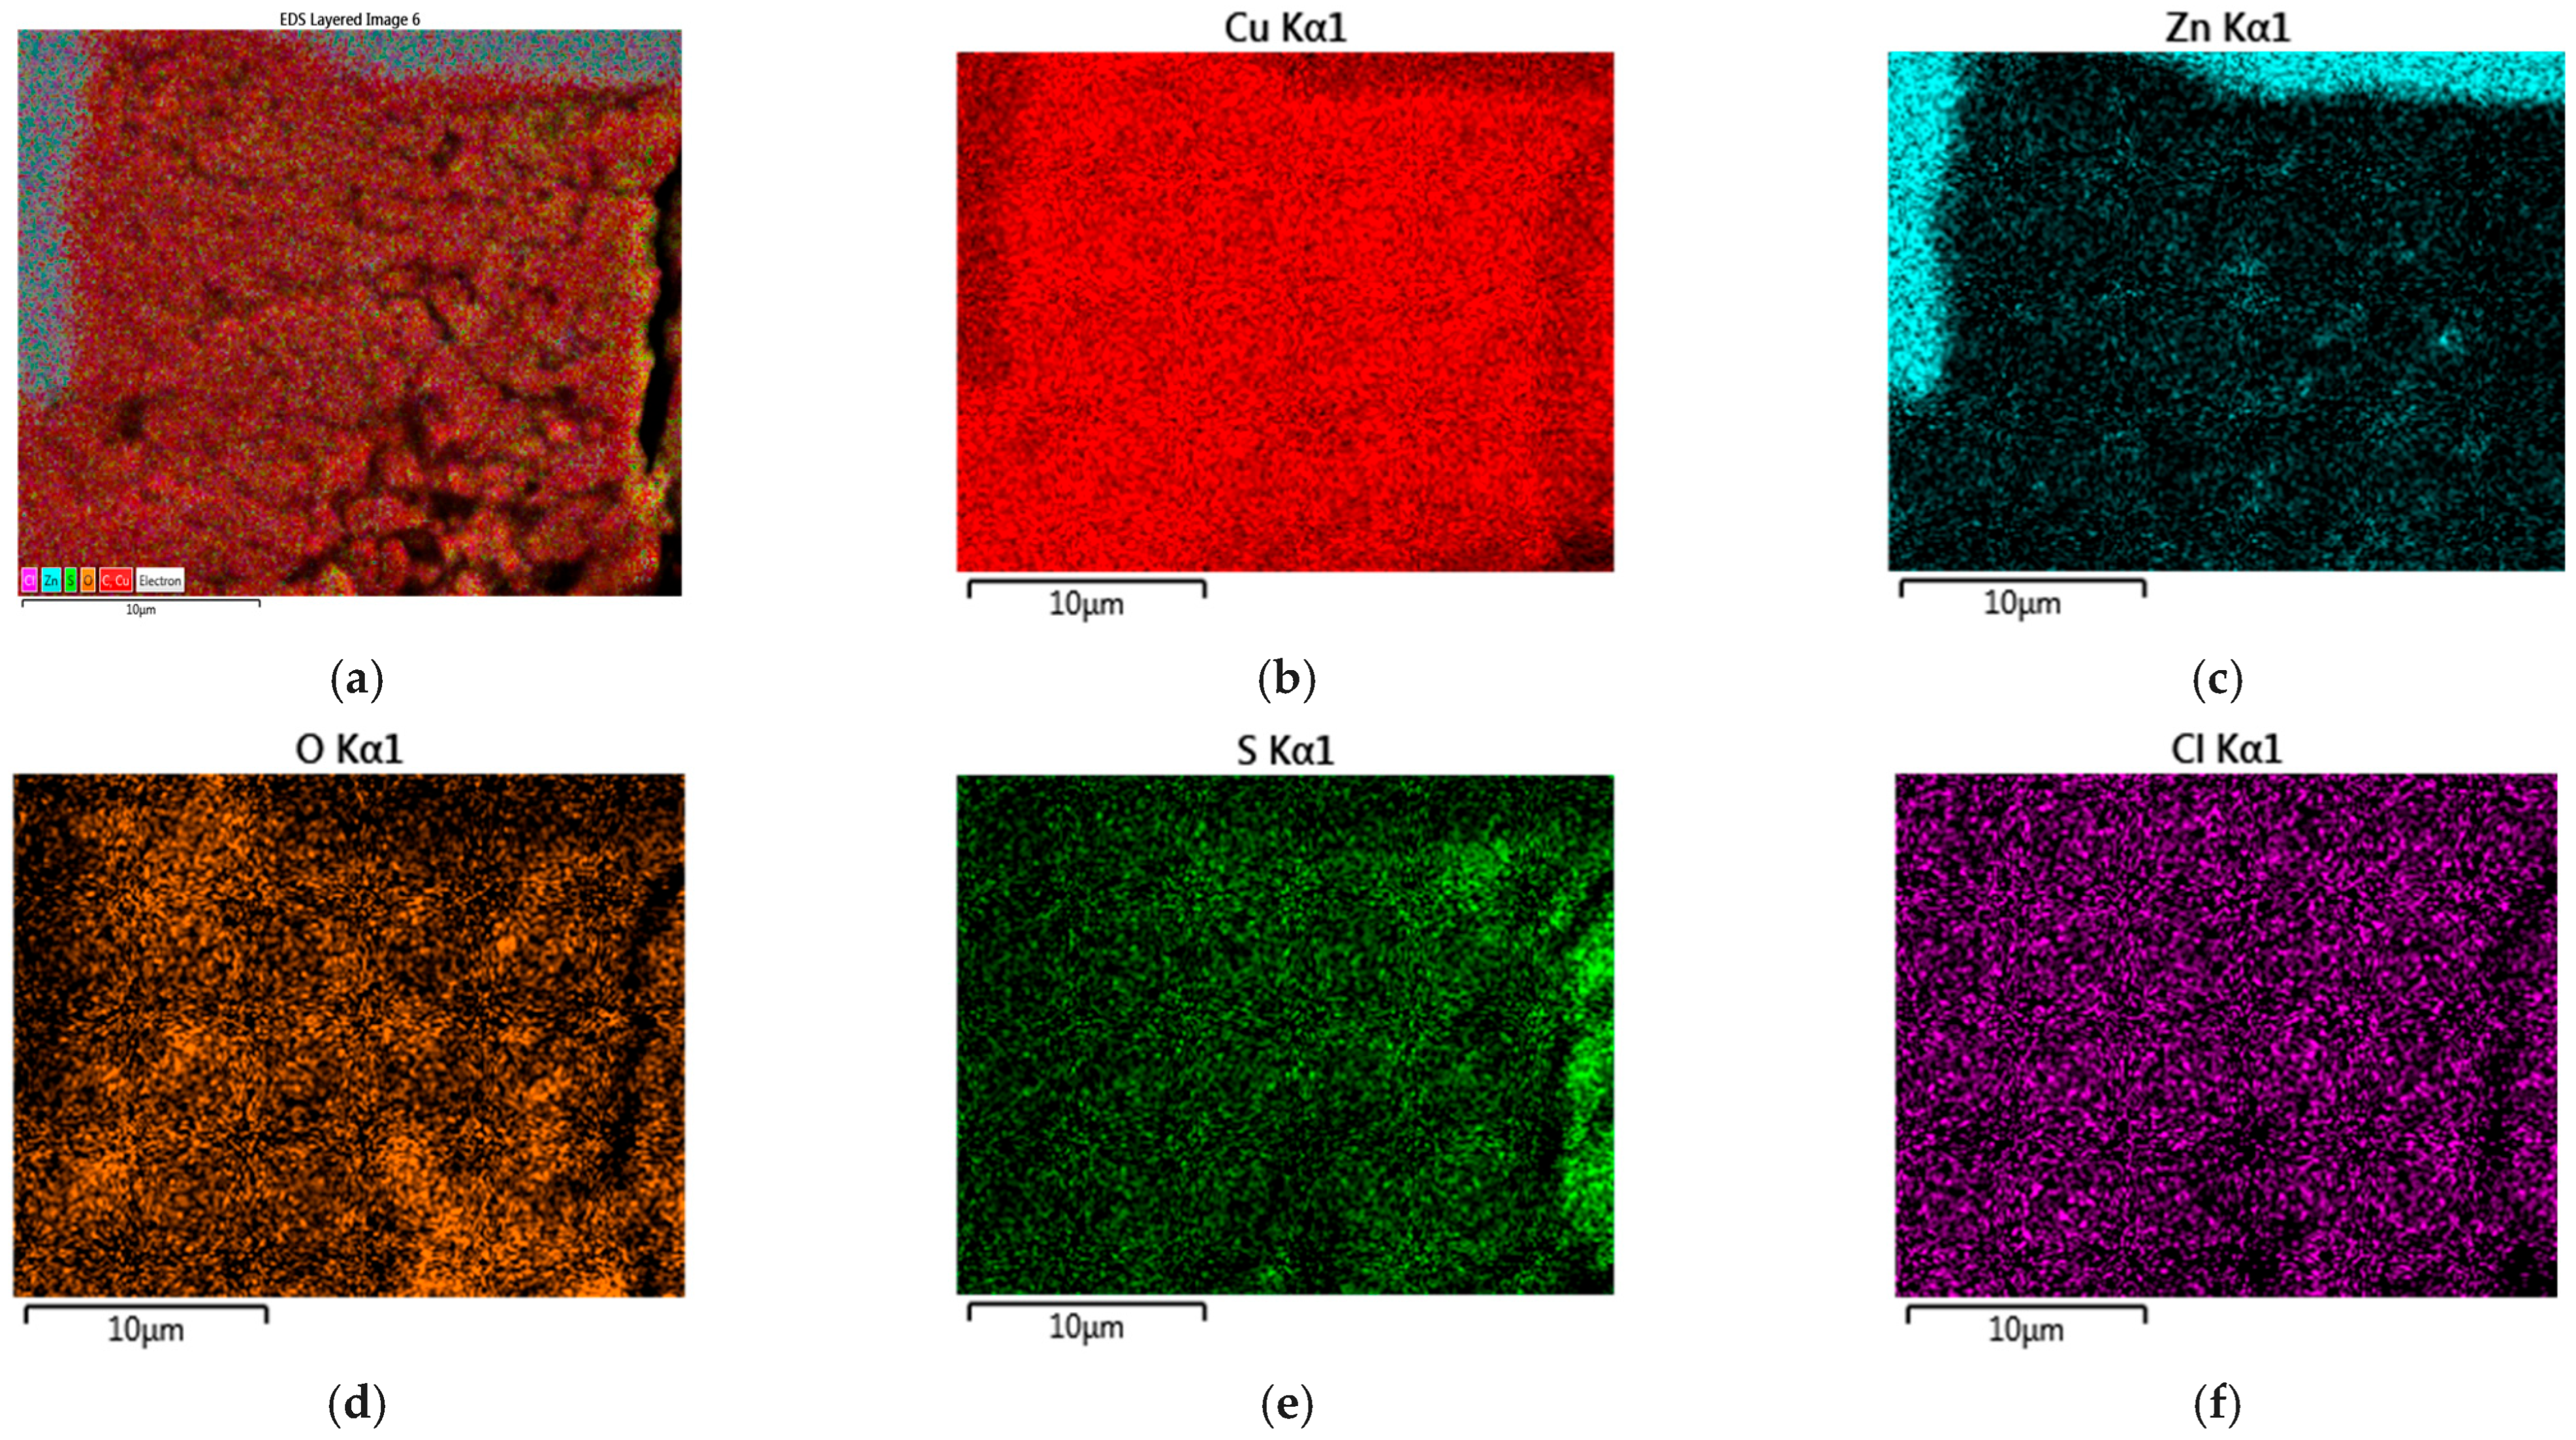
An EDS mapping of brass cross-section (ABW, −150 mVAg/AgCl,) is shown is Figure 10, marked on a square in Figure 10a; it details a corrosion product layer of copper oxychlorides contaminated with sulphur and an external irregular layer rich in Zn.
It can be confirmed that the corrosion–cavitation damage effect on the brass is controlled by the combined effects of microstructure, applied potential, and the mechanical stability of the corrosion product layer. The collapse of the cavitation bubbles removes the surface material, leading to an increase in surface roughness and promoting a localized corrosion processes, such as pitting and crevice corrosion. The selective dissolution of the β phase, susceptible to dezincification, disrupts the surface heterogeneity, required to mitigate cavitation damage, and alters the mechanical response of the alloy, leaving the α phase as the primary load-bearing constituent. This scenario is penalized as applied potential is increased, especially in ABW at −150 mVAg/AgCl.
The behaviour of brass after cavitation–corrosion tests is further influenced by the α/β phase ratio. A high density of α/β interfaces promotes stress concentration during bubble collapse, facilitating the accumulation of Cu-rich cathodic deposits, accelerating the selective β phase corrosion and enhancing the corrosion–cavitation synergy. This degradation pattern was consistently observed along the analyzed cross-sectional area, although the interaction was particularly pronounced in specific regions of the cross-sections observed. As the applied potential shifts towards more anodic values, the synergistic interaction between cavitation-induced mechanical damage and electrochemical dissolution results in an increased overall degradation result [49]. The dominant damage mechanism depends on the electrolyte and the electrochemical parameters, potentially shifting from predominantly mechanical erosion to corrosion-influenced attack.
The role of the corrosion product layer is governed by its chemical stability and mechanical resistance. While such layers may partially limit electrochemical activity under static conditions [16,23], the present results show that, under cavitation, they do not provide effective protection. In ABW at −150 mVAg/AgCl, a thick but porous and poorly adherent corrosion product layer was observed on the cross-section, which is readily removed during cavitation cycles. This continuous removal exposes fresh substrate, sustaining anodic dissolution and promoting selective β phase attack, as evidenced by the internal penetration features and the higher corrosion rates measured under these conditions. Therefore, the limited compactness and mechanical weakness of the corrosion products control the damage evolution in the cavitation–corrosion regime.
Under these conditions, cavitation significantly accelerates the corrosion process through a strong corrosion–cavitation synergism, whose manifestation depends on the electrolyte. Mechanical damage induced by cavitation compromises the integrity of the corrosion product layer, increasing electrochemical activity by continuously exposing fresh surface metal to the electrolyte, while corrosion, in turn, enhances the susceptibility of the surface to mechanical degradation. In ASW, this synergy is predominantly associated with mechanically driven degradation, characterized by severe plastic deformation of the α phase and preferential attack at the α/β interfaces due to the repeated mechanical destabilization of the corrosion product layer. Although previous studies have reported that brass in artificial seawater develops relatively compact and uniform corrosion films under static conditions [50], the present results indicate that such layers exhibit high susceptibility to plastic deformation under cavitation conditions. In contrast, in ABW, the cavitation–corrosion interaction is mainly corrosion-controlled: although thicker corrosion product layers form under PS conditions, which are mechanically weak and readily removed by cavitation, promoting deep galleries formation, enhanced β phase dezincification, and increased damage depth, particularly under more anodic polarization.
It should be noted that the test duration in this study (300 min) may not fully reflect long-term service conditions. While this time is sufficient to obtain preliminary data and understand the complexity of the phenomenon, and, in particular, the initial stages of the corrosion–cavitation interaction, it would be necessary to extend the tests to at least 600 min and to increase the number of corrosion/corrosion–cavitation cycles to more accurately determine the dominant phenomenon in this corrosion–cavitation synergy in low-lead brass alloys.

4. Conclusions

In this study, the corrosion and corrosion–cavitation behaviour of extra-low-lead CB773S brass in artificial seawater (ASW) and artificial brackish water (ABW) under controlled potentiodynamic, potentiostatic, and corrosion–cavitation conditions were investigated. The major conclusions from this work are summarized as follows:
  • It has been observed that the corrosion behaviour of CB773S brass is strongly influenced by the applied potential and the chemical composition of the electrolyte. In ASW, a higher corrosion rate and greater damage depth are recorded, associated with extensive selective dezincification of the β phase.
  • The lower corrosivity of ABW is attributed to the combined effect of thioacetamide and the lower chloride concentration compared to ASW. Sulfur promotes the formation of a thick, porous, and weakly adherent corrosion product layer, which partially limits electrochemical activity under static conditions and mitigates selective corrosion of the β phase.
  • The corrosion–cavitation synergy is governed by the mechanical stability of the corrosion product layer, the environmental corrosivity, and the applied potential, intensifying under anodic conditions, particularly in ABW. In ASW, damage is predominantly mechanical, whereas in ABW, the interaction is corrosion-controlled, with the continuous removal of corrosion products enhancing electrochemical activity and promoting dezincification, supported by the anodic behaviour of β phase, particularly enhanced under cavitation–corrosion conditions.
  • These findings offer new insights into the behaviour of extra-low-lead brasses in marine environments and enhance the understanding of cavitation–corrosion interactions in this material.

Author Contributions

Conceptualization, L.M.-G. and M.V.B.-M.; methodology, L.M.-G.; validation, L.M.-G. and M.V.B.-M.; formal analysis, L.M.-G. and M.V.B.-M.; investigation, L.M.-G.; resources, M.V.B.-M.; writing—original draft preparation, L.M.-G.; writing—review and editing, M.V.B.-M.; supervision, M.V.B.-M. All authors have read and agreed to the published version of the manuscript.

Funding

This research received no external funding.

Data Availability Statement

The data presented in this study are available on request from the corresponding author.

Acknowledgments

The authors acknowledge Paul Linhardt for scientific support, Latones del Carrión, Spain, for providing the specimens, and the Universidad de Burgos (UBU), Spain, for SEM services.

Conflicts of Interest

The authors declare no conflict of interest.

References

  1. Rahman, M.M.; Salin, A.S.M.; Haque, M.R.; Kaiser, M.S.; Ahmed, S.R. Experimental investigation of thermo-mechanical properties of copper-based marine propeller materials. AIP Conf. Proc. 2021, 2324, 030009. [Google Scholar] [CrossRef] [Scilit]
  2. Carlton, J. Marine Propellers and Propulsion; Butterworth-Heinemann: Oxford, UK, 2018. [Google Scholar]
  3. EN 1982:2017; Copper and Copper Alloys—Ingots and Castings. CEN: Brussels, Belgium, 2017.
  4. Toulfatzis, A.I.; Pantazopoulos, G.; Paipetis, A.S. Fracture behavior and characterization of lead-free brass alloys for machining applications. J. Mater. Eng. Perform. 2014, 23, 3193–3206. [Google Scholar] [CrossRef] [Scilit]
  5. Sandvig, A.M.; Triantafyllidou, S.; Edwards, M.; Heumann, D.; Boyd, G.; Kirmeyer, G. Nonleaded brass—A summary of performance and costs. J. Am. Water Work. Assoc. 2009, 101, 83–94. [Google Scholar] [CrossRef] [Scilit]
  6. Lazar, I.; Bordeasu, I.; Popoviciu, M.O.; Mitelea, I.; Craciunescu, C.M.; Pirvulescu, L.D.; Sava, M.; Micu, L.M. Evaluation of the brass CuZn39Pb3 resistance at vibratory cavitation erosion. IOP Conf. Ser. Mater. Sci. Eng. 2019, 477, 012002. [Google Scholar] [CrossRef] [Scilit]
  7. Song, Q.-N.; Xu, N.; Bao, Y.-F.; Jiang, Y.-F.; Gu, W.; Zheng, Y.-G.; Qiao, Y.-X. Corrosion and cavitation erosion behaviors of two marine propeller materials in clean and sulfide-polluted 3.5% NaCl solutions. Acta Metall. Sin. (Engl. Lett.) 2017, 30, 712–720. [Google Scholar] [CrossRef] [Scilit]
  8. Kadivar, E.; Rezaee, S.; Löschner, U.; El Moctar, O. Effects of materials and riblets on erosion mitigation induced by multiple collapses of cavitation bubbles. Appl. Sci. 2024, 14, 6452. [Google Scholar] [CrossRef] [Scilit]
  9. Biezma-Moraleda, M.V.; Strobl, S.; Linhardt, P.; Ball, G.; Haubner, R. Dezincification in cast and heat-treated alpha-beta brass samples. Pract. Metallogr. 2023, 60, 632–642. [Google Scholar] [CrossRef] [Scilit]
  10. Song, Q.; Li, H.; Xu, N.; Jiang, Z.; Zhang, G.; Bao, Y.; Jiang, Y.; Zhao, L.; Ji, C.; Zhao, J.; et al. Selective phase corrosion and cavitation erosion behaviors of various copper alloys in 3.5% NaCl solutions with different pH values. Trans. Nonferr. Met. Soc. China 2023, 33, 3039–3053. [Google Scholar] [CrossRef] [Scilit]
  11. Mor, E.D.; Beccaria, T.A.M. Behavior of copper in artificial seawater containing sulphides. Br. Corros. J. 1975, 10, 33–38. [Google Scholar] [CrossRef]
  12. Patterson, J.W.D.; Ridley, N. Effect of phase proportions on deformation and cavitation of superplastic α/β brass. J. Mater. Sci. 1981, 16, 457–464. [Google Scholar] [CrossRef] [Scilit]
  13. Cobo, I.; Biezma-Moraleda, M.V.; Linhardt, P. Corrosion evaluation of welded nickel aluminium bronze and manganese aluminum bronze in synthetic seawater. Mater. Corros. 2022, 73, 1788–1799. [Google Scholar] [CrossRef] [Scilit]
  14. Cobo Ocejo, I.; Biezma-Moraleda, M.V.; Linhardt, P. Corrosion behavior of heat-treated nickel-aluminum bronze and manganese-aluminum bronze in natural waters. Metals 2022, 12, 380. [Google Scholar] [CrossRef] [Scilit]
  15. Sudhakaran, R.; Deepa, T.; Thirumavalavan, M.; Sabarimuthu, S.Q.; Babu, S.; Asokan, T.; Raja, P.B. Trisodium citrate as a potential and eco-friendly corrosion inhibitor of copper in potable water. J. King Saud Univ. Sci. 2023, 35, 102907. [Google Scholar] [CrossRef] [Scilit]
  16. García, J.; Martínez, A.; López, S. Effects of sulfide ions on the intergranular corrosion of copper in saline water: A dissolution study and product analysis. Corros. Sci. 2024, 189, 109121. [Google Scholar] [CrossRef] [Scilit]
  17. Liu, H.; Deng, Z.; Chen, J.; Kang, C.; Li, B. Synergetic effect of corrosion and ultrasonic cavitation erosion on leaded brass. J. Mater. Eng. Perform. 2021, 30, 3174–3184. [Google Scholar] [CrossRef] [Scilit]
  18. Sun, J.; Ge, X.; Chu, D.; Zhang, L.; Meng, H.; Zheng, Y. Effects of sediment diameter and concentration on cavitation characteristics and mechanism. Tribol. Int. 2022, 171, 107543. [Google Scholar] [CrossRef] [Scilit]
  19. Tam, K.F.; Cheng, F.T.; Man, H.C. Enhancement of cavitation erosion and corrosion resistance of brass by laser surface alloying with Ni–Cr–Si–B. Surf. Coat. Technol. 2002, 149, 36–44. [Google Scholar] [CrossRef] [Scilit]
  20. Abedini, M.; Lopez de Arcaute, C.; Lozano, C.; Kostka, A.; Hanke, S. Influence of surface finishing by grinding on the cavitation erosion resistance of 316L and NiAl bronze. Wear 2024, 554–555, 205432. [Google Scholar] [CrossRef] [Scilit]
  21. Li, Y.; Lian, Y.; Sun, Y. Synergistic effect between cavitation erosion and corrosion for friction stir processed NiAl bronze in artificial seawater. Met. Mater. Int. 2021, 27, 5082–5094. [Google Scholar] [CrossRef] [Scilit]
  22. Livesey, D.W.; Ridley, N. Cavitation during superplastic flow of ternary alloys based on microduplex Pb–Sn eutectic. J. Mater. Sci. 1978, 13, 825–832. [Google Scholar] [CrossRef] [Scilit]
  23. Biezma-Moraleda, M.V.; Merino Galván, L.; Linhardt, P. Cavitation of some copper alloys for naval propellers: Electrolyte effect. IOP Conf. Ser. Mater. Sci. Eng. 2023, 1288, 012056. [Google Scholar] [CrossRef] [Scilit]
  24. Merino Galván, L.; Biezma-Moraleda, M.V.; Linhardt, P. Cavitation typology in the marine environment in copper-based alloys. In Proceedings of the COPINAVAL ICNE 2022; Springer: Cham, Switzerland, 2023; Volume 17, pp. 181–187. [Google Scholar] [CrossRef] [Scilit]
  25. Szala, M.; Łatka, L.; Walczak, M.; Winnicki, M. Comparative study on cavitation erosion and sliding wear of cold-sprayed coatings and bulk metals. Metals 2020, 10, 856. [Google Scholar] [CrossRef] [Scilit]
  26. Abedini, M.; Reuter, F.; Hanke, S. Corrosion and material alterations of a CuZn38Pb3 brass under acoustic cavitation. Ultrason. Sonochem. 2019, 58, 104628. [Google Scholar] [CrossRef] [Scilit]
  27. Li, X.Y.; Yan, Y.G.; Ma, L.; Xu, Z.M.; Li, J.G. Cavitation erosion and corrosion behaviour of copper–manganese–aluminium alloy weldment. Mater. Sci. Eng. A 2004, 382, 82–89. [Google Scholar] [CrossRef] [Scilit]
  28. Dumitriu, C.S.; Bărbulescu, A. Artificial intelligence models for the mass loss of copper-based alloys under cavitation. Materials 2022, 15, 6695. [Google Scholar] [CrossRef] [Scilit]
  29. Kim, Y.S.; Ko, S.J.; Lee, S.; Kim, J.G. Analysis of underwater electromagnetic field reduction by mixed-type cathodic protection. Korean J. Met. Mater. 2017, 55, 591–599. [Google Scholar] [CrossRef] [Scilit]
  30. Nejneru, C.; Savin, C.; Perju, M.C.; Burduhos-Nergis, D.D.; Costea, M.; Bejinariu, C. Studies on galvanic corrosion of metallic materials in marine medium. IOP Conf. Ser. Mater. Sci. Eng. 2019, 572, 012106. [Google Scholar] [CrossRef] [Scilit]
  31. Linhardt, P.; Biezma-Moraleda, M.V.; Strobl, S.; Haubner, R. Influence of cavitation in seawater on the etching attack of manganese–aluminium bronzes. Solid State Phenom. 2023, 341, 25–30. [Google Scholar] [CrossRef] [Scilit]
  32. Roy, S.; Smith, P.A.; House, G.R.; Edwards, M.A. Cavitation and erosion corrosion resistance of non-leaded alloys in chlorinated potable water. Corrosion 2019, 75, 424–435. [Google Scholar] [CrossRef] [Scilit]
  33. Biezma Moraleda, M.V.; Merino Galván, L.; Fernandez Palacio, J.; Berlanga Labari, C. Sustainable metallographic preparation: Specific case of Nickel Aluminium Bronze (NAB), Manganese Aluminium Bronze (MAB) and a Duplex Brass. Rev. Rev. Metal. 2024, 60, e271. [Google Scholar] [CrossRef] [Scilit]
  34. DIN 50905-4:2018-03; Corrosion of Metals—Corrosion Testing—Part 4: Performance of Chemical Corrosion Experiments Without Mechanical Stresses in Liquids in the Laboratory. Deutsches Institut für Normung: Berlin, Germany, 2018.
  35. Linhardt, P.; Kührer, S.; Ball, G.; Biezma, M.V. Design of a multichannel potentiostat and its application to corrosion testing of nickel–aluminium bronze. Mater. Corros. 2017, 69, 358–364. [Google Scholar] [CrossRef] [Scilit]
  36. Danyliak, M.O.; Zin, I.; Rizun, Y.; Korniy, S. Sodium citrate as an environmentally friendly corrosion inhibitor of steel in a neutral environment. Int. J. Corros. 2022, 2022, 1442537. [Google Scholar] [CrossRef] [Scilit]
  37. Merino Galván, L. Estudio del Comportamiento Frente a Fenómenos de Cavitación, Corrosión y Cavitación-Corrosión en el Ámbito Marino de Diferentes Sistemas Metálicos Base Cobre. Ph.D. Thesis, Universidad de Cantabria, Santander, Spain, 2025. Available online: https://hdl.handle.net/10902/38535 (accessed on 20 January 2026).
  38. Song, Q.N.; Xu, N.; Jiang, X.; Liu, Y.; Tong, Y.; Li, J.S.; Bao, Y.F.; Qiao, Y.X. Effect of sulfide concentration on corrosion and cavitation erosion behavior of manganese–aluminum bronze. J. Mater. Eng. Perform. 2019, 28, 4053–4064. [Google Scholar] [CrossRef] [Scilit]
  39. Guo, D.; Kwok, C.T. Effect of pH on the corrosion behaviour of tungsten–copper alloys. Corros. Sci. 2020, 177, 108994. [Google Scholar] [CrossRef] [Scilit]
  40. Syrett, B.C.; MacDonald, D.D.; Wing, S.S. Corrosion of copper–nickel alloys in seawater polluted with sulphide. Corrosion 1979, 35, 409–422. [Google Scholar] [CrossRef] [Scilit]
  41. Ataya, B.G.; El-Anadouli, B.E.; El-Nizamy, F.M.A. Corrosion inhibition and adsorption behaviour of thioamides on mild steel in sulfuric acid. Bull. Chem. Soc. Jpn. 1984, 54, 3157–3161. [Google Scholar] [CrossRef] [Scilit]
  42. Menéndez, C.; Jovancicevic, V.; Ramachandran, S.; Stegmann, D. Assessment of corrosion under iron sulphide deposits and CO2/H2S conditions. Corrosion 2012, 69, 145–156. [Google Scholar] [CrossRef] [Scilit] [PubMed]
  43. Wallaert, E.; Depover, T.; De Graeve, I.; Verbeken, K. FeS corrosion products formation and hydrogen uptake in a sour environment for quenched and tempered steel. Metals 2018, 8, 62. [Google Scholar] [CrossRef] [Scilit]
  44. Betti, N.; Al-Amiery, A.A.; Al-Azzawi, W.K.; Isahak, W.N.R.W. Corrosion inhibition properties of a Schiff base derivative against mild steel in HCl. Sci. Rep. 2023, 13, 8979. [Google Scholar] [CrossRef] [Scilit]
  45. Karunarathne, D.J.; Aminifazl, A.; Abel, T.E.; Quepons, K.L.; Golden, T.D. Corrosion inhibition effect of pyridine-2-thiol for brass in acidic environment. Molecules 2022, 27, 6550. [Google Scholar] [CrossRef] [Scilit] [PubMed]
  46. Zhou, P.; Ogle, K. The corrosion of copper and copper alloys. In Encyclopedia of Interfacial Chemistry; Elsevier: Amsterdam, The Netherlands, 2018; pp. 478–489. [Google Scholar] [CrossRef] [Scilit]
  47. Bolzán, A.E.; Haseeb, A.S.M.A.; Schilardi, P.L.; Piatti, V.R.; Salvarezza, R.C.; Arvia, A.J. Anodization of copper in acidic solution containing thiourea disulfide. J. Electroanal. Chem. 2001, 500, 533–542. [Google Scholar] [CrossRef] [Scilit]
  48. Collisi, U.; Strehblow, H.H. Formation of Cu2O layers on copper and their electrochemical properties. J. Electroanal. Chem. 1990, 284, 385–401. [Google Scholar] [CrossRef] [Scilit]
  49. Tang, C.H.; Cheng, F.T.; Man, H.C. Effect of laser surface melting on the corrosion and cavitation erosion behaviours of a manganese–nickel–aluminium bronze. Surf. Coat. Technol. 2007, 201, 5574–5580. [Google Scholar] [CrossRef] [Scilit]
  50. Santos, C.I.S.; Mendonça, M.H.; Fonseca, I.T.E. Corrosion of brass in natural and artificial seawater. J. Appl. Electrochem. 2006, 36, 1353–1359. [Google Scholar] [CrossRef] [Scilit]
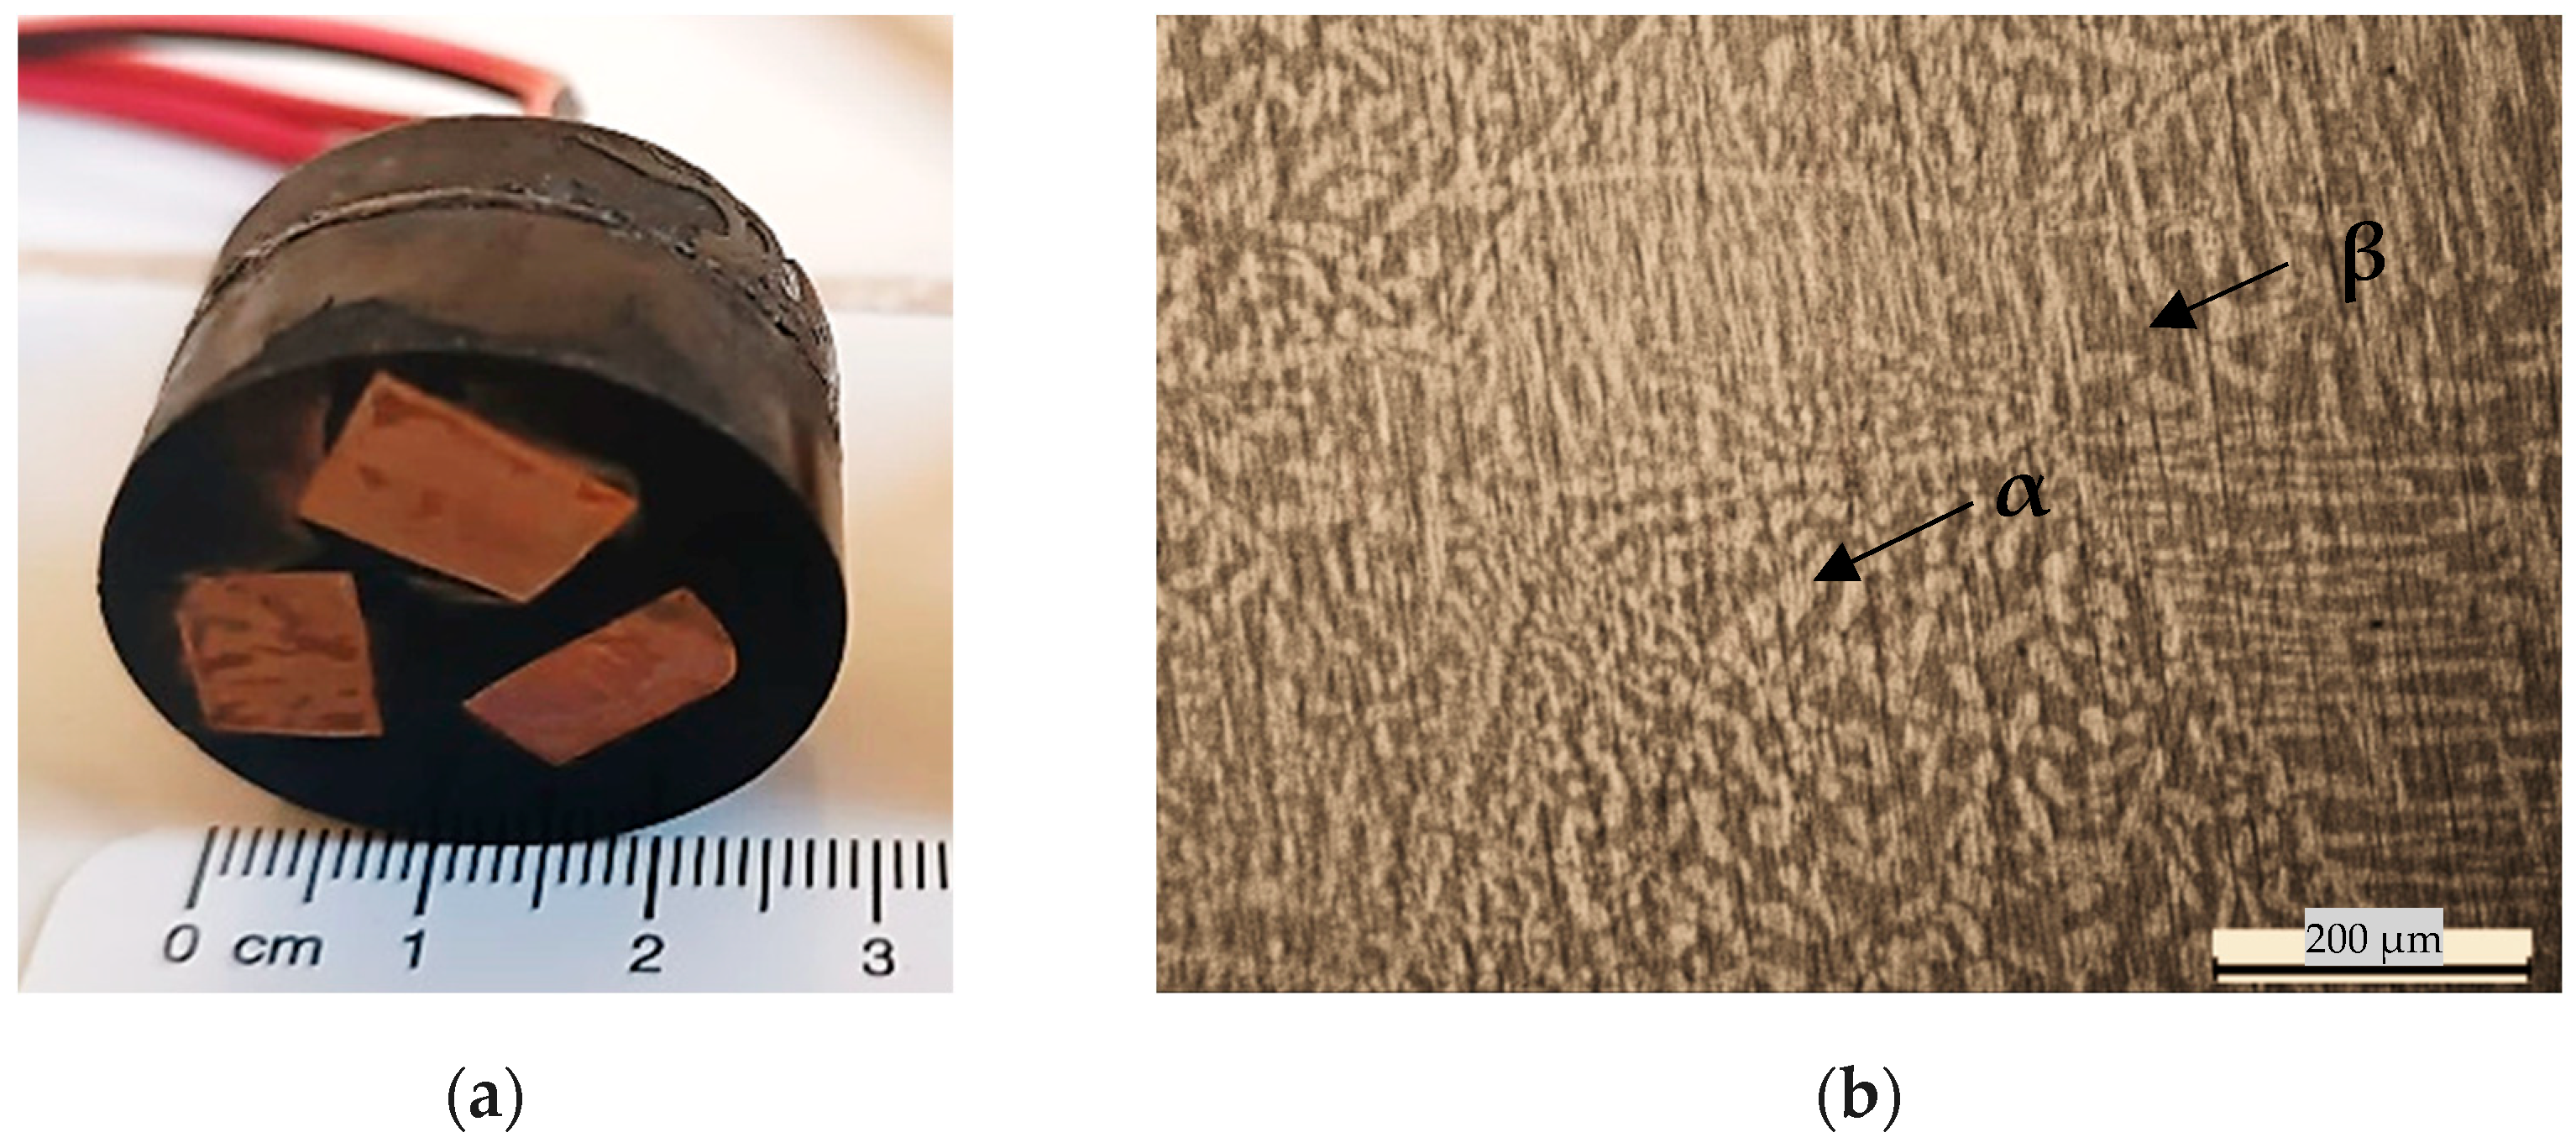
Figure 1. Contacted and embedded specimens for cavitation test (a), microstructure of brass (b).
Cmd 07 00025 g001
Figure 2. Schematic of (a) potentiostatic (PS) test setup [35] and (b) corrosion–cavitation test. WEs (yellow) RE (red) and CE (grey); the welded connections are defined in blue. (a) Adapted from Ref. [35], with modifications.
Cmd 07 00025 g002
Figure 3. PD tests results: (a) ASW, (b) ABW; the red circle indicates the approximate location of the critical potential.
Cmd 07 00025 g003
Figure 4. PS test results after 68 h in ASW (a) and ABW (b); the vertical line in (b) indicates the manual specimens cleaning step.
Cmd 07 00025 g004
Figure 5. Depth of damage after PS tests in ASW and ABW.
Cmd 07 00025 g005
Figure 6. Schematic representation of the proposed hypotheses describing the influence of thioacetamide in ABW on the corrosion behaviour of the brass alloy, including: (a) increase in pH at the metal/electrolyte interface and formation of a low-conductivity sulphide layer (CuS/ZnS); (b) blocking of electrochemically active β-phase sites by the corrosion product layer; and (c) chemical equilibrium within the corrosion product layer involving Cu2O, Zn-rich compounds, and trisodium citrate, as influenced by the applied electrochemical potential. The drawing is based on the mechanisms discussed in the main text and corresponding references [37,38,39,40,41,42,43].
Cmd 07 00025 g006
Figure 7. Corrosion–cavitation tests results in ASW (a) and ABW (b) under PS corrosion control. C = corrosion cycles (white areas), C+C = cavitation–corrosion cycles (shaded areas).
Cmd 07 00025 g007
Figure 8. Surfaces of brass specimens after 5 h of corrosion–cavitation test. (a) ASW −300 mVAg/AgCl. (b) ASW −250 mVAg/AgCl. (c) ASW −200 mVAg/AgCl. (d) ABW −300 mVAg/AgCl. (e) ABW −200 mVAg/AgCl. (f) ABW −150 mVAg/AgCl.
Cmd 07 00025 g008
Figure 9. Cross-section after corrosion–cavitation test at −150 mVAg/AgCl in ABW. (a) Damage caused by the bubbles (red circle) where damage is accelerated due to selective corrosion. The yellow area has been mapped by EDS. (b) Porous and poorly protective layer of corrosion products.
Cmd 07 00025 g009
Figure 10. EDS element mapping of the cross-section of the sample after corrosion–cavitation test (ABW, −150 mVAg/AgCl). (a) SEM image of the analyzed area; (b) Cu; (c) Zn; (d) O; (e) S; (f) Cl.
Cmd 07 00025 g010
Table 1. Chemical composition of the CB773S alloy (% wt).
(% wt)ZnAlNiFePbSnCu
CB773S400.170.010.150.090.03Balance
Table 2. Salts used (marked with an “X”) for the preparation of ASW and ABW electrolytes [34].
Chemical CompoundsASW (1000 mL)ABW (5000 mL)
Sodium chloride, 28.0 g NaClXX
Magnesium chloride, 5.0 g MgCl2 · 6 H2OXX
Calcium chloride, 2.4 g CaCl2 · 6 H2OXX
Magnesium sulphate, 7.0 g MgSO4 · 7 H2OXX
Sodium bicarbonate, 0.20 g NaHCO3X-
Tri-sodiumcitrate, 1.0 g C6H5Na3O7 2 H2O-X
Thioacetamide, 0.50 g CH3CSNH2-X
Table 3. Current densities after PS corrosion tests.
Applied PotentialASW (µA/cm2)ABW (µA/cm2)
−250 mVAg/AgCl80-
−200 mVAg/AgCl60010–20
−150 mVAg/AgCl110060
−100 mVAg/AgCl120090
−50 mVAg/AgCl-200
Table 4. Cross-sections of the specimens after PS corrosion tests. Dark areas correspond to empty material (removed β phase), as well as to β phase in non-affected material, and the clear areas correspond to the α phase.
ASW
−250 mVAg/AgCl−200 mVAg/AgCl−150 mVAg/AgCl−100 mVAg/AgCl
Cmd 07 00025 i001Cmd 07 00025 i002Cmd 07 00025 i003Cmd 07 00025 i004
ABW
−200 mVAg/AgCl−150 mVAg/AgCl−100 mVAg/AgCl−50 mVAg/AgCl
Cmd 07 00025 i005Cmd 07 00025 i006Cmd 07 00025 i007Cmd 07 00025 i008
Disclaimer/Publisher’s Note: The statements, opinions and data contained in all publications are solely those of the individual author(s) and contributor(s) and not of MDPI and/or the editor(s). MDPI and/or the editor(s) disclaim responsibility for any injury to people or property resulting from any ideas, methods, instructions or products referred to in the content.