Abstract
Polymer-bonded Nd–Fe–B and Sm–Fe–N magnets have excellent magnetic properties, but their corrosion resistance is inferior. Polymer-bonded magnets, the binary alloys Nd–Fe and Sm–Fe, and the metals Fe, Nd, and Sm were investigated in electrolytes with a pH range of 1.8 to 12.8. Potentiodynamic polarisation measurements showed that these materials corrode in acidic (H2SO4) and near-neutral (Na2SO4 and NaCl) electrolytes. Iron passivates at pH > 9, but Nd and Sm passivate only in strongly alkaline electrolytes (pH > 12). The alloys and magnets combine the characteristics of the individual metals. Scanning electron microscopy with energy-dispersive X-ray spectroscopy characterised the surface layers before and after electrochemical measurements. The speciation and the depth distribution of elements in the surface layers were analysed using X-ray photoelectron spectroscopy. In the H2SO4, a non-protective layer was formed. In NaCl, the corrosion products were more abundant, consisting of a mixture of oxides, hydroxides, and chlorides, while in NaOH, an oxide/hydroxide layer was formed. The corrosion product layers formed in the H2SO4 and NaCl electrolytes were significantly thicker for the Sm–Fe–N magnet than for the Nd–Fe–B magnet. Understanding the differences and similarities in the electrochemical behaviour of magnets in various electrolytes is essential to overcoming corrosion-related problems.
Keywords:
Nd–Fe; Sm–Fe; Nd–Fe–B; Sm–Fe–N; polymer-bonded magnets; corrosion; potentiodynamic curves; XPS; SEM/EDS 1. Introduction
Iron is integral to the most important permanent magnets based on intermetallic compounds of rare-earth elements, such as neodymium–iron–boron (Nd–Fe–B) and samarium–iron–nitrogen (Sm–Fe–N) magnets [1,2]. These magnets are essential components in many electromechanical devices (including magnetic suspension trains, door locks), as well as in electric and electronic devices (including head actuators for computer hard discs, loudspeakers, headphones, electric motors, electric generators for wind turbines, magnetic resonance imaging scanners, mobile phones, sensors, etc.). There are two principal manufacturing methods: the sintered magnet process and the bonded magnet process [3,4]. Sintered magnets are manufactured using the conventional powder metallurgy route: alloying, milling, pressing, and sintering [3]. The bonded magnets can be produced by either compression or injection moulding [4]. Bonded magnets are advantageous for their ability to create intricate shapes, good corrosion resistance, and suitability for large-scale production. However, they generally have lower magnetic strength compared to sintered magnets.
The Sm–Fe–N magnet has been proven to be a promising alternative to Nd–Fe–B magnets, offering intrinsic magnetic properties that are superior (in terms of Curie temperature and uniaxial anisotropy) or comparable (in terms of spontaneous magnetisation) to those of its famous predecessor. However, Sm–Fe–N magnets cannot challenge Nd2Fe14B because they are unstable at the high temperatures required to process dense sintered magnets. Sm–Fe–N magnetic powders are produced similarly to Nd–Fe–B magnetic powders, except that nitrogen is introduced by heat treatment of rapidly quenched Sm–Fe flakes in a nitrogen atmosphere. Since Sm–Fe–N bulk magnets cannot be produced by the sintering or hot pressing of Sm–Fe–N powder due to its instability above 500 °C, the Sm–Fe–N powders are synthesised using the reduction diffusion method. First, SmCl3, Fe, Ca, and CaH2 are mixed and calcined at 760–860 °C to form Sm–Fe alloy; then, after chemical separation, the Sm–Fe alloy is chalked and nitrided to form the Sm–Fe–N powders [3]. The powders are used in either injection-moulded or compression-moulded- magnets. Compression moulding uses a solid binder and high pressure to compact magnetic powder into a desired shape, resulting in higher magnetic strength but limited to simpler geometries. Injection moulding, on the other hand, mixes magnetic powder with a polymer binder, melts it, and injects it into a mould, allowing for more complex shapes but typically with lower magnetic strength [5]. While Sm–Fe–N magnets offer high magnetic performance, specific applications require materials with greater thermal stability. In such cases, Sm–Co magnets represent a great alternative since they have excellent high-temperature performance and good corrosion resistance. However, the main disadvantages are higher material costs and greater brittleness. The basic process steps for the Sm–Co-based magnets consist of alloy preparation, powder production, particle alignment and pressing, sintering and heat treatment, machining, and finally magnetising [3].
Magnetic materials in automotive and other industries are subjected to harsh environments, including aggressive aqueous and non-aqueous media, as well as changing temperatures and pressures. The corrosion resistance of Nd–Fe–B and Sm–Fe–N magnets is generally poor in most environments, and corrosion degradation may compromise their functional performance. The degradation of rare-earth magnets is related to the alloy composition, microstructure, and the environment to which the material is exposed. Their poor corrosion resistance originates from the multiple-phase morphologies [6,7]. According to the literature [8,9,10,11], Nd–Fe–B sintered magnets are microstructurally composed of three phases: the ferromagnetic matrix phase Φ (Nd2Fe14B), the B-rich phase η (Nd1+ЄFe4B4), and the paramagnetic intergranular Nd-rich phase n (Nd4Fe). The matrix phase is the most significant and occupies most of the magnet’s volume. It is surrounded by the Nd-rich phase, which is distributed along the grain boundary region. The Nd-rich phase is the most electrochemically active and thus governs the corrosion process of Nd–Fe–B sintered magnets. A small amount of the granular B-rich phase disperses randomly inside the Nd-rich phase. Large differences in corrosion potentials exist between the matrix and Nd-rich phases, leading to galvanic coupling [12]. Under electrochemical conditions, the Nd-rich phase is anodic (less noble) against the matrix phase, leading to the corrosion attack at the intergranular region of the matrix phase grains [13,14,15,16,17]. Furthermore, the volumes of the less noble Nd-rich and B-rich phases are significantly smaller than that of the more noble matrix phase, thereby accelerating the corrosion rate [15]. Hence, the preferential dissolution, i.e., corrosion of the Nd- and B-phases, causes the separation of the Nd2Fe14B grains, which leads to the deterioration of the magnetic properties of Nd–Fe–B sintered magnets [15,18,19].
Despite a great need for rare-earth magnets due to the development of green technologies, their corrosion behaviour has not been sufficiently studied. The majority of fundamental studies date back more than a decade [12,13,14,15,16,17,18,19], with only a few recent studies [20]. The corrosion of Nd–Fe–B sintered magnets has been recently reviewed, including fundamental studies as well as those regarding contemporary modifications in magnet production and their potential impact on corrosion resistance [11]. Understanding the electrochemical and corrosion properties of magnets is crucial for developing effective corrosion protection and thereby prolonging their smooth operation in numerous industrial applications. Compared to Nd–Fe–B, the corrosion studies on Sm–Fe–N are even more scarce [21,22,23]. The current status is that the corrosion behaviour of Sm–Fe–N magnets or magnetic powders is underexplored, especially for polymer-bonded magnets. Therefore, our research focused on magnets produced by injecting a mixture of magnetic powder (Nd–Fe–B or Sm–Fe–N) and high-performance polyphenylene sulphide (PPS) polymer into the mould. Due to its high thermal stability and resistance to degradation, PPS is used to manufacture rotors and sensors for automobiles. It can degrade under certain conditions, but not under the conditions to which the samples were exposed during the research in our work. For comparative analysis of magnets, we used metals Fe, Nd, and Sm, as well as binary alloys Nd–Fe and Sm–Fe, specifically manufactured for this task. Hence, this study examined the electrochemical behaviour and corrosion resistance of two magnetic materials, from individual metal components to more complex systems (binary alloys and magnets). Electrochemical measurements were conducted in various electrolytes, spanning a wide pH range, and complemented by surface analysis.
2. Materials and Methods
2.1. Materials, Sample Preparation, and Chemicals
Metals, alloys, and magnets, in the form of discs or plates, were used as substrates. Of the metals, iron (Goodfellow Cambridge Ltd., Huntingdon, UK, purity > 99.8%), neodymium (Alfa Aesar, Ward Hill, MA, USA, purity 99.5%), and samarium (Alfa Aesar, Ward Hill, MA, USA, purity 99.5%) were used. The Nd–Fe alloy was made by melt spinning by the group of Prof. Daniel Crespo at the Polytechnic University of Catalonia, Spain. The Sm–Fe alloy was purchased from the NingDe XingYu Technology Co., Ltd., Ningde City, Fujian, China. The polymer-bonded Nd–Fe–B and Sm–Fe–N magnets were produced by Kolektor d.d., Slovenia, using an injection-moulding process. The magnetic powder in these magnets was 400 μm (40 mesh) in size. The magnets contained a polymer binder, polyphenylene sulphide (PPS), at a volume fraction of 40%. To eliminate the additional influence of the magnetic field, the magnetic materials used in this study were not magnetised.
The surface preparation for microstructural, chemical, and electrochemical analyses included water-grinding the samples using P320- to P4000-grit SiC papers (Struers, Ballerup, Denmark). After grinding, the samples were rinsed with Milli-Q water, cleaned with absolute ethanol (≥99.9%, Carlo Erba Reagents, Cornaredo, Milan, Italy) in an ultrasonic bath for 2 min, rinsed again with Milli-Q water, and dried under an air stream.
Six electrolytes with different pH values were used: 0.01 M H2SO4 (pH = 1.8), 0.1 M NaCl (pH = 5.6), 0.001 M Na2SO4 (pH = 6.6), borate buffer (pH = 9.3), 0.0001 M NaOH (pH = 9.9), and 0.1 M NaOH (pH = 12.8). The electrolytes were prepared from analytical grade reagents: H2SO4 (Carlo Erba Reagents, purity 96%), NaCl (Fisher Chemical, Pittsburgh, PA, USA, purity ≥ 99.5%), Na2SO4 (Acros organics, Geel, Belgium, purity ≥ 99.0%), borate buffer (NaOH (Labochem International, Athens, Greece, p.A.) and Na2B4O7·10H2O (Honeywell Fluka, Charlotte, NC, USA, purity ≥ 99.0%), and NaOH (Labochem International, p.A.). The pH values of the electrolytes were measured using a pH meter 827 pH Lab (Metrohm AG, Herisau, Switzerland), equipped with a Metrohm Unitrode® electrode (Pt1000, c(KCl) = 3 M).
The water used for rinsing the samples and preparing the electrolytes was supplied by a Milli-Q® Direct Water Purification System (Merck Millipore, Billerica, MA, USA), with a water resistivity of ≥18.2 MΩ∙cm at 25 °C.
2.2. Electrochemical Measurements
The electrochemical and corrosion properties of the materials were investigated by recording potentiodynamic polarisation (PDP) curves, carried out using a Multi Autolab/M204 potentiostat/galvanostat (Metrohm Autolab, Utrecht, The Netherlands), coupled to a computer and controlled by Nova 2.1.4 software (Metrohm Autolab, Utrecht, The Netherlands). All electrochemical measurements were performed at room temperature in a custom-made three-electrode cell with a volume of 250 mL. The sample was positioned at the side of the cell and pressed against a rubber band. The contact on the other side was via a copper wire. A graphite rod was used as the counter electrode and an Ag/AgClsat. KCl–AgCl (EAg/AgCl = 0.197 V vs. standard hydrogen electrode) as the reference electrode. All potentials in this article are given with respect to the Ag/AgCl electrode.
Before the PDP measurements, the open circuit potential (OCP) was monitored for 1 h. The curves were recorded from −0.25 V to OCP up to different potentials, depending on the investigated material (the minimum value was 0.8 V, and the maximum value was 3 V). The scan rate was 1 mV/s. All measurements were repeated at least three times to ensure reproducibility, and representative PDP curves are presented. Electrochemical parameters, i.e., the corrosion current density (jcorr) and the corrosion potential (Ecorr), were determined by the Tafel extrapolation method using Nova 2.1.4 software. The assessment was conducted according to the rule, which specifies that the linear Tafel region should span at least one order of magnitude in current density and preferably two decades for more accurate extrapolation [24]. When that was not possible, the jcorr was determined as the intersection between the line connecting the linear part of the cathodic curve and the line passing through the corrosion potential. The primary passivation potential (Epp) refers to the beginning of the passive range, while the breakdown potential (Ebr) represents the potential at which the current density abruptly increases, denoting the end of the passive range. The ΔEpass is defined as the range between the primary passivation potential (Epp) and the breakdown potential (Ebr).
2.3. Microstructural and Chemical Characterisation
X-ray diffraction (XRD) was used for crystallographic analysis of the Nd–Fe and Sm–Fe alloys, as well as the Nd–Fe–B and Sm–Fe–N magnets, and to determine their phase composition. Experiments were performed on an X’Pert PRO MPD diffractometer (Malvern Panalytical B.V., Almelo, The Netherlands) using Cu Kα1 radiation with a wavelength of 1.5406 Å. The recorded diffraction angle range was between 15° and 90° (2ϴ), with a step size of 0.033° (2ϴ) and a step time of 400 s/step. The diffractograms were analysed using High Score Plus 4.9 software (Malvern Panalytical B.V., The Netherlands).
Scanning electron microscopy and energy-dispersive X-ray spectroscopy (SEM/EDS) analysis were used to obtain information on the composition and topography of the Nd–Fe and Sm–Fe alloys, as well as Nd–Fe–B and Sm–Fe–N magnets. A Jeol JSM-7600F, JEOL Ltd., Tokyo, Japan, scanning electron microscope, equipped with an INCA Oxford 350 (SDD 20 mm2) EDX spectrometer (Oxford Instruments plc, Abingdon, UK), was used. The SEM images were recorded in COMPO mode (backscattered electron imaging). The EDS analysis was performed in the point mode at several spots on the sample using a voltage of 15 kV. The composition is expressed as atomic percentages (at. %) as the average of several measurements taken at each characteristic spot. In EDS, detection limits are typically considered to be ≥1% for low atomic number elements (F to Be) and ≥0.1% (1000 ppm) for higher atomic number elements. With standardless semi-quantitative EDS, which is most commonly used, relative errors may range from ±2% to ±5% for major components. Accordingly, the concentrations were rounded to 1 at. %. Before the SEM/EDS analysis, the Nd–Fe and Sm–Fe alloys were prepared by etching for 5 min with 3% Nital (a mixture of nitric acid and ethanol), whereas the Nd–Fe–B and Sm–Fe–N magnets were prepared by grinding.
X-ray photoelectron spectroscopy (XPS) was used to analyse the surface chemistry and determine the elemental composition of the polymer-bonded Nd–Fe–B and Sm–Fe–N magnets. The XPS analysis was conducted using a PHI-TFA XPS spectrometer (Physical Electronics, Inc. (PHI), Chanhassen, MN, USA). The analysed area of the samples was 400 µm, and the analysed depth was about 2–3 nm. The XPS spectrometer was operated at an energy resolution of 0.6 eV, measured on the Ag 3d5/2 peak. The sensitivity of the XPS method was about 0.5 at. %. The sample surface was excited by X-ray radiation provided by a monochromatic Al Kα source with a photon energy of 1486.6 eV. The survey spectra were taken in the binding energy range from 1200 eV to 0 eV, with an analyser pass energy of 187 eV. The obtained XPS spectra were analysed using MultiPak 9.9 software (Physical Electronics, Inc. (PHI), Chanhassen, MN, USA). The atomic concentration of an element in the sample, Cx, was calculated using Equation (1)
where Ix is the number of photoelectrons per second for the spectral peak corresponding to element x, and is its atomic sensitivity factor; and Ii and represent the number of photoelectrons per second and atomic sensitivity factor, respectively, for all other elements i present in the sample. The peak area sensitivity factors were provided by MultiPak software. The high-resolution spectra were taken with an analyser pass energy of 58 eV. The binding energy positions were aligned relative to the C 1s peak at 284.8 eV, characteristic of the C–C/C–H bond in adventitious surface carbon contamination. The spectra were fitted with Gauss–Lorentz functions, and the Shirley function was used for the background removal. The binding energies of elements for different oxidation states were taken from the binding energy tables in the reference [25]. Additionally, argon ion etching was performed at a sputtering rate of 1.0 nm/min, as determined by a standard of known thickness. This provided information on the elemental depth distribution within the surface layer. We did not attempt to determine the exact oxide layer thickness based on the depth profile due to the high concentration of the organic phase, which could affect the results. Instead, the thickness of the oxide surface layer (either the passive film or the layer of corrosion products) was estimated from the obtained depth profile at the intersection of the O 1s and Fe 2p curves, considering the sputtering rate determined regarding the reference standard.
For the Nd–Fe–B and Sm–Fe–N magnets, SEM/EDS and XPS analyses were also performed after the potentiodynamic polarisation measurements up to 0.4 V in 0.01 M H2SO4, 0.1 M NaCl, and 0.1 M NaOH electrolytes. After the measurements, the samples were dried under an air stream.
3. Results and Discussion
3.1. Microstructural Characterisation
X-ray diffraction was used to investigate the crystal structure and identify the crystalline phases in the alloys and magnets. The recorded diffractograms indicated poor crystallinity in all samples. The comparison for all four materials is presented in Figure 1, while the individual XRD spectra with more detailed notions are presented in Figure S1. For the Nd–Fe alloy, the possible phases were Fe (ICDD 04-014-0171) and NdFe (ICDD 04-003-3013) in a ratio of 37.3:62.7. An additional phase was likely present but could not be identified. According to the Rietveld analysis, the lattice parameter of the Fe phase was a = 2.868 Å (cubic I3m space group), while the lattice parameters of the NdFe phase were a = 8.595 Å and c = 12.490 Å (trigonal space group). The XRD analysis of the Nd–Fe–B magnet was not meaningful due to the low intensity of the peaks, which indicated poor crystallinity. However, the comparison with the Nd–Fe alloy showed that the peaks were similar in position but lower in intensity. The peaks for the Fe phase (marked with asterisks in Figure 1) practically disappeared in the Nd–Fe–B magnet. For the Sm–Fe alloy, the possible phases were SmTiFe11 and traces of Fe (or their isostructural analogues) in a ratio of 96.2:3.8. According to the Rietveld analysis, the lattice parameters of the SmTiFe11 phase were a = 8.373 Å and c = 4.786 Å (tetragonal I4/mmm space group) and the lattice parameter of the Fe phase was a = 2.872 Å (cubic I3m space group). As for the Nd–Fe alloy, some other phases were possible in the Sm–Fe alloy, although they could not be identified. The Sm–Fe–N magnet differed in the position of its peaks compared to the Sm–Fe alloy, which may indicate a phase change. A possible phase was SmMoFeC (ICDD 04-017-5502) (or its isostructural analogue), and the lattice parameters, according to the Rietveld analysis, were a = 5.011 Å and c = 4.217 Å (hexagonal P6/mmm space group).
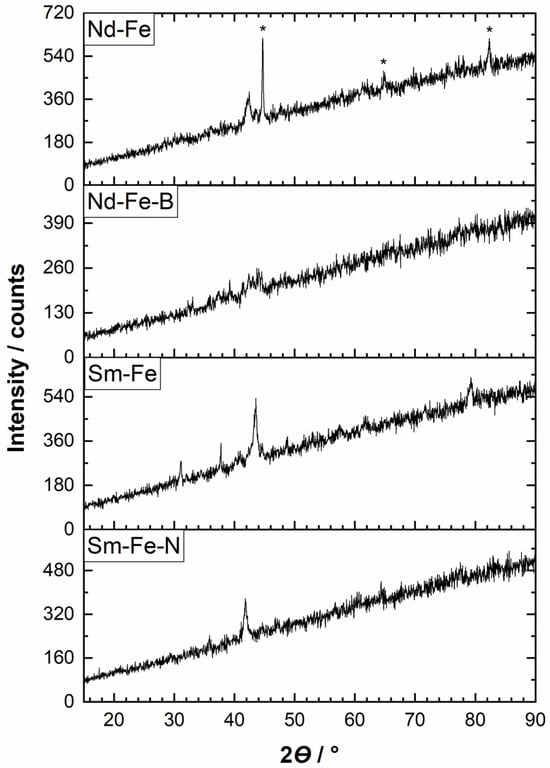
Figure 1.
XRD diffractograms of the Nd–Fe and Sm–Fe alloys, and the Nd–Fe–B and Sm–Fe–N polymer-bonded magnets. On the graph, only peaks for the Fe phase are denoted. For details, please refer to the Supplementary Material (Figure S1).
The SEM images of the Nd–Fe and Sm–Fe alloys are presented in Figure 2a,b, along with the corresponding EDS analysis in Table 1. Both alloys had three phases (white, grey, and black). According to the EDS analysis, the Nd–Fe alloy consisted of a black phase of pure Fe (spectrum 1) and two NdFe phases (white and grey areas) with a higher iron content than neodymium. The grey phase (spectrum 2) contained almost 90 at. % Fe, while the white phase (spectrum 3) included 70 at. % Fe and 30 at. % Nd. Similarly, the Sm–Fe alloy contained two SmFe phases (grey and white areas, spectra 5 and 6) with a higher iron content than samarium and one phase with almost pure Fe (black areas, spectrum 4). Carbon in the Sm–Fe alloy is regarded as an impurity from the material production. Data obtained from the EDS analysis are consistent with the XRD results and confirm that the Nd–Fe and Sm–Fe alloys consist of a pure Fe phase and another phase (or more of them), which are identified as NdFe and SmFe, respectively.
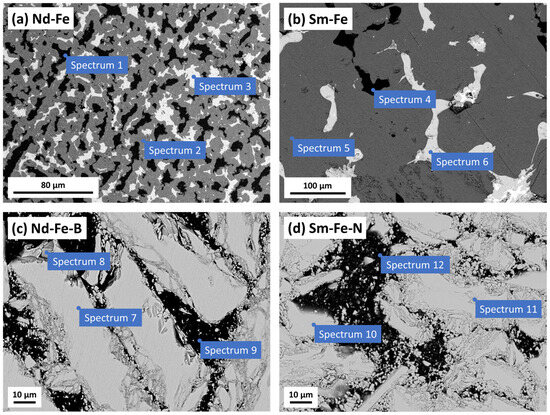
Figure 2.
SEM images of (a) Nd–Fe and (b) Sm–Fe alloys, and (c) Nd–Fe–B and (d) Sm–Fe–N polymer-bonded magnets recorded in COMPO mode. The Nd–Fe and Sm–Fe alloys were prepared by etching for 5 min with 3% Nital (a mixture of nitric acid and ethanol), whereas the Nd–Fe–B and Sm–Fe–N magnets were prepared by grinding. The results of the EDS analyses at enumerated sites are presented in Table 1.

The SEM/EDS analyses of the Nd–Fe–B and Sm–Fe–N polymer-bonded magnets are shown in Figure 2c,d and Table 1, respectively. In the SEM images, the magnetic powder is white, while the PPS polymer is black. The Nd–Fe–B magnetic powder (spectrum 7) mainly consisted of Fe and Nd, with small amounts of cobalt (Co) added during production to enhance its properties [26]. Boron cannot be detected under the conditions of the EDS analysis performed (15 kV). Some areas of the magnetic powder had oxidised (spectrum 8), likely due to the inaccessibility of certain regions (edges or holes in the powder) during grinding, which resulted in a higher oxygen content due to oxidation in the air. The PPS polymer (spectrum 9) consists mainly of carbon (C) and sulphur (S). The Sm–Fe–N magnetic powder contained Fe, Sm, N, and Co (spectrum 10) (Figure 2d). Similarly to the Nd–Fe–B magnet, some areas of the magnetic powder had oxidised (spectrum 11), mainly in the parts where the magnetic powder was crushed during grinding or production. The PPS polymer is composed of C and S (spectrum 12, Table 1).
The deconvoluted high-resolution XPS spectra recorded at the surface of the Nd–Fe–B magnet (reference sample) are shown in Figure S2 and will be discussed later. Herein, the depth profile of the Nd–Fe–B magnet, obtained by Ar+ sputtering, is presented in Figure 3a. Carbon dominated at the surface, accounting for over 50 at. % due to the presence of adventitious C, but also the PPS polymer. The surface concentration of oxygen was also high, over 30 at. %, followed by Fe and other elements present in smaller concentrations. During sputtering, the C concentration reached a minimum of approximately 1 nm but then increased to ≈50 at. % and remained constant, indicating the carbon content in the polymer matrix of the magnet bulk. The Fe content progressively increased, while that of oxygen decreased with the sputtering time, indicating the progressive removal of the surface oxide layer. The Nd content reached a maximum concentration of approximately 10 at. % around 2 nm and then decreased slightly within the magnet bulk. The S concentration, associated with the PPS polymer, was constant from the surface to the bulk, accounting for ≈5 at. %. The estimated thickness of the air-formed film from the depth profile was around 2 nm.
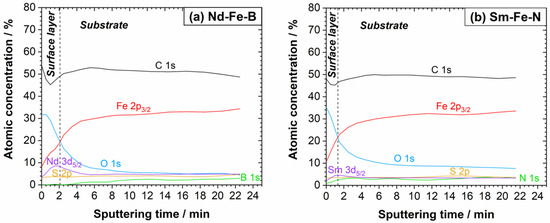
Figure 3.
XPS depth profiles of (a) Nd–Fe–B and (b) Sm–Fe–N polymer-bonded magnets (reference samples). The sputtering rate was 1.0 nm/min.
The deconvoluted high-resolution XPS spectra of the Sm–Fe–N magnet (reference sample) are shown in Figure S3 and will be discussed later. The depth profile obtained by ion sputtering is presented in Figure 3b. Similarly to the Nd–Fe–B magnet (Figure 3a), C and O dominated the surface concentration, followed by Fe, Sm, and other elements. All elements followed a similar trend to that observed for the Nd–Fe–B magnet. The thickness of the air-formed layer estimated from the depth profile is less than 2 nanometres.
3.2. Electrochemical Behaviour and Surface Analysis of the Nd–Fe–B
3.2.1. Potentiodynamic Polarisation Measurements for Nd–Fe–B
The electrochemical behaviour of Fe and Nd metals, Nd–Fe alloy, and a polymer-bonded Nd–Fe–B magnet was examined by PDP measurements in six electrolytes at pH values ranging from 1.8 to 12.8 at room temperature (Figure 4). These electrolytes were chosen to cover a wide pH range, as bonded magnets have diverse uses and may come into contact with various ions (chloride, sulphate, hydroxyl) during transport, storage or application.
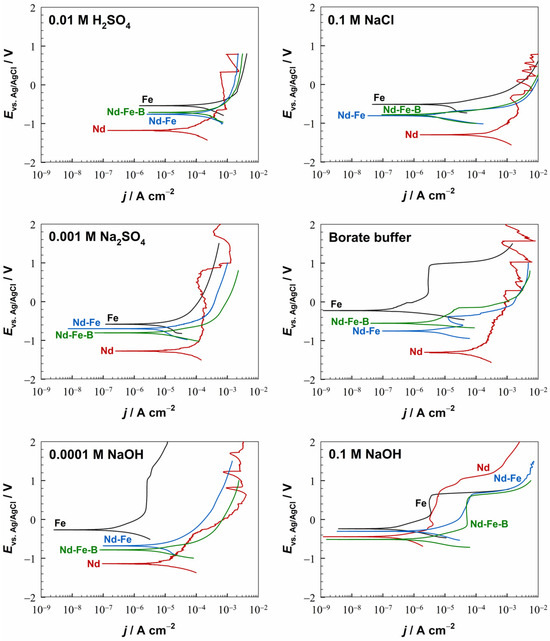
Figure 4.
Potentiodynamic polarisation curves of the Fe, Nd, Nd–Fe, and Nd–Fe–B materials in different electrolytes. The representative PDP curves from several repeated measurements conducted under identical conditions are shown. The samples were stabilised for one hour at OCP before the measurements. dE/dt = 1 mV/s, room temperature.
Iron corrodes in acidic (dilute H2SO4) and near-neutral (Na2SO4 and NaCl) electrolytes. As the electrolyte pH increased, the current densities decreased. The Ecorr values were between −0.6 V and −0.5 V. The electrochemical response of Fe in sulphuric acid is dependent on the acid concentration, which is caused by different corrosion mechanisms in concentrated and dilute solutions [27,28]. In concentrated sulphuric acid (0.5 M), iron passivates due to the formation of FeO and Fe3O4, which are formed only in the presence of water [29]. However, in dilute sulphuric acid, which is the case in this study, the formation of oxide and sulphate films does not ensure the passivation, and iron corrodes [30], as evidenced by the shape of the anodic part of the PDP curve (Figure 4). The anodic reaction is the iron dissolution with the formation of ferrous ions (Equation (2)). The cathodic reaction is the reduction of water molecules with the production of hydrogen gas (Equation (3)):
Fe → Fe2+ + 2e−,
2H2O + 2e− → H2 + 2OH−.
Due to the presence of SO42− ions in the solution, the formation of FeSO4 is likely to occur; however, it is not protective, as no active–passive transition was observed (Figure 4).
When iron is exposed to NaCl electrolyte, the corrosion mechanism is somewhat different. It has been reported [31] that the anodic reaction involves the dissolution of iron into ferrous ions (Equation (2)), followed by further oxidation to ferric ions (Equation (4)):
Fe2+ → Fe3+ + e−.
The cathodic reaction for iron in an aerated near-neutral solution corresponds to the reduction of oxygen (Equation (5)):
O2 + 2H2O + 4e− → 4OH−.
Under these conditions, an oxide film is formed on the iron surface. It has been confirmed that iron can develop up to nine iron oxide phases on its surface [32]. One of the possible oxide phases that might form under these conditions is ferrous hydroxide,
Fe(OH)2 (Equation (6)), which can be easily oxidised by oxygen dissolved in the solution to form ferric hydroxide, Fe(OH)3 (Equation (7)). Eventually, a hydrated ferric oxide, Fe2O3·H2O, forms–and possibly Fe3O4 [33]:
Fe + 1/2O2 + H2O → Fe(OH)2,
2Fe(OH)2 + 1/2O2 + H2O → 2Fe(OH)3.
The formed oxide film temporarily protects the iron against further corrosion. However, this film is porous, non-homogeneous, and loose, causing it to dissolve under the attack of chloride ions in the solution and at increased anodic potentials [34]. This leads to the continuous dissolution of iron, which can be described by Equations (8)–(11) [35,36]:
Fe(s) + 2Cl−(aq) ⇌ FeCl2(s) + 2e−,
FeCl2(s) ⇌ FeCl2(interface) → FeCl2(aq),
FeCl2(s) + Cl−(aq) ⇌ FeCl3(s) + e−,
FeCl3(s) ⇌ FeCl3(interface) → FeCl3(aq).
According to these reactions, a porous mixed film of ferrous chloride, FeCl2, and ferric chloride, FeCl3, is formed on the iron surface due to the precipitation of FeCl2 and FeCl3. The interface concentrations of FeCl2 and FeCl3 are at saturation, while the bulk concentrations (aq) of FeCl2 and FeCl3 are zero. Due to concentration gradients and applied potential, the FeCl2 and FeCl3 species diffuse from the interface into the bulk solution, leading to both uniform and pitting corrosion of iron [35,36].
At pH 6.6 (Na2SO4 electrolyte), iron also corrodes following Equation (2) [37]. The cathodic process is represented by Equation (5). Compared to measurements in lower pH, the current densities were smaller, while the Ecorr was similar.
Under alkaline conditions (borate buffer and NaOH), iron passivates [38,39]. During the initial stages of passivation, a film of ferrous hydroxide is formed on the iron surface (Equation (6)). The oxygen dissolved in the solution oxidises ferrous hydroxide to ferric compounds, which are suggested to be oxides having the cubic structure of Fe3O4, γ-Fe2O3, or an intermediate product [40]. A model based on a passive film with a layered structure was proposed, where the Fe(III)/Fe(II) ratio decreases with increasing film depth, meaning that Fe(III) oxides dominate the outer layers of the passive film [41]. The Fe(II) oxidation state is associated with FeO and Fe3O4 oxides, whereas the Fe(III) oxidation state corresponds to α-Fe2O3, γ-Fe2O3, α-FeOOH, β-FeOOH, or γ-FeOOH oxides and oxyhydroxides [41,42]. A passive film in borate buffer is typically represented as a thin film of Fe(II) and Fe(III) oxides, having a crystalline or amorphous structure with varying water content [43]. The establishment of the passive region (ΔEpass) reflects the formation of the passive film under these conditions (Figure 4). The Ebr values in the borate buffer and 0.0001 M NaOH electrolytes were similar, measuring 900 mV and 1 V, respectively, with a ΔEpass width of 800 mV. In the 0.1 M NaOH, the passive region was narrower (500 mV), and the Ebr was also at slightly lower values. As a result of passivation under alkaline conditions (pH > 9), the current densities were reduced by at least two orders of magnitude relative to the values in acidic and near-neutral electrolytes. At the same time, the Ecorr values were shifted more positively, from −0.6 V to −0.2 V.
The electrochemical behaviour of Nd is quite different from the behaviour of Fe. Depending on the pH, the current densities for the Nd were several orders of magnitude higher than those for the Fe (except in the H2SO4 and 0.1 M NaOH electrolytes), indicating higher corrosion activity of Nd. The Ecorr values were shifted to less noble potentials in all electrolytes, additionally showing poor corrosion resistance of Nd in aqueous solutions.
Under acidic and near-neutral conditions, and even at pH 9.3, Nd dissolves actively [44], with the anodic reaction being the dissolution of Nd into Nd3+ ions (Equation (12)):
Nd → Nd3+ + 3e−.
The cathodic reaction in dilute H2SO4 is the reduction of water (Equation (3)), whereas the oxygen reduction occurs in Na2SO4 and NaCl electrolytes (Equation (5)). As already observed by other authors [44], we have also detected an abnormal hydrogen evolution during anodic polarisation when neodymium is actively dissolving. Interestingly, the behaviour of Nd in the H2SO4 and Na2SO4 electrolytes deviated from the other materials because it showed lower current density values than in the NaCl electrolyte. The possible reason might be the formation of an inhibiting Nd2(SO4)3 surface film, which is poorly soluble in water and can behave as a pseudo-passive layer. In addition, due to the cathodic reactions, the pH increases near the surface, and a hydroxide layer can also form, providing temporary surface protection [44]. However, with anodic polarisation, the formed film becomes unstable and the current density increases.
The Nd in the borate buffer and 0.0001 M NaOH electrolytes did not exhibit a sharp transition to passivation, unlike the Fe, but the current densities were smaller than at lower pH. The current densities decreased as the electrolyte pH increased from pH 6.6 to pH 12.8. However, only in strongly alkaline media, neodymium exhibits passive behaviour due to the formation of Nd(OH)3 and/or Nd2O3 [44], as shown in Equations (13) and (14):
Nd3+ + 3OH− → Nd(OH)3,
2Nd(OH)3 → Nd2O3 + 3H2O.
Only in a strongly alkaline medium (0.1 M NaOH) was the behaviour of Nd and Fe similar. The width of the passive region was somewhat wider than for Fe, at 800 mV, while the Ebr was about 200 mV higher than in the case of Fe, reaching 800 mV.
In all electrolytes, apart from the 0.1 M NaOH, the PDP curves were scattered over the entire anodic region. This indicates a significant surface reactivity, where a passive film in alkaline solutions and a temporary surface layer in acidic and near-neutral solutions dissolve and reform during anodic polarisation [44]. Additionally, frequent sudden increases in current densities occurred at higher potentials, which can be attributed to the corrosion damage of the material [44]. Indeed, mechanical degradation accompanied by the formation of flaky corrosion products and the detachment of neodymium particles from the surface was observed. This process exposes the bare neodymium surface to the electrolyte, leading to further corrosion.
The Nd–Fe alloy and the Nd–Fe–B magnet show similar electrochemical behaviour to each other and a mixed behaviour of the individual metals, i.e., Fe and Nd (Figure 4). Their corrosive nature originates from the multiple-phase microstructure (Figure 2). The corrosion behaviour of Nd–Fe alloys has not been studied so far. XRD (Figure 1) and SEM/EDS (Figure 2a) analyses showed that three phases are present in the Nd–Fe alloy (two NdFe phases, which are Fe-rich, and one mainly Fe phase). This explains why it behaves very similarly to Fe but still shows some mixed properties of Fe and Nd (Figure 4). The Nd–Fe alloy and the Nd–Fe–B magnet corrode in acidic and near-neutral electrolytes (H2SO4, NaCl, Na2SO4), while passivation occurs in alkaline electrolytes (borate buffer, NaOH). In all electrolytes, the Ecorr values for the Nd–Fe alloy and the Nd–Fe–B magnet were shifted toward more negative values relative to Fe and more positive values relative to Nd, displaying a mixed behaviour that more closely resembled that of Fe than Nd. Figure 5a compiles the jcorr values of Fe, Nd, Nd–Fe, and Nd–Fe–B in various electrolytes. The Nd–Fe and Nd–Fe–B alloys exhibited similar jcorr values in acidic and near-neutral media compared to Fe, but higher values in alkaline media, where Fe was strongly passivated. Nd shows higher jcorr values in all electrolytes except in highly acidic and alkaline ones. Interestingly, the Nd–Fe and Nd–Fe–B showed an active–passive transition in the borate buffer and the 0.1 M NaOH, but passivation was not observed in the 0.0001 M NaOH, as it was for the Fe and Nd metals (Figure 4). In the 0.1 M NaOH, the width of the passive region for the Nd–Fe and Nd–Fe–B was 600 mV and 800 mV, respectively. For both materials, the Ebr was around 600 mV, similar to that for the Fe in this electrolyte, but with higher current densities in the passive range than that of Fe and Nd.
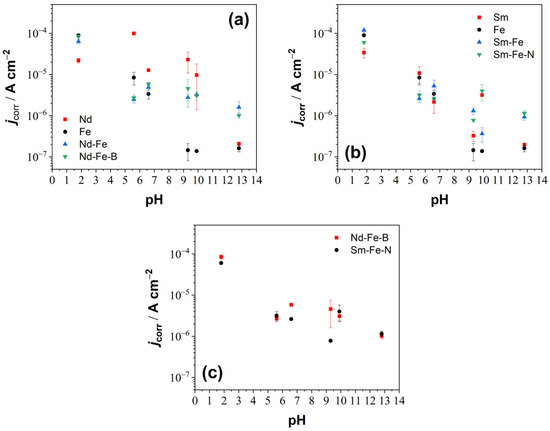
Figure 5.
Graphs showing corrosion current density (jcorr) as a function of pH for the (a) Fe, Nd, Nd–Fe, and Nd–Fe–B, (b) Fe, Sm, Sm–Fe, and Sm–Fe–N and (c) Nd–Fe–B and Sm–Fe–N. The values were deduced from the potentiodynamic polarisation measurements and represent averages of several measurements, with the corresponding standard deviations shown as error bars.
3.2.2. SEM/EDS Analysis for Nd–Fe–B
The polymer-bonded Nd–Fe–B magnet was studied after the electrochemical measurements in different corrosive media using SEM/EDS analysis to visualise and characterise the microstructural changes caused by corrosion. The SEM images are displayed in Figure 6, and the corresponding EDS analyses are given in Table 2.
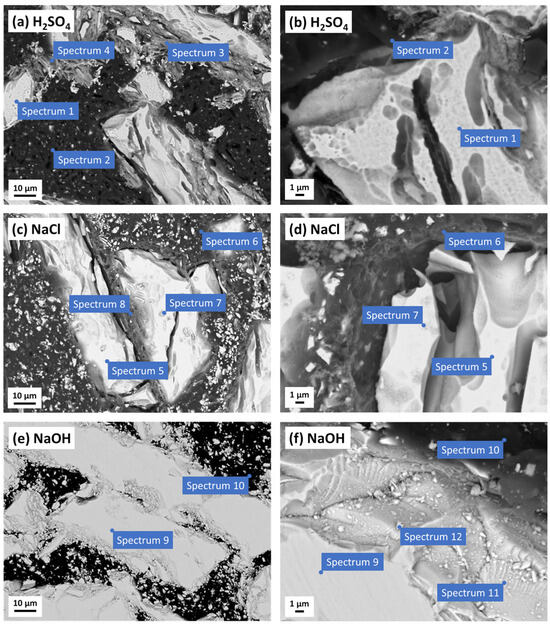
Figure 6.
SEM images (COMPO mode) of the polymer-bonded Nd–Fe–B magnet after the potentiodynamic polarisation measurements in (a,b) 0.01 M H2SO4, (c,d) 0.1 M NaCl, and (e,f) 0.1 M NaOH electrolytes. The corresponding EDS analyses are presented in Table 2.

Table 2.
Complementary EDS analyses to the SEM images (Figure 6) of the polymer-bonded Nd–Fe–B magnet after the potentiodynamic polarisation measurements in various electrolytes. The values given represent the averages of several measurements taken at each characteristic spot.
The sample was corroded after the PDP measurements in the H2SO4 (Figure 6a,b). The surface of the magnetic powder was etched, resulting in larger and smaller cracks (for comparison, refer to the non-corroded magnetic powder in Figure 2c). The magnetic powder contained an increased oxygen content, which indicates oxidation (spectrum 1). Changes in the structure were also visible along the edges of the magnetic powder. These areas appeared to have a mixture of corrosion products (spectra 3 and 4), containing elements originating from the PPS polymer (C and S) and the magnetic powder (Fe, Nd, and Co), with reduced Fe and Nd content and an increased O content compared to the non-corroded magnetic powder. Considering these observations, along with the electrochemical measurements, the possible corrosion products are Fe and/or Nd oxides/hydroxides and sulphates. The PPS polymer appeared to be unchanged (spectrum 2).
After the PDP measurements in the NaCl, the sample was also quite corroded (Figure 6c,d). The EDS analysis confirmed the presence of oxygen and chloride originating from corrosion products. Two types of corrosion products were identified, differing in morphology, chemical composition, and the areas where they occurred. One type (spectrum 7) had higher amounts of Cl, O, Fe, and Nd and most likely originated from the corrosion of the magnetic powder (spectrum 5). This is probably due to the formation of Fe and/or Nd oxides/hydroxides and chlorides at the surface, which supports the proposed corrosion products based on the electrochemical measurements. The other type of corrosion product (spectrum 8) contained S and a higher amount of C, probably resulting from the mixing of the corrosion product with the PPS polymer (spectrum 6). As in the sulfuric acid (Figure 6a,b), the surface of the magnetic powder in the NaCl was etched and cracked (Figure 6c,d), and the EDS analysis showed that it was oxidised (spectrum 5).
The SEM/EDS analyses after the PDP measurements in NaOH are shown in Figure 6e,f and Table 2, respectively. Under alkaline conditions, the Nd–Fe–B magnet was passivated (Figure 4). The SEM images confirmed this, as there were no visible signs of corrosion. The EDS analysis did not detect oxygen in some areas of the magnetic powder (spectrum 9). This is likely because the passive film is too thin to be detected by this method; however, it is clear that there was no corrosion. However, some regions, mostly along the edges of the magnetic powder, showed the presence of oxygen (spectrum 11), indicating the formation of Fe and/or Nd oxides/hydroxides passive films. In addition, small agglomerates containing Fe, O, and C were also present (spectrum 12). The composition of the PPS polymer, as shown in Table 2, spectrum 10, indicates that there was no change in the composition.
3.2.3. XPS Analysis for Nd–Fe–B
The XPS high-resolution spectra of Fe 2p, Nd 3d5/2, O 1s, and S 2p, as well as B 1s, C 1s, and Cl 2p, recorded at the surface of the Nd–Fe–B magnets after the PDP experiments (Figure 4), are presented in Figure 7 and Figure 8, respectively. For comparison, spectra recorded on the reference sample are also provided (recorded immediately after grinding). Vertical dashed lines denote the positions of different reference species, whereas the deconvoluted spectra are shown in Figure S2.
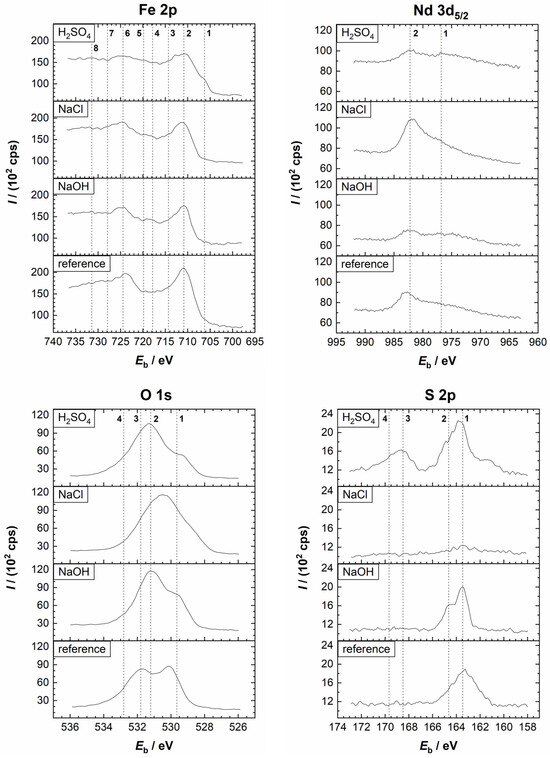
Figure 7.
Comparison of the high-resolution XPS spectra of Fe 2p, Nd 3d5/2, O 1s, and S 2p from the Nd–Fe–B polymer-bonded magnet before (reference sample) and after the potentiodynamic polarisation measurements in the 0.01 M H2SO4, 0.1 M NaCl, and 0.1 M NaOH electrolytes at room temperature. Vertical lines represent the positions of the reference compounds. (Fe 2p) 1, 5: Fe(0); 2, 6: Fe2+/Fe3+; 3, 4, 7, 8: satellites. (Nd 3d5/2) 1: O KLL; 2: Nd2O3. (O 1s) 1: O2−; 2: OH−; 3: H2O; 4: SO42−. (S 2p) 1, 2: S2−; 3, 4: SO42−.
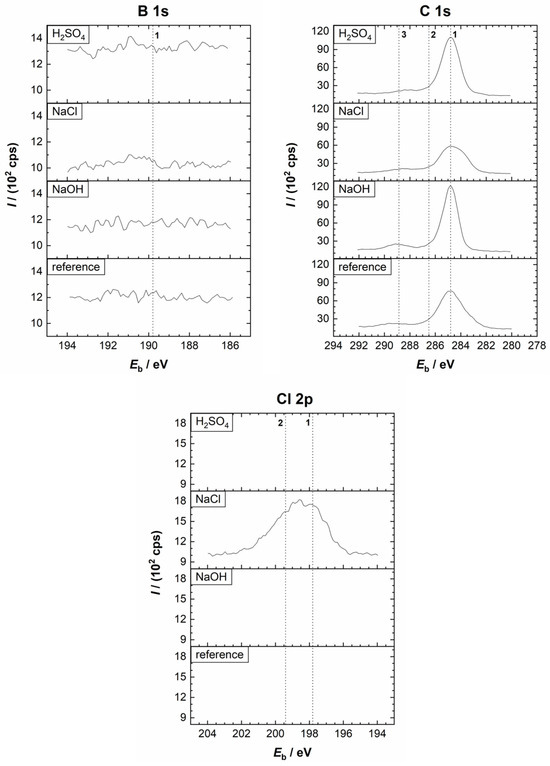
Figure 8.
Comparison of the high-resolution XPS spectra of B 1s, C 1s, and Cl 2p from the Nd–Fe–B polymer-bonded magnet before (reference sample) and after the potentiodynamic polarisation measurements in the 0.01 M H2SO4, 0.1 M NaCl, and 0.1 M NaOH electrolytes at room temperature. Vertical lines represent the positions of the reference compounds. (B 1s) 1: boride. (C 1s) 1: C–C/C–H; 2: C–S; 3: C–O. (Cl 2p) 1, 2: Cl−.
First, the spectra of the reference sample are discussed. The Fe 2p3/2 spectrum of the reference sample identified FeO (Eb = 709.4 eV), Fe2O3 (Eb = 710.7 eV), and FeOOH (Eb = 711.5 eV), indicating the existence of an air-formed oxide film. A small peak related to metallic Fe (Eb = 706.7 eV) was also noted in the deconvoluted spectrum (Figure S2). The formation of Nd2O3 was confirmed with the Nd 3d5/2 (Eb = 982.9 eV) and Nd 4d (Eb = 122.5 eV) peaks. Although the O KLL (Eb = 978.7 eV and Eb = 973.6 eV) peaks interfered with the Nd 3d5/2 peak, the confirmation of Nd is unambiguous. The O 1s spectrum, like the Fe 2p3/2 and Nd 3d5/2 spectra, suggested that during air exposure, the film consisting of metal oxides (Eb = 530.1 eV) and hydroxides (Eb = 531.7 eV) is formed. The peak at 532.7 eV indicates the adsorption of water. The S 2p spectrum appeared as a single peak, comprising 2p3/2 and 2p1/2 peaks characteristic of sulphide (Eb = 162.9 eV and Eb = 164.1 eV, respectively). The C 1s peak showed the presence of C–C/C–H (Eb = 284.8 eV), C–S (Eb = 287.7 eV), and C–O (related to organic species) (Eb = 289.3 eV) on the surface (Figure S2). The C–C/C–H and C–O peaks are related to adventitious carbon, while C–S refers to PPS. The signal for the B 1s peak was too small to perform a meaningful deconvolution.
Second, the spectra recorded after the PDP measurements are discussed (Figure 7 and Figure 8 and the deconvoluted spectra in Figures S4–S6). After polarisation in the H2SO4 electrolyte, the Fe 2p spectrum was more complex than that of the reference sample (Figure 7). The Fe 2p3/2 peak is centred at the Fe(II)/Fe(III) range. A small contribution was noted at Eb = 712.5 eV, which may be related to FeSO4. Since its position overlaps with the Fe(II)/Fe(III) satellite peak, it is difficult to confirm its presence unambiguously. However, a peak corresponding to sulphate was observed in the S 2p spectrum. Further, the intensity of the peak related to Fe(0) was greater than before polarisation (Figures S2 and S4), indicating increased dissolution in the acidic medium, which exposed a bare magnet (Figure 7). A small peak related to Nd2O3 was noted, interfering with the O KLL. The signals for the B 1s were too weak to perform meaningful analysis (Figure 8). Deconvolution of the C 1s spectrum showed the presence of C–C/C–H, C–S, and C–O species, while the O 1s spectrum indicated the formation of oxides, hydroxides, and sulphates (Eb = 533.0 eV) species (Figure S4). In the S 2p spectrum, a sulphate peak (2p3/2 peak at Eb = 168.4 eV and 2p1/2 peak at Eb = 169.6 eV) was noted in addition to the sulphide peak. The XPS depth profile in Figure 9a showed that the corrosion product layer formed at the surface during polarisation in the H2SO4 electrolyte was relatively thin, i.e., in the range of a few nanometres. Similarly to the reference spectrum (Figure 3a), C and O were the main components at the surface, followed by Fe, which is the next significant component. As the sputtering proceeded, the concentration of C remained constant, originating from the polymer matrix, and that of O first decreased sharply and then continued to decrease gradually with depth. The concentration of Fe rapidly increased and remained nearly constant with depth, while the concentration of Nd slightly increased. Results also showed increased sulphide concentration and the complete disappearance of the sulphate peak with depth (Figure S7). This indicates that sulphate is present only on the surface, prior to ion sputtering, due to corrosion products, while sulphide is present in the polymer matrix. These results confirm the assumption that Fe and/or Nd sulphate can form as corrosion products in the H2SO4 electrolyte, which agrees with the electrochemical measurements and the SEM/EDS analysis (Figure 6, Table 2). Changes in the O concentration showed a decrease in the concentration of metal oxides, hydroxides, and sulphates with depth, due to the progressive removal of corrosion products.
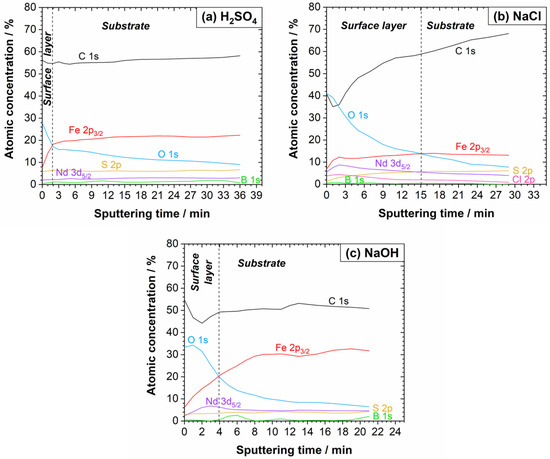
Figure 9.
XPS depth profiles of the Nd–Fe–B polymer-bonded magnet after the potentiodynamic polarisation measurements in (a) 0.01 M H2SO4, (b) 0.1 M NaCl, and (c) 0.1 M NaOH electrolytes at room temperature. The sputtering rate was 1.0 nm/min.
After the potentiodynamic polarisation measurements in the 0.1 M NaCl electrolyte (Figure 7, Figure 8 and Figure S5), the Fe 2p3/2 peak showed the possible existence of FeO, FeCl2/Fe2O3 (Eb = 710.7 eV), and FeCl3/FeOOH (Eb = 711.5 eV) on the surface. No Fe(0) peak was observed on the surface, indicating less damage during polarisation than in the H2SO4 electrolyte. The Nd 3d5/2 spectrum, which was more intense than after the measurements in the acidic medium, was deconvoluted into Nd2O3. The Cl 2p spectrum was deconvoluted into 2p3/2 and 2p1/2 peaks at Eb = 198.1 eV and Eb = 199.7 eV, respectively, and refers to the formation of corrosion products in the sodium chloride electrolyte. The C 1s spectrum showed the presence of C–C/C–H, C–S, and C–O on the surface. Only a minimal sulphide peak was observed on the surface, and the deconvolution was not meaningful. The depth profile of the layer formed during polarisation in the NaCl electrolyte is presented in Figure 9b. A decrease in the concentration of O and an increase in Fe were observed. This is due to the removal of corrosion products and an increase in the Fe signal originating from the magnetic material. A decrease in the Cl 2p also results from reduced FeCl2/FeCl3 corrosion products present only on the surface. At the beginning of the ion sputtering, a slight decrease in the C concentration with depth was observed due to reduced surface carbon contamination. With depth, the C concentration increased again due to the presence of the polymer matrix. A minimal sulphide peak was observed on the surface, and its concentration increased with depth due to the polymer matrix.
The XPS analysis of the Nd–Fe–B magnet after the potentiodynamic polarisation measurements in the 0.1 M NaOH electrolyte is presented in Figure 7, Figure 8 and Figure S6. The Fe 2p3/2 spectrum showed the presence of FeO, Fe2O3, and FeOOH species. No sign of Fe(0) was noted, indicating that the surface layer is thicker than the analysis depth. The XPS depth profile is shown in Figure 9c. The Fe concentration increased with depth to over 30 at. %, which was higher than in other electrolytes. The Nd 3d5/2 peak, which showed the presence of Nd2O3, had a relatively low intensity and overlapped with the O KLL peak.
In summary, XPS analysis in all electrolytes revealed a high concentration of carbon, which initially decreased with depth due to reduced carbon contamination, and then increased again as the polymer matrix was approached. The sulphur concentration increased with depth due to its presence in the polymer matrix. The concentrations of Fe, Nd, and B increased with depth because they are integral components of the magnetic powder. However, they were also present on the surface, either as corrosion products or as part of the passive film. The oxygen concentration decreased with depth in all electrolytes, which confirms that an oxide layer had formed on the surface. Interestingly, the results showed a higher Fe concentration than Nd in the surface oxide layers. This suggests that the primary corrosion products and the passive film are predominantly iron compounds, with a minor contribution from neodymium compounds.
3.3. Electrochemical Behaviour and Surface Analysis of the Sm–Fe–N
3.3.1. Potentiodynamic Polarisation Measurements for Sm–Fe–N
The electrochemical behaviour of Sm metal, Sm–Fe alloy, and Sm–Fe–N polymer-bonded magnet has been scarcely investigated in the literature. Therefore, our study aimed to examine these materials in different electrolytes, covering a wide pH range (1.8 to 12.8) (Figure 10).
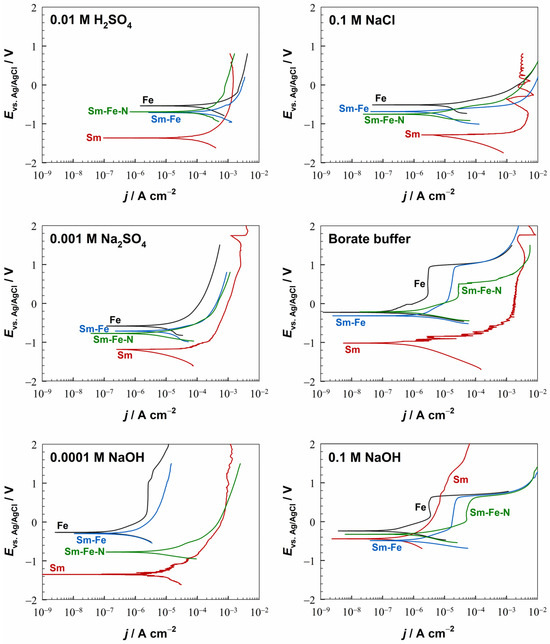
Figure 10.
Potentiodynamic polarisation curves of the Fe, Sm, Sm–Fe, and Sm–Fe–N materials in different electrolytes. The representative PDP curves from several repeated measurements conducted under identical conditions are shown. The samples were stabilised for one hour at OCP before the measurements. dE/dt = 1 mV/s, room temperature.
According to the Pourbaix diagram [45], Sm reaches immunity only at potentials lower than E = −3.2 V (standard hydrogen electrode). It corrodes in acidic and near-neutral solutions through the metal dissolution at the anode (Equations (15) and (16)):
Sm → Sm2+ + 2e−,
Sm2+ → Sm3+ + e−.
At the cathode, the hydrogen evolution from the reduction of water (Equation (3)) occurs in a dilute H2SO4 electrolyte, while the oxygen reduction reaction (Equation (5)) takes place in Na2SO4 and NaCl electrolytes. As was the case for the Nd, the Ecorr values for the Sm were shifted more negatively than those for the other materials in all electrolytes, except in a strongly alkaline medium.
In borate buffer and 0.0001 M NaOH, current densities were somewhat smaller than at more acidic pH, but at high anodic potentials (>−0.5 V), similar values were reached as at lower pH. However, in a strongly alkaline medium (0.1 M NaOH), Sm showed strong passivation, with the current density dropping to the value observed for Fe in the same electrolyte and sustaining high electrode potentials. Samarium passivates in alkaline media (at pH values higher than 10) due to the formation of Sm(OH)3, which may be further transformed into Sm2O3 [46], as shown by Equations (17) and (18):
Sm3+ + 3OH− → Sm(OH)3,
2Sm(OH)3 → Sm2O3 + 3H2O.
As with the Nd, the Sm also showed a scattering of the recorded data and frequent increases in current densities during anodic polarisation in almost all electrolytes. This behaviour indicates a strong metal reactivity, with the continuous formation and degradation of protective layers and corrosion products on the surface, eventually leading to the material’s mechanical decomposition [44].
The corrosion behaviour of Sm–Fe alloys and Sm–Fe–N polymer-bonded magnets has not been thoroughly investigated to date. Their corrosive nature originates from the complex microstructure, which contains multiple phases. XRD (Figure 1) and SEM/EDS (Figure 2b) analyses showed that the Sm–Fe alloy consists of three phases (one Fe-rich phase and two SmFe phases with different ratios of Sm and Fe). The polymer–bonded Sm–Fe–N magnet also exhibits a multi-phase microstructure [47,48]. The electrochemical measurements revealed that the Sm–Fe alloy and the Sm–Fe–N magnet corrode in acidic and near-neutral electrolytes and passivate in alkaline electrolytes (Figure 10). Thus, they can passivate even at pH < 10, where Sm does not passivate. As in the case of the Nd–Fe–B, the Sm-based materials show similar electrochemical behaviour to each other and a mixed behaviour of the individual metals, i.e., Fe and Sm. In all investigated electrolytes, the Ecorr values for the Sm–Fe and Sm–Fe–N were between those of the individual metals.
The PDP curves for Sm–Fe and Sm–Fe–N reflect passivation in the borate buffer and 0.1 M NaOH, but an active–passive transition was not observed in the 0.0001 M NaOH. In the borate buffer, the Sm–Fe alloy had a well-defined and broad passive region (ΔEpass = 900 mV) and an Ebr of 900 mV. In contrast, the Sm–Fe–N magnet had a much narrower passive region (ΔEpass = 400 mV) and a lower Ebr of 500 mV. In the 0.1 M NaOH, the Sm–Fe and Sm–Fe–N had a passive region of 800 mV and 600 mV, respectively. The Ebr was around 600 mV for both materials, the same as for the Fe, Nd–Fe, and Nd–Fe–B in this electrolyte, but current densities were higher than for individual metals, as observed for Nd–Fe and Nd–Fe–B (Figure 4).
Figure 5b compiles the jcorr values of Fe, Sm, Sm–Fe, and Sm–Fe–N in various electrolytes. In contrast to Nd-based materials (Figure 5a), Sm-based materials exhibit values more similar to Fe, with smaller minor differences between individual materials. For a more straightforward presentation of the similarities and differences in the Nd–Fe–B and Sm–Fe–N magnets in different electrolytes, the jcorr values are shown as a function of pH (Figure 5c). The two magnets behave very similarly in various electrolytes, although the Nd–Fe–B magnet shows slightly higher values in near-neutral, and slightly alkaline electrolytes.
3.3.2. SEM/EDS Analysis for Sm–Fe–N
The polymer-bonded Sm–Fe–N magnets were investigated using SEM/EDS analysis (Figure 11 and Table 3) to study the microstructural changes after the potentiodynamic polarisation measurements in various electrolytes (Figure 10).
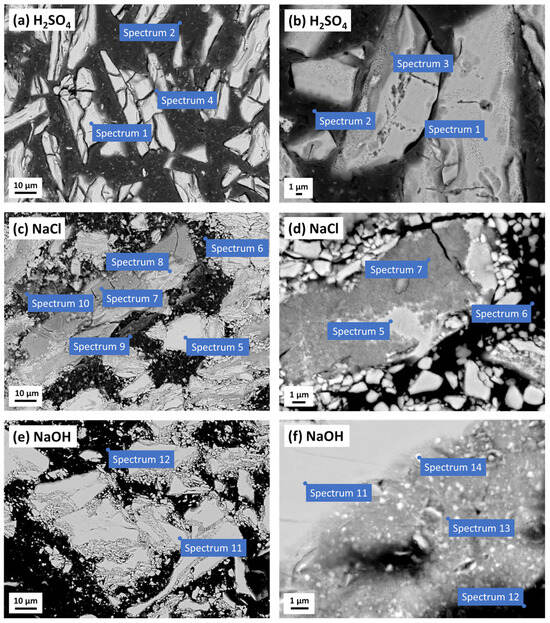
Figure 11.
SEM images (COMPO mode) of the polymer-bonded Sm–Fe–N magnet after the potentiodynamic polarisation measurements in (a,b) 0.01 M H2SO4, (c,d) 0.1 M NaCl, and (e,f) 0.1 M NaOH electrolytes. The corresponding EDS analyses are presented in Table 3.

Table 3.
Complementary EDS analyses to the SEM images (Figure 11) of the polymer-bonded Sm–Fe–N magnet after the potentiodynamic polarisation measurements in various electrolytes. The values given represent the averages of several measurements taken at each characteristic spot.
After the electrochemical measurements in the H2SO4 electrolyte, the Sm–Fe–N magnet was corroded, with the vast majority of the magnetic powder etched, cracked, and dissolved, resulting in a shrunken size (Figure 11a,b). The magnetic powder exhibited a somewhat reduced content of Fe and N, along with an increased amount of O, indicating oxidation (spectrum 1). On some parts of the magnetic powder surface, the EDS analysis revealed reduced Fe, Sm, N, and Co content compared to the magnetic powder itself (spectrum 1), as well as increased amounts of O, C, and S (spectrum 3). That was probably a corrosion product, and visually, that area also differed from the rest of the magnetic powder (Figure 11b). In some areas along the edges of the magnetic powder, a mixture of corrosion product and polymer was likely present, showing lower amounts of C and S (spectrum 4) than the rest of the polymer (spectrum 2), but still containing elements of oxidised magnetic powder (Fe, Sm, O). These two corrosion products, formed by the corrosion of the Sm–Fe–N magnet in the H2SO4, may include Fe and/or Sm oxides/hydroxides and sulphates. The polymer showed no changes in the composition (spectrum 2), compared to the uncorroded magnet (Table 1, spectrum 3).
The SEM images of the Sm–Fe–N magnet after the PDP measurements in the 0.1 M NaCl are shown in Figure 11c,d. Cracks were visible on the magnetic powder surface, and the EDS analysis revealed reduced amounts of Fe and N, but an increased amount of O, indicating oxidation (spectrum 5). Four different corrosion products were identified. The corrosion product on the magnetic powder contained a large amount of O and some Cl (spectrum 7). There were areas of the magnetic powder where one part was oxidised (white areas), while the other part contained corrosion products (grey areas with cracks) (Figure 11d). The second corrosion product was also formed on the magnetic powder, but visually and compositionally differed from the first product (Figure 11c). It contained C, which was not present in the first product, and had a slightly reduced content of Fe, Sm, O, and Cl (spectrum 8). The third corrosion product (Figure 11c) had an even lower content of Fe, Sm, O, and Cl, but a fairly high content of C and S (spectrum 9), likely resulting from the mixing of the corrosion product with the PPS polymer (spectrum 6). The fourth corrosion product (Figure 11c) was visually distinct from the others and had a very high Cl content, reaching up to 25 at. %, and about the same amount of O, along with reduced amounts of Fe and Sm (spectrum 10). Increased amounts of oxygen and chloride, and reduced amounts of iron and samarium, after exposure of the Sm–Fe–N to the NaCl electrolyte, indicate the possible formation of corrosion products, such as Fe and/or Sm oxides/hydroxides and chlorides.
Like the Nd–Fe–B magnet, the Sm–Fe–N magnet showed no signs of corrosion after the PDP measurements in the 0.1 M NaOH (Figure 11e,f) due to passivation in a strongly alkaline medium (Figure 10). The passivation was confirmed by the presence of O and slightly reduced amounts of Fe and Sm (spectra 13 and 14) in the areas at the edges of the magnetic powder, indicating the formation of Fe and/or Sm oxides/hydroxides passive films. However, oxygen was not detected in some parts of the magnetic powder because the passive film was thin, making its detection by EDS analysis difficult (spectrum 11). There were no significant changes in the structure or composition of the polymer (spectrum 12).
The EDS analysis showed reduced amounts of Fe and Sm in the corrosion products, which could be attributed to the dissolution reactions of both Fe and Sm from the magnet. Further, the EDS analysis of the Sm–Fe–N magnet in the NaCl electrolyte revealed much higher concentrations of oxygen and chloride in the corrosion products compared to those formed on the Nd–Fe–B magnet.
3.3.3. XPS Analysis for Sm–Fe–N
The XPS high-resolution spectra of Fe 2p, Sm 3d5/2, O 1s, and S 2p, as well as N 1s, C 1s, and Cl 2p, recorded at the surface of the Sm–Fe–N magnets after the PDP experiments (Figure 10), are presented in Figure 12 and Figure 13, respectively. The deconvoluted high-resolution XPS spectra are shown in Figures S8–S10. Information about the distribution of elements within the layer, as well as the thickness of the surface layer, was obtained from the ion sputtering (Figure 14).
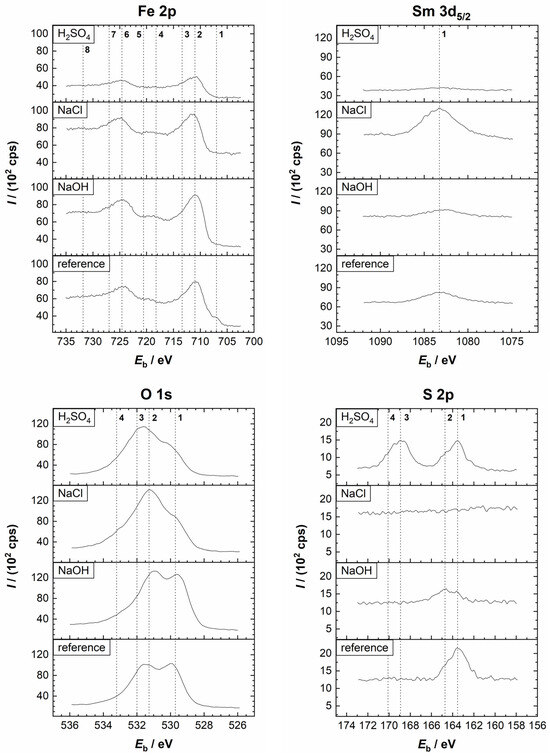
Figure 12.
Comparison of the high-resolution XPS spectra of Fe 2p, Sm 3d5/2, O 1s, and S 2p from the Sm–Fe–N polymer-bonded magnet before (reference sample) and after the potentiodynamic polarisation measurements in the 0.01 M H2SO4, 0.1 M NaCl, and 0.1 M NaOH electrolytes at room temperature. Vertical lines represent the positions of the reference compounds. (Fe 2p) 1, 5: Fe(0); 2, 6: Fe2+/Fe3+; 3, 4, 7, 8: satellites. (Sm 3d5/2) 1: Sm2O3. (O 1s) 1: O2−; 2: OH−; 3: H2O; 4: SO42−. (S 2p) 1, 2: S2−; 3, 4: SO42−.
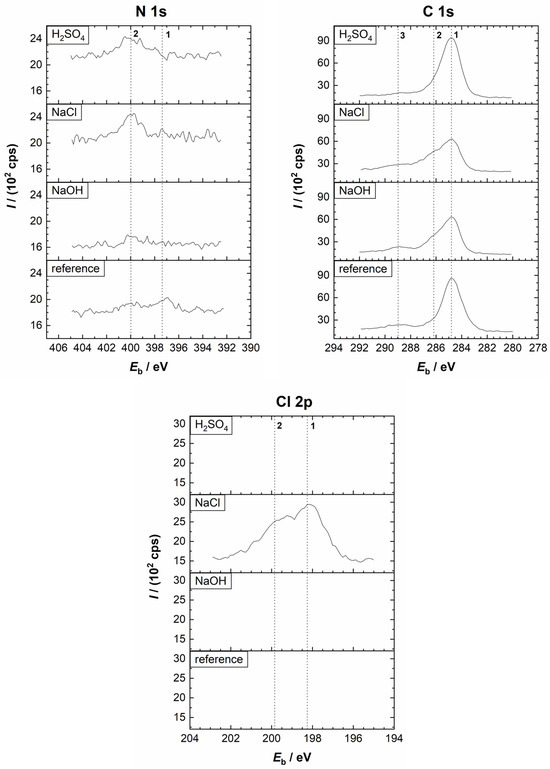
Figure 13.
Comparison of the high-resolution XPS spectra of N 1s, C 1s, and Cl 2p from the Sm–Fe–N polymer-bonded magnet before (reference sample) and after the potentiodynamic polarisation measurements in the 0.01 M H2SO4, 0.1 M NaCl, and 0.1 M NaOH electrolytes at room temperature. Vertical lines represent the positions of the reference compounds. (N 1s) 1: nitride; 2: NH3. (C 1s) 1: C–C/C–H; 2: C–S; 3: C–O. (Cl 2p) 1, 2: Cl−.
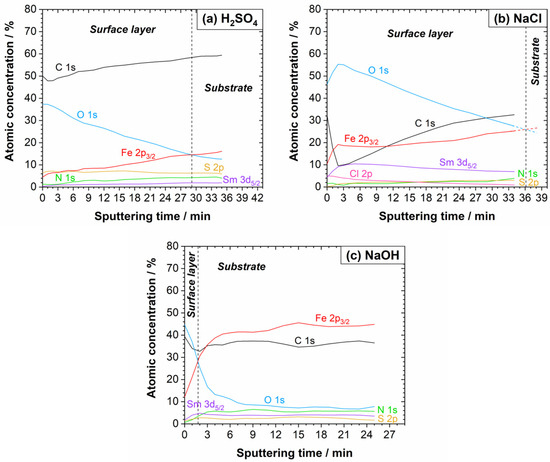
Figure 14.
XPS depth profiles of the Sm–Fe–N polymer-bonded magnet after the potentiodynamic polarisation measurements in (a) 0.01 M H2SO4, (b) 0.1 M NaCl, and (c) 0.1 M NaOH electrolytes at room temperature. The sputtering rate was 1.0 nm/min.
First, we will discuss the XPS spectra of the reference sample (Figure 12, Figure 13 and Figure S3). As with the Nd–Fe–B magnet, the Fe 2p peak showed the presence of FeO, Fe2O3, and FeOOH species, suggesting an air-formed oxide film. Metallic Fe was also present on the surface. The Sm 3d5/2 peak is related to Sm2O3 (Eb = 1083.2 eV), while the N 1s peak is associated with nitride (Eb = 397.2 eV). A peak at 399.9 eV was also observed, which may correspond to NH3. Deconvolution of the C 1s peak showed the presence of C–C/C–H, C–S, and C–O organic species. Sulphide was detected at the S 2p peak. In the O 1s spectrum, metal oxides, hydroxides, and H2O peaks were observed.
After the PDP measurements in the H2SO4 (Figure 12, Figure 13 and Figure S8), the Fe 2p spectrum contained FeO, Fe2O3, and FeSO4 components on the surface. In contrast to the Nd–Fe–B, no peak related to metallic Fe was observed. The intensity of the Sm 3d peak was very small. In the S 2p spectrum, both sulphide and sulphate peaks were detected, whereas in the O 1s spectrum, oxides, hydroxides, and sulphates were noted. Further, C–C/C–H, C–S, and C–O species were detected in the C 1s spectrum, while nitride and ammonia peaks were present in the N 1s spectrum (Figure S8). The XPS depth profile in Figure 14a showed that the layer formed on the Sm–Fe–N was much thicker than that formed on the Nd–Fe–B in the H2SO4, which may be the reason why the Fe(0) peak was not observed. Nevertheless, similar trends were observed within the layer as with the Nd–Fe–B (Figure 9a). The sulphate species were present only on the surface due to the corrosion products (Figure S11). With depth, the sulphide concentration increased due to the presence of the polymer matrix.
The XPS analysis after the potentiodynamic polarisation measurements in NaCl (Figure 12, Figure 13 and Figure S9) showed the possible existence of FeO, FeCl2/FeCl3/Fe2O3, and FeOOH as a result of the formation of corrosion products on the surface. The intensity of the Sm 3d peak was somewhat higher compared to that in the H2SO4. The existence of NH3 on the surface is possible, and its concentration decreased with depth. The O 1s spectrum showed the presence of metal oxides and hydroxides, and the Cl 2p spectrum confirmed that possible corrosion products in the NaCl electrolyte are FeCl2 and FeCl3. From the C 1s peak, C–C/C–H, C–S, and C–O were detected. A minimal sulphide concentration, but insufficient for the deconvolution, was observed on the surface. The XPS depth profile shown in Figure 14b is quite different from the other depth profiles. The C concentration dropped sharply within the first 2 min of the ion sputtering to approximately 10 at. %, then increased again above 30 at. % and continued to increase. Also, the O concentration on the surface was much higher than that of C, which was not the case in the other electrolytes or with the Nd–Fe–B magnet. Additionally, the O profile increased within the first 2 min, as did the Fe and Sm concentrations, reaching a maximum of ca. 55 at. % and then decreased as the C concentration increased. Chloride was also abundant on the surface.
The high concentrations of oxygen and chloride on the surface are consistent with the EDS analysis (Table 3) and are attributed to the thick corrosion product layer that forms on the surface. A decrease in O and Cl concentrations with depth was observed as the corrosion products were sputtered away. From the Fe 2p3/2 peak, a reduction in FeCl2/FeCl3/Fe2O3, FeO, and FeOOH peaks (due to a decrease in corrosion products) and a simultaneous appearance and increase in metallic Fe peak (due to the magnetic powder) with depth were observed. The S concentration increased with depth due to the presence of the polymer matrix. Also, an increase in nitride and samarium peaks with depth was observed due to the magnetic material.
After the potentiodynamic polarisation measurements in the NaOH (Figure 12, Figure 13 and Figure S10), the presence of FeO, Fe2O3, and FeOOH in the passive film, together with Sm2O3, was observed from the Fe 2p3/2 and Sm 3d5/2 peaks, respectively. This was also confirmed with the O 1s spectrum, whose deconvolution showed the presence of metal oxides and hydroxides on the surface. Again, the C 1s peak showed the presence of C–C/C–H, C–S, and C–O species, and sulphide was evident from the S 2p spectrum. From the depth profile in Figure 14c, the estimated thickness of the passive film was in the nanometric range, with trends similar to those observed in the other electrolytes. The C concentration first decreased and then increased shortly thereafter, remaining constant at approximately 35 at. %. The intensities of FeO, Fe2O3, and FeOOH peaks decreased with depth, while that of the metallic Fe peak progressively appeared. The Fe concentration increased with depth more than in the other electrolytes, reaching over 40 at. %, which was also higher than that of the Nd–Fe–B magnet.
As in the case of the Nd–Fe–B, the Sm–Fe–N magnet exhibited high C and S concentrations in all investigated electrolytes due to the polymer matrix. Fe, Sm, and N concentrations increased with depth because they are integral components of the magnetic powder, but they were also present on the surface, either as corrosion products or as part of the passive film. In all electrolytes, the oxygen concentration decreased with depth, which confirms that an oxide layer had formed on the surface. The XPS results again showed a higher Fe than Sm concentration in the surface oxide layers. Therefore, iron compounds preferentially form on the surface, while samarium compounds are present in smaller quantities.
4. Conclusions
The electrochemical behaviour of metals (Fe, Nd, Sm), binary alloys (Nd–Fe, Sm–Fe), and polymer-bonded magnets (Nd–Fe–B, Sm–Fe–N) was studied using potentiodynamic polarisation in different electrolytes, with a pH range of 1.8–12.8 (0.01 M H2SO4 (pH = 1.8), 0.1 M NaCl (pH = 5.6), 0.001 M Na2SO4 (pH = 6.6), borate buffer (pH = 9.3), 0.0001 M NaOH (pH = 9.9), and 0.1 M NaOH (pH = 12.8)). Fe corrodes in acidic and near-neutral solutions and passivates in alkaline solutions with a pH range of 9.3–12.8. Nd dissolves more than Fe in the pH range below 10; it starts to show the tendency to passivate in 0.0001 M NaOH and fully passivates only in strongly alkaline solutions. Its tendency to passivate is smaller than that of Fe in less alkaline solutions. The current density values for the Nd were higher than those of all the other investigated materials in all electrolytes except in very acidic and very alkaline media. Sm behaves similarly to Nd and reaches passivity only in strongly alkaline solutions; however, the related current densities in near-neutral and slightly alkaline electrolytes are lower than those of Nd.
The binary alloys and magnets showed corrosion behaviour that combined the characteristics of their metal components but was closer to that of the Fe component, especially in acidic electrolytes, reflecting its higher content. The behaviour of Fe, Nd or Sm in the multiple-phase microstructure, where each metal can have its electrochemical reactions in different electrolytes, is reflected in the mixed behaviour of the individual metals. The electrochemical measurements revealed that the Nd–Fe, Sm–Fe, Nd–Fe–B, and Sm–Fe–N passivate in alkaline electrolytes even at pH < 10, where Nd and Sm do not passivate.
The XPS results are consistent with the electrochemical measurements and the SEM/EDS results, indicating that the magnets corrode in acidic and near-neutral media, whereas a thin passive film forms in alkaline media. In the H2SO4 electrolyte, corrosion products may include Fe, Nd, and Sm oxides/hydroxides and sulphates. In the NaCl electrolyte, corrosion products such as Fe, Nd, and Sm oxides/hydroxides and chlorides are formed. In the NaOH electrolyte, both magnets were passivated, forming Fe, Nd, and Sm oxides/hydroxides. Ion sputtering, in combination with XPS analysis, was used to obtain in-depth information about the distribution of elements in the surface layers formed after the potentiodynamic polarisation measurements in the three electrolytes. In an alkaline medium, these materials passivate, forming layers in the nanometric range. The layers of corrosion products formed in acidic and near-neutral sodium chloride electrolytes were thicker, ranging from 15 nm to 30 nm, for the Nd–Fe–B and Sm–Fe–N magnets, respectively. Although the jcorr values of Nd–Fe–B and Sm–Fe–N magnets are quite similar in the H2SO4 and NaCl electrolytes, based on the SEM/EDS and XPS data, the Sm–Fe–N magnet appears more susceptible to corrosion, as significantly higher concentrations of oxygen and chloride were revealed in the corrosion products. The reason may be in a different stability of corrosion products or their desorption from the magnet surface, or the effect of the powder size, which is slightly smaller for the Sm–Fe–N magnets, thus producing more active surface areas.
Ultimately, as Nd–Fe–B and Sm–Fe–N magnets belong to the category of rare-earth magnets, they exhibit similar characteristics, with some differences noted regarding their electrochemical properties and tendency to corrosion. However, differences in the behaviour of magnets are smaller than those of the individual metals Fe, Nd, and Sm. Both magnets were produced using the same process (injection moulding) and contain the same proportion of magnetic powders and polymer, making their general characteristics quite similar.
Supplementary Materials
The following supporting information can be downloaded at: https://www.mdpi.com/article/10.3390/cmd6030042/s1, Figure S1: XRD diffractograms with marked phases for the Nd–Fe and Sm–Fe alloys, and the Sm–Fe–N polymer-bonded magnet; Figure S2: Deconvoluted high-resolution XPS spectra of Fe 2p3/2, Nd 3d5/2, O 1s, S 2p, and C 1s from the Nd–Fe–B polymer-bonded magnet (reference sample); Figure S3: Deconvoluted high-resolution XPS spectra of Fe 2p3/2, Sm 3d5/2, O 1s, S 2p, N 1s, and C 1s from the Sm–Fe–N polymer-bonded magnet (reference sample); Figure S4: Deconvoluted high-resolution XPS spectra of Fe 2p3/2, Nd 3d5/2, O 1s, S 2p, and C 1s from the Nd–Fe–B polymer-bonded magnet after the potentiodynamic polarisation measurements in the 0.01 M H2SO4 electrolyte at room temperature; Figure S5: Deconvoluted high-resolution XPS spectra of Fe 2p3/2, Nd 3d5/2, O 1s, C 1s, and Cl 2p from the Nd–Fe–B polymer-bonded magnet after the potentiodynamic polarisation measurements in the 0.1 M NaCl electrolyte at room temperature; Figure S6: Deconvoluted high-resolution XPS spectra of Fe 2p3/2, Nd 3d5/2, O 1s, S 2p, and C 1s from the Nd–Fe–B polymer-bonded magnet after the potentiodynamic polarisation measurements in the 0.1 M NaOH electrolyte at room temperature; Figure S7: XPS high-resolution spectra of S 2p from the Nd–Fe–B polymer-bonded magnet after the potentiodynamic polarisation measurements in the 0.01 M H2SO4 electrolyte at room temperature, depending on the sputtering time, i.e., depth; Figure S8: Deconvoluted high-resolution XPS spectra of Fe 2p3/2, Sm 3d5/2, O 1s, S 2p, N 1s, and C 1s from the Sm–Fe–N polymer-bonded magnet after the potentiodynamic polarisation measurements in the 0.01 M H2SO4 electrolyte at room temperature; Figure S9: Deconvoluted high-resolution XPS spectra of Fe 2p3/2, Sm 3d5/2, O 1s, N 1s, C 1s, and Cl 2p from the Sm–Fe–N polymer-bonded magnet after the potentiodynamic polarisation measurements in the 0.1 M NaCl electrolyte at room temperature; Figure S10: Deconvoluted high-resolution XPS spectra of Fe 2p3/2, Sm 3d5/2, O 1s, S 2p, and C 1s from the Sm–Fe–N polymer-bonded magnet after the potentiodynamic polarisation measurements in the 0.1 M NaOH electrolyte at room temperature; Figure S11: XPS high-resolution spectra of S 2p from the Sm–Fe–N polymer-bonded magnet after the potentiodynamic polarisation measurements in the 0.01 M H2SO4 electrolyte at room temperature, depending on the sputtering time, i.e., depth.
Author Contributions
Conceptualisation, N.L. and I.M.; methodology, N.L., J.K. and I.M.; formal analysis, N.L.; data curation, N.L.; writing—original draft preparation, N.L. and I.M.; writing—review and editing, N.L., J.K. and I.M.; supervision, I.M.; project administration, I.M.; funding acquisition, I.M. All authors have read and agreed to the published version of the manuscript.
Funding
The research was funded within the “Magnetics and Microhydrodynamics—from guided transport to delivery” (MaMi) project. The MaMi project was funded by the European Union’s Horizon 2020 research and innovation programme under the Marie Skłodowska Curie grant agreement No. 766007. The financial support by the Slovenian Research and Innovation Agency is kindly acknowledged (core funding grants No. P2-0393 and No. P2-0082).
Data Availability Statement
All data and materials are available on request from the corresponding author. The data are not publicly available due to ongoing research using part of the data.
Acknowledgments
The authors thank Daniel Crespo (Polytechnic University of Catalonia, Spain) for the preparation of Nd–Fe alloy, Barbara Kapun (Jožef Stefan Institute, Slovenia) for the SEM/EDS analysis, Nataša Zabukovec Logar (National Institute of Chemistry, Slovenia) for the XRD analysis, and Tatjana Filipič (Jožef Stefan Institute, Slovenia) for the XPS analysis. The authors also acknowledge Nataša Kovačević, Karla Kosmač and Matjaž Femec from Kolektor d.d. for their assistance with the procurement of the magnets required in this research.
Conflicts of Interest
The authors declare that they have no conflicts of interest. The funders had no role in the design of the study, the collection, analysis, or interpretation of data, the writing of the manuscript, or the decision to publish the results.
References
- Gutfleish, O.; Willard, M.A.; Brück, E.; Chen, C.H.; Sankar, S.G.; Liu, J.P. Magnetic Materials and Devices for the 21st Century: Stronger, Lighter, and More Energy Efficient. Adv. Mater. 2011, 23, 821–842. [Google Scholar] [CrossRef]
- Gorbachev, E.A.; Kozlyakova, E.S.; Trusov, L.A.; Sleptsova, A.E.; Zykin, M.A.; Kazin, P.E. Design of modern magnetic materials with giant coercivity. Russ. Chem. Rev. 2021, 90, 1287–1329. [Google Scholar] [CrossRef]
- Cui, J.; Ormerod, J.; Parker, D.; Ott, R.; Palasyuk, A.; Mccall, S.; Paranthaman, M.P.; Kesler, M.S.; McGuire, M.A.; Nlebedim, I.C.; et al. Manufacturing Processes for Permanent Magnets: Part I—Sintering and Casting. JOM 2022, 74, 1279–1395. [Google Scholar] [CrossRef]
- Crozier-Bioud, T.; Momeni, V.; Gonzales-Gutierrez, J.; Kukla, C.; Luca, S.; Polere, S. Current challenges in NdFeB permanent magnets manufacturing by Powder Injection Molding (PIM): A review. Mater. Today Phys. 2023, 34, 101082. [Google Scholar] [CrossRef]
- Croat, J.J. Chapter 6—Compression bonded NdFeB permanent magnets. In Modern Permanent Magnets; Woodhead Publishing: Cambridge, MA, USA, 2022. [Google Scholar]
- Yan, G.; McGuiness, P.J.; Farr, J.P.G.; Harris, I.R. Environmental degradation of NdFeB magnets. J. Alloys Compd. 2009, 478, 188–192. [Google Scholar] [CrossRef]
- Ni, J.J.; Ma, T.Y.; Cui, X.G.; Wu, Y.R.; Yan, M. Improvement of corrosion resistance and magnetic properties of Nd–Fe–B sintered magnets by Al85Cu15 intergranular addition. J. Alloys Compd. 2010, 502, 346–350. [Google Scholar] [CrossRef]
- Schultz, L.; El-Aziz, A.M.; Barkleit, G.; Mummert, K. Corrosion behaviour of Nd–Fe–B permanent magnetic alloys. Mater. Sci. Eng. A 1999, 267, 307–313. [Google Scholar] [CrossRef]
- Kim, J.W.; Kim, S.H.; Kim, Y.D. Mechanical properties of (Nd,Dy)–Fe–B magnets sintered via cyclic sintering. Mater. Sci. Eng. A 2012, 535, 325–329. [Google Scholar] [CrossRef]
- Shinba, Y.; Konno, T.J.; Ishikawa, K.; Hiraga, K. Transmission electron microscopy study on Nd-rich phase and grain boundary structure of Nd–Fe–B sintered magnets. J. Appl. Phys. 2005, 97, 53504. [Google Scholar] [CrossRef]
- Poženel Kovačič, T.; Kovačević, N.; Milošev, I. Corrosion of sintered NdFeB permanent magnets. J. Electrochem. Soc. 2025, 172, 71501. [Google Scholar] [CrossRef]
- Song, L.Y.W.; Zhang, H.; Yang, H.X.; Song, Z.L. A comparative study on the corrosion behavior of NdFeB magnets in different electrolyte solutions. Mater. Corros. 2008, 59, 794–801. [Google Scholar] [CrossRef]
- Xu, J.L.; Zhong, Z.C.; Huang, Z.X.; Luo, J.M. Corrosion resistance of the titania particles enhanced acrylic resin composite coatings on sintered NdFeB permanent magnets. J. Alloys Compd. 2013, 570, 28–33. [Google Scholar] [CrossRef]
- Zhang, H.; Song, Y.W.; Song, Z.L. Electrodeposited nickel/alumina composite coating on NdFeB permanent magnets. Mater. Corros. 2008, 59, 324–328. [Google Scholar] [CrossRef]
- Gurappa, I. Corrosion characteristics of permanent magnets in acidic environments. J. Alloys Compd. 2003, 360, 236–242. [Google Scholar] [CrossRef]
- El-Moneim, A.A.; Gebert, A. Electrochemical characterization of galvanically coupled single phases and nanocrystalline NdFeB-based magnets in NaCl solutions. J. Appl. Electrochem. 2003, 33, 795–805. [Google Scholar] [CrossRef]
- Isotahdon, E.; Huttunen-Saarivirta, E.; Kuokkala, V.-T.; Paju, M. Corrosion behaviour of sintered Nd–Fe–B magnets. Mater. Chem. Phys. 2012, 135, 762–771. [Google Scholar] [CrossRef]
- Ni, J.; Yan, M.; Ma, T.; Zhang, W. Magnetic and anticorrosion properties of two-powder (Pr, Nd)12.6Fe81.3B6.1-type sintered magnets with additions of (Pr, Nd)32.5Fe62.0Cu5.5. Mater. Chem. Phys. 2015, 151, 126–132. [Google Scholar] [CrossRef]
- Yan, M.; Ni, J.; Ma, T.; Ahmad, Z.; Zhang, P. Corrosion behavior of Al100−xCux (15 ≤ x ≤ 45) doped Nd–Fe–B magnets. Mater. Chem. Phys. 2011, 126, 195–199. [Google Scholar] [CrossRef]
- Popescu, A.-M.; Calderon-Moreno, J.M.; Yanushkevish, K.; Aplevich, A.; Demidenko, O.; Neacsu, E.I.; Constanin, V. Corrosion behaviour of NdFeB magnets in different aqueous solutions. J. Braz. Chem. Soc. 2024, 35, e-20230089. [Google Scholar]
- Takagi, S.; Morii, K.; Iriyama, T.; Tominaga, K.; Wada, N.; Hida, E. Evaluation of Practicality for Fully Dense Isotropic Sm-Fe-N Magnets Made by Shock-Wave Consolidation Method. IEEEXplore 2023, 59, 2101205. [Google Scholar]
- Coey, J.M.D.; Stamenov, P.; Porter, S.B.; Venkatesan, M.; Zhang, R.; Iriyama, T. Sm-Fe-N revisited; remanence enhancement in melt-spun Nitroquench material. J Magn. Magn. Mater. 2019, 480, 186–192. [Google Scholar] [CrossRef]
- Ma, X.B.; Li, L.Z.; Liu, S.Q.; Hu, B.Y.; Han, J.Z.; Wang, C.S.; Du, L.H.; Yang, Y.C.; Yang, J.B. Anisotropic Sm–Fe–N particles prepared by surfactant-assisted grinding method. J. Alloy Compds. 2014, 612, 110–113. [Google Scholar] [CrossRef]
- Kelly, R.G.; Scully, J.R.; Shoesmith, D.; Buchheit, R.G. Electrochemical Techniques in Corrosion Science and Engineering; CRC Press: Boca Raton, FL, USA, 2002. [Google Scholar]
- Moulder, J.F.; Stickle, W.F.; Sobol, P.E.; Bomben, K.D. Handbook of X-Ray Photoelectron Spectroscopy: A Reference Book of Standard Spectra for Identification and Interpretation of XPS Data; Perkin-Elmer, Physical Electronics Division: Eden Prairie, MN, USA, 1995. [Google Scholar]
- Mizoguchi, T.; Sakai, I.; Niu, H.; Inomata, K. Magnetic properties of Nd-Fe-B magnets with both Co and Al addition. IEEE Trans. Magn. 1987, 23, 2281–2283. [Google Scholar] [CrossRef]
- Maahn, E. Corrosion of cast iron in concentrated sulphuric acid under potentiostatic conditions. Br. Corros. J. 1966, 1, 350–354. [Google Scholar] [CrossRef]
- Mischler, S.; Rosset, E.; Stachowiak, G.W.; Landolt, D. Effect of sulphuric acid concentration on the rate of tribocorrosion of iron. Wear 1993, 167, 101–108. [Google Scholar] [CrossRef]
- Panossian, Z.; de Almeida, N.L.; de Sousa, R.M.F.; de Souza Pimenta, G.; Schmidt Marques, L.B. Corrosion of carbon steel pipes and tanks by concentrated sulfuric acid: A review. Corros. Sci. 2012, 58, 1–11. [Google Scholar] [CrossRef]
- Nakajima, N.; Maekawa, T. Anodic behaviors of iron and its oxides in dilute sulfuric acid and alkaline solutions. Trans. Jpn. Inst. Met. 1966, 7, 280–285. [Google Scholar] [CrossRef]
- Sherif, E.-S.M. A Comparative Study on the Electrochemical Corrosion Behavior of Iron and X-65 Steel in 4.0 wt % Sodium Chloride Solution after Different Exposure Intervals. Molecules 2014, 19, 9962–9974. [Google Scholar] [CrossRef]
- Oh, S.J.; Cook, D.C.; Townsend, H.E. Characterization of iron oxides commonly formed as corrosion products on steel. Hyperfine Interact. 1998, 112, 59–66. [Google Scholar] [CrossRef]
- You, Z.; Lai, Y.; Zeng, H.; Yang, Y. Influence of water and sodium chloride content on corrosion behavior of cast iron in silty clay. Constr. Build. Mater. 2020, 238, 117762. [Google Scholar] [CrossRef]
- Sherif, E.-S.M. Comparative study on the inhibition of iron corrosion in aerated stagnant 3.5 wt % sodium chloride solutions by 5-phenyl-1H-tetrazole and 3-amino-1,2,4-triazole. Ind. Eng. Chem. Res. 2013, 52, 14507–14513. [Google Scholar] [CrossRef]
- Li, W.; Nobe, K.; Pearlstein, A.J. Potential/current oscillations and anodic film characteristics of iron in concentrated chloride solutions. Corros. Sci. 1990, 31, 615–620. [Google Scholar] [CrossRef]
- Sherif, E.-S.M.; Erasmus, R.M.; Comins, J.D. In situ Raman spectroscopy and electrochemical techniques for studying corrosion and corrosion inhibition of iron in sodium chloride solutions. Electrochim. Acta 2010, 55, 3657–3663. [Google Scholar] [CrossRef]
- Hasan, B.O.; Sadek, S.A. Corrosion behavior of carbon steel in oxygenated sodium sulphate solution under different operating conditions. Adv. Chem. Eng. 2013, 2, 61–71. [Google Scholar]
- MacDougall, B.; Bardwell, J.A. Passivation of iron in sulfate, perchlorate, and borate solutions: Role of borate in the passivation process. J. Electrochem. Soc. 1988, 135, 2437–2441. [Google Scholar] [CrossRef]
- Mayne, J.E.O.; Menter, J.W.; Pryor, M.J. The mechanism of inhibition of the corrosion of iron by sodium hydroxide solution. J. Chem. Soc. 1950, 3229–3236. [Google Scholar] [CrossRef]
- Mayne, J.E.O.; Menter, J.W. The mechanism of inhibition of the corrosion of iron by sodium hydroxide solution. Part II. J. Chem. Soc. 1954, 99–103. [Google Scholar] [CrossRef]
- DorMohammadi, H.; Pang, Q.; Murkute, P.; Árnadóttir, L.; Isgor, O.B. Investigation of iron passivity in highly alkaline media using reactive-force field molecular dynamics. Corros. Sci. 2019, 157, 31–40. [Google Scholar] [CrossRef]
- Evans, U.R. Metallic Corrosion, Passivity and Protection; Edward Arnold & Co.: London, UK, 1964. [Google Scholar]
- Jovancicevic, V.; Kainthla, R.C.; Tang, Z.; Yang, B.; Bockris, J.O. The passive film on iron: An ellipsometric-spectroscopic study. Langmuir 1987, 3, 388–395. [Google Scholar] [CrossRef]
- Sueptitz, R.; Uhlemann, M.; Gebert, A.; Schultz, L. Corrosion, passivation and breakdown of passivity of neodymium. Corros. Sci. 2010, 52, 886–891. [Google Scholar] [CrossRef]
- Pourbaix, M. Atlas of Electrochemical Equilibria in Aqueous Solutions; National Association of Corrosion Engineers: Houston, TX, USA, 1974. [Google Scholar]
- Ruiz, E.J.; Ortega-Borges, R.; Godínez, L.A.; Chapman, T.W.; Meas-Vong, Y. Mechanism of the electrochemical deposition of samarium-based coatings. Electrochim. Acta 2006, 52, 914–920. [Google Scholar] [CrossRef]
- Ping, D.H.; Hono, K.; Hidaka, T.; Yamamoto, T.; Fukuno, A. Microstructural characterization of α-Fe/Sm–Fe–N nanocomposite hard magnets. J. Magn. Magn. Mater. 2004, 277, 337–343. [Google Scholar] [CrossRef]
- Engerroff, J.A.B.; Baldissera, A.B.; Magalhães, M.D.; Lamarão, P.H.; Wendhausen, P.A.P.; Ahrens, C.H.; Mascheroni, J.M. Additive manufacturing of Sm-Fe-N magnets. J. Rare Earths 2019, 37, 1078–1082. [Google Scholar] [CrossRef]
Disclaimer/Publisher’s Note: The statements, opinions and data contained in all publications are solely those of the individual author(s) and contributor(s) and not of MDPI and/or the editor(s). MDPI and/or the editor(s) disclaim responsibility for any injury to people or property resulting from any ideas, methods, instructions or products referred to in the content. |
© 2025 by the authors. Licensee MDPI, Basel, Switzerland. This article is an open access article distributed under the terms and conditions of the Creative Commons Attribution (CC BY) license (https://creativecommons.org/licenses/by/4.0/).