Abstract
With the increasing number of existing buildings, the implementation of durability-preserving repair procedures is becoming increasingly important. The chemical re-alkalization (CRA) enables the protection of reinforced concrete structures exposed to carbonation by maintaining or restoring the alkalinity in the concrete through the application of an alkaline mortar, such as hybrid alkali-activated binders (HAABs). However, the process of CRA is still insufficiently understood, which means that the requirements for the repair mortars can only be roughly formulated. This paper therefore investigates the process of CRA using laser-induced breakdown spectroscopy (LIBS). Based on the quantitative results of potassium transport in the composite system, a time-dependent attenuation factor can be determined that allows for the adaptation of Fick’s second law of diffusion previously used to predict CRA. The attenuation factor provides further insight into the course of potassium transport, which, based on the results, never follows an ideal diffusion process. Adjusting the diffusion law allows for an improved prediction of the maximum achievable re-alkalization depth depending on the repair mortar, where a potassium content of, e.g., 2.3 wt% leads to a complete re-alkalization of 16 mm. The present study demonstrates the potential of LIBS to quantitatively represent CRA for the first time thus providing new insights into potassium transport and the dynamics of the process.
1. Introduction
The steel reinforcement of concrete buildings often suffers from carbonation-induced corrosion which can reduce the durability of existing structures creating a need for options to counteract corrosion or carbonation of concrete. The focus is primarily on options preserving the existing building structures in order to promote the sustainability of the construction sector and to minimize repair costs.
The protection of the steel reinforcement against carbonation-induced corrosion can be achieved by different methods which include the replacement of the carbonated concrete as well as the application of an alkaline mortar onto the carbonated concrete to restore a pH > 9 within the concrete by the diffusion of the alkaline components from the mortar into the underlying concrete. The latter is referred to as chemical re-alkalization (CRA) which acts as a principle to maintain or rebuild the alkalinity of the concrete [1,2]. As an alternative to Portland cement-based repair mortars (RMs), other materials for chemical re-alkalization such as highly alkaline hydrogels and various alkaline solutions have been tested in the past [3,4]. Even though these materials represent a CO2-reduced alternative to cements, they do not offer any additional protection against re-carbonation. There are different results regarding the resistance of the re-alkalized concrete to re-carbonation, when there is no additional protection against carbonation given by the re-alkalization material itself. In contrast, Mukhin was able to demonstrate a pH value of 10 ten years after re-alkalization using an alkaline solution without any additionally applied carbonation protection on the re-alkalized concrete [5]. On the other hand, this is contradicted by the fact that the evidence of re-alkalization using the phenolphthalein test on a fracture surface of re-alkalized concrete fades again after a short time upon contact with the atmosphere [6]. This would mean rapid re-carbonation of the re-alkalized area.
Still, the use of alternative re-alkalization materials to Portland cement-based mortars offers the opportunity to redefine the performance of repair materials. Basis for the application of new materials to restore the alkalinity in the carbonated concrete is the fundamental understanding of the main processes during the chemical re-alkalization.
A first investigation regarding the transport processes during the re-alkalization process was conducted by Merkel resulting in the assumption that the chemical re-alkalization can be divided into two different phases, the suction phase and the diffusion phase [7]. This differentiation is based on the rate the re-alkalization depth increases with over time. In the suction phase, Merkel observed a rapid, nearly linear progression of the re-alkalization depth within the first day after different cement-based repair mortars were applied on the concrete surface. During this phase, the re-alkalization is said to be primarily driven by the piggyback transport of the alkalis from the mortar into the concrete, due to a moisture gradient between the fresh mortar and the more or less dry concrete. Therefore, the extent of the re-alkalization is strongly influenced by the moisture present in the near-surface of the concrete. After one day, the re-alkalization rate changed into a non-linear progress which, according to Merkel, is mainly controlled by the ambient humidity. This transition is assumed to be due to the hardening of the repair mortar as well as the saturation of the pore structure of the concrete during the suction phase, resulting in a diffusion-based transport of the alkalis within the diffusion phase.
A variation in the re-alkalization rate was also observed by Glawe et al. using hybrid alkali-activated binders (HAABs) as the re-alkalization material [6]. These HAABs consist of a combination of ordinary Portland cement (OPC) and calcined clay which additionally were alkali-activated by a potassium hydroxide solution. In case of the investigation by Glawe et al., the carbonated concrete was pre-wetted before the re-alkalization mortar was applied, leading to a wet concrete in the near-surface area [6]. A water-filled pore structure of the concrete results in a strong decrease in the capillary suction of the concrete from which it can be deduced that the high re-alkalization rate in the first day after application of the mortar is not exclusively due to the suction-based absorbency of the concrete. Still, the substrate concrete and more precisely the water-to-binder ratio (w/b) is shown to have an influence on the re-alkalization rate as it directly influences the porosity of the concrete [8]. A higher w/b therefore results in a coarser structure which leads to more pathways for fluids to be transported through the concrete. By comparing the data from Reus et al. and Glawe et al., the influence of the w/b of the concrete becomes clear as the HAABs show similar or even higher re-alkalization rates although the alkaline solutions provide more moisture for the alkali transport into the concrete (compare Figure 1) [3,6,7,9,10].
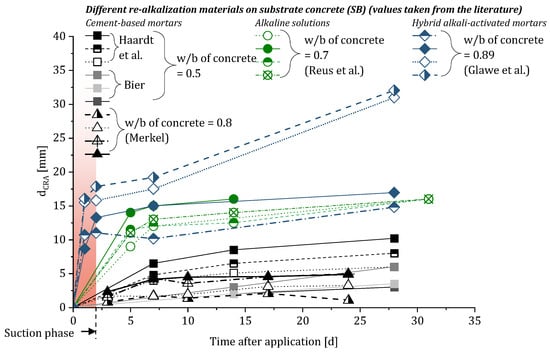
Figure 1.
Summary of the progression of the CRA over time using different substrate concretes based on the literature [3,6,7,9,10].
However, in the first approach Merkel and Réus et al. described the transport processes during the chemical re-alkalization using the root-time-law (compare Equation (1)) assuming a steady decrease in alkali ingress [3]. This decrease is assumed to be higher than the progression of time. The course of the re-alkalization therefore only differs dependent on the used re-alkalization material. The different re-alkalization materials are characterized by the re-alkalization coefficient kCRA.
Réus et al. used the re-alkalization coefficient, which is normally given in mm/t0.5, to compare different alkaline solutions regarding their sufficiency as a re-alkalization material [3]. The comparison showed the highest re-alkalization coefficient for a potassium hydroxide solution. Also, Glawe et al. could correlate an increased re-alkalization rate with a higher amount of potassium hydroxide in the repair mortar [6]. However, it has to be taken into account that the calculation of the coefficient is based on the assumption that there are no different phases within the chemical re-alkalization and that the different re-alkalization materials have an unlimited alkali depot. These assumptions stand in contrast to the differentiation of the different phases during re-alkalization made by Merkel and result in an underestimation of the achieved re-alkalization depth during the suction phase and an overestimation of the maximum re-alkalization depth of the different re-alkalization materials.
To fully understand the different phases of the chemical re-alkalization, further insight into the alkali transport and the changes in the alkali concentration of the repair mortar as well as the concrete is needed.
Therefore, this paper aims to illustrate the alkali transport during the chemical re-alkalization using laser-induced breakdown spectroscopy (LIBS) which allows a quantification of the different components participating in the re-alkalization process. The advantages of LIBS over traditional methods to study the CRA are given in Table 1. Further, the alkali depletion of the re-alkalization material is analyzed to determine the material-specific, maximum expected re-alkalization depth in a specific amount of time. Using the collected data, a model is developed that takes into account the systematic deviation of the re-alkalization process from an ideal diffusion-based process using an attenuation factor.

Table 1.
Comparison of LIBS with traditional analyses method for chemical re-alkalization.
2. Materials and Methods
The investigation of the CRA is based on the analysis of the penetration behavior of alkaline components from a repair layer in the form of a mortar into the substrate concrete. In this study, a concrete based on CEM I 32.5 R cement was used, while the mortar was made from a mixture of metakaolin and CEM I 52.5 R cement. The oxide composition of the different materials is given in Table 2.

Table 2.
Oxide composition of the used binders.
2.1. Preparation of the Concrete
To investigate the penetration behavior of alkalis from the repair material into the concrete substrate, cylindrical samples were first prepared from a concrete class A2 according to TR IH [16]. This concrete class with a maximum grain size of 16 mm and very high w/b ratio of 0.89 is intended to represent particularly porous concretes susceptible to carbonation.
In the first step, cylindrical samples of the A2 concrete with a diameter of 100 mm and a height of 200 mm and 300 mm, respectively, were produced using steel formworks. The concrete mixture is given in Table 3. The cylinders were stored under PE-foil for 48 h and were taken out of the formworks afterwards. Next, the concrete disks were stored in water up to a concrete age of 7 days. At a concrete age of 7 days, each of the cylinders was then cut into 5 disks with a height of 55 mm. One front side was sandblasted to achieve a mean roughness (RZ) depth of 10 mm which ensures a sufficient bond between mortar and substrate concrete in the later process. For further hydration, the disks were then stored at 100% relative humidity (RH) for additional 21 days. After overall 28 days of hydration, the disks were stored at 23 °C and 55% RH as preparation for the following drying process which was started at a concrete age of 35 days. For curing, the concrete disks were stored in a chamber at 60 °C for 21 days until mass constancy. By drying the concrete disks, the aim was to accelerate the subsequent artificial carbonation, since the concrete moisture content has a significant influence on the carbonation rate [17]. Before transferring the concrete disks into the carbonation chamber, the lateral surfaces as well as the non-sandblasted surface was sealed in two layers using a 2-component epoxy resin. The application of the two layers was carried out with a delay of 24 h. Finally, the dried and sealed concrete disks were stored in the carbonation chamber at 1 Vol.-% CO2 at 20 °C and 65% RH for 15 weeks.

Table 3.
Mixtures of the investigated substrate concrete and the repair mortars.
After the carbonation process, the disks were prepared for the application of the different repair materials. For the application, the disks were put into 3D-printed formworks which exceeded the heights of the disks for 20 mm to allow the application of a repair layer of 20 mm thickness. According to [2], a repair layer of 20 mm minimum should be applied to ensure a full chemical re-alkalization of the carbonation depth of up to 40 mm. However, the layer thickness can be adapted according to the exposure class of the carbonated concrete component.
2.2. Pre-Wetting of the Concrete
Before the repair layer was applied on top of the concrete, the sandblasted surface of the concrete disk was pre-wetted twice with a brush at intervals of ten minutes. This method was chosen because it was qualitatively observed in a preliminary test that excessive pre-wetting counteracts the initial suction phase within the chemical re-alkalization. The test was intended to investigate an approach for simplified substrate preparation for CRA.
For the preliminary test, one concrete disk was pre-wetted by storage under water for 24 h and one disk was pre-wetted by brushing with water in two layers while a third disk was not pre-wetted. On top of each disk, a repair mortar was applied as a 20 mm thick layer which was enriched with the fluorescent substance Uranine [18]. After the application, the disks were stored under damp cloth for 24 h. Afterwards, each of the composite systems was split and the resulting cross-sectional area was photographed under UV light.
The result is given in Figure 2. The Uranine enables the qualitative visualization of the moisture penetration from the repair layer into the concrete dependent on the pre-wetting method. It is clearly shown that the pre-wetting procedure of water storage leads to a low penetration of the moisture from the repair layer into the concrete compared to the pre-wetting by brushing. Interestingly, the brushing results in a similar penetration of moisture into the concrete as the non-pre-wetted concrete disks shows. However, pre-wetting of the concrete is essential to prevent excessive capillary suction of the concrete during the first hours after application as this can lead to weak bond behavior between repair layer and concrete and to a deviating w/b of the repair mortar near to the bonding area [19]. To ensure that the brushing is able to pre-wet the concrete in the near-surface area, an additional disk was pre-wetted with an Uranine solution, split and photographed under UV light. The result shows that the brushed solution penetrates into the near-surface area of the concrete and is assumed to act as a barrier against excessive capillary suction within the first hours after application of the repair layer.

Figure 2.
Results of the preliminary test to determine the influence of the pre-wetting method on the suction phase using repair mortars enriched with fluorescent Uranine.
2.3. Application of the Repair Mortar
Before the application of the repair mortars, the concrete disks were put into 3D-printed formworks and were pre-wetted using the brushing method.
The mixtures of the repair mortars are given in Table 3. Except for the reference mixture (OPC), for all mortars, a substitution rate of 50 wt% was used which corresponds to the mixtures used in [6]. As activation solutions, a 50% potassium solution (KOH) was used as well as potassium water glass (KWG) with a silicate modulus of 1.0. The values of 0.5 and 2.3 correspond to the calculated potassium solution in the fresh mortar. The mortars were mixed by first homogenizing the dry components consisting of Metakaolin and a CEM I 52.5 R and the wet components of water, KOH and KWG separately. The values for w/b were calculated by including the solid content of the activator solution to the proportion of the binder and were set to 0.58 for all mixtures. For homogenizing the wet components, the water and the activator solution were put in the mixing bowl and were mixed for 10 s. Before adding the dry components, the cement, metakaolin and sand were homogenized using a wood spatula. The dry components were then added to the mixing bowl followed by a mixing process of 2 min.
After mixing, each mortar was applied on five concrete disks with a layer thickness of 20 mm. After the application, the composite systems were stored under damp cloths and PE-Foil for 24 h. Afterwards, the composite systems were taken out of the formwork and put into an irrigation system, except for one sample per variation, which was directly analyzed. The remaining four samples per variation were exposed to cyclic watering for 1 h with a delay of 23 h for 90 days in total.
2.4. Analysis of the CRA
After the application of the mortar, the composite systems were stored in the irrigation system as described above. Except from the first sample, which was directly analyzed one day after the mortar application, the remaining samples were analyzed at 7, 28 and 90 days of cyclic watering, respectively. The analyses were conducted using the two indicator solutions Phenolphthalein and Mordant Orange 1 as described in [6]. Further, the samples were investigated using laser-induced-breakdown-spectroscopy (LIBS) after 1, 7, 28 and 90 days. The combination of both techniques is supposed to give insight into the alkali transport during the CRA as function of time and enables the correlation of the pH indicators with the quantified potassium concentration by LIBS in the cross-sectional area of the composite systems.
To enable the implementation of both analysis techniques on one sample, the composite systems were cut in half using a saw which enables dry sawing by simultaneously monitoring the temperature of the saw blade. By this, a maximum temperature of 50 °C was maintained to minimize heat-related changes within the sample. When sawing, care was also taken to ensure that the sawing process was carried out from the direction of the concrete towards the applied mortar in order to avoid additional mortar material being introduced into the concrete.
2.4.1. Indicator Tests
The indicator tests were conducted at five different times to analyze the progression of the re-alkalization depth (dCRA) over time. As Glawe et al. characterized the indicator Mordant Orange 1 as a less time-sensitive alternative for Phenolphthalein, both indicators were used in the present study [6]. The characteristics of the indicators is given in Table 4.

Table 4.
Characteristics of the indicator solutions.
The indicators were both applied on the cross-sectional area of one half of the sawn composite system which enable a direct comparison of the displayed dCRA. The values for dCRA were obtained by measuring the thickness of the previously carbonated area that has been colored as a result of the spraying of the indicator, indicating an increase in the pH of the concrete in this area of at least above 9. Although the phenolphthalein test usually indicates a clear turning point, there may still be deviations from the actual pH profile in the samples, which can be determined using optical pH methods, for example [13]. The transition range of the indicator in particular can lead to an underestimation of the CRA as a result of flat pH profiles, as weak coloring occurs in this range. At the same time, interactions between the indicator and the sample can lead to leaching processes, which cause the pH value to rise in the area close to the surface and thus lead to an overestimation of the alkalinity [12]. The measurements were carried out using photographs taken 30 s after spraying the indicator solutions and then processed using the JMicrovision software (vision 1.3.4). The software enables the measurement of the dCRA in each point of the re-alkalization front and the calculation of dCRA of each composite system by averaging all data points after the different storage times, respectively [20].
In the first approach, an attempt was made to calculate the average of the results of the two indicators to determine dCRA, in accordance with the studies by Glawe et al. [6]. However, when using Mordant Orange 1, a very slightly visible re-alkalized area was observed in most cases. Furthermore, the different colors of the re-alkalized zone, as observed by Glawe et al., could not be detected [6]. Therefore, the dCRA values were determined exclusively based on the results of the indicator phenolphthalein.
Still, the use of Mordant Orange 1 enables the identification of another process resulting from the cyclical irrigation during storage. With increasing storage time, a lighter-colored zone became apparent in the near-surface area of the repair mortar. This is assumed to be a hydroxide-depleted zone, resulting from leaching processes caused by regular irrigation of the sample. This zone will be referred to as the depleted zone. Some samples exhibited a depleted zone near the surface of the lateral surfaces. The depletion with increasing storage time can be explained by the unsealed lateral surfaces of the mortar, which were also in contact with water during the cyclic irrigation. To exclude the influence of this areas on the determined re-alkalization depths, a 15 mm edge area was excluded from the evaluation as shown in Figure 3.
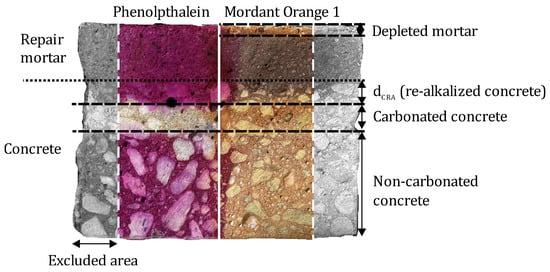
Figure 3.
Representation of the definition of the different areas displayed by the indicator solutions Phenolphthalein and Mordant Orange 1.
Based on the values for dCRA, the re-alkalization coefficient kCRA was determined according to the root-time law as described in the Introduction section. Although the root-time law assumes that there is an infinite alkali buffer within the repair material, which is demonstrated to not be the case later on, the obtained values allow us to roughly compare the different repair materials of this study.
2.4.2. Laser-Induced-Breakdown Spectroscopy
In addition to the indicator tests, the second half of each composite system were analyzed using laser-induced-breakdown-spectroscopy (LIBS) to quantify the potassium ingress in the cross-sectional area of the samples. The focus was on the potassium concentration because potassium was assumed to act as the main active constituent for the CRA using the HAABs of this study which were alkali-activated using a potassium hydroxide solution and potassium water glass. As LIBS is often used to determine the penetration of chloride into concrete, a calibration method was developed to quantify the potassium concentration in the investigated area [11,21].
The following measurements were conducted using equipment by SECOPTA (Teltow, Germany), Model: FiberLIBSlab after 1, 7, 28 and 90 days of storing the composite systems in the irrigation system.
For the calibration to quantify the potassium concentration, calibration mixtures were prepared that gradually cover the potassium content of the materials to be tested. The potassium contents were selected based on the µXRF analysis and the calculated potassium contents of the activator solutions (compare Table 5).

Table 5.
Potassium content of the used components.
The compositions of the calibration mixtures cover a concentration range of 0 to approximately 5 wt% potassium (compare Figure 4).
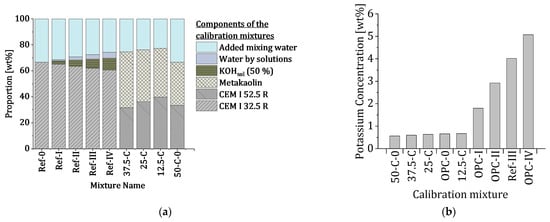
Figure 4.
(a) Composition of the calibration mixtures and (b) range of potassium concentrations (mixtures were sorted in order of the potassium concentration for visualization).
The calibration mixtures were produced by mixing the components in a sealed plastic bag and let them cure for 7 days. After curing, the mixtures were dried in a beaker glass at 105 °C until constant mass was reached. The dried mixtures were crushed using a mortar and then ground in a ball mill for 5 min at 400 turns per minute. The mill was cleaned after each mixture by grinding quartz sand and cleaning with isopropanol. The powder samples were pressed into tablets using a press with a load of 25 tons. Each tablet was put into a sealed plastic bag and stored in a container over silica gel beads to prevent water absorption.
The calibration tablets were measured at each measuring time of the composite systems to take into account any influences of the measuring equipment. For the measurement, the tablets were installed in the LIBS chamber as shown in Figure 5. During the measurement, each measuring point was burst four times. The first burst was discarded to exclude any surface anomalies which could have evolved during the storage of the tablets. The generated spectra of the other three bursts were averaged.
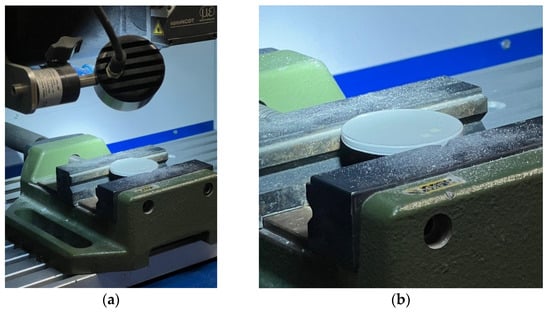
Figure 5.
(a) Installed calibration tablet in the LIBS chamber and (b) magnification of the measuring field.
For the evaluation of the spectra, a differentiation was made depending on the existing potassium concentration. For concentrations up to 3 wt% the characteristic potassium band at 769.896 nm wavelength was analyzed while the quantification of concentrations of 3.0–5.0 wt%, the potassium band at 693.8 nm was analyzed, which is a common procedure as described in [22].
The described evaluation procedure was also applied on the LIBS measurements of the composite systems which enables a quantification of the potassium concentration in wt% relative to the cement content.
To analyze the penetration behavior of potassium in the cross-section of the composite systems, 2D measurements were generated using the LIBS device. The entire measurement field extended to 30 mm width and 75 mm length with a resolution of 0.4 mm per measurement point (compare Figure 6). The width of 30 mm was chosen according to the maximum grain size of the concrete of 16 mm. The measuring field was set individually for each sample to ensure the highest possible proportion of cement matrix within the measurement field. At the same time, the LIBS measurements, as well as the indicator evaluation, did not cover the edge area to exclude any anomalies in the area of the lateral surfaces.
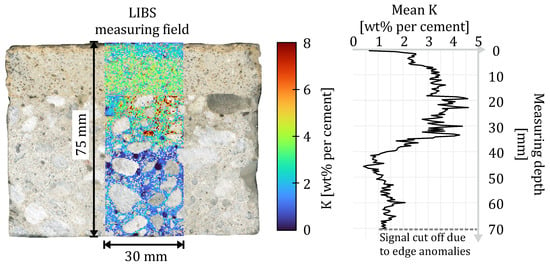
Figure 6.
Exemplary representation of the measuring field of the LIBS measurement with excluded aggregates and the resulting depth profile of the averaged potassium concentration.
In addition to visualizing the potassium distribution in the cross-section of the samples, the LIBS data were analyzed to depict depth profiles of potassium concentration following the extraction of the aggregates [23].
After applying the calibration method on the LIBS Data, the data gives the potassium concentration in wt% relative to the cement. As described above, the potassium concentration was then averaged for each measuring depth to obtain depth profiles of the cross-sectional area of each composite system.
The profiles were further evaluated by determining the penetration depth of potassium at the different measuring times of 1, 7, 28 and 90. For reference, the maximum potassium content in the carbonated concrete was determined using LIBS on a sample to which no repair mortar was applied. The maximum potassium content of the carbonated concrete was determined to be 0.57 wt% relative to the cement. A measured content above this value was assigned to potassium ingress as a result of CRA which enables the determination of the penetration depth of potassium from the repair mortar into the concrete.
Further, the quantified data allows us to calculate a specific diffusion coefficient D(RM) for potassium depending on the different repair mortar [24,25]. The evaluation is based on Fick’s second law of diffusion, for which a one-dimensional diffusion in a semi-infinite medium with a constant surface concentration (compare Equation (2)) is assumed:
The concentration C(x,t) is the concentration of potassium at depth x and time t, which can both be derived from the LIBS measurements after a storage time of one day. It is assumed that within the first day after application of the mortar, alkali transport is dominated by diffusion and the absorption phase only occurs in the first two hours [7]. The surface concentration Cs was derived from the LIBS measurements at the mortar–concrete interface. The erf is an error function to describe the potassium diffusion into the concrete including a decreasing potassium content with increasing depth.
The mortar–concrete interface was determined manually and was set as the surface of the semi-infinite medium to only take into account the diffusion within the substrate concrete (see Figure 7).
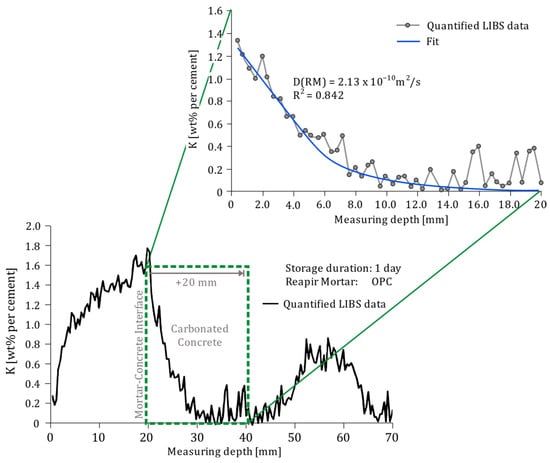
Figure 7.
Example of the evaluation process to determine the potassium diffusion coefficient based on the LIBS depth profiles.
The final depth of the medium was set by cropping the depth profiles 20 mm in direction of the concrete starting at the mortar–concrete interface, resulting in only considering the carbonated concrete and to exclude any other transport processes coming from the non-carbonated concrete such as the rear-side re-alkalization [3].
The parameters Cs and D(RM) were fitted based on the LIBS data between x = 0 and x = 20 mm with a non-linear least-squares optimization. For fitting, Cs was initially set to the maximum measured potassium concentration in the cropped area and D(RM) was assumed to be in the range of 10–11 to 10–12 m2/s as this represents the range of diffusion coefficients of ions like Sodium (Na) or Chloride (Cl) in hardened cement paste [24]. The quality of the fit was evaluated based on the coefficient of determination R2.
2.5. Adaptation of the Diffusion Model to Predict dCRA
In order to calculate the possible maximum re-alkalization depth of each material, a simplified model was applied assuming the re-alkalization process to follow an adapted square-root-time law (Equation (3)) which is commonly applied to model unidirectional diffusion processes in semi-infinite media [24,26]:
where dCRA(t) corresponds to the re-alkalization depth at time t, which depends on the diffusion coefficient D(RM). To consider the deviation of the re-alkalization process from an ideal Fickian (diffusion-based) behavior, as it was already observed by Glawe et al. [6,27], an empirical attenuation factor β is introduced. While β represents the difference between measured dCRA and values which were calculated based on diffusion-based progression of the re-alkalization exclusively, a value of 1 would indicate a purely diffusion-based CRA. Values above 1 indicate that the measured values of dCRA at a given time are higher than the calculated values. This means that the CRA progresses faster compared to diffusion-based transport through, e.g., capillary suction. In comparison, values below 1 represent an attenuated diffusion-based CRA, where the measured values are below the calculated values for dCRA. Therefore, the factor can be used to take into account binding of alkalis or alkali depletion of the repair mortar. The factor can be calculated based on the measured values for dCRA (Equation (4)).
As the processes, which cause the deviation between the re-alkalization process and a diffusions-based process, may change over time, β represents a time-dependent factor. Therefore, the evolution of the attenuation factor was fitted using a power law (Equation (5)).
The attenuation factor at each time can be calculated by fitting a which corresponds to the starting value at t = 1 and b describing how β decreases over time.
To determine β(t), only values for dCRA (measured and calculated) after 1, 7 and 28 days were used to test the transferability of the results to longer re-alkalization periods such as 90 and 180 days. Finally, the calculation of the re-alkalization depth based on the diffusion coefficient D(RM) and the attenuation factor β(t), which are both specific for each re-alkalization material and concrete, was carried out using Equation (6).
3. Results
3.1. Potassium Penetration over Time
The quantification of the LIBS measurements enables the visualization of potassium transport over time during the CRA. The different depth profiles are given in Figure 8 and show the mean potassium concentration of each measuring depth at the different measuring times of all composite systems. The progression of the potassium penetration shows a dependency on the applied repair material and therefore on the present potassium concentration of the material. In accordance with the different compositions of the mortars, the mortars with high potassium content in Figure 8f,g show the strongest increase in concentration within the concrete. It is striking that in some cases after just one day of storage in the irrigation system, the potassium concentration in the concrete is higher than in the mortar itself. This phenomenon becomes more pronounced up to day 28 and results in a sudden increase in the potassium concentration at the transition from mortar to concrete, which is on average about at 20 mm. The potassium-enriched area in the concrete adjacent to the mortar–concrete interface is characterized by a steep slope that decreases over time, indicating further penetration of potassium into the concrete. As the penetration depth progresses further over time, potassium continues to accumulate in the re-alkalized area while the repair layer gets depleted. In case of the repair material 50C 0.5 KOH KWG and 50C 2.3 KOH, the accumulation of potassium in the re-alkalized area results in exceeding the calibration range of the LIBS measurements.
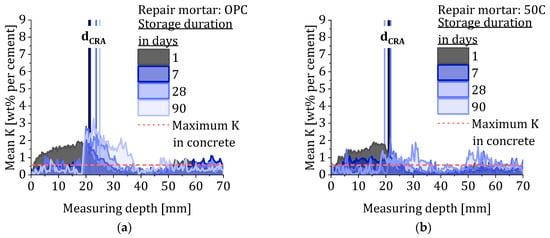
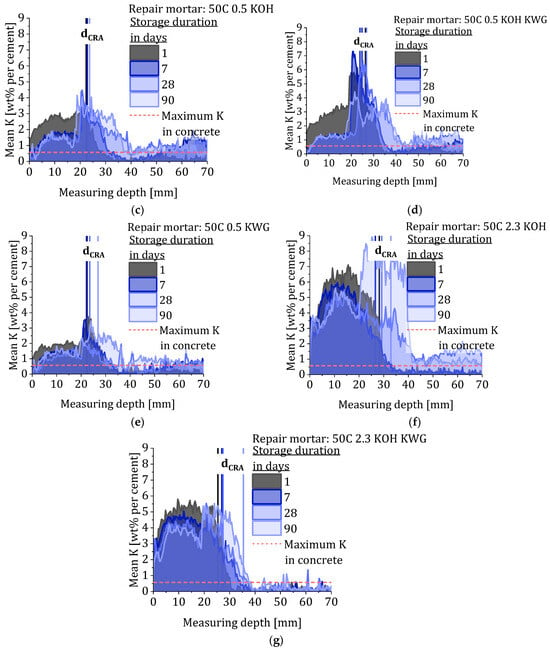
Figure 8.
Quantitative depth profiles showing the mean potassium concentration of the different composite systems after different storage duration and the corresponding values for dCRA and the maximum potassium concentration in the substrate concrete. (a) OPC. (b) 50C. (c) 50C 0.5 KOH. (d) 50C 0.5 KOH KWG. (e) 50C 0.5 KWG. (f) 50C 2.3 KOH and (g) 50C 2.3 KOH KWG.
The temporal development of the potassium concentration in the concrete suggests that the alkalis are bound in the concrete, causing the alkali concentration in the pore solution of the concrete to continually decrease [28,29]. This results in a continuous release of dissolved potassium from the mortar into the concrete, even beyond concentration equilibrium. Further, after 28 days, no further accumulation in the bonding zone between mortar and concrete can be observed but a more even potassium distribution in the re-alkalized area. However, the concentration ratio measured using LIBS refers to the entire material and provides a mixed result of dissolved and bound potassium. A statement about the concentration ratio of dissolved potassium in the mortar and the concrete cannot be made based on these results.
Within the storage duration of 90 days, only the repair mortars with the highest potassium concentration enable full re-alkalization in case of a carbonation depth of 16 mm. However, the repair mortars with medium potassium concentration (0.5) show similar penetration depth, but with lower concentration at the re-alkalization front as well as the overall concentration within the re-alkalized area.
Based on the measured data during the 90-day study period, no uniform concentration distribution could be observed in the composite systems. It would be interesting to see to what extent a uniform potassium concentration is established and to what extent the concentrations in mortar and concrete differ over time.
3.2. Correlation of Indicator Tests and LIBS
The progression of the re-alkalization depth over time is given in Figure 9 and shows that only the materials with high potassium concentration are capable of a steady increase in the re-alkalization depth resulting in full re-alkalization. In case of fully re-alkalized concrete, the value for dCRA was set to 16 mm as this represents the carbonation depth of the substrate concrete.
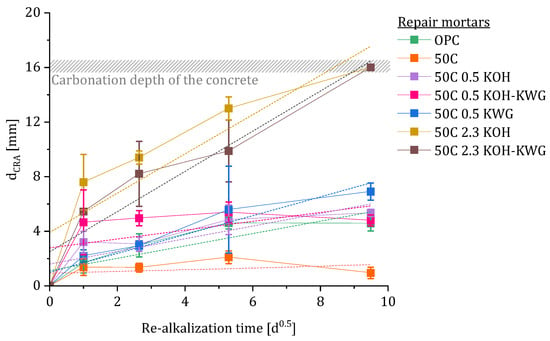
Figure 9.
Evolution of the re-alkalization depth dCRA over time with linear regression to calculate the re-alkalization coefficient kCRA.
Based on the data, the re-alkalization coefficient kCRA was calculated by applying a linear regression on the data. The results are given in Table 6. In case of the 50C and the 50C 0.5 KOH KWG mixture, the linear fit results in a weak measure of certainty accompanied by a low value for kCRA.

Table 6.
Results of the calculation of the re-alkalization coefficient kCRA including the measure of certainty.
Referring to the different phases of the CRA, most of the repair materials show a maximum re-alkalization depth dominated by the suction phase. During the first 24 h after application of the mortar, approximately 50% of the final re-alkalization depth is reached. Even though the LIBS profiles show a steadily increasing penetration depth of the alkalis of all composite systems, the concentration is not sufficient to detect a successful CRA using the indicator. However, the composite systems with high potassium concentration show the highest potassium penetration depth while showing full re-alkalization. By looking at the different activator solutions, a generalized influence of the solution on the potassium penetration behavior cannot be formulated.
To directly compare the results of the indicator tests and the LIBS measurements, the penetration depth of potassium within the carbonated area was determined using the LIBS data. A limit of 0.57 wt% was assumed as the reference value for the concrete, so the depth at which the value in the concrete exceeded this limit was taken as the potassium penetration depth. The limit value represents the maximum potassium concentration of the concrete which was determined by measuring a carbonated concrete sample without an applied repair layer. In this observation, the area outside the carbonated area in the concrete was excluded because redistribution of alkalis may have already occurred at the carbonation front as a result of carbonation [30]. This means that penetration depths of potassium to depths outside the carbonated area were excluded from consideration.
The correlation of the data (compare Figure 10) shows that the penetration depth of potassium is in any case higher than the determined re-alkalization depth. However, there is no direct correlation of the parameters given by a weak measure of certainty (R = 0.385).
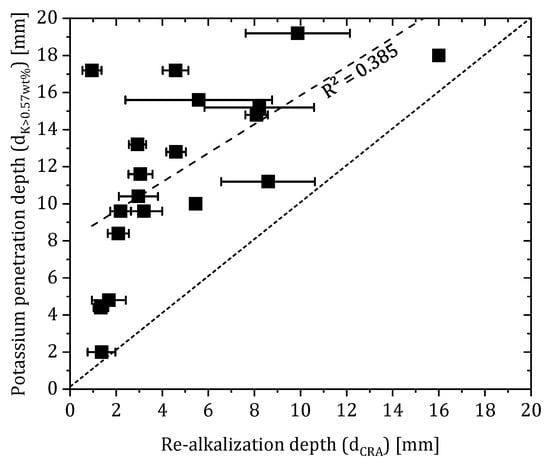
Figure 10.
Correlation of dCRA and the penetration depth of potassium where K > 0.57 wt% (corresponds to the maximum potassium concentration of the substrate concrete).
While this correlation was applied to the totality of the measured values, Figure 11 shows the potassium concentrations at dCRA related to the individual materials. Only at low potassium concentrations in materials without potassium water glass content, an approximately uniform value of the potassium concentration at dCRA is given. The assumption of a concrete-specific critical potassium content for detecting CRA using Phenolphthalein cannot be confirmed based on the data.
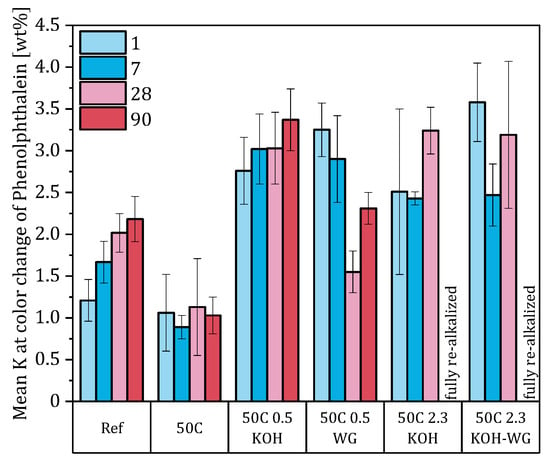
Figure 11.
Potassium concentration at the color change in the indicator.
On the one hand, the irrigation of the repair layer causes leaching in the near-surface area and, on the other hand, the mortar near the bonding zone is depleted of alkalis due to CRA. This occurs to an extent that the mortar loses its alkalinity to such an extent that it falls below the indicator limit of Mordant Orange 1 (compare Figure 12).
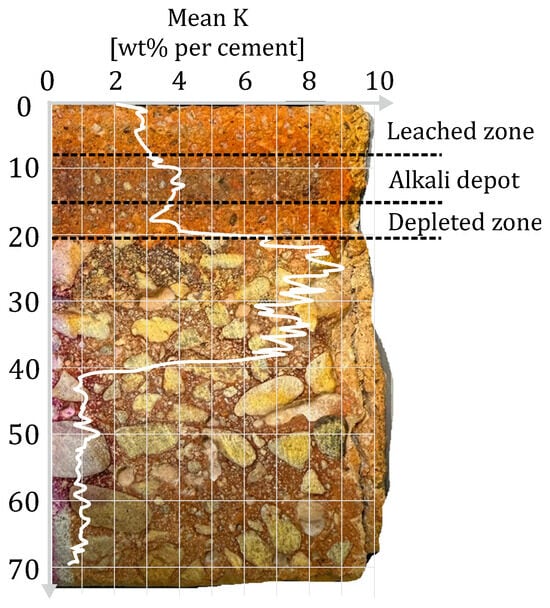
Figure 12.
Visualization of the bi-directional alkaline loss of the repair layer as a result of leaching and CRA.
3.3. Parametrization of the Investigation Results
The results regarding the progression of the CRA and the correlation of the LIBS data with the indicator test results all point out that the connection of the potassium penetration and the CRA is non-linear. Especially the observation that the potassium concentration within the concrete increases over time leading to a depletion of the repair mortar as well as the formation of a potassium concentration plateau in the re-alkalized area indicate that the influence of alkali transport in the concrete on the re-alkalization process is decisive for the evolution of dCRA.
To include this influence into the model to predict dCRA at a specific time, the diffusion coefficient of potassium in the concrete was calculated based on the LIBS data which were obtained one day after the repair mortars were applied. The resulting diffusion coefficient of the different repair materials are given in Table 7.

Table 7.
Fitted diffusion coefficients and surface concentrations of the different composite systems based on the LIBS data obtained after one day.
In most cases, the diffusion coefficient shows a good linear correlation with the re-alkalization coefficient which was calculated as described in [28] (see Figure 13). However, formulations with combined alkaline activation with potassium hydroxide and potassium silicate are outliers. At high potassium concentrations in the mortar (2.3), this leads to excessive re-alkalization compared to diffusion, while at lower potassium concentrations in the mortar (0.5), diffusion proceeds faster than re-alkalization. It is assumed that the interaction of the activators causes a reaction that influences the diffusion of potassium. In contrast to that, the calculation of dCRA based on D(RM) using the root-time law of Equation (1) and replacing kCRA with the correlation formula in Figure 13 results in an unrealistic overestimation of the achieved re-alkalization depth (see Appendix A Figure A1). As Glawe et al. mentioned, also the calculation including the re-alkalization coefficient to adapt Fick’s second law results in an underestimation of the re-alkalization during the suction phase but an overestimation of the long-term performance of the repair material as kCRA is obtained by a linear regression of the measured re-alkalization depth [6].
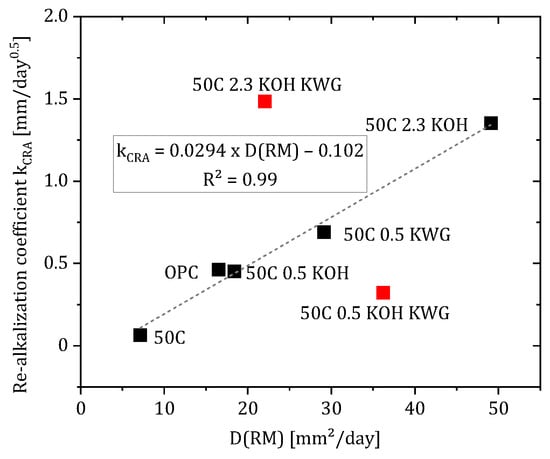
Figure 13.
Correlation of the specific diffusion coefficient and the re-alkalization coefficient with linear regression excluding outliers (50C 2.3 KOH KWG, 50C 0.5 KOH KWG).
Furthermore, a good correlation between D(RM) and kCRA is only present if mixtures with potassium water glass are excluded. To counteract this overestimation, the attenuation factor β was introduced, which no longer assumes an exclusively diffusion-based re-alkalization, but takes into account other influences such as the following:
- Alkali binding in the concrete;
- Structural changes in the mortar;
- Alkali depletion of the repair material.
This allows the attenuation factor to be applied to different materials, as the calculation takes into account the influences of the respective material.
The results of the calculation of β are given in Figure 14 for 1, 7 and 28 days of re-alkalization. The consideration of the attenuation factor at each measuring time compared to the calculation of just one attenuation factor for each material, provides further information about the influences on the process of CRA.
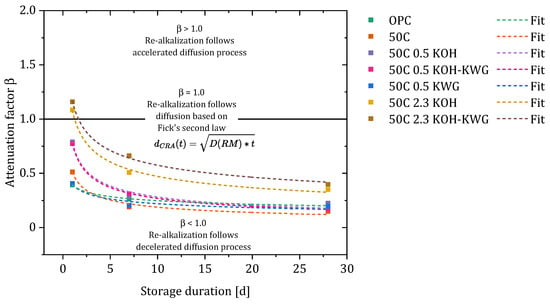
Figure 14.
Evolution and fitting of the attenuation factors of the different materials over time.
The calculated values for β show that the investigated material can lead to a re-alkalization which progresses faster than a diffusion-based progress when the potassium concentration is 2.3 wt%, while a potassium concentration of 0.5 wt% or lower within the repair material results in a re-alkalization process which is slower compared to a diffusion-based process. However, regardless of the material, the re-alkalization process develops into a strongly decelerated diffusion process, which is defined by values of β > 1. At potassium concentrations of ≤ 0.5, the attenuation factors are equalized after just 7 days. This means that the re-alkalization using these materials differs from an exclusively diffusion-based process to the same extend.
By fitting the attenuation factors of the different materials over time, the deviation of the CRA from the diffusion-based curve can be fully accounted for. The data could be best fitted using a power function given in Equation (5). The results of the fitted data can be found in Table 8.

Table 8.
Results of fitting the power equation (Equation (5)) to the attenuation factors of the different materials.
3.4. Prediction of dCRA
Using the fitted data, the re-alkalization depth of the different materials was calculated. The results in comparison to the measured data for dCRA using Phenolphthalein are given in Figure 15. Furthermore, the dCRA was calculated for additional measuring times to test the extent to which forecasts for the further course of re-alkalization are possible using the measured values from 1, 7 and 28 days.
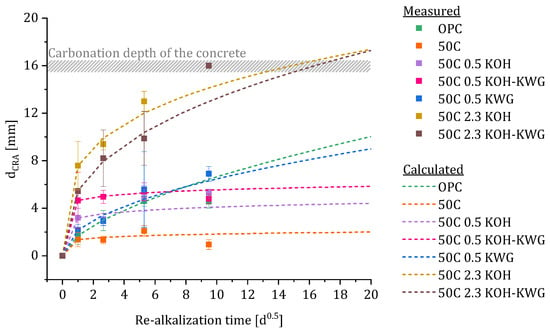
Figure 15.
Comparison of the calculated and measured values for dCRA.
Overall, the measured and calculated values show good agreement. Although the calculation of the attenuation function β(t) was based on only three measured values of the re-alkalization depth, the prediction of re-alkalization depths for re-alkalization periods of 28 days and longer still shows a reliable agreement between the data (compare Figure 16).
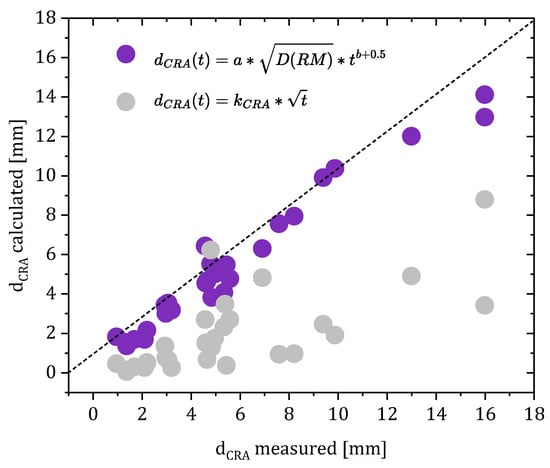
Figure 16.
Correlation of the measured re-alkalization depths and the re-alkalization depth calculated using kCRA compared to the calculation using the attenuation factor β.
In particular, the prediction of the expected maximum re-alkalization depth corresponds to the measured values. Repair mortars with a potassium content of 0.5 wt% and less show very little or even no re-alkalization progress after a period of 90 days.
Compared to the prediction of the re-alkalization depth using the re-alkalization coefficient kCRA the introduction of the attenuation factor results in a considerably more realistic prediction of the CRA and highlights the relevance of considering the two phases of re-alkalization and assuming a non-ideal Fickian process.
4. Discussion
4.1. Comparison of the Results with Previous Studies
The present investigations confirm the applicability of HAABs as a repair material for CRA as stated by Glawe et al. [6]. The present study also showed a clear influence of the potassium content in the repair material on the maximum achievable re-alkalization depth within 90 days. Interestingly, the materials in the studies by Glawe et al. achieved a higher re-alkalization depth in both the suction phase and the diffusion phase, despite significantly stronger pre-wetting of the samples prior to mortar application [6]. This is therefore not consistent with the preliminary studies on pre-wetting the concrete substrate in this study, in which a weaker pre-wetting by brushing the concrete surface with water in two layers should lead to a stronger suction phase. Rather, the suction phase seems to be responsible for a CRA of 50% regardless of the carbonation depth and moisture content of the concrete when a HAAB with at least 0.5 wt% potassium is used.
Based on the observations as described in Section 3.2 and considering the results of all indicator tests at the various measurement times, it becomes clear that the mortars with medium and low potassium concentrations are almost completely depleted of potassium after just 28 days of re-alkalization, as evidenced by the light color of the Mordant Orange 1 indicator. Meanwhile, the phenolphthalein indicator continues to show a pH value above the transition point. Therefore, comparing the indicators is useful for evaluating repair materials, as the durability of the repair material can be assessed using Mordant Orange 1, while phenolphthalein can be used to determine the progress of the CRA and the carbonation resistance of the materials. Therefore, the results of Glawe et al. regarding the evaluation of Mordant Orange 1 as a better indicator for the assessment of CRA cannot be confirmed [6]. This may be due to the fact that the samples tested in this study were sawn samples, whereas previous studies examined broken samples using an indicator. Sawing the samples causes the samples to dry out in the near-surface area, as they were cleaned with compressed air after the sawing process. This suggests a stronger interaction between the indicator and the sample due to suction and leaching effects, which could result in weaker boundaries of the different areas [12]. However, a combination of both indicators is still recommended to investigate both the re-alkalization progress and the alteration of the re-alkalization material.
With regard to the model, the presented determination of the attenuation factor complements existing models such as Merkel’s [7]. Merkel modeled re-alkalization primarily as a function of the substrate concrete, whose diffusion coefficient was corrected by taking tortuosity into account. The investigations also identified a dependence of the diffusion process on the re-alkalization material, which could not be further quantified due to a lack of values for the diffusion of the relevant alkalis in the concrete. In comparison, the present investigations using LIBS enable the determination of mortar-dependent diffusion coefficients of potassium. No adjustment was made for varying substrate concrete, but this should be the subject of future investigations.
4.2. LIBS for the Analysis of CRA
The present study demonstrates the applicability of laser-induced-breakdown spectroscopy to analyze the CRA. Using LIBS, the alkali transport in composite systems can be quantitively visualized in form of 2D mappings which can be transformed into depth profiles. Based on the depth profiles, the penetration depth of potassium can be determined and the potassium content in the range of the re-alkalization depth, which was determined using indicators. The depth profiles further offer the possibility to determine the potassium diffusion coefficient for each composite system specifically.
The correlation of potassium penetration depth and potassium content with the re-alkalization depth performed in the first approach, showed only very weak systematic agreement. This can be explained primarily by the fact that potassium values obtained using LIBS are based on the measurement of the plasma, which includes both the solids and the pore solution contained therein. In contrast, the indicator results are based only on the reaction of the indicator with the pore solution of the material.
The correlation of the diffusion coefficient of the different materials with the re-alkalization coefficient which usually is used to adapt Fick’s second law of diffusion to the re-alkalization process, a connection of both parameters was determined. However, the materials that were activated using the potassium solution in combination with potassium water glass were excluded to obtain a good correlation of the data. The transferability of the diffusion coefficient to the re-alkalization coefficient appears to be limited dependent on the applied re-alkalization material.
Although the reason for the deviation in the two mortar mixtures (50C 0.5 KOH KWG and 50C 2.3 KOH KWG) was not further analyzed, the interaction between the potassium solution and potassium water glass appears to be the cause of the deviations. This assumption is particularly supported by the fact that the formulations activated only with potassium solution or potassium water glass show a good correlation between the diffusion coefficient and kCRA. It should also be noted that the calculation of the diffusion coefficient is based on the determined surface concentration, i.e., the potassium concentration at the interface between concrete and mortar. Since this value (CS) is a fitted value, it depends primarily on a good calibration of the LIBS measurements. However, the measurements, especially at high potassium concentrations, yielded results that were at the limit of the calibration range, which can distort the depth profile by exaggerating the potassium concentration at the interface. A surface concentration that is too high leads to a steeper depth profile and results in a lower diffusion coefficient. In addition to the overestimation of the potassium content, temporary enrichments of potassium in the boundary zone can also lead to a steeper depth profile, which does not necessarily reflect the general diffusion pattern. Overall, the good correlation between D(RM) and kCRA can be explained by the fact that a higher potassium content of the material is associated with an increased CRA.
In some cases, a reduced potassium content can be measured in the LIBS results in the mortar area near the concrete boundary. While this was initially classified as a measurement inaccuracy, the alkali depletion could also be verified using the indicator measurements. Thus, in addition to the increased potassium release into the concrete, there also appears to be an overall decrease in the pH value in this area. This contrasts with the alkaline core of the mortar, which, however, is subject to stress in two directions due to additional leaching. The extent to which this constant depletion affects the re-alkalization behavior could not be determined within the test period.
4.3. Application Potential an Limitation of the Prediction Model
Since the CRA comprises the transport of alkalis through a porous material which is assumed to be a moisture-based process as water in the pores acts as a transport medium for the alkalis, the transport process usually is approximated using diffusion models. To model the CRA, Fick’s second law of diffusion usually is adapted by including the re-alkalization coefficient kCRA which is determined by a linear regression of the re-alkalization depth dCRA over the root of time. The value for kCRA corresponds to the slope of the regression line and is given in mm/√time and assumes an ideal diffusion process. While previous research on CRA agrees that the process is non-linear, this is not taken into account in the root-time law.
As shown in the present study, this simplified assumption results in an overly simplified representation of the re-alkalization process and ultimately in an incorrect assessment of the re-alkalization potential of the different materials. In order to understand the re-alkalization process more precisely, LIBS measurements were carried out, which, in addition to the indicator tests, enable the investigation of the CRA over time.
Based on the LIBS measurements and the generated depth profiles, the diffusion coefficient D(RM) of potassium was determined after a re-alkalization period of one day as a function of the re-alkalization material. Using the diffusion coefficient, the deviation between the theoretical re-alkalization depths and the measured values could be determined, assuming an ideal diffusion process. The resulting systematic error can be incorporated into the modeling of the re-alkalization process as a time-dependent attenuation factor β.
This factor allows for the consideration of both the potassium concentration at the interface between mortar and concrete, as well as the penetration behavior of potassium into the concrete depending on the re-alkalization material. This allows for the increased alkali transport during the suction phase, which occurs within the first 24 h after mortar application, to be taken into account.
Subsequent processes such as the binding of alkalis in the carbonated concrete and the saturation of the concrete, as well as the depletion of the mortar, lead to a decrease in the re-alkalization rate. This decrease results in an increasing deviation of the re-alkalization process from an ideal diffusion process, which causes it to deviate further from the previously applied root-time law over time. If a continuous, infinite re-alkalization is assumed in the root-time law, the reducing influence of these processes named above is taken into account when applying the attenuation factor.
Thus, based on the LIBS measurement after one day and the determination of re-alkalization depths at least three time points within 28 days, a material-specific attenuation factor can be calculated, which can be used to model the re-alkalization process. This not only improves the coefficient of determination of the prediction but also requires fewer values that could theoretically be determined within a quick test in the laboratory. Furthermore, by determining the reduction factor, a systematic deviation of the re-alkalization process from the ideal diffusion process could be parameterized for the first time.
The materials differ primarily in their initial attenuation factor during the suction phase, which is influenced not only by the moisture content difference but also by the concentration difference between mortar and concrete. Over time, the attenuation factor of the materials decreases in a similar manner, which presumably reflects less of an influence of the repair mortar than of the concrete, which was the same for all composite systems. It should be noted that concrete with an extremely high w/b ratio and porosity was selected in order to accelerate the re-alkalization process. However, the determination of the attenuation factor can be applied to cement-based concretes with a lower w/b ratio leading to a lower porosity, as it can be assumed that lower porosity primarily only leads to a slowdown of the CRA. Other factors affecting the attenuation factor, such as the binding of alkalis in the concrete and the effects of the repair material, continue to apply. Finally, it should be noted that according to the present calculations, the re-alkalization process never follows an ideal diffusion process, which would be characterized by an attenuation factor of 1.
Nevertheless, the prediction described is only an approximation of the real data, since the re-alkalization process is underestimated, especially at high potassium concentrations. This discrepancy may be due to the fact that the present data are based on samples that were fully re-alkalized at high potassium concentrations within the 90-day measurement period. Thus, correlation between the calculated and measured data is only possible to a limited extent, since a precise value for the actual re-alkalization depth cannot be determined with complete re-alkalization. In this case, the dCRA value was assumed to be equal to the carbonation depth, which, however, was only determined using a reference sample. Due to the inhomogeneous structure of concrete, certain deviations in the carbonation depth within a sample are to be expected [20,30].
5. Conclusions
The present study demonstrates the applicability of LIBS for the quantitative analysis of CRA to derive the material-specific diffusion coefficient, which can be used to calculate an attenuation factor that allows an improvement in the predictability of the re-alkalization process. By comparing the different investigation methods, in addition to the parameterization of the results, further insights into the re-alkalization process and the influence of the different re-alkalization materials could be gained. The main findings can be summarized as follows:
- During CRA, potassium accumulation in the concrete exceeds the concentration equilibrium between concrete and mortar, which indicates binding of potassium in the carbonated concrete. This enrichment occurs at the expense of the repair mortar, which becomes depleted of alkalis in the interface to the concrete.
- Using LIBS measurements, a diffusion coefficient D(RM) can be determined, which can be used to determine the deviation of the re-alkalization process from a process based on Fick’s second diffusion law. This deviation can be parameterized as a time-dependent attenuation factor β(t).
- By adapting the diffusion law through the attenuation factor, the re-alkalization process in the suction and diffusion phase can be modeled, so that a comparison of the different materials with regard to the expected maximum re-alkalization depth is possible. This is crucial when the alkali concentration in the re-alkalization material is high compared to cement-based mortars, so as not to underestimate the re-alkalization potential of these materials.
- As a result of cyclical irrigation, the re-alkalization mortar is subjected to stress in two directions, which is characterized on the one hand by leaching and on the other hand by the excessive release of alkalis into the substrate.
- Although pre-wetting the concrete influences the absorption behavior of the concrete, this does not directly correlate with the re-alkalization progress during the suction phase of the CRA. A less pre-wetted substrate concrete does not automatically result in faster re-alkalization during the suction phase.
6. Outlook
While the present study demonstrates the time-dependent deviation of the CRA from an ideal diffusion process, which can be taken into account by introducing the attenuation factor, the validation of this adaptation should be expanded to more material variations and longer re-alkalization periods. In this context, the alteration effects in the mortar should be investigated in more detail with regard to their limiting influence on the CRA and, if necessary, quantified in order to further refine the prediction model. The influence of the substrate concrete should also be further investigated to determine the influence of a possible rear-side re-alkalization. For the practical development of CRA, systematic investigations should be carried out with regard to the pre-wetting of the substrate concrete. Since the re-alkalization mortar is subjected to stress in two directions, the increased leaching of alkalis should be counteracted by optimizing the material. In addition, the influence of carbonation of the repair mortar and its effects on the CRA should also be investigated.
Author Contributions
Conceptualization, methodology, software, validation, formal analysis, investigation, resources, data curation, writing—original draft preparation and visualization, C.G.; writing—review and editing, supervision and project administration, C.G. and M.R. All authors have read and agreed to the published version of the manuscript.
Funding
This research was funded by the German Research Foundation (DFG) under the grant number 540001237.
Data Availability Statement
Not applicable.
Acknowledgments
Many thanks to Gesa Kapteina, Marcus Illguth and Milena Hüging for the LIBS analyses.
Conflicts of Interest
The authors declare no conflicts of interest.
Abbreviations
The following abbreviations are used in this manuscript:
| CRA | Chemical re-alkalization |
| dCRA | Re-alkalization depth |
| D(RM) | Specific diffusion coefficient for a repair mortar |
| HAABs | Hybrid alkali-activated binders |
| kCRA | Re-alkalization coefficient |
| KWG | Potassium water glass |
| LIBS | Laser-induced-breakdown spectroscopy |
| OPC | Ordinary Portland cement |
Appendix A
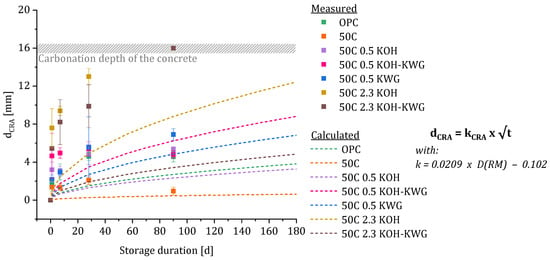
Figure A1.
Comparison of the measured values and the values which were calculated based on the root-time law using the diffusion coefficient after 1 day to replace the re-alkalization coefficient (determined after 90 days).

Table A1.
Composition of the LIBS calibration mixtures.
Table A1.
Composition of the LIBS calibration mixtures.
| Mix.-No. | Name | CEM I 32.5 | CEM I 52.5 | Metakaolin | KOHsol (50 %) | KWG (Silicate Modulus 1.0) | Water by Solutions | Added Mixing Water | K |
|---|---|---|---|---|---|---|---|---|---|
| g | wt% | ||||||||
| 1 | Ref-0 | 100 | - | - | - | - | - | 50 | 0.656 |
| 2 | Ref-I | 100 | - | - | 3.75 | - | 1.875 | 48.125 | 1.795 |
| 3 | Ref-II | 100 | - | - | 7.5 | - | 3.75 | 46.25 | 2.921 |
| 4 | Ref-III | 100 | - | - | 11.25 | - | 5.625 | 44.375 | 4.018 |
| 5 | Ref-IV | 100 | - | - | 15.0 | - | 7.5 | 42.5 | 5.070 |
| 6 | 37.5-C | - | 62.5 | 85.0 | - | - | - | 50.0 | 0.595 |
| 7 | 25-C | - | 75.9 | 84.0 | - | - | - | 50.0 | 0.633 |
| 8 | 12.5-C | - | 87.5 | 83.0 | - | - | - | 50.0 | 0.667 |
| 9 | 50-C-0 | - | 50.0 | 50.0 | - | - | 50 | 0.560 | |
References
- DIN EN 1504-9:2008; Products and Systems for the Protection and Repair of Concrete Structures—Definitions, Requirements, Quality Control and Evaluation of Conformity—Part 9: General Principles for the Use of Products and Systems. Beuth: Berlin, Germany, 2008.
- Deutsches Institut für Bautechnik (DIBt). Technische Regel—Instandhaltung von Betonbauwerken (TR Instandhaltung)—Teil 2: Merkmale von Produkten oder Systemen für die Instandsetzung und Regelungen für Deren Verwendung; Deutsches Institut für Bautechnik (DIBt): Berlin, Germany, 2020. [Google Scholar]
- Réus, G.C.; Medeiros, M.H.F. Chemical realkalization for carbonated concrete treatment: Alkaline solutions and application methods. Constr. Build. Mater. 2020, 262, 120880. [Google Scholar] [CrossRef]
- Jung, A.; Weichold, O. Preparation and characterisation of highly alkaline hydrogels for the re-alkalisation of carbonated cementitious materials. Soft Matter 2018, 14, 8105–8111. [Google Scholar] [CrossRef]
- Mukhin, P. Long-term durability of passive realkalization solution in concrete remediation: A 10-year old field study. In Proceedings of the Australasian Corrosion Association Conference, Cairns, Australia, 10–14 November 2024; The Australasian Corrosion Association Inc.: Cairns, Australia. [Google Scholar]
- Glawe, C.; Raupach, M. Application of hybrid alkali-activated binders for chemical re-alkalization. Mater. Struct. 2025, 58, 212. [Google Scholar] [CrossRef]
- Merkel, M. Realkalisierungspotenzial von Zementgebundenen Werkstoffen im Trinkwasserbereich. Ph.D. Thesis, Technische Universität Kaiserslautern, Kaiserslautern, Germany, 15 July 2021. [Google Scholar]
- Wang, Y.; Li, L.; An, M.; Sun, Y.; Yu, Z.; Huang, H. Factors Influencing the Capillary Water Absorption Characteristics of Concrete and Their Relationship to Pore Structure. Appl. Sci. 2022, 12, 2211. [Google Scholar] [CrossRef]
- Bier, T.A. Carbonation and Realkalization of Cement Paste and Concrete. Ph.D. Thesis, Universität Fridericiana zu Karlsruhe, Karlsruhe, Germany, 23 December 1987. [Google Scholar]
- Haardt, P.; Hilsdorf, H.K. Realkalisierung karbonatisierter Betonrandzonen durch großflächigen Auftrag zementgebundener Reparaturschichten. In Berichtsband zu Werkstoffwissenschaften und Bauinstandsetzen (MSR III-93); Expert Verlag: Tübingen, Germany, 1993; pp. 666–683. [Google Scholar]
- Wilsch, G.; Weritz, F.; Schaurich, D.; Wiggenhauser, H. Determination of chloride content in concrete structures with laser-induced breakdown spectroscopy. Constr. Build. Mater. 2005, 19, 724–730. [Google Scholar] [CrossRef]
- Bernal, S.A.; Dhandapani, Y.; Elakneswaran, Y.; Gluth, G.J.G.; Gruyaert, E.; Juenger, M.C.G.; Lothenbach, B.; Olonade, K.A.; Sakoparnig, M.; Shi, Z.; et al. Report of RILEM TC 281-CCC: A critical review of the standardised testing methods to determine carbonation resistance of concrete. Mater. Struct. 2024, 57, 173. [Google Scholar] [CrossRef]
- Sakoparnig, M.; Galan, I.; Müller, B.; Mittermayr, F.; Juhart, J.; Grengg, C. Optical pH imaging reveals what phenolphthalein conceals–A carbonation study on blended cements. Cem. Concr. Res. 2024, 186, 107681. [Google Scholar] [CrossRef]
- Plusquellec, G.; Geiker, M.R.; Lindgård, J.; Duchesne, J.; Fournier, B.; De Weerdt, K. Determination of the pH and the free alkali metal content in the pore solution of concrete: Review and experimental comparison. Cem. Concr. Res. 2017, 96, 13–26. [Google Scholar] [CrossRef]
- Ranger, M.; Hasholt, M.T.; Barbosa, R.A. Pore solution alkalinity of cement paste as determined by Cold Water Extraction. Cement 2023, 11, 100055. [Google Scholar] [CrossRef]
- Deutsches Institut für Bautechnik (DIBt). Technische Regel—Instandhaltung von Betonbauwerken (TR Instandhaltung)—Teil 1: Anwendungsbereich und Planung der Instandhaltung; Deutsches Institut für Bautechnik (DIBt): Berlin, Germany, 2020. [Google Scholar]
- Thiel, C.; Kratzer, J.; Grimm, B.; Kränkel, T.; Gehlen, C. Effect of Internal Moisture and Outer Relative Humidity on Concrete Carbonation. CivilEng 2022, 3, 1039–1052. [Google Scholar] [CrossRef]
- Loehmannsroeben, H.-G.; Roch, T.; Schaefer, R.; Schultze, R.; Vereecken, H. Laser-induced fluorescence (LIF) spectroscopy for in-situ analysis of fluorescence tracers in water and soils. In Remote Sensing of Vegetation and Water, and Standardization of Remote Sensing Methods; SPIE: Bellingham, WA, USA, 1997; Volume 3107, pp. 207–216. [Google Scholar] [CrossRef]
- Courard, L.; Lenaers, J.-F.; Michel, F.; Garbacz, A. Saturation level of the superficial zone of concrete and adhesion of repair systems. Constr. Build. Mater. 2011, 25, 2488–2494. [Google Scholar] [CrossRef]
- Glawe, C.; Georget, F.; Raupach, M.; Matschei, T. Multi technique characterization of the carbonation affected zone uncluding non-destructive sindle sided 1H NMR. Cem. Concr. Res. 2024, 178, 107438. [Google Scholar] [CrossRef]
- Šavija, B.; Schlangen, E.; Pacheco, J.; Millar, S.; Eichler, T.; Wilsch, G. Chloride ingress in cracked concrete: A laser induced breakdown spectroscopy (LIBS) study. J. Adv. Concr. Technol. 2014, 12, 425–442. [Google Scholar] [CrossRef]
- Molkenthin, A. Laser-Induzierte Breakdown Spektroskopie (LIBS) zur Hochauflösenden Analyse der Ionenverteilung in Zementgebundenen Feststoffen. Ph.D. Thesis, Universität Duisburg-Essen, Essen, Germany, 12 November 2008. [Google Scholar]
- Pourbozorgi Langroudi, P.; Kapteina, G.; Illguth, M. Automated Distinction between Cement Paste and Aggregates of Concrete Using Laser-Induced Breakdown Spectroscopy. Materials 2021, 14, 4624. [Google Scholar] [CrossRef] [PubMed]
- Ziehensack, E.; Keßler, S.; Angst, U.; Hilbig, H.; Gehlen, C. Diffusion potentials in saturated hardened cement paste upon chloride exposure. Mater Struct 2023, 56, 100. [Google Scholar] [CrossRef]
- Mateo, J.; García, M.C.; Rodero, A. Using laser-induced breakdown spectroscopy for the study of chloride diffusion in mortar and concrete. Constr. Build. Mater. 2023, 385, 131520. [Google Scholar] [CrossRef]
- Mangat, P.S.; Molloy, B.T. Prediction of free chloride concentration in concrete using routine inspection data. Mag. Concr. Res. 1994, 46, 279–287. [Google Scholar] [CrossRef]
- Glawe, C.; Raupach, M. Basics and new opportunities for chemical re-alkalisation of carbonated concrete, including alkali-activated binders. Mag. Concr. Res. 2024, 76, 1185–1197. [Google Scholar] [CrossRef]
- Zajac, M.; Song, J.; Ullrich, P.; Skocek, J.; Ben Haha, M.; Skibsted, J. High early pozzolanic reactivity of alumina-silica gel: A study of the hydration of composite cements with carbonated recycled concrete paste. Cem. Concr. Res. 2024, 175, 107345. [Google Scholar] [CrossRef]
- De Weerdt, K.; Plusquellec, G.; Revert, A.B.; Geiker, M.; Lothenbach, B. Effect of carbonation on the pore solution of mortar. Cem. Concr. Res. 2019, 118, 38–56. [Google Scholar] [CrossRef]
- Georget, F.; Soja, W.; Louise Scrivener, K. Characteristic lengths of the carbonation front in naturally carbonated cement pastes: Implications for reactive transport models. Cem. Concr. Res. 2020, 134, 106080. [Google Scholar] [CrossRef]
Disclaimer/Publisher’s Note: The statements, opinions and data contained in all publications are solely those of the individual author(s) and contributor(s) and not of MDPI and/or the editor(s). MDPI and/or the editor(s) disclaim responsibility for any injury to people or property resulting from any ideas, methods, instructions or products referred to in the content. |
© 2025 by the authors. Licensee MDPI, Basel, Switzerland. This article is an open access article distributed under the terms and conditions of the Creative Commons Attribution (CC BY) license (https://creativecommons.org/licenses/by/4.0/).