Article

Optimizing Anti-Corrosive Properties of Polyester Powder Coatings Through Montmorillonite-Based Nanoclay Additive and Film Thickness

by
Marshall Shuai Yang
1,2,*,
Chengqian Xian
3,4,
Jian Chen
1,
Yolanda Susanne Hedberg
1,2,5,* and
James Joseph Noël
1,2,5,*
1
Department of Chemistry, The University of Western Ontario, London, ON N6A 5B7, Canada
2
Carbon to Metal Coating Institute, Queen’s University, Kingston, ON K7L 3N6, Canada
3
Department of Statistical and Actuarial Sciences, The University of Western Ontario, London, ON N6A 5B7, Canada
4
Department of Statistics and Actuarial Science, University of Waterloo, Waterloo, ON N2L 3G1, Canada
5
Surface Science Western, London, ON N6G 0J3, Canada
*
Authors to whom correspondence should be addressed.
Corros. Mater. Degrad. 2025, 6(3), 39; https://doi.org/10.3390/cmd6030039
Submission received: 19 July 2025 / Revised: 14 August 2025 / Accepted: 21 August 2025 / Published: 25 August 2025

Abstract

This research investigates the impact of incorporating montmorillonite-based nanoclay additives on the anti-corrosive properties of a polyester/triglycidyl isocyanurate (polyester/TGIC) powder coating on phosphated steel. The self-repairing capability facilitated by the swelling and expansion of nanoclay was demonstrated to enhance the corrosion resistance of the coatings significantly. A statistical Mixture Design methodology was employed to establish the optimal combination of nanoclay dosage and coating film thickness. Nineteen experiments were conducted using Design of Experiments, and two regression models were developed using the measured polarization resistance (Rp) and specular gloss values as responses. The mathematical maximization of the Rp value predicted an optimal nanoclay dosage of 4.1% with a corresponding film thickness of 80 µm. Statistical and experimental verification validated the results obtained from the regression models. Notably, the optimized coating demonstrated an Rp value one order of magnitude higher than the coating with 4% nanoclay and a standard film thickness of 60 µm. The behavior of the newly developed coatings was analyzed and compared through measurements of open circuit potential, polarization resistance, and electrochemical impedance spectroscopy. The findings confirm the substantial improvement in the anti-corrosive and self-repairing properties of the polyester/TGIC powder coating with the incorporation of montmorillonite-based nanoclay additives.

Graphical Abstract

1. Introduction

Powder coating reduces energy use relative to liquid coatings and enables reclaim of overspray, improving material efficiency [1,2,3]. Its superior film building also permits higher per-coat thickness, reducing layer count and increasing throughput [1,4]. This characteristic significantly boosts production efficiency and reduces the number of coating layers required to achieve the desired thickness.
A coating formulation typically comprises essential ingredients, including binders (resins and cross-linking agents), pigments, fillers, and various additives. Understanding the intricate interactions between these components necessitates thorough experimental investigations [5]. Additionally, film thickness plays a crucial role in coating application and performance assessment, further complicating the optimization of a given coating system [1,6]. Inappropriate film thickness can lead to severe defects where low thickness fails to provide adequate substrate coverage, necessitating increased pigment load to enhance hiding power (opacity) [1,7,8]. Conversely, a higher film thickness is desirable to reduce water and gas permeability and enhance the leveling velocity during curing, thereby improving surface smoothness [9,10]. However, excessive film thickness can lead to a coating defect known as the “fat edge,” where the edges of workpieces exhibit this defect [11]. It can also cause poor adhesion or internal stress. Careful formulation and application parameter designs, including optimizing film thickness, are crucial to minimizing this unevenness.
Mixture Design—a special case of response surface methodology (RSM) within Design of Experiments (DOE)—is well-suited to multi-component coatings, enabling prediction and optimization of performance [12,13].
Clays used in coating systems can be broadly classified into cationic layered silicates (e.g., montmorillonite, hectorite) and anionic layered double hydroxides (LDHs) [14]. Montmorillonite consists of negatively charged aluminosilicate layers balanced by interlayer cations, offering high-aspect-ratio platelets that create a tortuous path for corrosive species [15]. LDHs, in contrast, have positively charged hydroxide layers with interlayer anions, enabling intercalation and controlled release of corrosion inhibitors. Both types have demonstrated potential in organic coatings; cationic clays (e.g., montmorillonite) primarily enhance barrier/tortuosity, whereas anionic LDHs can deliver active protection via inhibitor release.
Recent advances underscore the growing utility of nanoclays in modern coating applications. Cai et al. [16] highlighted that nanoclays have emerged as highly effective fillers in anticorrosion coatings, demonstrating enhanced barrier performance across multiple polymer matrices. Similarly, Haghi et al. [17] showed that acid-modified montmorillonite nanoclay significantly improved corrosion resistance when integrated into acrylic electrocoatings. A review by Affaf et al. [18] further corroborated montmorillonite’s advantages in smart coatings, including hydrophobicity, mechanical reinforcement, and enhanced dispersion for corrosion protection.
In our previous investigation, we conducted a comparative analysis of two nanoclay additives in a polyester/TGIC powder coating system [19]. The study demonstrated that both nanoclays significantly enhanced the anti-corrosive properties of the coatings by imparting barrier properties and self-repairing effects. Particularly, the nanoclay with a larger particle size exhibited the most favorable performance at a dosage of 4%, as evidenced by electrochemical measurements.
Building on these promising findings, this study further examines nanoclay-containing coatings with larger particle sizes, focusing on different film thicknesses. The Design of Experiment (DOE) approach was used, with the additive/binder dosage (content wt.%) as the key composition, while film thickness was varied as the process parameter. Important coating properties, such as polarization resistance (Rp) and specular gloss, were measured to assess coating performance. This study aims to determine the optimal conditions for both nanoclay additive content and film thickness for an anti-corrosive coating on phosphated steel.

2. Experimental

2.1. Statistical Method of Mixture Design

The components in the Mixture Design model adhere to the constraint defined in Equation (1):
i = 1 q x i = 1 ; x i 0 ;   i = 1 , , q
where q is the number of components and xi represents the proportion of the ith mixture component.
The Mixture Design model combines a multiplicative approach, integrating Scheffé’s cubic model for q mixture components (x1,…,xq) and a reduced quadratic model for r process variables (z1,…, zr). This combined model is expressed as Equation (2) [20]:
C γ , x , z = i = 1 q γ i 0 x i + i < j q γ i j 0 x i x j + i < j < k q γ i j k 0 x i x j x k +   l = 1 r i = 1 q γ i l x i + i < j q γ i j l x i x j +   i < j < k q γ i j k l x i x j x k z l +   l < m r i = 1 q γ i l m x i + i < j q γ i j l m x i x j + i < j < k q γ i j k l m x i x j x k z l z m
where C is the response variable (e.g., in our study, it is polarization resistance (Rp value)) and γ’s are the regression coefficients in the model.
Equation (3) represents the simplified model combining Scheffé’s quadratic model for two mixture components (x1) and (x2) and a linear model for one process variable (z):
C γ , x , z = γ i 0 x 1 +   γ i 0 x 2 +   γ i 0 x 1 x 2 +   γ i 0 x 1 +   γ i 0 x 2 +   γ i 0 x 1 x 2 z
In the DOE conducted for this study, I-optimal design, also known as IV (Integrated Variance), was employed. The criterion for this design approach is to minimize the average prediction variance [12,20], ensuring robust and accurate results. Through regression analysis, models were derived to identify the optimal conditions, and these models were subsequently validated through additional experiments.
The electrochemical properties of multiple coating samples were characterized and compared to evaluate the effects of film thickness comprehensively. The goal was to gain insights into how varying film thickness influences the electrochemical performance of the coatings. This study aimed to investigate the correlations between film thickness and the observed electrochemical properties of the coatings.

2.2. Materials and Coating Formulations

In this study, a surface-modified montmorillonite (MMT) with a surface treatment based on dimethyl dihydrogenated tallow ammonium compounds, Claytone® HT from BYK USA Inc. (Wallingford, CT, USA), was incorporated as an anti-corrosive additive/filler into the polyester/TGIC powder coating system. It is referred to as a nanoclay based on its structural characteristics in polymer composites. While the as-supplied powder appears micron-sized due to tactoid agglomerates typically ranging from 2 to 40 µm, each individual silicate platelet has a thickness of approximately 0.9–1.5 nm.
Four levels were selected to optimize the dosage of the additive: 2%, 4%, 6%, and 8%. Beyond 4% dosage, a diminishing enhancement in performance was observed, and higher dosages resulted in severe defects in the coatings.
The process variable chosen for investigation was the film thickness, ranging from 40 µm to 80 µm. Below 40 µm, the coating surfaces exhibited poor flow and leveling, leading to a sandpaper-like visual appearance and inadequate substrate coverage. On the other hand, film thicknesses above 80 µm resulted in excessive coating material, causing sagging and the “fat edge” effect, which led to uneven film thickness, particularly along the panel edges.
The experimental design and statistical analysis were conducted using Design-Expert® Version 13.0.9.0 by Stat-Ease Inc. (Minneapolis, MN, USA) [21]. Table 1 presents the experimental design with target film thicknesses, and the sequence of experiments was randomized to minimize bias. All panel preparation and testing were executed using the assigned run numbers.

2.3. Preparation of Powder-Coated Panels

Consistency was maintained across the powder coating manufacturing (dry blending, extrusion, and pulverization), electrostatic powder spraying, and curing processes. Phosphated steel panels (model No. S-36-I, dimensions: 76 mm × 152 mm × 0.81 mm; ASTM D609 Type 2 [22]; Q-Lab Corporation, Westlake, OH, USA) were used as the coating application substrate.
Film thickness measurements were conducted using a non-destructive film thickness gauge, the PosiTector 6000 (DeFelsko Corporation, Ogdensburg, NY, USA), following the ASTM D7091–22 [23] standard. Additionally, the cross-section thicknesses were measured using scanning electron microscopy (SEM) with a Hitachi SU3500 Variable Pressure SEM (Hitachi High-Tech Corporation, Tokyo, Japan). The coated panels, with film thicknesses within ±5 µm of the values specified in the DOE, were selected for testing and characterization.

2.4. Coating Performance Evaluations

To assess the surface quality of the coatings, specular gloss measurements were taken as an additional response using a Rhopoint IQ 20/60 gloss meter (goniophotometer, Rhopoint Instruments Ltd., Hastings, UK), following the ASTM D523–14 [24] standard. Confocal laser scanning microscopy (CLSM, by a Zeiss LSM800 For Materials, Carl Zeiss Microscopy GmbH, Jena, Germany) was utilized to map the surface morphology and measure the surface roughness as Sa and Sz values.
Open circuit potential (OCP), linear polarization resistance (LPR), and electrochemical impedance spectroscopy (EIS) measurements were conducted utilizing a Solartron ModuLab XM potentiostat coupled with a frequency response analyzer (AMETEK Scientific Instruments, Oak Ridge, TN, USA) using a standard three-electrode electrochemical cell within a Faraday cage, with the coated panels functioning as the working electrode. A saturated calomel electrode (SCE) and a platinum wire were utilized as the reference and counter electrodes, respectively. The spatial arrangement of the three electrodes was consistently maintained throughout the measurements.
These measurements were executed consecutively at 24 h intervals until a rust grade of 9-G (0.03% rusted) in the general rusting category was attained, following the ASTM D610–08 (Reapproved 2019) [25] protocol. Polarization resistance (Rp), obtained through a well-established, rapid technique, LPR, is a parameter for evaluating corrosion resistance in coatings and an indicator of the coatings’ barrier effect. It was determined at a scan rate of DC 10 mV/min within the OCP ± 10 mV range. Electrochemical impedance spectroscopy (EIS) was performed over a frequency range of 10 mHz to 100 kHz, using a sinusoidal perturbation with an amplitude of 10 mV. The EIS spectra were subsequently analyzed using ZView software, version 4.0c (Scribner Associates, Southern Pines, NC, USA).
Both surfaces and edges of the substrate panels were coated to achieve a uniform film thickness, and they were subsequently immersed in a 500 mL beaker containing a 5 wt.% NaCl solution, prepared using Type I water with a resistivity of 18.2 MΩ∙cm (Sigma-Aldrich, Burlington, MA, USA). The total exposed area of each test panel was standardized at 123.5 cm2. The powder coatings exhibited adequate edge coverage, attributed to the “wrap-around” phenomenon induced by the electric field during the spraying process.

3. Results and Discussion

3.1. Measured Values and Resulting Regression Models

The Rp value was previously established as a reliable indicator of the barrier effect of coatings and anti-corrosive performance [26]. The Rp findings were corroborated by other indicators obtained by fitting the equivalent electrical circuit (EEC) data from the EIS measurements.
The specular gloss of the coating films has previously been shown to exhibit a consistent trend with the surface roughness measured by confocal laser scanning microscopy [27]. Given its significance in industrial applications for assessing the visual appearance of coatings, specular gloss was used as the second response variable. The measured Rp and gloss values in the specular gloss unit (GU) are detailed in Table 2. The actual measured film thickness values (five evenly distributed points across each panel were automatically averaged by the instrument) in Table 2 are used instead of the target values in Table 1 for the modeling.
The developed model, which used polarization resistance (Rp) values as the response, effectively assesses the barrier effect of the coatings. Due to the wide range of Rp values, data transformation using the natural logarithm was employed to enhance the modeling process. The coefficients for the model were carefully selected using the Bayesian Information Criterion (BIC) [28] and forward selection method, resulting in a parsimonious model with high predictive accuracy.
The obtained model is represented as Equation (4) with R2 = 0.8833 and adjusted R2 = 0.8384.
R p   =   e x p   3.82595   ×   x 1   +   0.103752   ×   x 2     0.03562   ×   x 1   ×   x 2     0.42938   ×   x 1   ×   z   +   0.00086   ×   x 2   ×   z   +   0.004626   ×   x 1   ×   x 2   ×   z
where x1 and x2 represent the nanoclay and binder content, respectively, in percentage (%), and z denotes the film thickness in µm. The sum constraint is imposed as x1 + x2 = 100.
Figure 1 illustrates the plot of this model, showing the relationship between the Rp value and the nanoclay dosage at a specified film thickness. The ANOVA (Analysis of Variance) table, presented in Table 3, confirms the significance of the fitted model, with a p-value of less than 0.0001. Additionally, the interaction term between the two mixture components (x1 × x2) emerges as the most significant term in the model, with a p-value smaller than 0.0001.
The interaction terms x1 × x2 (nanoclay dosage × binder fraction) and x2 × z (binder fraction × film thickness) significantly influenced the modeled responses (Table 3). The x1 × x2 term indicates that nanoclay effectiveness depends on binder content, with optimal binder levels promoting better platelet dispersion. The x2 × z term suggests that thicker films can offset lower binder content by reducing porosity, whereas thin films at low binder levels are more prone to microvoids and reduced Rp.
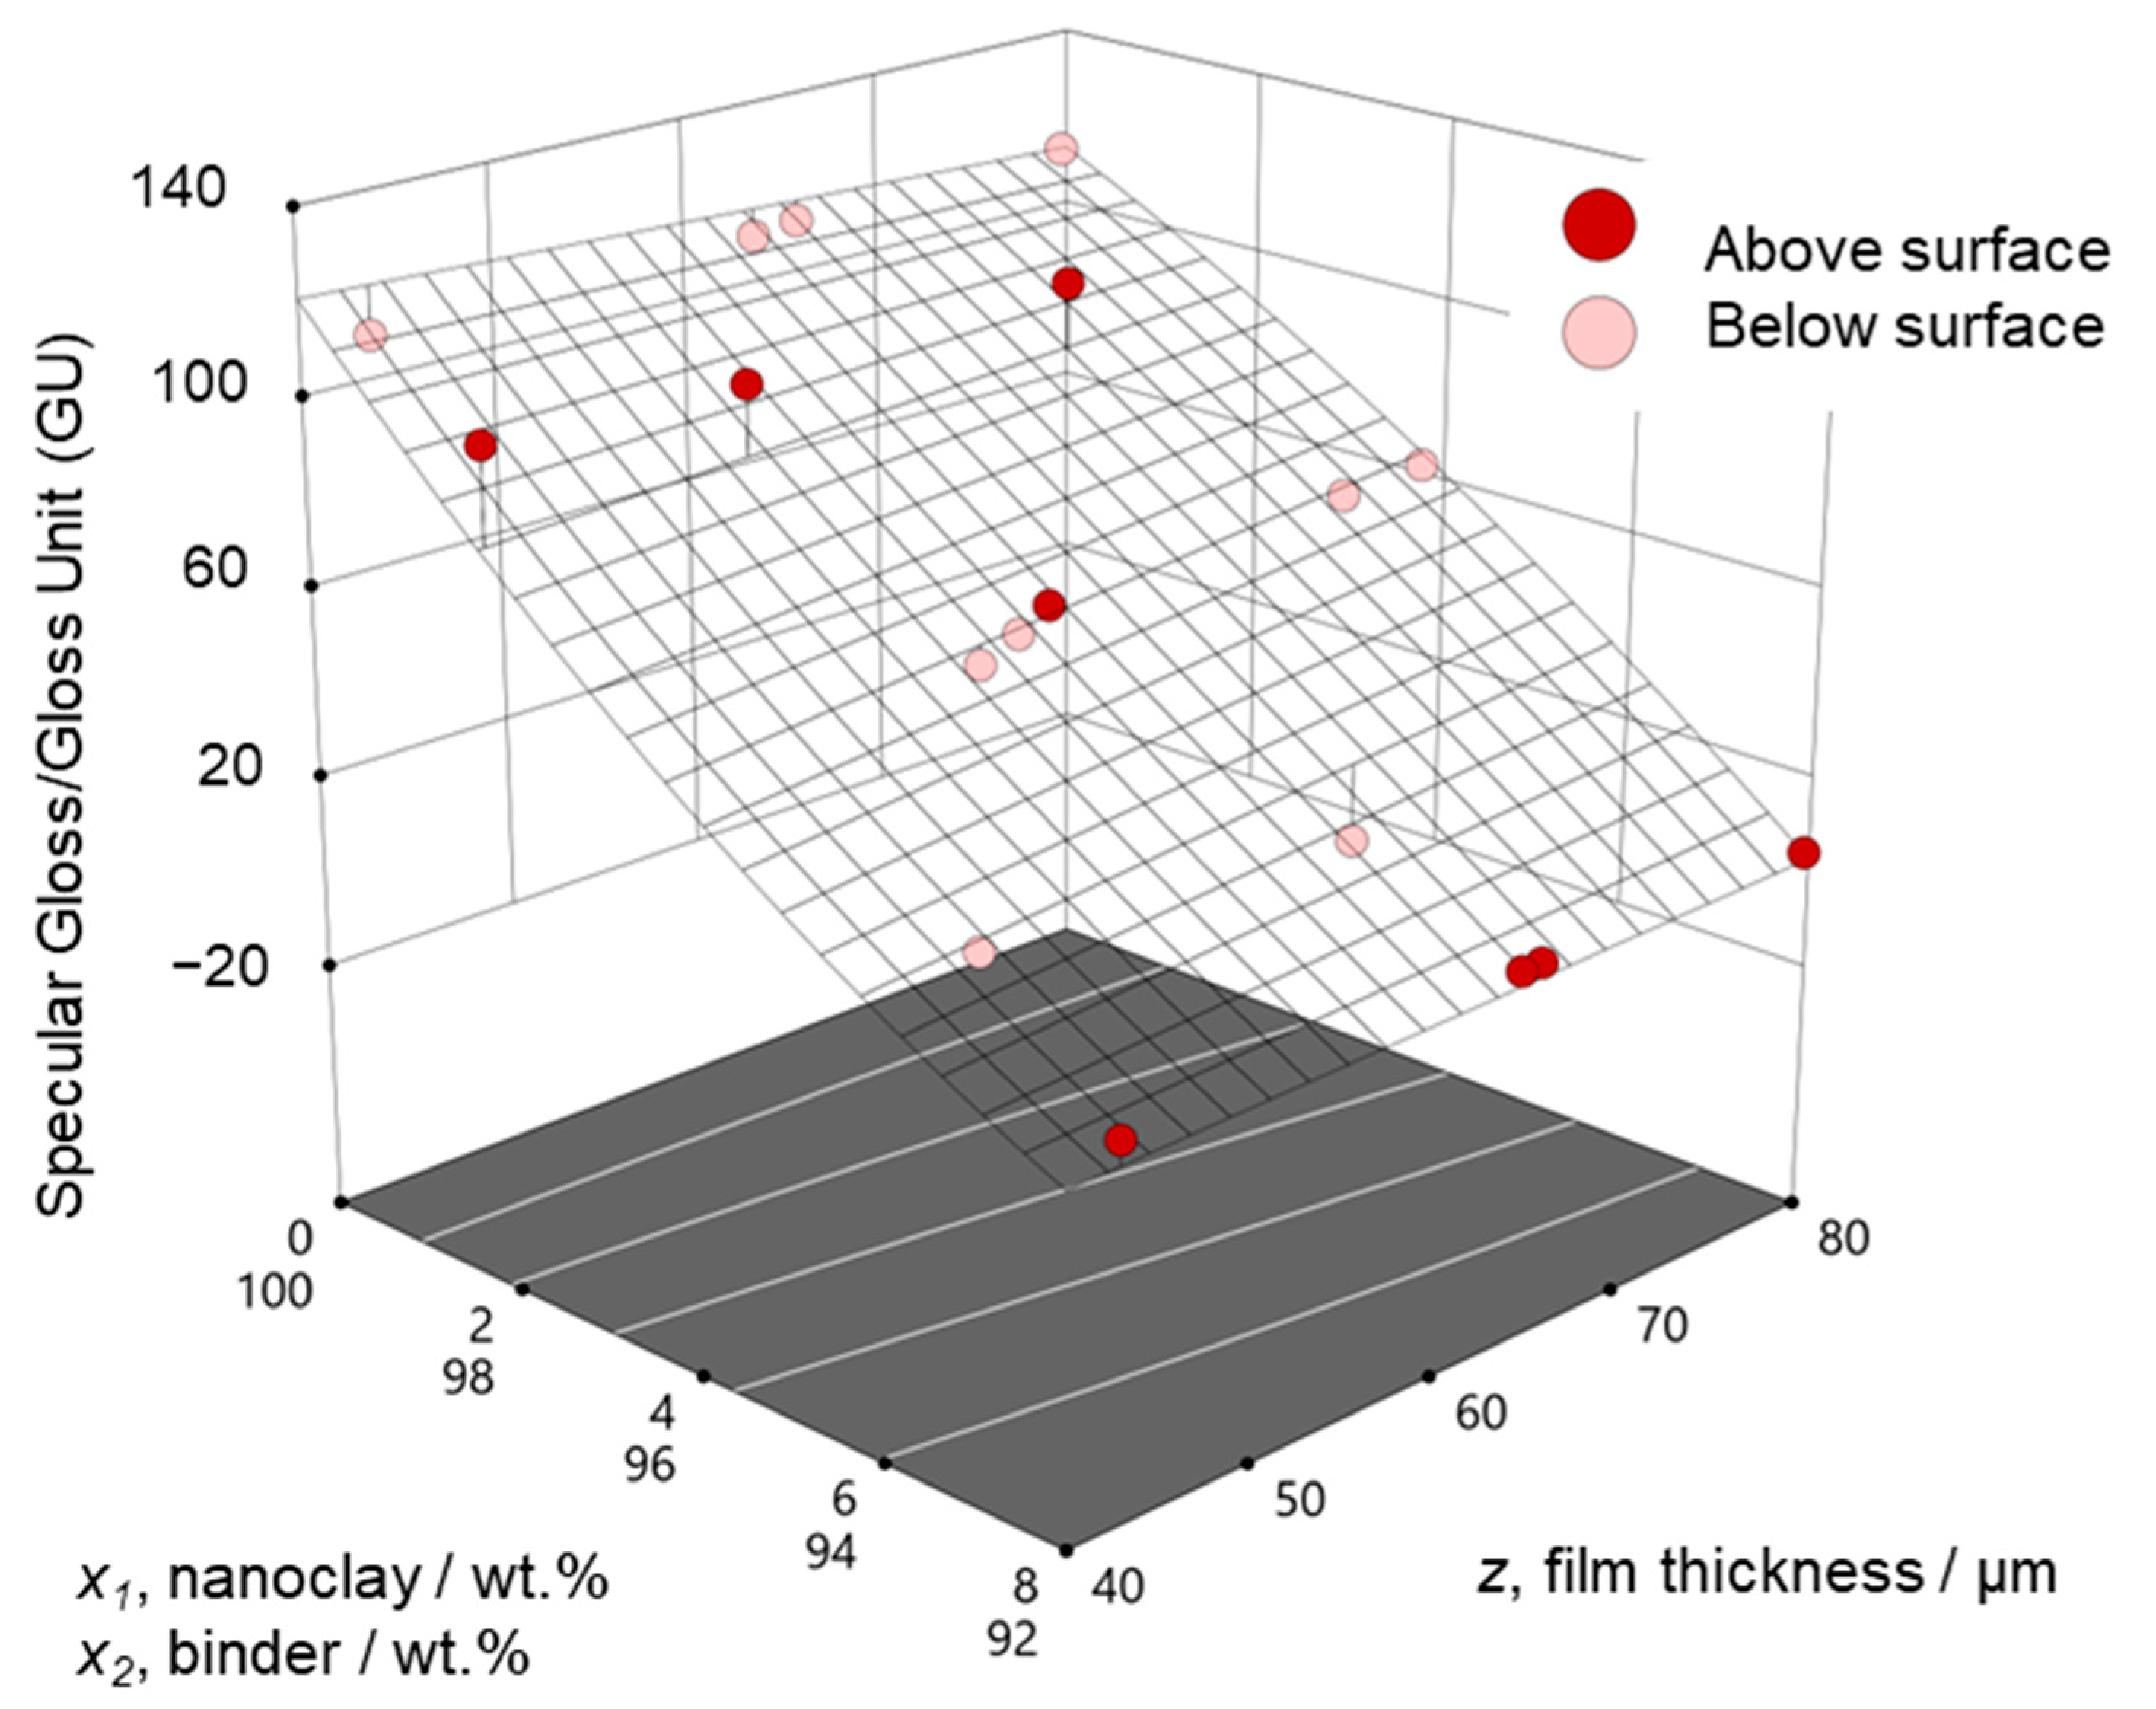
The procedure was repeated using specular gloss values as the second response, resulting in the following model (Equation (5)) with a high goodness of fit: R2 = 0.9513 and adjusted R2 = 0.9326. Similarly to the first model, the mixture composition is in quadratic order while the process variable remains in linear order.
S p e c u l a r   g l o s s = 164.09226   ×   x 1   +   1.28878   ×   x 2   1.95220   x 1 × x 2 2.76574   x 1 × z 0.001899 × x 2 × z + 0.030451 × x 1 × x 2 × z
where x1 + x2 = 100, x1 is the nanoclay content in wt.%, x2 is the binder content in wt.%, and z is the film thickness in µm.
The second model is plotted in Figure 2, and the ANOVA results for this model are listed in Table 4. At any given film thickness, the gloss of the coating decreased with increasing nanoclay dosage, attributed to the higher melt viscosity and the increasingly hindered flow and leveling of the coating film. Additionally, a higher film thickness resulted in a higher gloss value for a consistent dosage (Figure 2). This was attributed to the longer distance from the steel substrate to the coating surface, which reduced the effect of substrate roughness on coating smoothness. Furthermore, the higher leveling velocity of coatings at a higher film thickness contributed to the increased gloss [10]. The ANOVA table shows that the fitted model, with specular gloss values as the response, is also strongly significant (p < 0.0001), and the linear mixture part is the most significant part within the fitted model.

3.2. Optimization of Coating Performance

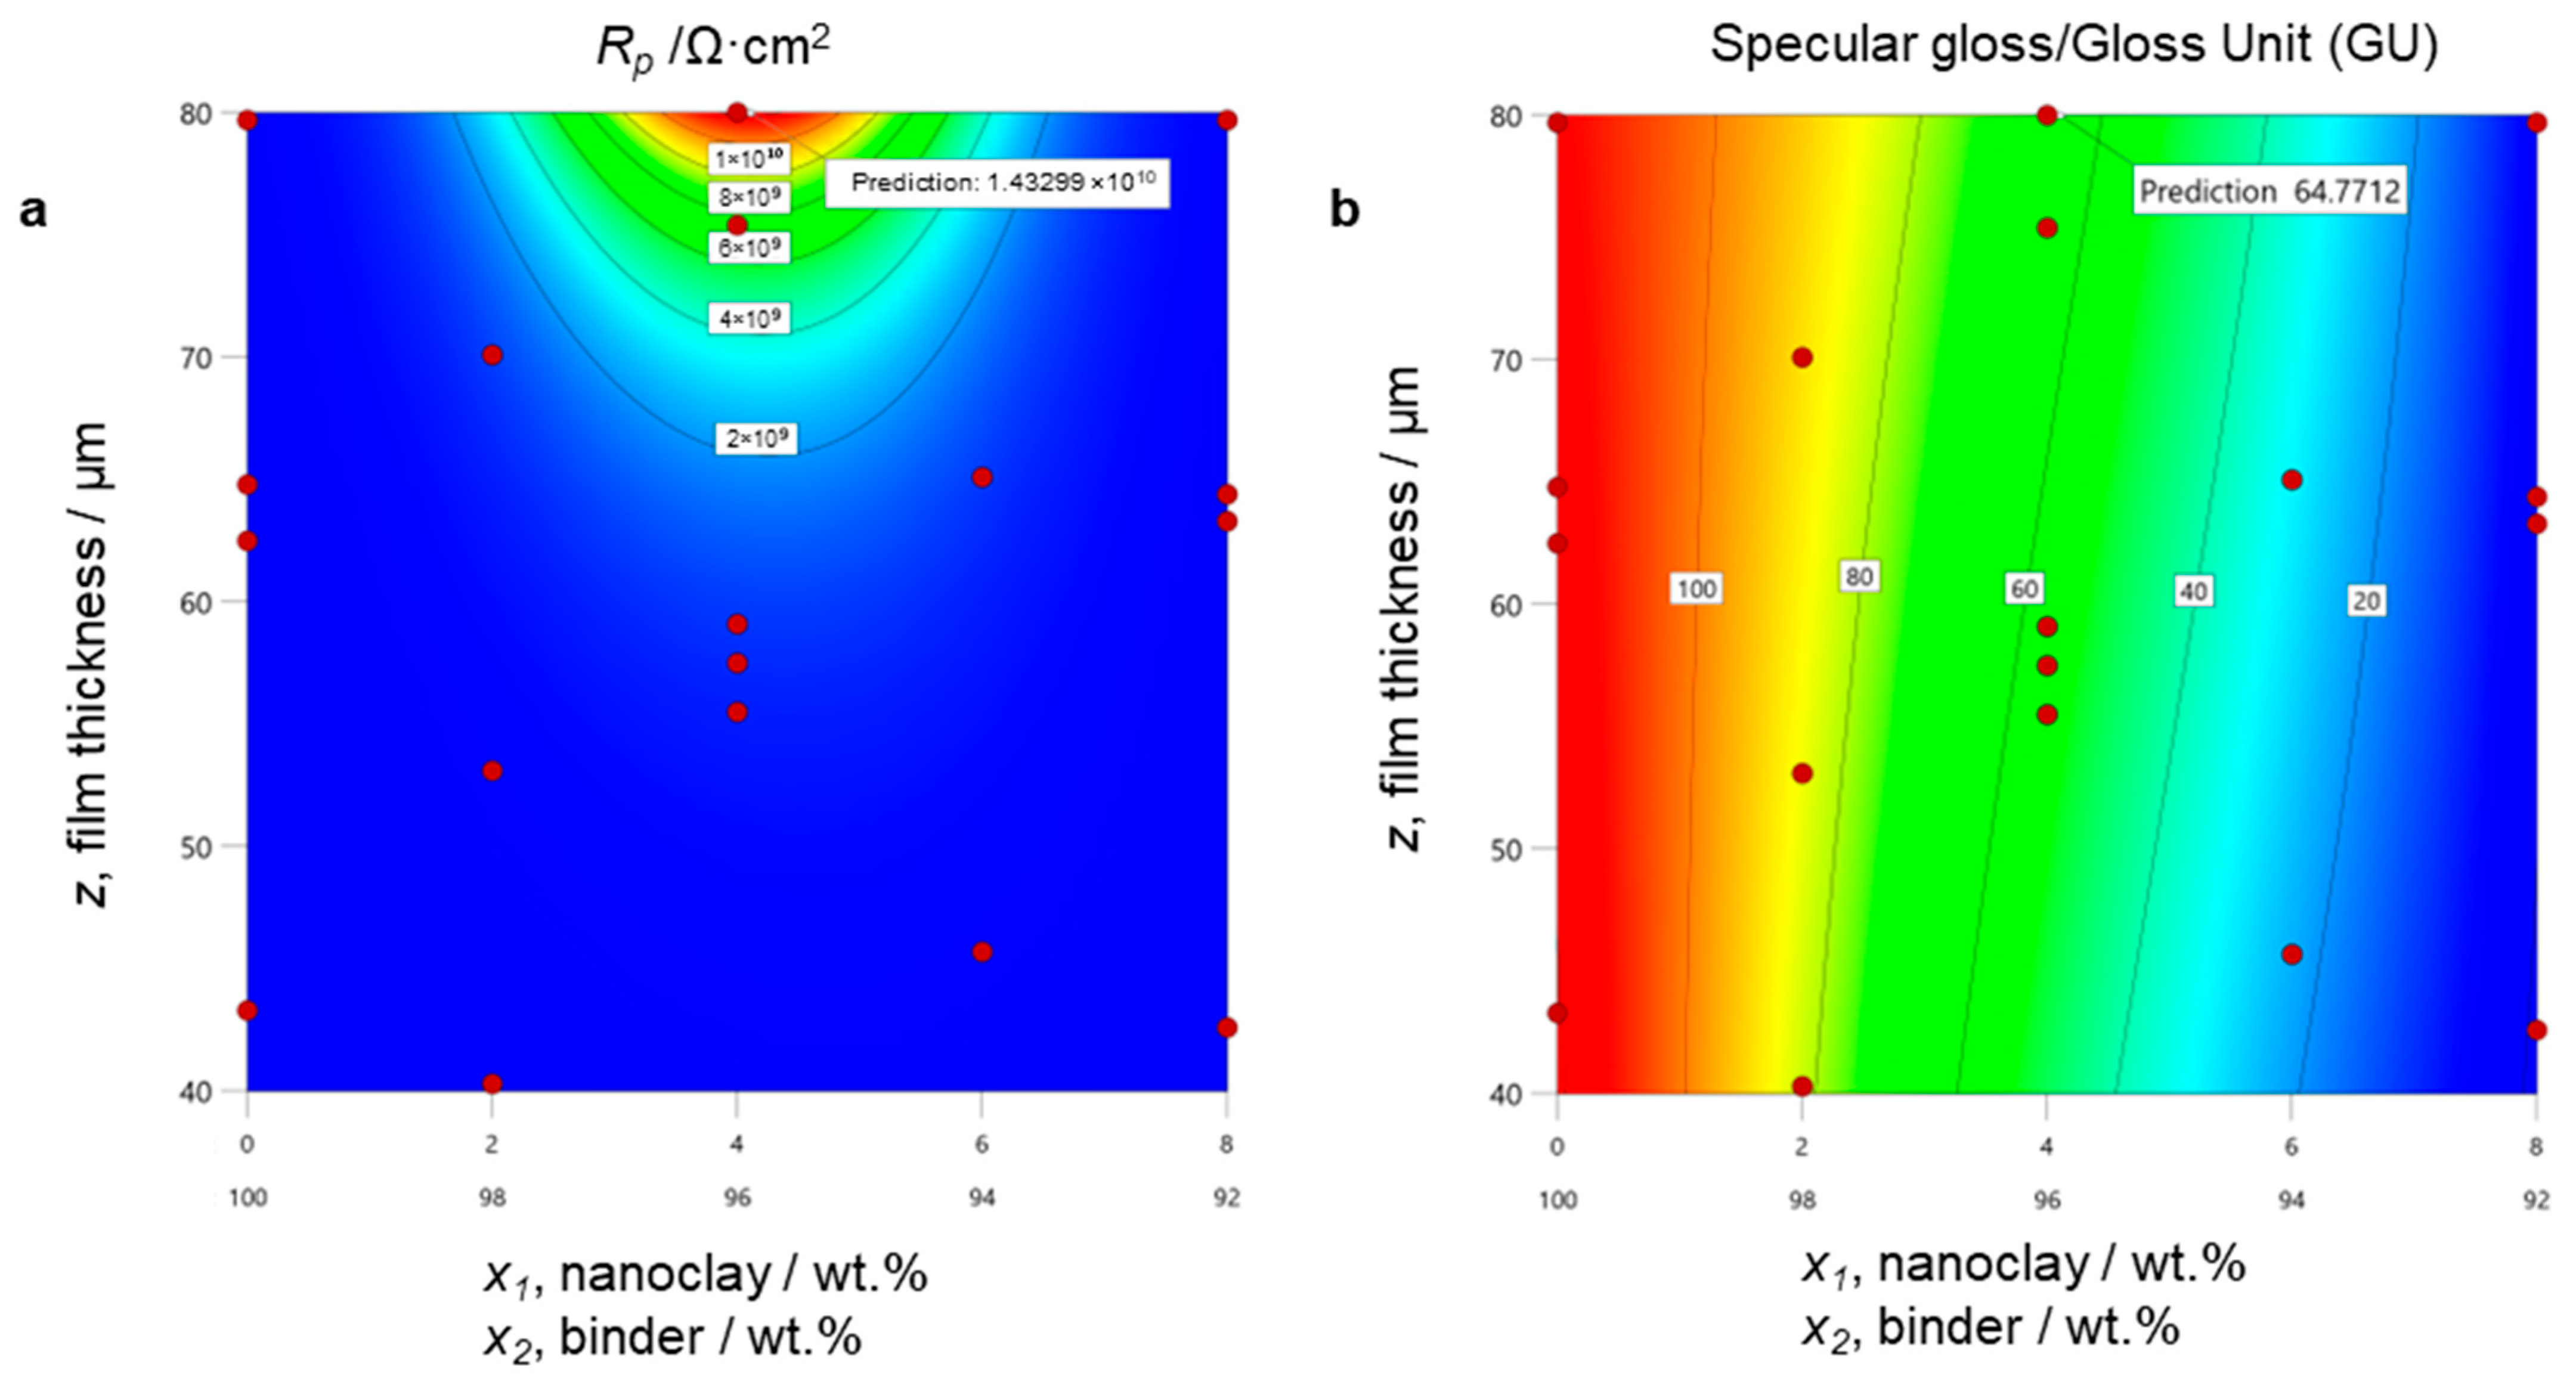
In the pursuit of optimizing coating performance, the criterion for the optimization was to maximize the Rp value, which correlates with a more substantial barrier effect against corrosion. Utilizing the developed model, the maximum Rp value was predicted to be 1.43 × 10¹⁰ Ω·cm2 at the nanoclay dosage of 4.11% and the film thickness of 80 µm. The specular gloss at this dosage was predicted to be 64.75 GU, as shown in the contour plots in Figure 3a,b.

3.3. Model Validation

In experimental validation, a new panel was prepared using a formula with 4.11% nanoclay content and a film thickness of 80.0 µm. The measured Rp value for this panel was 1.40 × 10¹⁰ Ω·cm2, which is within ±3% of the predicted value (Section 3.2). This excellent agreement between the predicted and measured values validates the effectiveness of the models in guiding the coating optimization process.
Further, three randomly selected samples (Panel Nos. 5, 12, and 15) were removed from the dataset, and new models were built using the remaining data to validate the statistical models. The resulting models are represented by Equations (6) and (7) for Rp values and gloss values, respectively.
R p   =   e x p   3.16005   ×   x 1   +   0.095457   ×   x 2     0.025768   ×   x 1   ×   x 2     0.39075   ×   x 1   ×   z   +   0.001010   ×   x 2   ×   z   +   0.004689   ×   x 1   ×   x 2   ×   z
where x1 + x2 = 100, R2 = 0.9463, and adjusted R2 = 0.9164.
S p e c u l a r   g l o s s = 138.01006   ×   x 1   +   1.30192   ×   x 2   1.66895 × x 1 × x 2 2.28805 × x 1 × z 0.002337 × x 2 × z + 0.025307 × x 1 × x 2 × z
where x1 + x2 = 100, R2 = 0.9540, and adjusted R2 = 0.9310.
The similarity between these new models and the previous ones demonstrates the robustness and reliability of the statistical models in predicting the coating performance.

3.4. Characterization Findings and Detailed Electrochemical Analysis

3.4.1. Coating Morphologies, OCP and Rp Measurement Results

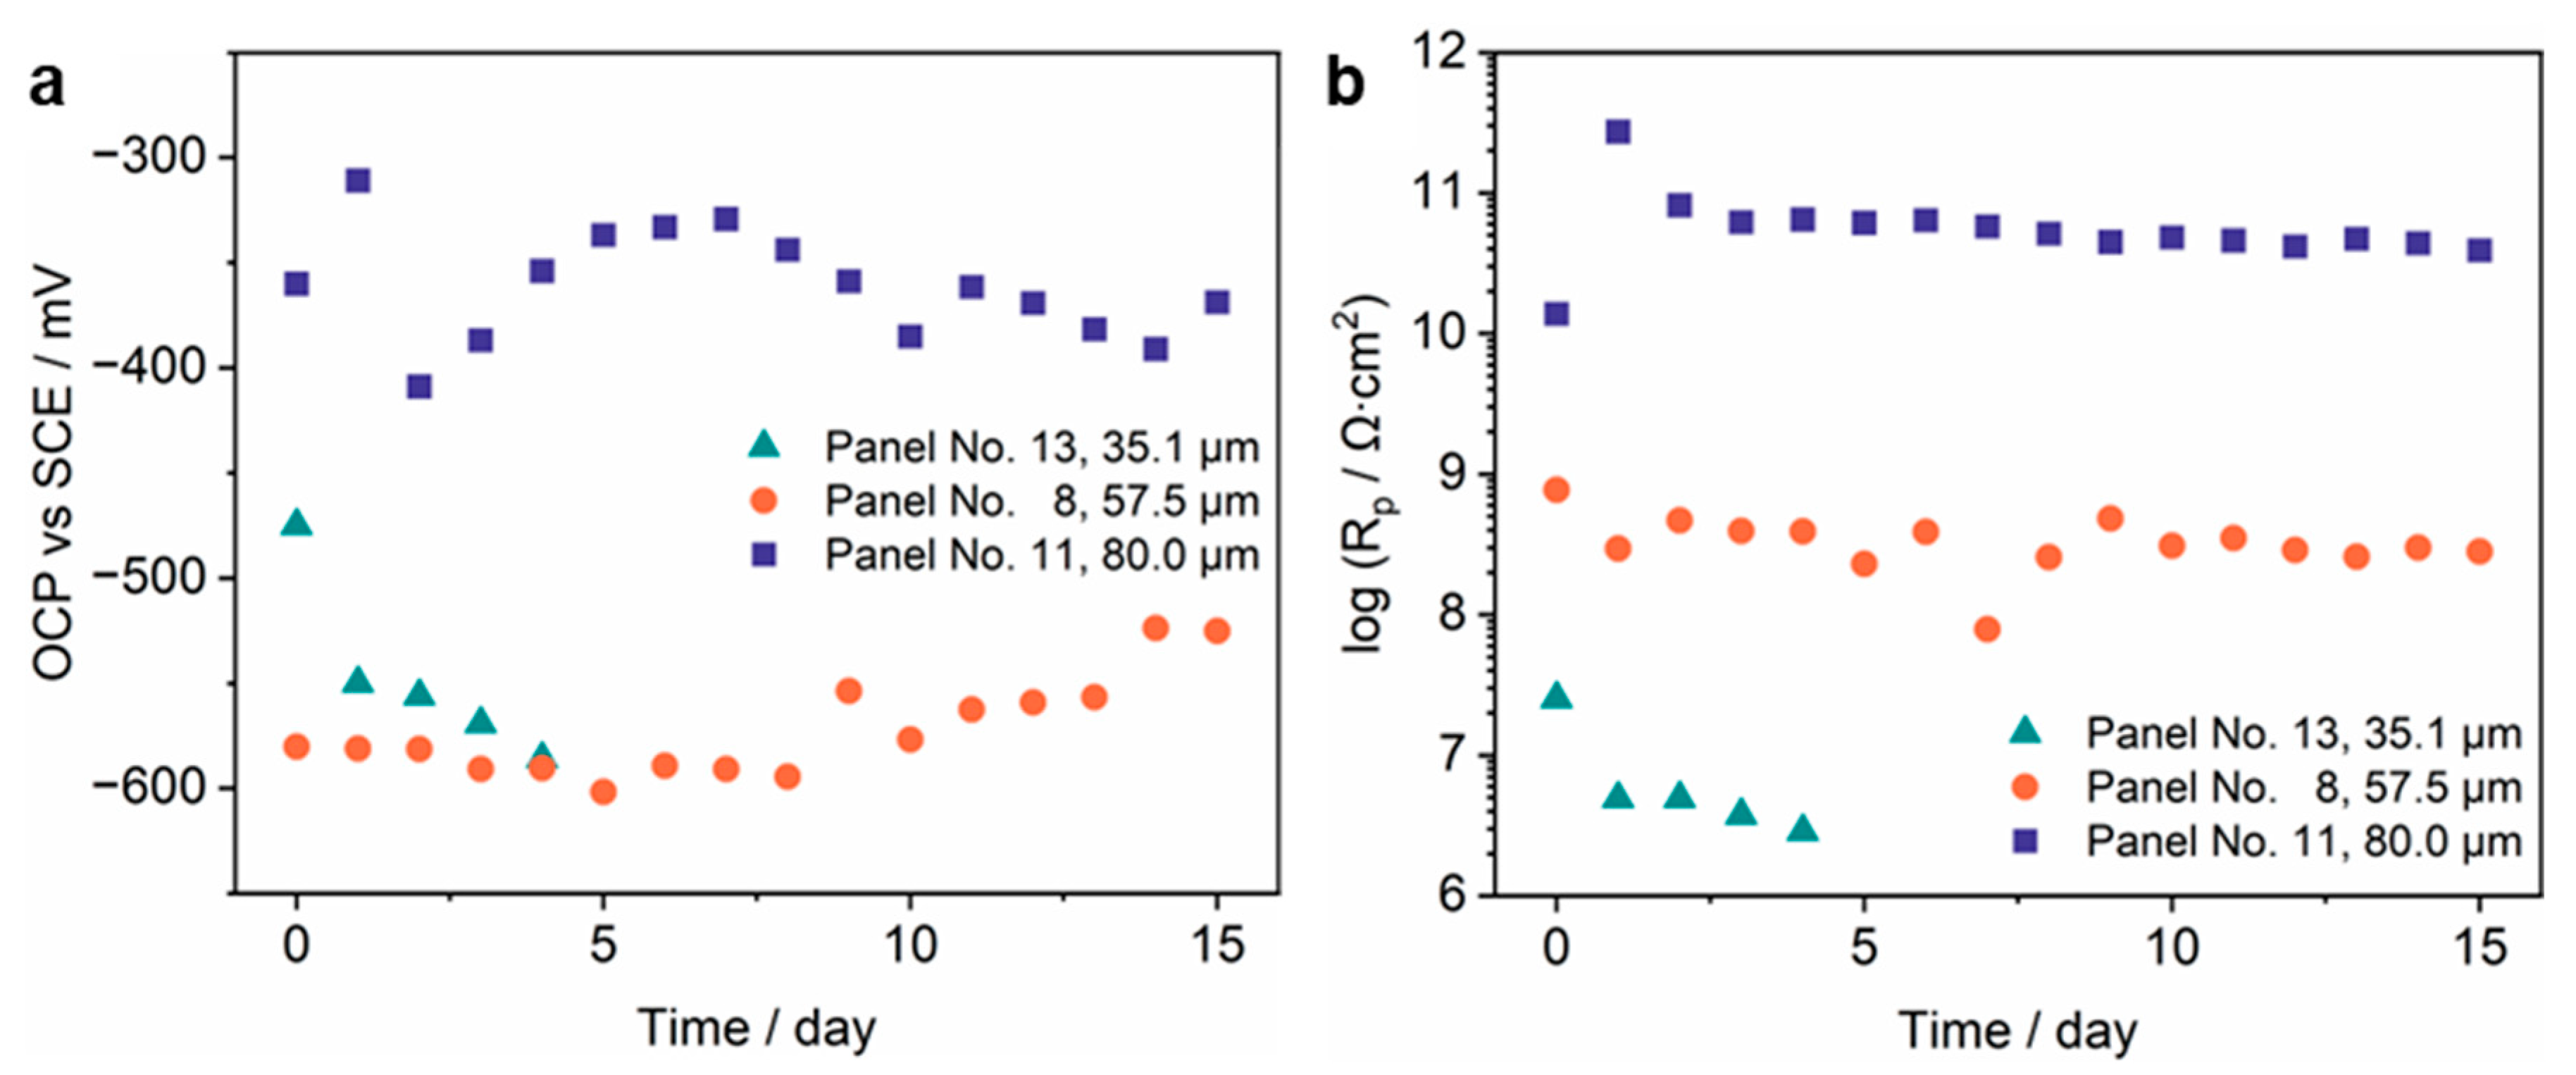
In analyzing the OCP and Rp measurement results, it was observed that a nanoclay dosage of approximately 4% yielded the highest Rp values within the entire design space, as depicted in Figure 1. Consequently, three coated panels (Panel Nos. 13, 8, and 11) prepared with this dosage were subjected to OCP, Rp, and EIS measurements, and the results are plotted in Figure 4.
Panel No. 13, with the lowest film thickness of 35.1 µm, exhibited inferior performance and reached a rusting grade of 9-G (0.03% rusted, ASTM D610 standard) in the general rusting category on Day 4. This test was terminated, suggesting a possible correlation between low film thickness and premature failure due to insufficient substrate coverage.
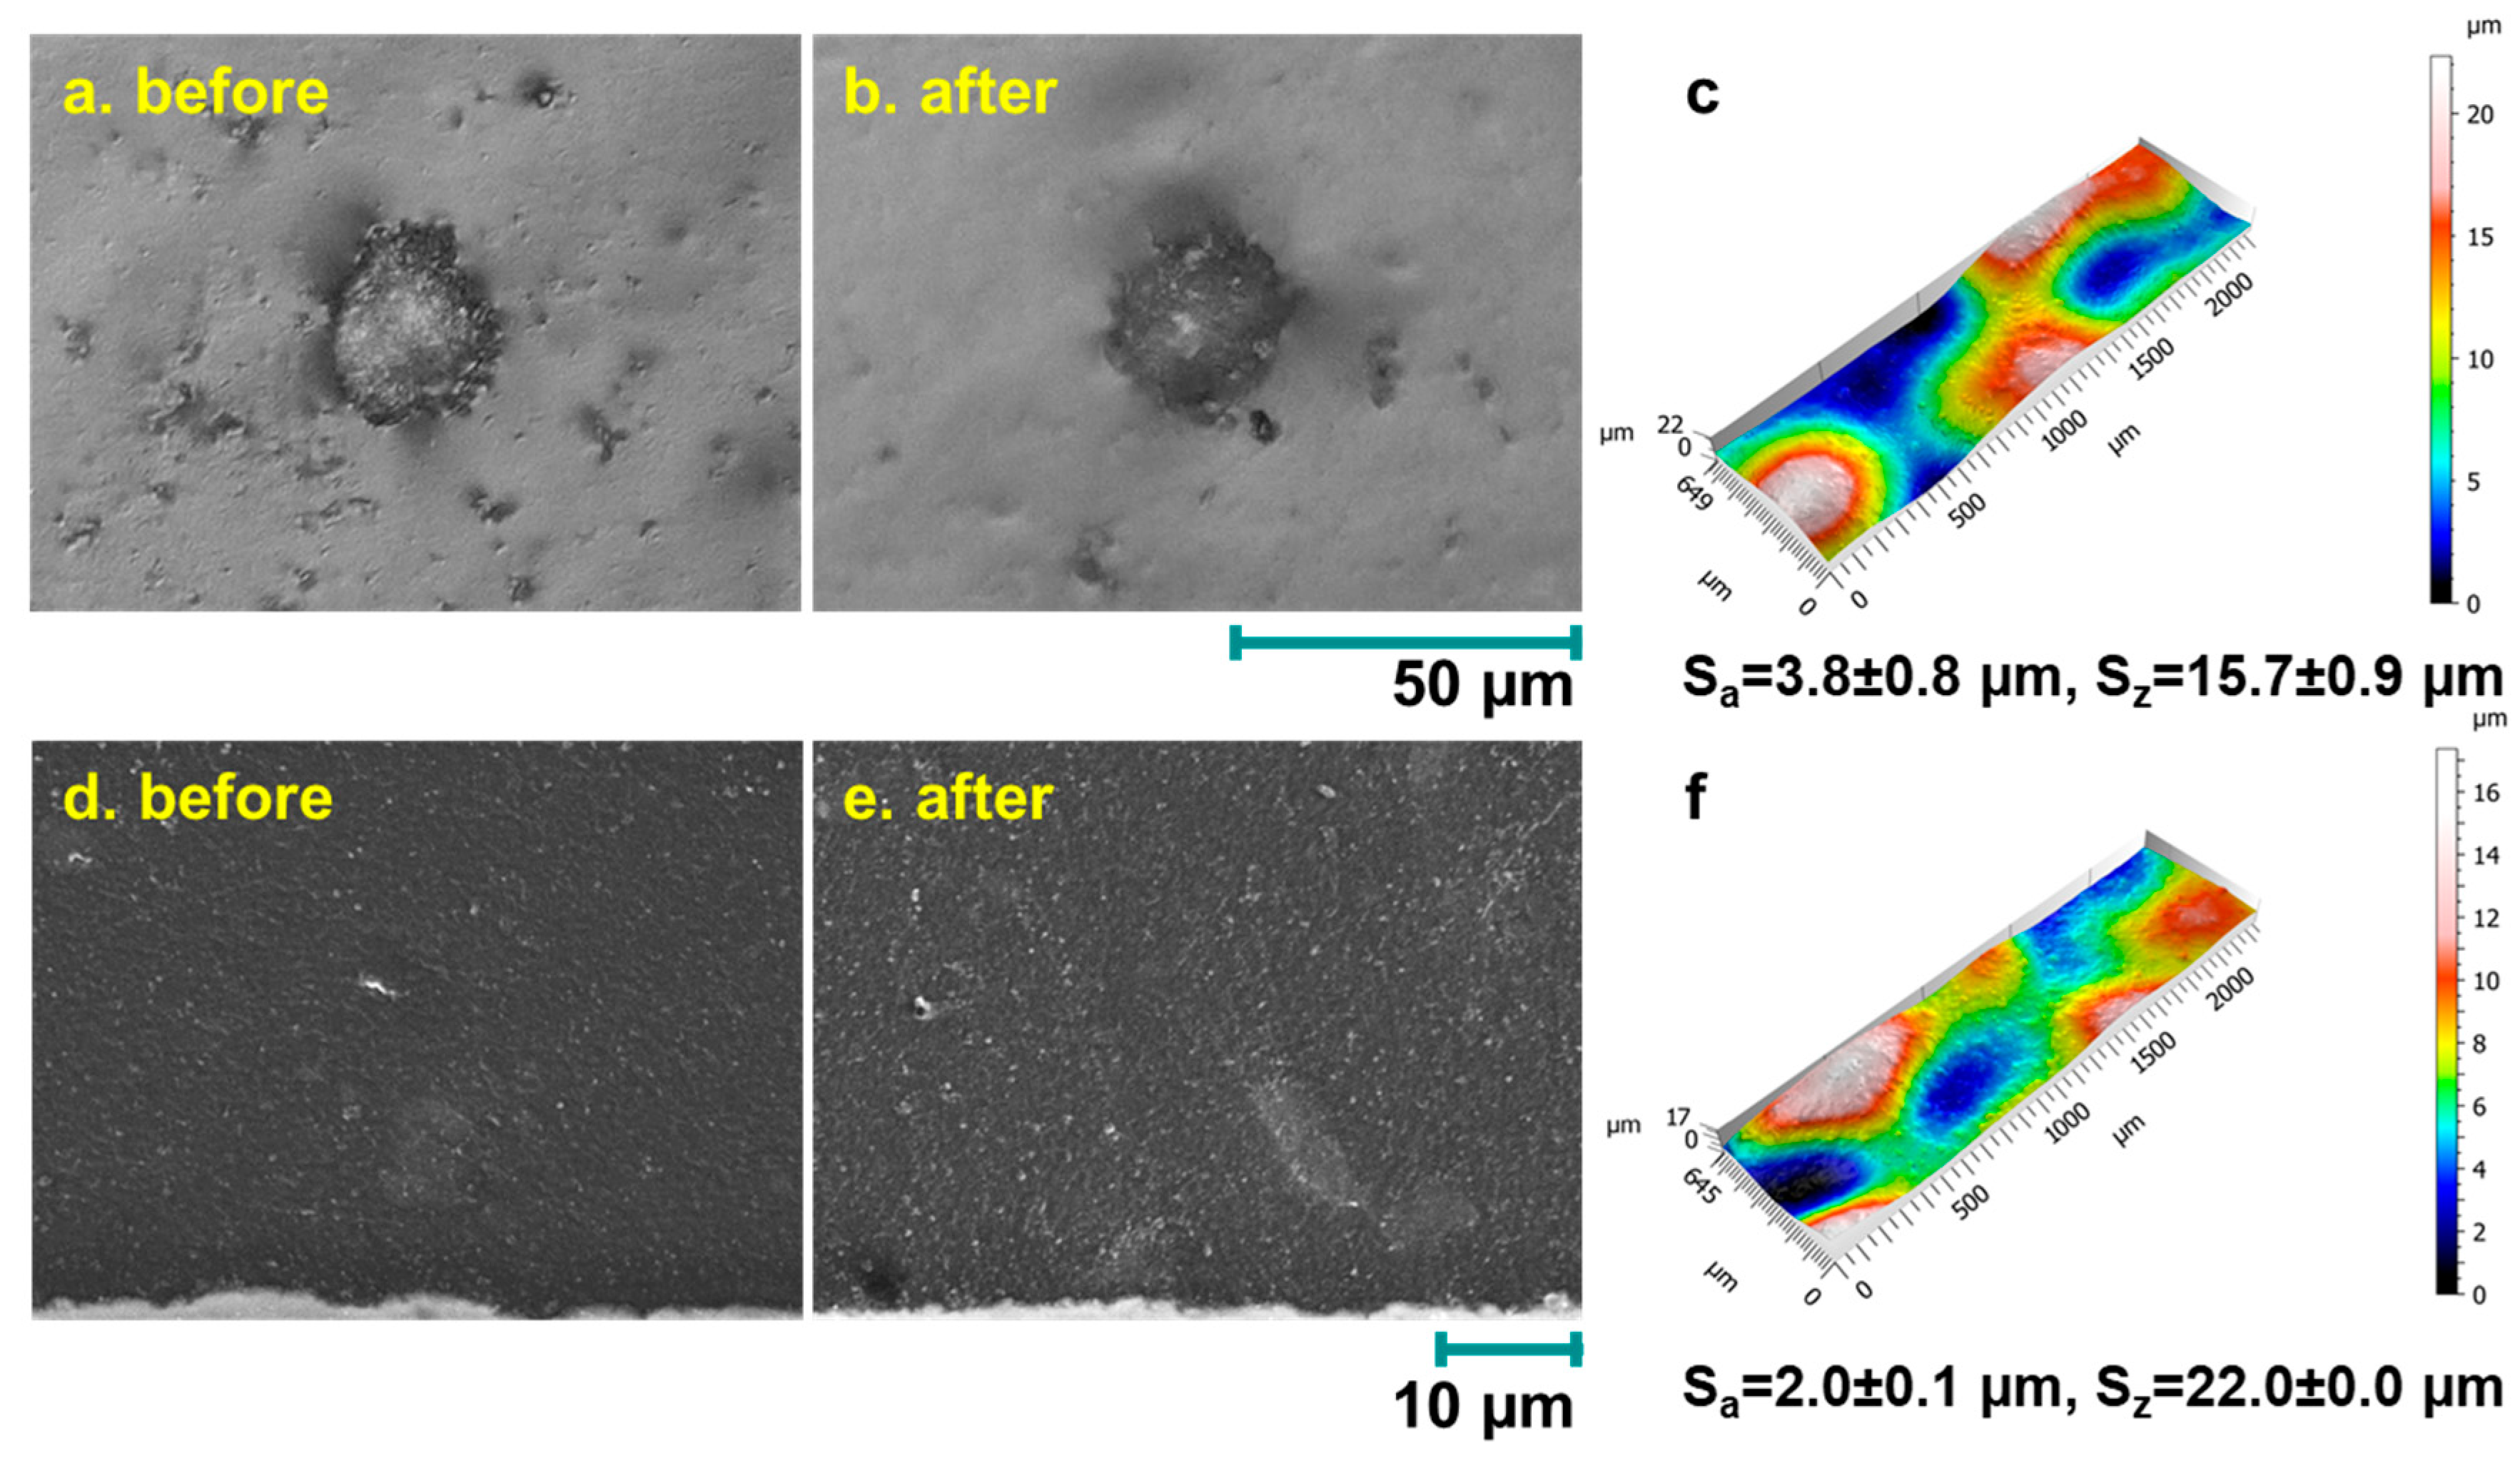
On the other hand, the tests for the other two coated panels (Panel Nos. 08 and 11) continued until they reached the same rusting grade on Day 15. A comparison of the results from these two samples revealed notable differences. Panel No. 11, with a higher film thickness of 80.0 µm, exhibited significantly higher (>100 mV) OCP values and Rp values of two orders of magnitude higher than Panel No. 08, which had a film thickness of 57.5 µm. This can be partially attributed to the increased tortuosity imparted by the nanoclay in the coating films, which contributes to a more effective barrier effect of the coating. Higher film thickness is also beneficial for the coating film homogeneity due to the improved flow and leveling [29], as indicated by the lower surface roughness values of Sa and Sz in Figure 5c,f.
Interestingly, the Rp value of Panel No. 11 (80 µm film thickness) increased slightly over prolonged immersion, indicating that the swelling and expansion of the nanoclay particles contributed to sealing microscopic voids and pores within the coatings. This self-repairing effect outweighed the damage incurred by the ingress of electrolytes, demonstrating the ability of the coatings to maintain their water-absorbing [30] and anti-corrosive performance over time.
Overall, these results underscore the significance of the nanoclay dosage and film thickness in determining the barrier effect and anti-corrosive performance of the coatings, further validating the effectiveness of the nanoclay-based additive.
Optical microscopy was utilized to observe the swelling of the nanoclay particles in the same coating sprayed and cured on a glass slide before and after an immersion of 15 days. As shown in Figure 5a,b, although the size change in a particle was not noticeable, the defects, such as cracks on the surface of the coating, decreased significantly due to the expansion of the particle in contact with water, which squeezed the cracks. SEM images in Figure 5d,e demonstrate that the particles exist in submicron particles and micron-sized agglomerates, which is in agreement with previous findings [19].

3.4.2. EIS Spectra Analysis

EIS scans were conducted on Panel No. 11, which exhibited the highest performance, to investigate the coating performance over time and in detail. Figure 6 shows the distinct EIS spectra of the coating for Days 0 to 4. The Day 0 spectra displayed ultra-high low-frequency impedance moduli of 109 Ω·cm2 and a broad plateau with phase angles close to –90° in the 1 Hz to 100 kHz frequency range. The spectra were further analyzed and fitted to the EEC depicted in Figure 6e, with the corresponding values listed in Table 5.
Starting from Day 1, the swelling and expansion of the nanoclay were induced by the uptake of electrolytes. This led to a further shift in the phase angle to −90° in the low-frequency region. The spectra of Days 1, 2, and 3 were successfully modeled by the EEC in Figure 6f, as indicated by the small χ2 values in Table 5. The CPEcoat, CPEdl, Rct, and Rpore are the constant phase element (CPE) for the coating film, the interface between the exposed substrate and permeated electrolyte into the pores/microvoids, the charge transfer resistance of this interface, and pore resistance, respectively. Qcoat and αcoat, and Qdl and αdl in Table 5 are the CPE parameters for CPEcoat and CPEdl, respectively. The large values of coating capacitance (CPEcoat) and pore resistance (Rpore) indicated a dense coating film with a robust barrier effect. These results suggest that the incorporation of nanoclay facilitated the formation of a compact and protective coating layer, enhancing the barrier properties against corrosive elements.
The EIS spectra obtained on Days 5, 10, and 15 (Figure 6d–f) were further analyzed by fitting them into the EEC shown in Figure 6h. The presence of the Warburg diffusion-controlled effect (Warburg element Ws in Figure 6h, Ws-RD, Ws-TD, and Ws-P in Table 5 are the Warburg parameters) in the EIS spectra suggested some minor localized coating delamination and corrosion [19]. However, it was evident that the majority of the coating film remained intact and maintained its protective properties. Remarkably, the coating film still demonstrated ultra-high low-frequency impedance moduli even after prolonged immersion, indicating its continued effectiveness as a protective barrier.
Interestingly, the trend observed in this study was opposite to previously reported results for other coatings [31,32]. Unlike those coatings, the CPEcoat value in this study decreased throughout the entire immersion test, suggesting reduced dielectric uptake and microvoid sealing, resulting in gradual improvement and repair of the coating film over time. Additionally, the increase in the Rpore value by one order of magnitude between Days 1 and 15 further supported the idea of a repaired coating film.
These findings indicate the self-repairing capability of the coating film, which can be attributed to the swelling and expansion of the nanoclay particles. The ability of the nanoclay to seal microscopic voids and pores inside the coating contributed to restoring its protective properties even after experiencing some localized damage during the immersion test.

3.5. Further Discussion

The incorporation of montmorillonite-based nanoclay additives significantly improved the barrier properties of the polyester/TGIC powder coatings. The electrochemical measurements, including OCP, Rp, and EIS, revealed that the nanoclay enhanced the coating’s ability to resist corrosion. Specifically, the self-repairing capability of the nanoclay, facilitated by its swelling and expansion upon electrolyte uptake, played a crucial role in sealing microscopic voids and pores within the coating. This behavior contributed to maintaining the anti-corrosive performance of the coating over prolonged immersion periods.
The optimized coating, with a nanoclay dosage of 4.11% and a film thickness of 80 µm, demonstrated an Rp value one order of magnitude higher than the standard coating with a 60 µm film thickness. This improvement is partly attributed to the increased tortuosity imparted by the nanoclay particles, which enhanced the barrier effect by creating a more tortuous path for corrosive elements to penetrate the coating.
The findings of this study align with previous research that has demonstrated the effectiveness of additives in improving the anti-corrosive properties of coatings. Similarly to the results reported previously [33,34,35,36], this study confirmed that nanoclays can enhance the barrier properties of coatings through their self-healing capability. However, this study provides additional insights by systematically investigating the combined effects of nanoclay dosage and film thickness using quantitative optimization.
Using statistical models to optimize coating formulations represents an advancement over empirical approaches commonly employed in the literature. The Mixture Design methodology allowed for a comprehensive analysis of the interactions between nanoclay dosage and film thickness, identifying optimal conditions for maximizing the barrier effect.
Despite the promising results, future studies need to address several limitations. In particular, this study was limited to a single type of binder (polyester/TGIC). Future research should investigate the impact of different binder systems, including hybrids and other cross-linking agents, to generalize the findings and explore the potential for optimizing various coating formulations.
The immersion tests performed in this study were relatively short. Extended exposure studies are warranted to evaluate the durability and long-term performance of the coatings comprehensively under practical conditions. Future work will also investigate the influence of varying environmental parameters, including temperature, humidity, and pollutant presence, alongside assessments of nanoclay dispersion quality and cure-state effects, as these factors strongly influence barrier performance. Standardized accelerated aging protocols and controlled environmental chamber exposures will be employed to simulate real-world service conditions and provide a more comprehensive understanding of coating behavior across diverse operational environments.

4. Conclusions

This study aimed to find the optimized conditions for both nanoclay additives and film thickness for an anti-corrosive coating on phosphated steel. The following main conclusions can be drawn.
The Mixture Design method models were successfully applied to optimize nanoclay content and film thickness through two independent responses (polarization resistance, Rp, and specular gloss). The models were verified through reduced data and experimental validation, and their robustness was confirmed.
The highest Rp value was predicted for 4.11% nanoclay and an 80 µm thickness.
A greater film thickness resulted in better coating performance.
A detailed EIS analysis of the 4% nanoclay and 80 µm thick coating over time revealed self-repairing capabilities, as indicated by a decrease in coating capacitance and a slight increase in pore resistance over 14 days of exposure to 5% NaCl.

Author Contributions

Conceptualization, M.S.Y.; methodology, M.S.Y., C.X. and J.C.; software, C.X.; validation, M.S.Y. and C.X.; formal analysis, M.S.Y. and C.X.; investigation, M.S.Y. and J.C.; resources, J.C., Y.S.H. and J.J.N.; data curation, M.S.Y., C.X. and J.C.; writing—original draft, M.S.Y.; writing—review & editing, C.X., J.C., Y.S.H. and J.J.N.; visualization, M.S.Y.; supervision, Y.S.H. and J.J.N.; project administration, M.S.Y., Y.S.H. and J.J.N.; funding acquisition, M.S.Y., Y.S.H. and J.J.N. All authors have read and agreed to the published version of the manuscript.

Funding

This work is affiliated with the Carbon to Metal Coating Institute at Queen’s University and was supported by the Government of Canada’s New Frontiers in Research Fund (#NFRFT-2020-00573). This work was financially supported by the Natural Sciences and Engineering Research Council of Canada (NSERC) Discovery Grants (RGPIN-2018-06672, DGDND-2021-03997, RGPIN-2021-03997, and RGPIN-2020-06856); the Mitacs Accelerate Fellowship (IT42104, Umbrella IT37545); Surface Science Western SSW Capital Renewal Reserve Fund; and the Wolfe-Western Fellowship program (2020).

Acknowledgments

The authors would like to thank Stat-Ease Inc. (Minneapolis, MN, USA, www.statease.com) for authorizing the publication of the results generated by the software Design-Expert®. The authors appreciate the support from the specialists at Surface Science Western (www.surfacesciencewestern.com), the University of Western Ontario (Western University).

Conflicts of Interest

The authors declare no conflict of interest.

Statement

During the preparation of this work, the authors used ChatGPT 5 (chat.openai.com) to improve the writing of the manuscript. After using this tool/service, the authors reviewed and edited the content as needed and take full responsibility for the content of the publication.

References

  1. Crapper, G. Powder Coatings. In Polymer Science: A Comprehensive Reference; Elsevier: Amsterdam, The Netherlands, 2012; Volume 10, pp. 541–566. ISBN 9780080878621. [Google Scholar]
  2. Turner, S.; Baskir, J.; Nunez, C. Powder Coatings: A Technology Review. Pollut. Prev. Rev. 1999, 9, 7–21. [Google Scholar]
  3. Fu, J.; Krantz, M.; Zhang, H.; Zhu, J.; Kuo, H.; Wang, Y.M.; Lis, K. Investigation of the Recyclability of Powder Coatings. Powder Technol. 2011, 211, 38–45. [Google Scholar] [CrossRef]
  4. Du, Z.; Wen, S.; Wang, J.; Yin, C.; Yu, D.; Luo, J. The Review of Powder Coatings. J. Mater. Sci. Chem. Eng. 2016, 4, 54–59. [Google Scholar] [CrossRef]
  5. Perera, D.Y. Effect of Pigmentation on Organic Coating Characteristics. Prog. Org. Coat. 2004, 50, 247–262. [Google Scholar] [CrossRef]
  6. Métayer, M.; Labbé, M.; Marais, S.; Langevin, D.; Chappey, C.; Dreux, F.; Brainville, M.; Belliard, P. Diffusion of Water through Various Polymer Films: A New High Performance Method of Characterization. Polym. Test. 1999, 18, 533–549. [Google Scholar] [CrossRef]
  7. Uribe-Padilla, J.; Graells, M.; Salgado-Valle, J.; López Serrano, J. A Viscosity-Mediated Model for Relating Gloss and Film Thickness of Coatings. Prog. Org. Coat. 2019, 136, 105195. [Google Scholar] [CrossRef]
  8. Abdel-Gaber, A.M.; Nabey, B.A.A.E.; Khamis, E.; Abdelattef, O.A.; Aglan, H.; Ludwick, A. Influence of Natural Inhibitor, Pigment and Extender on Corrosion of Polymer Coated Steel. Prog. Org. Coat. 2010, 69, 402–409. [Google Scholar] [CrossRef]
  9. Muizebelt, W.J.; Heuvelsland, W.J.M. Permeabilities of Model Coatings: Effect of Cross-Link Density and Polarity. In Polymeric Materials for Corrosion Control; ACS Symposium Series; American Chemical Society: Washington, DC, USA, 1986; pp. 110–114. [Google Scholar] [CrossRef]
  10. Biris, A.S.; Mazumder, M.K.; Yurteri, C.U.; Sims, R.A.; Snodgrass, J.; De, S. Gloss and Texture Control of Powder Coated Films. Part. Sci. Technol. 2011, 19, 199–217. [Google Scholar] [CrossRef]
  11. Spyrou, E. Powder Coatings: Chemistry and Technology, 3rd ed.; Vincentz Network GmbH & Co KG: Hannover, Germany, 2012; ISBN 978-3-86630-824-4. [Google Scholar]
  12. Bello, L.H.A.D.; Vieira, A.F.D.C. Tutorial for mixture-process experiments with an industrial application. Pesquisa Operacional 2011, 31, 543–564. [Google Scholar] [CrossRef]
  13. Lin, S.M.; Wen, T.C. A Mixture Design Approach to the Service Life and the Oxygen Evolving Catalytic Activity of Ru-Sn-Ti Ternary Oxide Coated Electrodes. J. Appl. Electrochem. 1993, 23, 487–494. [Google Scholar] [CrossRef]
  14. Carrado, K.A. Synthetic Organo-and Polymer-Clays: Preparation, Characterization, and Materials Applications. Appl. Clay Sci. 2000, 17, 1–23. [Google Scholar] [CrossRef]
  15. Tedim, J.; Kuznetsova, A.; Salak, A.N.; Montemor, F.; Snihirova, D.; Pilz, M.; Zheludkevich, M.L.; Ferreira, M.G.S. Zn-Al Layered Double Hydroxides as Chloride Nanotraps in Active Protective Coatings. Corros. Sci. 2012, 55, 1–4. [Google Scholar] [CrossRef]
  16. Cai, Y.; Yin, Y.; Zhang, Y.; Yang, F.; Zhang, C.; Wang, W. Nanoclay-Enabled Advanced Metal Protection: Emerging Barrier Engineering and Smart Corrosion Inhibition Strategies. Coord. Chem. Rev. 2025, 545, 217014. [Google Scholar] [CrossRef]
  17. Haghi, M.; Kazemian, H.; Ranjbar, Z. Improvement of the Corrosion Resistance of Acrylic Electrocoating in the Presence of Acid-Modified Montmorillonite Nano Clay. Prog. Org. Coat. 2023, 182, 107689. [Google Scholar] [CrossRef]
  18. Affaf, N.; Alias, J.; Alang, N. Montmorillonite (MMT) Nanoclay in Smart Coatings for Corrosion Protection of Metal Alloy: A Brief Review. J. Phys. Conf. Ser. 2024, 2688, 012012. [Google Scholar] [CrossRef]
  19. Yang, M.S.; Huang, J.; Zhang, H.; Noël, J.J.; Hedberg, Y.S.; Chen, J.; Eduok, U.; Barker, I.; Henderson, J.D.; Xian, C.; et al. Study on the Self-Repairing Effect of Nanoclay in Powder Coatings for Corrosion Protection. Coatings 2023, 13, 1220. [Google Scholar] [CrossRef]
  20. Goos, P.; Jones, B.; Syafitri, U. I-Optimal Design of Mixture Experiments. J. Am. Stat. Assoc. 2016, 111, 899–911. [Google Scholar] [CrossRef]
  21. Design-Expert®, version 13.0.9.0; Stat-Ease, Inc.: Minneapolis, MN, USA, 2024.
  22. ASTM D609; Standard Practice for Preparation of Cold-Rolled Steel Panels for Testing Paint, Varnish, Conversion Coatings, and Related Coating Products. ASTM International: West Conshohocken, PA, USA, 2017; pp. 1–3.
  23. ASTM D7091; Practice for Nondestructive Measurement of Dry Film Thickness of Nonmagnetic Coatings Applied to Ferrous Metals and Nonmagnetic, Nonconductive Coatings Applied to Non-Ferrous Metals. ASTM International: West Conshohocken, PA, USA, 2022.
  24. ASTM D523; Standard Test Method for Specular Gloss. ASTM International: West Conshohocken, PA, USA, 2014; pp. 1–5.
  25. ASTM D610; Standard Practice for Evaluating Degree of Rusting on Painted Steel Surfaces. ASTM International: West Conshohocken, PA, USA, 2008; pp. 1–6.
  26. Walter, G.W. A Critical Review of d.c. Electrochemical Tests for Painted Metals. Corros. Sci. 1986, 26, 39–47. [Google Scholar] [CrossRef]
  27. Huang, J.; Yang, M.S.; Xian, C.; Noël, J.J.; Hedberg, Y.S.; Chen, J.; Eduok, U.; Barker, I.; Henderson, J.D.; Zhang, H.; et al. Synergistic Effect of Nanoclay and Barium Sulfate Fillers on the Corrosion Resistance of Polyester Powder Coatings. Coatings 2023, 13, 1680. [Google Scholar] [CrossRef]
  28. Neath, A.A.; Cavanaugh, J.E. The Bayesian Information Criterion: Background, Derivation, and Applications. Wiley Interdiscip. Rev. Comput. Stat. 2012, 4, 199–203. [Google Scholar] [CrossRef]
  29. Bosma, M.; Brinkhuis, R.; Rensen, E.; Watson, R. A New Method for the Quantitative Determination and Prediction of Sag and Levelling in Powder Coatings. Prog. Org. Coat. 2011, 72, 26–33. [Google Scholar] [CrossRef]
  30. Perron, S.; Tully, C.S.; Gupta, S.; Fox, M.S.; Zagidulin, D.; Noël, J.J.; Ouriadov, A. Implementation of the X-Centric Pulse Sequence at Low Field for MRI of Water Penetration in Clay. J. Magn. Reson. 2025, 373, 107852. [Google Scholar] [CrossRef]
  31. Gu, L.; Liu, S.; Zhao, H.; Yu, H. Facile Preparation of Water-Dispersible Graphene Sheets Stabilized by Carboxylated Oligoanilines and Their Anticorrosion Coatings. ACS Appl. Mater. Interfaces 2015, 7, 17641–17648. [Google Scholar] [CrossRef]
  32. Stojanović, I.; Šimunović, V.; Alar, V.; Kapor, F. Experimental Evaluation of Polyester and Epoxy-Polyester Powder Coatings in Aggressive Media. Coatings 2018, 8, 98. [Google Scholar] [CrossRef]
  33. Golgoon, A.; Aliofkhazraei, M.; Toorani, M.; Moradi, M.H.; Rouhaghdam, A.S. Corrosion and Wear Properties of Nanoclay-Polyester Nanocomposite Coatings Fabricated by Electrostatic Method. Procedia Mater. Sci. 2015, 11, 536–541. [Google Scholar] [CrossRef]
  34. Huttunen-Saarivirta, E.; Vaganov, G.V.; Yudin, V.E.; Vuorinen, J. Characterization and Corrosion Protection Properties of Epoxy Powder Coatings Containing Nanoclays. Prog. Org. Coat. 2013, 76, 757–767. [Google Scholar] [CrossRef]
  35. Guo, F.; Aryana, S.; Han, Y.; Jiao, Y. A Review of the Synthesis and Applications of Polymer-Nanoclay Composites. Appl. Sci. 2018, 8, 1696. [Google Scholar] [CrossRef]
  36. Rashmi; Renukappa, N.M.; Chikkakuntappa, R.; Kunigal, N.S. Montmorillonite Nanoclay Filler Effects on Electrical Conductivity, Thermal and Mechanical Properties of Epoxy-Based Nanocomposites. Polym. Eng. Sci. 2011, 51, 1827–1836. [Google Scholar] [CrossRef]
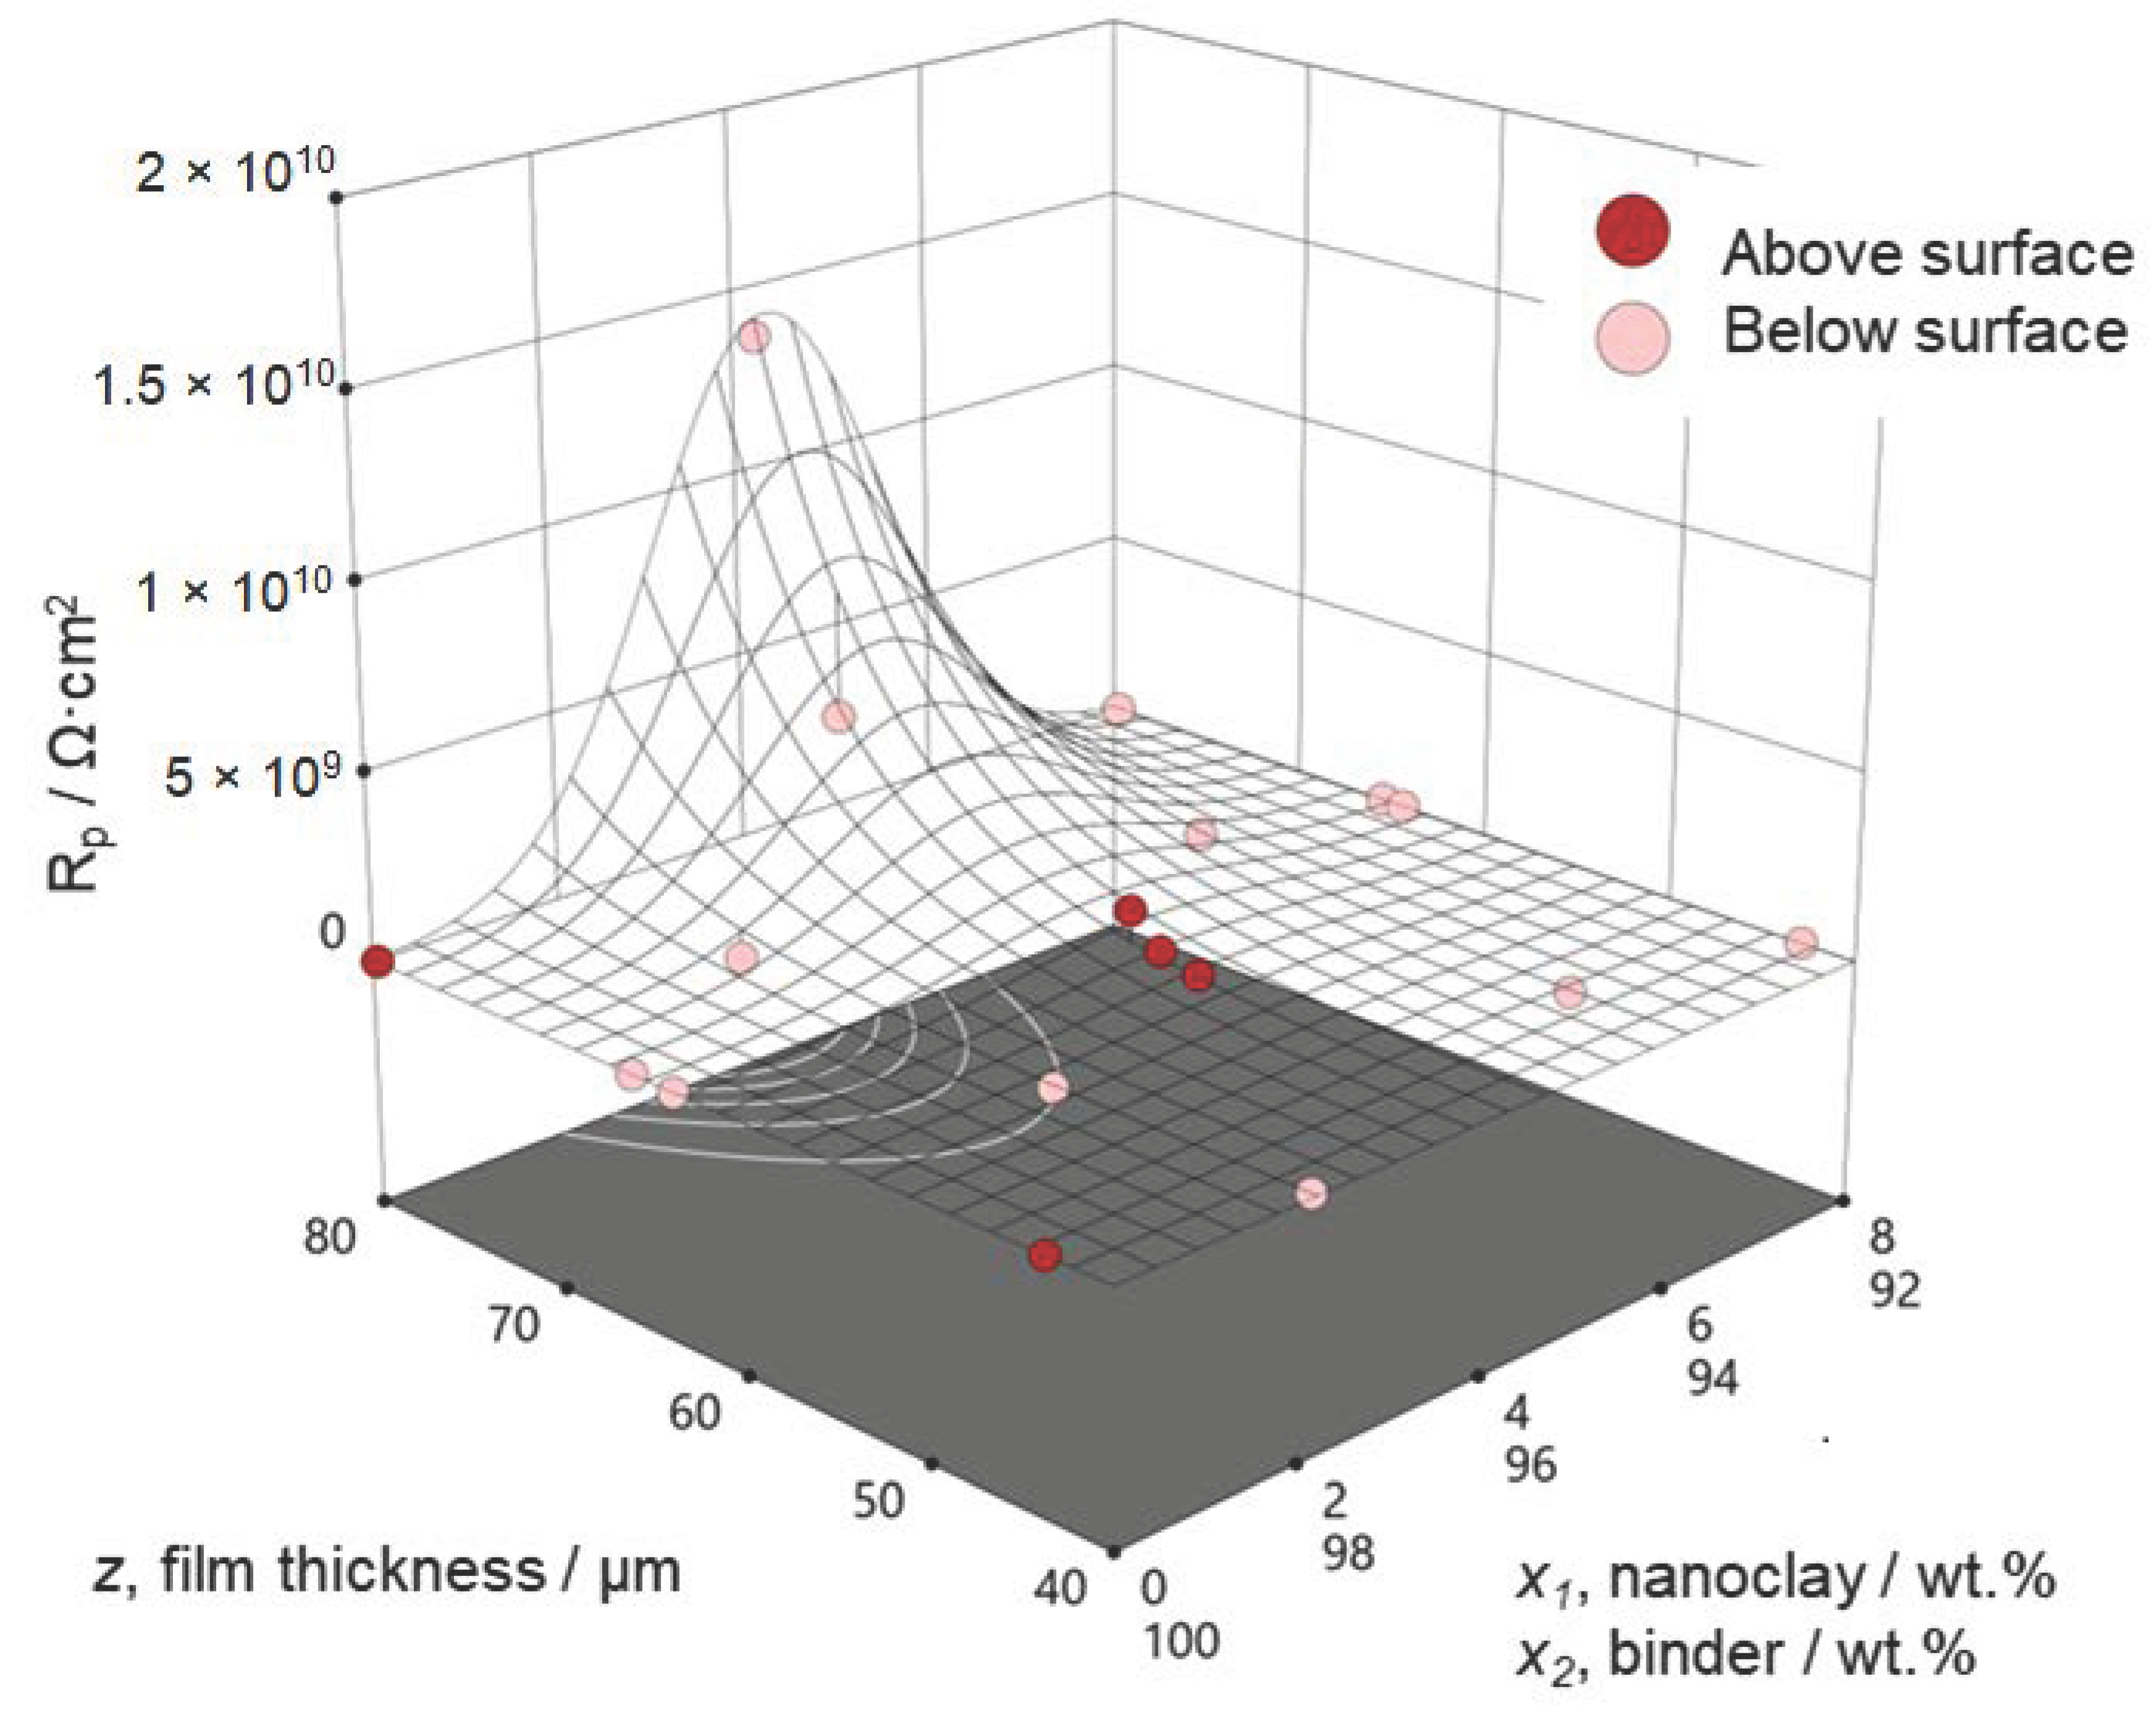
Figure 1. Graph of the statistical model using the Rp value as the response.
Cmd 06 00039 g001
Figure 2. Graph of the statistical model using the specular gloss value as the response.
Cmd 06 00039 g002
Figure 3. Contour plots with (a) the predicted maximum Rp value and (b) the corresponding specular gloss value. The red dots represent the measured values.
Cmd 06 00039 g003
Figure 4. (a) OCP and (b) Rp values, Panel Nos. 13, 8, and 11 with three film thicknesses, prepared from the formulae with 4% nanoclay.
Cmd 06 00039 g004
Figure 5. Optical images of a coating with 4% nanoclay on glass slide (a) before and (b) after immersion in 5% NaCl solution for 15 days; SEM images of Panel No. 08 cross-section (d) before and (e) after immersion test; CLSM images with Sa and Sz values (mean and standard deviation of three measurements on the same panel) of (c) Panel 08 and (f) Panel No. 11, both with 4% nanoclay.
Cmd 06 00039 g005
Figure 6. EIS spectra of Panel No. 11, coating with 4% nanoclay and a film thickness of 80.0 µm, (ac) Days 0–4, (df) Days 5, 10, and 15; EECs for EIS data fitting of (g) Days 0–4, and (h) Days 5, 10, and 15.
Cmd 06 00039 g006
Table 1. DOE for Mixture Design, nanoclay in a polyester/TGIC binder.
Panel No.Experiment No.x1, Nanoclay/wt.%x2, Binder/wt.%z, Film Thickness/µm
17010040
211010080
317010060
418010060
5129870
6329840
71029850
8449660
9849680
10949660
111349680
121449660
131649640
14669470
151569450
16289280
17589260
181289260
191989240
Table 2. Measured values of Rp and specular gloss for input to the Mixture Design.
Panel No.Experiment No.Actual Coating Film Thickness/µmResponse 1, Rp/Ω∙cm2Response 2, Specular Gloss/Gloss Unit (GU)
1743.32.32 × 106110.3
21179.76.77 × 107113.5
31762.54.62 × 106111.1
41864.89.94 × 106112.2
5170.18.38 × 107103.4
6340.31.07 × 107102.6
71053.11.23 × 107100.4
8457.57.70 × 10855.0
9875.43.98 × 10962.3
10959.11.57 × 10959.0
111380.01.38 × 101063.6
121455.55.07 × 10851.1
131635.12.53 × 10731.0
14665.17.08 × 10814.5
151545.71.17 × 10720.6
16279.73.55 × 1075.2
17564.43.16 × 1074.8
181263.32.73 × 1074.7
191942.61.05 × 1074.3
Table 3. ANOVA for the model using Rp as the response. Strongly significant correlations are marked with p-values in bold.
SourceSum of SquaresDegree of FreedomMean SquareF-Valuep-Value
Model95.50519.1019.68<0.0001
Linear Mixture3.6313.633.730.0754
x1 × x255.55155.5557.22<0.0001
x1 × z1.7611.761.820.2008
x2 × z5.5215.525.680.0331
x1 × x2 × z3.8313.833.950.0685
Residual12.62130.9708
Corrected Total108.1218
Corrected total: total sum of squares corrected for the mean.
Table 4. ANOVA for the model using specular gloss values as the response. Strongly significant correlations are marked with p-values in bold.
SourceSum of SquaresDegree of FreedomMean SquareF-Valuep-Value
Model31,244.2156248.8450.83<0.0001
Linear Mixture30,867.18130,867.18251.08<0.0001
x1 × x214.87114.870.12090.7336
x1 × z9.1519.150.07440.7893
x2 × z26.88126.880.21860.6478
x1 × x2 × z165.961165.961.350.2662
Residual1598.1913122.94
Corrected Total32,842.4018
Corrected total: total sum of squares corrected for the mean.
Table 5. Fitted values from EEC analysis, Panel No. 11 (4% nanoclay, 80.0 µm).
TimeCPEcoatRporeCPEdlRctWs-RDWs-TDWs-Pχ2
DaysQcoat/
Ω−1∙cm−2∙sn
αcoatΩ∙cm2Qdl/
Ω−1∙cm−2∙sn
αdlΩ∙cm2Ω∙cm2∙sPs
04.99 × 10−110.9816.36 × 1086.96 × 10−120.6341.44 × 1011 3.44 × 10⁻⁴
14.40 × 10−110.9926.11 × 1082.31 × 10−110.6334.58 × 1011 1.26 × 10⁻⁴
24.37 × 10−110.9934.35 × 1099.44 × 10−110.5101.53 × 1011 3.78 × 10⁻⁴
34.30 × 10−110.9945.55 × 1091.28 × 10−100.5063.71 × 1011 1.09 × 10⁻⁴
44.35 × 10−110.9936.40 × 1091.72 × 10−100.6191.60 × 1011 1.25 × 10⁻⁴
54.30 × 10−110.9946.16 × 1091.52 × 10−100.5594.47 × 10103.61 × 10111.04 × 1030.7271.18 × 10−4
104.21 × 10−110.9945.24 × 1091.51 × 10−100.5837.67 × 1097.08 × 10101.95 × 1030.5501.08 × 10−4
154.26 × 10−110.9944.52 × 1091.30 × 10−100.5391.08 × 10105.76 × 10102.52 × 1030.5381.02 × 10−4
Disclaimer/Publisher’s Note: The statements, opinions and data contained in all publications are solely those of the individual author(s) and contributor(s) and not of MDPI and/or the editor(s). MDPI and/or the editor(s) disclaim responsibility for any injury to people or property resulting from any ideas, methods, instructions or products referred to in the content.