Abstract
Corrosion in infrastructure creates high-risk scenarios, and mitigation strategies are expensive, with significant annual costs globally. This paper advances the discourse of corrosion monitoring and tracking in infrastructure, emphasizing the importance of data analytics, AI, and Digital Twins (DT) for managing the infrastructure lifecycle while reducing risk and costs associated with corrosion. The non-parametric analysis of corrosion data is demonstrated to provide insights into spatial and temporal variations, helping in predictive modeling and decision-making. Strategic sampling and analysis of corrosion data help in making evidence-based maintenance decisions, reducing costs, and improving safety. AI analytics enhances the functionality of corrosion databases and Digital Twins, enabling predictive analytics and real-time simulations for better decision-making. Recommendations are provided for the implementation of AI in engineering applications, including data quantity and training resources, but offer significant potential for improved corrosion management.
1. Introduction
Corrosion in infrastructure systems can lead to high-risk scenarios that require expensive mitigation strategies in service throughout a system’s lifecycle. Corrosion is so prevalent and takes so many forms that its occurrence and associated costs cannot be eliminated completely. However, it has been estimated that 25 to 30% of annual corrosion costs in the U.S. could be saved if optimum corrosion management practices were employed. The cost of government assets is similarly significant. The global cost of corrosion on infrastructure [1] from a study dated 2017 is estimated to be around USD 2.5 trillion annually, which represents approximately 3.4% of the world’s Gross Domestic Product (GDP). This figure reflects only the direct cost of corrosion—essentially materials, equipment, and services involved with repair, maintenance, and replacement. The United States’ total annual estimated direct cost of corrosion [2] from a study dated 2002 is a staggering USD 276 billion—approximately 3.1% of the nation’s GDP. Early prediction and monitoring of corrosion can reduce economic losses.
Inspection and monitoring approaches are used to mitigate the substantial risk and costs associated with corrosion; however, there are challenges in the resources required and consistent approaches implemented to effectively manage corrosion. The use of data analytics plays a role in both improving inspection and monitoring approaches while reducing the limited resources required to implement monitoring strategies. Artificial intelligence (AI) applications, including in Digital Twins (DT), are being proposed as supportive efforts to corrosion management.
The objective of this paper is to present new technology for bridging the gap between applicable standards and reality for infrastructure corrosion by monitoring and using the latest technology available for data analysis and decisions for forecasting inspection and maintenance needs. This paper begins with an overview of engineering approaches used to manage and analyze corrosion data, along with risk-based approaches used to support decisions for mitigating and managing risk from corrosion failure in infrastructure. The paper then presents new technology involving DTs, data analytics, and artificial intelligence (AI) used to support these engineering activities, along with example applications of AI in data analytics, which are discussed as part of the new research and perspectives. The synergistic benefits of AI and AI analytics are discussed as part of the new research perspectives. Finally, recommendations are provided for further research on this topic.
2. Corrosion Monitoring and Databases
Corrosion monitoring of infrastructure is conducted by inspections that are primarily visual and often supplemented by measurements, typically residual structural thickness that is compared to original structural design thicknesses to infer corrosion wastage amounts and rates. Industries use various inspection techniques (i.e., for steel frame and rebar corrosion) or metadata (i.e., salinity and temperature) to infer corrosion rates from related corrosion rate models. In these examples, the data are archived in databases, often of varying types and platforms, for further analysis and forecasting. The information is then used for situational repair decisions, and, in many cases, the information is no longer retained or used in any other forecasting or trending analysis. In resource-limited cases, the retention of the data is archived in digital file folder systems, and the corrosion data are analyzed in spreadsheet-type databases when possible. Approaches for archiving corrosion data include specialized flat databases, 3D databases, cloud storage databases, and Digital Twin type-databases, as examples discussed in more detail below.
2.1. Data Management
The specific corrosion data, whether visual, photographs, thickness measurements, or other metadata (i.e., temperature and salinity), are taken at specific locations known to be problematic from prior experience. In these cases, the data must be obtained in a manner that reflects the entirety of the structure or, at a minimum, the locations of the highest structural demand. Similarly, the data must be representative of a specific time and will be more useful if sampled periodically, if forecasts are to be made from the data. The form and function of a database are important for efficient monitoring and utilization of the information obtained.
2.2. Databases in Corrosion Management
Databases used to archive corrosion measurements and related metadata include flat, 3D, Cloud, and Digital Twin, as examples discussed here.
2.2.1. Flat Databases
Flat databases are typically used to store digital data in electronic documents, including digital text and pdf formats. These flat databases are used to store photographic and tabulated measured data. The extent of metadata (including spatial and temporal) varies greatly depending on the application. The data are typically time-stamped in some format for general use if specific time information is available. An example of a flat database is the one used by the US Navy surface ship maintenance Corrosion Control Information Management System (CCIMS) [3,4]. The US Navy uses the database to plan maintenance on ships, including assessment tracking, data analysis facilitation, repair/overhaul work planning, and future maintenance needs forecasting.
2.2.2. Three-Dimensional Databases
Three-dimensional (3D) databases are used to archive the measured data and are most useful in displaying the special representations of the data in 3D vector space. A number of these approaches use Computer-Aided Design (CAD) based programs. Other programs have linked references to the typical flat file information for future reference as needed. These programs are useful in targeting specific areas of concern that can be used to focus further inspections and maintenance actions. The databases may be used for data analysis using either internal or external statistical analysis tools.
The MAESTRO corrosion database [5] is an example of a ship structure-specific solution for monitoring corrosion. This database is combined with a structural FEA model for structural analysis as shown in Figure 1. The MAESTRO approach can be used to predict future corrosion wastage failures given measured corrosion rates, as shown in Figure 2.
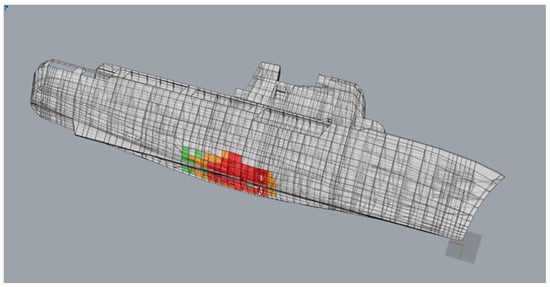
Figure 1.
Illustrative example of a surface ship in the (3D) MAESRTO Corrosion Database [5].
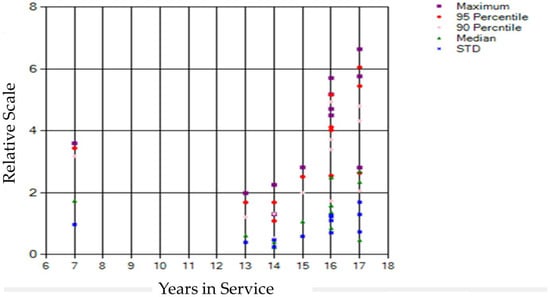
Figure 2.
Illustrative example of relative statistics as a ratio to a baseline of corrosion on a surface ship in the MAESRTO Corrosion Database [5].
2.2.3. Corrosion Databases and Cloud Computing
Cloud computing is used for storing the large datasets of many applications, including corrosion-related information.
The American Bureau of Shipping (ABS), Google Cloud, and SoftServe [6] completed a pilot project applying artificial intelligence (AI) models to detect levels of corrosion and coating breakdown on ships and offshore structures. ABS reports that the project successfully demonstrated the accuracy of AI in detecting and assessing structural anomalies commonly found during visual inspection. AI techniques could be further used to analyze images over time to understand corrosion and coating breakdown trends.
A 3D point-cloud-data-based Bayesian model updating approach is presented to predict the critical parameter evolution of concrete sewer corrosion [7]. The proposed approach adopts a novel distribution-based updating strategy to address the multivariate and asymmetric nature of massive point-cloud data. The effectiveness of the proposed method is investigated using two publicly available sewer corrosion datasets from Perth, Australia, and Texas, USA. The Perth case results show that critical parameters after Bayesian updating have the same trends as the in situ monitoring data, which provides interpretability for ultimate decision-making. The Texas case results show that the proposed framework enables more accurate service life predictions than the non-updated Pomeroy model. The proposed approach achieves interpretable and intelligent decision-making, contributing to improved sewer predictive maintenance.
The key aspects of the approach include the following:
- Automatic updating of the corrosion model is proposed for the sewer using 3D point cloud data;
- A predictive lifecycle management framework is presented for the concrete sewer;
- Updating the accuracy of the corrosion model is validated by four-year field data;
- Predictive maintenance capacity of our framework is demonstrated by a case study.
Other industries [8,9] are working on cloud computing and databases for monitoring corrosion, showing demand for this type of action in infrastructure lifecycle management.
2.2.4. Digital Twin Databases
Digital Twin approaches are being used in major industries as a digital record of the lifecycle of the system [10]. These approaches typically have substantial amounts of data and are justified for the most complex and high-value types of structures where risk management is an essential part of the system’s lifecycle.
Industries are developing Digital Twin technology in manufacturing [11] and are beginning to see opportunities for infrastructure management. The investigators state that “AI analytics represents a transformative evolution in data analysis, enabling organizations to derive meaningful, actionable insights from vast and complex datasets. By leveraging advanced AI techniques, businesses and industries can transition from reactive decision-making to proactive, predictive, and prescriptive strategies. The adoption of AI analytics is increasingly critical in today’s data-driven world, offering a competitive edge while driving innovation and efficiency”.
In their highest form, the digital databases interface with structural analysis approaches, including Finite Element Analysis (FEA) [5], where the data forecasting is used to support structural evaluations of forecast limit states. Here, structural analysis benefits from structural reliability and risk assessments based on the measured data.
2.3. Lifecycle Management Approaches
Examples of infrastructure corrosion management approaches include risk-based approaches for estimating the probabilities of hazards and the associated consequences, including failure losses.
2.3.1. Lifecycle Analysis (ROMMSS)
A methodology has been proposed to utilize risk and economic concepts to manage the maintenance of a structural system [12]. The methodology utilizes and builds on previous experiences and addresses the limitations of current maintenance practices. The methodology described here is referred to as risk-based optimal maintenance management of ship structures (ROMMSS) but is applicable to other structural systems. Risk-based methodologies require the use of analytical methods at the system level that consider subsystems and components in assessing their failure probabilities and consequences. Systematic, quantitative, qualitative, or semiquantitative approaches for assessing the failure probabilities and consequences of engineering systems are used for this purpose. A systematic approach allows an engineer to expediently and easily evaluate complex engineering systems for safety and risk under different operational and extreme conditions. The ability to quantitatively evaluate these systems helps cut the cost of unnecessary and often expensive reengineering, repair, strengthening, or replacement of components, sub systems, and systems. The results of risk analysis can also be utilized in decision analysis methods that are based on benefit–cost tradeoffs.
The ROMMSS is a multi-step process that provides a systematic and rational framework for the reduction of Total Ownership Costs for ships and other large-scale structures. This framework combines advanced probabilistic numerical models, optimization algorithms, risk and maintenance cost models, and corrective/preventive maintenance technologies and directs them toward the cost-effective identification, prioritization, and overall management of ship structure maintenance problems. Such a strategy could lead to the reengineering of structural components and system maintenance processes. For a ship example, the basic steps followed for the ROMMSS strategy are as follows:
- Selection of ship or fleet system;
- Partitioning of the ship structure into major subsystems and components;
- Development of risk-based optimal maintenance policy for major components within a subsystem;
- Selection of a time frame for maintenance implementation, and development of a risk-ranking scheme;
- Development of optimal maintenance scheduling for the overall vessel;
- Implementation of optimal maintenance strategies and updating system condition states and databases.
Maintenance and repair actions that can be applied to various segments of a component depend not only on the damage category, but also on the location of the component and the condition states of the component. The cost of these actions can differ significantly. Possible maintenance actions include spot blasting, welding, patch coating, addition and maintenance of sacrificial anodes, and section replacement. In general, the cost of maintenance action increases with the severity of a condition state. An associated expected failure cost is due to the risk of being in a particular condition state. This cost is estimated at a subsequent step.
Large system structural components tend to deteriorate when no maintenance actions are taken. A model must therefore be developed to estimate the deterioration rates of components under such circumstances. The model must have the capability to quantify the uncertainty inherent in such predictions. Furthermore, the prediction model must have the capability to incorporate results from actual experience and to update parameter values when more data becomes available. A probabilistic Markov chain model, which quantifies uncertainty, is adopted in this study. It estimates the likelihood that a component, in each condition state, would make a transition to an inferior condition state within a specified period. An example of the Markov chain model is shown in Figure 3. This Markov chain modeling has been used in bridge management systems for maintenance planning developed by the Federal Highway Administration and utilized by many US states [13].
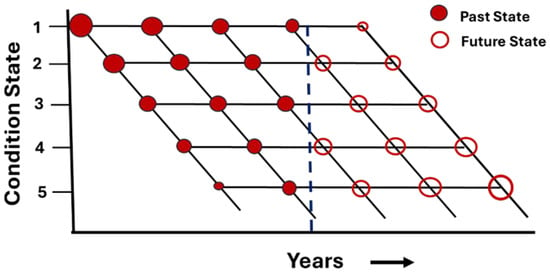
Figure 3.
Example Markov chain transition between condition states without maintenance actions. The circle’s size represents the percentage in the state. The dashed line represents current year. Redrawn and enhanced based on [12].
2.3.2. Data Analysis for Maintenance Decisions
Strategic sampling and analysis of the measured data provide corrosion rates at critical locations. As a result of strategic sampling, maintenance schedules can be condition-based, or maintenance decisions can be made based on current condition and forecast corrosion rates. Deferred maintenance is possible with evidence-based decisions, resulting in great cost savings in both scenarios. An approach has been developed for managing risk and Total Ownership Costs (TOC) with proactive monitoring [14]. In this approach, failure hazard probabilities are estimated, approaches for reducing uncertainty are identified, and costs are estimated for failure mitigation and loss costs. Figure 4 shows an example of this approach with fatigue and corrosion considered.
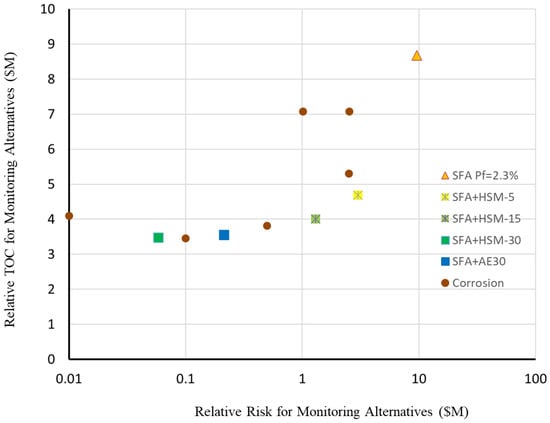
Figure 4.
Relative risk-informed Total Ownership Costs (TOC) trade-space with fatigue and corrosion risk control scenarios [14].
Figure 4 shows the relative risk and TOC for fatigue and corrosion monitoring scenarios. Scenarios include Spectral Fatigue Analysis (SFA), Hull Structure Monitoring (HSM), and Acoustic Emission (AE) with Visual and Non-Destructive Testing (NDT) inspections [14].
An interesting area between USD 0.5M and USD 10M for risk and USD 1M and USD 10M for TOC occurs in Figure 4. There are many risk control options from SFA in design to HSM and corrosion inspection results that could provide acceptable values of risk based on the preferences and perceived utilities of the Decision Makers. The differences in TOC produce a substantial difference in RoI for each option, justifying the investments by Decision Makers. In this example, the risk-TOC framework is used to evaluate alternatives to risk management options, technology investments, and the potential RoI that is not as evident in any other type of analysis (i.e., Component Reliability, Optimal Inspection, β-based).
This example is illustrative of the risk-TOC approach and serves as a starting perspective for further research and development and refinement of the approach relative to corrosion in ship structure and application in the broader context of infrastructure lifecycle management.
3. Data Analytics
Data are of little use if it is simply stored and not used for any actionable purpose to affect an infrastructure’s lifecycle and related costs. It takes thought-out approaches and resources (financial and human) to turn corrosion measurements into decisions to reduce the risk and lifecycle costs for Decision Makers. The technology includes statistical analysis of data to enable forecasting of future conditions and support technical approaches for interpreting the long-term risks and costs.
3.1. Non-Parametric Statistical Analysis
Analysis of corrosion data for a large complex structure involves examination of both the spatial and temporal statistical parameters. An example of a non-parametric analysis is presented along with the findings on severe corrosion, outliers, and sampling implications.
This section presents an example of how the analysis of measured data is applied to a US Coast Guard cutter class [15].
During the period from 2008 to 2010, comprehensive visual and ultrasonic structural assessments of twelve vessels of the medium endurance cutters were undertaken. These vessels were commissioned between 1964 and 1969. The structural assessments were based in part on thickness measurement of plates and were in support of a mission effectiveness project and dry-dock availability study. The content of a relational database was assembled, consisting of 76,091 VI and UT thickness measurements tracked by positions on these vessels. Particular attention was given to those areas designated as “wet spaces” and other corrosion-prone areas of the ship.
There were three divisions (structural locations exposed to the weather (ST1), structural locations not exposed to the weather (ST2), and locations underwater in contact with seawater (UW)). Each cutter was sampled at about 5000–7000 locations for thicknesses by cutter, divided into structural and underwater measurements, where structural measurements cover weather decks and inside compartments within the cutters, and underwater measurements consist of underwater thickness measurements by divers.
Nonparametric statistical analysis is provided herein for (1) explaining the problematic or the aggressive corrosion resulting from variability in the corrosion levels sampled; (2) outlier and extreme value analysis for representing the aggressive corrosion; (3) statistically examining corrosion outliers; (4) examining relationships between outlier and general corrosion; and (5) examining spatial variations by positions and the impacts of geographic use of these cutters along U.S. coasts. Corrosion data collected on the 12 ships are analyzed and presented in Table 1.

Table 1.
Descriptive statistics of wastage upper outliers of plate thicknesses by divisions for (a) a cutter as an example and (in parenthesis (b) all cutters as a combined dataset) values taken from [15].
The study statistically examines the spatial and temporal variations in corrosion magnitudes and rates using nonparametric methods, and reports results for the use of researchers and engineers in developing or evaluating predictive time-variant models. The probabilistic data analysis covers general corrosion and extreme values to characterize localized corrosion, such as pitting, based on measured data. Parameters are examined for general corrosion and localized corrosion based on average values and selected percentile values. The results offer a basis for making statements on structural life based on the probabilities of failure at critical locations, divisions, and positions of similar structural components, and critical regions of a vessel using probabilistic life prediction methods [16].
Table 1 and Figure 5 provide the descriptive statistics on the resulting upper and lower outliers and associated box plots for a cutter and a combined case of all cutters, treating all the data as a single dataset for the purpose of comparison. It is noteworthy that ST2 has the greatest outlier magnitudes and counts, followed by ST1, and then UW, although UW outliers are greater in count compared to ST1. Some of the statistics for a cutter are significantly different than the corresponding ones for all the cutters combined.
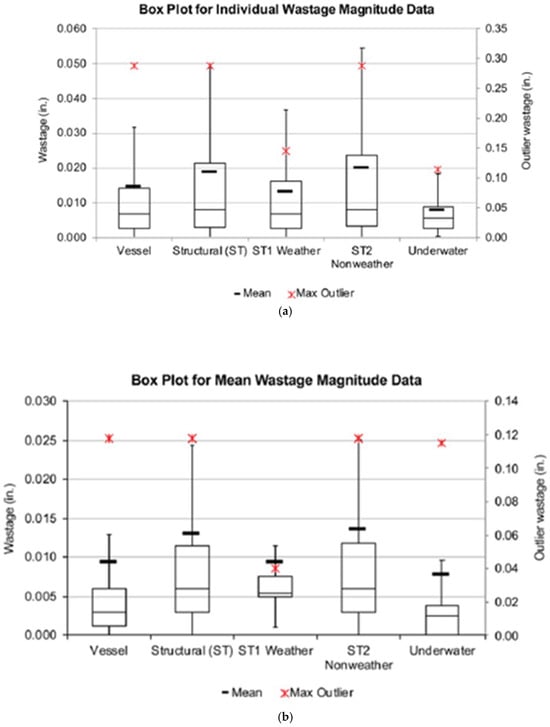
Figure 5.
Box plots for wastage of a cutter as an example (1 ft = 0.3048 m): (a) wastage (in.) at locations by division and (b) mean wastage (in.) at positions by division (general location) [15].
Table 1 shows the outlier counts and the corresponding percentage of their counts to measured values for a cutter as an example. The following observations are made based on Table 1:
- Comparison of ST1 and ST2 statistics: Generally, ST2 upper tail statistics are greater than the corresponding ST1 values. This is an appropriate observation since ST1 locations are generally more accessible than ST2 locations;
- Comparison of ST1 and UW statistics: Generally, ST1 upper tail statistics are greater than the corresponding UW values. This is an appropriate observation since the UW location receives a higher level of maintenance to maintain water tightness, and such locations are most critical for ship survival.
Figure 6 shows the frequency of corrosion wastage (%) for a cutter deck location (ST1). The frequency is biased to the lower wastage with fewer higher wastage measurements. However, the higher wastage locations are often difficult to access for inspection and remediation to reduce the probability of failure.
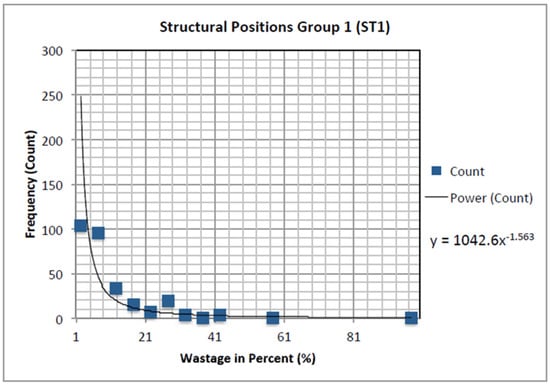
Figure 6.
Illustrative example of corrosion frequency on a surface ship deck [15].
3.2. Outliers and Probability of Detection
The non-parametric analysis of the corrosion data includes the identification of the corrosion that is most damaging, but isolated and high risk, in addition to the likely corrosion rates most common throughout the structure. The maximum severe corrosion wastage shown in Table 1 and Figure 5 and Figure 6 is well beyond the mean value and may be seen as outliers from the range of data. Outliers represent corrosion wastage that exceeds three standard deviations for a normal probability distribution [17]; however, the frequency distribution of corrosion shown in Figure 6 is exponential vs. normal and supports the conclusion that the most severe corrosion is well beyond the acceptable mean for most of the structure.
The presence of outlier corrosion is problematic [15,18] because it is typically at a much higher rate than the average corrosion and often in smaller quantities that are more difficult to find and measure. The outlier corrosion is higher risk for a variety of failure modes depending on the type of infrastructure, be it a steel structure of ships or reinforced concrete of bridges and buildings. The relationships and correlations of corrosion data between general corrosion wastage rates and severe outliers may be used to infer the presence of outlier corrosion, the possible need for more detailed inspections, and more invasive measures if interference must be removed, for example. The ratio of outlier rate to general corrosion wastage rated is on the order of five to ten times the set mean [15] in contrast to approximately two times the average and severe corrosion [19] and an assumed PoD of “25% of the corrosion breakdown can be detected with a probability of 80%”. Severe corrosion is clearly a significant hazard that must be characterized by data analytics to form inspection and mitigation strategies.
3.3. Bayesian Networks
More detailed definitions of corrosion rate relationships are beneficial for complex structures where prior models and metadata (i.e., environmental parameters or location-specific information) are available. In these applications, complex structures and models include the Bayesian Networks [19,20,21].
A Bayesian network, when applied to corrosion measurements, is a probabilistic model used to analyze and predict corrosion levels by considering various influencing factors and their interdependencies, allowing for a more comprehensive understanding of corrosion risk and uncertainty, especially when dealing with incomplete or uncertain data from corrosion measurements; essentially, it helps to estimate the probability of a certain level of corrosion based on available data and expert knowledge about the system.
Bayesian networks excel at handling uncertainty inherent in corrosion processes by assigning probabilities to different corrosion states and factors contributing to corrosion, such as environmental conditions, material properties, and coating integrity. They can model complex interactions between various factors that influence corrosion, allowing for a more holistic assessment of corrosion risk by considering how different variables relate to each other. Bayesian networks can incorporate both qualitative expert knowledge and quantitative data from corrosion measurements (like potential readings, weight loss measurements) to generate more accurate predictions.
A Bayesian network is often structured as a directed acyclic graph where each node represents a variable related to corrosion (e.g., corrosion rate, environmental factor, inspection result) and edges indicate the influence of one variable on another. Each node in the network has a Conditional Probability Distribution (CPD) which specifies the probability of a certain state of that variable given the states of its parent nodes. Once a Bayesian network is built, it can be used to predict future corrosion levels based on new measurements or changing conditions, enabling proactive maintenance strategies. By incorporating new measurement data into the network, Bayesian inference can be used to update the probabilities of different corrosion states, providing a more accurate assessment of the current corrosion situation.
Example applications of Bayesian networks in corrosion analysis include:
- Identifying high-risk sections of a pipeline by considering factors like soil conditions, coating quality, operating pressure, and inspection data;
- Evaluating the likelihood of severe corrosion under deposits in pipelines by incorporating factors like flow rate, deposit thickness, and microbial activity;
- Assessing the probability of corrosion damage to rebar within concrete structures based on environmental exposure, concrete quality, and measured corrosion potentials.
3.4. Strategic Sampling
Sampling location and frequency are useful parameters in characterizing corrosion for forecasting hazards and planning mitigation strategies. These parameters inform risk analysis for decisions by the system managers. In this context, past performance is used to forecast future performance. The coating performance and maintenance schedules also play important roles in planning corrosion sampling approaches.
Offshore structures, bridges, industrial piping, commercial ships, and military ships have different environmental exposure characteristics and corrosive medium variables. For example, a structure may be globally or locally exposed to an intermittent or constantly corrosive environment of varying corrosive characteristics (i.e., temperature and salinity). Therefore, it is difficult to generalize and specifics of the application matter in sampling strategies (i.e., less frequent uniform sampling vs. strategic, more frequent local sampling or optimum combination of both). In all cases, data and relevant experience are necessary to inform sampling approaches.
Based on the analysis of the non-parametric example, the corrosion rates are useful, and the finding that most of the structure is generally well-maintained. The sampling to accomplish this goal must be focused on known problematic areas where condensation or water ingress is likely to aggregate and cause corrosion in the longer term and at intervals in the structure’s lifecycle. In this example, the correlation of average corrosion may inform the existence of severe corrosion wastage to plan strategic inspections.
4. AI in Analytics, Inference, and Digital Twins
There are beneficial technologies and approaches that support decisions based on the measured data, including inference on spatial importance, statistical sampling of both spatial and temporal data, lifecycle analysis, and implications useful in decisions based on this information.
4.1. AI Analytics
AI analytics refers to the application of artificial intelligence (AI) techniques, such as machine learning (ML), natural language processing (NLP), and predictive modeling, to analyze and interpret complex datasets. AI enables organizations to extract meaningful insights, automate data processing, and support decision-making processes in ways that traditional analytics cannot achieve.
The key idea behind AI analytics is to augment or replace manual, rule-based data analysis with systems that learn from data and improve their performance over time. These systems can handle large volumes of data, uncover hidden patterns, predict future trends, and provide actionable recommendations.
Benefits of AI Analytics include the following:
- Automates data analysis and generates insights faster than traditional methods;
- Reduces human error and improves predictions with data-driven methods;
- Handles large volumes of structured and unstructured data across industries;
- Enables proactive decision-making using live data streams;
- Uncovers complex patterns and trends that might remain hidden with traditional tools.
Challenges of AI Analytics include the following:
- AI is only as good as the data it processes; poor data can affect outcomes;
- Black-box AI models can be difficult to explain and understand;
- Training AI models requires significant amounts of data, computing power, and resources.
An example of AI analytics includes the application of Microsoft (MS) Copilot in the non-parametric analysis of the corrosion data presented previously for the class of US Coast Guard cutters. Copilot is an integrated application in MS Excel and has prompt instructions, both user-defined, and Copilot suggested “INSIGHTS” for the analysis. Figure 7 and Figure 8 show the maximum and average corrosion wastage for a cutter, and Figure 9 and Figure 10 show locations of maximum corrosion developed by Copilot. These figures are very similar to the ones shown for the non-parametric analysis previously, with additional insights generated from the data plotting by Copilot. The results of this output can be used to develop corrosion rates at critical locations required for focused inspections and maintenance. The data analytics further supports corrosion management approaches as presented previously.
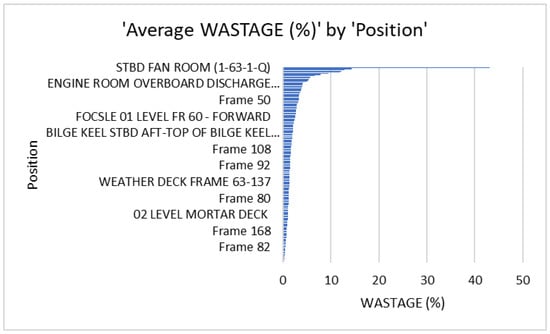
Figure 7.
Average corrosion wastage (%) per position (location) by MS Copilot and user prompts.
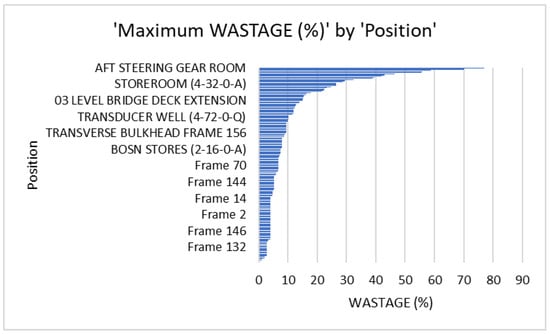
Figure 8.
Maximum corrosion wastage (%) per position (location) by MS Copilot and user prompts.
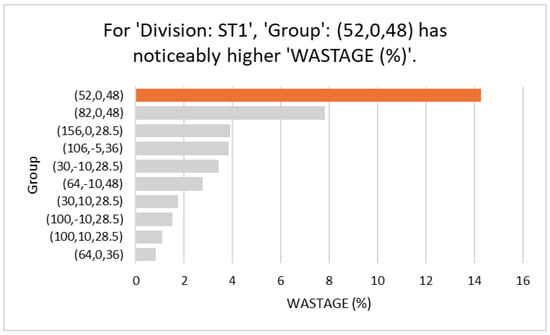
Figure 9.
Average corrosion wastage (%) per group (location coordinates) by MS Copilot “INSIGHTS”.
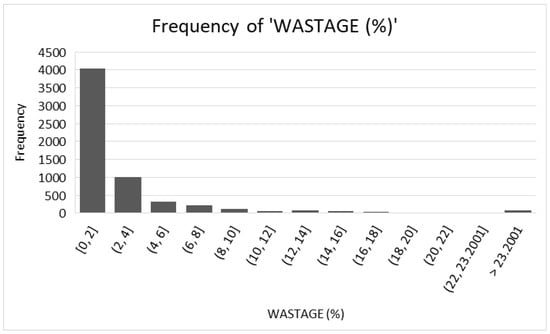
Figure 10.
Corrosion wastage (%) histogram by MS Copilot “INSIGHTS” for the dataset.
The potential resource savings from these AI insights are significant and relatively easy to obtain. Whereas the database development formatting took over 100 h (fixed development cost) and over 40 h for the manual analysis, results tabulation, and display development, the Copilot analytics took less than 2 h to obtain and display automatically developed as part of the Copilot process. There are external AI applications (i.e., Julius [22]) developed for statistical analytics; however, the integrated Copilot is intuitive and easy to use for most corrosion engineers.
4.2. AI and Inference
Statistical inference refers to a “process” for using prior knowledge and updating the prior knowledge as new information becomes available. The approach is attributed to Reverand Bayes and has been used by scientists, engineers, and in financial, legal, and many other applications.
At the core of Bayesian Networks lies probabilistic inference, where the network is used to calculate the probabilities of various events or states of the variables. This inference mechanism also enables AI systems to make reasoned decisions by considering the uncertainty associated with the available information.
Bayesian Networks are a type of probabilistic graphical model. The first stage of belief networks is to convert all possible states of the world into beliefs, which are either true or false. In the second stage, all possible transitions between states are encoded as conditional probabilities. The final stage is to encode all possible observations as likelihoods for each state.
Developing probabilistic models is challenging in AI due to the lack of information about the relationship or the dependence between random variables. Even if it is present, calculating the conditional probability of such an event can be illogical. In this scenario, developers take a common approach where they make assumptions or estimates, such as that all random variables in the model are conditionally independent, dependent, or somewhere in between. A belief network can be seen as an inference procedure for a set of random variables, conditioned on some other random variables. This forms the basis of Bayesian Networks in AI, which are types of probabilistic models that involve how random variables are conditionally or unconditionally independent. The conditional independence assumptions define the joint probability distribution from which the conditional probabilities are computed.
Bayesian Networks [23] are applied in a variety of tasks, including the following:
- Assist in information retrieval for research, which is a constant process of extracting information from databases;
- Form of signal processing, image processing uses mathematical operations to convert images into a digital format. Once images (i.e., photographs or video frames) are converted, their quality can be enhanced with more operations;
- AI inference is the process of using a trained artificial intelligence (AI) model to analyze new data and make predictions. It is a key part of machine learning and AI technology.
AI inference in corrosion control refers to the process where an AI model, trained on large datasets of corrosion data, analyzes new information from sensors or inspections to predict the likelihood of corrosion, identify its severity, and recommend preventative actions, allowing for more proactive and targeted corrosion management strategies based on real-time insights.
Bayesian networks and deep learning models address uncertainty and data sparsity in AI by leveraging probabilistic modeling and regularization techniques. This allows them to not only make predictions but also quantify the uncertainty associated with those predictions, making them suitable for scenarios with limited or noisy data.
4.3. AI in Corrosion Databases and Digital Twins
AI has been proposed for use in both large databases and Digital Twin applications in corrosion data acquisition and analysis. The following sections describe work being conducted in these two important areas, generally at a large scale where data volume is available to data scientists and engineers.
4.3.1. AI in Corrosion Databases
Large datasets are often maintained in cloud computing applications. An “AI-powered cloud computing corrosion database” refers to a digital repository stored on a cloud platform that houses a large collection of corrosion-related data, utilizing artificial intelligence algorithms to analyze and interpret this information, enabling predictive maintenance, early detection of corrosion issues, and optimized asset management strategies across various industries.
AI uses machine learning models like deep learning are used to identify patterns in the data, allowing for automated corrosion detection and prediction of future corrosion behavior based on current conditions.
The database is hosted on a cloud platform, providing easy access to the data and analysis tools from anywhere with an internet connection.
Benefits of cloud platforms for databases include:
- Early detection of corrosion allows for timely repairs, preventing potential failures and costly downtime;
- Prioritizing maintenance based on predicted corrosion risks, companies can allocate resources more efficiently;
- Identifying critical corrosion areas helps to mitigate potential safety hazards;
- Access to real-time insights enables informed decisions regarding asset management and corrosion mitigation strategies.
Examples of applications:
- Monitoring pipeline integrity by analyzing corrosion data from sensors and visual inspections to identify high-risk areas [24];
- Using AI to detect corrosion on structural components of ships and offshore platforms based on drone imagery [25,26,27];
- Analyzing corrosion patterns on bridge beams and cables to prioritize maintenance activities.
AI approaches have been divided into categories with integrated non-transparent models and those with documented machine learning models. In both cases, the user must practice due diligence in validating the outputs in the same manner as any engineering model.
4.3.2. AI in Digital Twins
AI enhances the functionality of Digital Twins by enabling predictive analytics that allow for real-time simulations and scenario modeling. This combination improves operational insights and decision-making capabilities significantly [28,29].
Digital Twins are virtual replicas of physical systems that continuously evaluate operational impacts utilizing real-time data. They serve as dynamic models that facilitate a deeper understanding of system behaviors in operation and their impact on performance and lifecycle. In engineering contexts, Digital Twins offer the possibilities of real-time diagnostics and prognostics, enabling impact assessments for off-design operations and facilitating maintenance scheduling for cause. Digital Twins, being tightly integrated multi-disciplinary models, enable scenario modeling and evaluations. The off-design scenarios could, when data are available, be based on real-time operational data. In defense applications, they enhance mission planning, asset management, and operational readiness by enabling the simulation of various scenarios and outcomes. By leveraging these capabilities, organizations can optimize performance and extend the lifecycle of their assets while improving decision-making processes across various industries.
The key requirements for effective Digital Twins include the following:
- Effective data management encompasses the collection, transmission, storage, and retrieval of data from physical assets. This capability is essential for providing real-time information about performance, conditions, and maintenance needs;
- Numerous technical hurdles when integrating these advanced technologies. Compatibility issues between existing systems, complexities in data management, and the need for sophisticated infrastructure can impede successful implementation;
- Institutional challenges include the need for skilled personnel. The successful deployment of Digital Twins and AI requires a proficient workforce in these areas. This highlights the importance of training programs to equip personnel with the necessary skills.
Additional recent investigations on this application of AI in DTs for corrosion infrastructure include discussion on framework and applications in wind turbine and bridge structures [30,31]. The discussion of measured corrosion analytics is sparse in the literature in the context of AI and DTs and is a new aspect for further research of this important topic.
5. Conclusions and Recommendations
AI and Digital Twins represent a transformative evolution in data analysis, enabling organizations to derive meaningful, actionable insights from vast and complex datasets. By leveraging advanced AI techniques, businesses and industries can transition from reactive decision-making to proactive, predictive, and prescriptive strategies. The adoption of AI analytics is increasingly critical in today’s data-driven world, offering a competitive edge while driving innovation and efficiency.
The challenge is to use AI and Digital Twins in engineering applications effectively. Not all organizations have the resources to field monitoring systems needed to obtain the quantity of data to train AI, nor the sample duration to infer long-term lifecycle management.
Corrosion databases, Digital Twins, and developing AI applications offer potential to fill the gap between codes and reality.
This paper is a focused response to the Special Issue theme of research benefiting infrastructure life cycle management and presented from an industry perspective. Examples are presented using analytics that bridge AI to Digital Twins in the context of infrastructure lifecycle management. While there is literature on both AI and Digital Twins primarily in manufacturing, the integration of analytics into infrastructure lifecycle management is relatively new, and the literature is sparse.
This focused paper begins with an overview of engineering approaches used to manage and analyze corrosion data, along with risk-based approaches used to support decisions. This paper then presents new technology involving Digital Twins, data analytics, and artificial intelligence (AI) used together to support these engineering activities, risk mitigation, and decision support. The application of AI in data analytics for corrosion in ship structure is relatively new. The benefits of AI and AI analytics are discussed in the context of the necessary resources to implement them. Recommendations are provided here for further research for the continued development of the emerging technologies to mitigate and manage the risks from corrosion in infrastructure.
5.1. AI and Corrosion Analytics
A significant amount of research is being conducted on incorporating AI in corrosion management approaches, especially in inspection assistance via image recognition and data analytics. There are efforts to incorporate AI into predictive approaches, including in Digital Twin applications in various engineering fields.
Corrosion inspections can be conducted more efficiently by frequent, focused inspections guided by prior experience and general surveys when conducted. Corrosion databases, data analytics, and AI are key technologies in this process.
5.2. Challenges for AI in Engineering Applications
AI has been proposed for inspection support, analytics, Markov chain development, and risk assessments; however, little effort has been made to aggregate these analyses into Digital Twin support for lifecycle management of the infrastructure system. The fully integrated lifecycle approach requires further research efforts to integrate the variety of elements in a full lifecycle approach discussed herein. The Digital Twin efforts are oriented in this direction.
Potential approaches include the use of hyperparameters from models, alternate training techniques, and the application of AI for inference via Bayesian Networks and Digital Twins.
Further experimentation in AI applications is a fruitful topic for future research, in addition to the examples provided in this paper. The research should include explanations or a conceptual framework of how AI analytics are integrated into Digital Twin systems, diagrams, model architecture, and system workflows. The research should include suggestions such as open dataset creation, benchmarking models, or pilot programs.
5.3. Resources Needed to Fully Implement AI
Not all organizations have the resources to acquire significant quantities of data required to train AI over long-term applications. Application of corrosion models and monitoring with limited data requires the use of similar data and models in similar applications with engineering or well-trained AI in the future.
Engineers must be trained in corrosion management approaches and AI applications for organizations to receive the benefits of the rapidly developing field of AI. How to integrate accessible AI into databases and Digital Twin models? This is a topic for developmental efforts and enterprising AI engineers.
Author Contributions
B.A. conducted corrosion analytics and contributed technical review of this paper. K.S. conducted the AI analytics and summarized the efforts of both authors in corrosion management approaches. All authors have read and agreed to the published version of the manuscript.
Funding
This research review received no external funding.
Data Availability Statement
The data shown in this paper are available from the published papers referenced herein.
Acknowledgments
The authors acknowledge the prior research conducted for the US Coast Guard [15].
Conflicts of Interest
The authors declare no conflicts of interest. The funders had no role in the design of the study; in the collection, analyses, or interpretation of data; in the writing of the manuscript; or in the decision to publish the results.
References
- NACE International. 2025. Available online: https://www.jm.com/en/blog/2017/march/nace-study-estimates-global-cost-of-corrosion-at-25-trillion-annually/#:~:text=NACE%20International%20today%20released%20the,Read%20the%20article (accessed on 27 February 2025).
- NACE United States. 2025. Available online: http://impact.nace.org/documents/ccsupp.pdf (accessed on 27 February 2025).
- Shaw, B. Development of the Corrosion and Coatings Report and Data Depot for Naval Use. In Proceedings of the DoD Corrosion Conference, Washington, DC, USA, 10–14 August 2009. [Google Scholar]
- Korzun, J. Corrosion Control Information Management System (CCIMS). In Proceedings of the SSPC Conference, Los Angeles, CA, USA, 27–30 January 2008. [Google Scholar]
- National Shipbuilding Research Program. Minimize Work Content in Production and Maintenance and Reduce TOC Using Early-Stage Structural Design Optimization. NSRP RA Project 2017-443. 2024. Available online: https://www.nsrp.org/project/minimize-work-content-in-production-and-maintenance-and-reduce-toc-using-early-stage-structural-design-optimization-2022-328-001/ (accessed on 27 February 2025).
- ABS Google Cloud and SoftServe Partner to Demonstrate Feasibility of AI-Enabled Corrosion Detection, ABS. 2025. Available online: https://ww2.eagle.org/en/news/press-room/partnership-ai-enabled-corrosion-detection.html (accessed on 27 February 2025).
- Li, M.; Feng, X.; Liu, X. 3D Point-Cloud Data Corrosion Model for Predictive Maintenance of Concrete Sewers. Autom. Constr. 2024, 168 Pt A, 105743. [Google Scholar] [CrossRef]
- Schleider, M. Point of Maintenance Tool for 3D Collection of Corrosion Data. In Proceedings of the DoD Corrosion Conference, La Quinta, CA, USA, 31 July–5 August 2011. [Google Scholar]
- Jiang, Y.; Dong, J.; Qi, X.; Wang, F. Improvement of Monitoring Technology for Corrosive Pollution of Marine Environment under Cloud Computing Platform. Coatings 2022, 12, 938. [Google Scholar] [CrossRef]
- Magyar, B. Digital Twin Technology Is Changing How Infrastructure Is Designed, Built and Operated. Forbes. 2025. Available online: https://www.forbes.com/sites/sap/2023/02/06/digital-twin-technology-is-changing-how-infrastructure-is-designed-built-and-operated/ (accessed on 27 February 2025).
- Siemens Digital Transformation Report. 2025. Available online: https://assets.new.siemens.com/siemens/assets/api/uuid:a1010bc9-6bf0-4bab-98ef-cd04aad3a81d/Tech-Report-Digital-transformation-sustainable-returns-the-new-pathway-of-infrastructure.pdf (accessed on 27 February 2025).
- Ayyub, B.M.; McCuen, R. Probability, Statistics and Reliability for Engineers, 3rd ed.Chapman and Hall/CRC Press: Boca Raton, FL, USA, 2011. [Google Scholar]
- Goyal, R. Bridge Deck Condition Rating Forecast—Survival-Based Models. U.S. Department of Transportation, Federal Highway Administration. 2025. Available online: https://highways.dot.gov/research/long-term-infrastructure-performance/ltbp/data-analysis/bridge-deck-condition-rating-survival (accessed on 27 February 2025).
- Stambaugh, K. On Ship Structural Risk and TOC Management Assisted by Proactive Monitoring. Ph.D. Thesis, Delft University of Technology, Delft, The Netherlands, 2020. [Google Scholar]
- Ayyub, B.; Stambaugh, K.; McGIl, W. End of Life Corrosion Estimation and Profile of Ship Hull Structure: Nonparametric Statistical Analysis of Medium Endurance Cutters. ASCE-ASME J. Risk Uncertain. Eng. Syst. Part B Mech. Eng. 2022, 8, 031203. [Google Scholar] [CrossRef]
- Ayyub, B.M.; Stambaugh, K.A.; McAllister, T.A.; de Souza, G.F.; Webb, D. Structural Life Expectancy of Marine Vessels: Ultimate Strength, Corrosion, Fatigue, Fracture and Systems. ASCE-ASME J. Risk Uncertain. Eng. Syst. Part B Mech. Eng. 2015, 1, 011001. [Google Scholar] [CrossRef]
- NIST. What Are Outliers in the Data? National Institute of Standards and Technology. 2025. Available online: https://www.itl.nist.gov/div898/handbook/prc/section1/prc16.htm (accessed on 27 February 2025).
- Jiang, X.; Melchers, R. Reliability Analysis of Maintained Ships Under Correlated Fatigue and Corrosion. Int. J. Mar. Technol. RINA 2005, 147, 9–18. [Google Scholar] [CrossRef]
- Sridhar, N. (Ed.) Bayesian Network Modeling of Corrosion; Springer: Berlin/Heidelberg, Germany, 2025. [Google Scholar]
- Kreuzer, T.; Papapetrou, Z. Bayesian Network Model for Buried Gas Pipeline Failure Analysis. Reliab. Eng. Syst. Saf. 2020, 203, 107089. [Google Scholar]
- Luque, J.; Straub, D. Reliability analysis and updating of deteriorating systems with dynamic Bayesian networks. Struct. Saf. 2016, 62, 34–46. [Google Scholar] [CrossRef]
- Julius AI|Your AI Data Analyst. 2025. Available online: https://julius.ai/ (accessed on 27 February 2025).
- Turing. An Overview of Bayesian Networks in AI. 2025. Available online: https://www.turing.com/kb/an-overview-of-bayesian-networks-in-ai (accessed on 27 February 2025).
- SAP Community. AI-Powered Pipeline Corrosion Analysis. 2023. Available online: https://community.sap.com/t5/technology-blogs-by-sap/ai-powered-pipeline-corrosion-analysis-implementation-deep-dive/ba-p/13572620 (accessed on 27 February 2025).
- Det Nosrke Veritas (DNV). Corrosion Inspection Solution. DNV Link. 2020. Available online: https://www.dnv.com/research/review-2020/featured-projects/corrosion-ai-inspection/ (accessed on 27 February 2025).
- American Bureau of Shipping (ABS). AI-Enabled Corrosion Detection for American Bureau of Shipping. ABS SoftServe Link. 2025. Available online: https://www.softserveinc.com/en-us/resources/ai-enabled-corrosion-detection-for-abs (accessed on 27 February 2025).
- Imran, M.; Jamaludin, S.; Faisal, A.; Ayob, M.; Imran, A.; Ali, M.; Abidin, S.; Ahmad, S.; Faizal, M.; Akhbar, A.; et al. Application of Artificial Intelligence in Marine Corrosion Prediction and Detection. J. Mar. Sci. Eng. 2023, 11, 256. [Google Scholar] [CrossRef]
- Kreuzer, T.; Papapetrou, P.; Zdravkovic, J. Artificial intelligence in digital twins: A systematic literature review. Data Knowl. Eng. 2024, 151, 102304. [Google Scholar] [CrossRef]
- Charles, N. Using Digital Twins and AI for Smarter Engineering. Quest Global. 2024. Available online: https://aviationweek.com/aerospace/using-digital-twins-ai-smarter-engineering (accessed on 27 February 2025).
- Tang, X.; Heng, J.; Kaewunruen, S.; Dai, K.; Baniotopoulos, C. Artificial Intelligence-Powered Digital Twins for Sustainable and Resilient Engineering Structures. Bauingenieur 2024, 99, 270–276. [Google Scholar] [CrossRef]
- Ghafari, R. Integrating Smart Polymers, Digital Twins, and AI for Corrosion Mitigation and Structural Health Monitoring in Large-Scale Infrastructure: A Case Study on the Golden Gate Bridge Rasoul Ghafari. In Proceedings of the International Conference on Urban Planning, Architecture, Civil Engineering and Environment, Wolfsburg, Germany, 6 March 2025. [Google Scholar]
Disclaimer/Publisher’s Note: The statements, opinions and data contained in all publications are solely those of the individual author(s) and contributor(s) and not of MDPI and/or the editor(s). MDPI and/or the editor(s) disclaim responsibility for any injury to people or property resulting from any ideas, methods, instructions or products referred to in the content. |
© 2025 by the authors. Licensee MDPI, Basel, Switzerland. This article is an open access article distributed under the terms and conditions of the Creative Commons Attribution (CC BY) license (https://creativecommons.org/licenses/by/4.0/).