Abstract
Li-ion battery recycling is growing with better tech and eco-awareness. Explosions are possible during battery recycling due to their residual voltage. Proper battery discharge is vital to successful recycling. The goal of this study was to investigate a new method for discharging cylindrical batteries, utilizing a saltwater solution and copper conductors and analyzing the impact of both direct and indirect contact between the copper and the battery. A key variable impacting the discharge process was inconsistent spacing between the battery and the copper conductor. In the gap, the saltwater, functioning as an electrolyte solution, created an electrical short circuit, thus causing faster discharge. Because the battery was not in contact with the copper conductor during the discharge process, corrosion of the battery cap and valve occurred, leading to the battery’s anode and cathode elements dissolving into the solution. However, a near-total voltage drop of 99% was observed in the battery, indicating that it was almost completely discharged. Upon making contact with the copper strip during its discharge cycle, the battery exhibited no signs of corrosion. This report details the battery discharge process, encompassing an analysis of the electrochemical reaction, schematic diagrams, and a chemical analysis of the discharge precipitate.
1. Introduction
Due to the recent development of and increasing demand for electrical products, especially electric vehicles, the application of lithium-ion batteries has recently increased significantly. The design of lithium batteries incorporates a wide range of high-capacity options, with the specific capacity influenced by the choice of cathode metals, as evidenced in the literature [1,2,3,4]. Among the many types of cylindrical batteries in use today, lithium iron phosphate (LFP), lithium cobalt oxide (LCO), lithium manganese oxide (LMO), nickel manganese cobalt oxide (NMC), and nickel cobalt aluminum oxide (NCA) are prevalent in a wide array of applications, as evidenced by the extensive research documented in references [5,6,7,8]. Battery manufacturers are increasingly concerned about the sourcing of raw materials for their products and view used batteries not as waste but as a valuable resource ripe with potential for reuse and recycling. Furthermore, a considerable body of research has focused on the utilization of waste batteries as a valuable source material for battery production, encompassing the study of diverse recycling techniques. The discharge step in the recycling process is critically important for safety reasons, as failure to properly discharge batteries before recycling them creates a significant risk of short-circuiting between the anode and cathode, which could lead to dangerous consequences [9,10,11]. Due to short-circuiting between the anode and the cathode, the battery’s stored chemical energy is released, thus heating the anode and cathode elements; their interaction with oxygen presents a significant risk of smoke generation, burning, and potentially a powerful explosion, as evidenced by studies [12,13]. Among the various techniques employed for the safe disposal of batteries before the crushing stage, freezing and electrolytic discharge stand out as the most prevalent and reliable methods, ensuring that the batteries are appropriately prepared for subsequent processing. A process called physical discharge is used in the discharge of a battery; this method enables the removal of electrical energy from the battery’s individual cells. Because this process is lengthy and complex, it is not widely adopted by most people; however, it has several potential benefits. Cryogenic treatment diminishes the battery voltage to a secure level. By employing a crusher machine and an inert gas environment, either a vacuum, argon, or carbon dioxide, the risk of battery explosion during the crushing process is significantly reduced [14,15,16]. Because freezing methods necessitate specialized, and often expensive, freezing equipment and the quick-freezing method, while effective, requires the use of expensive liquid nitrogen, this process ultimately results in high overall processing costs. Among the methods suggested for disposing of large quantities of batteries, submersion in an electrolyte solution is one possibility. This method relies on the combined effect of short-circuiting and electrochemical-reaction-induced electrolysis of the electrolyte solution to completely deplete the battery’s charge. Some studies (Zhang et al. [17], Xiao et al. [18], Liu et al. [19], and Xu et al. [20]) have directly compared the voltage fluctuations and corrosion properties of spent LIBs by either submerging them directly or connecting their poles to an external platinum wire within salt solutions such as NaCl, Na2SO4, FeSO4, and ZnSO4 to investigate the effects of different experimental setups. Severi [21] and Mohammad [22] independently performed LIB discharge experiments using salt solutions of NaCl, Na2S, and MgSO4 at concentrations ranging from 5 to 30 wt.%, with their findings consistently demonstrating the superior effectiveness of the NaCl salt solution. The results from the battery discharge experiments showed that using a 20 wt.% NaCl salt solution led to the quickest decrease in the battery’s voltage observed, according to the reports. The experimental findings of Lin et al. [9], Hao et al. [14], and Xiao et al. [18] have demonstrated that when a battery is directly immersed in a salt solution for discharge, the steel cap and the aluminum valve of the battery undergo corrosion and dissolution, resulting in contamination of the solution with the battery’s anode and cathode materials. As a result, a different approach has been taken by other researchers that has focused on using external discharge tracks for LIBs by immersing a conductor into a salt solution; however, this approach is not scalable for mass production. Therefore, the objective of this work was to enhance the electrical conductivity, thereby accelerating the discharge rate of cylindrical batteries, by employing a copper conductor to create an electrical short circuit between the battery and the copper conductor, which was achieved using a conductive solution. According to studies conducted by Severi et al. [21] and Mohammad et al. [22], the 20 wt.% NaCl solution was utilized in this experiment, as reported in their studies. A short circuit within the electrolyte medium can be created through the simple process of immersing the discharging battery into the solution and introducing a copper conductor. Copper’s high electrical conductivity, combined with its relative abundance, justified its selection. In order to avoid direct contact and potential short-circuiting, the copper conductor should be positioned a short distance away from the battery. The size of the gap played a significant role and had a considerable influence on the rate at which the discharge occurred.
2. Materials and Methods
2.1. The Experimental Materials
In this research, the batteries used were cylindrical lithium-ion batteries of the NCA type, sourced from Samsung, Seoul, Korea, with a nominal voltage of 3.78 V. With a reported nominal capacity of 3950 mAh and a minimum capacity of 2850 mAh, the NCA battery operates at a nominal voltage of 3.78 V. The 32-volt battery set was carefully unpacked, and then each battery from the package was individually taken apart. The process of discharging the batteries involved submerging them completely in saltwater, while they still retained their full 3.78 V voltage. For the saltwater, 100% pure sea salt from SAJO LLC in South Korea was used to ensure the highest quality and purity of the solution. About 93–94.5% of the total composition of sea salt is NaCl. In the process of making saltwater by adding sea salt to 400 mL of distilled water, the rate at which the salt dissolved was slower than expected, so we used a stirrer to make sure that all of the salt dissolved completely into the water. Employing a digital pH–200 pH meter manufactured by HM Digital, Inc, Seoul, Korea, a test was conducted to determine the pH level of the saltwater solution. When the solution contained 20 wt.% salt, the pH is was revealed to be 10.49 upon measurement. For this experiment, solutions were prepared with different concentrations of salt, and their pH levels were then compared and are shown in Table 1, demonstrating the correlation between the solution’s concentration and its resulting pH. In this study, a 200 mm long, 20 mm wide, and 0.5 mm thick copper strip was utilized as the electrical conductor. The purity of the copper strip was exceptionally high, reaching 99.99% and originating from cathode copper.

Table 1.
Concentration and pH level of saltwater.
2.2. The Experimental Procedures
The experiment involved placing a copper strip conductor in two different positions to speed up the battery’s discharge rate in the saltwater; the battery electrode and the end of the copper strip were separated by a measured gap. Figure 1 describes the battery’s discharge process under two distinct configurations of the copper strip; in the first, a gap is present between the strip and both the positive and negative battery electrodes, preventing electrical contact. Discharge testing was undertaken at room temperature. The distance separating the battery’s electrodes and the end of the copper strip significantly influences the likelihood of a short circuit occurring, thereby affecting the overall functionality and safety of the electrical system. In order to measure the discharge, tests were carried out using three different gaps; 2 mm, 4 mm, and 6 mm were used for these tests. Measurements of the battery voltage were made hourly during the initial five-hour period, followed by another five-hour period of hourly measurements commencing after the first five-hour period had concluded. As shown in Figure 1a, the passage of an electric current through the electrolyte solution, originating at the positive electrode and terminating at the negative electrode of the battery, completes the electrical circuit, but a short circuit concurrently develops via the copper strip because the electric current follows the path of least resistance. The energy consumption is exacerbated by the fact that the copper strip conductor generates heat, and this heat is then transferred to the electrolyte, leading to substantial energy losses. Electrochemical reactions can take place between the copper conductor and the positive electrode material in the battery during the discharge process due to the potential difference between the metals used in the electrodes. At the negative electrode, saltwater undergoes an electrochemical process yielding hydrogen and chlorine gases. Furthermore, the corrosion of copper is a potential issue, and the formation of electrolytic cells during the process should also be considered, as this can significantly impact the overall outcome. Figure 1b shows the battery’s positive electrode located at the end of the copper strip; gaps of varying sizes (2, 4, or 6 mm) were present between the negative electrode and the other end of the copper strip. The voltage of the battery underwent hourly measurements to monitor its performance and ensure accurate data collection. Because the copper strip is positioned in contact with the battery, it acts as an electrical conductor, causing an electrical short circuit to occur through the electrolyte solution that is found within the space separating the negative electrode and the end of the copper strip itself. As shown in the illustrations above, physical and electrochemical processes are possible; however, it is more likely for copper corrosion to occur at a more intensive rate.
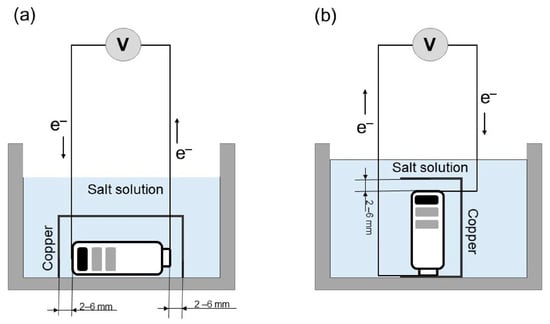
Figure 1.
A schematic diagram of the process of electrochemical discharge with a copper strip conductor (a) no contact and (b) contacted with battery.
2.3. Analysis Methods
Using a UT201 clamp multimeter, the technician carefully measured the battery voltages. When measuring a low direct current voltage, one must properly connect the red cable to the positive (+) input jack and the black cable to the common negative (–) input jack of the multimeter to obtain an accurate reading. In the red test, the positive electrode of the battery should be tested for five to seven seconds, while the negative electrode should be tested using the black test for a similar duration. Measurements of the battery’s voltage were made every hour for the first five hours and then continued hourly for an additional five hours as the discharge process proceeded. Following the completion of the discharge experiment, the precipitate that formed in the saltwater solution underwent filtration using a vacuum pump, followed by a 24 h drying period at a temperature of 100 °C, to prepare the sample for a subsequent analysis using X-ray fluorescence spectrometry (XRF) and X-ray diffraction (XRD). Utilizing a Shimadzu XRF-1700 X-ray fluorescence spectrometer, an XRF analysis was conducted on the precipitate to determine its chemical composition and to identify the electrochemical products formed during the discharge process. The XRD analysis, performed using a Rigaku UltimaIV model featuring a 3 kW Cu-Kα X-ray tube, was implemented to identify the precise compounds formed as a result of the electrochemical discharge process. The XRD data collection utilized a scan from 10 to 80 degrees, employing a step size of 0.02 degrees and a dwell time of 10 min per step to ensure comprehensive data acquisition.
2.4. Calculating the Discharge Efficiency
The efficiency in how a battery discharges is assessed through a quantitative analysis of the residual voltage percentage and the measured voltage drop. Following Equation (1), the battery’s residual voltage percentage (Et) was determined by calculating the ratio of the residual voltage measured after the discharge test to the initial voltage before the test began. Equation (2) was employed to determine the percentage voltage drop, symbolized by Er.
where Vt is the residual voltage at the final time t, and V0 is the initial voltage.
3. Results
3.1. Battery Discharge with a Copper Strip in Saltwater
3.1.1. No Connection to the Copper Conductor in Battery Discharging
The process of discharging a battery involves three key stages, namely a constant voltage phase, a phase of a significant reduction in voltage (the bulk voltage drop), and finally, a phase of minimal reduction in the voltage (a low voltage drop). Figure 2 shows the relationship between the gap between the battery’s electrodes and the copper conductor and the resulting voltage drop. There are three stages to the drop in the battery discharge, and this is represented graphically using a black dashed line. The graph shows one of the tested battery samples exhibiting corrosion. Many studies, as noted earlier, have shown a clear correlation between the optimal battery discharge and a 20% concentration of the salt solution, thus indicating that this concentration as the most effective for this process. It is important to note that Severi et al. [21] experimentally determined that in salt solutions with concentrations of 5 wt.%, 10 wt.%, and 20 wt.%, complete discharge of the batteries occurred in 9.0, 5.0, and 4.4 h, respectively, which is a significant finding in this field. Severi’s study externally discharged the battery via a Pt conductor, avoiding immersion in the salt solution. Our study’s results were compared to Severi’s experimental outcomes using a 20 wt.% salt solution discharge test.
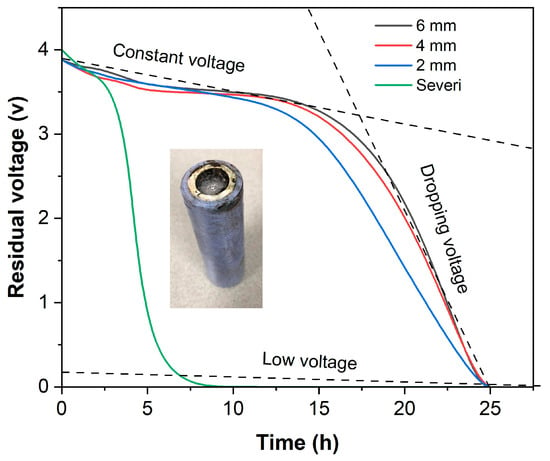
Figure 2.
The effect of varying gaps from a copper conductor on the rate of battery discharge in a 20 wt.% saline solution.
During the discharge process, the battery undergoes a continuous period of a constant voltage, where it steadily provides energy until its energy storage capacity is fully depleted, at which point it can no longer maintain a sufficient voltage level. Following the complete depletion of its stored energy, the battery undergoes a rapid decrease in its remaining voltage, a phenomenon characteristic of the voltage drop stage. As the battery nears the end of its discharge cycle, it enters the low-voltage stage, a final phase where the diminished remaining voltage significantly curtails its ability to facilitate the essential chemical reactions within the electrolyte. Within the initial five-hour period, a consistent voltage drop to approximately 3.5 V was observed across all gaps, accompanied by complete corrosion and disappearance of the steel battery cap; however, after fifteen hours, a continuous decline in the voltage commenced, culminating in voltage drops of 0.05 V at 2 mm, 0.08 V at 4 mm, and 0.12 V at 6 mm after a full 24 h period. When the discharge test was performed at a 2 mm gap, a faster-than-average drop in the voltage was observed; nevertheless, this decline in voltage slowed significantly as the voltage approached and fell below 1 V. Discharge testing at varying gap widths revealed that the copper conductor was a significant contributor to the voltage drop observed within the saltwater solution encompassing the battery.
Figure 3 shows the percentages of the residual voltage and the voltage drop observed after battery discharge, illustrating how these percentages are dependent upon the size of the gap—defined as the space between the end of the copper conductor and the battery’s electrodes, where no contact exists between them. Upon reaching a 2 mm gap, the battery voltage drop peaked at 98.7%; however, this value subsequently declined to 96.9% at a 4 mm gap and then further decreased to 94.8% with a 6 mm gap. In contrast to the 4 mm and 6 mm gaps, the 2 mm gap exhibited a noteworthy reduction in the percentage of residual voltage, specifically a decrease of 1.3%. When the experiment concluded, a maximum residual voltage of 5.16% was recorded, and this was considered to be a relatively insignificant amount.
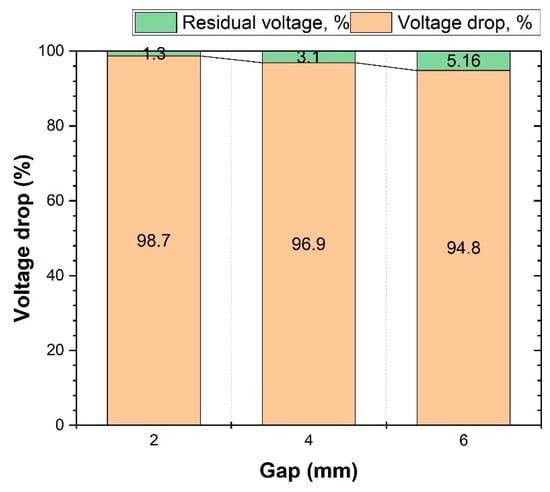
Figure 3.
Efficiency of battery discharge illustrated by percentage of residual voltage and voltage drop in case of no contact with copper conductor.
3.1.2. Connection to the Copper Conductor in Battery Discharging
The correlation between the measured voltage drop and the distance separating the battery and the copper conductor (connected to the battery’s positive electrode) is shown in Figure 4. Over the first five hours of testing, a voltage drop to around 3.5 volts was observed across all gaps, which showed a correlation with the results of the discharge test using no contact with the copper conductor. Upon examination of the discharged battery, it was observed that neither the steel cap nor the aluminum valve showed any signs of corrosion. Following this point in time, there was a continuous decline in voltage; however, the rate of this discharge varied in relation to the specific gap value measured. The results of the discharge test performed at a 2 mm gap showed a pattern consistent with the previous findings: a notably faster drop in voltage than that observed in the other tests, leading to a complete voltage drop to 0.01 V after 8 h of testing. During the 8 h period of discharge across the 4 mm gap, the voltage exhibited a uniform decrease, resulting in a 0.45 V drop. At the 6 mm discharge point, however, a gradual decline in the voltage began after 6 h, and it was not until 8 h later that the voltage finally decreased to 0.5 V. As the graph shows, a smaller gap value demonstrably leads to an improved discharge performance.
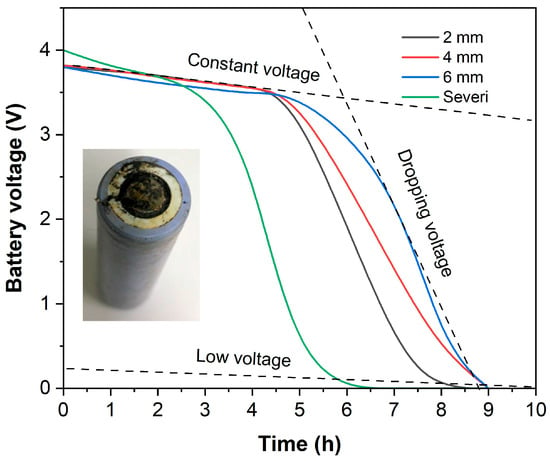
Figure 4.
Efficiency of battery discharge illustrated by percentage of residual voltage and voltage drop in case of contact with copper conductor.
The results shown in Figure 5 confirm that a critical factor influencing the efficiency of the discharge test—where a copper conductor is in contact with the battery—is the magnitude of the gap between the conductor and the battery. When the gap was small, a higher percentage of voltage drop was observed, while a larger gap resulted in a lower percentage of voltage drop. The voltage drop exhibited a slight decrease as the gap increased; specifically, at a 2 mm gap, the voltage drop was 88.9%, while at 4 mm and 6 mm gaps, the voltage drops were 88.2% and 86.8%, respectively. The data revealed an inverse relationship between the distance and the residual voltage percentage; at 2 mm, the residual voltage was lower, at 11.1%, but it increased to 13.1% at a distance of 6 mm. Consequently, the gap value played a significant role in influencing the rate and overall pattern of the battery’s discharge.
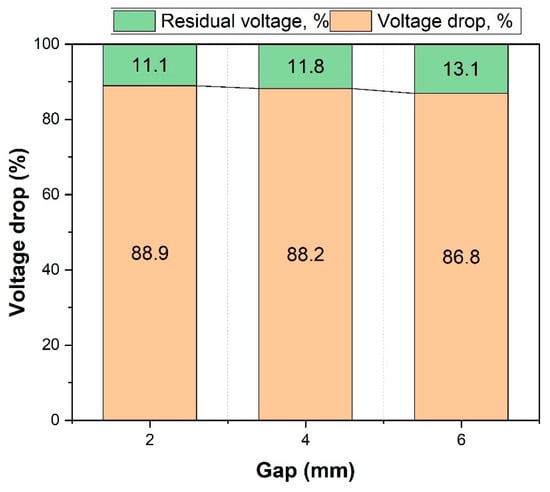
Figure 5.
Efficiency of battery discharge illustrated by percentage of residual voltage and voltage drop in case of contact with a copper conductor.
3.2. Chemical Analysis of the Precipitates
In both test methods, the salt solution was found to be contaminated after the battery discharge test had been conducted. Figure 6 shows an image of the solution that was used in the battery discharge and was subsequently found to be contaminated. As shown in Figure 6a, battery discharge was achieved without contact with a copper conductor; however, this resulted in the battery cap corroding and the internal components dissolving extensively into the salt solution, leading to significant contamination of the solution. Figure 6b illustrates the solution used during the discharge process with the battery’s positive electrode connected to the copper conductor. The reaction produced a surface layer of green copper chloride on the solution; these chlorides then underwent decomposition upon exposure to the air; this decomposition process resulted in the formation of copper hydroxides that came out of the solution, accumulating as a precipitate at the bottom of the beaker.
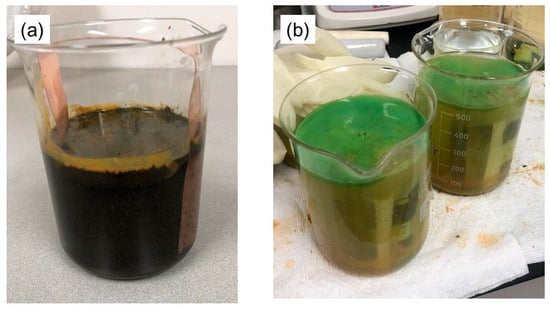
Figure 6.
The used salt solution after the battery discharge experiments when the battery (a) was not in contact with the copper conductor and (b) was in contact with the copper conductor.
The penetration of the solution into the battery, as a result of corrosion of the cap, is shown in Figure 7; this observation was made during a discharge test performed where the copper conductor did not make contact with the battery. Upon separation of the anode and cathode foils from the steel case, a substantial amount of solution penetration was observed, a phenomenon clearly illustrated in Figure 7a. The graphite-based anode material, situated on a copper foil substrate, clearly shows the effects of the solution’s washing process, as shown in Figure 7b.
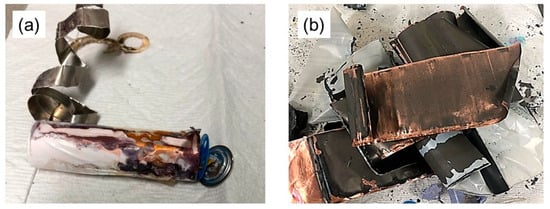
Figure 7.
Battery sample taken apart after conducting discharge tests; (a) anode and cathode foils removed from steel case and (b) washed anode material on copper foil.
Once the discharge test had been finished, for both the experiments with and without contact with the copper conductor, the batteries and the copper conductors were extracted from the solution, after which step the solution was filtered. After filtering, the precipitate was placed in a dryer to dry for 3 h at 100 °C before undergoing XRF and XRD analyses to ascertain its chemical composition. Precipitates formed in the discharge tests without contact with copper and with contact with the copper conductor, as shown in Table 2. In the precipitate without contact, the components include iron oxide (Fe2O3), aluminum oxide (Al2O3), and sodium oxide (Na2O), along with chlorine (Cl). Relatively small amounts of several elements are present, specifically copper oxide (CuO), nickel oxide (NiO), diphosphorus pentoxide (P2O5), and sulfur (S). The chlorine concentration of about 23 wt.% suggests the potential presence of FeCl3 and NaCl within the precipitate. The small amount of CuO, only 1.69 wt.%, indicates that the copper conductor remained free from corrosion throughout the discharge process. With approximately 21 wt.% Al2O3 and 31 wt.% Fe2O3 present in the precipitate, it is evident that the battery cap and the valve underwent corrosion. The precipitate analysis revealed the presence of phosphorus, a possible indication that some of the battery’s lithium hexafluorophosphate (LiPF6) electrolyte had dissolved into the surrounding solution. However, the analysis of the precipitate from the contact with the copper revealed a composition of approximately 82 wt.% copper oxide and 11 wt.% chlorine, suggesting that the copper conductor underwent substantial corrosion during the discharge process.

Table 2.
The chemical composition of the precipitates determined using the XRF analysis.
Utilizing X-ray diffraction (XRD), a mineralogical analysis was performed to identify the compositional makeup of the precipitates designated in both the contact and non-contact experiments, as shown in Figure 8. The analysis of the precipitate from the non-contact (Figure 8a) revealed the presence of NaCl and FeCl3; however, NaCl was determined to be the main component of the precipitate. Due to their low concentration, the other compounds were not detectable using the methods employed. In contrast, a higher concentration of copper oxychloride (Cu2Cl(OH)3) and cuprous oxide (Cu2O) was observed in the precipitate from the sample that had contact with the copper, as shown in Figure 8b. A thorough comparison of the XRD and XRF analyses revealed complete consistency between the results; the data obtained through both methods aligned perfectly, confirming the accuracy of both sets of findings.
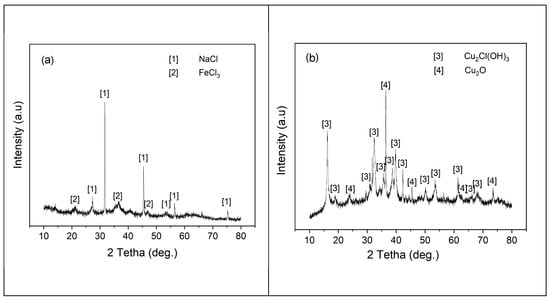
Figure 8.
XRD patterns of precipitates during (a) no contact of the battery with the copper conductor and (b) contact with the copper conductor.
4. Discussion
An Eh–pH diagram is a visual tool that simplifies our understanding of water electrolysis by representing the thermodynamically stable region where water decomposes. Figure 9 shows the relationship between the electrochemical potential scales (Eh) and pH levels, clearly showing a negative correlation: as the pH level increases during water electrolysis, the Eh value exhibits a corresponding decrease. As is clearly shown in the diagram, a gray dashed line is used to represent the process of water dissociation. The dissociation process, quite interestingly, begins at remarkably low voltages; in fact, this process is initiated at voltages below the 1.0 V threshold. Utilizing an Eh–pH diagram, which details the oxidation states within the Cu–Na–Cl systems, allows for a comprehensive explanation of the battery discharge process in a saltwater environment at room temperature, whether using the copper conductor or not. The diagram’s composition includes a variety of different areas, where each area visually represents a species that is locally dominant. When a battery is discharged using saltwater and a copper conductor, the oxidation states exhibited due to the copper within the battery are dependent upon the pH level of the solution and can therefore vary depending on this factor. As the transition from Cu2+ to Cu(OH)2→Cu2O proceeds in saltwater at a pH of 10.49, the electrochemical potential decreases, signifying a change in the oxidation state of the copper. The decomposition of NaCl generates sodium ions (Na+) and gaseous chlorine (Cl(g)), and this process, occurring at the same time as a decrease in the solution’s pH, facilitates the chlorination of the copper, represented by the formation of CuCl2 from Cu2+ and Cl−. The processes involved in both copper’s corrosion and chlorination can be readily explained by consulting and referencing the Eh–pH diagram specifically developed for the Cu–Na–Cl system, thereby providing a clear understanding of the mechanisms involved.
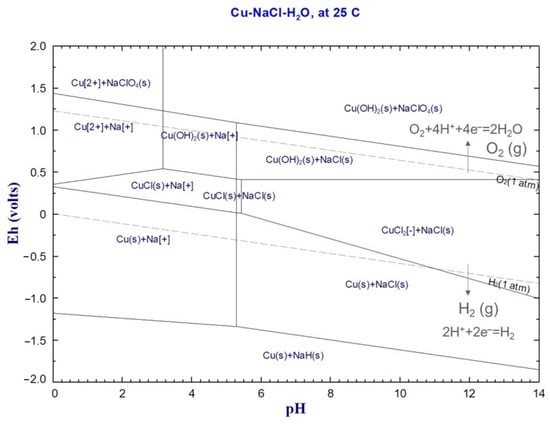
Figure 9.
An Eh–pH diagram for a Cu-Na-Cl system at 25 °C, by Factsage 8.2.
The findings of several studies [23,24,25,26] collectively point to the presence of an electrolyte circuit, within which electrochemical reactions take place, during the process of discharging a battery immersed in saltwater. Research studies have shown a direct correlation between the observed voltage drop in the battery and the process of water electrolysis, which produces hydrogen gas; this gas is visibly apparent as bubbles forming on the negative electrode, as detailed in Equations (3)–(5). The electrochemical reactions at the anode and the cathode, as illustrated, show that water electrolysis, which is the process of water dissociation, is achieved by applying a voltage exceeding 1.23 V.
Anode:
2H2O − 4e− ↔ O2(g) + 4H+ E° = 1.23 V
Cathode:
2H+ + 2e− ↔ H2(g) E° = 0 V
Total reaction:
2H2O(l) ↔ 2H2(g) + O2(g) E° = −1.23 V
During discharge, not only did the water undergo a splitting reaction but the metals also corroded and the salt decomposed. During the electrochemical reaction, there was interaction between several metals: iron and nickel originating from the battery cap, aluminum from the battery’s valve, and copper from the copper conductor. As the salt decomposed, a chemical reaction ensued between the copper and chlorine, yielding copper chlorides, which were seen floating atop the liquid. As depicted in Equations (6) and (7), the metals, which were oxidized by the oxygen produced during the water splitting process, precipitated and settled at the bottom of the beaker. As shown below, reactions (8) through (13) depict the oxidation–reduction reactions involving copper species that occur at the anode and the cathode.
Chemical reaction
Me2+ + nOH− →Me(OH)n
Me + Cl2 = MeCl2
Anodic half-reaction
Cu − 2e− ↔ Cu2+ E° = 0.34 V
2Cl− − 2e− ↔ Cl2(g) E° = −1.35 V
Na − e− ↔ Na+ E° = −2.71 V
Cathodic half-reaction
2H2O + O2 + 4e− ↔ 4OH− E° = 0.82 V
Cu + 2e− ↔ Cu E° = 0.34 V
Men+ + 2H2O − ne− ↔ MeOn + 2H+
Because the copper strip carries the current from the battery to the electrolyte, thereby creating a short circuit, the battery will discharge rapidly. The standard reduction potential of copper (Cu2+ = 0.34), during the battery’s discharge process, leads to corrosion of both the nickel-plated steel cap and the aluminum valve situated on the positive electrode. Because the battery was not in contact with the copper conductor, significant corrosion affected both the steel cap and the aluminum valve, causing both metals to subsequently dissolve into the solution. Upon reaction with oxygen and chlorine, metals including copper, iron, nickel, and aluminum produced oxide and chloride precipitate products that settled at the bottom of the beaker. At the cathode, the negatively charged electrode, hydrogen reduction takes place, producing hydrogen gas that bubbles away from the saltwater solution. Although this method produced corrosion similar to that seen for other methods involving the immersion of batteries into salt solutions to induce discharge, it was observed to accelerate the rate at which the batteries discharged.
Upon contact between the battery and the copper conductor, a short circuit was generated between the negative electrode and the end of the copper conductor, initiating electrochemical reactions and causing the battery to begin to discharge immediately. Since the battery was directly connected to the copper conductor, preventing any electrochemical reactions from occurring on the positive electrode, there was no corrosion of the stainless-steel cap or the aluminum valve. As the copper conductor conducts current, it loses two electrons, forming Cu2+ ions, which then readily react with the oxygen and chlorine present in the salt solution to produce oxide and chloride precipitates.
5. Conclusions
Complete discharging of a battery eliminates any risk of explosion due to the electrical short circuits that may occur during the processes of disposal and recycling. This study investigated the discharge of a cylindrical NCA battery using saltwater and copper conductors, employing both contact and non-contact methods; these were the methods examined in our work. In the event that the battery did not make contact with the copper conductor during the discharge process, a vigorous corrosive reaction ensued, ultimately affecting the battery’s steel cap and aluminum valve. As a result, the solution caused the dissolution of the battery’s anode and cathode components. A voltage drop of more than 95% resulted in complete discharge of the battery within a 24 h period. Because of the corrosion, this method was not deemed suitable for practical applications. A smaller gap between the battery and the copper conductor resulted in a faster discharge rate and a higher percentage of voltage drop across the connection. No corrosion of the battery cap or valve was detected during battery discharge when it was in contact with a copper conductor. Based on the chemical analysis that was conducted, the resulting precipitate was found to contain a mixture of copper oxide and copper chloride compounds. The voltage of the battery decreased to 0.01 V following an eight-hour period with a 2 mm gap; in contrast, when the gap was increased to 4 mm and 6 mm, the voltage readings rose to 0.45 V and 0.5 V, respectively. The voltage drop reached approximately 90% when a 2 mm gap was used, a result confirming successful discharge. The successful completion of the experiment confirmed that applying a 20 wt.% saltwater solution to the point of contact between the copper conductor and the positive (+) electrode of the battery resulted in a demonstrably effective reduction in voltage. In addition to the above, our research revealed that a copper conductor in common saltwater allows for the safe discharge of cylindrical batteries. Further research into potential industrial applications of copper oxides, derived from the corrosion of copper conductors, could yield substantial economic advantages and contribute to improved financial outcomes.
Author Contributions
B.T.: Data curation; writing—original draft. E.U.: Methodology; investigation; software; validation. J.-P.W.: Project administration; conceptualization; writing—review and editing; funding acquisition. All authors have read and agreed to the published version of the manuscript.
Funding
This research was funded by the Global Joint Research Program funded by Pukyong National University (202411760001).
Data Availability Statement
The original contributions presented in this study are included in the article; further inquiries can be directed to the corresponding author.
Conflicts of Interest
The authors declare no conflicts of interest.
References
- Feixiang, W.; Joachim, M.; Yan, Y. Guidelines and trends for next-generation rechargeable lithium and lithium-ion batteries. Chem. Soc. Rev. 2020, 49, 1569–1614. [Google Scholar] [CrossRef]
- Hadrien, B.; Marion, L.; Nicolas, L. The future of lithium-ion batteries: Exploring expert conceptions, market trends, and price scenarios. Energy Res. Soc. Sci. 2022, 93, 102850. [Google Scholar] [CrossRef]
- Long, Z.; Xin, L.; Bin, L.; Yi, Y.; Ming, Y.; Jiahui, W.; Yujiu, Z. State Estimation Models of Lithium-Ion Batteries for Battery Management System: Status, Challenges, and Future Trends. Batteries 2023, 8, 131. [Google Scholar] [CrossRef]
- Suraj, R.; Rajan, K.; Rabinder, S.B. Current trends, challenges, and prospects in material advances for improving the overall safety of lithium-ion battery pack. J. Chem. Eng. 2023, 463, 142336. [Google Scholar] [CrossRef]
- Micah, S.Z.; Jessika, E.T. Re-examining rates of lithium-ion battery technology improvement and cost decline. J. Chem. Eng. 2021, 14, 1635–1651. [Google Scholar] [CrossRef]
- Hossain, M.S.; Hannan, M.A.; Aini, H.; Afida, A.; Mohamad, H.M.; Tahia, F.K.; Dickson, N.T. Data-driven state of charge estimation of lithium-ion batteries: Algorithms, implementation factors, limitations and future trends. J. Clean. Prod. 2020, 277, 124110. [Google Scholar] [CrossRef]
- Tang, F.; Jiang, T.; Tan, Y.; Xu, X.; Zhou, Y. Preparation and electrochemical performance of silicon@graphene aerogel composites for lithium-ion batteries. J. Alloys Compd. 2021, 854, 157135. [Google Scholar] [CrossRef]
- Patil, R.; Phadatare, M.; Blomquist, N.; Örtegren, J.; Hummelgård, M.; Meshram, J.; Dubal, D.; Olin, H. Highly Stable Cycling of Silicon-Nanographite Aerogel-Based Anode for Lithium-Ion Batteries. ACS Omega 2021, 6, 6600–6606. [Google Scholar] [CrossRef]
- Lin, P.Y.; Qi, Z.; Ting, Q.; Jia, L. An environmentally friendly discharge technology to pretreat spent lithium-ion batteries. J. Clean. Prod. 2020, 245, 118820. [Google Scholar] [CrossRef]
- Lutz, W.; Hans-Georg, J.; Thomas, L.; Urs, A.P. Crushing of large Li-ion battery cells. Waste Manag. 2019, 85, 317–326. [Google Scholar] [CrossRef]
- Zheng, F.; Qiangling, D.; Qingkui, P.; Zesen, W.; Huiqi, C.; Jinhua, S.; Qingsong, W. Comparative study of chemical discharge strategy to pretreat spent lithium-ion batteries for safe, efficient, and environmentally friendly recycling. J. Clean. Prod. 2022, 359, 132116. [Google Scholar] [CrossRef]
- Zalosh, R.; Gandhi, P.; Barowy, A. Lithium-ion energy storage battery explosion incidents. J. Loss Prev. Process Ind. 2021, 72, 104560. [Google Scholar] [CrossRef]
- Sin-Woo, K.; Soo-Gyeong, P.; Eui-Ju, L. Assessment of the explosion risk during lithium-ion battery fires. J. Loss Prev. Process Ind. 2022, 80, 104851. [Google Scholar] [CrossRef]
- Hao, W.; Guorui, Q.; Jiaqi, Y.; Bo, L.; Yonggang, W. An effective and cleaner discharge method of spent lithium batteries. J. Energy Storage 2022, 54, 105383. [Google Scholar] [CrossRef]
- Kim, S.; Bang, J.; Yoo, J.; Shin, Y.; Bae, J.; Jeong, J. A comprehensive review on the pretreatment process in lithium-ion battery recycling. J. Clean. Prod. 2021, 294, 101016. [Google Scholar] [CrossRef]
- Rouhi, H.; Karola, E.; Serna-Guerrero, R.; Santasalo-Aarnio, A. Voltage behavior in lithium-ion batteries after electrochemical discharge and its implications on the safety of recycling processes. J. Energy Storage 2021, 35, 102323. [Google Scholar] [CrossRef]
- Zhang, T.; He, Y.; Ge, L.; Fu, R.; Zhang, X.; Huang, Y. Characteristics of wet and dry crushing methods in the recycling process of spent lithium-ion batteries. J. Power Sources 2013, 240, 766–771. [Google Scholar] [CrossRef]
- Xiao, J.; Guo, J.; Zhan, L.; Xu, Z. A cleaner approach to the discharge process of spent lithium ion batteries in different solutions. J. Clean. Prod. 2020, 255, 120064. [Google Scholar] [CrossRef]
- Liu, Y.; Mu, D.; Li, R.; Ma, Q.; Zheng, R.; Dai, C. Purification and characterization of reclaimed electrolytes from spent lithium-ion batteries. J. Phys. Chem. C 2017, 121, 4181–4187. [Google Scholar] [CrossRef]
- Xu, X.; Yu, C.; Tang, S.; Sun, X.; Si, X.; Wu, L. Remaining useful life prediction of lithium-ion batteries based on wiener processes with considering the relaxation effect. Energies 2019, 12, 1685. [Google Scholar] [CrossRef]
- Severi, O.; Mari, L.; Annukka, S.A.; Rodrigo, S.G. Challenging the concept of electrochemical discharge using salt solutions for lithium-ion batteries recycling. Waste Manag. 2018, 76, 242–249. [Google Scholar] [CrossRef]
- Mohammad, M.T.; Milad, J.; Alireza, B. Discharge of lithium-ion batteries in salt solutions for safer storage, transport, and resource recovery. Waste Manag. Res. 2021, 40, 402–409. [Google Scholar] [CrossRef]
- Zhao, Y.; Kang, Y.; Fan, M.; Li, T.; Wozny, J.; Zhou, Y.; Wang, X.; Chueh, Y.-L.; Liang, Z.; Zhou, G. Precise separation of spent lithium-ion cells in water without discharging for recycling. J. Energy Storage 2022, 45, 1092–11099. [Google Scholar] [CrossRef]
- Brian, M.; Qinghua, T.; Xueyi, G.; Kinnor, C.; Dawei, Y. Pyrometallurgical options for recycling spent lithium-ion batteries: A comprehensive review. J. Power Sources 2019, 22, 229622. [Google Scholar] [CrossRef]
- Xu, C.; Ouyang, M.; Lu, L.; Liu, X.; Wang, S.; Feng, X. Preliminary study on the mechanism of lithium ion battery pack under water immersion. ECS Trans. 2017, 77, 209–2016. [Google Scholar] [CrossRef]
- Tennakone, K. Hydrogen from brine electrolysis: A new approach. Int. J. Hydrogen Energy 1989, 14, 681–682. [Google Scholar] [CrossRef]
Disclaimer/Publisher’s Note: The statements, opinions and data contained in all publications are solely those of the individual author(s) and contributor(s) and not of MDPI and/or the editor(s). MDPI and/or the editor(s) disclaim responsibility for any injury to people or property resulting from any ideas, methods, instructions or products referred to in the content. |
© 2025 by the authors. Licensee MDPI, Basel, Switzerland. This article is an open access article distributed under the terms and conditions of the Creative Commons Attribution (CC BY) license (https://creativecommons.org/licenses/by/4.0/).