Article

In Situ Surface-Enhanced Raman Spectroscopy Investigation of the Passive Films That Form on Alloy 600, Alloy 690, Unalloyed Cr and Ni, and Alloys of Ni-Cr and Ni-Cr-Fe in Pressurized Water Nuclear Reactor Primary Water

Department of Materials Science and Engineering, University of California, Berkeley, CA 94720, USA
*
Author to whom correspondence should be addressed.
Current address: Nuclear Materials Divisio, State Power Investment Corporation Research Institute, Beijing 102209, China.
Corros. Mater. Degrad. 2025, 6(2), 16; https://doi.org/10.3390/cmd6020016
Submission received: 9 February 2025 / Revised: 21 April 2025 / Accepted: 29 April 2025 / Published: 6 May 2025

Abstract

:
Passive films that form on Alloy 600 and Alloy 690 during four hours in simulated Primary Water (PW) of Pressurized Water Nuclear Reactors (PWRs) at 320 °C were investigated by in situ surface-enhanced Raman spectroscopy (SERS). Similar tests conducted on unalloyed nickel, unalloyed chromium, and laboratory alloys of Ni-10Cr, Ni-20Cr, Ni-5Cr-8Fe, and Ni-10Cr-8Fe aided in assigning the peaks in the surface-enhanced Raman (SER) spectra of the passive films of Alloy 600 and Alloy 690. SERS indicates an inner layer (IL) of Cr2O3/CrOOH forms on both Alloy 600 and Alloy 690 and that Alloy 690’s IL was more protective against corrosion due to its greater resistance to ion transport. The outer layer (OL) of Alloy 600 consists of NiO and spinels, FeCr2O4—M(Cr,Fe)2O4. The OL of Alloy 690 contains no spinel. A comparison of SER spectra in 320 °C PWR PW to the spectra following cooling down to room temperature and after exposure to air indicates some differences between in situ films and ex situ films.

1. Introduction

Alloy 600 and Alloy 690 are Ni-Cr-Fe alloys that are employed for various structural components of Pressurized Water Nuclear Reactors (PWRs) [1,2]. In that capacity, the alloys are exposed during service to a high-temperature, high-pressure aqueous solution that is used to cool the nuclear fuel and to transport heat from the fuel to a steam generator. The alloys’ resistances/susceptibilities to corrosion, stress corrosion cracking, and radiation build-up in PWRs are dependent to significant degrees on the alloys’ passive films [3,4]. It is no surprise, therefore, that a number of studies have been conducted to identify the passive films formed in high-temperature, high-pressure water and to investigate their properties.
There is not a single, passive film of either Alloy 600 or Alloy 690. Instead, each film’s identity depends on the temperature, pH, aqueous cations, and the time of immersion. Briefly, all films exhibit a duplex structure, but the identities of the inner layer (IL) and outer layer (OL) depend on the conditions of the test. A sampling of results is summarized in Table 1.
The inner layer (IL) is of prime importance regarding resistance to uniform corrosion and stress corrosion cracking [4]. Cr2O3/CrOOH forms the IL in short-time tests conducted in titanium autoclaves (see the first two rows of Table 1) [5,6]. Longer time tests were conducted in stainless steel autoclaves and created ILs of chromium oxide in three out of the six studies listed in Table 1 [8,9,12] and spinels of chromite or mixtures of chromite and ferrite in the other half of the investigations [7,10,11].
It is not clear if the formation of ILs of spinel rather than of chromium oxide is a consequence of the longer duration of the tests or the effect of stainless steel autoclaves and circulation tubing. Corrosion of the stainless steel autoclaves and tubing introduces metal cations (primarily iron and nickel) that adsorb on the oxide surfaces of test samples of Alloy 600, which ultimately influence the composition and/or phase of the IL. Healy and James discuss the adsorption of aqueous cations on oxides [14,15,16] and Sten et al. investigate the adsorption of cations on iron oxides in high-temperature, high-pressure water in nuclear power plants [17].
The OL is also of importance to the performance of Alloy 600. First, the outer layer has been implicated in the process of radiation build-up on the pipes of Alloy 600 that transport heated PWR Primary Water (PW) from the reactor to the steam generator, and cooled water from the steam generator back to the reactor [18]. Second, in a recent study conducted in an all-titanium system, we showed that the OL can influence the corrosion rate of Alloy 600 [6]. Specifically, the addition of 0.1 ppm aqueous zinc ions changed the morphology of the Ni-rich OL from a porous structure of whiskers of NiO to a dense planar film that reduced the corrosion rate by lowering the rate of dissolution of metal cations.
As already mentioned, it is possible that the IL of Alloy 600 might be affected by the presence in the electrolyte of aqueous cations that were introduced by corrosion of the autoclave and tubing. A similar issue appears likely in the case of Alloy 600’s OL. In the results presented in Table 1, the identity of the OL appears dependent on the alloy used for the autoclave and tubing of the high-temperature, high-pressure testing facility as well as the duration of the test. An OL of NiO or Ni(OH)2 forms on Alloy 600 in short-time tests conducted in titanium autoclaves [5,6]. Instead, an iron and nickel-containing spinel forms the OL in tests conducted for longer times with stainless steel autoclaves [7,8,9,10,11,12]. Presumably, corrosion of the autoclave and tubing introduces metal cations into the aqueous solution, which are incorporated into the OL [14,15,16,17].
In summary, earlier investigations indicate two possible effects on the passive film (IL + OL) of Alloy 600. ILs of Cr2O3 and OLs of NiO form during short-time tests conducted in titanium autoclaves and ILs of Cr2O3 or chromite spinel and OLs of either ferrite spinel or spinels with a mix of iron and chromium form in longer time tests conducted in stainless steel autoclaves.
In the present study, we seek to deconvolute the effects of autoclave and test duration on the identity of Alloy 600’s passive film. The present study of the passive films of Alloy 600 and Alloy 690 is also motivated by a recent paper by Scott and Combrade, which reviewed the use of Alloy 600 in Light Water Reactors [4]. The authors state that the “nature of oxide layers is still uncertain”, especially for “Alloy 690 where the presence and the role of Cr2O3 are still not clear”.
Thus, for the present paper, we conducted tests in an all-titanium autoclave/tubing facility (a 316L stainless steel pump pressurizes the water at room temperature). Auger electron spectroscopy indicated no titanium is incorporated in the surface film of Alloy 600 tested in PWR PW at 288 °C in our titanium system [19]. We therefore assume that the passive film formed on Alloy 600 in our titanium facility with simulated PWR PW at 320 °C reflects the inherent behavior of Alloy 600 and is not influenced by metal cations introduced into the electrolyte by corrosion of the autoclave and tubing.
A second feature of the present study is the duration of the tests at 320 °C. We investigate the passive films formed after 4 h of immersion in simulated PWR Primary Water at 320 °C. Earlier results suggest that between one and five hours is a critical time period within which the film changes from an IL of Cr2O3 and an OL of NiO at short times to an IL and OL of spinels at longer times [20]. Our tests will establish whether four hours of immersion represents the end of the short time period of immersion or the beginning of the long time period of immersion.
A third feature of the present study is its technique for investigating passive films. In all of the earlier studies, the passive films of Alloy 600 and Alloy 690 were investigated by various types of electron microscopy, which required that the metal samples be cooled to room temperature, removed from the aqueous solution, dried, and placed inside a vacuum chamber in preparation for their examination. It raises the question as to whether or not in situ surface film is changed when it is cooled to room temperature, removed from the electrolyte, and exposed to air. In the present study, the passive films are investigated in situ by surface-enhanced Raman spectroscopy (SERS) so the films are investigated as they are being formed and in the conditions in which they are employed during service in operating pressurized water nuclear reactors. A brief introduction to SERS is provided in Appendix A.
We also investigate if changes occur to the films when the samples are cooled to room temperature and removed from the aqueous solution. We compare the in situ SERS of the passive films in PWR PW at 320 °C to the SERS after cooling to room temperature and after removal from the electrolyte and exposure to air. No differences in the SER spectra will confirm that investigations by electron microscopy of the passive films are representative of the films in 320 °C PWR PW.
Finally, in the present study, we also investigate by SERS the passive films formed on nickel, chromium, and alloys of Ni-10Cr, Ni-20Cr, Ni-5Cr-8Fe, and Ni-10Cr-8Fe (atomic percents), which helps in assigning the peaks in the SER spectra of the passive films of Alloy 600 and Alloy 690.
In summary, this paper focuses on the identification by SERS of the species that make up the IL and OL of the surface films formed on Alloy 600 and Alloy 690 and the information that SERS provides regarding the nature of the protectiveness of the IL.

2. Experimental Procedure

2.1. Overview

The results presented in the current study are a fraction of a large number of tests in which passive films were investigated in situ in simulated high-temperature, high-pressure PWR PW. In each test, the SER spectrum of the passive film was measured at room temperature, at 50 °C, and then at intervals of 50 °C as the temperature was raised at a rate of 1 °C/min from room temperature to the final value of 320 °C. During the heating up, the sample was cathodically polarized at −1.8V vs. the standard hydrogen electrode (VSHE).
At 320 °C the sample’s potential was stepped from −1.8VSHE to −0.9VSHE. After 10 min at −0.9VSHE, an SER spectrum was measured. Thereafter, the sample’s potential was stepped 50 mV every 10 min to a maximum value of −0.5VSHE. After 10 min at each potential, the SER spectrum was measured. The temperature was then lowered back to room temperature at a rate of 2 °C/minute and the SER spectrum was measured at room temperature and, finally, at room temperature after the sample was removed from the aqueous solution and exposed to air.
Tests were conducted on two to seven samples of each alloy to check for reproducibility.

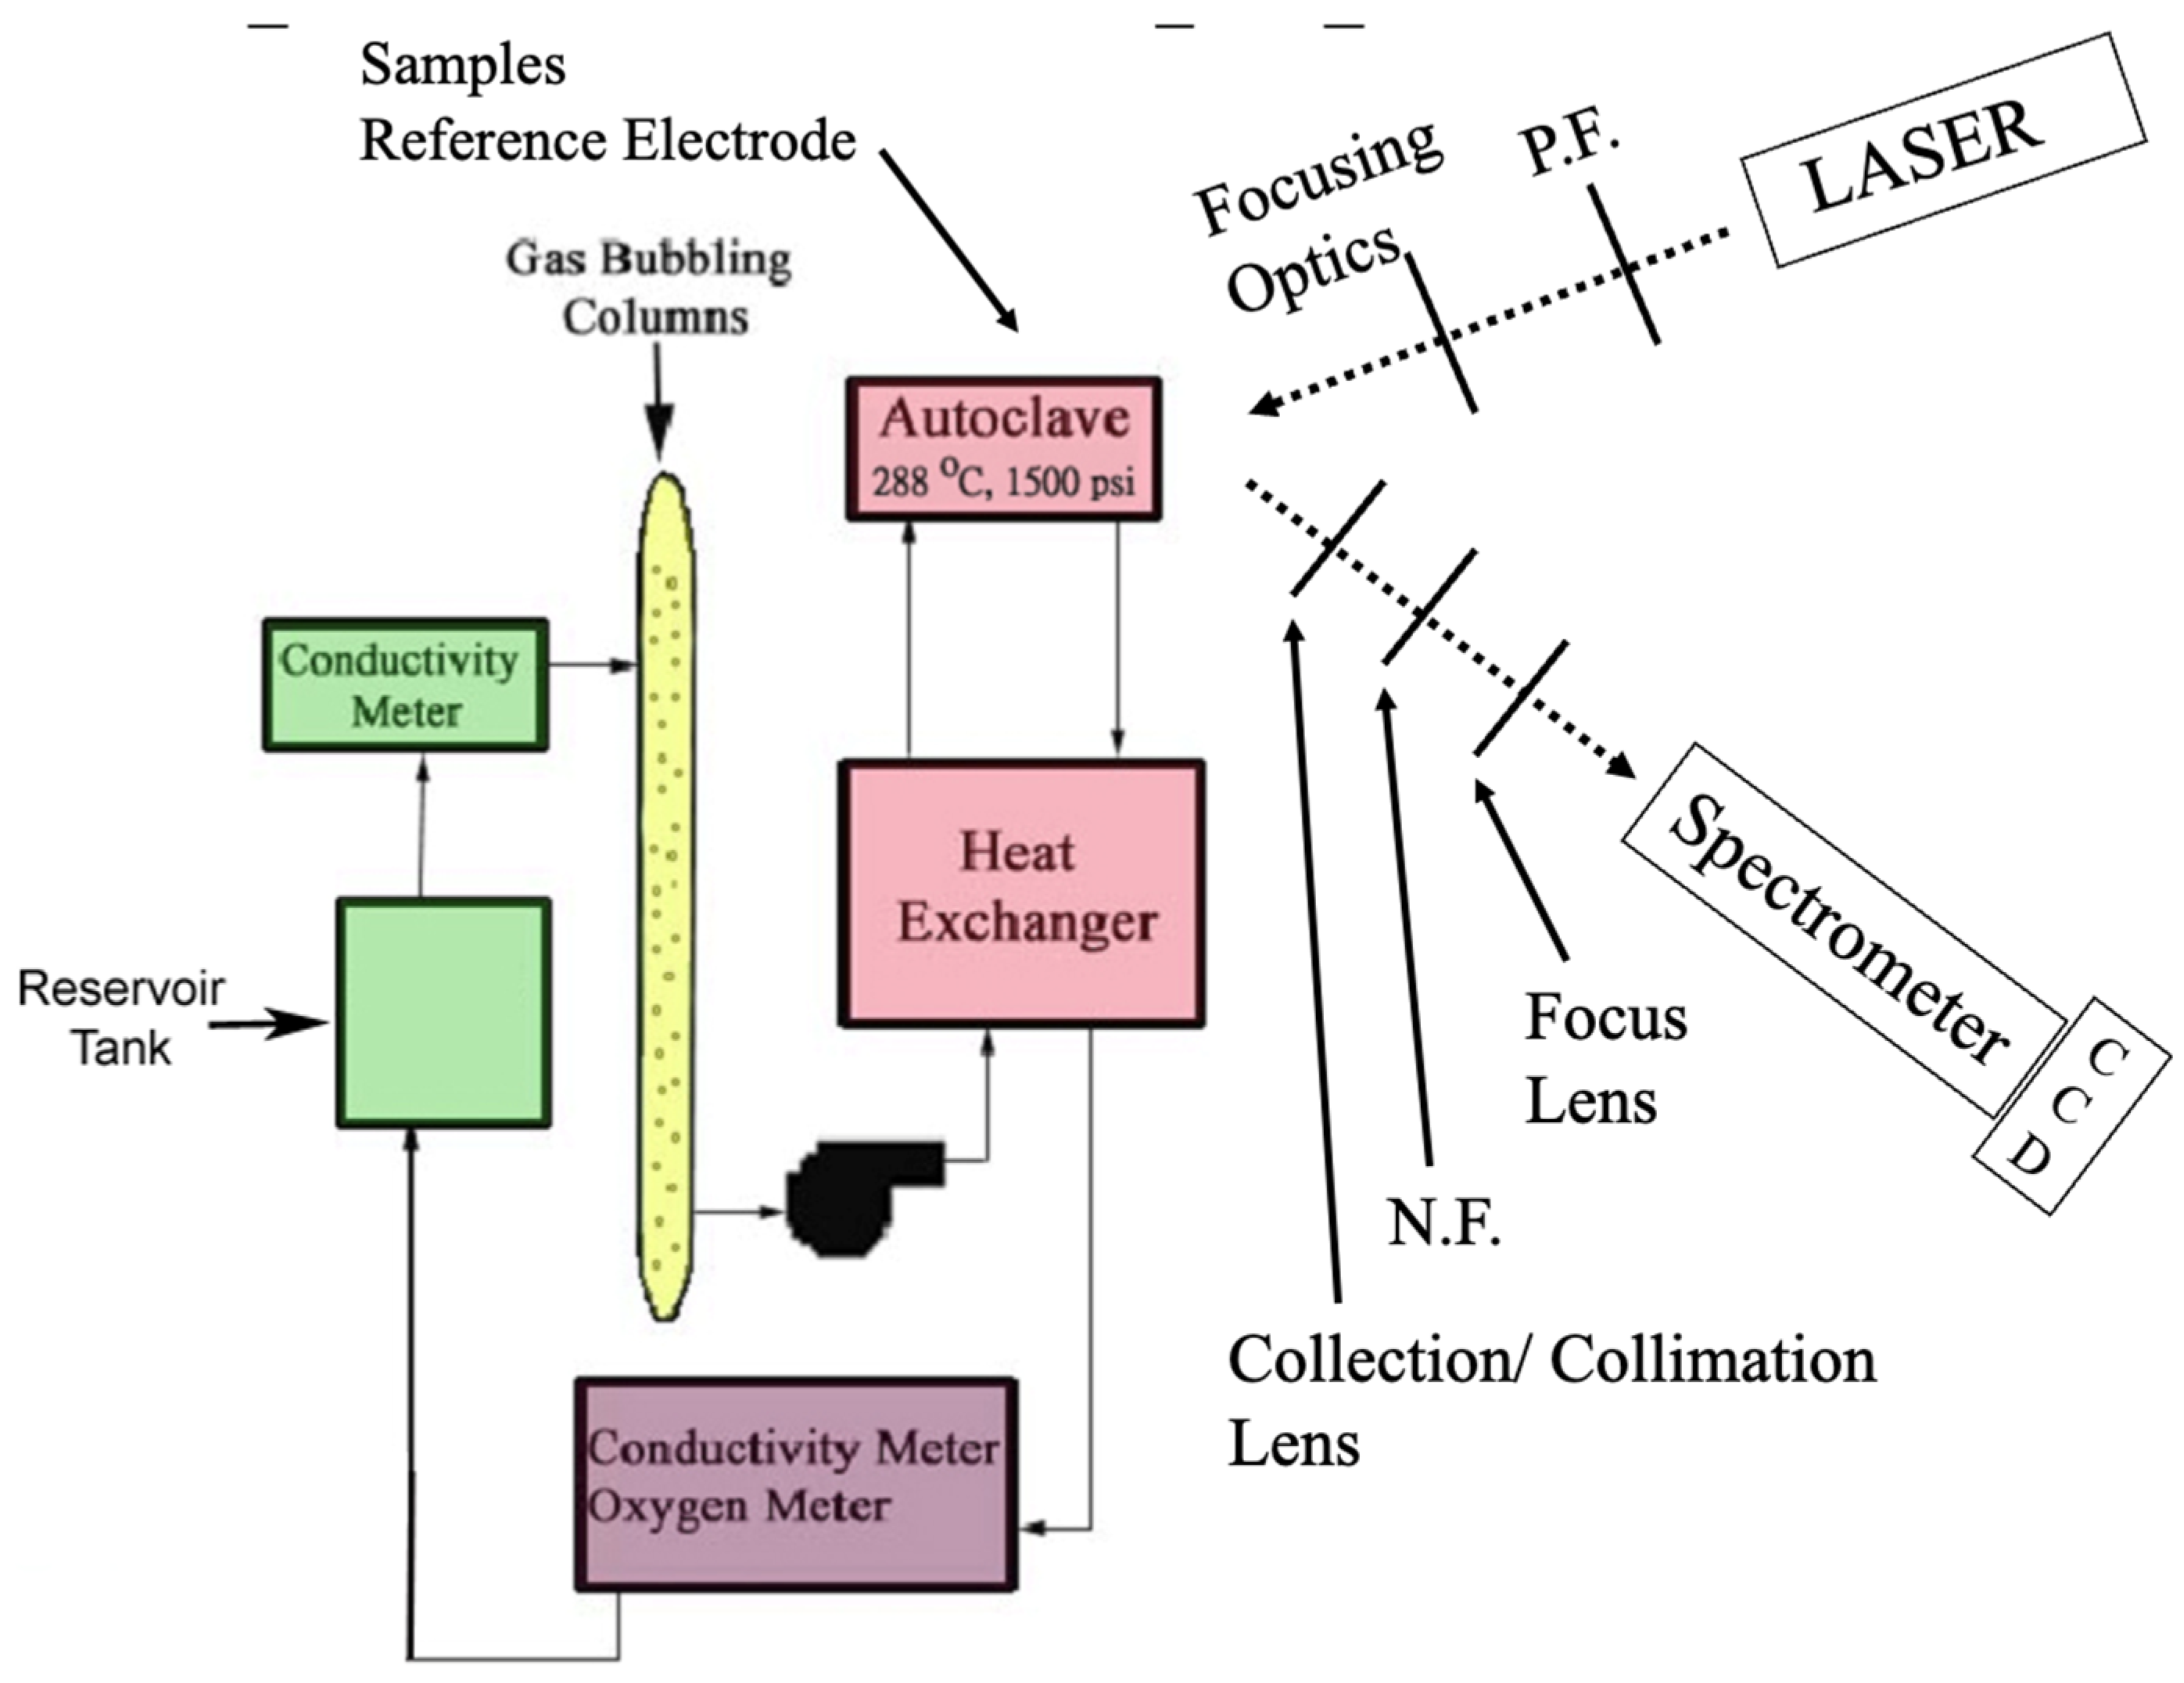
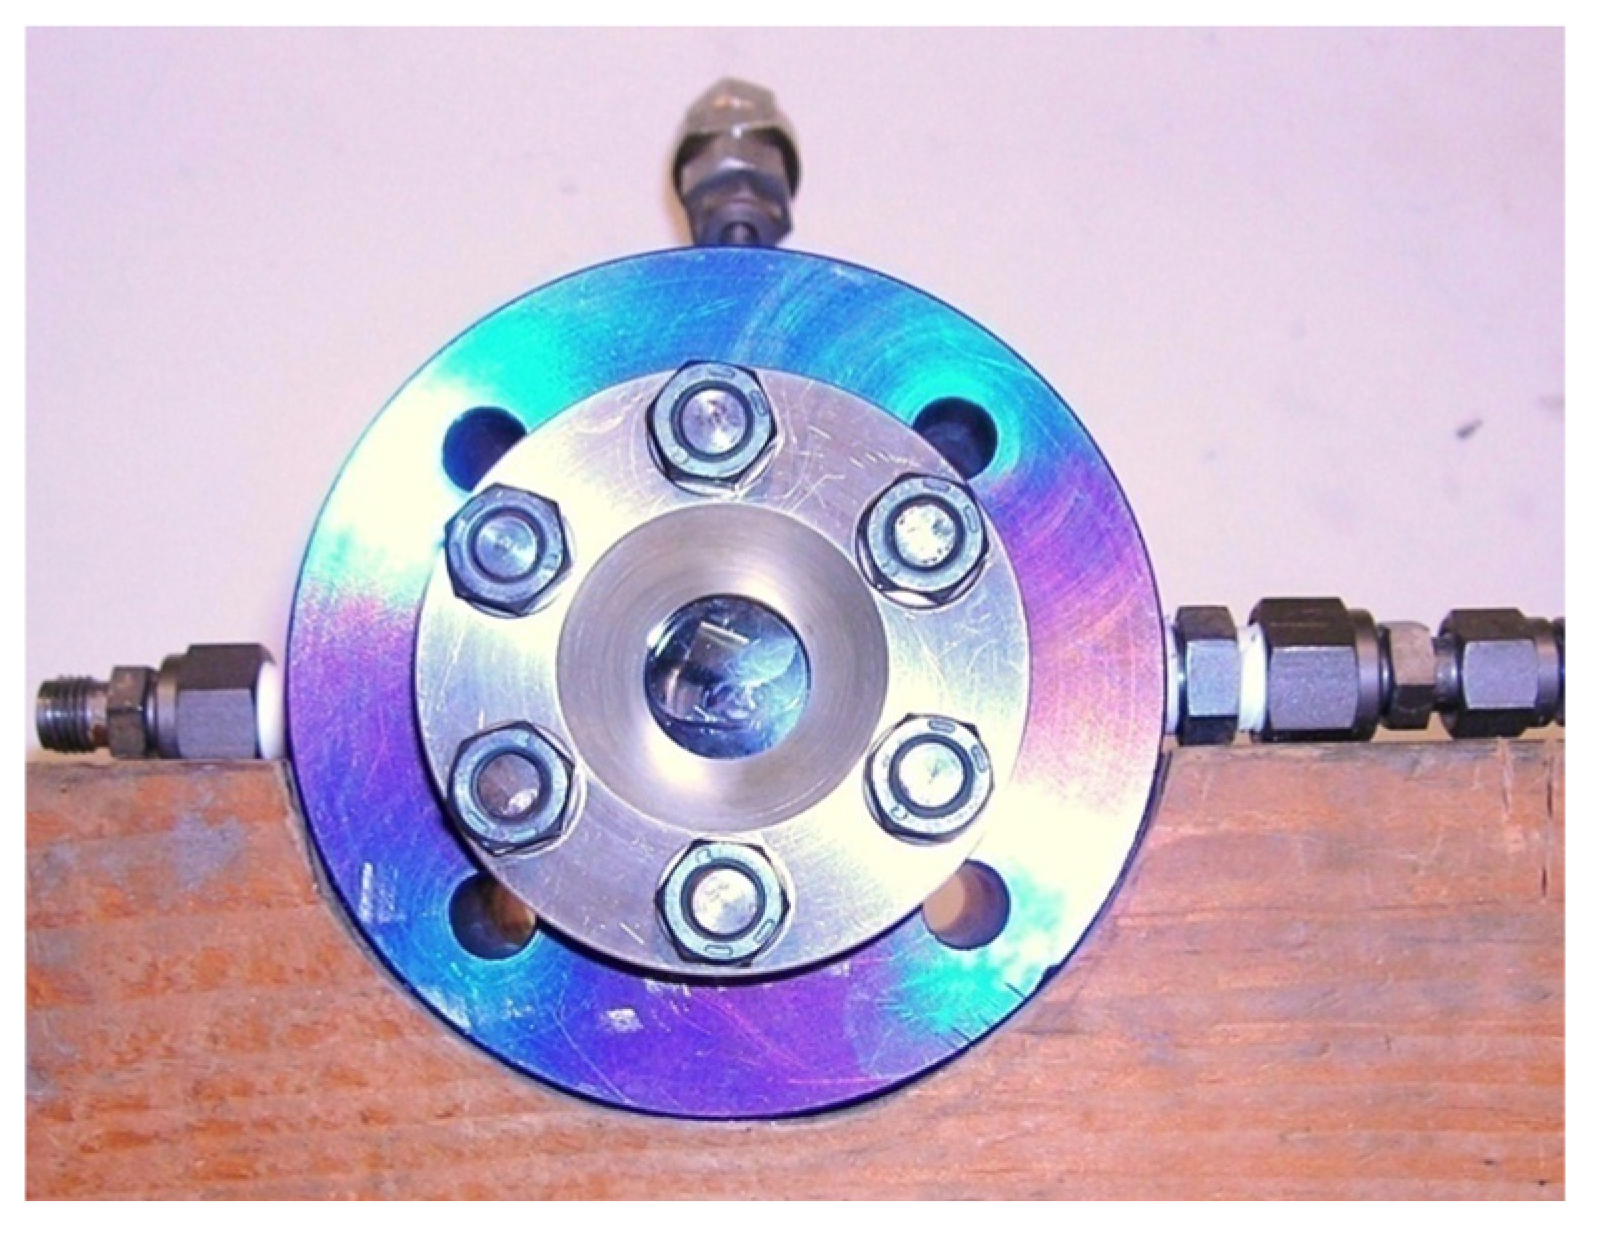
2.2. Details of Experimental Procedure

The passive films that form on Ni, Cr, Ni-10Cr, Ni-20Cr, Ni-5Cr-8Fe, Ni-10Cr-8Fe, Alloy 600, and Alloy 690 in pressurized aqueous solution at 320 °C were investigated by SERS. The unalloyed nickel (99.99%) and chromium (99.7%) were purchased from the Goodfellow Corporation. Alloy 600 and Alloy 690 were commercial heats. Their nominal compositions are listed in Table 2. The other alloys were laboratory heats that were melted, cast and thermomechanically processed at General Electric’s Global Research Center.
Test samples of nickel and chromium were 1.5 mm thick disks cut from rods 6 mm and 5 mm, respectively, in diameter. All other samples were rectangular 6 mm × 5 mm and cut from 1.5 mm thick foil. Each sample was tack welded to a 35 cm long, 0.5 mm diameter wire of Alloy 600. The wire was coated with a Teflon tube and inserted into an alumina tube that was normally used for thermocouple wires. The alumina tube prevented the shorting of the sample’s wire to the autoclave and to the wires for the counter and reference electrodes. The wire electrically connected the sample to a potentiostat, which controlled the sample’s potential. Before and after attaching the wire, each sample was polished with 400, 600, 800, and 1200 grit SiC paper. Each sample was ultrasonically cleaned with Labtone detergent followed by double-deionized water.
Samples were prepared for SERS by electrodepositing gold particles. The electrodeposition was performed by immersing the sample in a one-liter multi-neck glass electrochemical cell containing 0.5 mM AuCl3 (Sigma-Aldrich 334049—99%. Sigma-Aldrich, Inc., St. Louis, MO, USA) and deaerated with UHP nitrogen gas for 24 h prior to electrodeposition. Upon immersion, samples were cathodically polarized at −900 mV vs. SCE (saturated calomel electrode) with an EG&G Model potentiostat equipped with a digital coulometer. The electrodeposition was continued until a specific amount of charge was passed. Theoretically, the optimum size of gold particles is about 50 nm. Ideally, the gold particle is as small as possible with respect to the wavelength of the incident laser radiation (632 nm) but large enough to minimize the effect of scattering electrons by the gold particle’s surface [21]. Generally, the gold particles exhibited a range of size, some as large as approximately 500 nm. Even if gold particles are large they can still provide enhancement if they have nanoscale roughness. It is also the case that much larger enhancements are possible in the gaps between closely situated, electromagnetically interacting gold particles than are obtained from single, isolated particles [22,23]. After gold deposition, samples were rinsed with double-deionized water.
Tests were conducted in two aqueous solutions made with double-deionized water. Both electrolytes contained 1200 ppm B(OH)3. One test electrolyte contained 2 ppm LiOH and the other 0.19 ppm LiOH. The pH of the primary coolant of a PWR is mainly dictated by the solution’s lithium concentration and the pH typically ranges from 7.4 to 6.8 [4]. The pH of our 0.19 ppm Li solution was calculated as 6.2 (EPRI Chem WORKSTM, 1013369, EPRI Primary System pH Calculator, PHC Version 3.1). The higher Li concentration of 2 ppm had a calculated pH of 7.2. For all tests, the solutions were deoxygenated with forming gas (4% H2—96% N2).
A schematic of the experimental facility is presented in Figure 1. The tests were conducted in an all-titanium system. The autoclave was machined from an extrusion of Grade 2 Titanium. The interior volume was 17.6 cc, had a diameter of 20 mm and a length of 60 mm, and was fitted with a 30 mm diameter 10 mm thick window of single crystal alumina (orientation 0001 ± 2°) through which the laser beam was incident on the sample and the SERS radiation was collected. A photograph of the autoclave and sapphire window is presented in Figure 2.
After the samples were inserted into the autoclave, the test electrolyte was pressurized to 12.4 MPa (1800 psi) and circulated by a 316 stainless steel pump for 24 h at a rate of 1.70 L/min (0.45 gal/min) and deoxygenated by forming gas. The deoxygenation was performed by bubbling forming gas into the bottom of a 1.63 m (64 inch) long 40 mm diameter borosilicate glass tube in which the electrolyte entered at the top of the tube and exited at the bottom. The counter flow of electrolytes and forming gas enhanced the rate of deoxygenation of the solution.
After 24 h of deaeration, the test solution was heated at the rate of 1 °C/minute to a maximum value of 320 °C. The temperature was maintained at 320 °C for the SERS tests. During the heating up, the samples were cathodically polarized at −1.8VSHE. The polarization was accomplished with the aid of a Gamry potentiostat, a platinum coil counter electrode with a surface area of 2 cm2, and a platinum wire that served as the substrate for the reversible hydrogen reference electrode with a potential = −0.723VSHE (see Appendix B). The potentials reported in this paper were converted to the standard hydrogen electrode scale (SHE).
After 24 h of deoxygenation and before the heat up to 320 °C, the SER spectrum was measured. During the heating up, a potential of −1.8VSHE was applied and the SERS was measured at 50 °C and thereafter at every interval of 50 °C. During the heat-up samples were cathodically polarized at −1.8VSHE. The purpose of the cathodic polarization at −1.8VSHE during the heating up was twofold: first, to electrochemically reduce the alloy’s surface film, which was formed during the 24 h period in which the sample was exposed to the aqueous solution as it was being deoxygenated, and, second, to prevent oxidation during the heating up. SER spectra indicated the cathodic polarization did not completely reduce the film formed at room temperature.
When the temperature reached 320 °C the SERS was measured. Then, the samples were polarized at potentials ranging from approximately 200 mV below to 200 mV above the corrosion potentials. Starting at a potential of −0.9V, which is approximately 200 mV more negative than the corrosion potentials, the potential was stepped in 50 mV increments and held constant for 10 min, at which time the SERS was measured. The maximum potential was −0.5VSHE, which is approximately 200 mV more positive than the corrosion potentials. After 10 min at −0.5VSHE, the SERS was measured and the temperature was lowered to room temperature at a rate of 2 °C/minute. The SERS was measured at room temperature and after the electrolyte was drained from the cell and the sample was exposed to air for 10 min.
The measured potentials were not corrected for ohmic (IR) drop; however, the estimated magnitude of the IR drop is small. In a separate investigation, we measured the EIS of Alloy 600 in PWR PW at 320 °C using the same all-titanium facility as the present study. The EIS indicated an ohmic impedance that ranged from 200 to 400 ohm·cm2 and potentiodynamic anodic polarization tests indicated the anodic current density in the passive region, in which the current tests were conducted, is ≈30 µA/cm2. From these measurements, we estimate the IR drop as 6 to 12 mV.
SER spectra were obtained by irradiating the samples with a 35 mW Spectra-physics Model 127 He-Ne laser (632.8 nm) (see Figure 1). After exiting the laser tube, the laser beam passed through a Corion D1-633-R-T294 633 nm plasma line filter. The laser beam was then directed by a Newport 05D20DM.4 632.8 nm 12.7 mm diameter dielectric mirror and a Spindler & Hoyer (Göttingen, Germany) 34 0444 DLHS 632.8 nm 5 mm diameter dielectric mirror. A Newport plano-convex collection lens was used to focus the incident laser beam on the sample (BK 7; diameter: 50.8 mm; effective focal length: 75.6 mm; wavelength range: 430–700 nm). The backscattered light from the sample was then collected and collimated by the same Newport plano-convex lens. The collimated beam was passed through an HSNF-632.8-2.5 Holographic Super Notch Filter (Kaiser Optical Systems, Inc., Ann Arbor, MI, USA) to remove the elastic component of the scattered light. After passing through the Holographic Notch Filter, the light was focused by a Sigma 70–210 mm f/3.5–4.5 apochromatic macro zoom lens before entering into the slits of the spectrometer.
The SER spectra were analyzed (background subtraction and deconvolution of overlapping peaks) with the aid of ORIGINLAB software (Origin 8).

3. Results

3.1. Overview

SER spectra of passive films were measured during the heat-up from room temperature to 320 °C, during polarization between −0.9 VSHE and −0.5 VSHE at 320 °C, after the cool-down from 320 °C to room temperature, and after the removal of the sample from the electrolyte and exposure to air. Tests on each alloy were repeated on two to seven samples. In brief, the results exhibited very good reproducibility. We present the results of selected individual tests that are representative of the entire body of results.
The objective of the tests was to determine what information is obtained about the inner layer (IL) and outer layer (OL) of the passive films of Alloy 600 and Alloy 690 by a comparison of their in situ SER spectra. To help identify the peaks in the SERS spectra of Alloy 600 and Alloy 690, SER spectra were also measured using the identical testing procedure for unalloyed Ni and Cr and for laboratory heats of Ni-10Cr, Ni-20Cr, Ni-5Cr-8Fe, and Ni-10Cr-8Fe.
The effect of alloy composition on the identity of the alloy’s passive film is revealed by comparing and contrasting the SER spectra at potentials between −0.9 VSHE and −0.5 VSHE of nickel, chromium, and the seven alloys. In the interest of brevity, the only results presented are the SERS measured for each alloy at just a single potential of −650 mVSHE, which is approximately 100 mV to 200 mV above the corrosion potentials.
Differences in the passive films of Alloy 600 and Alloy 690 were also investigated by comparing the influence of two different values of pH, 6.2 and 7.2, on the passive films formed on Alloy 600 and Alloy 690. Both solutions contain 1200 ppm borate. The higher pH solution also contains 2 ppm lithium and the lower pH solution contains 0.19 ppm lithium. We start with the results that investigate the effect of alloy composition on the passive films formed in 2 ppm lithium + 1200 ppm borate. We finish by comparing the spectra in situ at 320 °C and at room temperature after exposure to air.

3.2. Influence of Alloy Composition

The SER spectrum of nickel is presented in Figure 3. The sharp peak at 879 cm−1 is due to conventional Raman scattering by the A1 vibrational mode of borate in the bulk solution [24]. The broad, weak peak between 400–500 cm−1 is attributed to a combination of the SERS background and a Raman peak at 416 cm−1 of the sapphire window [25]. The borate peak at 879 cm−1, the sapphire peak at 416 cm−1, and the SERS background are present in the SER spectra of all samples. However, the size and shape of the SERS background varies from sample to sample on account of variations in the number, size, shape, and distribution of gold particles.
The peak at ≈540 cm−1 is attributed to the surface film formed on nickel at 320 °C. Tests were conducted on a total of seven samples of nickel and the location of the peak attributed to nickel’s surface film is 538.0 cm−1 (SD = 2.69 cm−1). The peak is assigned to a specific species in the discussion.
As shown in Figure 4a, the SER spectrum of chromium consists of two overlapping peaks, one centered at ≈540 cm−1 and the other at ≈580 cm−1. The deconvolution of the overlapping peaks is illustrated in Figure 4b, in which the background has been subtracted (see Appendix C). For the five laboratory alloys and Alloy 600 and Alloy 690, the SER spectra at −650 mVSHE are presented after background subtraction and with the deconvolution of overlapping peaks illustrated.
Tests were conducted on seven samples of chromium and the results exhibited some scatter. In five out of seven tests, the SER spectra were similar to that shown in Figure 4 in that the height of the peak at 540 cm−1 was greater than the height of the peak at 580 cm−1. However, in four of the five tests, the integrated intensity of the peak at 540 cm−1 was greater than that at 580 cm−1. In the other, the ratio was reversed and the integrated intensity of the peak at 580 cm−1 was greater. In the tests of the two other samples of Cr, there were two strong peaks at 580 cm−1 and 640 cm−1 and no peak was detected at 540 cm−1. The meaning of the scatter is considered in the discussion. Despite the scatter in the relative intensities of the peaks at 540 cm−1 and 580 cm−1, their locations were reproducible: 541.8 cm−1 (SD = 3.93 cm−1) and 582.7 cm−1 (SD = 5.37 cm−1).
The SER spectra of Ni-10 Cr and Ni-20Cr are presented in Figure 5 and Figure 6. The surface films of the two Ni-Cr binary alloys exhibit peaks at ≈540 cm−1 and ≈600 cm−1. Two samples were tested of each alloy. The average of the peak locations were 543.5 ± 4.95 cm−1 and 590.2 ± 0 cm−1 for Ni-10 Cr and 543.2 ± 1.3 cm−1 and 602.3 ± 6.6 cm−1 for Ni 20 Cr. There was also a weak, broad peak at 460 cm−1, which was not present in the SER spectra of Cr.
The SER spectra of Ni-5Cr-8Fe and Ni-10Cr-8Fe samples are contained in Figure 7 and Figure 8. Tests were conducted for five samples of Ni-5Cr-8Fe and for seven samples of Ni-10Cr-8Fe. The surface films of the two ternary alloys exhibit two overlapping peaks at ≈540 cm−1 and ≈600 cm−1, and another peak at ≈680 cm−1, which was not present in the spectra of Ni, Cr, and the two binary Ni-Cr alloys. The locations of the three main peaks were 539.1 cm−1 (SD 2.84 cm−1), 618.4 cm−1 (SD 5.20 cm−1), and 679.7 cm−1 for Ni-5Cr-8Fe and 539.3 cm−1 (SD 3.26 cm−1), 600.4 cm−1 (SD 5.43 cm−1), and 659.3 cm−1 (SD 4.65) for Ni-10Cr-8Fe. As was the case for the Ni-Cr binary alloys, there was also a weak, broad peak at 460 cm−1.
The SER spectra of the passive films of Alloy 600 and Alloy 690 are presented in Figure 9 and Figure 10, respectively. Tests were conducted on four samples of each alloy. The surface film of Alloy 600 exhibits peaks at 538.5 cm−1 (SD1.80), 611.5 cm−1 (SD 4.92) and 684.0 cm−1 (SD 9.2). The SER spectrum of Alloy 690’s film exhibits just the two peaks at 539.0 cm−1 (SD 2.87 cm−1) and 583.8 cm−1 (SD 5.32 cm−1).
The peak locations are summarized in the following Table 3.

3.3. Influence of pH on SERS of Alloy 600 and Alloy 690

The effect of pH 6.2 and pH 7.2 on the SER spectra of Alloy 600 is indicated by the two raw spectra presented in Figure 11 and Figure 12. The spectrum of the surface film formed in the more acidic solution exhibits a greater integrated intensity of the peak at 680 cm−1. The effect is small but reproducible. In contrast, the spectra of Alloy 690 are presented in Figure 13 and Figure 14 and are very similar in both solutions and consist only of peaks at 540 cm−1 and 580 cm−1.

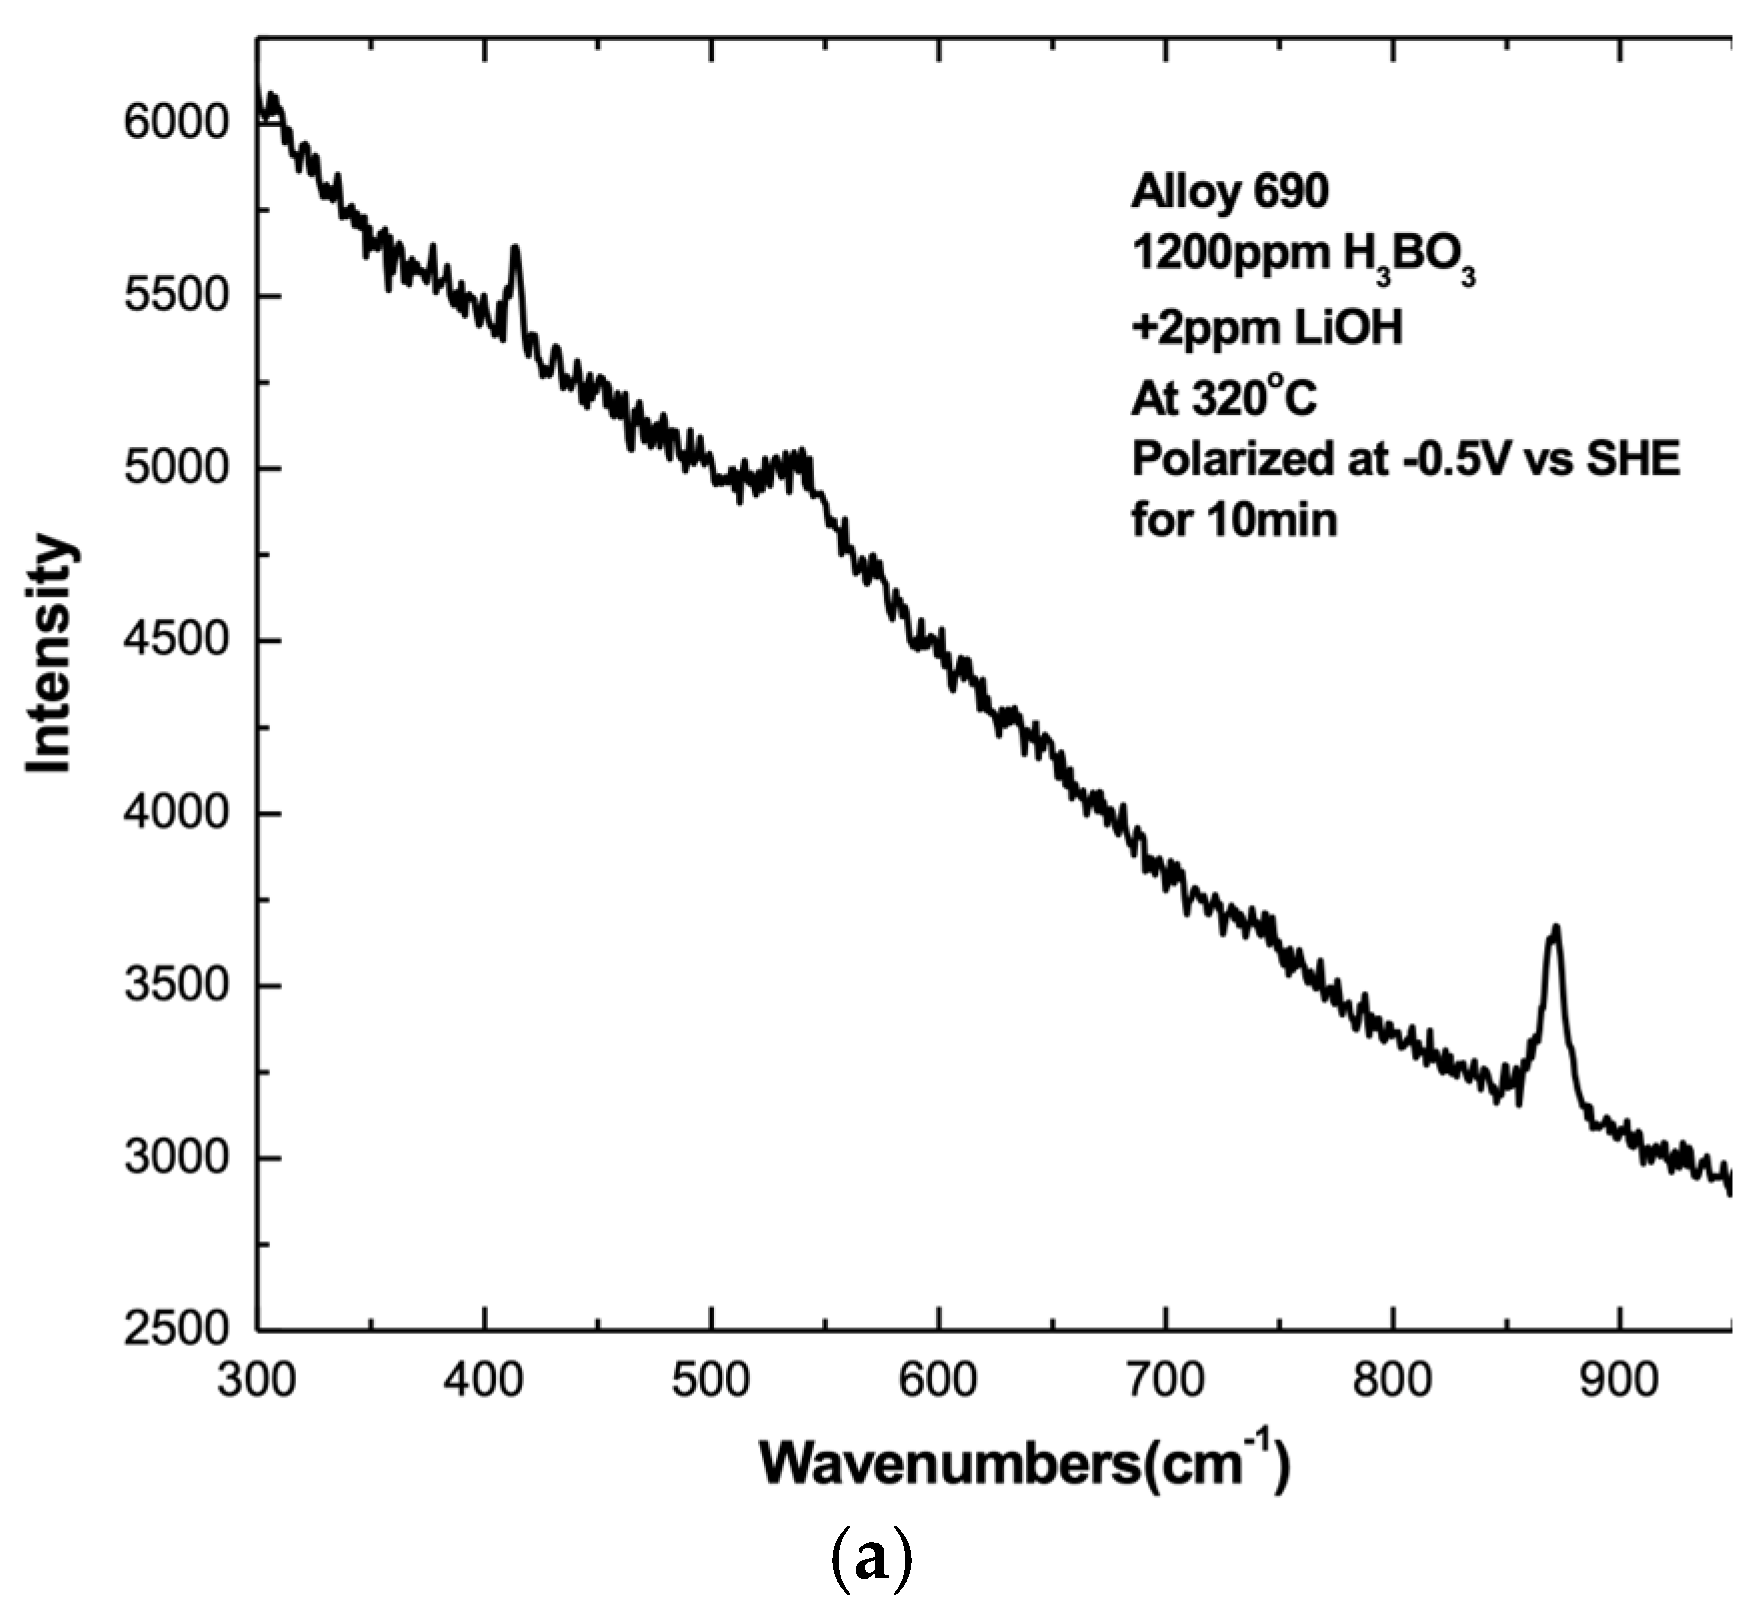
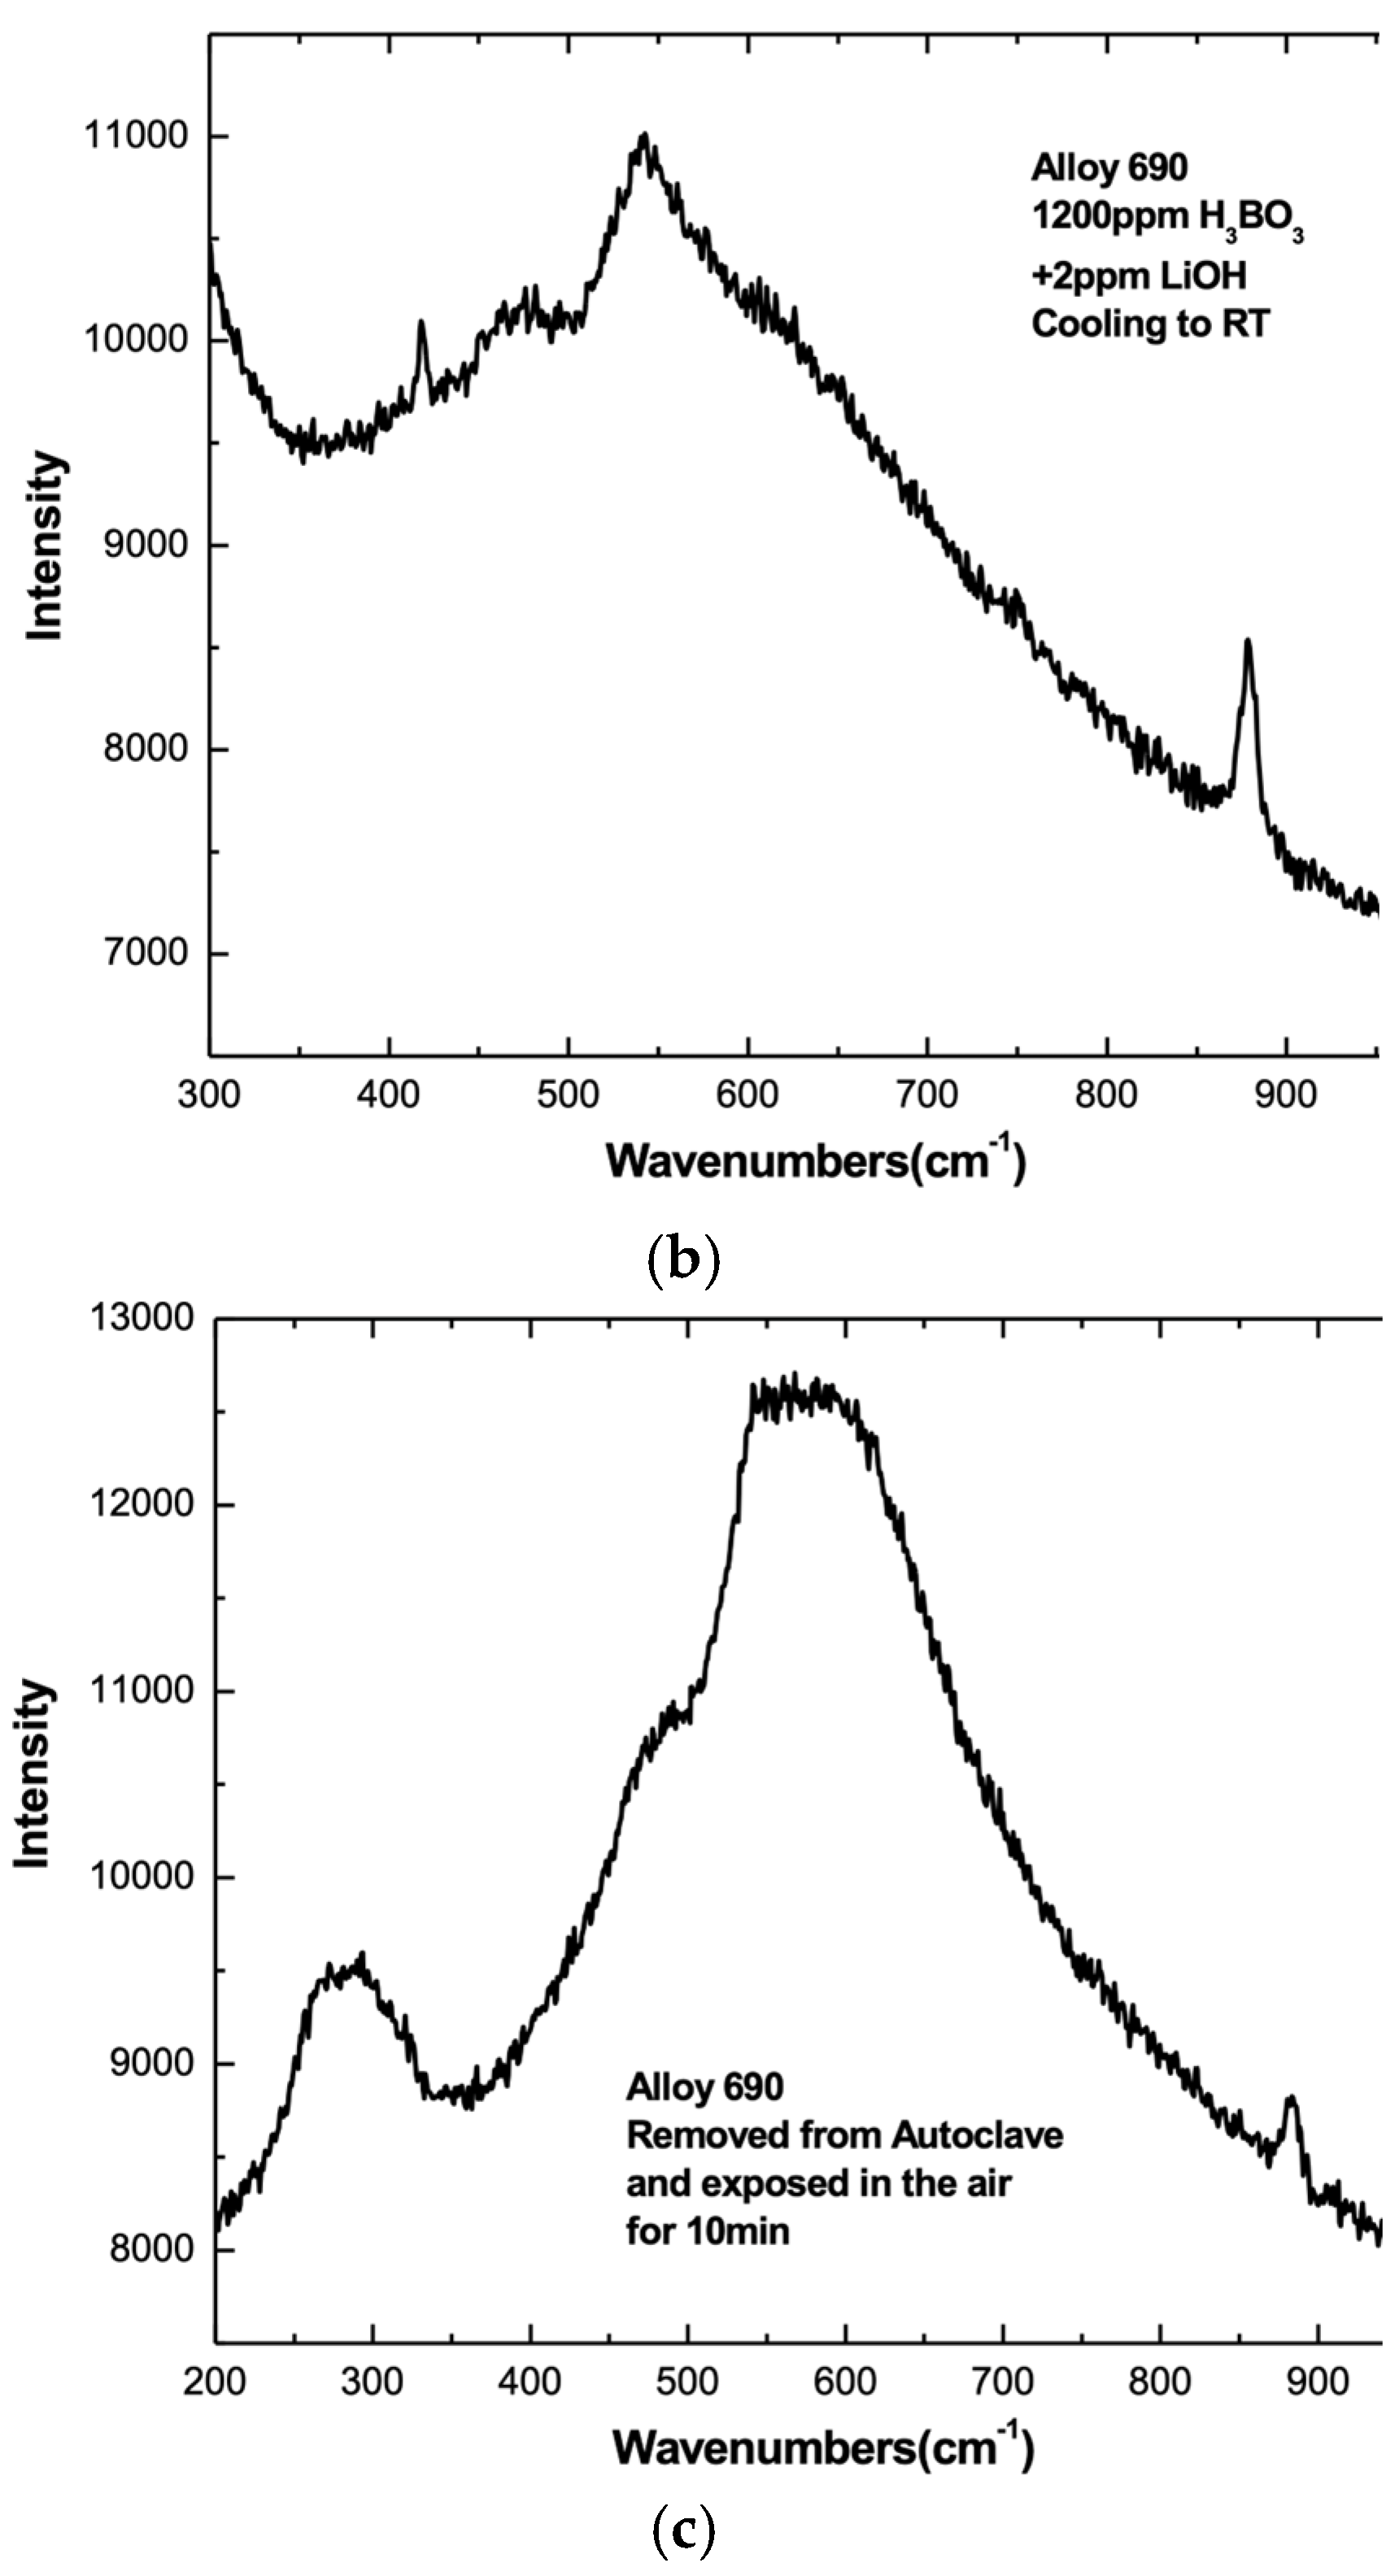
3.4. Cool-Down and Air Exposure

The effect of cooling down and exposure to air is indicated in the SERS of Alloy 600 and in the SERS of Alloy 690 in Figure 15a–c and Figure 16a–c, respectively. Figure 15a and Figure 16a show the SER spectra in 320 °C PWR PW at a potential of −500 mV, which was the most positive and the last potential tested at 320 °C. The SER spectra after the autoclave was cooled to room temperature are shown in Figure 15b and Figure 16b, and the spectra after the sample was removed from the autoclave and exposed to air are shown in Figure 15c and Figure 16c.

4. Discussion

Extracting information about the surface films from their SER spectra can be hindered by the fact that the SER spectra do not always include all of the Raman peaks, so the SER spectrum might represent a partial “fingerprint” and not a full fingerprint. The Raman spectra of many Raman-active species consist of a number of peaks of different intensities. Each peak is associated (usually) with a particular vibrational mode (or modes). Typically, the most intense peak is that of the totally symmetric A1 vibrational mode. Because Raman scattering is very weak, Raman spectra of measurable intensities require large samples. In the case of thin surface films, the amount of material might be too small to produce a measurable Raman intensity. SERS permits the measurement of the Raman spectra of very small amounts of materials. However, there is some uncertainty in the identification of components of a thin surface film by their SER spectra because the SER spectrum of each component might contain only the most intense peaks and be missing the lower intensity peaks.

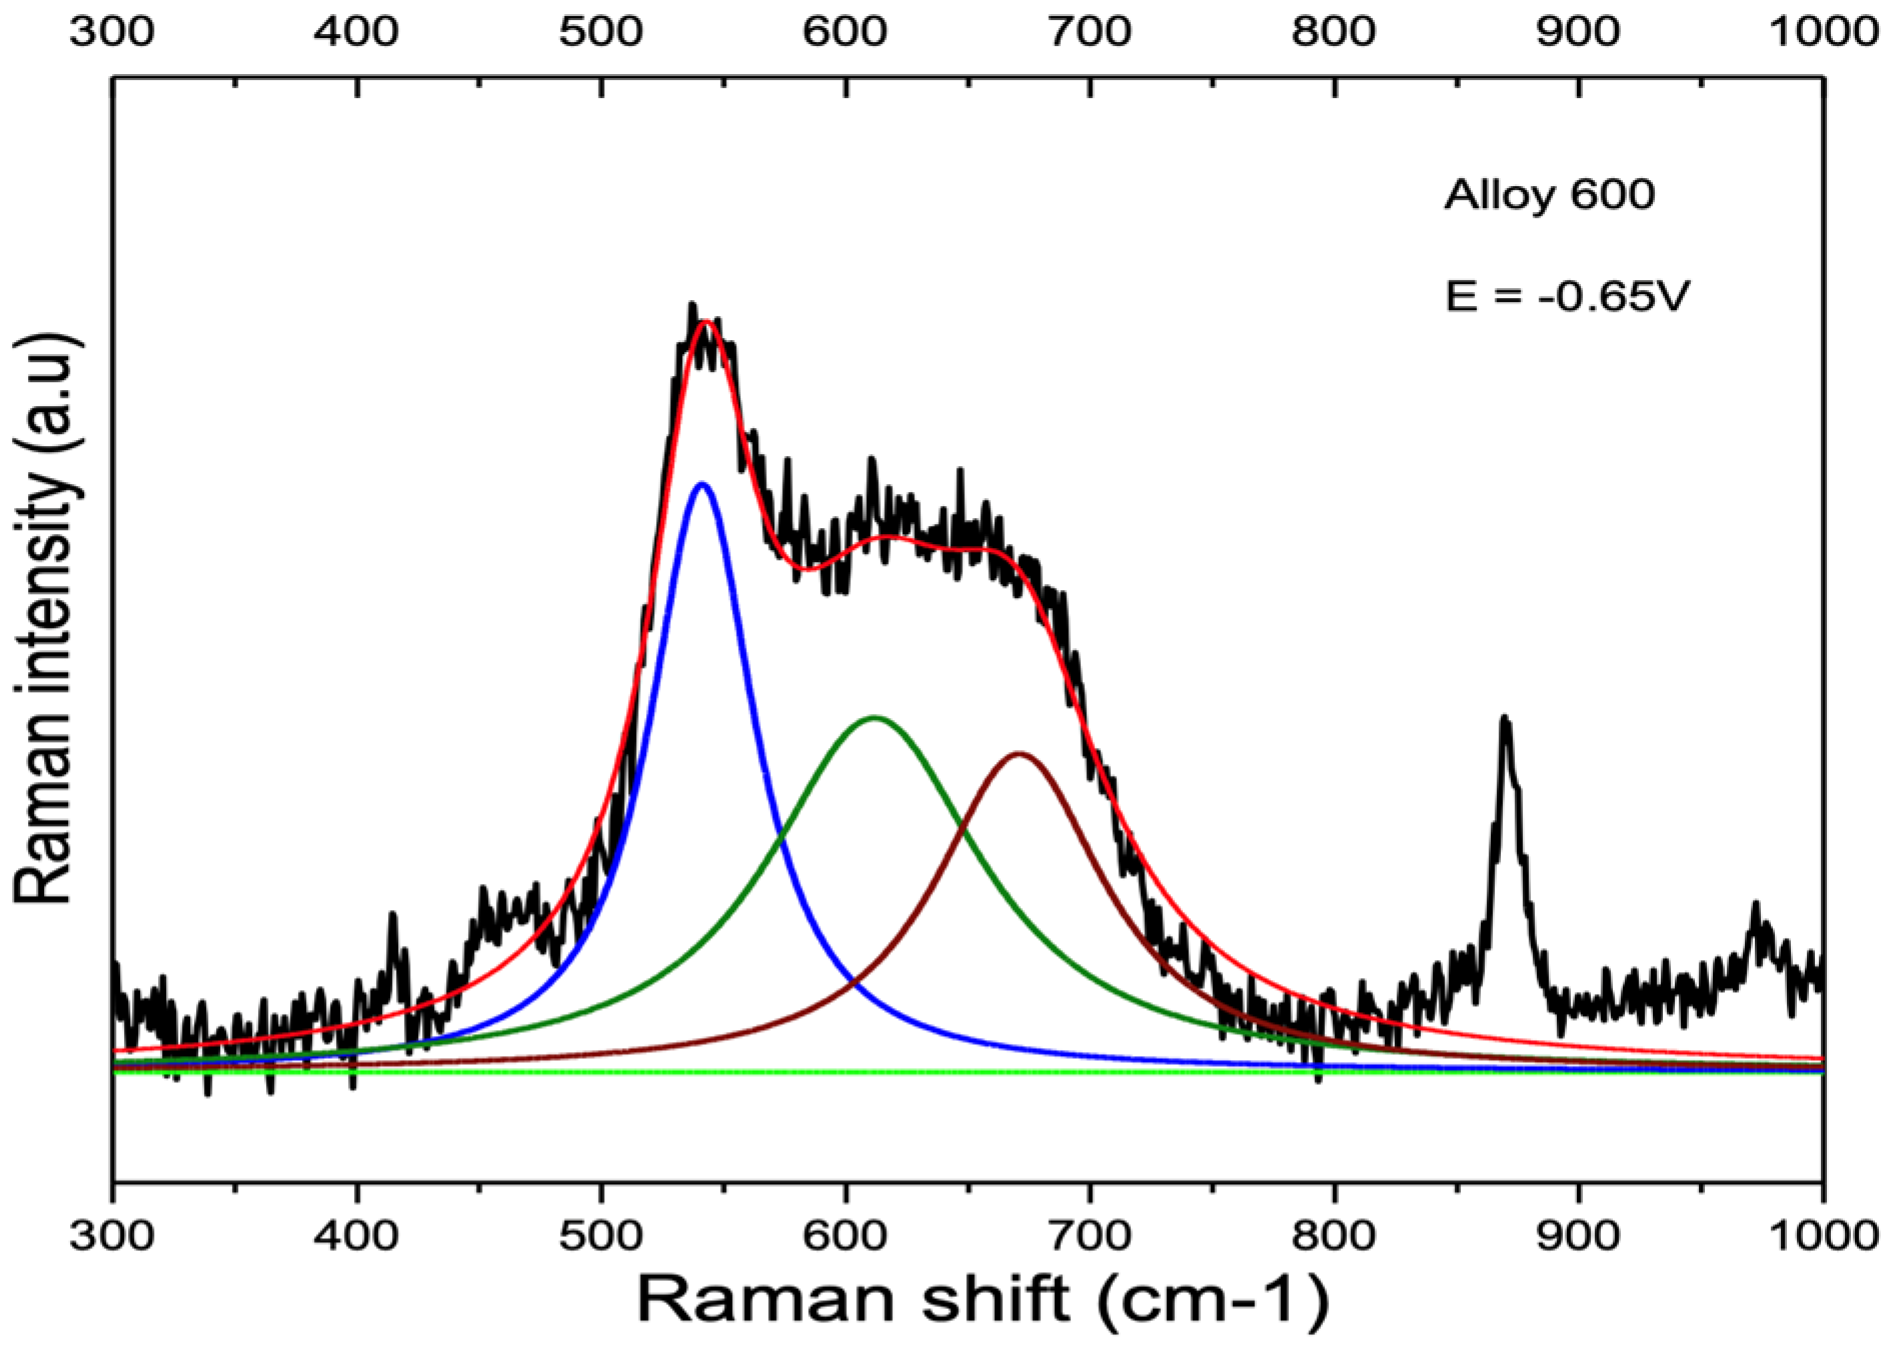
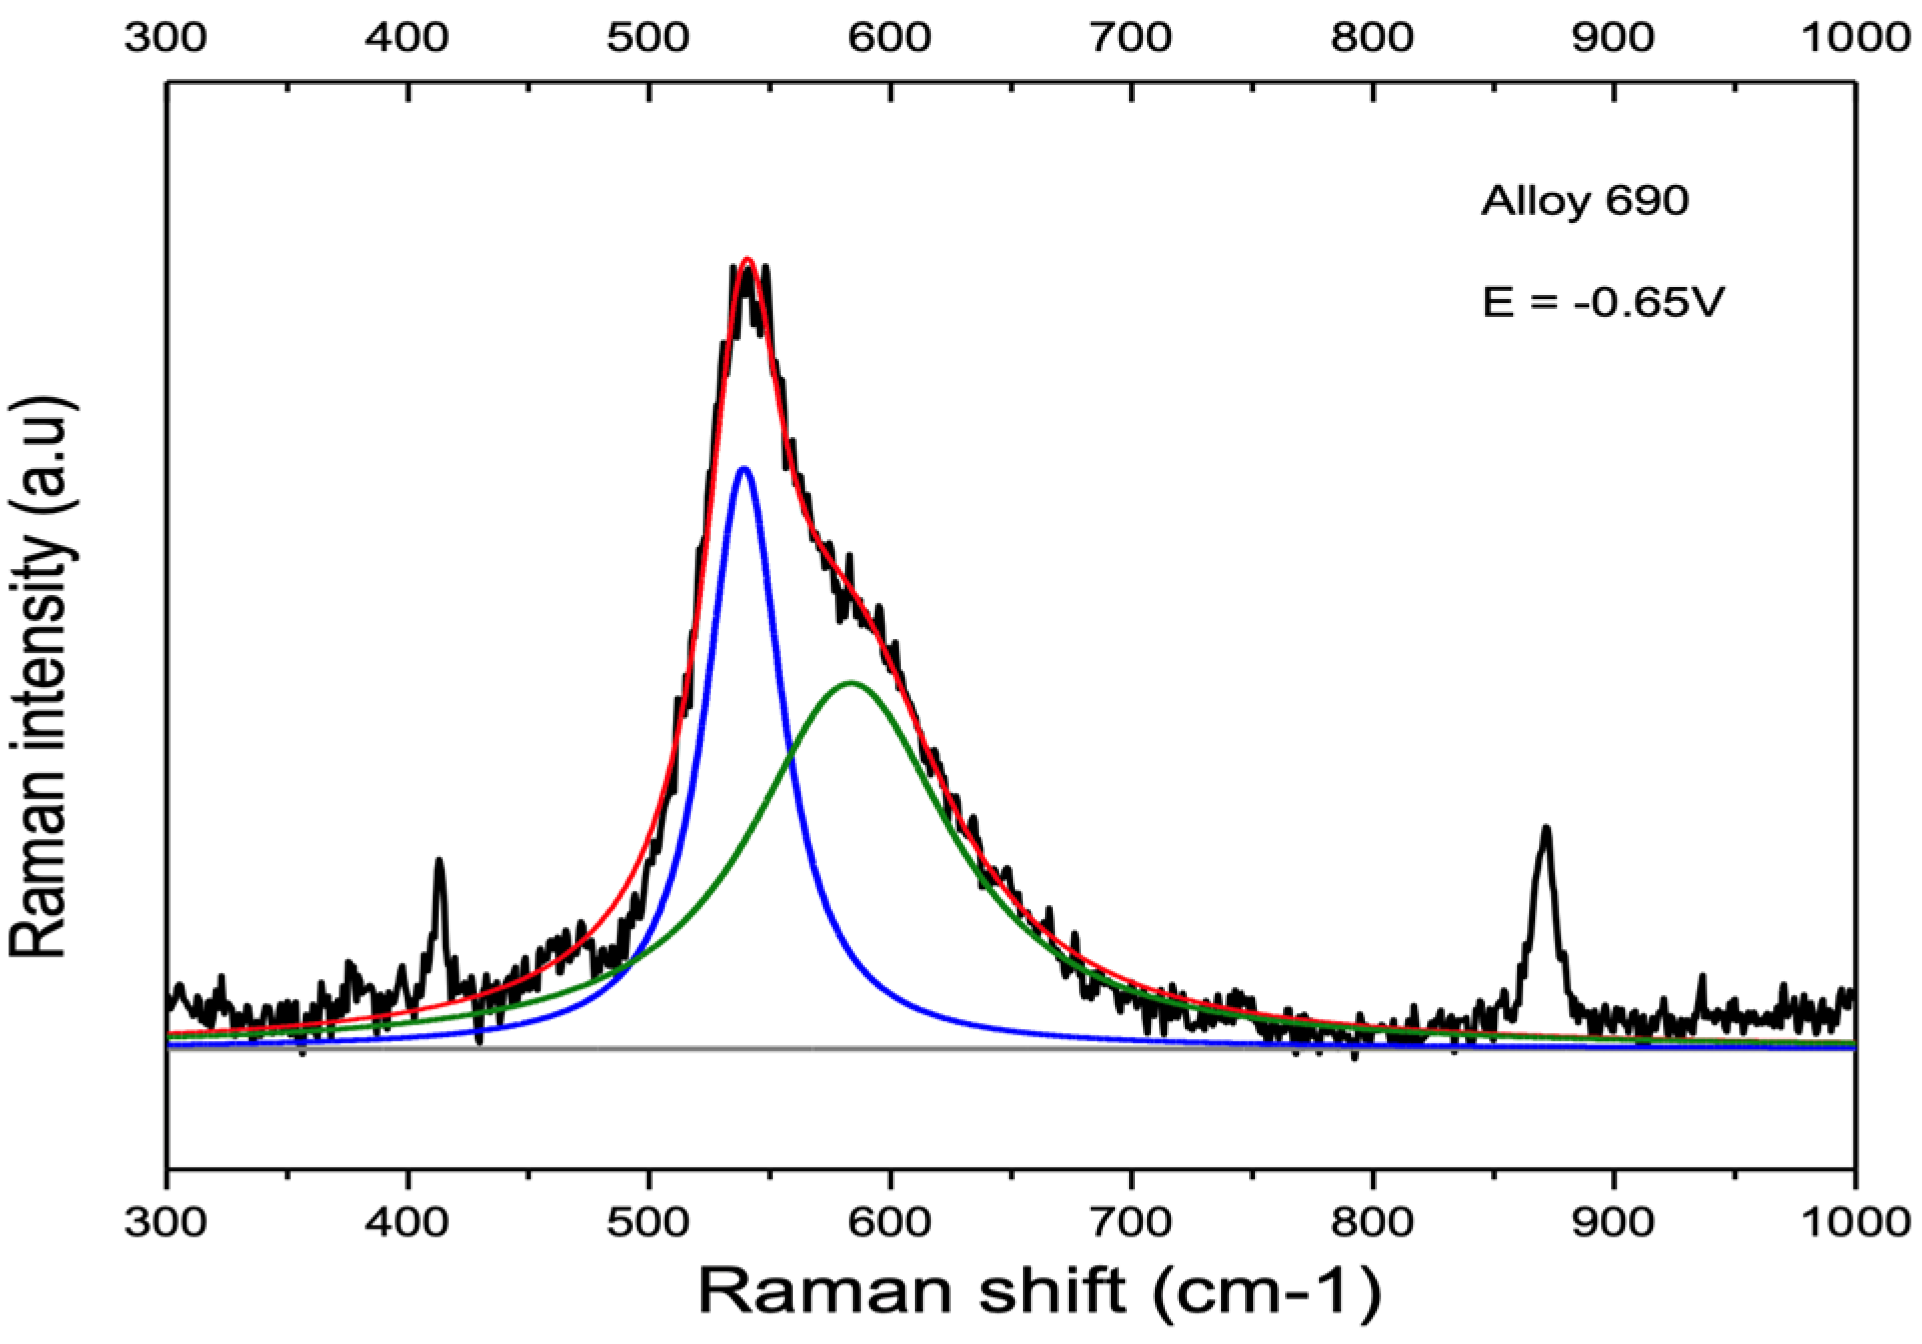
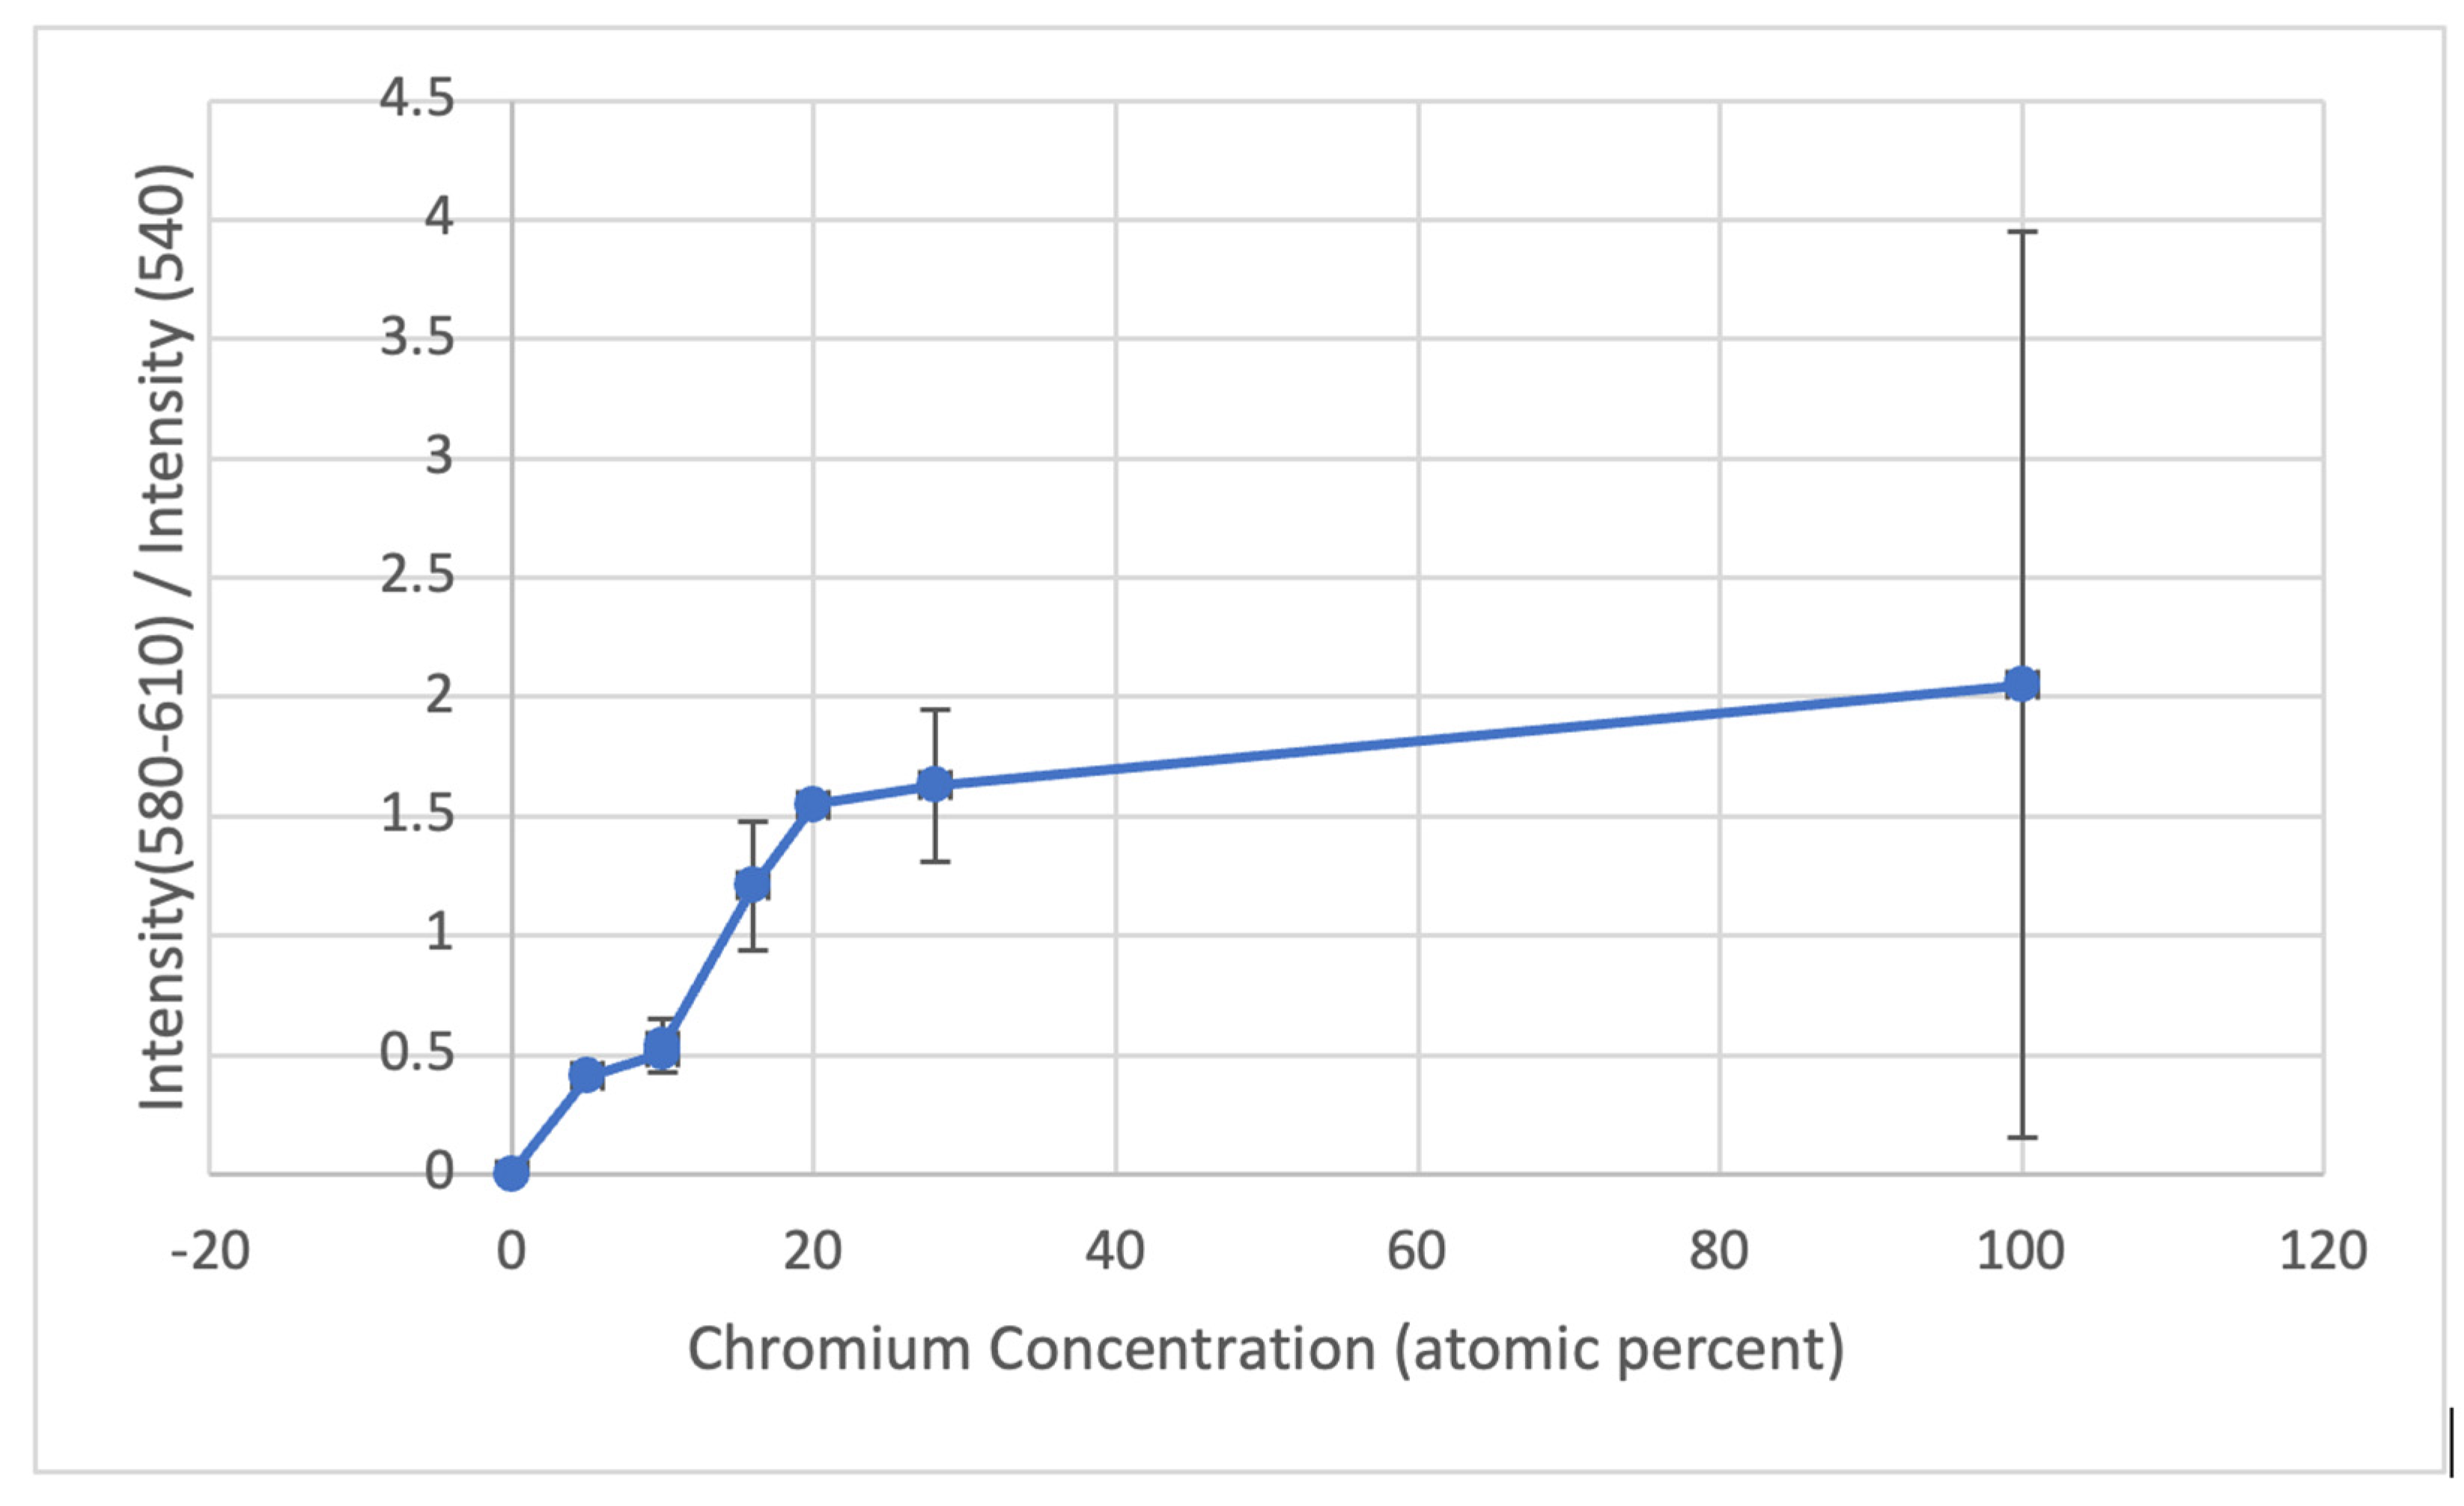
4.1. Peaks at 540 cm−1 and 580–610 cm−1

4.1.1. Nickel and Chromium

The likely products of nickel’s oxidation are Ni(OH)2 and NiO. The Raman spectrum of Ni(OH)2 (both α and β) exhibits a strong peak at ≈450 cm−1 [26]. The Raman spectrum of NiO consists of a peak at 510–550 cm−1 [27,28,29]. Our SER spectrum of nickel’s surface film measured at room temperature, which we did not present in this paper in the interest of brevity, contains a strong peak at ≈460 cm−1, which we assigned to Ni(OH)2. The spectra at 320 °C of the surface film formed on seven samples of unalloyed nickel at 320 °C consisted of a single peak at 538.0 cm−1 (SD = 2.69 cm−1), which we assigned to NiO.
The SER spectra of the passive film of Cr exhibit peaks at 541.8 cm−1 (SD = 2.9 cm−1) and 582.7 cm−1 (SD = 5.4 cm−1). The most intense peak of the Raman spectrum of Cr2O3 is at 540 cm−1 and the most intense peak of CrOOH is at ≈580 cm−1, which suggests the passive film of Cr is a combination of Cr2O3 and CrOOH [13,30]. Our tests of seven samples of chromium indicate significant scatter in the relative amounts of Cr2O3 and CrOOH. In four out of seven tests, the amount of Cr2O3 was greater than the amount of CrOOH, and in two out of seven tests, no Cr2O3 was detected and the film consisted entirely of CrOOH. In the other two tests, there was a significant amount of both phases but the amount of CrOOH was greater. The results in Figure 4 are an example of the latter. Cr2O3 is the thermodynamically stable phase [31] and the formation of CrOOH is attributed to kinetic effects. Our results are a snapshot taken after 4 h of testing. Presumably, at longer times, the surface film will consist entirely of Cr2O3.

4.1.2. Ni-Cr and Ni-Cr-Fe Alloys

The SER spectra of the passive films that form on two samples of each of the two Ni-Cr binary alloys and on five samples of each of the three Ni-Cr-Fe ternary alloys exhibit a strong peak located at 539–543 cm−1 and a second peak at 590–618 cm−1. The SER spectra of the surface films of four samples of Alloy 600 and four samples of Alloy 690 also exhibit strong peaks at 538–539 cm−1 and 588–611 cm−1. Consider the lower wavenumber peak first.
Because the SER spectrum of the passive film of Ni exhibits a single peak at 538.0 cm−1 and the SERS of Cr contains a strong peak at 541.8 cm−1, it is difficult to assign the peak at 539–543 cm−1 for the seven alloys. It is only possible to state that the peak at 539–543 cm−1 is due to some combination of NiO and Cr2O3.
The location of an oxide’s Raman peak is determined in part by the oxide’s chemical composition. The relatively narrow range of 538 cm−1 to 543 cm−1 in which the peak is located for unalloyed nickel and chromium and for the seven alloys suggests that the compositions of the NiO and Cr2O3 components of the surface films of all seven alloys possess similar chemistries.
The second peak in the SER spectra of the surface films formed on the seven alloys is located over a relatively wide range of 588–618 cm−1. The peak indicates the passive films contain a significant amount of CrOOH. The relatively wide range of locations of the peak suggests the composition of the CrOOH depends on the alloy’s chromium concentration.
Another feature that distinguishes the peak at ≈540 cm−1 from the peak at 588–611 cm−1 is width. The full width at half of the maximum peak height (FWHM) of the peak at ≈540 cm−1 is ≤50 cm−1 and the FWHM of the peak at 580–600 cm−1 ≥ 100 cm−1. Decreasing grain size and disorder at the bond scale increase peak width.
Given the influence of grain size and stoichiometry on the peak width and peak location, there is a considerable amount of information contained in the SER spectra about the composition and morphology of the surface film. However, mining the spectra for information about composition and morphology is limited at this time by the ill-defined nature of the SERS background, which significantly influences peak location and peak shape (see Appendix C). Until the SERS background is better defined, the details of structure and composition that are embedded in the spectra will be unavailable.
The mean value (and standard deviation) of the ratio of the integrated intensities of the peaks at ≈540 cm−1 and ≈580–600 cm−1 as a function of the alloy’s chromium concentration is plotted in Figure 17. The results were obtained from four tests on both Alloy 600 and Alloy 690, seven tests each on unalloyed nickel and unalloyed chromium, two tests each of Ni-10Cr and Ni-20Cr, five tests of Ni-5Cr-8Fe, and seven tests of Ni-10Cr-8Fe. The results indicate a very small amount of scatter in the ratio for all of the alloys, which indicates the amount of CrOOH relative to the amount of NiO + Cr2O3 is very reproducible. The high reproducibility is in contrast to the large scatter in the relative amounts of CrOOH and Cr2O3 for the passive film of Cr.
At this point of the discussion, it bears repeating that because the location of the Raman peak of NiO is almost identical to the location of the A1 mode of Cr2O3, it is not possible for the present results to distinguish between NiO and Cr2O3 and to completely explain the monotonic increase in the ratio with increasing chromium concentration.
One explanation is suggested by the results of scanning electron microscopy (SEM) and transmission electron microscopy (TEM), which indicated a significant amount of NiO in the OL of Alloy 600 [6] and a very small amount of NiO in the OL of Alloy 690. The microscopy results, combined with the fact that the amount of NiO is 100% for Ni and is 0% for Cr, suggest the monotonic increase in the ratio of the integrated intensities at 588–611 cm−1 and 540 cm−1 is due at least in part to a monotonic decrease in the amount of NiO in the surface films. This hypothesis indicates a relatively large amount of NiO in the surface film of Ni-5Cr-8Fe, Ni-10Cr-8Fe, and Ni-10Cr, which is reasonable but nonetheless speculative and requires TEM to either confirm or refute.
The SERS results do not provide information about the morphology of the surface films. Based on the earlier investigations of the passive films of stainless steels and Ni-Cr alloys, it is expected that Cr2O3/CrOOH forms as an inner layer and NiO as an outer layer. In fact, a TEM investigation that we conducted of the passive film formed on Alloy 600 that was tested in the same all-titanium facility as used in the present study indicated the IL was a chromium-rich oxide that was continuous and between 6 nm and 10 nm thick and the OL was dominated by whiskers of NiO [6]. Also, based on TEM investigations performed by other researchers, the inner layer of Cr2O3/CrOOH is known to be continuous for Alloy 600 and Alloy 690 [4,5,7,8,9,10,11,12,13].

4.2. Peak at ≈680 cm−1

A peak at ≈680 cm−1 is observed in the SER spectra of the lab alloys of Ni-Cr-Fe and Alloy 600 and is missing in the spectra of Ni, Cr, and Ni-Cr binary alloys and Alloy 690. The peak is assigned to the A1 mode of spinel [32]. The absence of the spinel peak in the SER spectra of Ni-10Cr and Ni-20Cr indicates that a nickel-chromite spinel does not form.
That the spinel peak only occurs for the alloys with 8% Fe (other than Alloy 690, whose film’s spectrum does not contain a spinel peak) suggests that the spinel might be a ferrite. However, earlier work indicated that at room temperature the Raman peak for the A1 mode of ferrite is at 700 cm−1 and that for chromite is located at 670–680 cm−1, so it is most likely that the spinel formed on the Ni-Cr-Fe alloys, including Alloy 600, is FeCr2O4 [33]. There can be some substituting by nickel on the iron sites and some substituting of iron for chromium [4] (see Table 1).
Thus, the results indicate the presence of spinel requires alloys with 8% Fe and the location of the spinel peak varies with the alloy’s chromium concentration. Also, in the case of Alloy 600, the standard deviation of the peak’s location is large, which suggests the spinel contains a range of compositions: FeCr2O4—MFe2O4—M(Fe,Cr)2O4 [32].
The presence of spinel in the surface films of Ni-5Cr-8Fe, Ni-10Cr-8Fe, and Alloy 600 (16 Cr, 8Fe) and the absence of spinel in the spectra of Alloy 690 (28 Cr, 8Fe) suggests the IL of Alloy 690 is more protective than the IL of Alloy 600 and that its greater protectiveness is due to its resistance to transport of iron cations. Results of several electrochemical impedance spectroscopy investigations have suggested that ion transport is the rate-determining step in the oxidation of Alloy 600 and Alloy 690 at 320 °C [6,34,35,36]. Long-time tests of 500 h at 330 °C did not detect spinel in the surface film of Alloy 690, Ni(OH)2 and NiO were present in the OL [3]. Thus, although Alloy 690’s IL is resistant to iron cation transport nickel cation transport does occur after long times. Furthermore, the Pourbaix Diagram of Alloy 690 indicates FeCr2O4 is thermodynamically stable, so at longer times it is likely that a spinel will eventually form as part of the OL of the surface film of Alloy 690 [37].
Nothing in our SER spectra indicates Cr2O3 of Alloy 690 is different from that of Alloy 600’s Cr2O3. However, as shown in Figure 17, the ratio I (580–611cm−1)/I (540 cm−1) of Alloy 690 is greater than that of Alloy 600. If that difference in the ratios is because the amount of NiO of Alloy 690’s OL is less than the amount of NiO of Alloy 600’s OL, it would suggest that the IL of Alloy 690 is more resistant to the transport of Ni++ as well as resistant to the transport of Fe+z. On the other hand, if the inequality of the ratios is due to a greater amount of CrOOH in the IL of Alloy 690, it would suggest that the resistance of Alloy 690’s IL to transport of Fe+z is due to its greater amount of CrOOH.
As stated in the introduction, one of the objectives of the present study was to determine if the surface films formed on Alloy 600 and Alloy 690 after 4 h in PWR PW at 320 °C were similar to the surface films that form at shorter times or similar to the steady-state films that form at much longer times. The results indicate our ILs are similar to those observed at shorter times of immersion in PWR PW at 320 °C, but our OLs are in transition, as our OL has NiO like that of short-time tests and a spinel like that of long-time tests.

4.3. Effect of Temperature on SERS

The summary of the locations of the spinel peak presented in Table 3 indicates that the spectrum of only one sample was measured for Ni-5Cr-8Fe. The other five spectra exhibited an extremely broad peak of nearly constant intensity from ≈580 cm−1 to ≈700 cm−1, which suggests the presence of multiple, overlapping peaks. It was not possible to identify the exact locations of individual peaks. However, because the SERS’ enhancement increased significantly as the temperature was lowered to room temperature, the spectra at room temperature confirmed the presence of spinel in all five cases. The temperature effect is shown in Figure 14 and Figure 15. While the spinel peak is only detectable as the high wavenumber edge of the broad peak from 600 to 700 cm−1 in the spectrum at 320 °C, the spinel peak is easily recognized in the spectrum at room temperature. So, while we were unable to identify the location of the spinel peak in all spectra of Ni-5Cr-8Fe at 320 °C, the spectra at room temperature (RT) confirmed the presence of spinel in all six samples of Ni-5Cr-8Fe. The stronger intensity at RT is due to the temperature dependency of SERS [38,39,40,41].
The greater intensity of SERS at RT suggests using the RT spectra to quantitatively measure the different species that make up the surface film rather than using the spectra measured at 320 °C. The large SERS background at room temperature hinders the use of the RT spectra to perform quantitative analyses of the surface films. The positive slope of intensity vs. wavenumber at 200 cm−1 and the negative slope of the intensity vs. wavenumber at 800 cm−1 in the RT spectrum presented in Figure 15c indicate that the SERS background is shaped like a mound that extends from 200 cm−1 to 800 cm−1 and obtaining its exact shape is challenging. As mentioned in Appendix C, one possibility is the use of wavelet transforms to construct the SERS background [42]. While the use of wavelets is mathematically sound, what is needed is a mechanistically based analytical expression of the SERS background or a robust empirical technique for subtracting the background.

4.4. In Situ vs. Ex Situ SERS

Finally, a comparison of the spectra at 320 °C and the spectra after cooling down to room temperature and after the electrolyte is drained from the cell and replaced by air indicates that the intensity of the spectrum is greatly increased by the cool-down and this is attributed to the temperature dependency of the SERS enhancement [38,39,40,41].
In some cases, the SER spectra indicate that the decrease in temperature and exposure to air did not change the passive film. The spectra of Alloy 600 presented in Figure 15a–c is an example. In other instances, the SER spectra suggest changes have occurred to the passive film as a consequence of exposure to air. The spectra of Alloy 690 shown in Figure 16a–c is one example. A significant increase occurred in the peak at 580 cm−1 as a result of exposure to the air for 10 min. That is, there was a significant increase in the amount of CrOOH relative to the amount of Cr2O3. While a significant change in the relative heights of the peaks at 540 cm−1 and 580 cm−1 caused by the exposure to air is quite apparent, it is not possible to quantify the amount of increase in CrOOH. Nevertheless, the results suggest that some films investigated by ex situ techniques might have important differences from the films formed at 320 °C.
The matter of in situ vs. ex situ investigations of passive films is important. The present results do not provide a consistent answer, but they bring attention to an important issue that is worthy of a comprehensive study.

4.5. Miscellaneous

Another difference in the behaviors of Alloy 600’s and Alloy 690’s ILs of Cr2O3/CrOOH is the effect of pH. The SER spectra indicate the surface film of Alloy 690 does not contain an OL of spinel, either at pH 7.2 or pH 6.2, and the SER spectra indicate the passive film of Alloy 600 contains an OL of spinel and the amount of spinel formed at pH 6.2 is significantly greater than the amount formed at pH 7.2. The mechanism by which a less alkaline pH increases either the transport of iron cations through Alloy 600’s Cr2O3/CrOOH or the release rate of iron cations at the surface of Cr2O3/CrOOH is not yet known.
One more feature to mention is the weak broad peak at 460 cm−1 that appears in the spectra of all samples at 320 °C, at room temperature, and after removal from the autoclave and exposure to air, except unalloyed chromium. The peak is assigned to Ni(OH)2 [26] and indicates that there is another form of oxidized nickel in addition to NiO. NiO is the thermodynamically stable phase and so the formation of Ni(OH)2 is presumably a consequence of kinetic effects.

5. Summary and Conclusions

The passive films that form on Alloy 600 and Alloy 690 in simulated PWR PW for 4 h at 320 °C were investigated in situ by SERS. To aid in assigning the peaks in the SER spectra of the surface films of Alloy 600 and Alloy 690, SER spectra were also measured for samples of Ni, Cr, Ni-10Cr, Ni-20Cr, Ni-5Cr-8Fe, and Ni-10Cr-8Fe.
The SER spectra indicated the following.
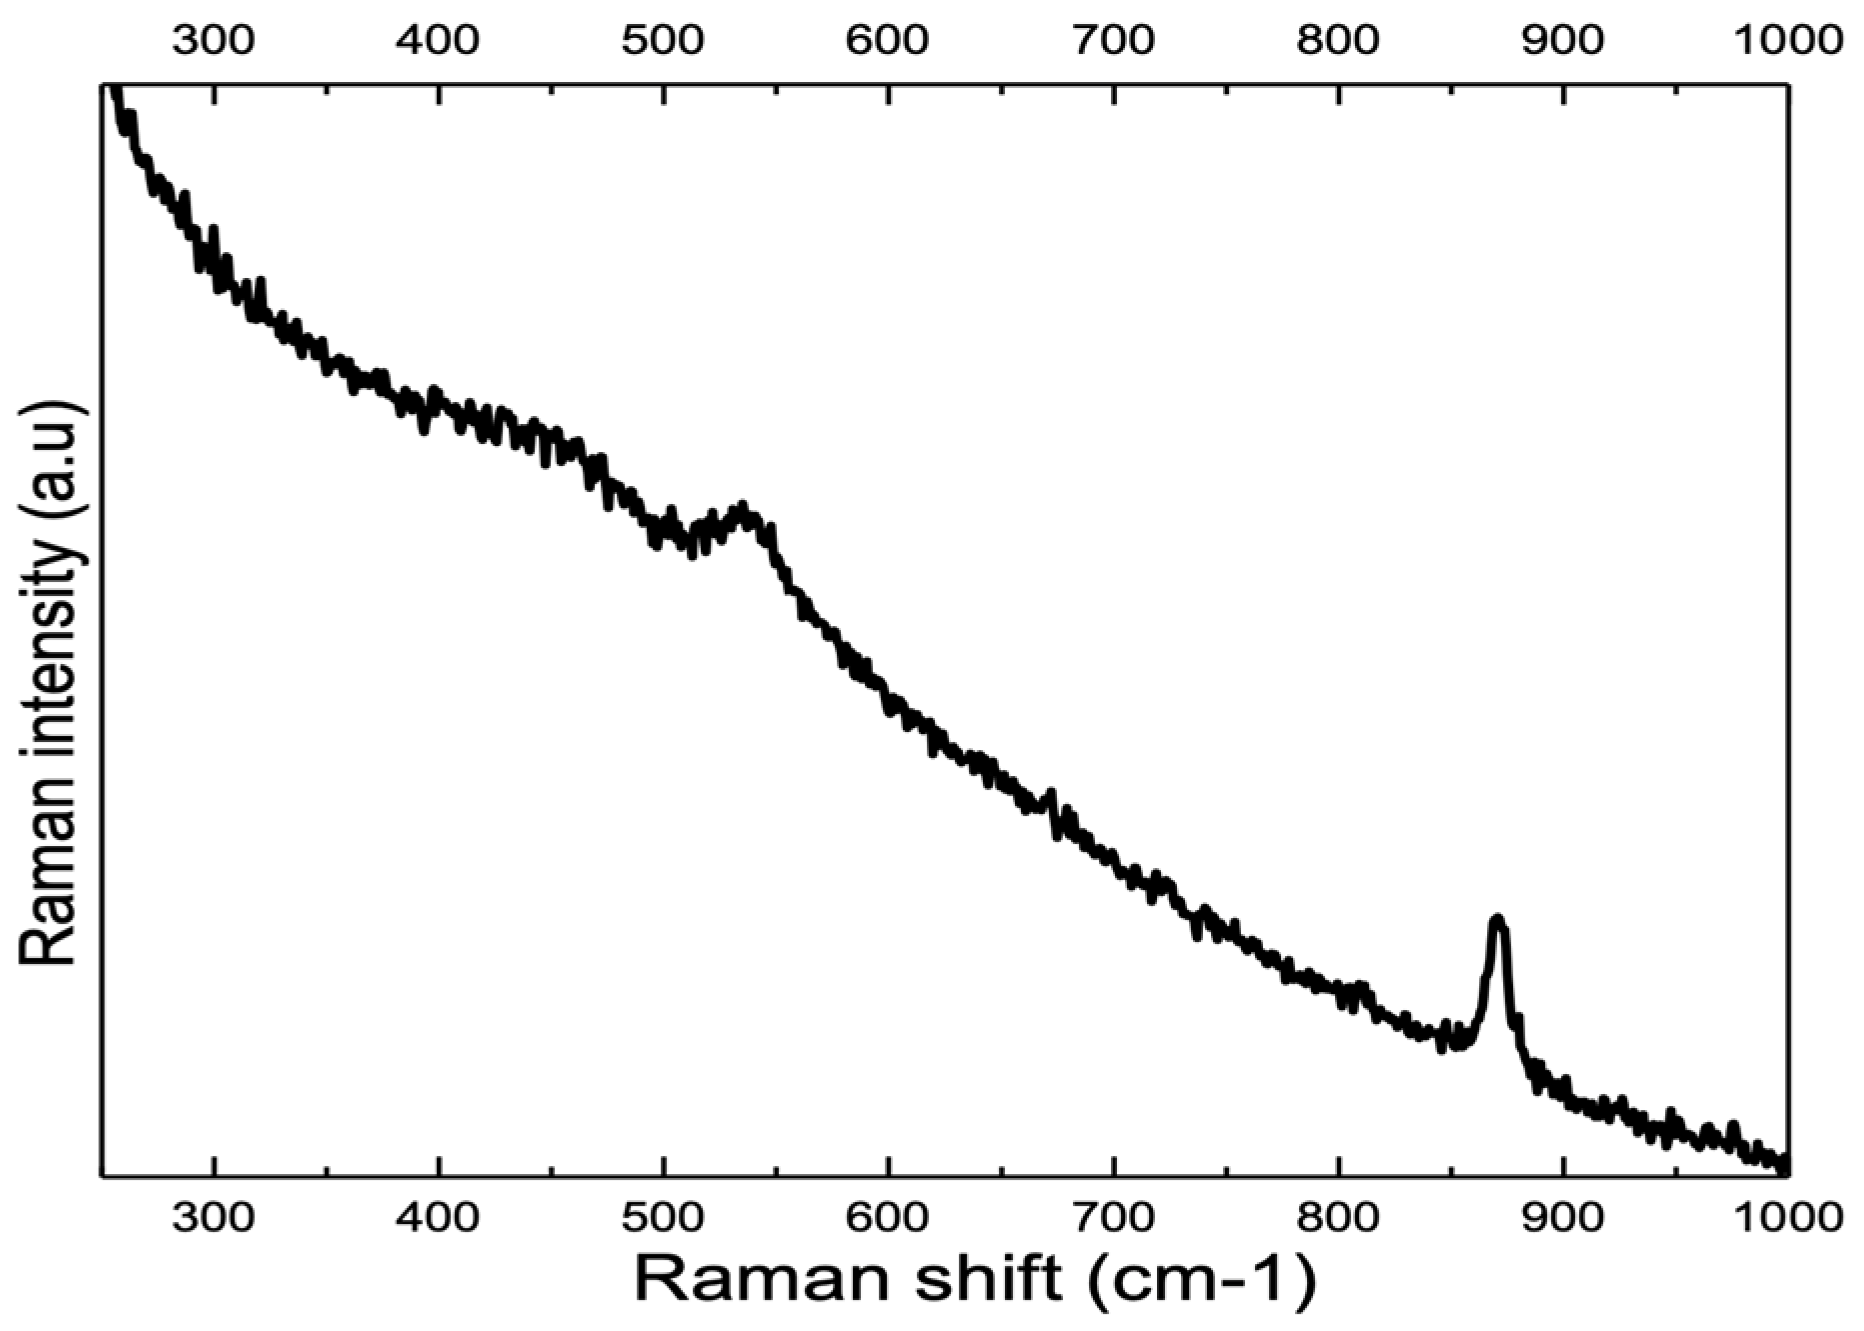
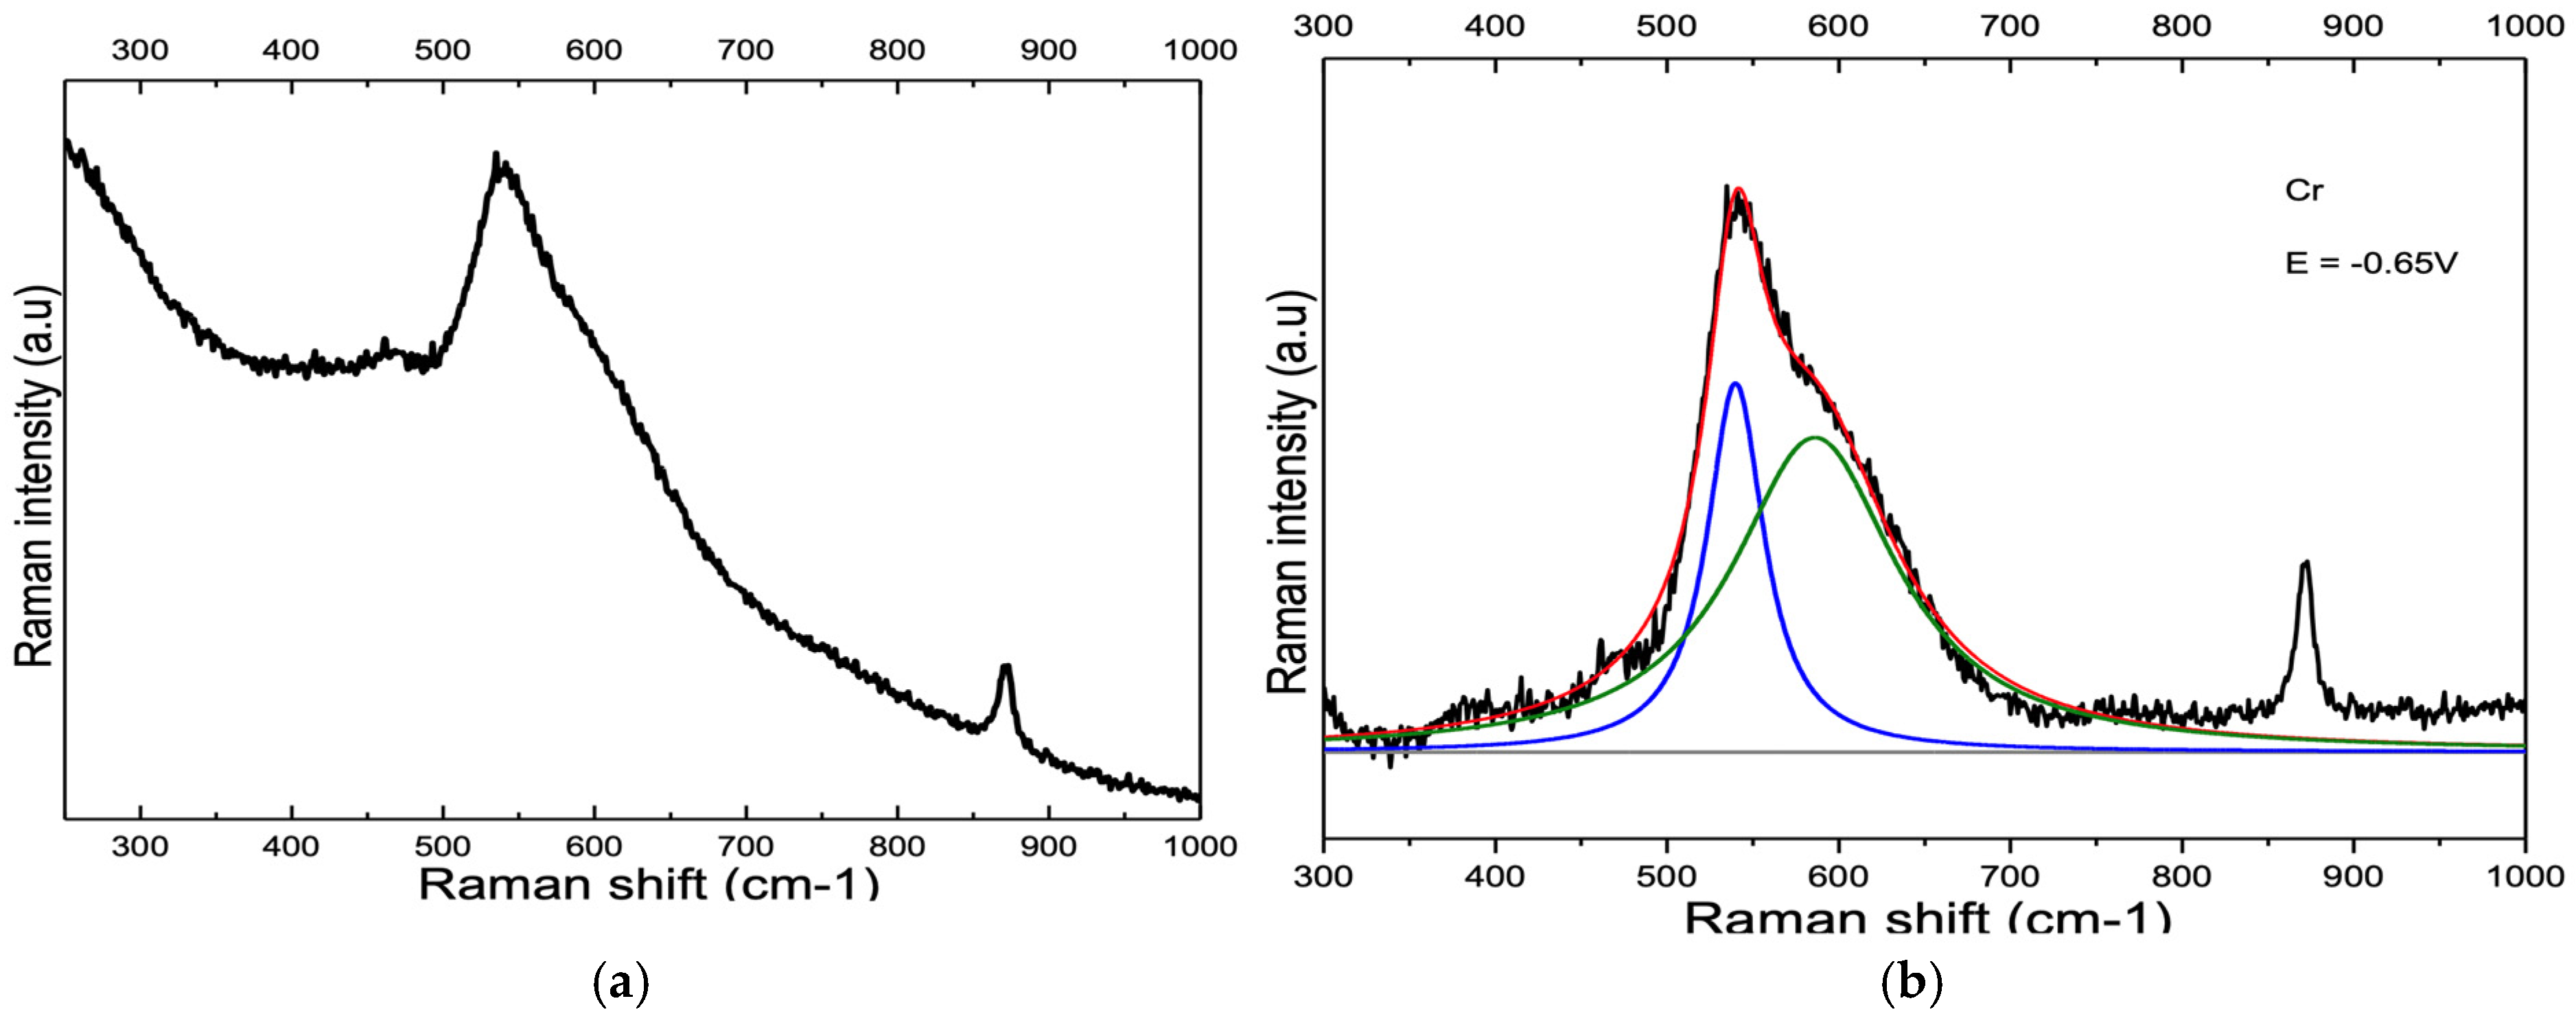
  • The passive film that forms at 320 °C on unalloyed nickel is NiO and the film that forms on unalloyed chromium is a mixture of Cr2O3 and CrOOH. The relative amounts of Cr2O3 and CrOOH varied from sample to sample and ranged from instances in which Cr2O3 is clearly the dominant species to cases in which CrOOH is dominant and no Cr2O3 is detected.
  • The most intense peaks of the SER spectra of NiO and of Cr2O3 are nearly identical and are located within 3.8 cm−1 of each other, which makes it very difficult to determine the relative amounts of NiO and Cr2O3 in the surface films of the Ni-Cr alloys, the Ni-Cr-Fe alloys, and Alloy 600 and Alloy 690.
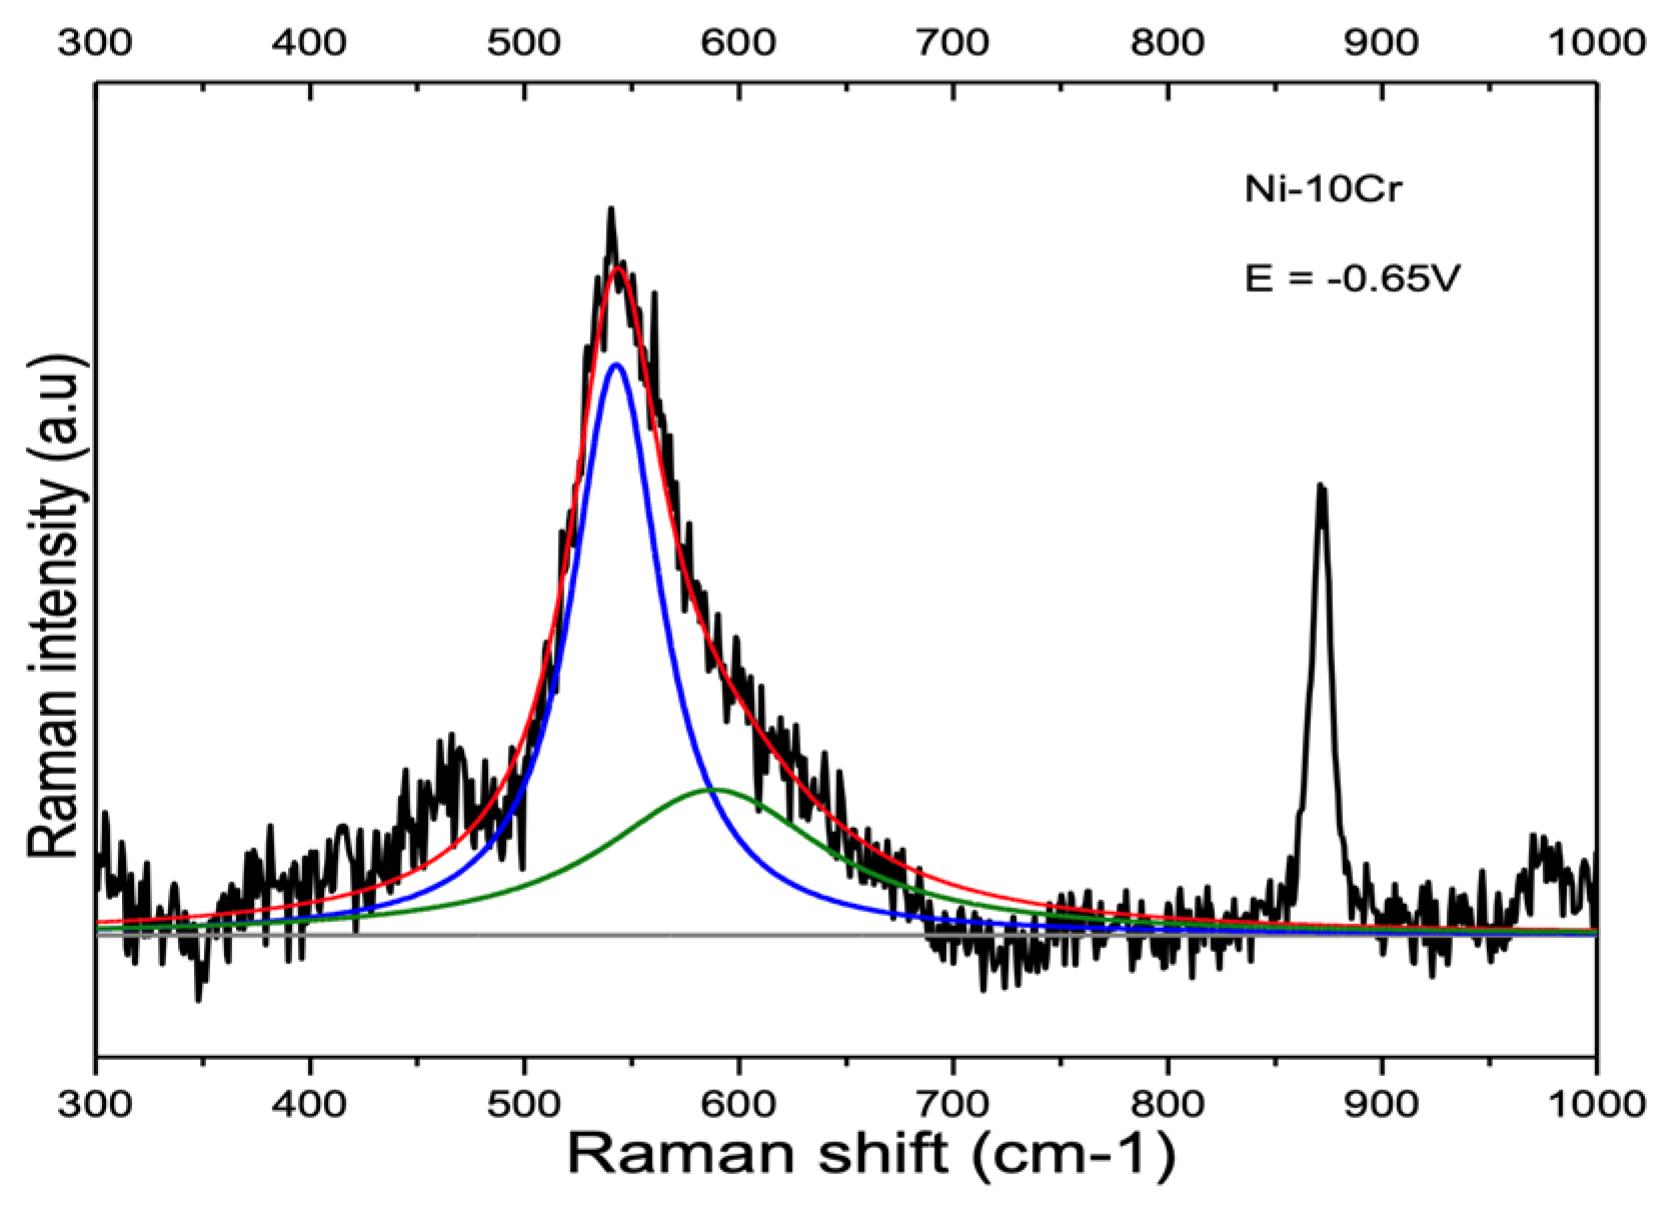
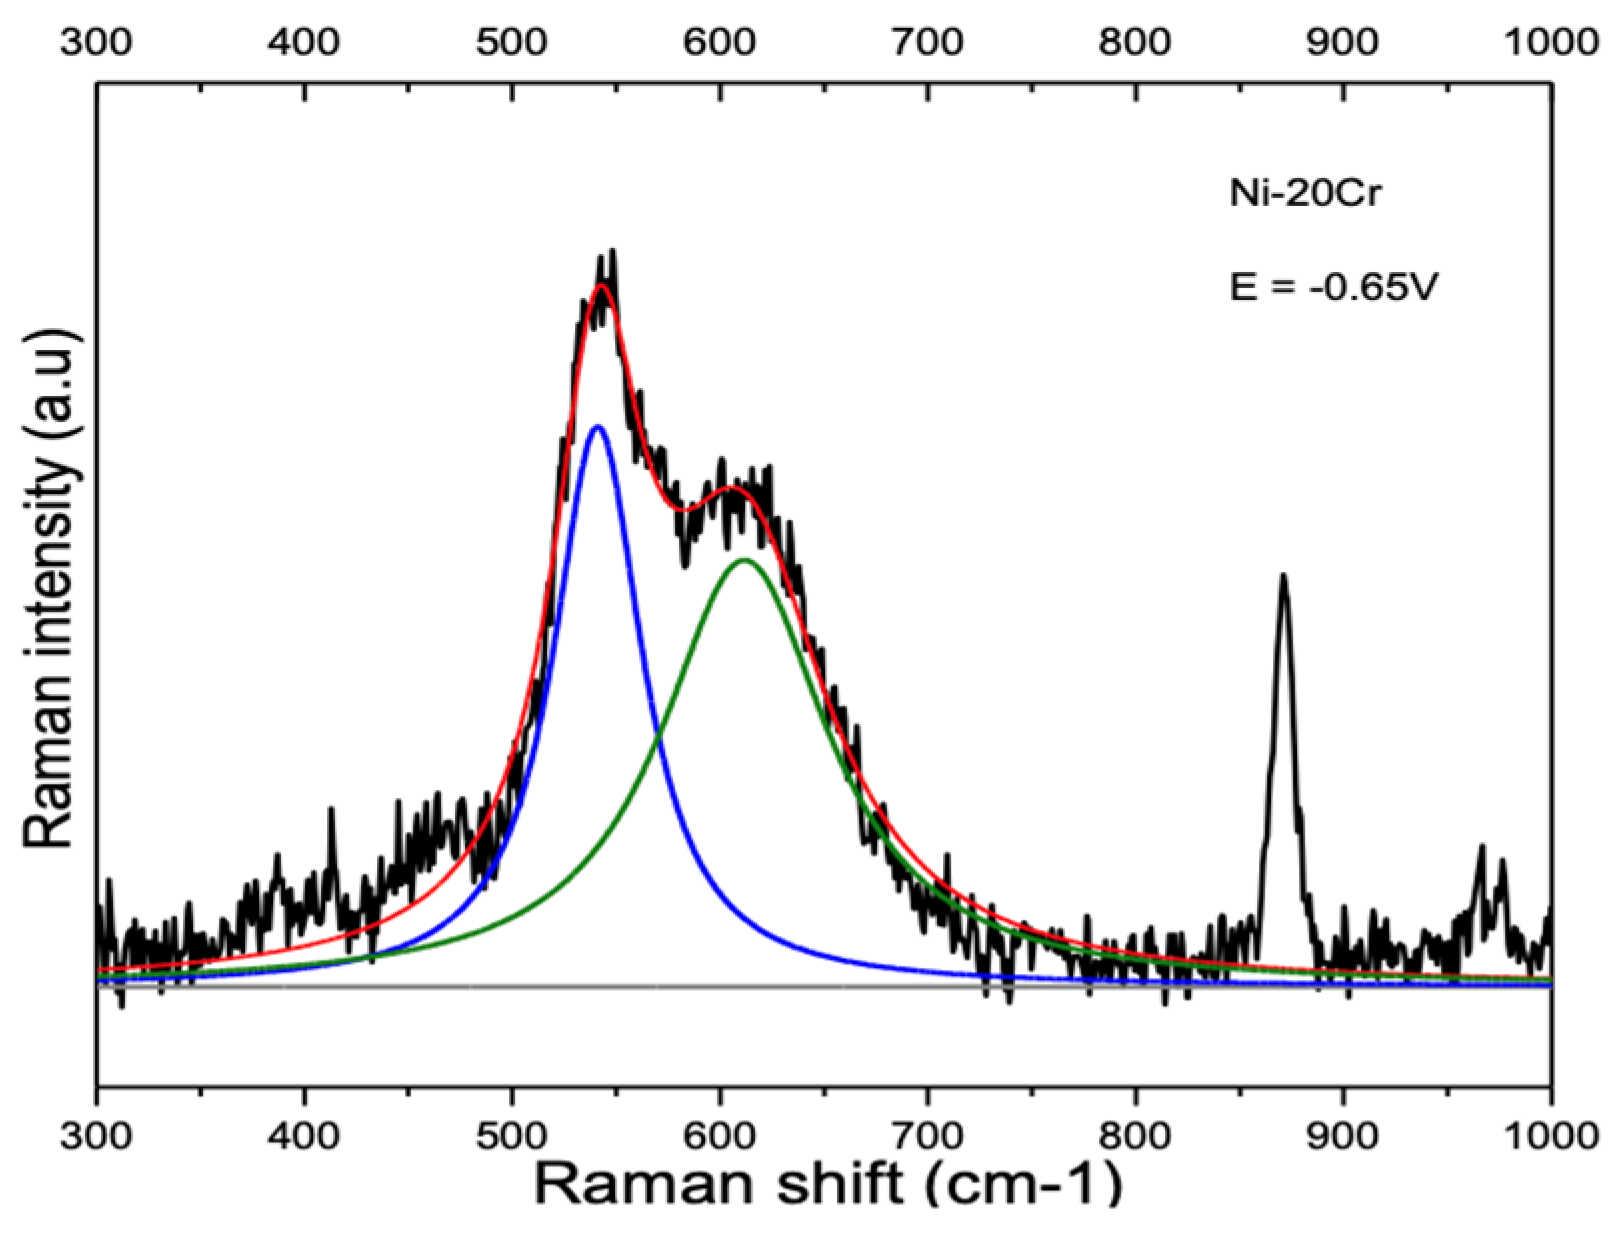
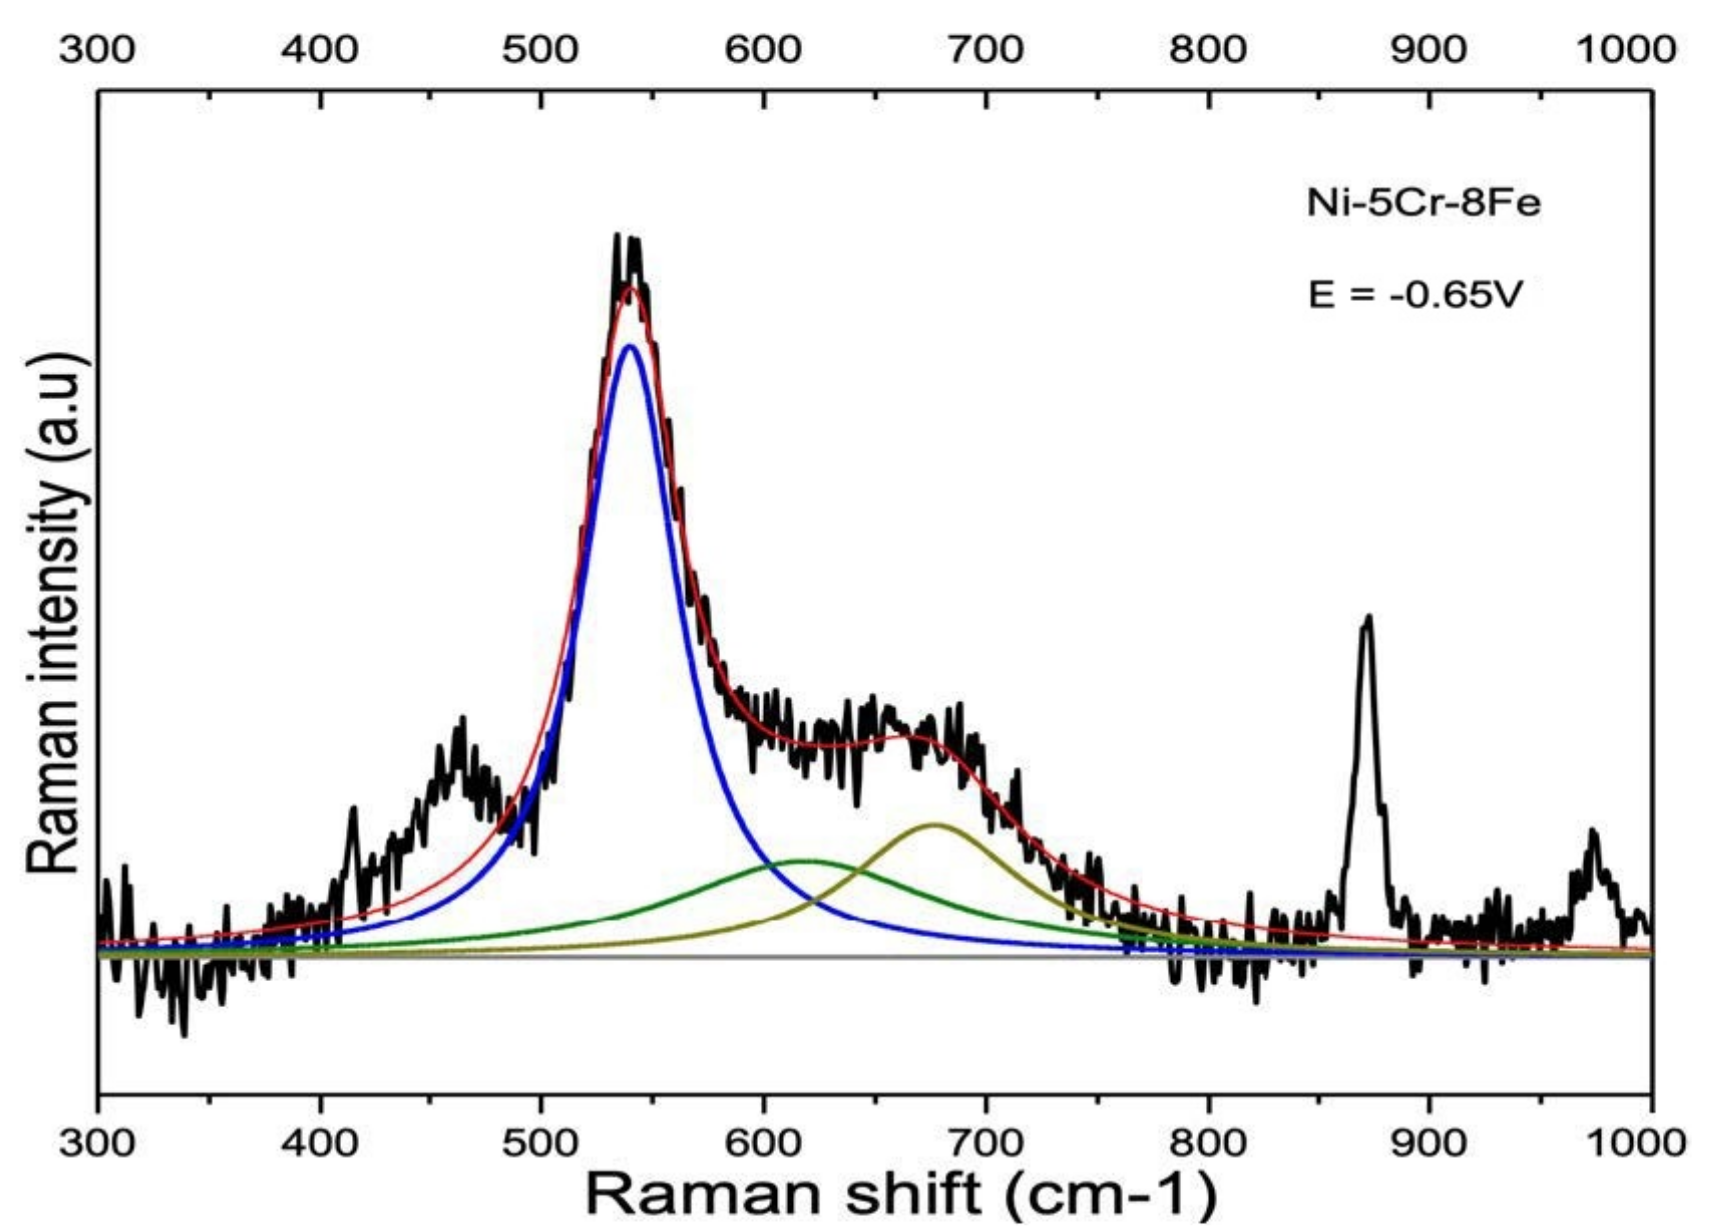
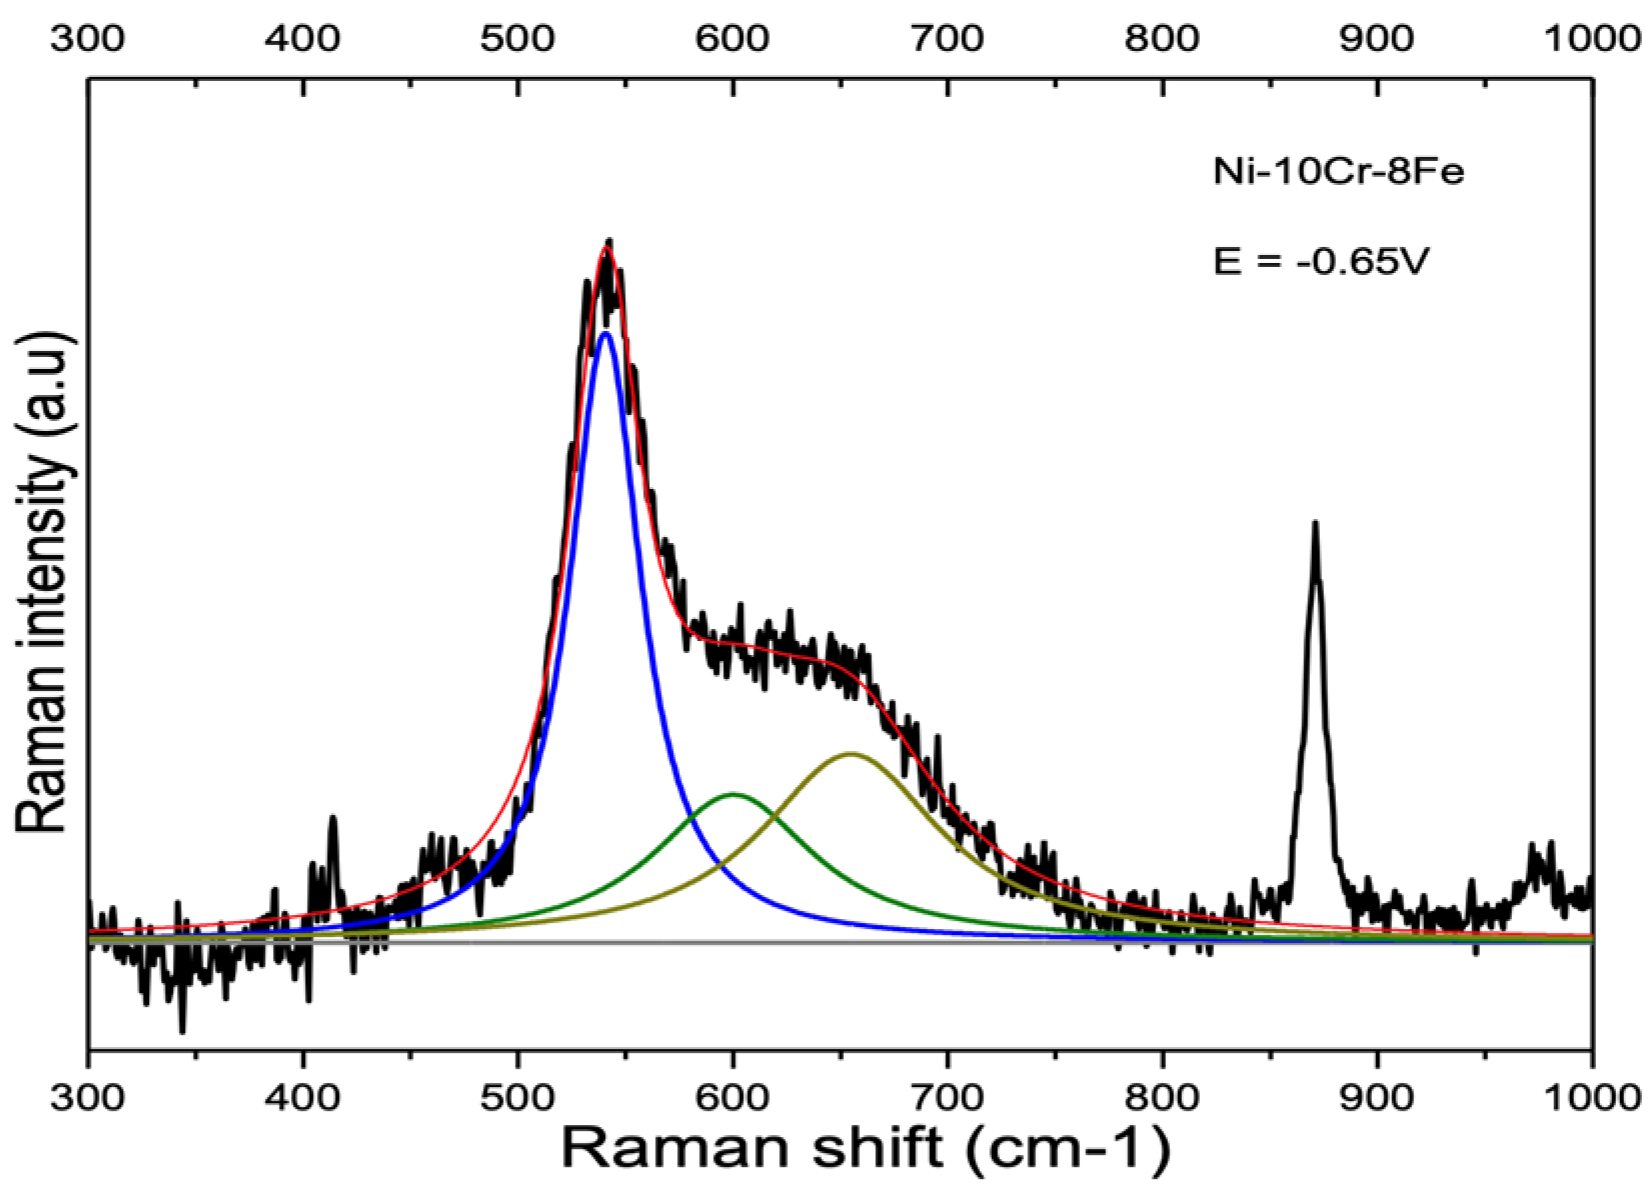
  • The films that form on Ni-Cr binary alloys and Ni-Cr-Fe ternary alloys consist of NiO and a mixture of Cr2O3 and CrOOH. The amounts of CrOOH relative to the combined amounts of Cr2O3 and NiO are very reproducible and monotonically increase as the alloy’s chromium concentration increases. When combined with earlier TEM investigations, the SERS results suggest a monotonic decrease in the amount of NiO in the surface film as the alloy’s chromium concentration increases.
  • With the exception of Alloy 690, all alloys with 8% Fe exhibited OLs with spinel FeCr2O4—M(Fe,Cr)2O4 along with NiO. The absence of spinel in the OL of the surface film of Alloy 690 indicates the greater protectiveness of 690’s IL of Cr2O3 + CrOOH compared to Alloy 600’s IL of Cr2O3 + CrOOH. The greater protectiveness is associated with Alloy 690’s IL’s greater resistance to the transport of iron cations.
  • There is a greater amount of spinel in the OL of Alloy 600 formed at pH 6.2 than at pH 7.2. No spinel is formed in the passive film of Alloy 690 at pH 7.2 and pH 6.2.
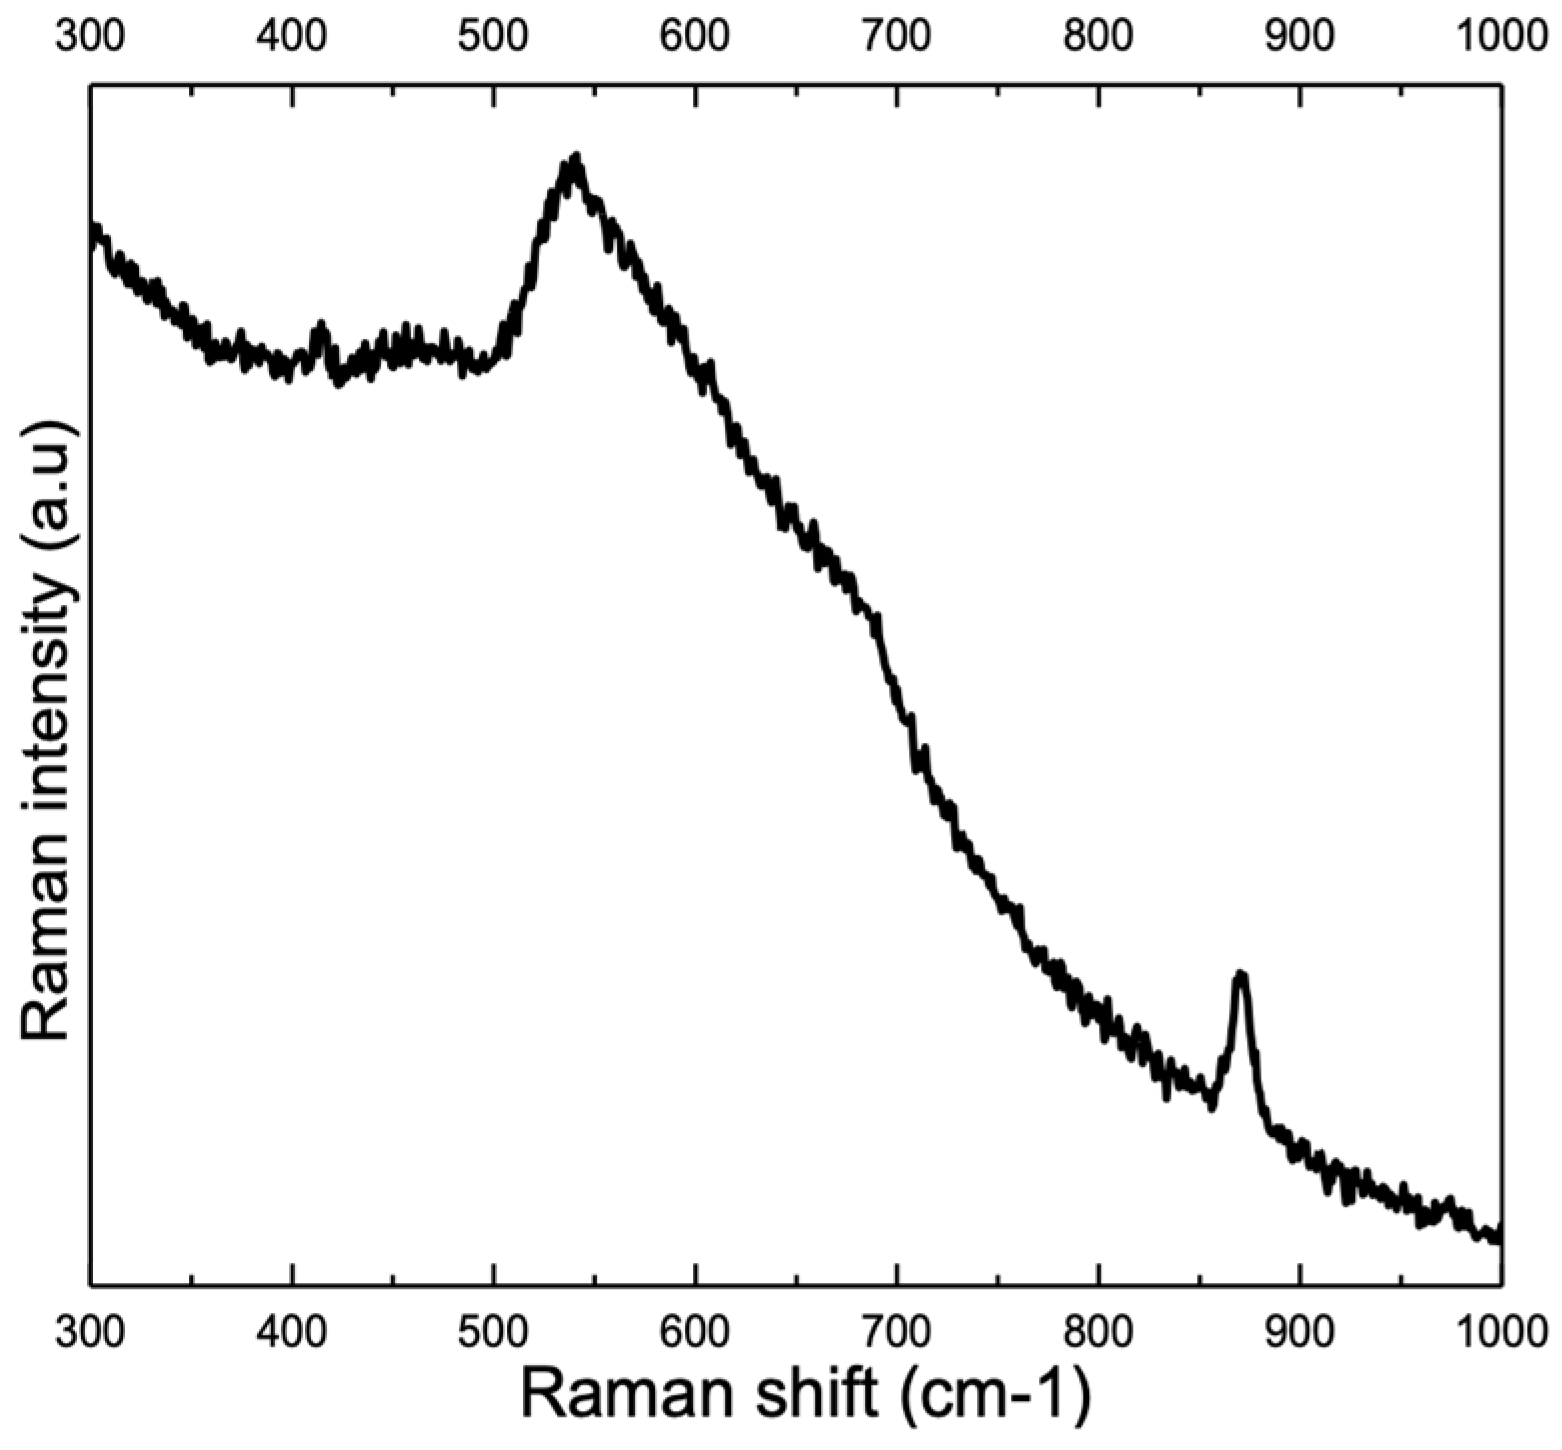
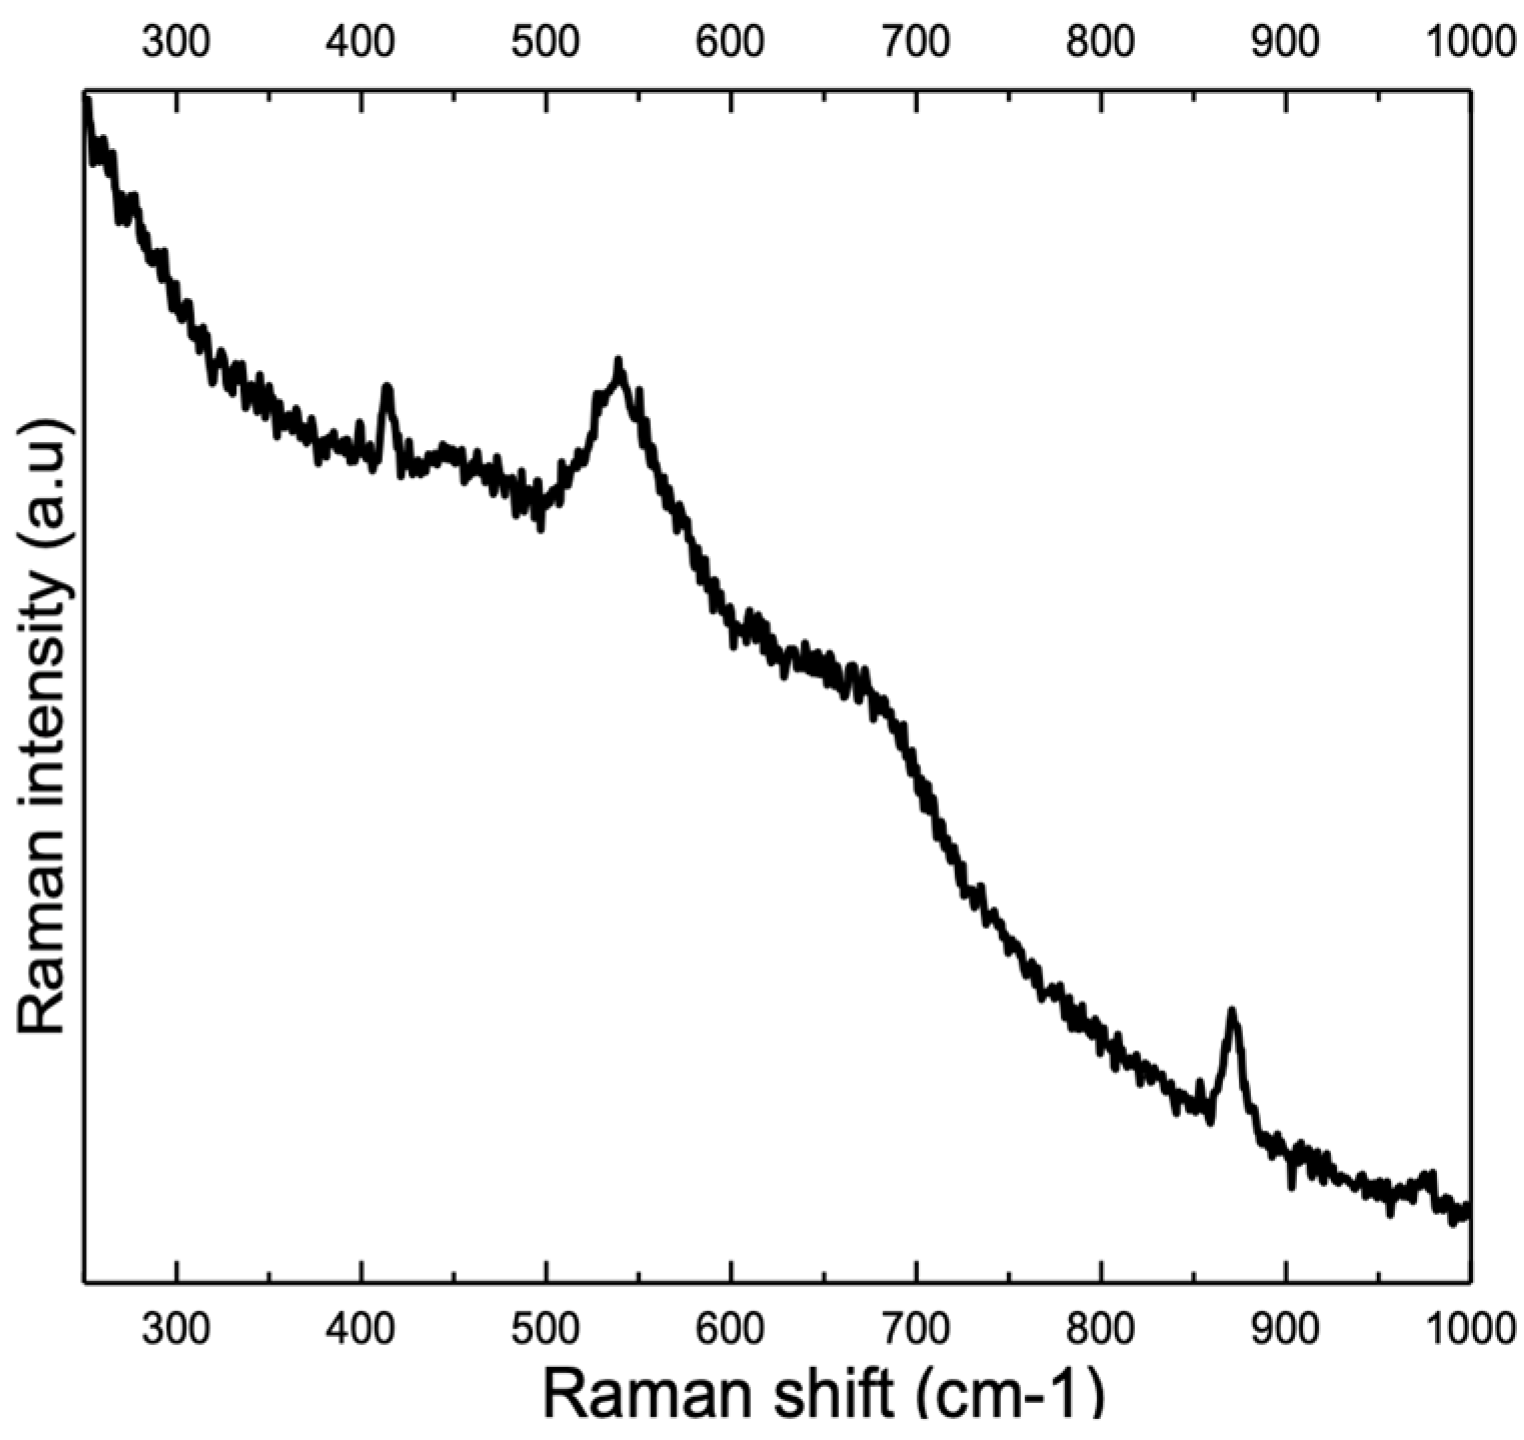
  • The SERS background has a significant effect on the location, size, and shape of the Raman peaks of the surface films. In addition, The SERS background impairs analyses of surface films by swamping the intensities of secondary peaks in the SER spectra of Cr2O3 and CrOOH. Work on how to remove the SERS background is required in order to extract more information from the SER spectra about the structure and composition of the surface films.
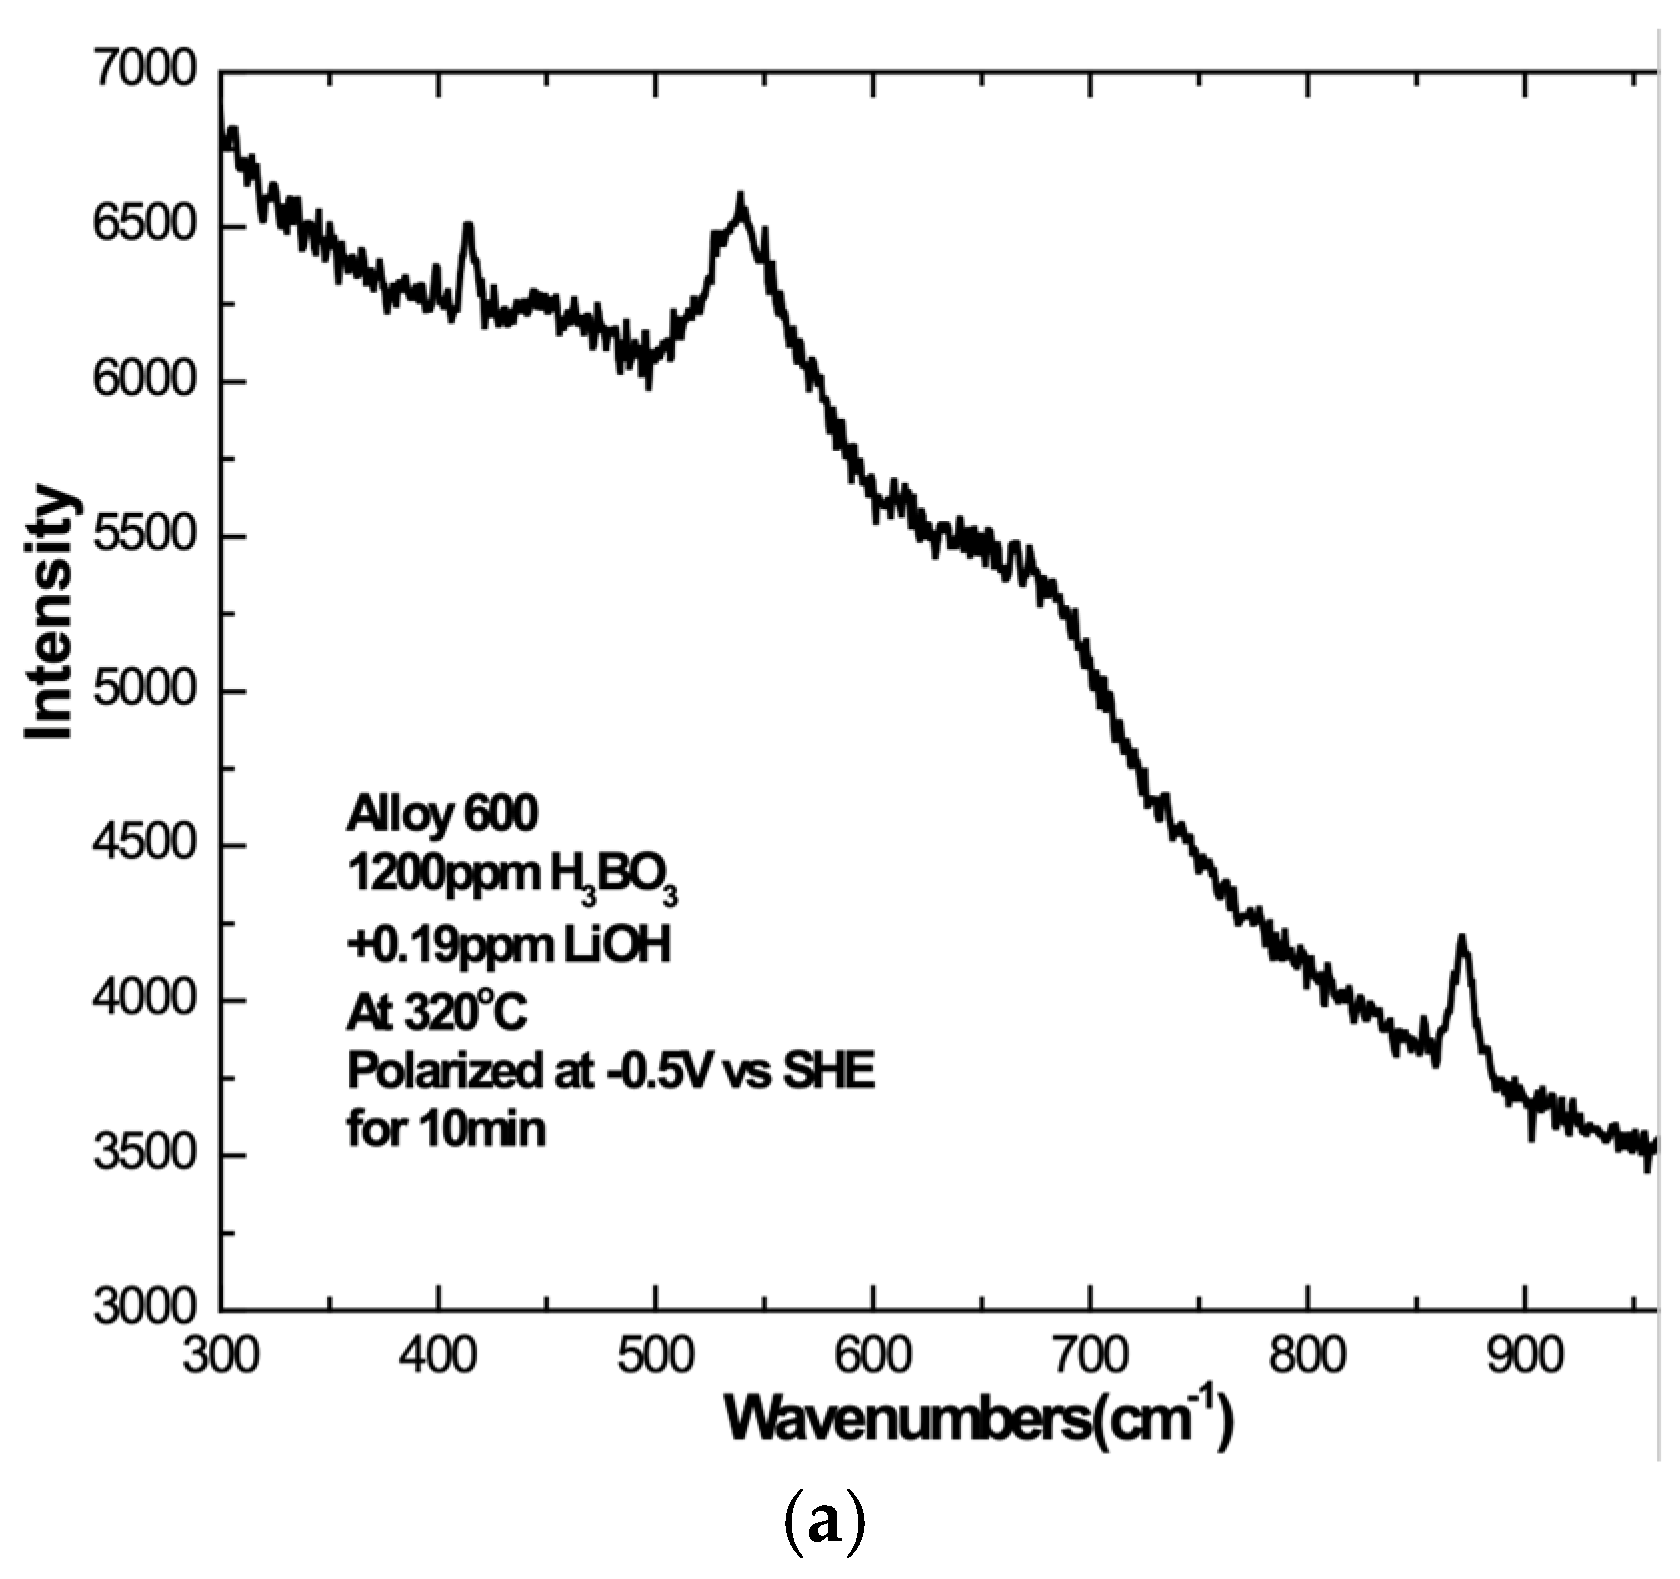
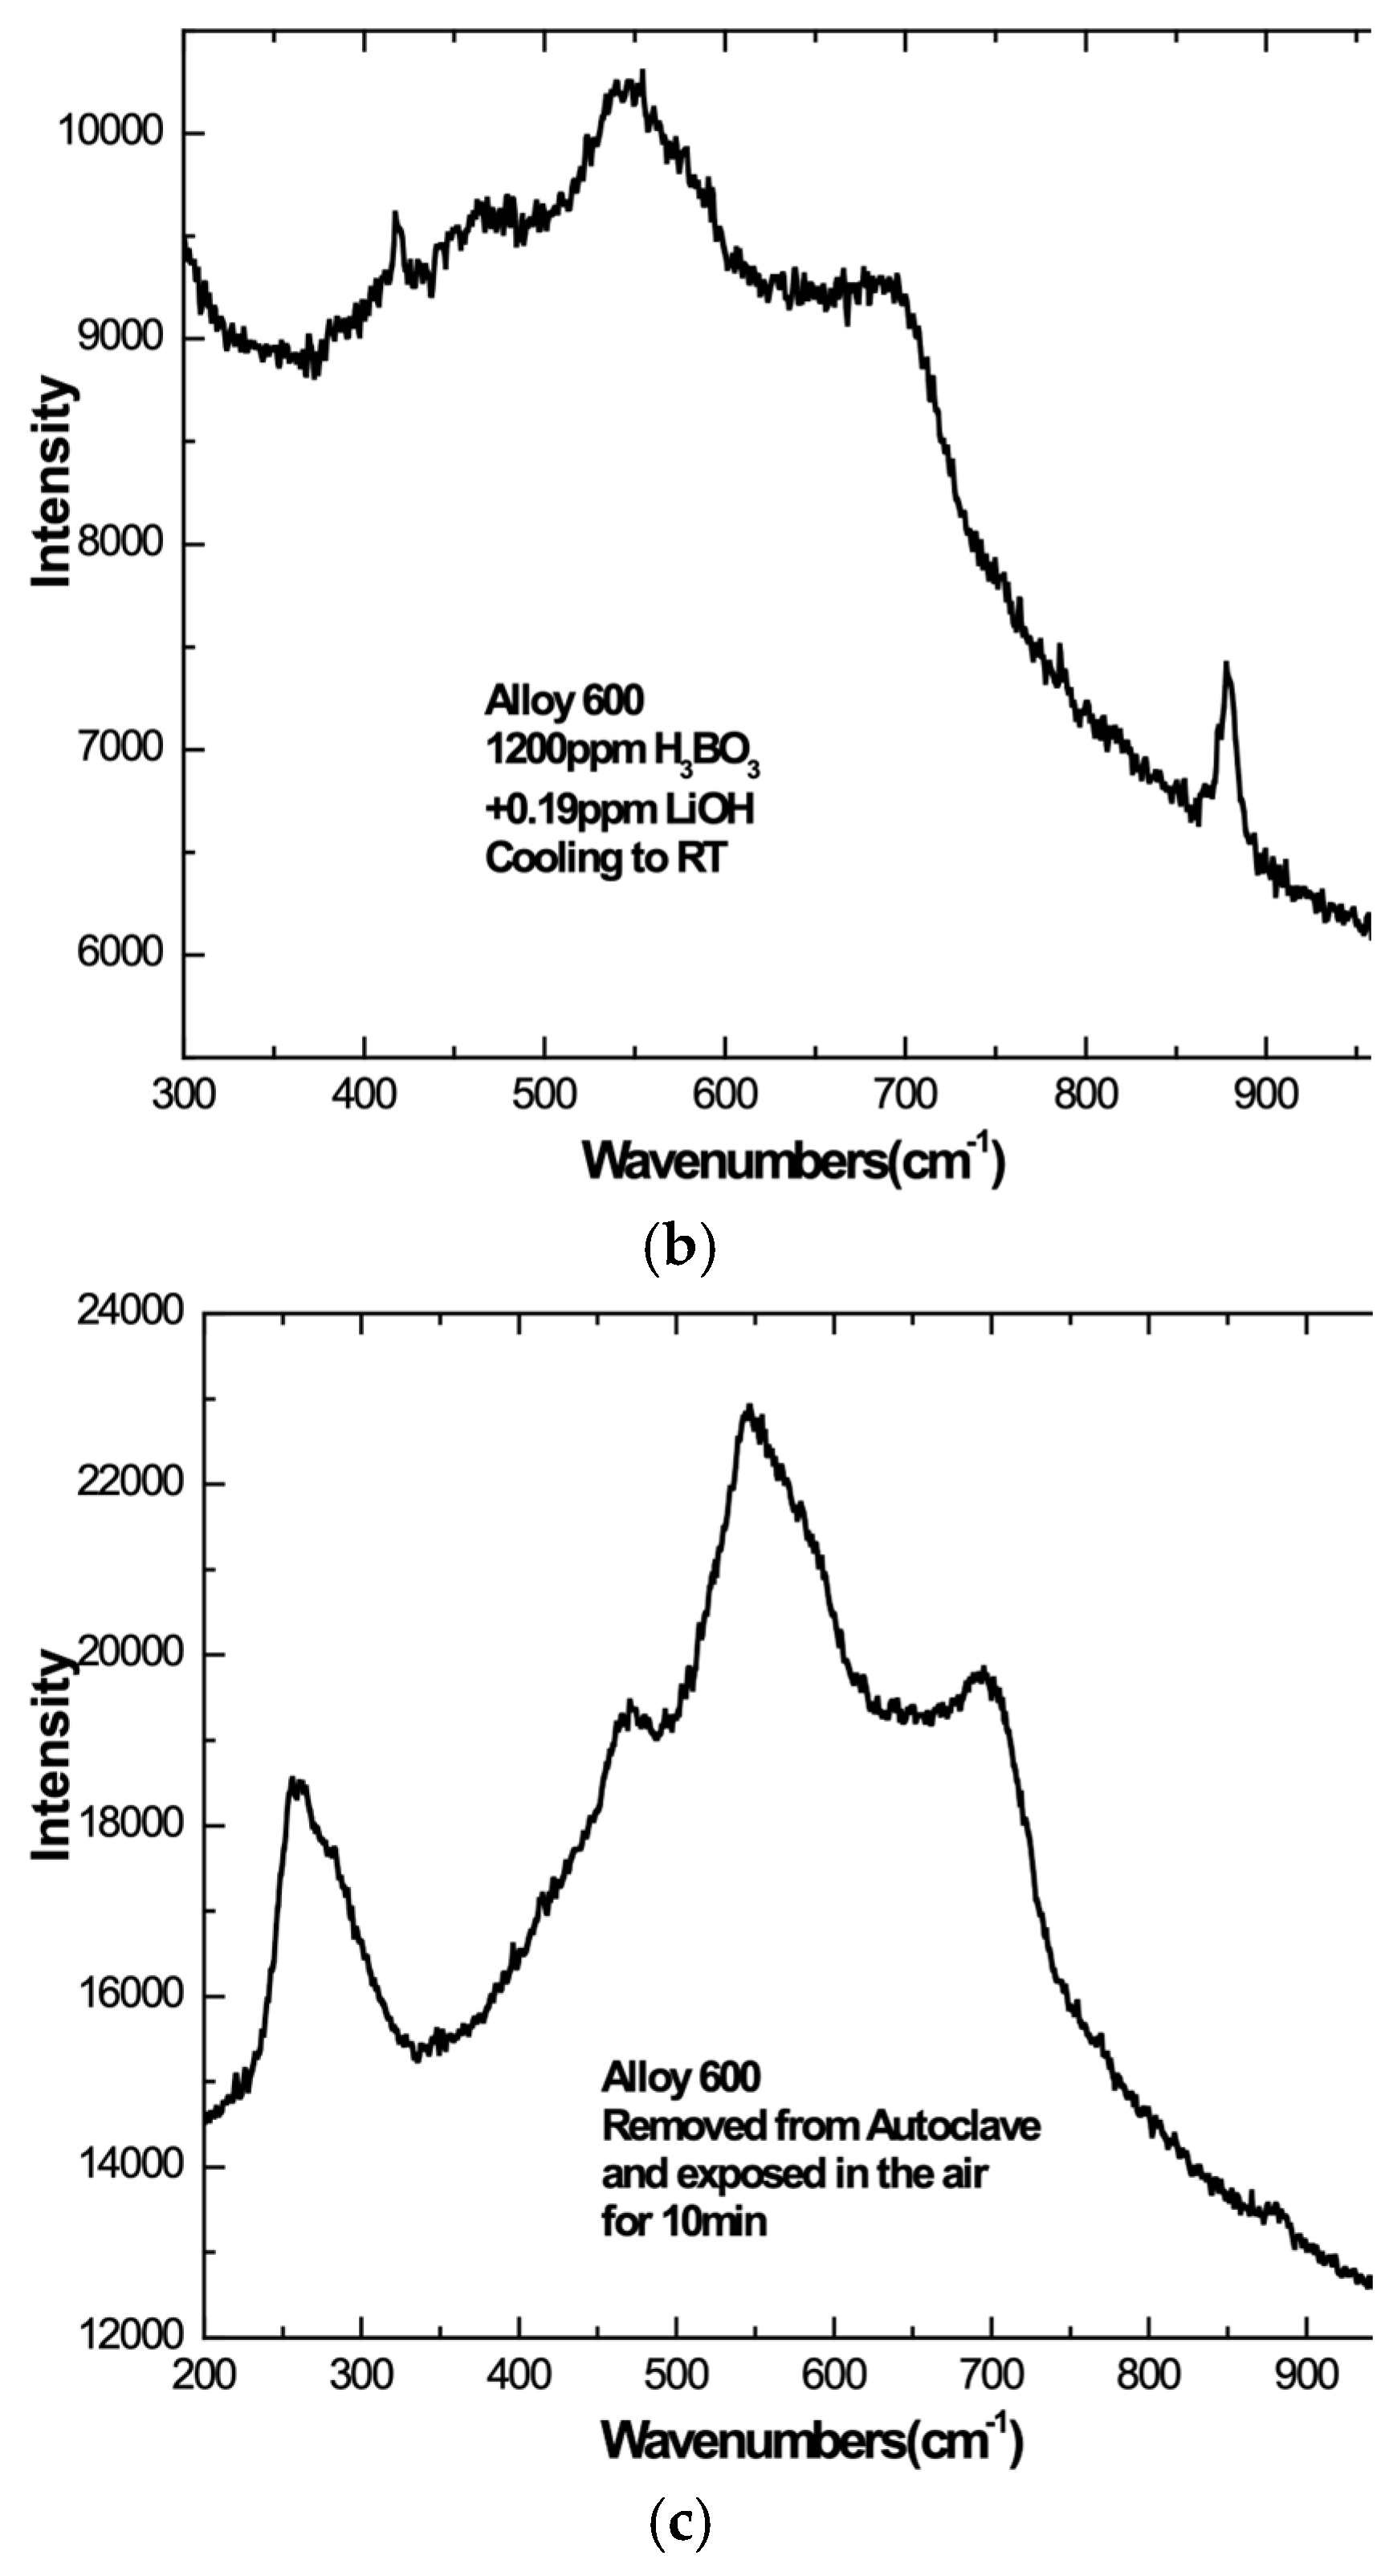
  • Comparison of in situ and ex situ SER spectra yielded mixed results. In some cases, air exposure caused significant change to the SER spectrum of surface films formed in PWR PW at 320 °C.
  • SERS is most effective when used in combination with other tools for investigating surface films such as scanning electron microscopy, transmission electron microscopy, and electrochemical impedance spectroscopy.

Author Contributions

Conceptualization, T.M.D.; measurements of SERS, F.W.; data analyses, T.M.D. and F.W.; writing—original draft and editing, T.M.D.; supervision, T.M.D.; funding acquisition, T.M.D. All authors have read and agreed to the published version of the manuscript.

Funding

This research was funded by the Electric Power Research Institute (EPRI), Palo Alto, CA, USA; (project managers John Hickling, Raj Pathania, and Peter Chou).

Data Availability Statement

Complete set of data is available in the PhD thesis of F.W: “In Situ Surface Enhanced Raman Spectroscopy Investigation of the Surface Films on Alloy 600 and Alloy 690 in Pressurized Water Reactor-Primary Water”, Feng Wang, May 2012, Graduate Division, Department of Materials Science and Engineering, University of California, Berkeley, CA 94720, USA.

Acknowledgments

We are grateful for the many technical contributions of Christopher Kumai and several helpful discussions with Peter Andresen of GE GRC.

Conflicts of Interest

The authors declare no conflict of interest.

Appendix A. Surface-Enhanced Raman Spectroscopy

Conventional Raman spectroscopy is a powerful technique for investigating the structure and bonding of solids [43]. It is based on the inelastic scattering of light. The inelastically scattered radiation forms the Raman spectrum, which serves as a fingerprint of the sample. There are a number of advantages to investigating corrosion products by Raman spectroscopy. First, the Raman spectrum is generated by reflecting a laser beam off the surface of the corroding sample. Since most aqueous solutions are optically transparent, the Raman spectrum can be measured on the sample as it corrodes. It is not necessary to remove the sample from the solution, dry it, and investigate it in a vacuum chamber, such as is required for investigating the films by electron microscopy. A second advantage of Raman spectroscopy is that amorphous solids as well as crystalline solids can be Raman active. Third, metals are not Raman active, so the SER spectrum of a surface film is not swamped by a signal from the large mass of metal that serves as the film’s substrate. Fourth, the Raman spectrum can be acquired from a roughened surface, which is often the state of a corroding surface. Other optical techniques such as ellipsometry require a highly polished surface.
The main limitation of Raman spectroscopy is the low intensity of Raman scattered radiation. The low intensity is generally addressed by studying thick surface films, which is not possible with passive films. The drawback of low Raman intensity is addressed by surface-enhanced Raman spectroscopy (SERS) [44,45]. In our earlier SERS studies of passive films and in the present research, we electrodeposit submicron-sized particles of gold on the surface of the alloy of interest [21,24,46,47,48]. The incident laser beam excites surface plasmons of the gold particles. There is an intense electric field associated with the surface plasmons that greatly enhances the intensity of Raman scattering of the passive film in the vicinity of the gold particles. Because the potential of our sample is controlled with a potentiostat, there is no galvanic effect of the gold particles, which, therefore, act as inert Raman antennae. Two examples of the power of SERS to investigate in situ passive films are the SERS of the passive film of iron growing on a bare surface in a borate buffer at room temperature [24], and the in situ passive films of iron [47] and stainless steel [48] in simulated high-purity water of Boiling Water Nuclear Reactors at 288 °C.

Appendix B. Reversible Hydrogen Reference Electrode

A 0.05 mm diameter Pt wire (99.95% metal basis) is used as the substrate for our reference electrode. The aqueous solution is saturated with forming gas (96%N2, 4%H2) and the hydrogen oxidation–reduction couple serves as the reversible hydrogen reference electrode:
2H+ + 2e ⇔ H2
The equilibrium potential for the reversible hydrogen reference electrode is calculated using the Nernst equation and following the procedure of Kim and Macdonald [49].
Δ ϕ e = Δ ϕ e o RT zF ln f H 2 H + 2 = Δ ϕ e o 2.303 RT F pH RT 2 F lnf H 2
Δ ϕ e o is the standard reduction potential ( Δ ϕ e o = 0.0 V vs. SHE for this half-cell reaction at all temperatures); R is gas constant; T is the temperature in Kelvin; z is the number of electrons transferred in the overall reaction (z = 2 in this reaction); F is Faraday’s constant; f H 2 is the fugacity of H2; [H+] is the concentration of H+ (pH320 °C = 7.28 for the solution using PWR-ELECTROCHEM (2009) code developed by D.D. Macdonald and H. Kim [49]).
The fugacity of H2 is calculated using the temperature-dependent Henry’s law [49],
m H 2 T = K H T f H 2 T = K H T 0 f H 2 T 0
where KH is Henry’s law constant in mol/kg-atm, f H 2 T 0 is the fugacity of H2 in the standard state, and f H 2 T is the temperature-dependent fugacity. Henry’s law constant for H2 in water as a function of temperature is given as [49].
log K H 2 T = 1321 T 10.703 + 0.010468 × T
The fugacity of H2 at temperature T in the solution is calculated as
f H 2 T = K H T 0 K H T f H 2 T 0 K H T 0 K H T P H 2
where P H 2 is the dissolved hydrogen gas pressure. The forming gas pressure is controlled at 6 bar = 0.2369 atm = 2.4 × 10⁻² MPa. The fugacity of H2 at 320 °C is 0.031 atm.
Making the appropriate substitutions into the Nernst equation yields an equilibrium potential of −0.723 V vs. SHE for the reversible hydrogen electrode in our tests conducted at 320 °C in simulated PWR PW.
Δ ϕ e - 320 ° C = 0.723 V   vs   SHE

Appendix C. SERS Background Subtraction

Identification of the components that make up a surface film is based on the locations and widths of the peaks in the SER spectra. The precise peak locations and widths require the removal of the background. Because of the close locations of many of the peaks of interest (e.g., 540 cm−1 and 580 cm−1) and because of the relatively low intensity of the SERS background at 320 °C, a simple and approximate background was constructed by drawing a tangent to the spectrum on either side of the peaks.
ORIGINLAB software was used to identify multiple peaks by peak fitting. To fit the broad peak, a Gaussian-type function was chosen. The number of peaks was selected and input into the program. Then, a value of Full Width Half Height (FWHH) was assigned to the ORIGINLAB software. The program then runs a peak fitting program and iterates these peaks until the best fitting is achieved. The statistics of peak fitting were recorded and the value of R2 characterized the quality of the peak fitting.
Upon cooling to room temperature the intensity of the SERS enhancement increases significantly. The greater intensity at room temperature of the SERS of the surface films of Alloy 600 and Alloy 690 compared to the intensity at 320 °C is demonstrated by the spectra presented in Figure 15a–c and Figure 16a–c. The temperature dependency of SERS has been known for some time [38,39,40]. Accompanying the large SERS enhancement is a significant increase in the intensity of the SERS background. Although the greater SERS enhancement at room temperature makes it easier to detect the individual peaks, the SERS background makes it more difficult to identify the precise location, shape, and integrated intensity of each individual peak.
The removal of the SERS background is challenging because its precise shape is not known. Briefly, the SERS background is a broad, asymmetric peak that in our SERS studies of surface oxides can exhibit significant intensity from approximately 200 cm−1 to over 700 cm−1 (i.e., the SERS background looks like an asymmetric bump) although theoretically, the background can extend over a much wider range [43,44,50].
One possible approach to SERS background removal is the use of wavelet transforms [42]. We have conducted a significant but preliminary attempt to use wavelets to emulate the SERS background. Although the use of wavelets is mathematically justified, at this time we are not satisfied that there is a unique background that can be created by wavelets. What is needed is a mechanism-based methodology for generating the SERS background. To the best of our knowledge, the fundamental understanding of the SERS background is not yet sufficient to generate a quantitative expression of the background that could be subtracted from the measured SER spectrum.
Models of SERS and of the SERS background consider adsorption of Raman-active molecules on SERS-active substrates (e.g., roughened surfaces of silver and gold and nanoparticles of silver and gold). According to several mechanisms, the SERS background is associated with the “electronic Raman” [45] of the nanostructured gold (or silver). These models have not explicitly considered the case in which the SERS-active species is a thin solid film such as the passive films of Ni-Cr-Fe alloys. Because the SERS background is associated with gold, the background should be similar to the case of an adsorbed molecule and a solid oxide.
Empirical approaches to SERS background removal might be fruitful. For example, there are optical techniques that attempt to decrease the background [51].
Importantly, while the SERS background is increased by the adsorbed molecules, the background is still present in the absence of the adsorbate [45]. We are currently attempting to develop experimental techniques that will enable subtraction of the SERS background by exploiting the fact that the background persists in the absence of the surface films.
In summary, at this time, a simple background constructed by drawing a tangent to the measured spectrum is adequate for identifying the locations and shapes of the overlapping peaks at 540 cm−1 and 580 cm−1.
Finally, in deconvoluting the measured SER spectra we assume Gaussian peaks. Theoretically, a Raman peak is a Lorentzian but the effects of factors such as small grain size, stress, and stoichiometry are best addressed by the use of Gaussians.

References

  1. Young, B.A.; Gao, X.; Srivatsan, T.S.; King, P.J. The Response of Alloy 690 Tubing in a Pressurized Water Reactor Environment. Mater. Des. 2007, 28, 373–379. [Google Scholar] [CrossRef]
  2. Grimmel, B.U.S. Plant Experience with Alloy 600 Cracking and Boric Acid Corrosion of Light-Water Reactor Pressure Vessel Materials; U.S. Nuclear Regulatory Commission Report NUREG1823; U.S. Nuclear Regulatory Commission: Washington, DC, USA, 2005.
  3. Jeon, S.-H.; Song, G.D.; Hur, D.H. Effects of Hydrogen Contents on Oxidation Behavior of Alloy 690TT and Associated Boron Accumulation within Oxides in High-Temperature Water. Scanning 2018, 2018, 7845176. [Google Scholar] [CrossRef] [PubMed]
  4. Scott, P.; Combrade, P. General Corrosion and Stress Corrosion Cracking of Alloy 600 in Lighht Water Reactor Primary Coolants. J. Nucl. Mater. 2019, 524, 340–375. [Google Scholar] [CrossRef]
  5. Machet, A.; Galtayries, A.; Marcus, P.; Combrade, P.; Scott, P. XPS Study of Oxides Formed on Nickel-Base Alloys in High-Temperature and High-Pressure Water. Surf. Interface Anal. 2002, 34, 197–200. [Google Scholar] [CrossRef]
  6. Jiang, Y.; Bustillo, K.C.; Devine, T.M. Investigation via Electron Microscopy and Electrochemical Impedance Spectroscopy of the Effect of Aqueous Zinc Ions on Passivity and the Surface Films of Alloy 600 in PWR PW at 320 °C. Corros. Mater. Degrad. 2023, 4, 54–89. [Google Scholar] [CrossRef]
  7. Ziemniak, S.E.; Hanson, M. Corrosion behavior of NiCrFe Alloy 600 in high temperature, hydrogenated water. Corros. Sci. 2006, 48, 498–521. [Google Scholar] [CrossRef]
  8. Terachi, T.; Totsuka, N.; Yamada, T.; Nakagawa, T.; Deguchi, H.; Horiuchi, M.; Oshitani, M. Influence of Dissolved Hydrogen on Structure of Oxide Film on Alloy 600 Formed in Primary Water of Pressurized Water Reactors. J. Nucl. Sci. Technol. 2003, 40, 509–516. [Google Scholar] [CrossRef]
  9. Panter, J.; Viguier, B.; Cloué, J.M.; Foucault, M.; Combrade, P.; Andrieu, E. Influence of oxide films on primary water stress corrosion cracking initiation of alloy 600. J. Nucl. Mater. 2006, 348, 213–221. [Google Scholar] [CrossRef]
  10. Combrade, P.; Scott, P.M.; Foucault, M.; Andrieu, E.; Marcus, P. Oxidation of Ni Base Alloys in PWR Water: Oxide Layers and Associated Damage to the Base Metal. In Proceedings of the 12th International Conference on Environmental Degradation of Materials in Nuclear Power System—Water Reactors, Salt Lake City, UT, USA, 14–18 August 2005; Allen, T.R., King, P.J., Nelson, L., Eds.; TMS (The Minerals, Metals & Materials Society): Pittsburgh, PA, USA; pp. 883–890. [Google Scholar]
  11. Morton, D.; Lewis, N.; Hanson, M.; Rice, S.; Sanders, P. Nickel Alloy Primary Water Bulk Surface and SCC Corrosion Film Analytical Characterization and SCC Mechanistic Implications; Lockheed-Martin Research Report, LM-07K022; Lockheed-Martin: Niskayuna, NY, USA, 2007. [Google Scholar]
  12. Delabrouille, F.; Legras, L.; Vaillant, F.; Scott, P.; Viguier, B.; Andrieu, E. Effect of the Chromium Content and Strain on the Corrosion of Nickel Based Alloys in Primary Water of Pressurized Water Reactors. In Proceedings of the 12th International Conference on Environmental Degradation of Materials in Nuclear Power System—Water Reactors, Salt Lake City, UT, USA, 14–18 August 2005; Allen, T.R., King, P.J., Nelson, L., Eds.; TMS (The Minerals, Metals & Materials Society): Pittsburgh, PA, USA; pp. 903–911. [Google Scholar]
  13. Kim, J.H.; Hwang, I.S. In-situ Raman Spectroscopic Study of Oxide Films on Alloy 600 in Simulated PWR Water. In Proceedings of the 11th International Conference on Environmental Degradation of Materials in Nuclear Systems—Water Reactors, Colorado Springs, CO, USA, 7–11 August 2011. [Google Scholar]
  14. James, R.O.; Healy, T.W. Adsorption of Hydrolyzable Metal Ions at the Oxide-Water Interface, Part I. J. Colloid Interface Sci. 1972, 40, 42–52. [Google Scholar] [CrossRef]
  15. James, R.O.; Healy, T.W. Adsorption of Hydrolyzable Metal Ions at the Oxide-Water Interface, Part II. J. Colloid Interface Sci. 1972, 40, 53–64. [Google Scholar] [CrossRef]
  16. James, R.O.; Healy, T.W. Adsorption of Hydrolyzable Metal Ions at the Oxide-Water Interface, Part III. J. Colloid Interface Sci. 1972, 40, 65–81. [Google Scholar] [CrossRef]
  17. Sten, P.; Puhakka, E.; Ikavalko, E.; Lehikoinen, J.; Olin, M.; Sirkia, P.; Kinnunen, P.; Laitinen, T. Adsorption Studies on Iron Oxides with Reference to the Oxide Films Formed on Materials Surfaces in Nuclear Power Plants; VTT Research Notes 2182; VTT Technical Research Center of Finland: Espoo, Finland, 2002. [Google Scholar]
  18. Radiation Protection Aspects of Primary Water Chemistry and Source Term Management, Radiological Protection, NEA/CRPPH/R(2014)2, July 2014. Available online: www.oecd-nea.org (accessed on 15 December 2024).
  19. Mintz, T.S. An In-Situ Investigation of the Passive Film on Stainless Steel and Inconel 600 in High Temperature, Pressurized, Impurity Containing Water. Ph.D. Thesis, University of California, Berkeley, CA, USA, 2003. [Google Scholar]
  20. Voyshnis, S.; Seyeux, A.; Zanna, S.; Martin-Cabanas, B.B.; Couvant, T.; Marcus, P. Oxide Layer Growth on Nickel-base Alloy Surfaces in High Temperature Water and in O2 Studied by ToF-SIMS with Isotropic Tracers. Corros. Sci. 2018, 145, 212–219. [Google Scholar] [CrossRef]
  21. Gui, J.; Devine, T.M. The Influence of Sulfate Ions on the Surface Enhanced Raman Spectra of Passive Films Formed on Iron. Corros. Sci. 1994, 36, 441–462. [Google Scholar] [CrossRef]
  22. Futamata, M.; Ishikura, M.; Iida, C.; Handa, S. The Critical Importance of Gap Modes in Surface Enhanced Raman Scattering. Faraday Discuss. 2015, 178, 203–220. [Google Scholar] [CrossRef]
  23. Karn-Orachai, K. Gap-Dependent Surface-Enhanced Raman Scattering (SERS) Enhancement Model of SERS Substrate–Probe Combination Using a Polyelectrolyte Nanodroplet as a Distance Controller. Langmuir 2021, 37, 10776–10785. [Google Scholar] [CrossRef] [PubMed]
  24. Schroeder, V.; Devine, T.M. SERS during the Galvanostatic Reduction of the Passive Film on Iron. J. Electrochem. Soc. 1999, 146, 4061–4070. [Google Scholar] [CrossRef]
  25. Porto, S.P.S.; Krishnan, R.S. Raman Effect of Corundum. J. Chem. Phys. 1967, 47, 1009–1012. [Google Scholar] [CrossRef]
  26. Oblonsky, L.J.; Devine, T.M. SERS from the Films Formed on Nickel in the Passive and Transpassive Regions. J. Electrochem. Soc. 1995, 142, 3677–3682. [Google Scholar] [CrossRef]
  27. Dietz, R.E.; Parisot, G.I.; Meixner, A.E. Infrared Absorption and Raman Scattering by Two-Magnon Processes in NiO. Phys. Rev. B Condens. Matter 1971, 4, 2302. [Google Scholar] [CrossRef]
  28. Maslar, J.E.; Hurst, W.S.; Bowers, W.J.; Hendricks, J.H., Jr.; Aquino, M.I. In Situ Raman Spectroscopic Investigation of Nickel Hydrothermal Corrosion. Corrosion 2002, 58, 225–231. [Google Scholar] [CrossRef]
  29. Melendres, C.A.; Xu, S. In situ Laser Raman Spectroscopic Study of Anodic Corrosion Films on Nickel and Cobalt. J. Electrochem. Soc. 1984, 131, 2239–2243. [Google Scholar] [CrossRef]
  30. Maslar, J.E.; Hurst, W.S.; Bowers, W.J.; Hendricks, J.H.; Aquina, M.J.; Levin, I. In-Situ Raman Spectroscopic Investigation of Chromium Surfaces under Hydrothermal Conditions. Appl. Surf. Sci. 2001, 180, 102–118. [Google Scholar] [CrossRef]
  31. Cubicciotti, D. Potential-pH Diagrams for Alloy-Water Systems. J. Nucl. Mater. 1993, 201, 176–183. [Google Scholar] [CrossRef]
  32. Hosterman, B.D. Raman Spectroscopic Study of Solid Solution Spinel Oxides. Ph.D. Thesis, Department of Physics, University of Nevada, Las Vegas, NV, USA, August 2011. [Google Scholar]
  33. Maslar, J.E.; Hurst, W.S.; Bowers, W.J.; Hendricks, J.H.; Windsor, E.S. Alloy 600 Aqueous Corrosion at Elevated Temperatures and Pressures: An In Situ Raman Spectroscopic Investigation. J. Electrochem. Soc. 2009, 156, C103–C113. [Google Scholar] [CrossRef]
  34. Yang, J.; Li, Y.; Macdonald, D.D. Effects of Temperature and pH on the Electrochemical Behavior of Alloy 600 in Simulated PWR Primary Water. J. Nucl. Mater. 2020, 528, 1–16. [Google Scholar] [CrossRef]
  35. Bojinov, M.; Kinnunen, P.; Sunduolm, G. Electrochemical Behavior of Nickel-Chromium Alloys in a High temperature Aqueous Electrolyte. Corrosion 2003, 59, 91–103. [Google Scholar] [CrossRef]
  36. Yang, J.; Li, Y.; Xu, A.; Fekete, B.; Macdonald, D.D. The Electrochemical properties of Alloy 690 in Simulated Pressurized Water Reactor Primary Water: Effect of Temperature. J. Nucl. Mater. 2019, 518, 305–315. [Google Scholar] [CrossRef]
  37. Kaufman, L. Pourbaix Diagrams of Ni-Cr-Fe Ternary Alloys; EPRI Report C13751A; Electric Power Research Institute: Palo Alto, CA, USA, 2009. [Google Scholar]
  38. Pang, Y.S.; Hwang, H.J.; Kim, M.S. Reversible Temperature Dependence in Surface-Enhanced Raman Scattering of 1-Propanethiol Adsorbed on a Silver Island Film. J. Phys. Chem. B 1998, 102, 7203–7209. [Google Scholar] [CrossRef]
  39. Chiang, H.P.; Leung, P.T.; Tse, W.S. Remarks on the Substrate-Temperature Dependence of Surface-Enhanced Raman Scattering. J. Phys. Chem. B 2000, 104, 2348–2350. [Google Scholar] [CrossRef]
  40. Kwon, C.H.; Boo, D.W.; Hwang, H.J.; Kim, M.S. Temperature Dependence and Annealing Effects in Surface-Enhanced Raman Scattering on Chemically Prepared Silver Island Films. J. Phys. Chem. B 1999, 103, 9610–9615. [Google Scholar] [CrossRef]
  41. Leung, P.T.; Hider, M.H.; Sanchez, E.J. Surface-enhanced Raman Scattering at Elevated Temperatures. Phys. Rev. B 1996, 53, 12659–12662. [Google Scholar] [CrossRef] [PubMed]
  42. Galloway, C.M.; Le Ru, E.C.; Etchegoin, P.G. An Iterative Algorithm for Background Removal in Spectroscopy by Wavelet Transforms. Appl. Spectrosc. 2009, 63, 1370–1376. [Google Scholar] [CrossRef]
  43. Devine, T.M.; Adar, F. Raman Spectrsocopy of Solids. In Characterization of Materials; Wiley & Sons: Hoboken, NJ, USA, 2012; ISBN 9780471268826. [Google Scholar]
  44. Moskovits, M. Surface-enhanced Spectroscopy. Rev. Mod. Phys. 1985, 57, 783–829. [Google Scholar] [CrossRef]
  45. Moskovits, M. Surface Enhanced Raman Spectroscopy: A brief retrospective. J. Raman Spectrosc. 2005, 36, 485–496. [Google Scholar] [CrossRef]
  46. Gui, J.; Devine, T.M. Use of Surface Enhanced Raman Scattering as an In-Situ Probe of the Metal-Aqueous Solution Interface; Corrosion ’91, Paper #79; NACE: Houston, TX, USA, 1991. [Google Scholar]
  47. Kumai, C.S.; Devine, T.M. Oxidation of Iron in Oxygen-Containing Water at 288 °C. Corrosion 2005, 61, 201. [Google Scholar] [CrossRef]
  48. Kumai, C.S.; Devine, T.M. Influence of Oxygen Concentration of 288 °C Water and Alloy Composition on the Films Formed on Fe-Ni-Cr Alloys. Corrosion 2007, 63, 1101. [Google Scholar] [CrossRef]
  49. Kim, H.; Macdonald, D.D. Measurement of Steady-State Hydrogen Electrode Reactions on Alloy 600 and Alloy 690 Tubes. Corros. Sci. 2010, 52, 1139–1145. [Google Scholar] [CrossRef]
  50. Mahajan, S.; Cole, R.M.; Speed, J.D.; Pelfrey, S.H.; Russell, A.E.; Bartlett, P.N.; Barnett, S.M.; Baumberg, J.J. Understanding the Surface-Enhanced Raman Spectroscopy “Background”. J. Phys. Chem. C 2010, 114, 7242–7250. [Google Scholar] [CrossRef]
  51. Praveen, B.B.; Steuwe, C.; Mazilu, M.; Dholakia, K.; Mahajan, S. Wavelength modulated surface enhanced (resonance) Raman scattering for background-free detection. Analyst 2013, 138, 2816–2820. [Google Scholar] [CrossRef]
Figure 1. Schematic of a high-temperature, high-pressure facility for in situ SERS of surface films.
Cmd 06 00016 g001
Figure 2. Macrophotograph of sealed titanium autoclave with sapphire window.
Cmd 06 00016 g002
Figure 3. SER spectrum of nickel sample measured in simulated PWR PW at 320 °C and at an applied potential of −650 mVSHE.
Cmd 06 00016 g003
Figure 4. (a) SER spectrum of chromium sample measured in simulated PWR PW at 320 °C and at an applied potential of −650 mVSHE. (b) SER spectrum of chromium after background subtraction and peak fitting.
Cmd 06 00016 g004
Figure 5. SER spectrum of Ni-10Cr sample measured in simulated PWR PW at 320 °C and at an applied potential of −650 mVSHE after background subtraction and peak fitting.
Cmd 06 00016 g005
Figure 6. SER spectrum of Ni-20Cr sample measured in simulated PWR PW at 320 °C and at an applied potential of −650 mVSHE after background subtraction and peak fitting.
Cmd 06 00016 g006
Figure 7. SER spectrum of Ni-5Cr-8Fe sample measured in simulated PWR PW at 320 °C and at an applied potential of −650 mVSHE after background subtraction and peak fitting.
Cmd 06 00016 g007
Figure 8. SER spectrum of Ni-10Cr-8Fe sample measured in simulated PWR PW at 320 °C and at an applied potential of −650 mVSHE after background subtraction and peak fitting.
Cmd 06 00016 g008
Figure 9. SER spectra of Alloy 600 sample measured in simulated PWR PW at 320 °C and at an applied potential of −650 mVSHE after background subtraction and peak fitting.
Cmd 06 00016 g009
Figure 10. SER spectrum of Alloy 690 sample measured in simulated PWR PW at 320 °C and at an applied potential of −650 mVSHE after background subtraction and peak fitting.
Cmd 06 00016 g010
Figure 11. SER spectrum of Alloy 600 sample measured in 2.0 ppm Li +1200 ppm B(OH)3 (pH 7.2) at 320 °C and at an applied potential of −500 mVSHE.
Cmd 06 00016 g011
Figure 12. SER spectrum of Alloy 600 sample measured in 0.19 ppm Li +1200 ppm B(OH)3 (pH 6.2) at 320 °C and at an applied potential of −500 mVSHE.
Cmd 06 00016 g012
Figure 13. SER spectrum of Alloy 690 sample measured in 2.0 ppm Li +1200 ppm B(OH)3 (pH 7.2) at 320 °C and at an applied potential of −500 mVSHE.
Cmd 06 00016 g013
Figure 14. SER spectrum of Alloy 690 sample measured in 0.19 ppm Li +1200 ppm B(OH)3 (pH 6.2) at 320 °C and at an applied potential of −500 mVSHE.
Cmd 06 00016 g014
Figure 15. (a) SER spectrum of Alloy 600 sample in PWR PW at 320 °C and an applied potential of −500 mVSHE. (b) SER spectrum of Alloy 600 in PWR PW after cooling to room temperature. (c) SER spectrum of Alloy 600 after removal to air.
Cmd 06 00016 g015aCmd 06 00016 g015b
Figure 16. (a) SER spectrum of Alloy 690 sample in PWR PW at 320 °C and an applied potential of −500 mVSHE. (b) SER spectrum of Alloy 690 sample in PWR PW after cooling to room temperature. (c) SER spectrum of Alloy 690 sample after removal from autoclave and exposure from autoclave and exposure to air.
Cmd 06 00016 g016aCmd 06 00016 g016b
Figure 17. Influence of the alloy’s chromium concentration on the ratio of the integrated intensity of the peak at 580–610 cm−1 to the integrated intensity of the peak at 540 cm−1. The error bars represent the SD except for Ni-10Cr and Ni-20Cr. The datum point for each of the two binary alloys is the average of two tests and the error bars represent the range of the two values.
Cmd 06 00016 g017
Table 1. Alloy 600’s passive film formed at high temperatures in PWR PW.
Titanium Autoclave
Inner LayerOuter LayerTemperature and Time of OxidationReference
Cr2O3Ni(OH)2325 °C/4–8 min[5] *
Cr2O3/CrOOHNiO whiskers320 °C/4 h[6] **
Stainless Steel Autoclaves
Inner layerOuter LayerTemperature and Time of OxidationReference
(Ni0.7Fe 0.3)(Fe0.3Cr0.7)23O4(Ni0.9Fe0.1)(Fe0.85Cr0.15)2O4260 °C 1000–10,000 h[7]
Cr-rich oxide(Ni,Cr,Fe)-spinel NiFe2O4320 °C/1000 h[8]
Cr-rich oxideNi(Cr,Fe)2O4 360 °C/300 h[9]
Cr2O3/(Fe,Ni)Cr2O4NiFe2O4360 °C/300 h[10]
Ni(Cr,Fe)2O4NiFe2O4338 °C/4000 h[11] ***
Cr-rich oxideNiFe2O4360 °C/1000 h[12]
Alloy 690 Autoclave: Alloy 600 Tubing
Inner layerOuter LayerTemperature and Time of OxidationReference
CrOOH Cr-oxideNiCr2O4 NiO70 h/350 °C[13]
* (Stainless Steel Water Tank); ** (Glass Water Tank); *** High-purity water (buffered to neutral pH at 338 °C) with 60 cc/KgH2.
Table 2. Compositions (wt.%) of Alloy 600 and Alloy 690.
Compositions (wt.%) of Alloy 600 and Alloy 690
AlloyNiCrFeMnCCuSiS
Alloy 600≥7214–176–10≤1≤0.15≤0.5≤0.5≤0.015
Alloy 690≥5827–317–11≤0.5≤0.05≤0.5≤0.5≤0.015
Table 3. Locations of peaks in SER spectra of surface films at −650 mVSHE in simulated PWR PW at 320 °C.
Ni538.0 cm−1 SD 2.7 cm−1
Cr541.8cm−1 SD 2.9 cm−1582.7 cm−1 SD 5.4 cm−1
Ni-10Cr *543.5 cm−1 ± 5.0 cm−1590.2 cm−1 ± 0 cm−1
Ni-20Cr *543.2 cm−1 ± 1.3 cm−1602.3 cm−1 ± 6.6 cm−1
Ni-5Cr-8Fe539.1 cm−1 SD 2.8 cm−1618.0 cm−1 SD 5.2 cm−1679.7 cm−1 **
Ni-10Cr-8Fe539.3 cm−1 SD 3.3 cm−1600.4 cm−1 SD 5.4 cm−1659.3 cm−1 SD 4.7 cm−1
Alloy 600538.5 cm−1 SD 1.8 cm−1611.5 cm−1 SD 4.9 cm−1684.0 cm−1 SD 9.2 cm−1
Alloy 690539.0 cm−1 SD 2.9 cm−1588.0 cm−1 SD 5.3 cm−1
* Averages and ranges of two samples; ** One measurement.
Disclaimer/Publisher’s Note: The statements, opinions and data contained in all publications are solely those of the individual author(s) and contributor(s) and not of MDPI and/or the editor(s). MDPI and/or the editor(s) disclaim responsibility for any injury to people or property resulting from any ideas, methods, instructions or products referred to in the content.

