

Corrosion Behavior of Fe-Ni Electrodeposited Coatings in Weak Ammonium Hydroxide Solution


Abstract
1. Introduction
2. Materials and Methods
2.1. Materials and Solutions
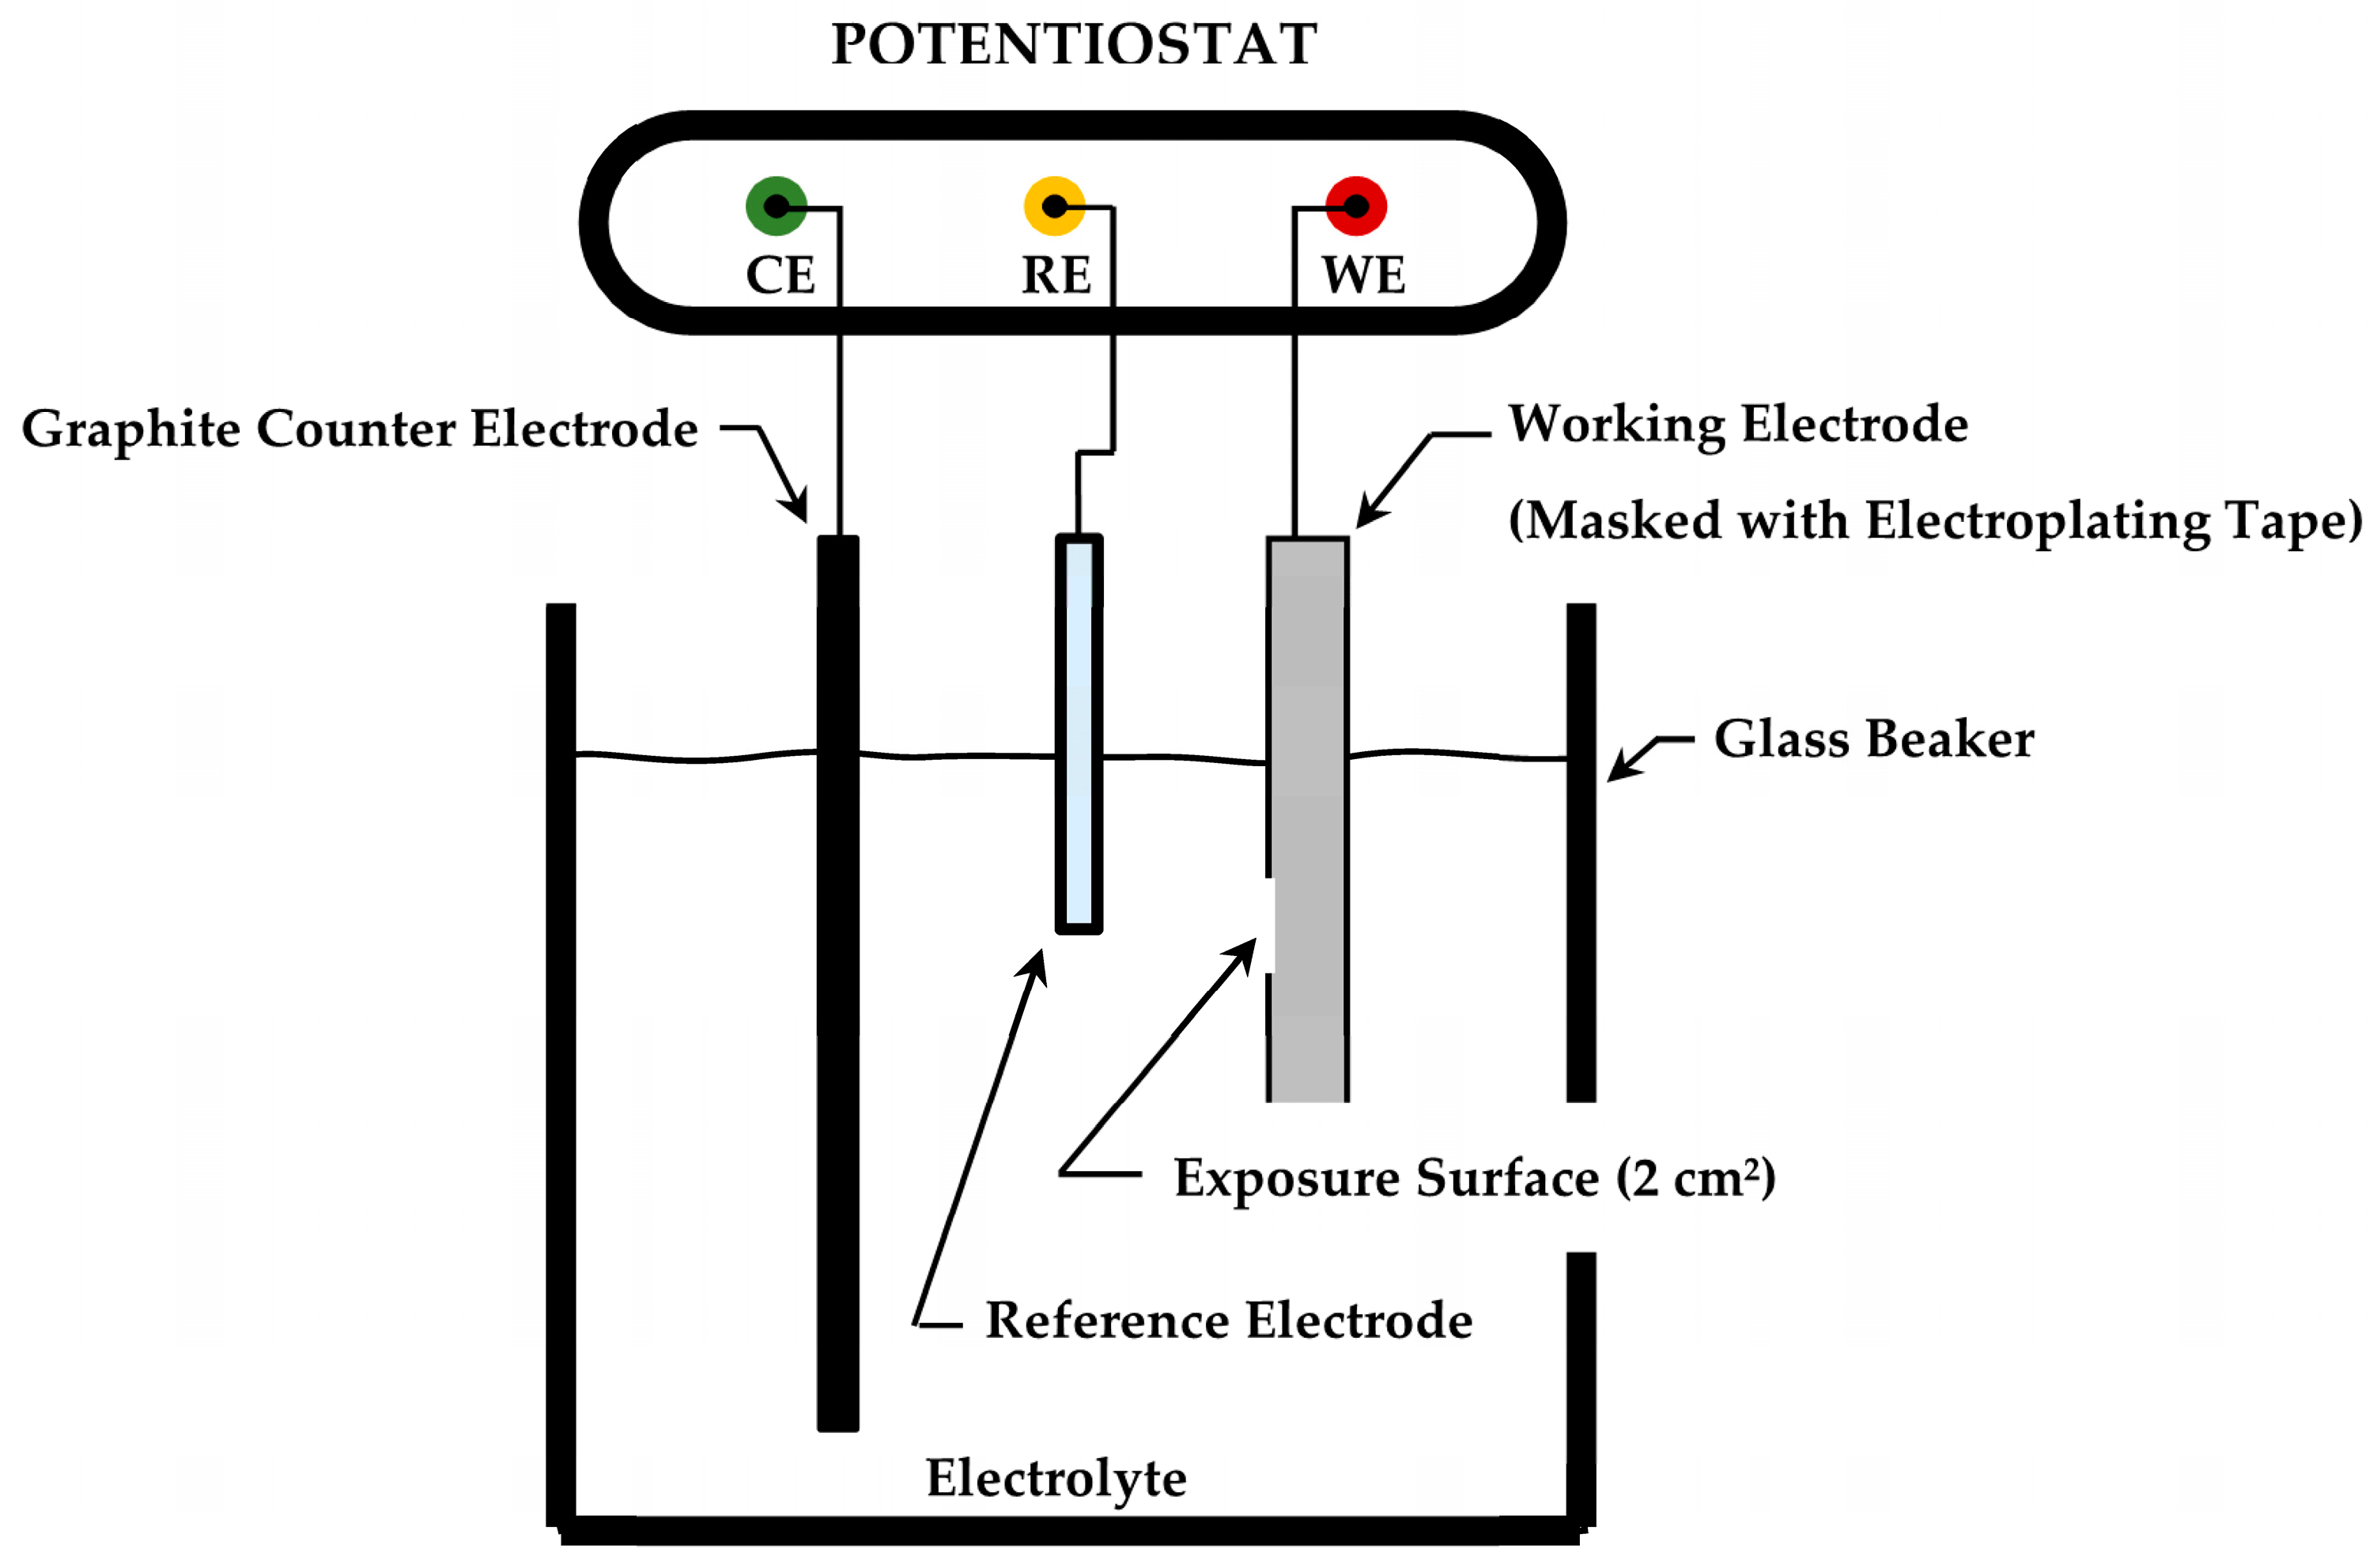
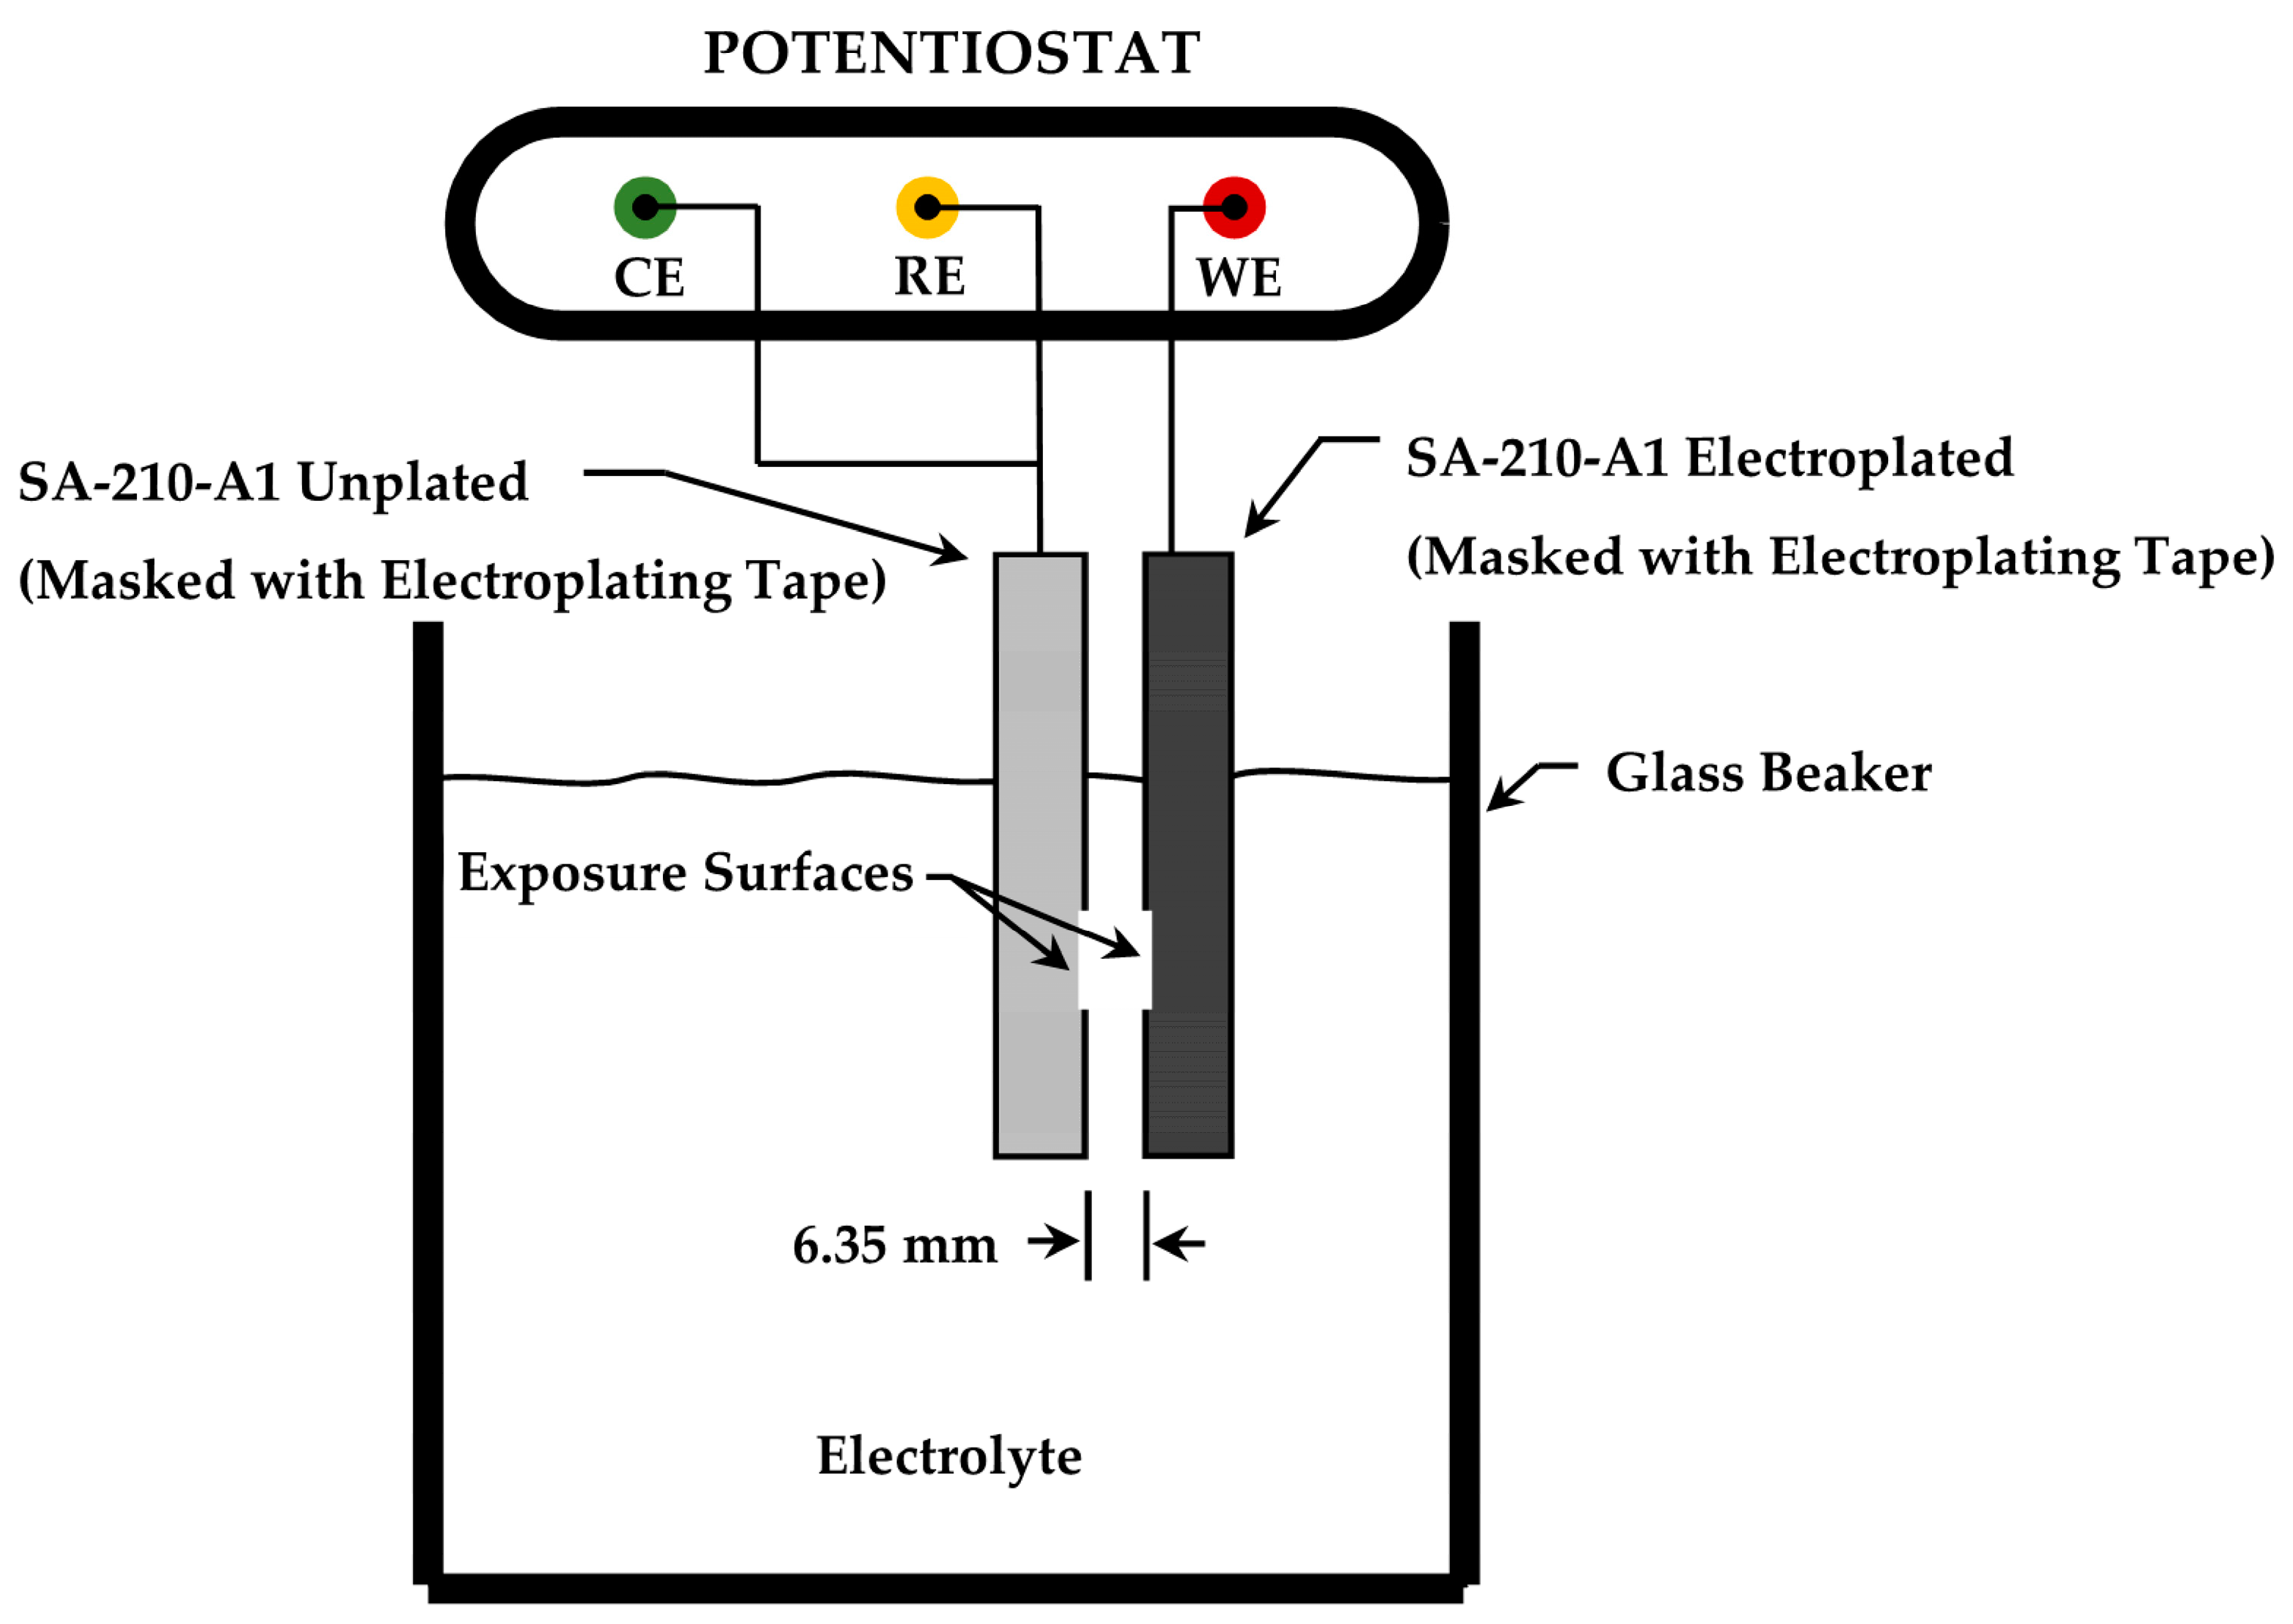
2.2. Corrosion-Electrochemical Investigations
2.3. Morphological Investigations
3. Results
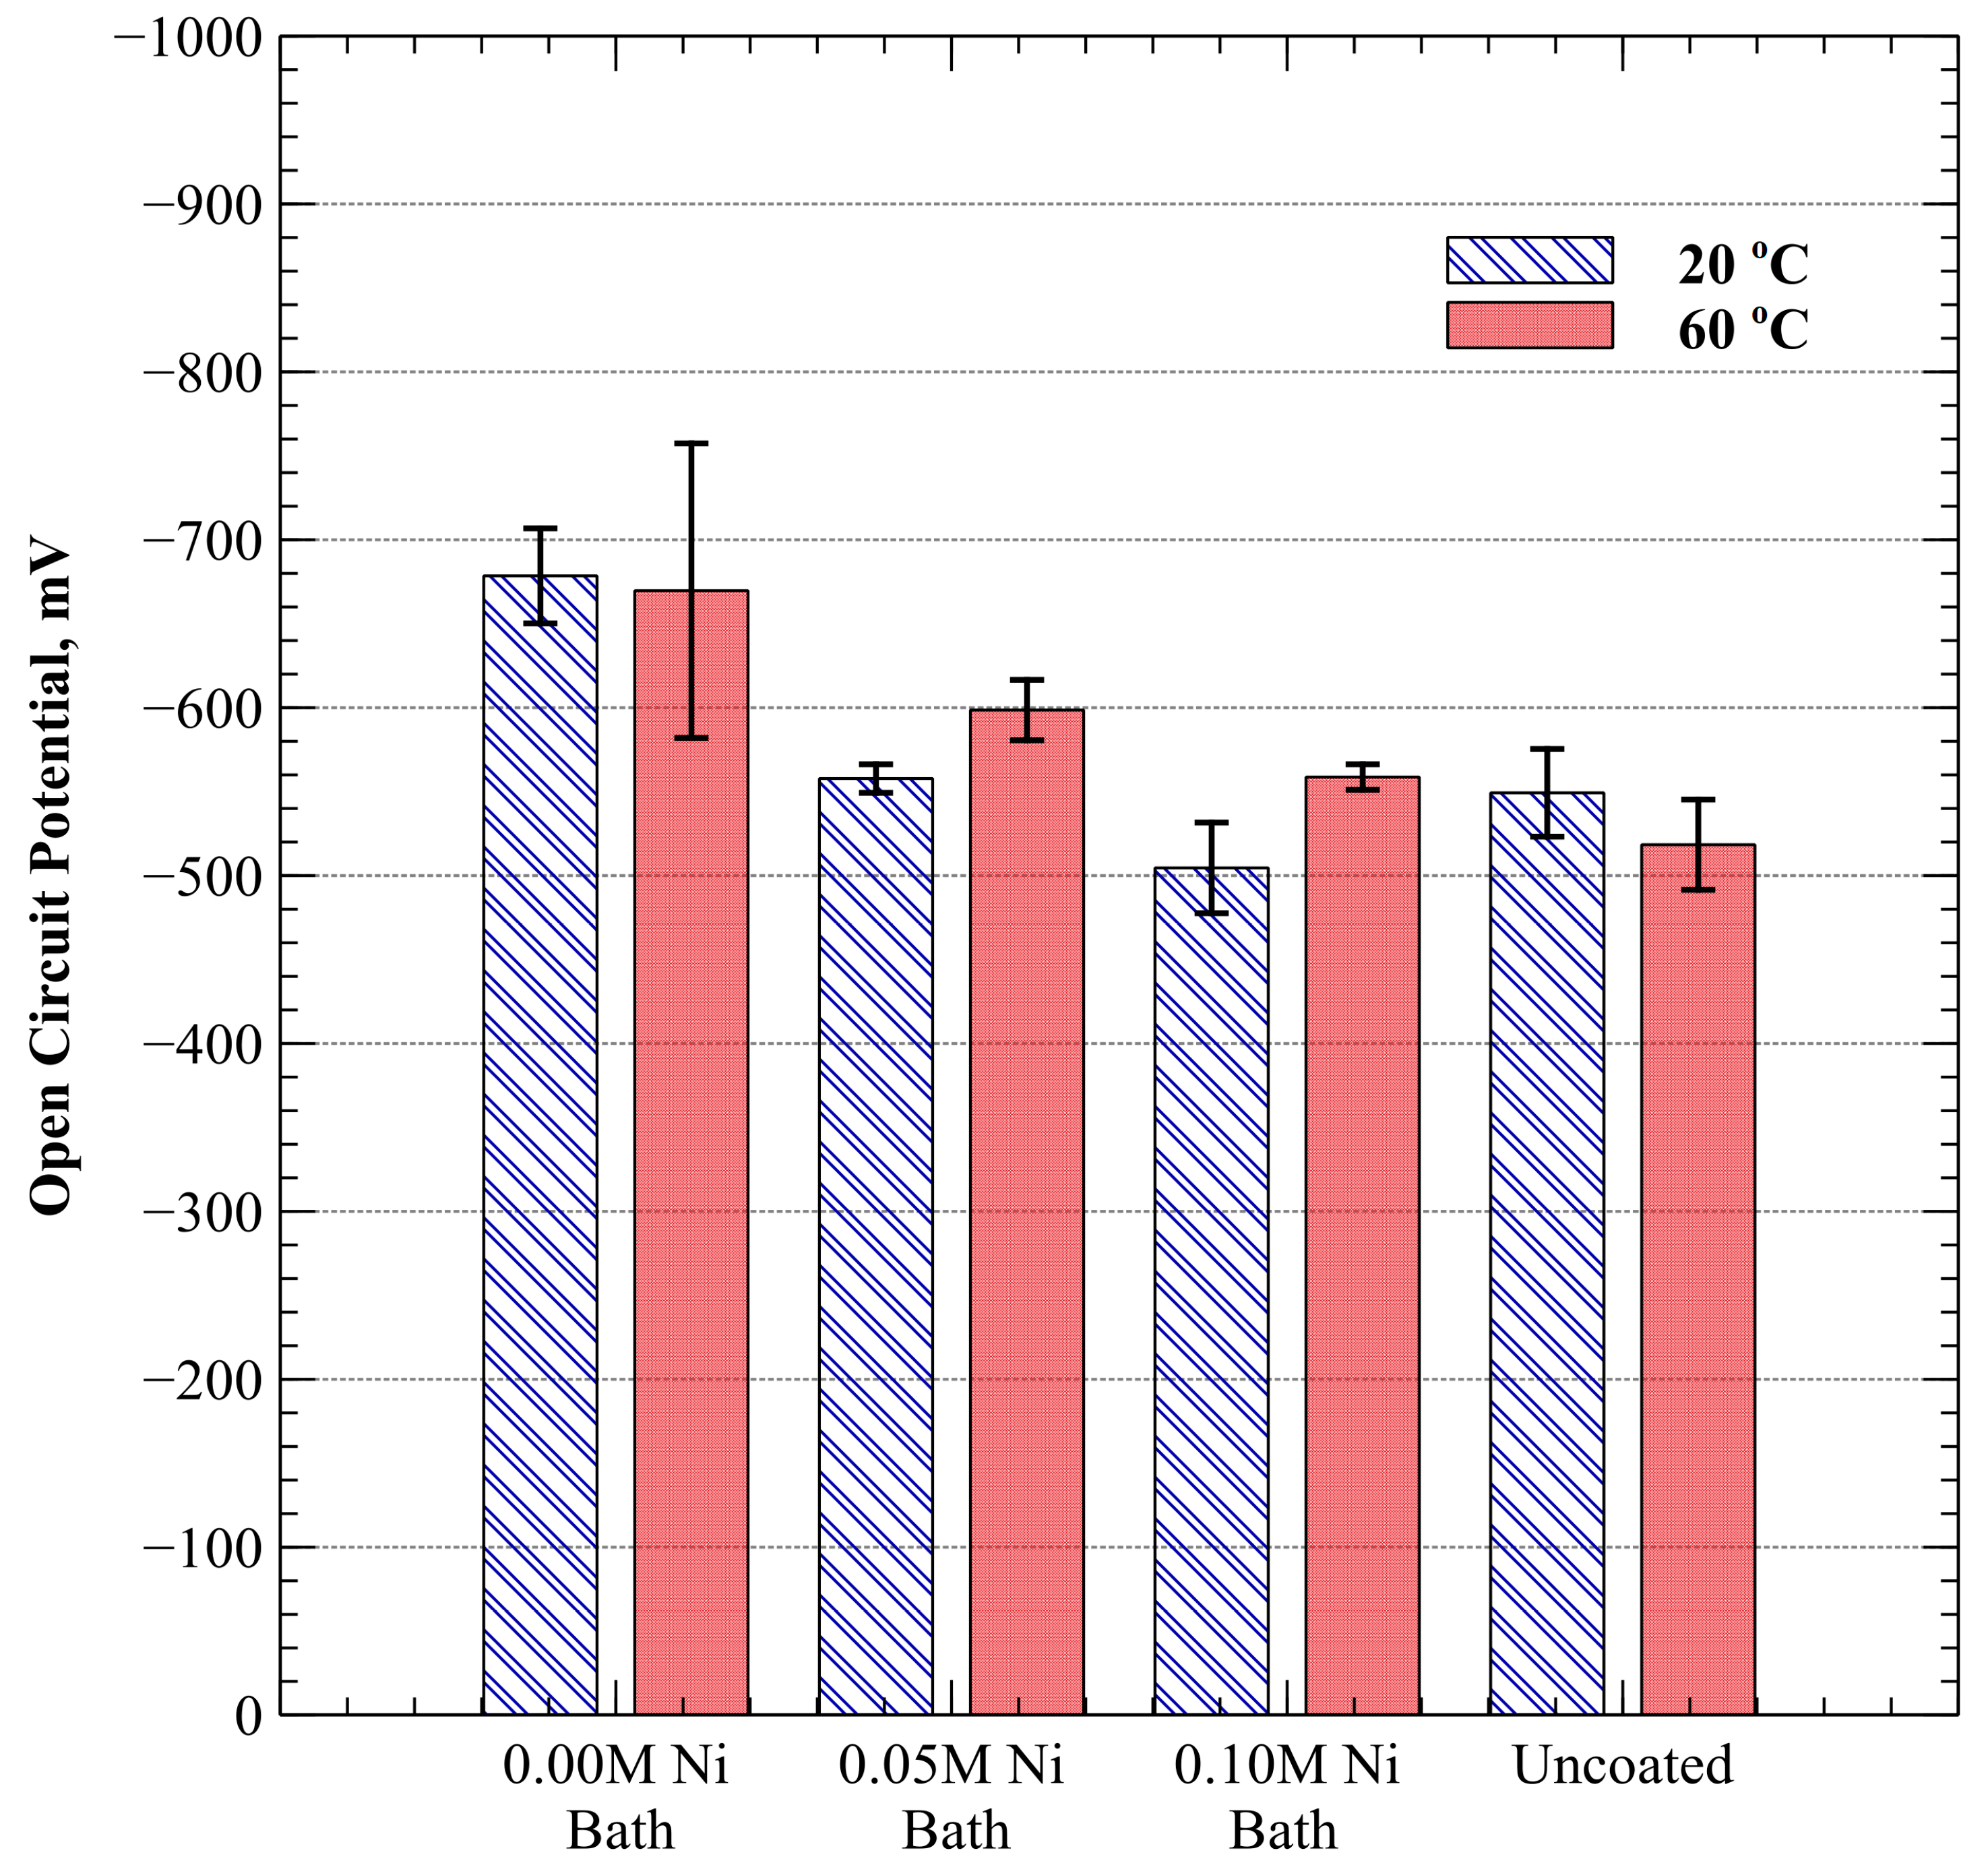
3.1. Open Circuit Potential
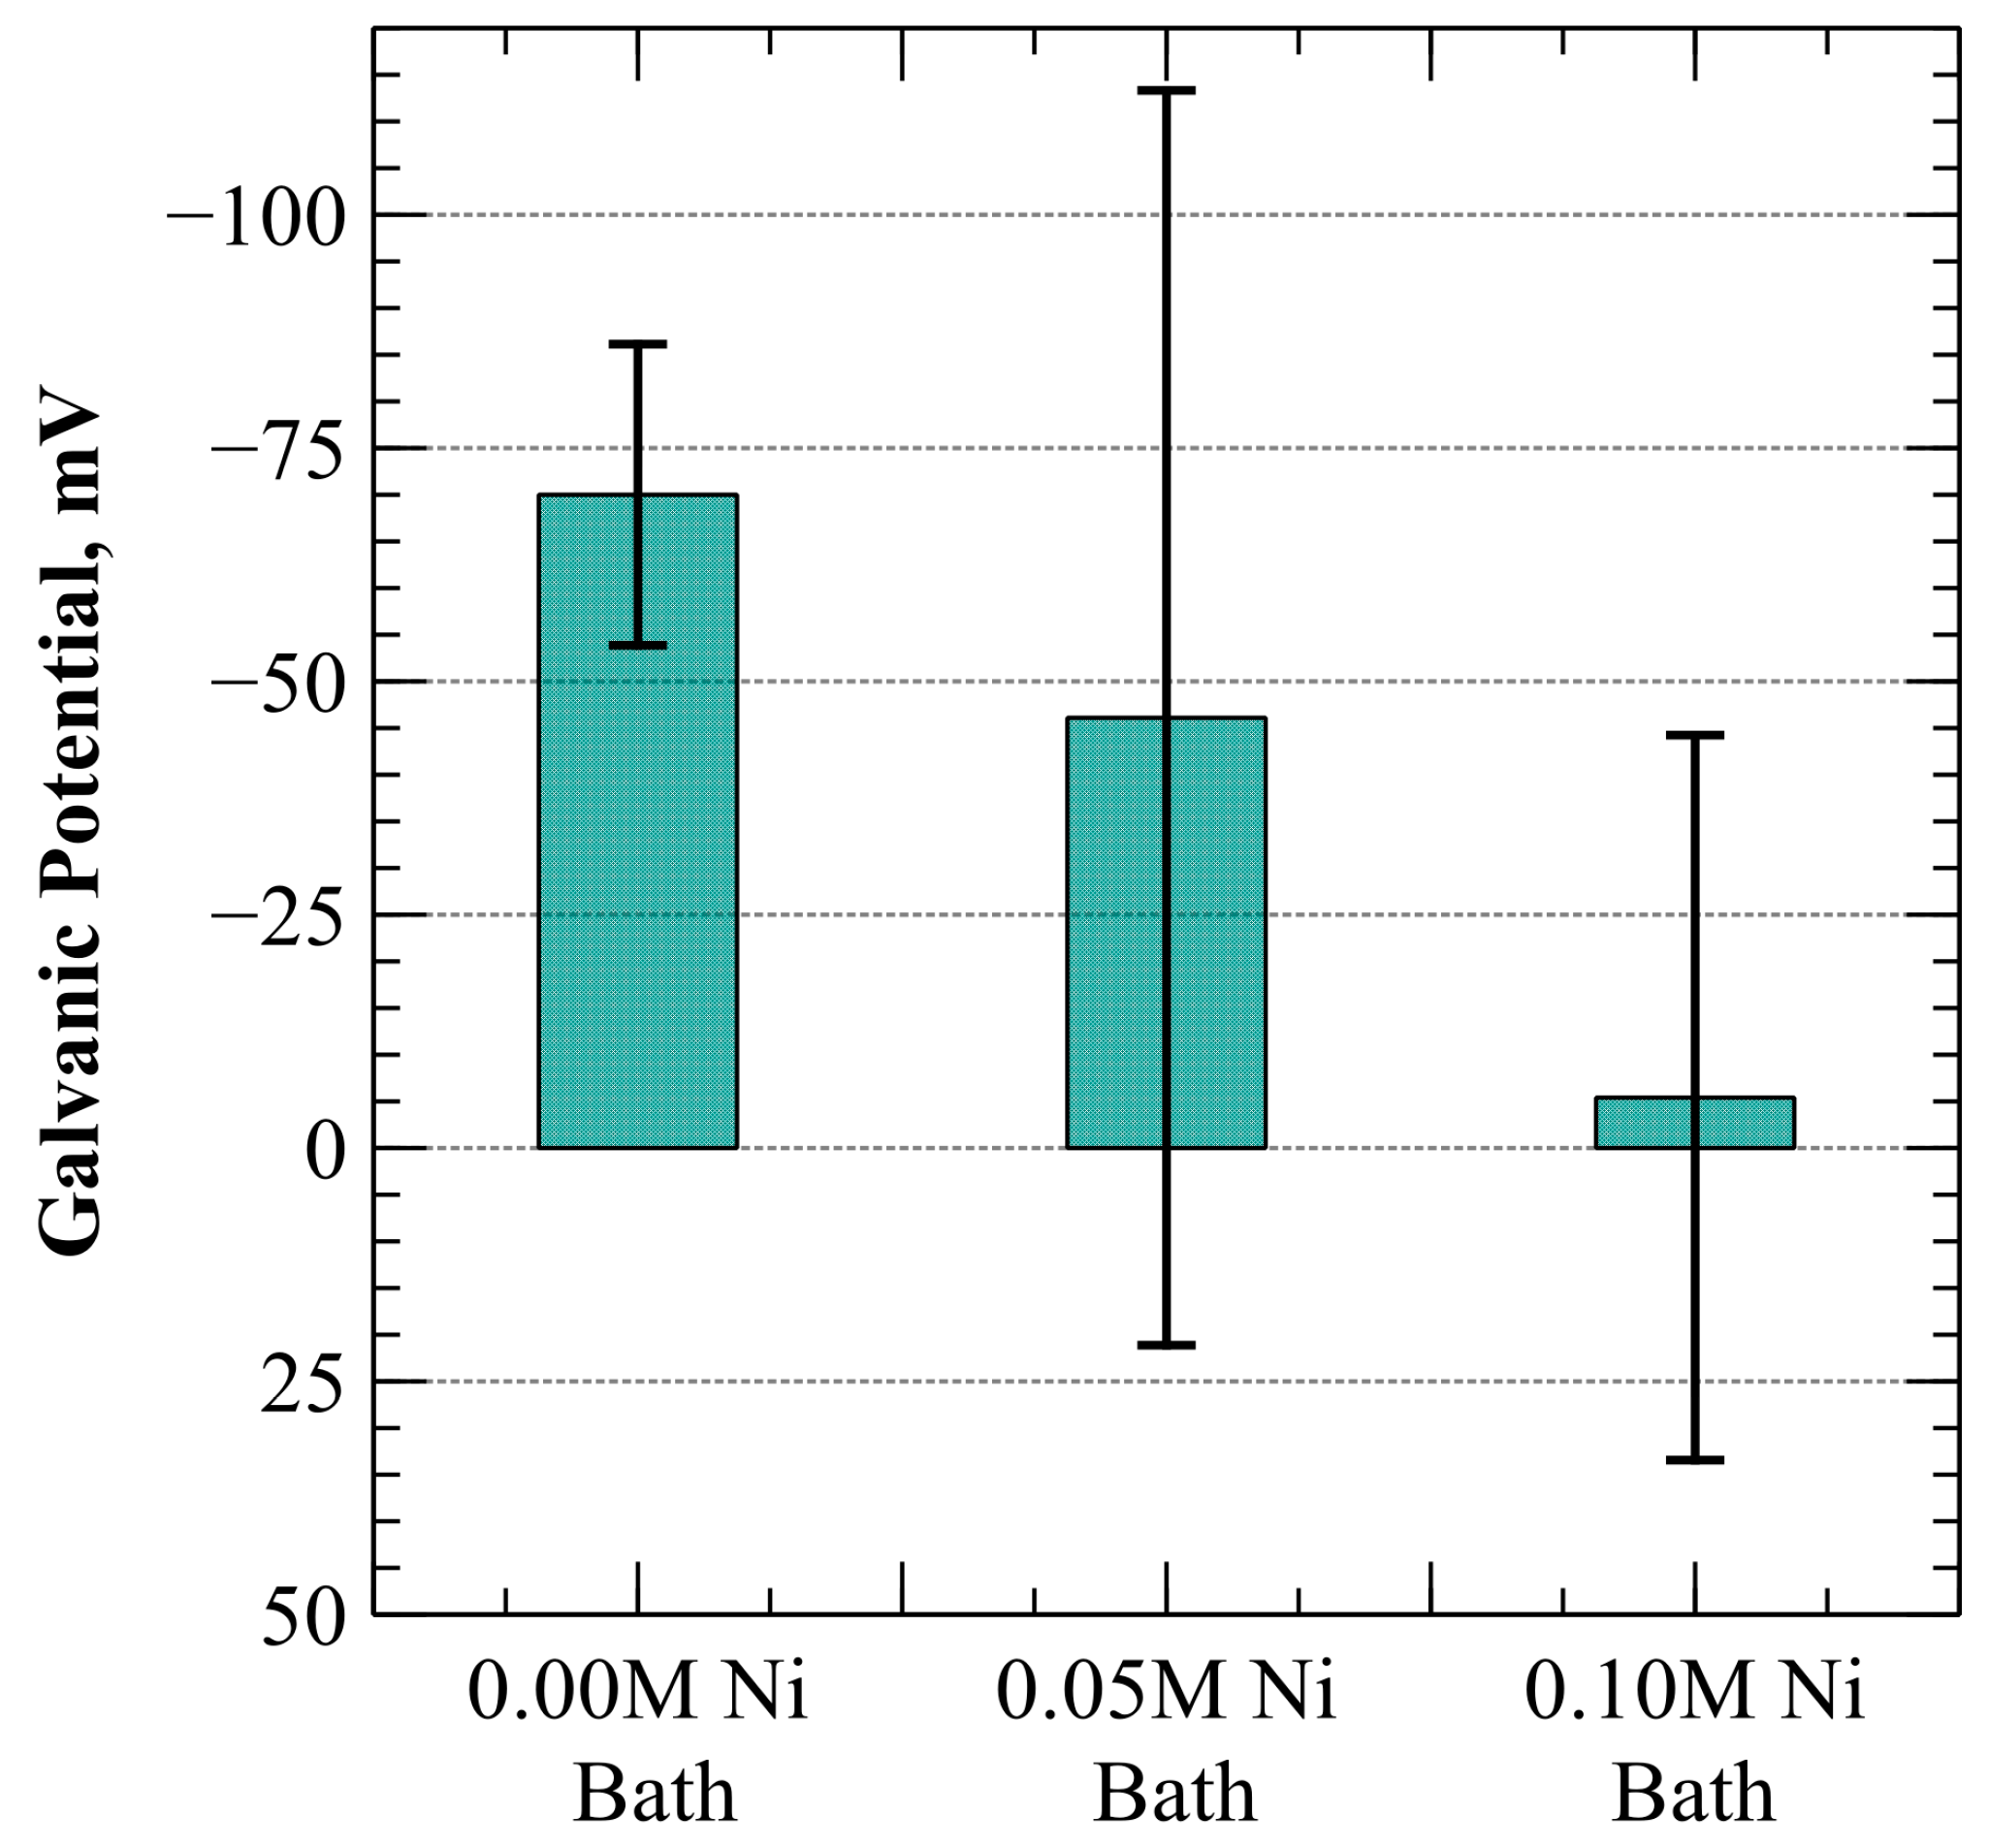
3.2. Galvanic Potential
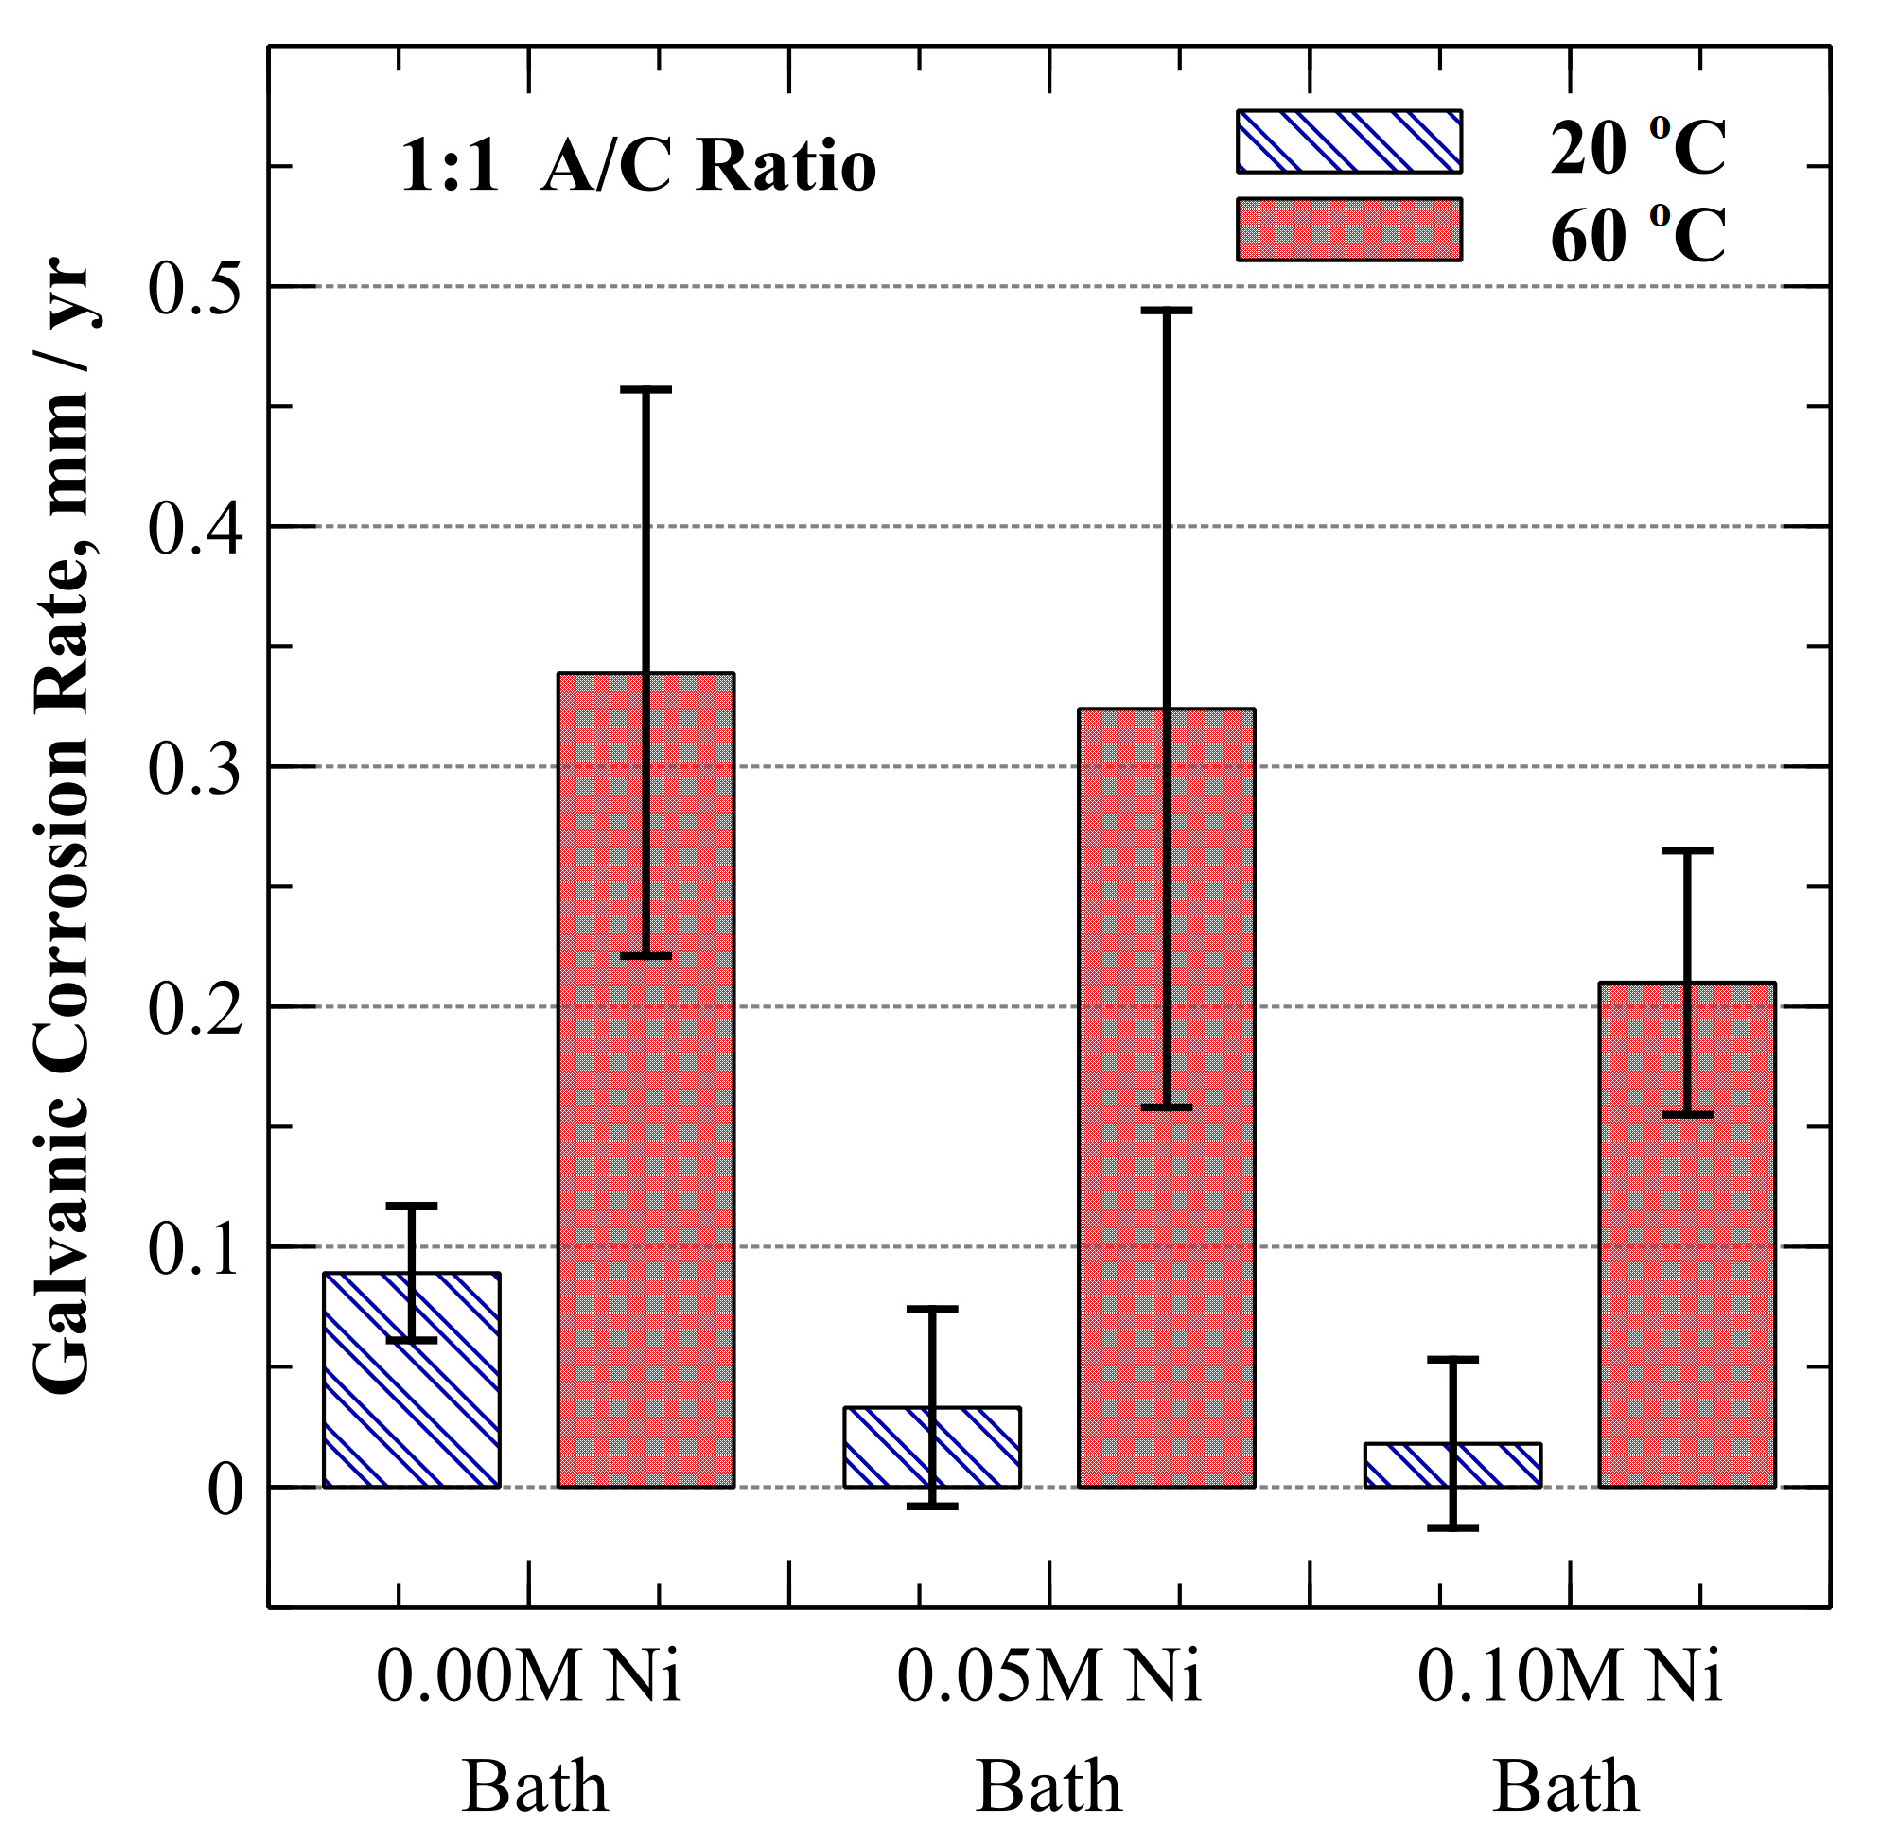
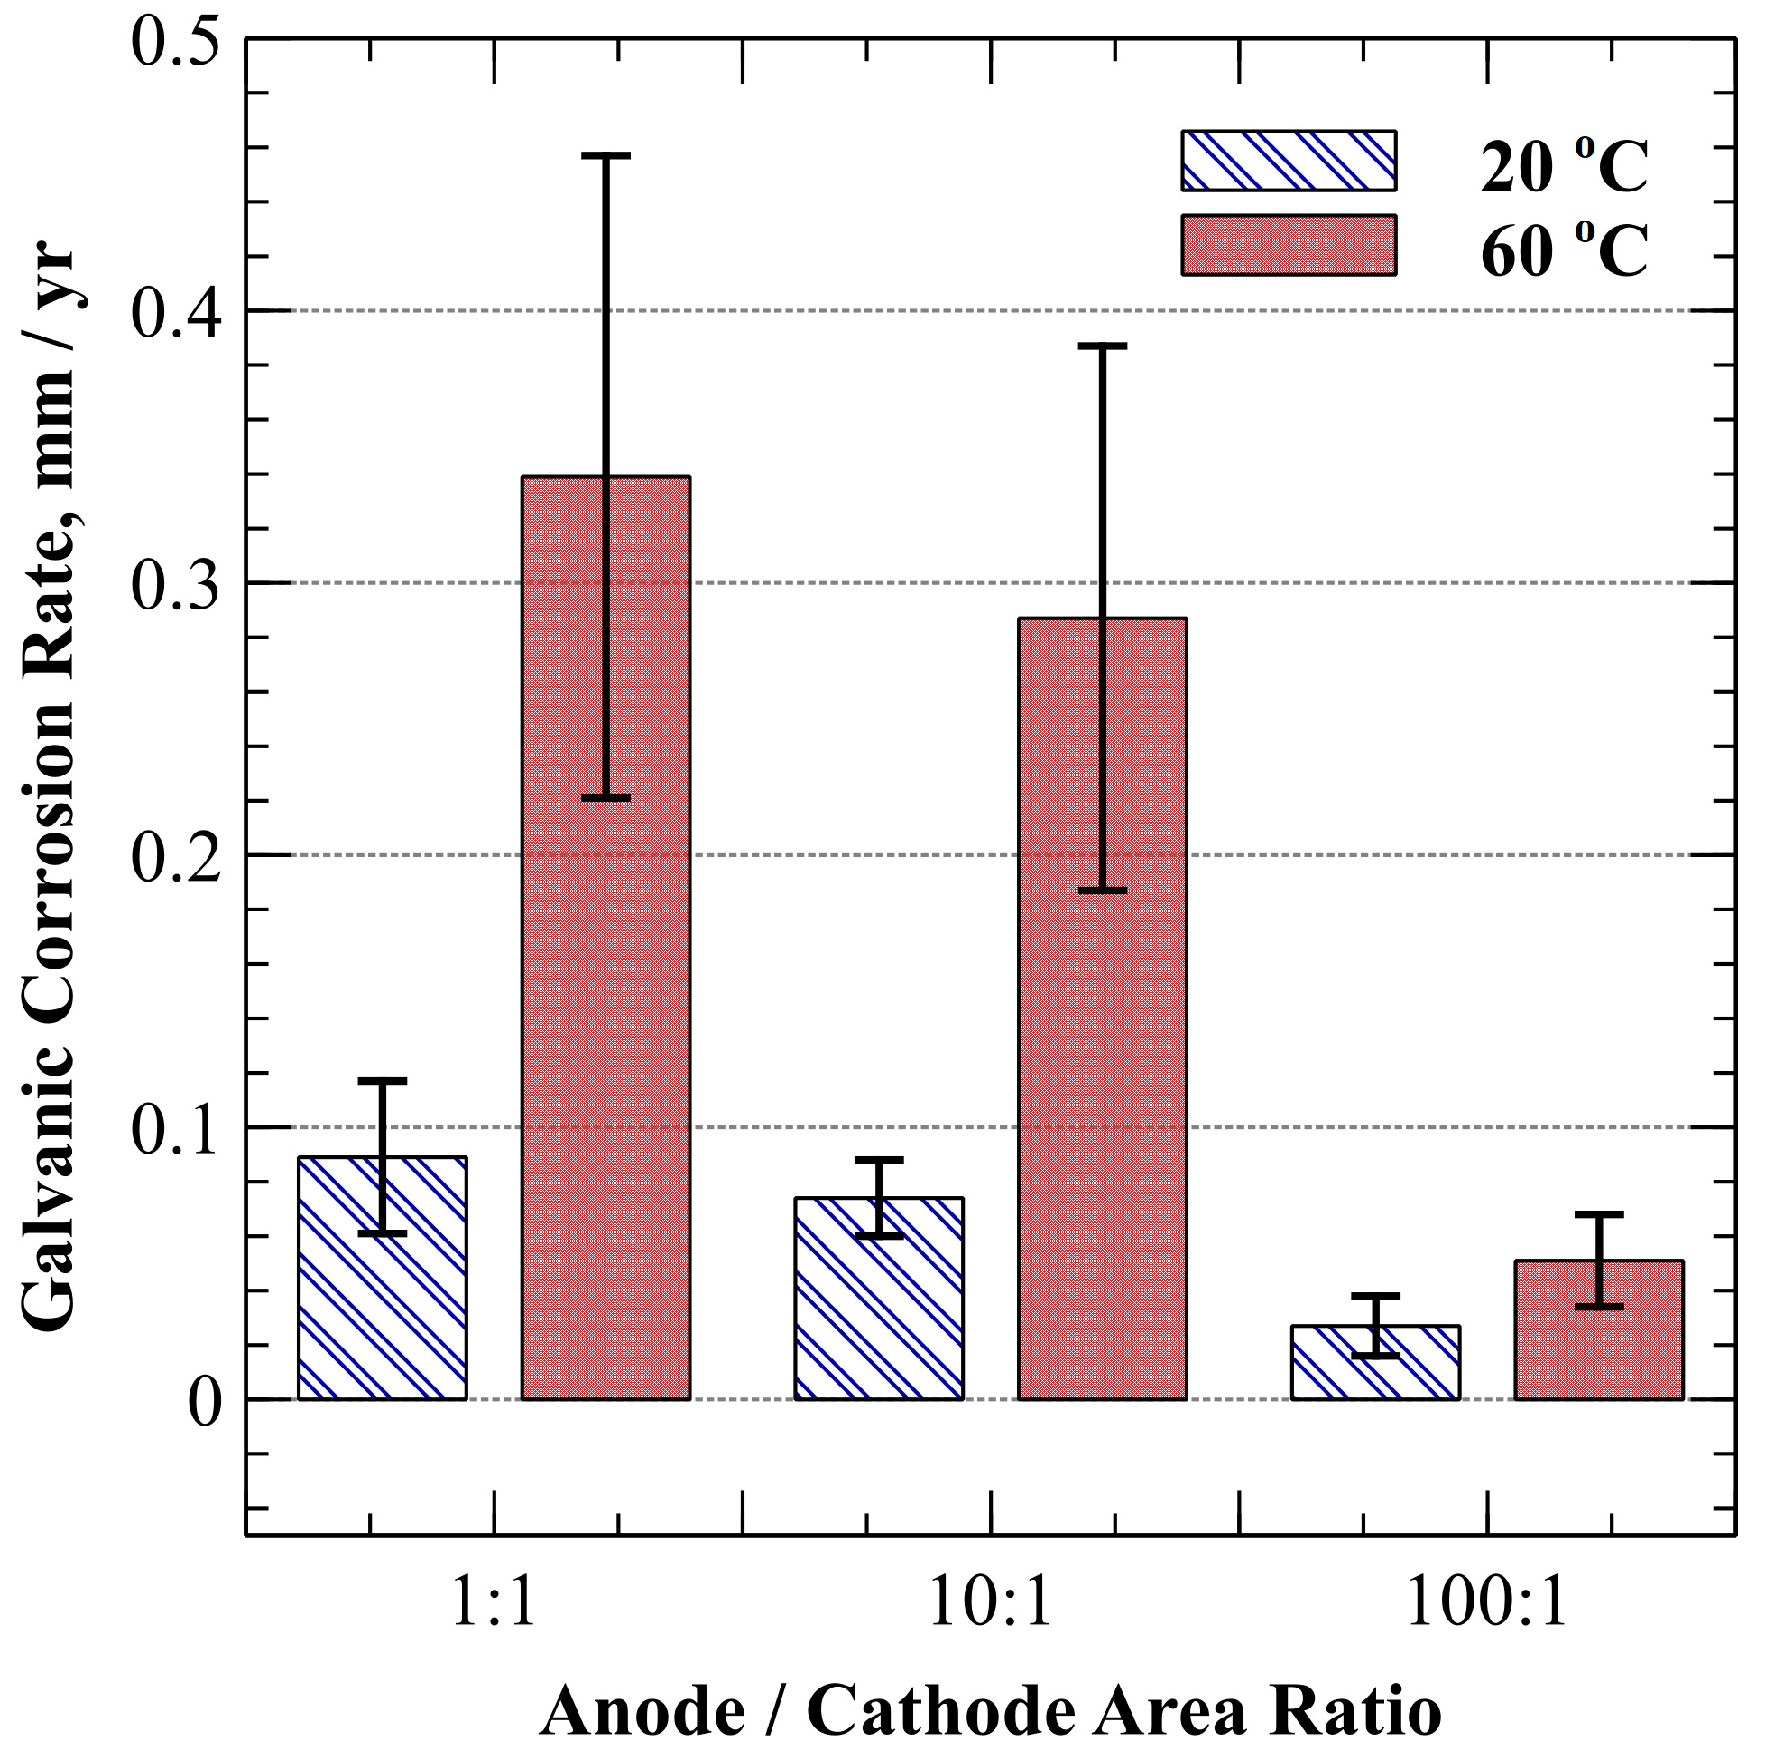
3.3. Zero-Resistance Ammeter
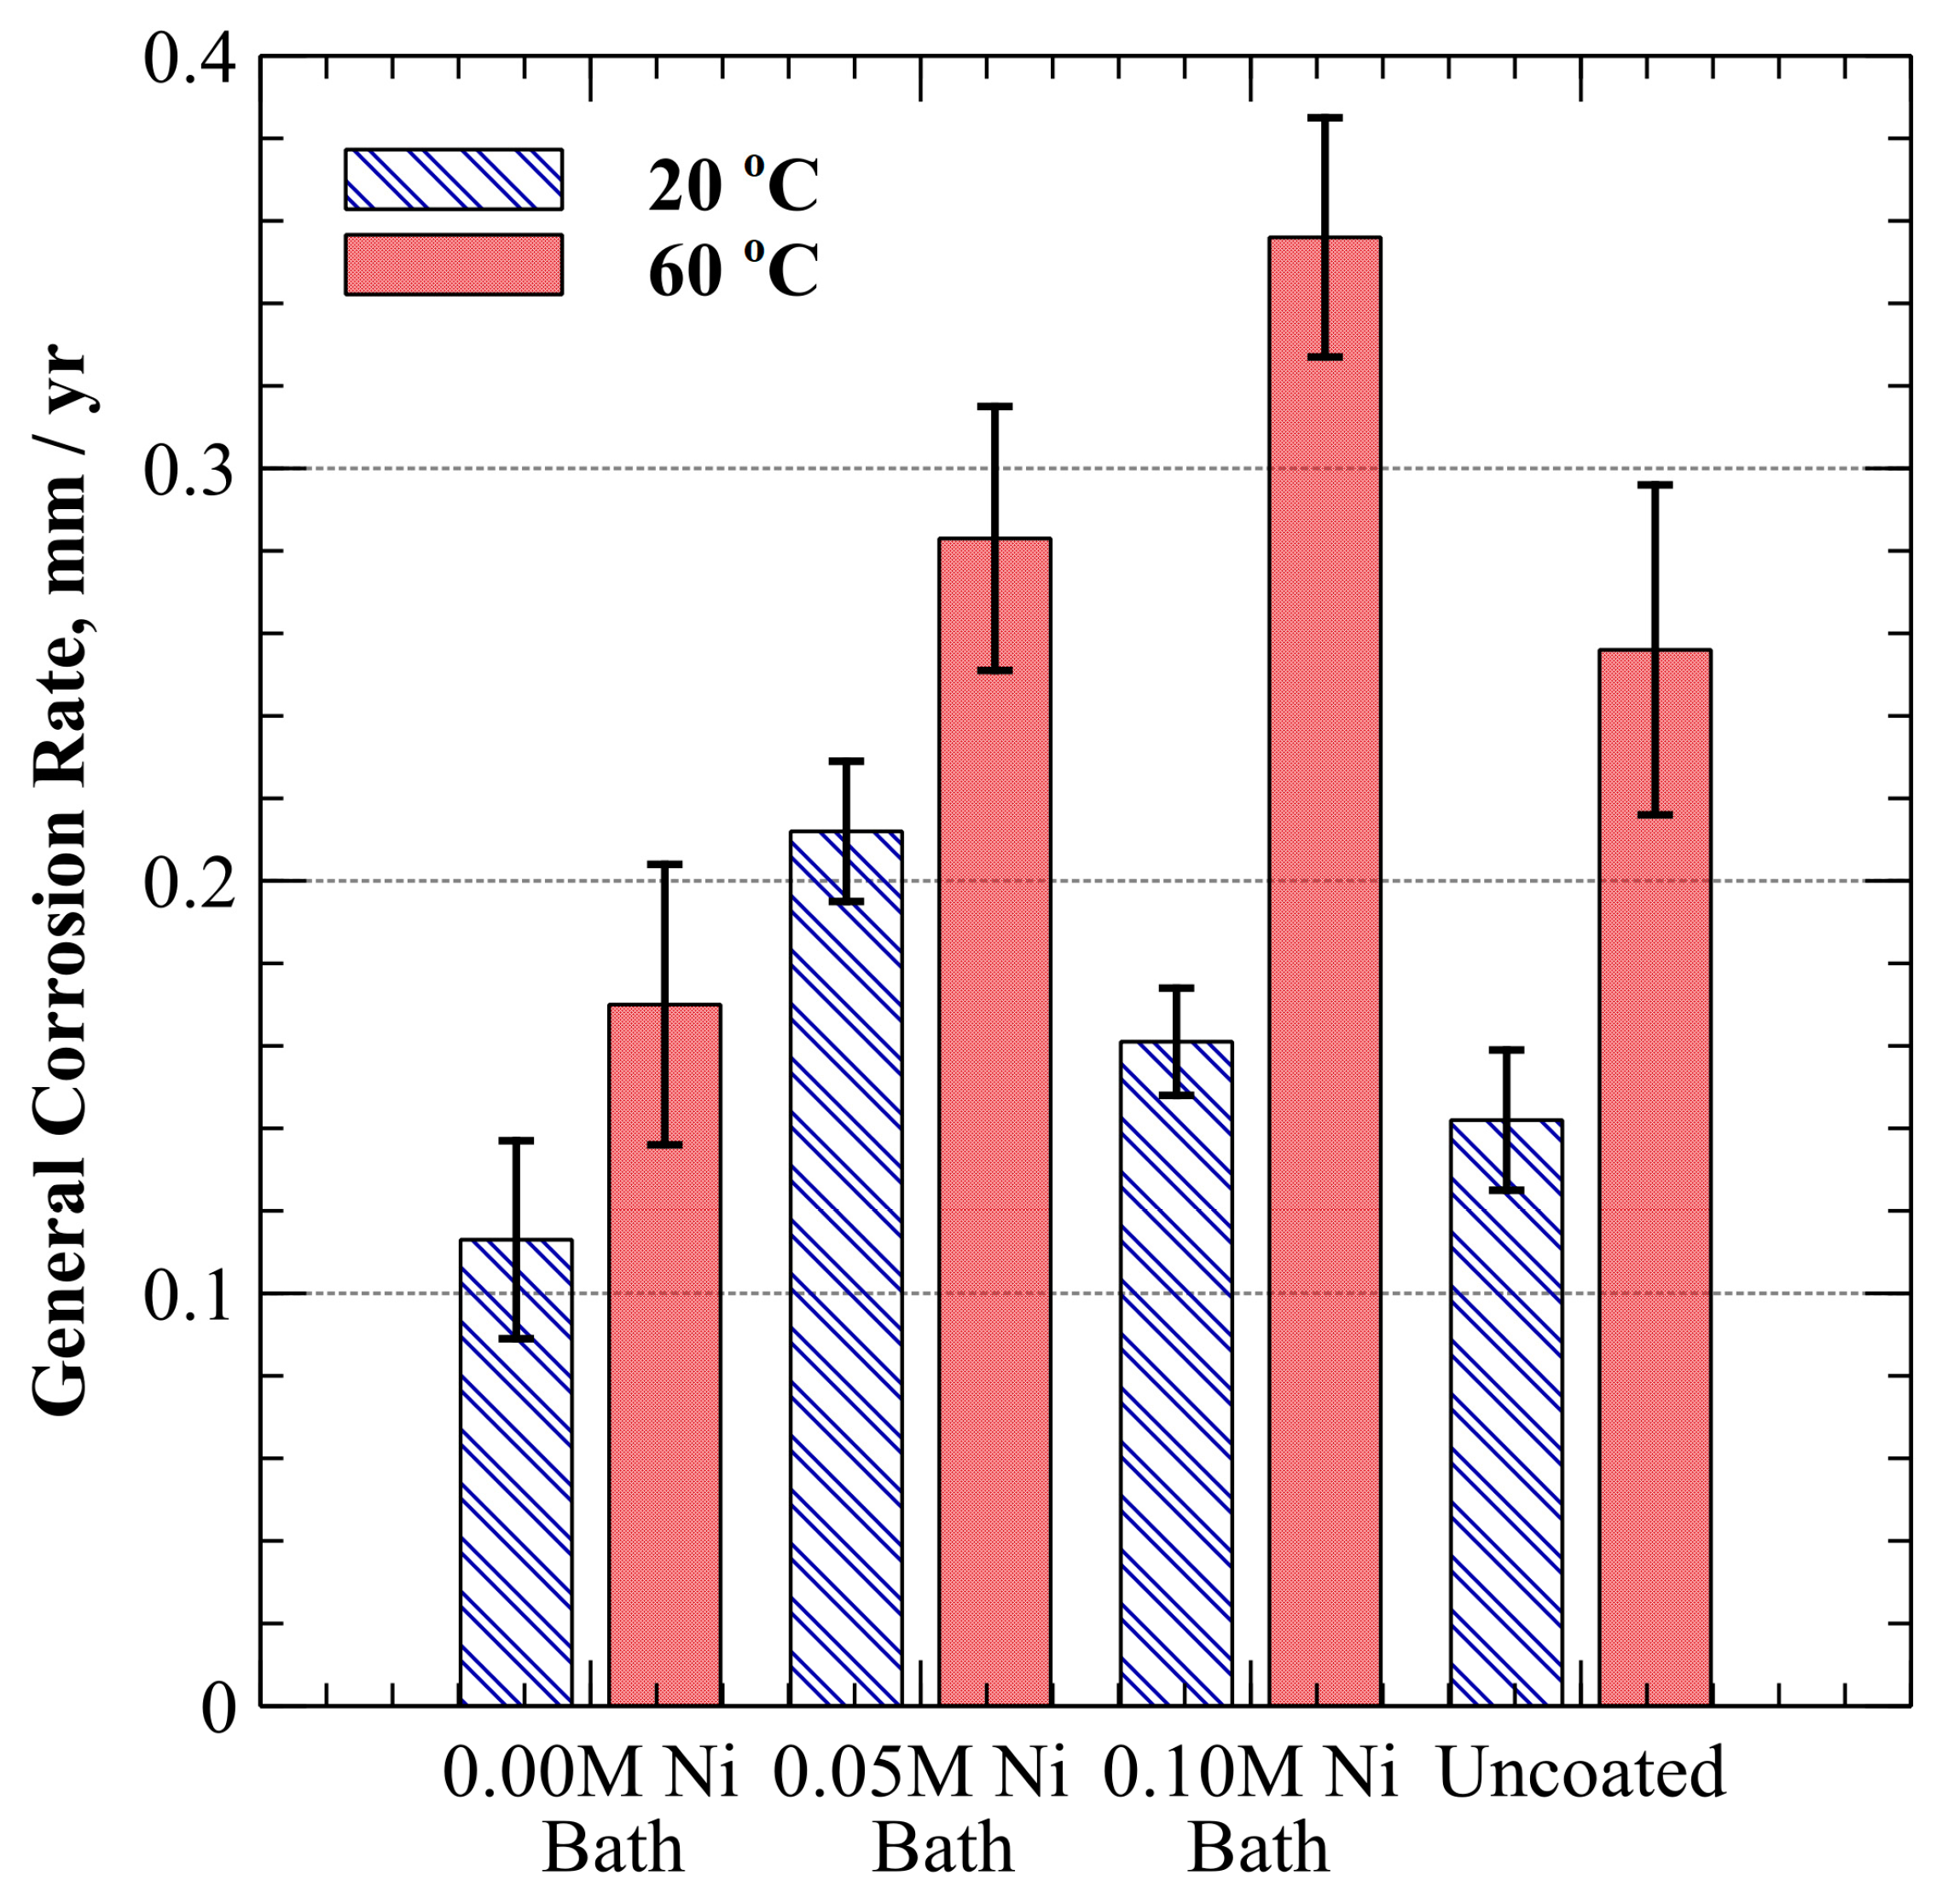
3.4. Linear Polarization Resistance
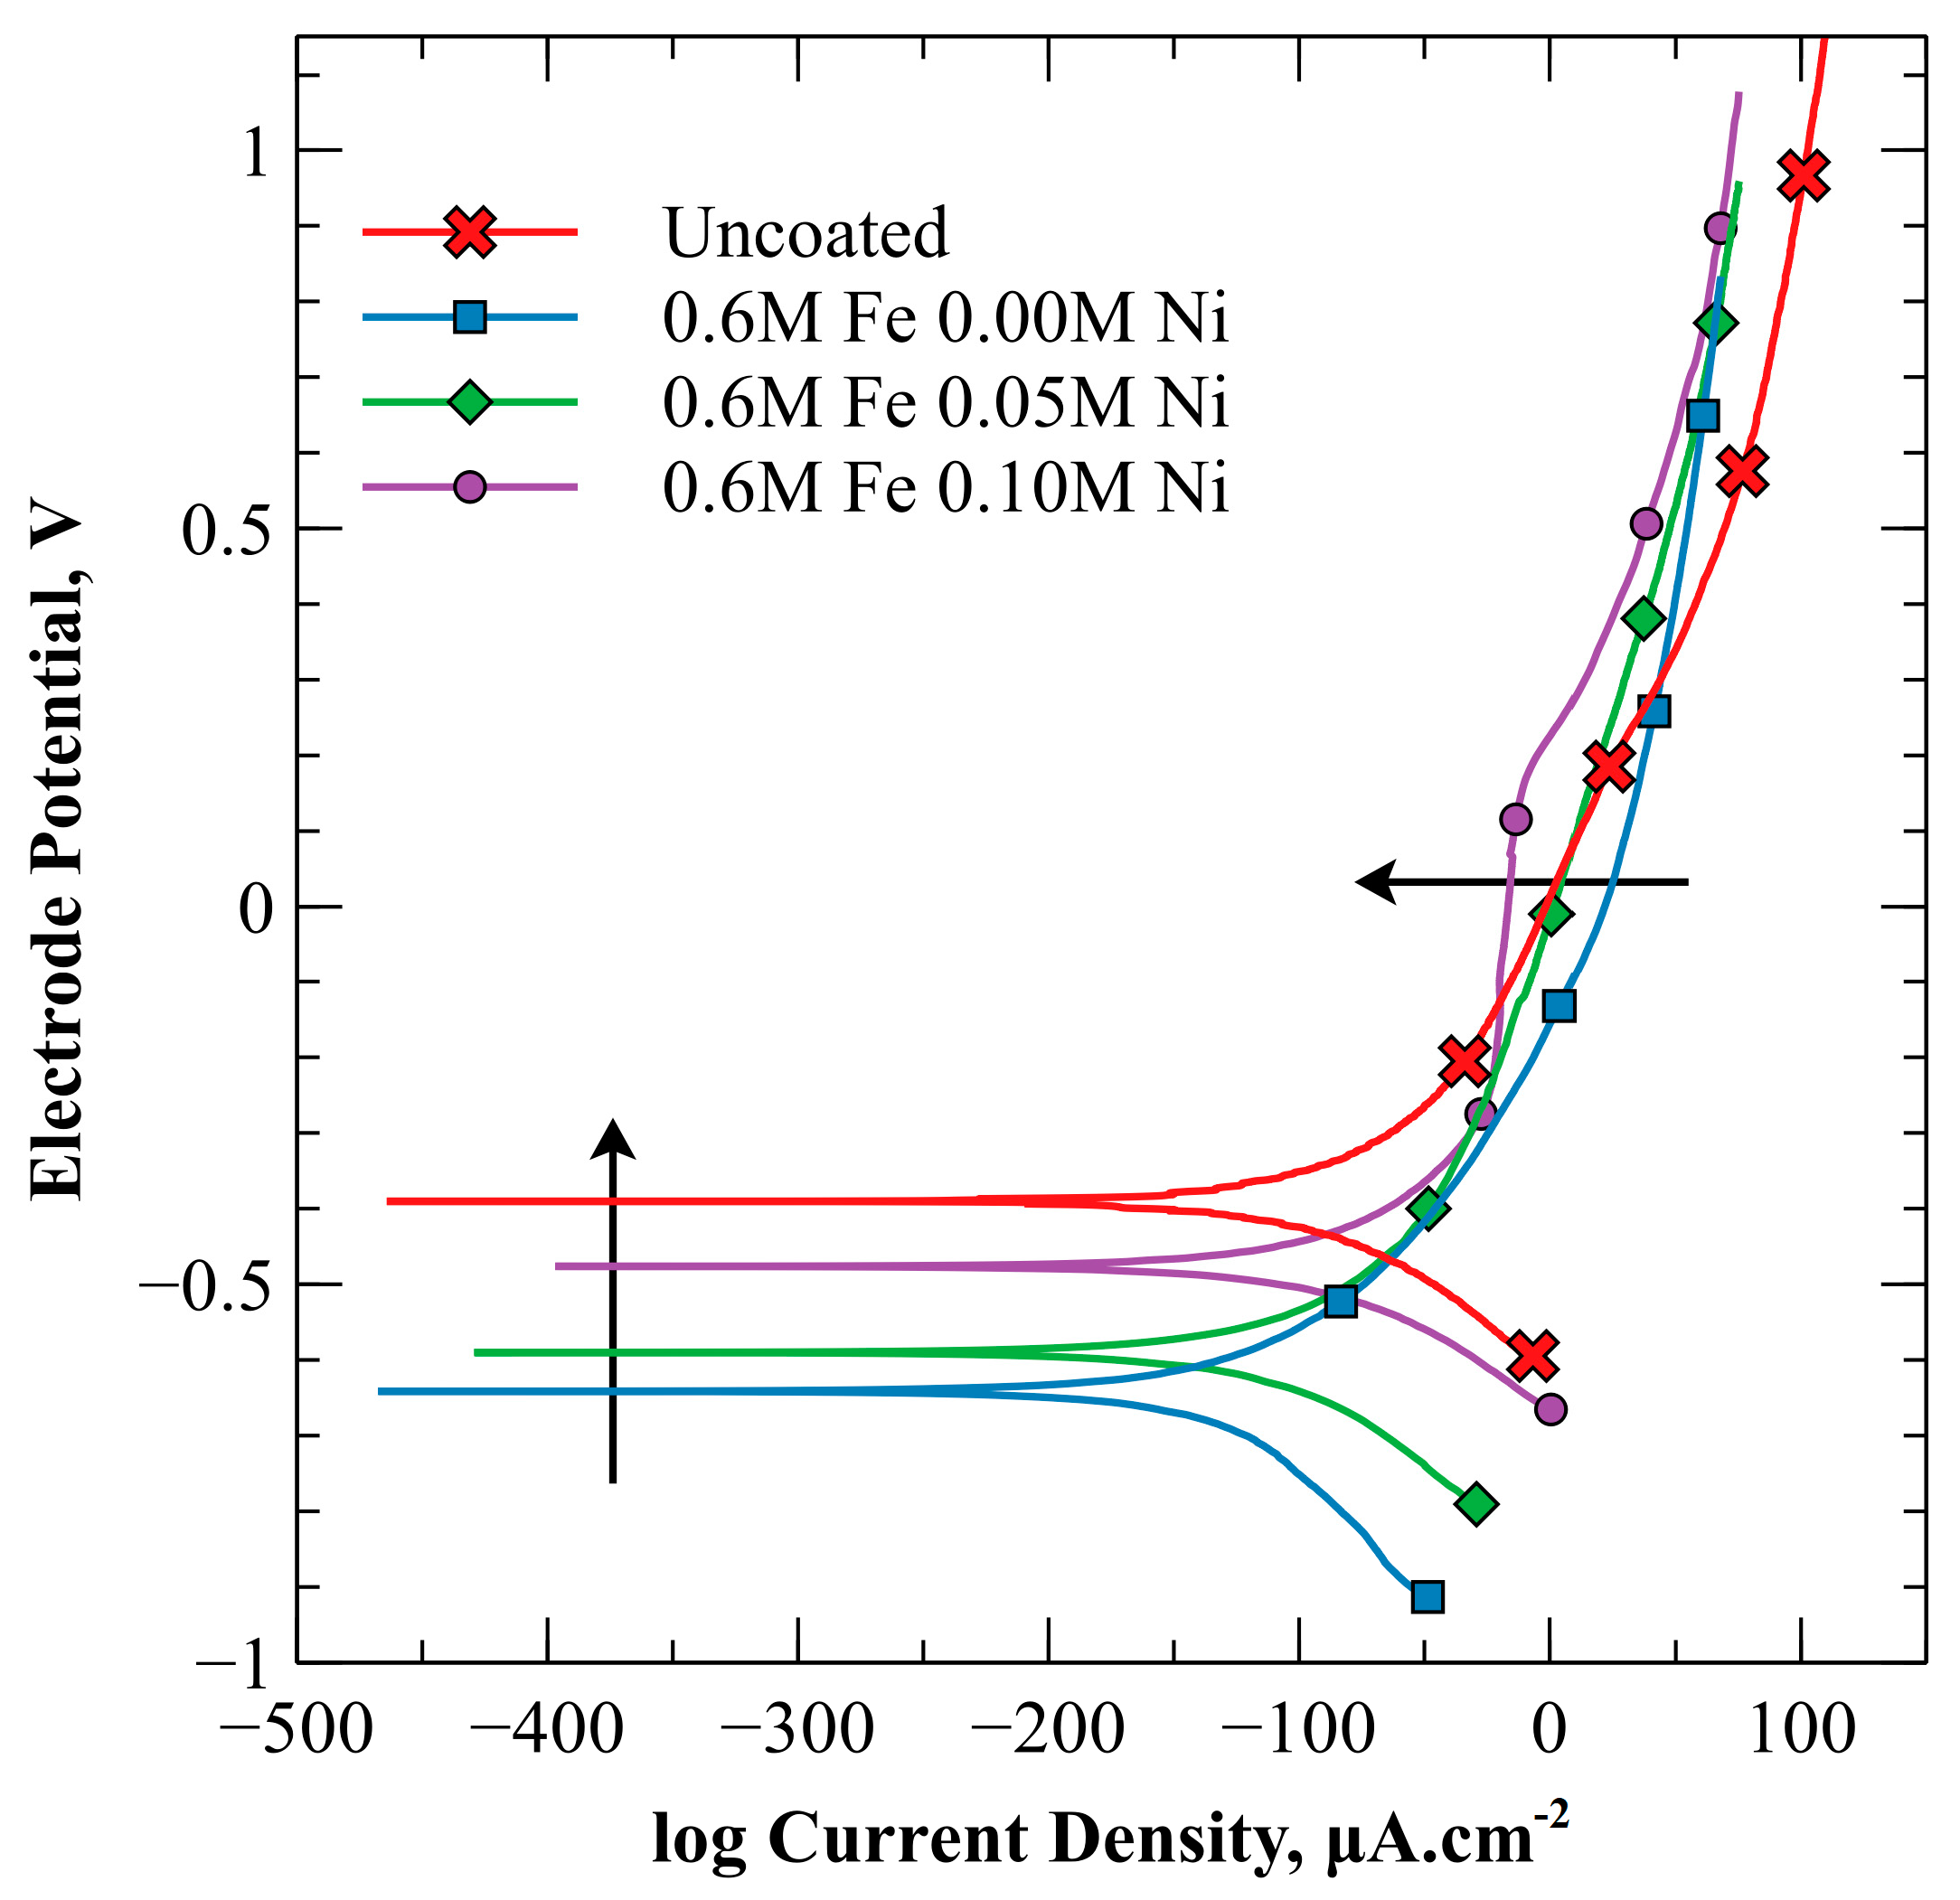
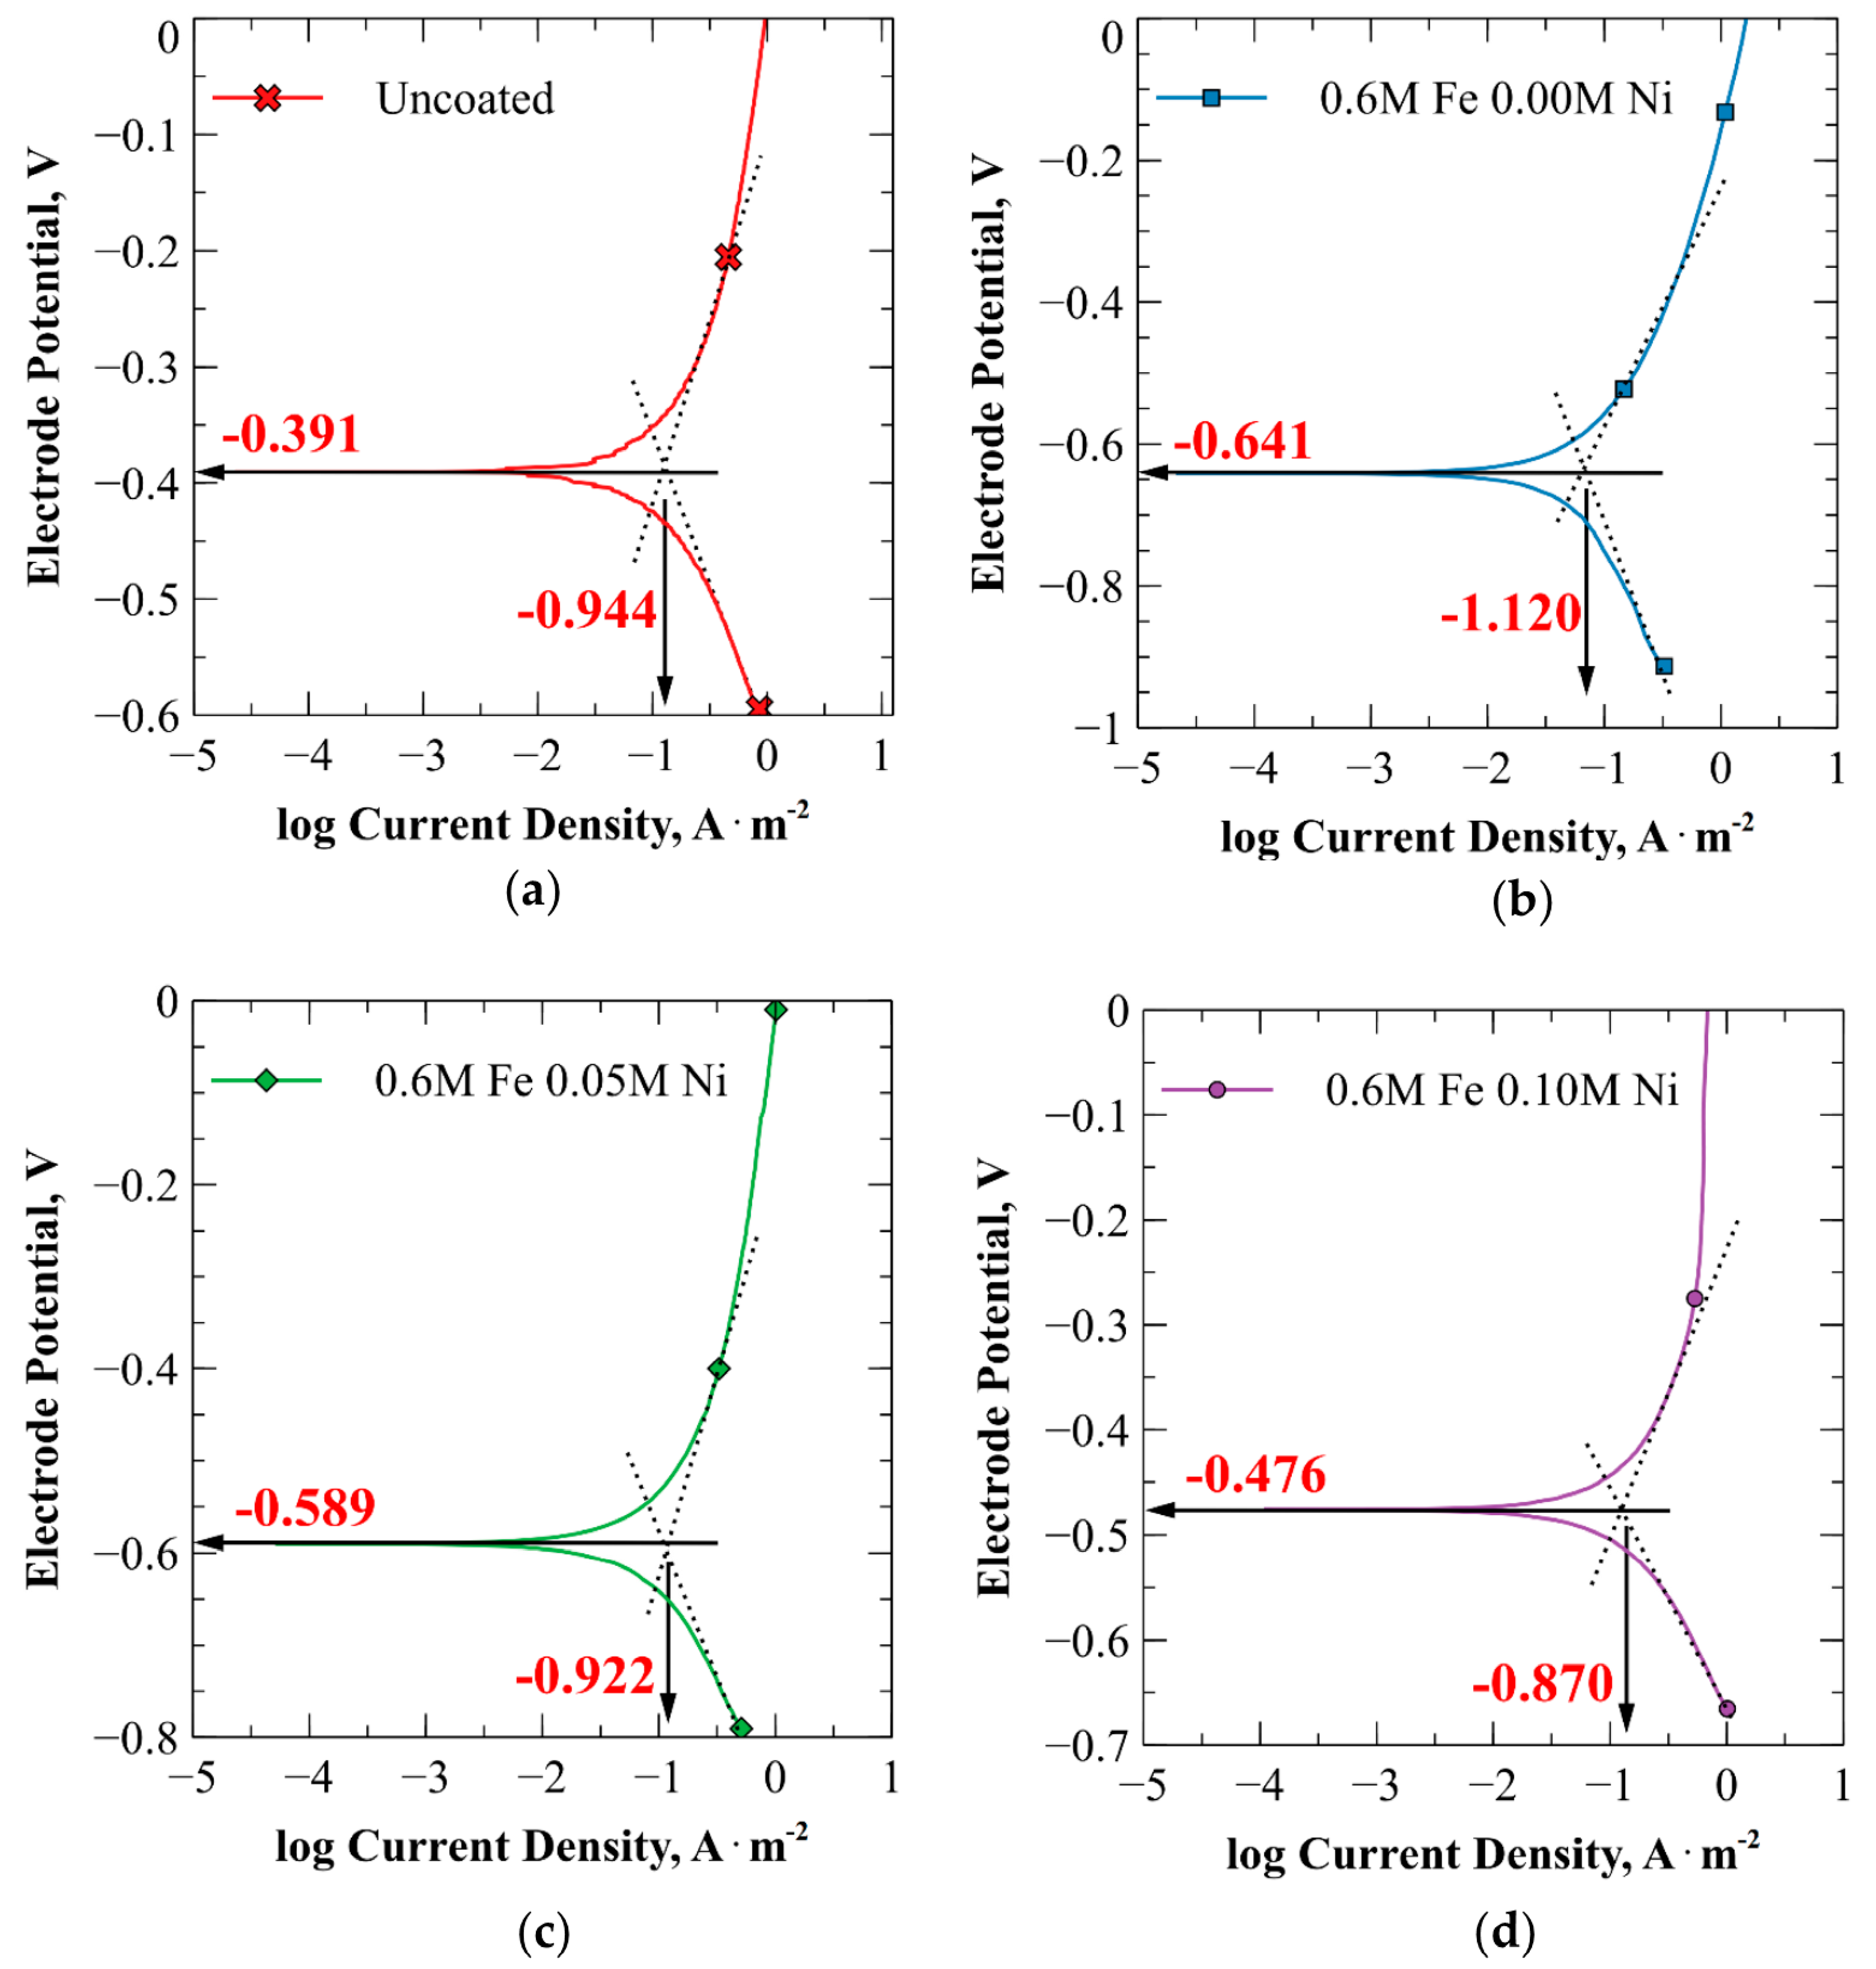
3.5. Potentiodynamic Polarization and Tafel Extrapolation
3.6. Surface Morphology and Composition
4. Discussion
5. Conclusions
- Fe and Fe-Ni alloy coatings were successfully applied as sacrificial anodes for the cathodic protection of mild carbon steel boiler tubes. A distinguishable variation in the corrosion behavior of electroplated specimens was observed. The selected concentrations of ions (0.00 M, 0.05 M, and 0.10 M) in the electroplating solution appeared to influence the chemical properties and resulting corrosion behavior of the deposits in a predictable manner, suggesting tuneability. Overall, the findings highlight a trade-off between galvanic and general corrosion performance, indicating that the optimal Fe-Ni coating composition will depend on the specific application and which corrosion mechanism dominates over the long term. Since the coating is expected to be sporadically applied on the interior surface of boiler tubes, localized effects may play a more significant role in determining its effectiveness.
- The progressive increase in molar ratio within the electroplating solution correlated strongly with a corrosion potential shift in the more noble direction. Additionally, a reduction in corrosion current density was observed within the region where passivation typically occurs, suggesting a slight enhancement of the protective oxide layer with higher nickel content.
- The temperature-dependent amplification of corrosion thermodynamics and kinetics observed in this research suggests that the protective characteristics of Fe-Ni alloy electrodeposits may be reasonably tunable to specific temperature conditions by adjusting elemental composition to achieve an optimal cathodic protection scheme.
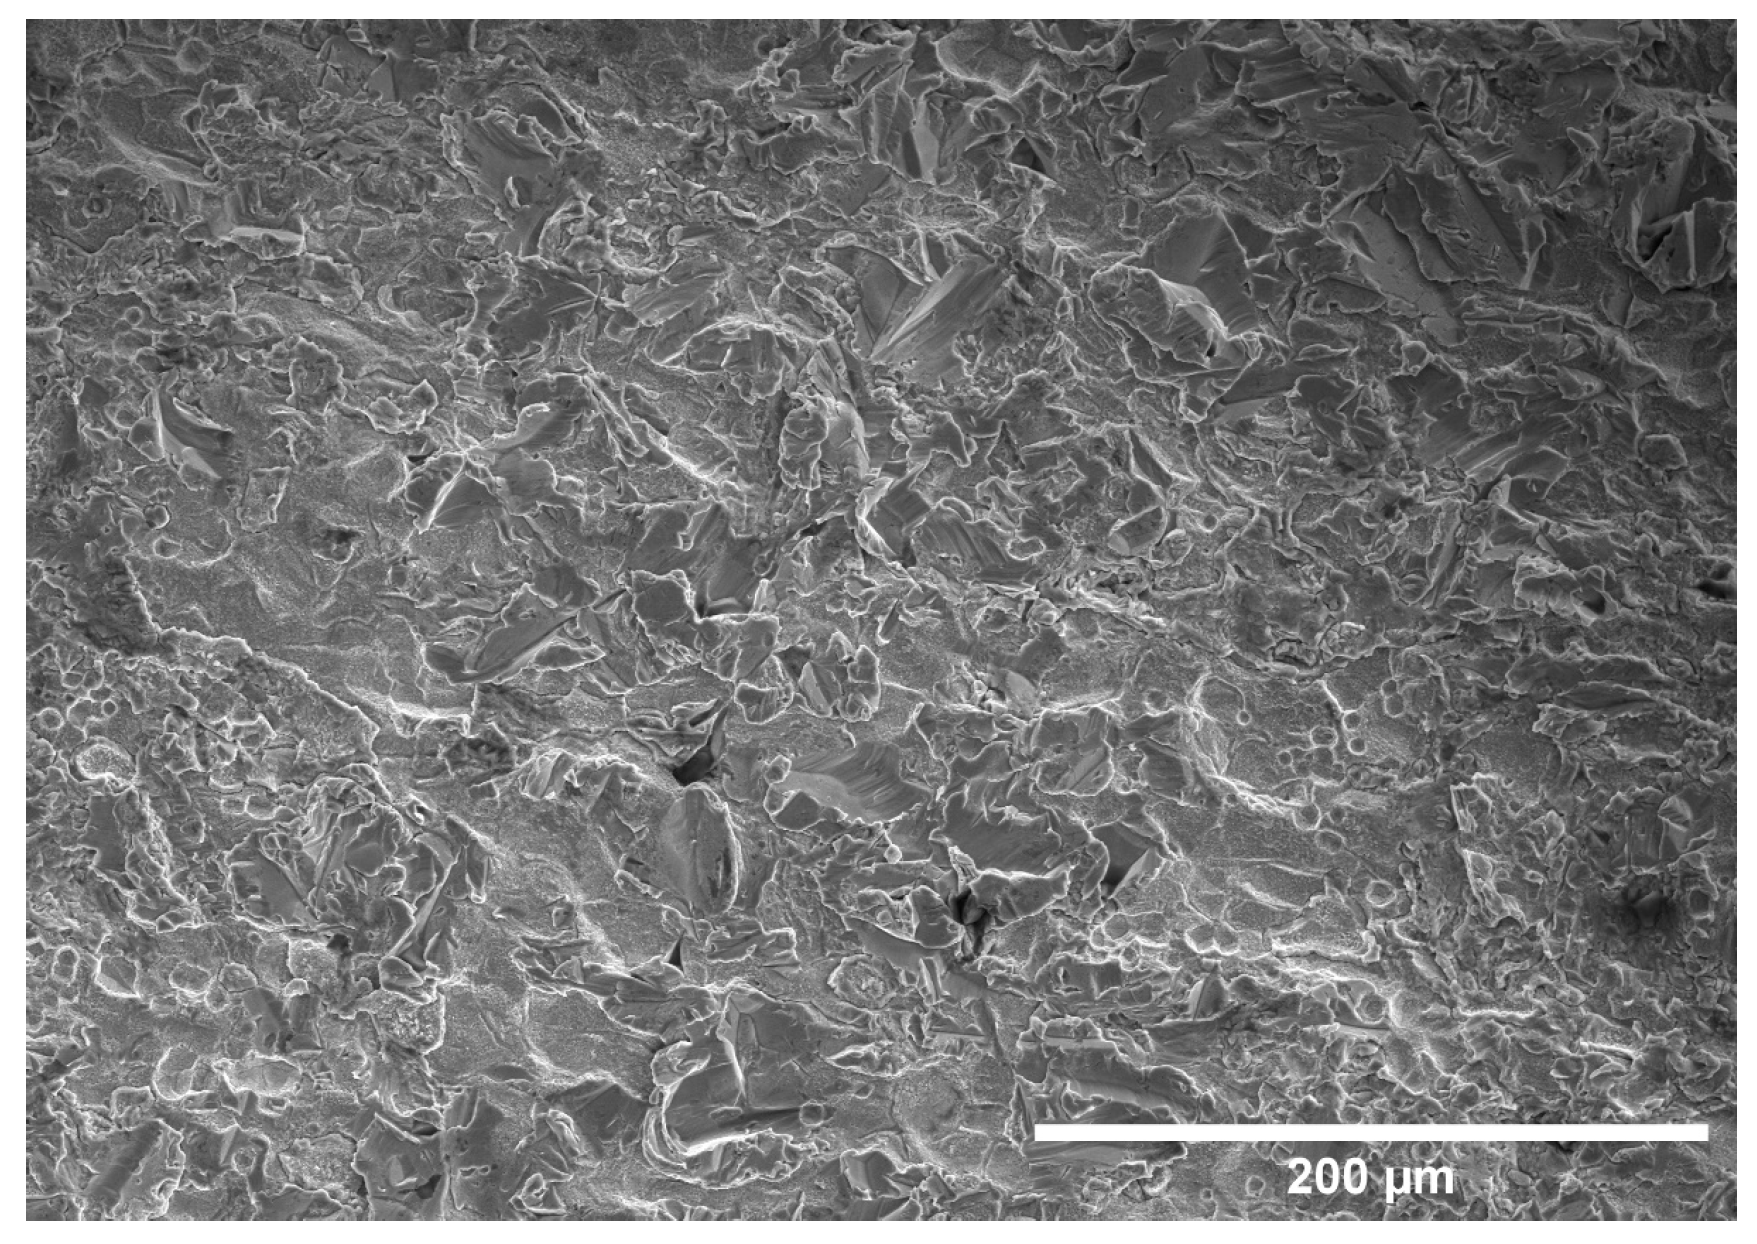
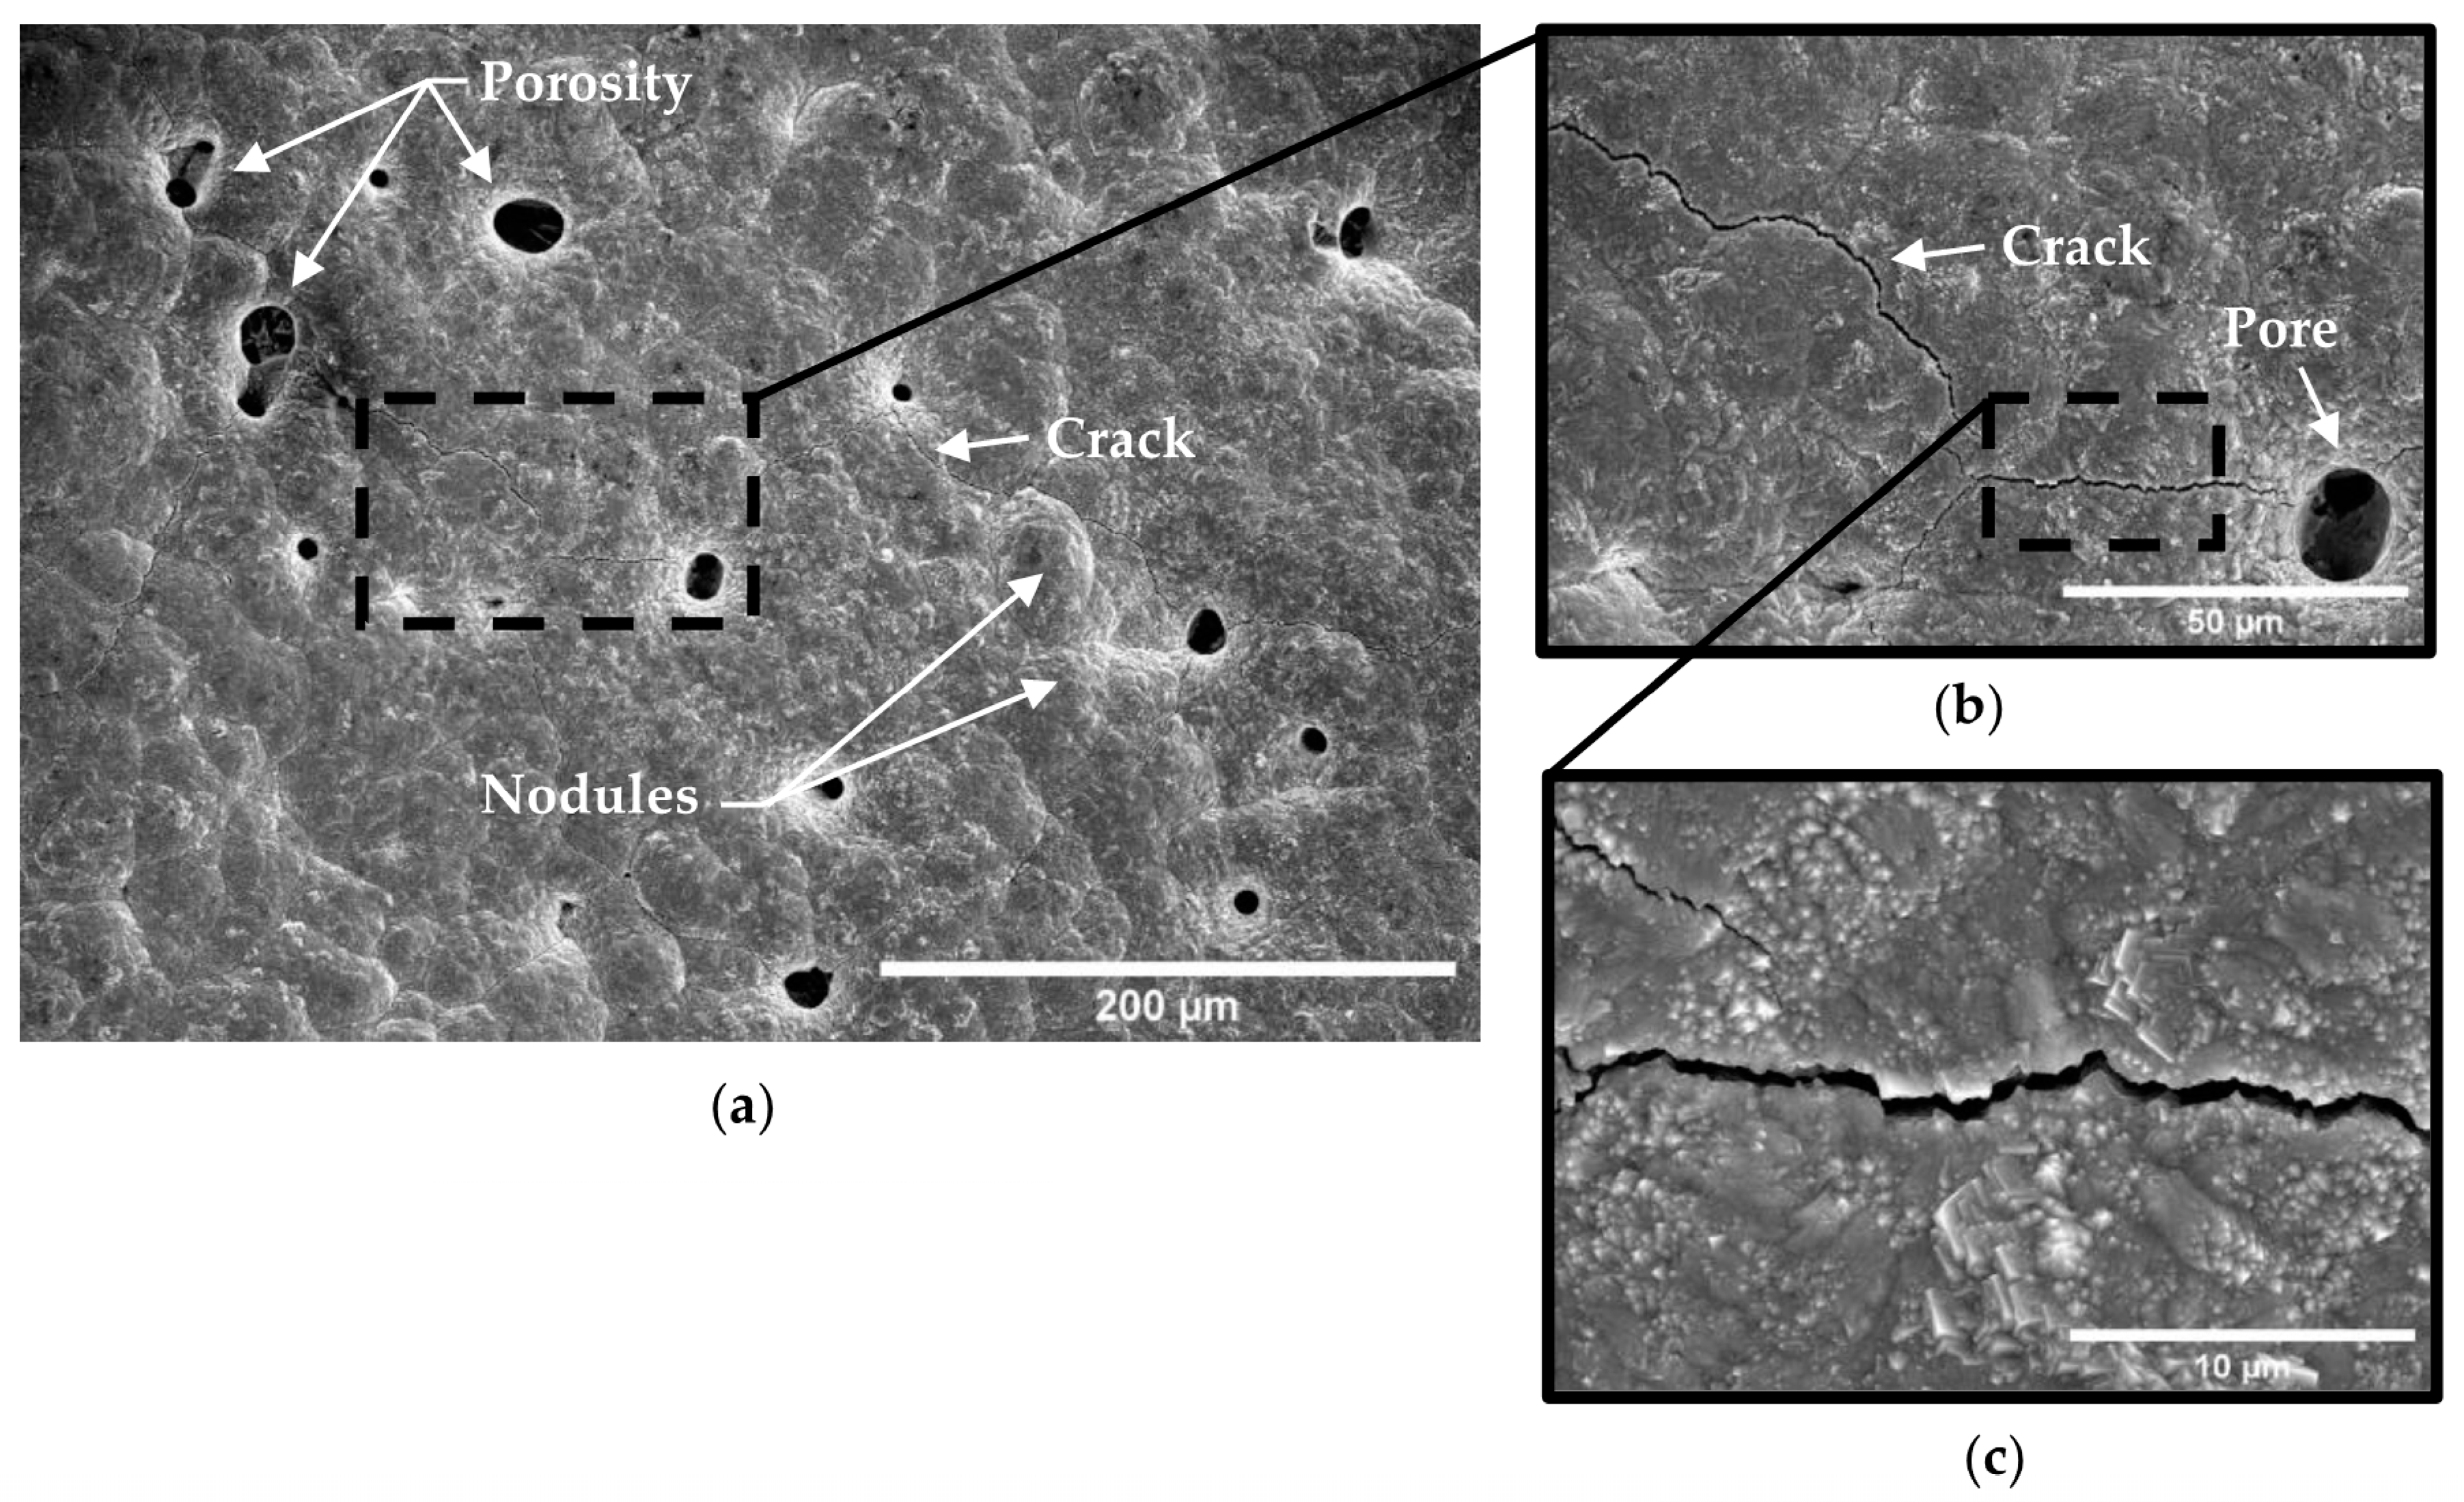
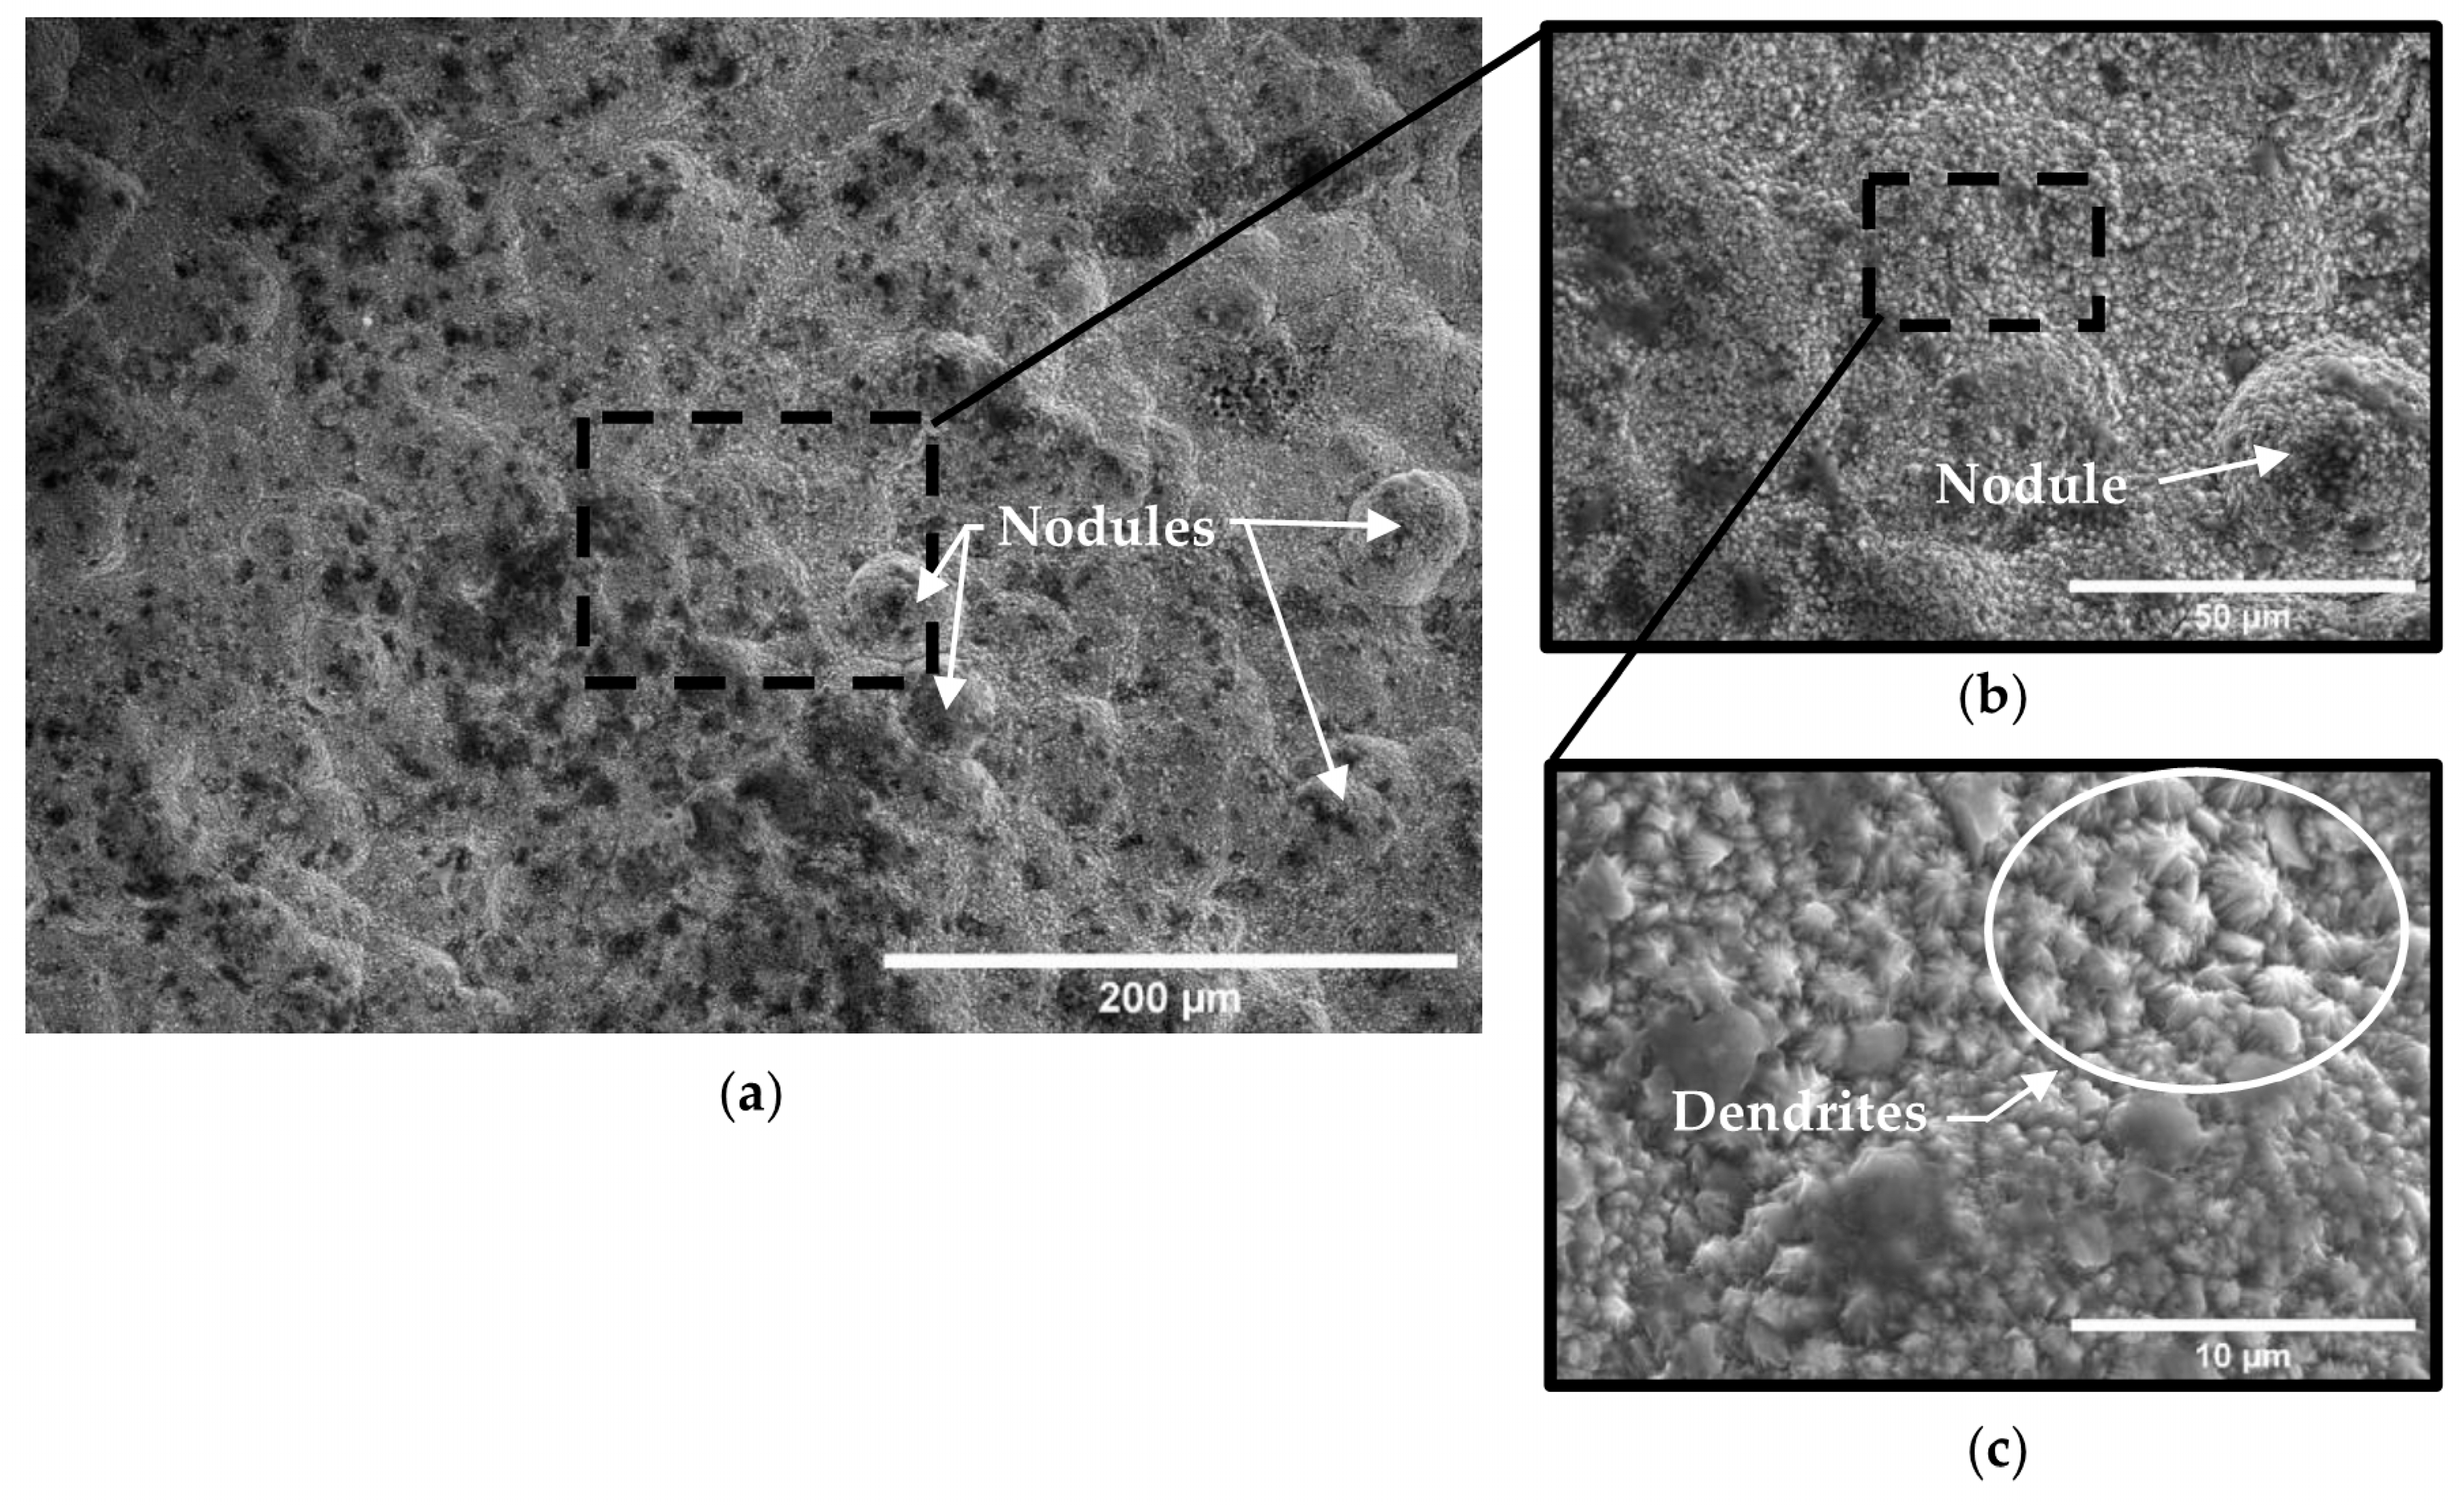
- Increasing the nickel composition appeared to reduce porosity and cracking of the deposit surface, leading to a reduction in the amount of substrate surface area exposed to the environment and improving the protective capability of the coating.
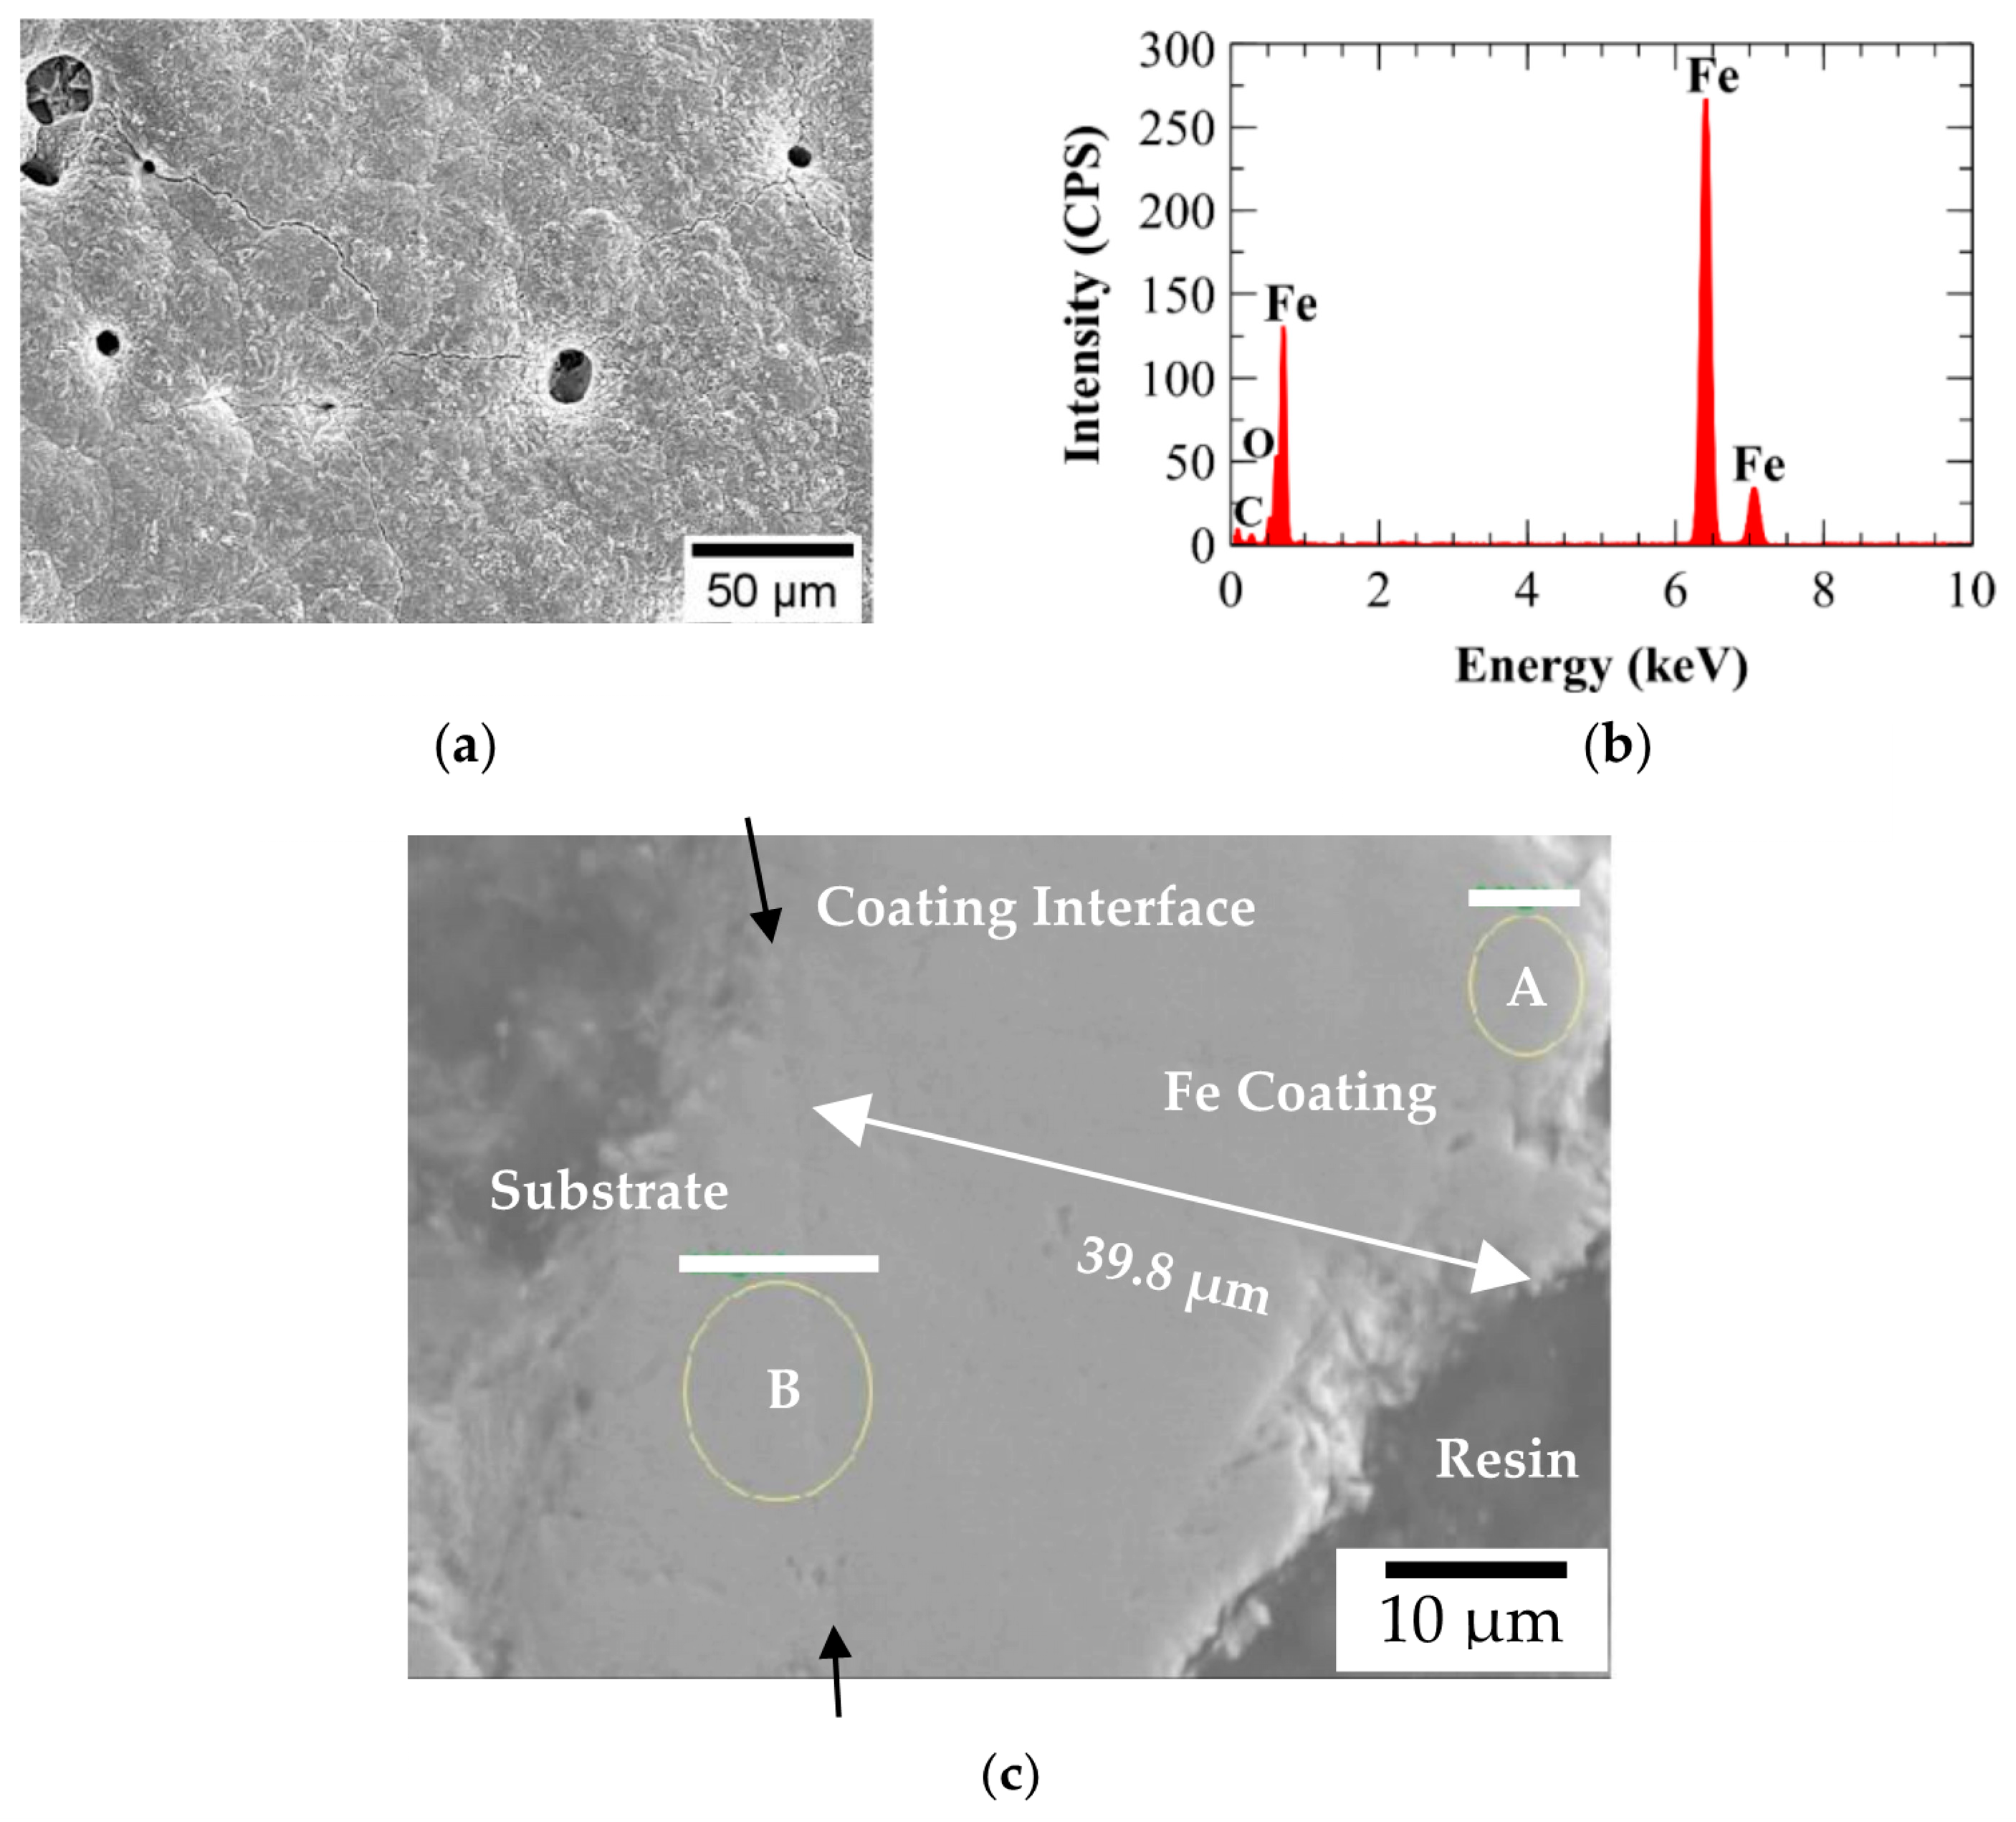
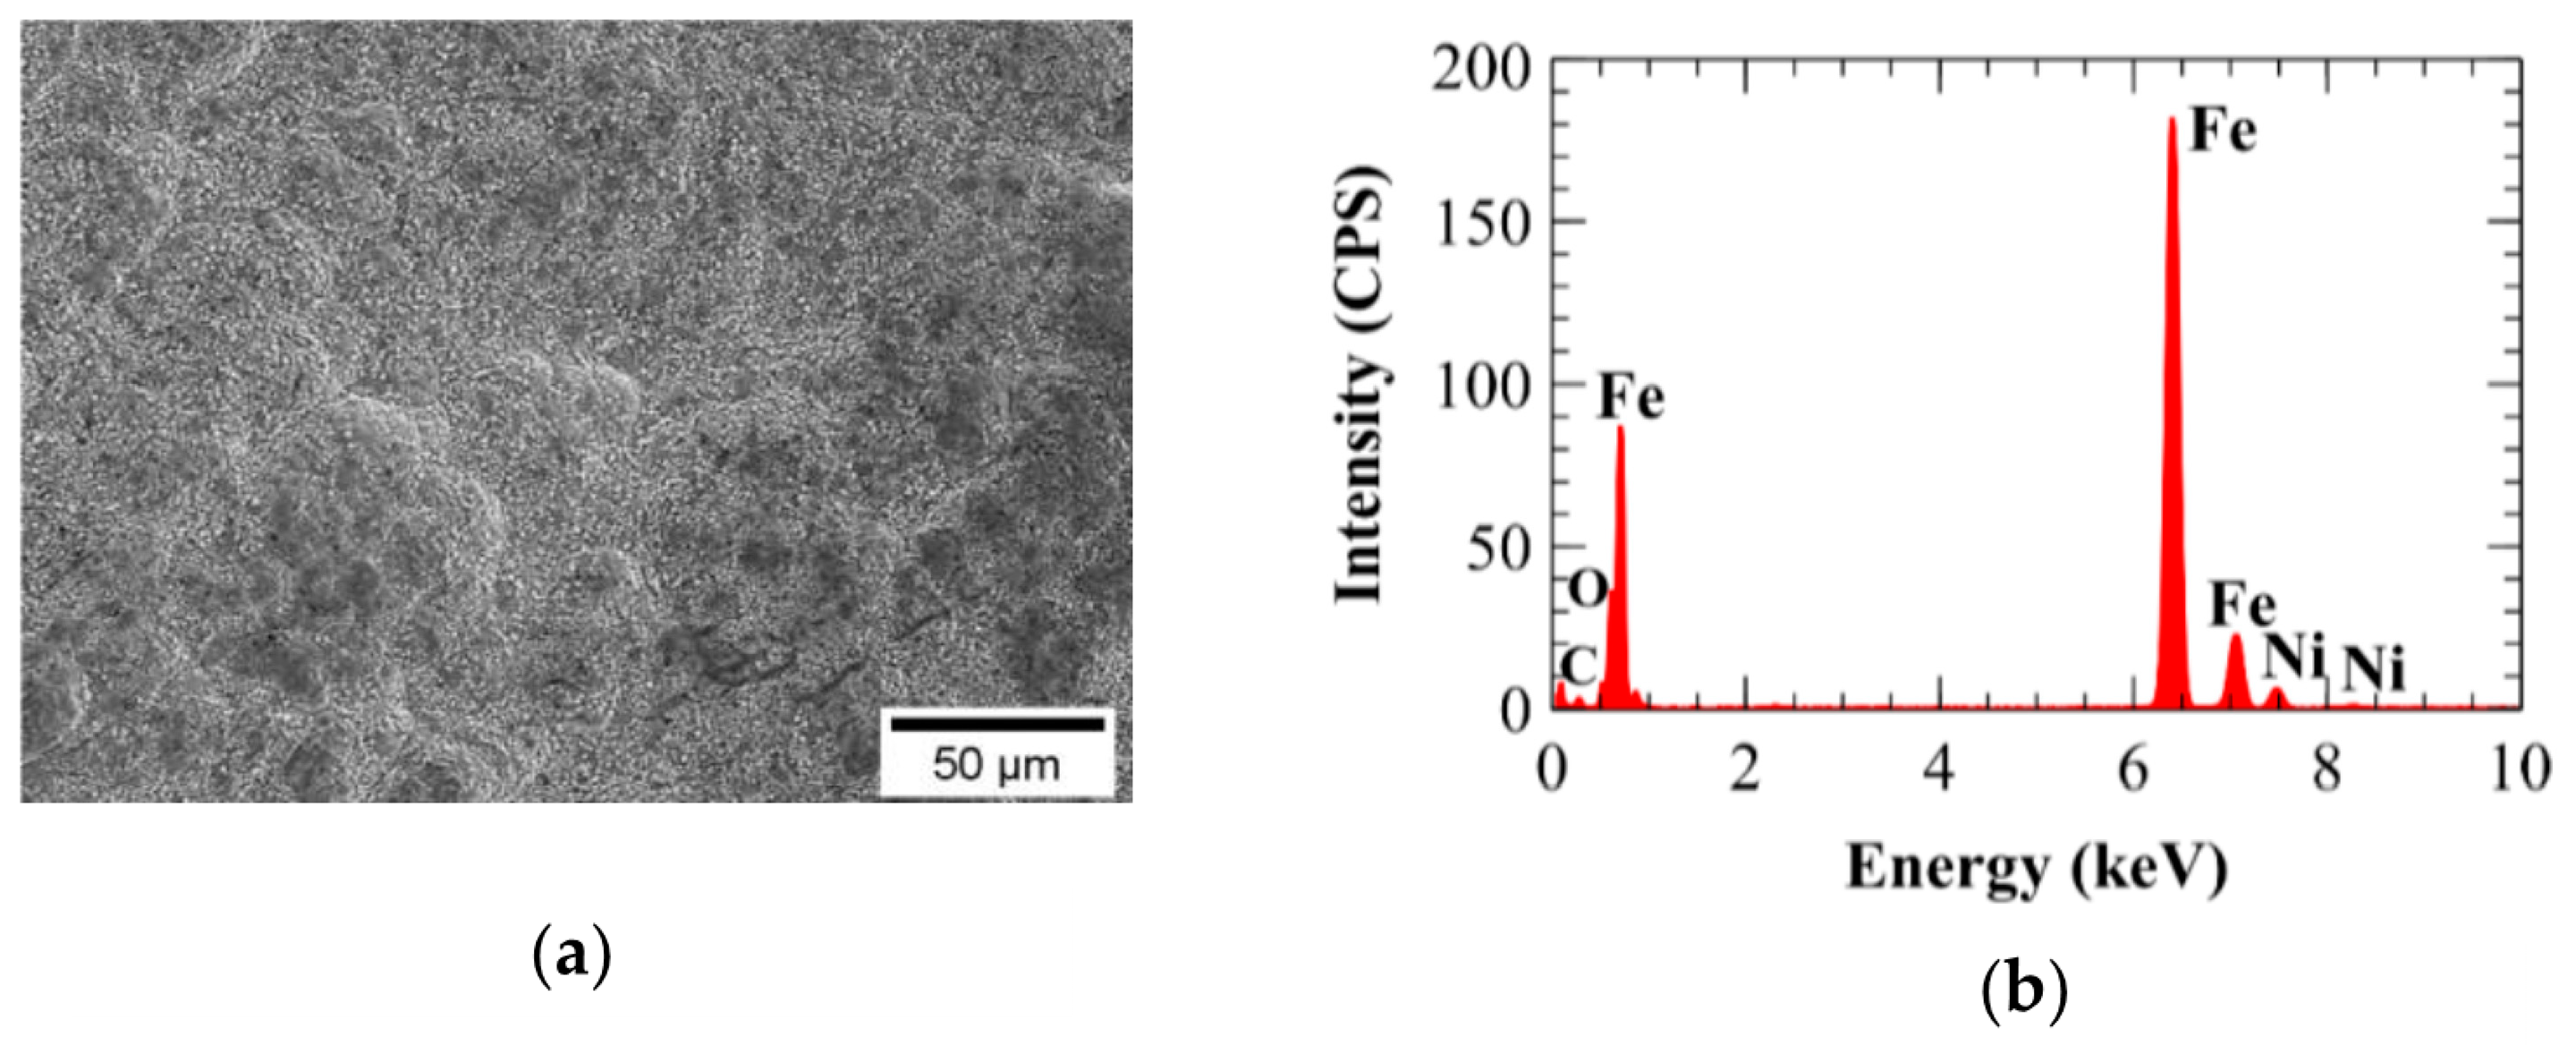
- The addition of ions to the electroplating solution affected the diffusion rate and growth kinetics of the resulting electrodeposit as dendrite structures immerged and grew perpendicularly to the substrate surface with the characteristic branch-like formation spanning about 2 µm in size. The resulting deposits contained a relatively uniform distribution of Ni through the 30–40 µm plating thickness. The 0.05 M Ni bath yielded an average Ni content of 5.15 wt%, while the 0.10 M Ni bath produced an average of 10.51 wt%.
Author Contributions
Funding
Data Availability Statement
Acknowledgments
Conflicts of Interest
References
- ASM International. ASM Handbook Volume 13C: Corrosion: Environments and Industries; Cramer, S.D., Covino, B.S., Jr., Eds.; ASM International: Materials Park, OH, USA, 2006; ISBN 978-0-87170-709-3. [Google Scholar]
- Malik, A.; Meroufel, A.; Al-Fozan, S. Boiler Tubes Failures: A Compendium of Case Studies. J. Fail. Anal. Prev. 2015, 15, 246–250. [Google Scholar] [CrossRef]
- Duarte, C.A.; Espejo, E.; Martinez, J.C. Failure Analysis of the Wall Tubes of a Water-Tube Boiler. Eng. Fail. Anal. 2017, 79, 704–713. [Google Scholar] [CrossRef]
- Dinesh, S.; Jose Anandh Vino, V. Analysis of Corrosive Degradation and Failure of Water Wall Tubes. Mater. Today Proc. 2022, 62, 2168–2172. [Google Scholar] [CrossRef]
- Frayne, C. Boiler Water Treatment: Principles and Practice; Chemical Publishing Co.: New York, NY, USA, 2002. [Google Scholar]
- Revie, R.W.; Uhlig, H.H. Corrosion and Corrosion Control: An Introduction to Corrosion Science and Engineering, 4th ed.; Wiley: Hoboken, NJ, USA, 2008. [Google Scholar]
- Ahmad, Z. Principles of Corrosion Engineering and Corrosion Control; Elsevier: Burlington, MA, USA, 2006. [Google Scholar]
- von Baeckmann, W.; Schwenk, W.; Prinz, W. Handbook of Cathodic Protection: Theory and Practice of Electrochemical Protection Processes, 3rd ed.; Gulf Professional Publishing: Houston, TX, USA, 1997. [Google Scholar]
- Electric Power Research Institute (EPRI). Typical Boiler Tube Damage from Flexible Operation or Cycling; Report No. 3002002086; Electric Power Research Institute (EPRI): Palo Alto, CA, USA, 2013. [Google Scholar]
- Hamblin-Smoske, P. Improve Boiler Reliability with Unit Specific Strategic Planning. In Proceedings of the ASME Power Conference, Baltimore, MD, USA, 28–31 July 2014; American Society of Mechanical Engineers: Baltimore, MD, USA, 2014; Volume 1. [Google Scholar]
- Bornak, W.E. Chemistry of Iron and Its Corrosion Products in Boiler Systems. Corrosion 1988, 44, 154–158. [Google Scholar] [CrossRef]
- Hill, J.W.; Petrucci, R.H. Electrochemistry. In General Chemistry: An Integrated Approach; Prentice-Hall: Saddle River, NJ, USA, 1999; pp. 766–816. [Google Scholar]
- Giurlani, W.; Zangari, G.; Gambinossi, F.; Passaponti, M.; Salvietti, E.; Di Benedetto, F.; Caporali, S.; Innocenti, M. Electroplating for Decorative Applications: Recent Trends in Research and Development. Coatings 2018, 8, 260. [Google Scholar] [CrossRef]
- Inwood, B.C.; Garwood, A.E. Electroplated Coatings for Wear Resistance. Tribol. Int. 1978, 11, 113–119. [Google Scholar] [CrossRef]
- Rybakova, N.; Souto, M.; Martinz, H.-P.; Andriyko, Y.; Artner, W.; Godinho, J.; Nauer, G.E. Stability of Electroplated Titanium Diboride Coatings in High-Temperature Corrosive Media. Corros. Sci. 2009, 51, 1315–1321. [Google Scholar] [CrossRef]
- Ma, L.; Zhou, K.; Li, Z.; Wei, Q.; Zhang, L. Hot Corrosion of a Novel NiO/NiFe2O4 Composite Coating Thermally Converted from the Electroplated Ni–Fe Alloy. Corros. Sci. 2011, 53, 3712–3724. [Google Scholar] [CrossRef]
- Myung, N.V.; Nobe, K. Electrodeposited Iron Group Thin-Film Alloys: Structure-Property Relationships. J. Electrochem. Soc. 2001, 148, C136. [Google Scholar] [CrossRef]
- Cardenas, H.E.; Shrestha, A. Protective Characteristics of Electroplated Iron Applied to Low Carbon Steel. AIP Conf. Proc. 2018, 2022, 020018. [Google Scholar]
- Huang, J.; Cardenas, H. Fatigue Crack Arrest in Mild Steel via Iron Electroplating. Mater. Sci. Appl. 2021, 12, 484–503. [Google Scholar] [CrossRef]
- Bhat, R.S.; Nagaraj, P.; Priyadarshini, S. Zn–Ni Compositionally Modulated Multilayered Alloy Coatings for Improved Corrosion Resistance. Surf. Eng. 2021, 37, 755–763. [Google Scholar] [CrossRef]
- Bhat, R.S.; Shetty, S.M.; Kumar, N.A. Electroplating of Zn-Ni Alloy Coating on Mild Steel and Its Electrochemical Studies. J. Mater. Eng. Perform. 2021, 30, 8188–8195. [Google Scholar] [CrossRef]
- Bhat, R.S.; Balakrishna, M.K.; Parthasarathy, P.; Hegde, A.C. Structural Properties of Zn-Fe Alloy Coatings and Their Corrosion Resistance. Coatings 2023, 13, 772. [Google Scholar] [CrossRef]
- Torabinejad, V.; Aliofkhazraei, M.; Assareh, S.; Allahyarzadeh, M.H.; Rouhaghdam, A.S. Electrodeposition of Ni-Fe Alloys, Composites, and Nano Coatings–A Review. J. Alloys Compd. 2017, 691, 841–859. [Google Scholar] [CrossRef]
- Chaudhari, A.K.; Singh, V.B. A Review of Fundamental Aspects, Characterization and Applications of Electrodeposited Nanocrystalline Iron Group Metals, Ni-Fe Alloy and Oxide Ceramics Reinforced Nanocomposite Coatings. J. Alloys Compd. 2018, 751, 194–214. [Google Scholar] [CrossRef]
- ASTM G16-95; Standard Guide for Applying Statistics to Analysis of Corrosion Data. ASTM International: West Conshohocken, PA, USA, 2010.
- Schneider, C.A.; Rasband, W.S.; Eliceiri, K.W. NIH Image to ImageJ: 25 Years of Image Analysis. Nat. Methods 2012, 9, 671–675. [Google Scholar] [CrossRef]
- ASTM G102-89; Standard Practice for Calculation of Corrosion Rates and Related Information from Electrochemical Measurements. ASTM International: West Conshohocken, PA, USA, 2015.
- ASTM G 59-97; Standard Test Method for Conducting Potentiodynamic Polarization Resistance Measurements. ASTM International: West Conshohocken, PA, USA, 2014.
- Brenner, A. Electrodeposition of the Mutual Alloys of the Iron-Group Metals. In Electrodeposition of Alloys, Principles and Practice; Academic Press: New York, NY, USA, 1963; Volume II. [Google Scholar]
- Tilak, B.V.; Gendron, A.S.; Mosoiu, M.A. Borate Buffer Equilibria in Nickel Refining Electrolytes. J. Appl. Electrochem. 1977, 7, 495–500. [Google Scholar] [CrossRef]
- Popov, B.N.; Yin, K.; White, R.E. Galvanostatic Pulse and Pulse Reverse Plating of Nickel-Iron Alloys from Electrolytes Containing Organic Compounds on a Rotating Disk Electrode. J. Electrochem. Soc. 1993, 140, 1321–1330. [Google Scholar] [CrossRef]
- Matulis, J.; Sližys, R. On Some Characteristics of Cathodic Processes in Nickel Electrodeposition. Electrochim. Acta 1964, 9, 1177–1188. [Google Scholar] [CrossRef]
- Hessami, S.; Tobias, C.W. A Mathematical Model for Anomalous Codeposition of Nickel-Iron on a Rotating Disk Electrode. J. Electrochem. Soc. 1989, 136, 3611–3616. [Google Scholar] [CrossRef]
- Grimmett, D.; Schwartz, M.; Nobe, K. Pulsed Electrodeposition of Iron-Nickel Alloys. J. Electrochem. Soc. 1990, 137, 3414–3418. [Google Scholar] [CrossRef]
- Zech, N.; Podlaha, E.J.; Landolt, D. Anomalous Codeposition of Iron Group Metals: II. Mathematical Model. J. Electrochem. Soc. 1999, 146, 2892–2900. [Google Scholar] [CrossRef]
- Abdel-Karim, R.; Reda, Y.; Muhammed, M.; El-Raghy, S.; Shoeib, M.; Ahmed, H. Electrodeposition and Characterization of Nanocrystalline Ni-Fe Alloys. J. Nanomater. 2011, 2011, 1–8. [Google Scholar] [CrossRef]
- Bedir, M.; Bakkaloğlu, O.F.; Karahan, I.H.; Öztaş, M. A Study on Electrodeposited Ni x Fe1−x Alloy Films. Pramana 2006, 66, 1093–1104. [Google Scholar] [CrossRef]
- Callister, W.D.; Rethwisch, D.G. Materials Science and Engineering: An Introduction, 8th ed.; Wiley: Hoboken, NJ, USA, 2009. [Google Scholar]
- Dini, J.W. Electrodeposition: The Materials Science of Coatings and Substrates; Noyes Publications: Park Ridge, NJ, USA, 1993. [Google Scholar]
- Petrucci, R.; Herring, G.; Madura, J.; Bissonnette, C. General Chemistry: Principles and Modern Applications, 10th ed.; Pearson: Toronto, ON, Canada, 2011. [Google Scholar]
- Gutman, E.M. Mechanochemistry of Materials; Cambridge International Science Publishing: London, UK, 1998. [Google Scholar]
- Gutman, E.M. Mechanochemistry of Solid Surfaces; World Scientific Publishing: Singapore, 1994. [Google Scholar]
- Evans, A.G.; Hutchinson, J.W. The Thermomechanical Integrity of Thin Films and Multilayers. Acta Metall. Mater. 1995, 43, 2507–2530. [Google Scholar] [CrossRef]
- Wang, Y.; Xu, L.; Sun, J.; Cheng, Y.F. Mechano-Electrochemical Interaction for Pipeline Corrosion: A Review. J. Pipeline Sci. Eng. 2021, 1, 1–16. [Google Scholar] [CrossRef]
- Bratsch, S.G. Standard Electrode Potentials and Temperature Coefficients in Water at 298.15 K. J. Phys. Chem. Ref. Data 1989, 18, 1–21. [Google Scholar] [CrossRef]
- Trasatti, S. Work Function, Electronegativity, and Electrochemical Behaviour of Metals. J. Electroanal. Chem. Interfacial Electrochem. 1972, 39, 163–184. [Google Scholar] [CrossRef]
- Compton, R.G.; Banks, C.E. Understanding Voltammetry, 3rd ed.; World Scientific: Singapore, 2018. [Google Scholar]
- Ning, Z.; He, Y.; Gao, W. Mechanical Attrition Enhanced Ni Electroplating. Surf. Coat. Technol. 2008, 202, 2139–2146. [Google Scholar] [CrossRef]
- Landolt, D. Electrochemical and Materials Science Aspects of Alloy Deposition. Electrochem. Acta 1994, 39, 1075–1090. [Google Scholar] [CrossRef]


| Carbon (Max) | Manganese (Max) | Phosphorus (Max) | Sulfur (Max) | Silicon (Min) |
|---|---|---|---|---|
| 0.27 | 0.93 | 0.035 | 0.035 | 0.10 |
| Property | Value |
|---|---|
| Tensile Strength, min, ksi [MPa] | 60 [415] |
| Yield Strength, min, ksi [MPa] | 37 [255] |
| Elongation in 2 in. or 50 mm, min, % | 30 |
| Designation | Chemicals | Concentration (mol/L) |
|---|---|---|
| 0.00 M Ni | 0.60 | |
| 0.05 M Ni | 0.60 0.05 | |
| 0.10 M Ni | 0.60 0.10 |
| Groups | (V) | SD (V) | t-Stat | df | p-Value | |
|---|---|---|---|---|---|---|
| 20 °C | ||||||
| Unplated | −0.549 | 0.067 | 18 | - | - | - |
| 0.00 M Ni | −0.679 | 0.042 | 6 | 5.506 | 14 | <0.001 |
| 0.05 M Ni | −0.558 | 0.013 | 6 | 0.540 | 20 | 0.595 |
| 0.10 M Ni | −0.505 | 0.040 | 6 | 1.937 | 15 | 0.073 |
| 60 °C | ||||||
| Unplated | −0.518 | 0.069 | 18 | - | - | - |
| 0.00 M Ni | −0.670 | 0.131 | 6 | 2.719 | 6 | 0.042 |
| 0.05 M Ni | −0.599 | 0.027 | 6 | 4.123 | 21 | <0.001 |
| 0.10 M Ni | −0.559 | 0.011 | 6 | 2.430 | 19 | 0.025 |
| Groups | (mm/yr) | SD (mm/yr) | t-Stat | df | p-Value | |
|---|---|---|---|---|---|---|
| 20 °C | ||||||
| 1:1 A/C | 0.089 | 0.042 | 6 | - | - | - |
| 10:1 A/C | 0.074 | 0.021 | 6 | 0.764 | 7 | 0.470 |
| 100:1 A/C | 0.027 | 0.016 | 6 | 3.332 | 6 | 0.016 |
| 10:1 A/C | 0.074 | 0.021 | 6 | - | - | - |
| 100:1 A/C | 0.027 | 0.016 | 6 | 4.268 | 9 | 0.002 |
| 60 °C | ||||||
| 1:1 A/C | 0.339 | 0.176 | 6 | - | - | - |
| 10:1 A/C | 0.287 | 0.136 | 5 | 0.559 | 9 | 0.592 |
| 100:1 A/C | 0.051 | 0.025 | 6 | 3.972 | 5 | 0.011 |
| 10:1 A/C | 0.287 | 0.136 | 5 | - | - | - |
| 100:1 A/C | 0.051 | 0.025 | 6 | 3.826 | 4 | 0.019 |
| Specimen Bath Designation | βa (mV/Decade) | βc (mV/Decade) | (µA/cm2) | Rp (Ω·cm2) | EW (g) | CR (mm/yr) |
|---|---|---|---|---|---|---|
| Uncoated | 281 | 231 | 11.4 | 4839 | 27.92 | 0.13 |
| 0.00 M Ni | 305 | 216 | 7.6 | 7239 | 27.92 | 0.09 |
| 0.05 M Ni | 428 | 356 | 12.0 | 7051 | 28.00 | 0.14 |
| 0.10 M Ni | 364 | 481 | 13.5 | 6660 | 28.07 | 0.16 |
| Surface Feature | 0.00 M Ni Bath | 0.05 M Ni Bath | 0.10 M Ni Bath |
|---|---|---|---|
| Surface pore area density (µm2/µm2) | 0.01 | 0.00 | 0.00 |
| Crack length density (µm/µm2) | 0.0087 | 0.0247 | 0.0122 |
| Avg. crack width (µm) | 0.53 | 0.31 | 0.22 |
| Calculated anode-to-cathode area ratio | 66 | 128 | 363 |
| Specimen Bath Designation | Location | Si | P | S | Mn | Fe | Ni |
|---|---|---|---|---|---|---|---|
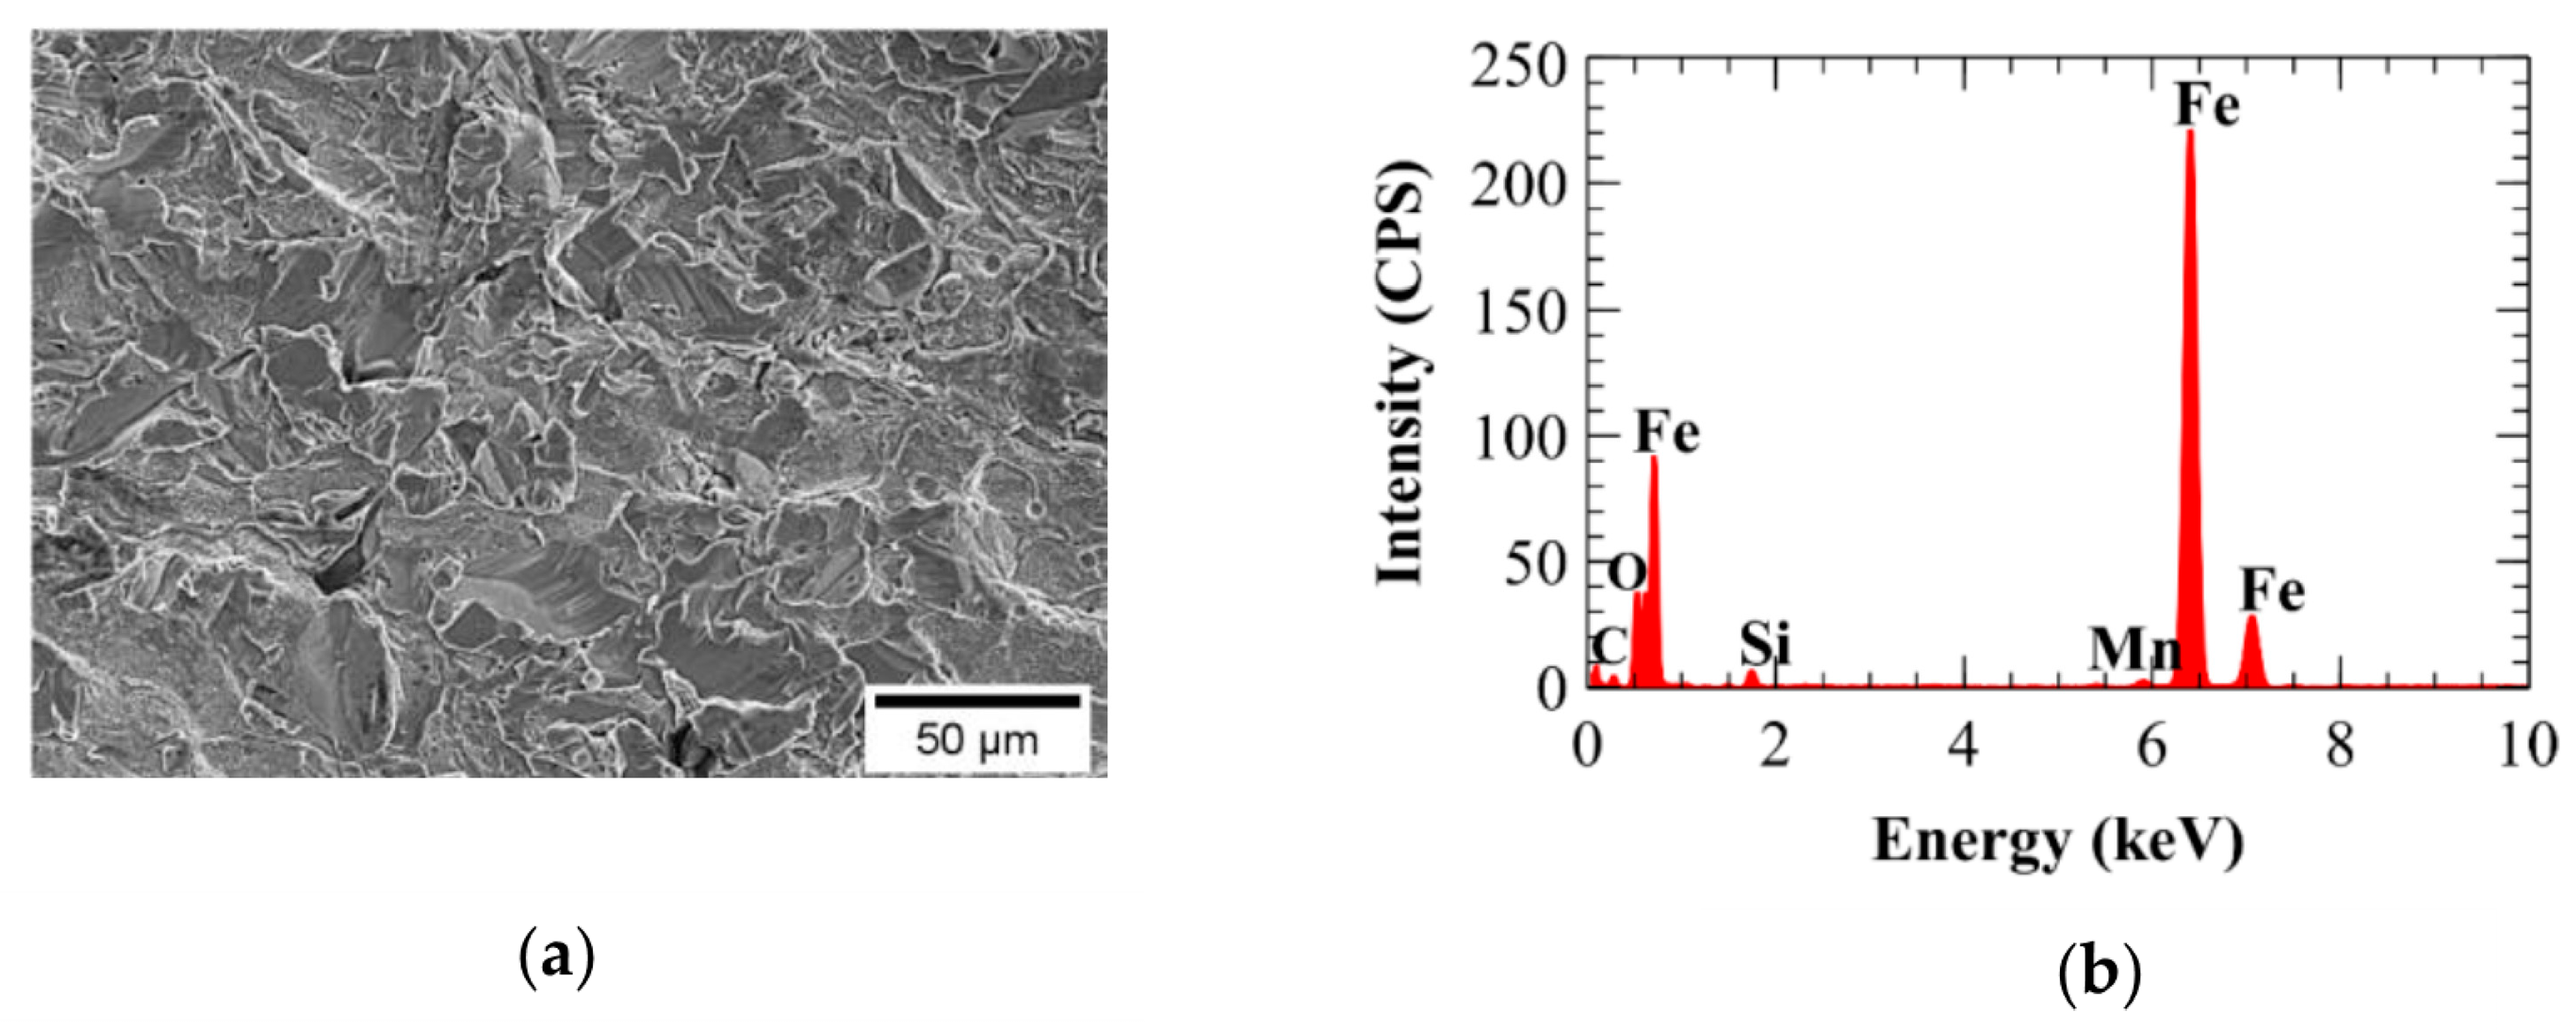
| 0.00 M Ni (Figure 15c) | A (coating) | 0.03 | 0.00 | 0.05 | 0.00 | 99.92 | 0.00 |
| B (substrate) | 0.04 | 0.03 | 0.03 | 0.20 | 99.69 | 0.00 | |
| 0.05 M Ni (Figure 16c) | A (coating) | 0.02 | 0.00 | 1.65 | 0.02 | 92.11 | 6.20 |
| B (coating) | 0.00 | 0.06 | 2.03 | 0.06 | 93.10 | 4.75 | |
| C (coating) | 0.03 | 0.04 | 2.22 | 0.10 | 90.79 | 6.64 | |
| D (coating) | 2.14 | 0.10 | 2.01 | 0.66 | 92.08 | 3.01 | |
| E (substrate) | 0.31 | 0.05 | 1.04 | 0.00 | 98.04 | 0.56 | |
| F (substrate) | 0.00 | 0.06 | 0.94 | 0.00 | 98.65 | 0.35 | |
| 0.10 M Ni | A (coating) | 0.11 | 0.01 | 0.06 | 0.00 | 89.30 | 10.52 |
| B (coating) | 0.07 | 0.00 | 0.00 | 0.21 | 89.21 | 10.50 | |
| C (substrate) | 0.18 | 0.00 | 0.00 | 0.70 | 98.58 | 0.54 | |
| D (substrate) | 0.08 | 0.04 | 0.11 | 0.88 | 98.87 | 0.01 |
Disclaimer/Publisher’s Note: The statements, opinions and data contained in all publications are solely those of the individual author(s) and contributor(s) and not of MDPI and/or the editor(s). MDPI and/or the editor(s) disclaim responsibility for any injury to people or property resulting from any ideas, methods, instructions or products referred to in the content. |
© 2025 by the authors. Licensee MDPI, Basel, Switzerland. This article is an open access article distributed under the terms and conditions of the Creative Commons Attribution (CC BY) license (https://creativecommons.org/licenses/by/4.0/).
Share and Cite
Hudson, J.A.; Cardenas, H.E. Corrosion Behavior of Fe-Ni Electrodeposited Coatings in Weak Ammonium Hydroxide Solution. Corros. Mater. Degrad. 2025, 6, 15. https://doi.org/10.3390/cmd6020015
Hudson JA, Cardenas HE. Corrosion Behavior of Fe-Ni Electrodeposited Coatings in Weak Ammonium Hydroxide Solution. Corrosion and Materials Degradation. 2025; 6(2):15. https://doi.org/10.3390/cmd6020015
Chicago/Turabian StyleHudson, Joel Andrew, and Henry E. Cardenas. 2025. "Corrosion Behavior of Fe-Ni Electrodeposited Coatings in Weak Ammonium Hydroxide Solution" Corrosion and Materials Degradation 6, no. 2: 15. https://doi.org/10.3390/cmd6020015
APA StyleHudson, J. A., & Cardenas, H. E. (2025). Corrosion Behavior of Fe-Ni Electrodeposited Coatings in Weak Ammonium Hydroxide Solution. Corrosion and Materials Degradation, 6(2), 15. https://doi.org/10.3390/cmd6020015