Article

Evaluation of the Effect of Dual-Stage Aging and RRA on the Hardening and Corrosion Resistance of AW7075 Alloy

by
Aleksandra Ładak
1,
Mateusz Cichoń
1 and
Marzena Lachowicz
2,*
1
Faculty of Mechanical Engineering, Wroclaw University of Science and Technology, Łukasiewicza 5, 50-371 Wroclaw, Poland
2
Department of Metal Forming, Welding Technology and Metrology, Wroclaw University of Science and Technology, Łukasiewicza 7-9, 50-371 Wroclaw, Poland
*
Author to whom correspondence should be addressed.
Corros. Mater. Degrad. 2022, 3(1), 142-159; https://doi.org/10.3390/cmd3010008
Submission received: 19 December 2021 / Revised: 2 February 2022 / Accepted: 2 March 2022 / Published: 3 March 2022

Abstract

:
The corrosion resistance of the AW7075 alloy after RRA treatment was evaluated. The corrosion rate in the NSS test was assessed and the electrochemical parameters were determined. The results were compared with the results obtained for the alloy subjected to conventional aging (T6) and dual-stage aging (DA). In order to determine the state of alloy hardening, the tests were carried out simultaneously with the material hardness measurements and microscopic examinations. The hardness of the AW7075 alloy increased in the following order: DA < T6 < RRA. The tests revealed that the achieved increase in strengthening was correlated with the preservation of high resistance to general corrosion of the alloy after RRA treatment. After the corrosion tests, SEM microscopic observations were also carried out to determine the corrosion features. The corrosion rate can be arranged in the following order: RRA < T6 ≈ DA. At the same time, the alloy after RRA was characterized by the lowest value of the corrosion potential and the open circuit. The corrosion potential value can be presented in increasing order: RRA < T6 ≈ DA. The corrosion behavior of the aluminum alloy after dual-stage aging was similar to that of T6. However, it was accompanied by a decline in hardening.

1. Introduction

High-strength 7000 series aluminum alloys have been widely used in the aerospace industry due to their unique properties [1,2,3,4,5,6,7]. Their high strength properties are obtained through heat treatment, during which conventional methods of precipitation hardening based on supersaturation and subsequent aging are usually used. However, even a subtle change in the microstructure of a material can significantly translate into its performance properties, including corrosion resistance [8,9,10]. Therefore, research in this area is largely focused on the balance between corrosion resistance and strength. Proper control of the morphological features of the microstructure of these alloys allows control of the properties of these materials [1].
Single-stage aging treatment to the T6 state provides high strength but is associated with high susceptibility to stress corrosion cracking (SCC) [2,6,7,11,12]. The SCC mechanisms in high-strength 7000 series alloys have been associated with hydrogen-induced cracking, anodic dissolution-assisted cracking, and passive layer cracking [5,13,14]. In particular, the authors noted a strong relationship between alloy state and hydrogen interaction [15,16,17]. SCC has been linked to the hydrogen generation and diffusion before the crack tip [13]. Cooper et al. [14] also observed environment acidification at the crack peak. There is evidence that metallurgical features, particularly grain boundary precipitates (GBPs), affect the SCC resistance. The properties of these precipitates are mainly determined by the chemical composition, electrochemical activity, size, and distribution of GBPs [1,2,13,17,18,19]. The higher corrosion susceptibility of the T6 alloy is attributed to the continuous distribution of GBPs providing corrosion channels for anodic dissolution. These continuous chain-like precipitates are distributed along grain boundaries and make the alloy susceptible to stress corrosion cracking [2,7].
It has been demonstrated that the application of the over-aging to T7X states improves the low SCC susceptibility of 7000 series alloys; however, it is associated with a significant decrease in strength and hardness properties [2,4,6,11,12,13,15,20,21]. The low susceptibility of the over-aged alloy to SCC was explained by the presence of large-phase precipitates, whose presence altered the crack growth conditions and favored hydrogen trapping [15]. In order to improve resistance to SCC while maintaining high strength, the dual-stage aging (DA) has been proposed [2,22,23]. The first aging stage of the DA heat treatment process is characterized by relatively low temperature compared to conventional aging, which is responsible for the diffuse and uniform distribution of GP zones. The coarse GP zones and phases formed during the second aging contribute to the hardness peak. The strength of the experimental alloy increases by 9.6% (33.2 MPa) and the susceptibility to the SCC decreases by 38.9% when using the second peak aging regime instead of the conventional T73 state [22]. Emani et al. [23] believed that the DA treatment results in an acceleration of the kinetics of the precipitation of the alloy strengthening phase. Compared to classical single-stage aging to the T6 state, matrix precipitates (MPs) after DA treatment are fragmented and partially converted into an incoherent η phase, resulting in reduced strength but increased ductility [24].
The third Retrogression and Reaging (RRA) heat treatment involving multi-stage aging treatments provides better control over the resulting precipitates responsible for strengthening, and thus increases the chance of obtaining a microstructure that will provide a favorable combination of mechanical strength and corrosion susceptibility [3,4,7,19,20,24]. Retrogression involves heating of the previously precipitation-strengthened alloy at temperatures in the range of 200–260 °C for a short time (120s), followed by Reaging typical of T6 peak aging [1,2,6]. The application of retrogression leads to a partial dissolution of the unstable precipitates formed during the first aging. This is accompanied by an increase in the size of the stable precipitates [12]. It also leads to a decrease in dislocation density compared to the state after supersaturation [16]. Reaging aims to restore the alloy strengthening, which decreases during the retrogression treatment as a consequence of the increase in precipitations [1]. The application of RRA treatment makes it possible to obtain a microstructure characterized by the presence of finely dispersed MgZn2 matrix precipitates (MPs) in the grains that are characteristic for the T6 state (and by fragmented, discontinuous precipitates occurring along grain boundaries (GBPs) typical of T7X over-aging [2,6,7,13,20,25]). Thus, the grain boundary line previously blocked by continuous GBPs precipitates is transformed into a state where η phase precipitates are coarse and discontinuous [4,6,24,26]. The volume proportion of GP zones also decreases [26]. This significantly reduces the susceptibility of the alloy to SCC, while still maintaining the strength typical of T6 [2]. Resistance to the SCC has also been linked to the provision of low dislocation density after the reaging stage [16]. Thick GBP precipitates act as hydrogen trapping sites, which limit the hydrogen content around grain boundaries [13]. Zielinski et al. [16,27] also linked the good resistance to SCC to the possibility of hydrogen trapping by numerous interfacial boundaries present after RRA, especially those providing high coherence with the matrix. Meanwhile, Park et al. [18] linked the enhanced resistance to the SCC with the reduction in copper concentration in the precipitate-free zone (PFZ). The susceptibility to SCC is also largely attributed to the existence of precipitate-free zones (PFZ) near grain boundaries. RRA treatment makes it possible to obtain wide PFZs [24]. Its widening is also favored by the combination of high temperature and stress [28]. The presence of wide PFZs has a beneficial effect on stress relaxation, which reduces the probability of fatigue crack formation [29]. In addition, the low strength of the precipitate-free zone (PFZ) promotes plastic deformation in this region and thus intergranular cracking [29]. Consequently, the RRA is characterized by high resistance to fatigue crack initiation [30,31]. A clear contribution of the matrix to crack development is also observed [16,27].
The literature data indicate a significant effect of regression parameters on the obtained properties of aluminum alloys. With an increase in regression time, there is an increase in impact toughness as the size of GBPs grows along with their discreteness, which leads to the grain boundary being unblocked [6]. The best level of strengthening is obtained if the regression is terminated at the stage where the precipitates reach a size typical of the shearing (Friedel effect)/Orowan looping dislocation [12]. It has been suggested that for some alloys, the strength after RRA treatment can be higher than in the T6 state [2,32]. In addition, the retrogression time plays an important role, as reducing the regression time with high temperatures can help achieve high alloy strengthening. Reda et al. [33] indicated that the most optimal properties are obtained with retrogression conducted at 200 C. Similar observations were made by the authors of [32]. Increasing the temperature and reducing the regression time positively affect the resistance to SCC [16]. It was also found that cyclic repetition of regression significantly influences the precipitates at grain boundaries (GBPs), while the precipitates distributed in the matrix (MPs) are affected only to a slight extent [2]. The search for optimal properties is also favored by the possibility of applying various aging parameters after the regression [34]. Good results can also be obtained by the combination of the RRA heat treatment with thermomechanical treatment [23,35], as well as the use of plastic forming during the aging process [36]. A number of patented parameters for treatments conducted at lower temperatures but longer times have also been developed based on RRA heat treatment [1]. It has found application not only in solid alloys but also in coating systems applied to aluminum alloys of other series [37,38].
Providing an optimal microstructure from the point of view of SCC and mechanical properties of SCC may be associated with an increase in susceptibility to other types of corrosion. An important indicator in assessing the susceptibility of aluminum alloys to corrosion turns out to be electrical conductivity, which shows a relationship with the microstructure and properties of 7000 series alloys [6,24,32,39,40,41]. Significant potential differences contribute to the rate of formation and amount of galvanic corrosion between the matrix and (GBPs) or (PFZs) [40]. Therefore, 7000 series alloys are particularly susceptible to intergranular corrosion and exfoliation [3,4,7,19,32,41]. The unfavorable effect of alloy aging may be associated with PFZ widening near the grain boundaries [11,29] and the reduction in copper content in them [18]. This leads to reduced resistance to intergranular corrosion. The continuous η phase at grain boundaries makes it a very good anodic pathway for the development of intergranular corrosion [3,29]. The rate of anodic dissolution along grain boundaries can be hindered by increasing the size and spacing of GBP precipitates, reducing the susceptibility to intergranular corrosion [29,42]. According to Wang et al. [3], material after RRA shows less susceptibility to intergranular corrosion. Ren et al. [43] showed that intergranular corrosion resistance (IGC) is ranked in the following order: T6 < RRA < T76 < T74 [43]. Wang et al. [2] also showed that the T6 alloy displayed a higher intergranular corrosion (IGC) susceptibility than the alloy after RRA treatment. The alloy after dual-stage aging was found to be most resistant to IGC. A similar sequence of the strengthening states of 7000 series alloys were shown for exfoliation resistance [43]. According to Li et al. [4], the exfoliation resistance of the AW7150 alloy after RRA treatment is similar to the T73 state. When the aging level increases, the precipitates at grain boundaries reduce the potential difference, and the intra-grain precipitates make the surrounding matrix more susceptible to dissolution. Therefore, pitting corrosion is more likely to occur in aged alloys [44]. The AW7055 alloy after RRA treatment showed better corrosion resistance than single-stage aging with 10% hardness loss [7].
The literature review indicates a significant effect of RRA treatment on the resistance to structural corrosion, such as stress corrosion cracking, intergranular corrosion, or exfoliation corrosion. However, there are no reports on the effect of RRA treatment on the overall corrosion rate of the AW7075 alloy. Therefore, the corrosion resistance of the AW7075 alloy after RRA treatment was evaluated. The results were compared with the results obtained for the alloy subjected to conventional aging (T6) and dual-stage aging (DA). In order to determine the state of alloy strengthening, the tests were carried out simultaneously with the material hardness measurements.

2. Material and Methodology of Research

The research focused on the AW7075 aluminum alloy. The chemical composition of the tested alloy determined by LECO GDS500A (Leco Corporation, St. Joseph, Michigan, USA) glow discharge optical spectrometry (GD OES) is presented in Table 1.
The parameters of four different heat treatments of 30 mm× 100 mm coupons cut from a 10 mm thick sheet tested material were developed (Figure 1). Microstructure investigations were performed on conventionally prepared metallographic micro-sections using a Leica DM6000M (Leica Microsystems, Wetzlar, Hesse, Germany) metallographic microscope and scanning electron microscopy (SEM) using a JEOL 5800 LV scanning electron microscope coupled with an energy-dispersive X-ray microanalysis system ISIS 300 (Oxford instruments, Abingdon, Oxfordshire, UK). The microscopic examinations were carried out before and after etching with a 10% aqueous solution of HF. In order to determine the material strengthening, hardness measurements were carried out by means of the Brinell method and DuraJet G5 hardness tester (Struers, Detroit, Cleveland, USA). The tests were carried out on grinded heat-treated sheet metal coupons using a 2.5 mm ball. The test forces of 1839 N (equivalent to a force diameter index of 30) were applied. The initial force application time was 2 s and the test force was maintained for 10 s. Five measurements were made at ambient temperature for each heat treatment state, determining an average of the measurements and standard deviation. In order to compare the hardness with the state before the precipitate strengthening, hardness measurements were carried out immediately after supersaturation (S state). Due to the low hardness of the material in this state and the limitations of the hardness tester scale, the hardness was measured using the Vickers method and a LECO LC100 (Leco Corporation, St. Joseph, Michigan, USA) hardness tester. The hardness obtained was then converted to Brinell scale units.
The general corrosion resistance of the tested materials was evaluated based on the weight loss of 30 mm × 30 mm sheet metal coupons subjected to the NSS (Neutral Salt Spray) test in the salt chamber VLM CCT 400 FL (VLM, Bielefeld, Germany). Three coupons were tested for each condition of heat treatment. The results are given as an average of measurements with determination of the standard deviation. The tests were conducted in accordance with PN-EN ISO 9227:2017-06 under the following conditions:
  • Temperature inside the chamber: + 35°C ± 0.4 °C;
  • Brine concentration: 5.00%;
  • Salt spray precipitation: 1.5 mL/h;
  • Brine pH: 8.06 ± 0.6;
  • pH of the collected solution: 6.90 ± 0.06;
  • Density of the collected solution 1.033 ± 0.002 g/cm3;
  • Test duration: 144 h.
The corrosion rate was evaluated according to ASTM G1, indicating the relationship between the corrosion rate (CR) and the coupon mass lost during the test (for an alloy density of 2.81 g/cm 3). The formula was used in the calculation:
CR = K W A T D
where:
  • K—constant equal to 8.76 × 10⁴;
  • W—weight loss (g);
  • A—surface area (cm2);
  • T—exposure time (h);
  • D—density (g/cm3).
Resistance to corrosion was also determined on the basis of electrochemical measurements, which were carried out using methods involving measurement of the open-circuit potential (stationary) E0 and recording of the relation i = f(E) during polarization tests in a three-electrode measuring system. The automated measuring system consisted of a measuring vessel, an ATLAS 0531 ELEKTROCHEMICAL UNIT & IMPEDANCE ANALYSER (Atlas-Sollich, Gdansk, Poland), and a computer controller with AltasCorr05 software (Atlas-Sollich, Gdansk, Poland). The counter electrode made of austenitic steel was placed directly in the measuring vessel. A saturated chlorosilver electrode (Ag/AgCl) was used as the reference electrode. The potential value of this electrode relative to a standard hydrogen electrode was +0.196 V according to EN ISO 17475:2010. The time between coupon preparation and testing was a minimum of 24 h. The surface area of the test electrode (coupon) was 0.785 cm2. Before measurement, each coupon was kept in a 3.5% NaCl solution and room temperature to stabilize the stationary potential, after which it was polarized in the same solution in the anodic direction at a rate of dE/dt = 1 mV/s. The initial potential value was determined based on the stationary potential values, assuming a value about 200 mV lower. Tests were carried out on three samples for each state of heat treatment. The results were presented as an example polarization curve and summarized in the form of electrochemical parameters: stationary potential E0, corrosion potential Ecorr, and corrosion current density icorr. The parameters were determined as an average of three measurements with determination of the standard deviation.

3. Results and Discussion

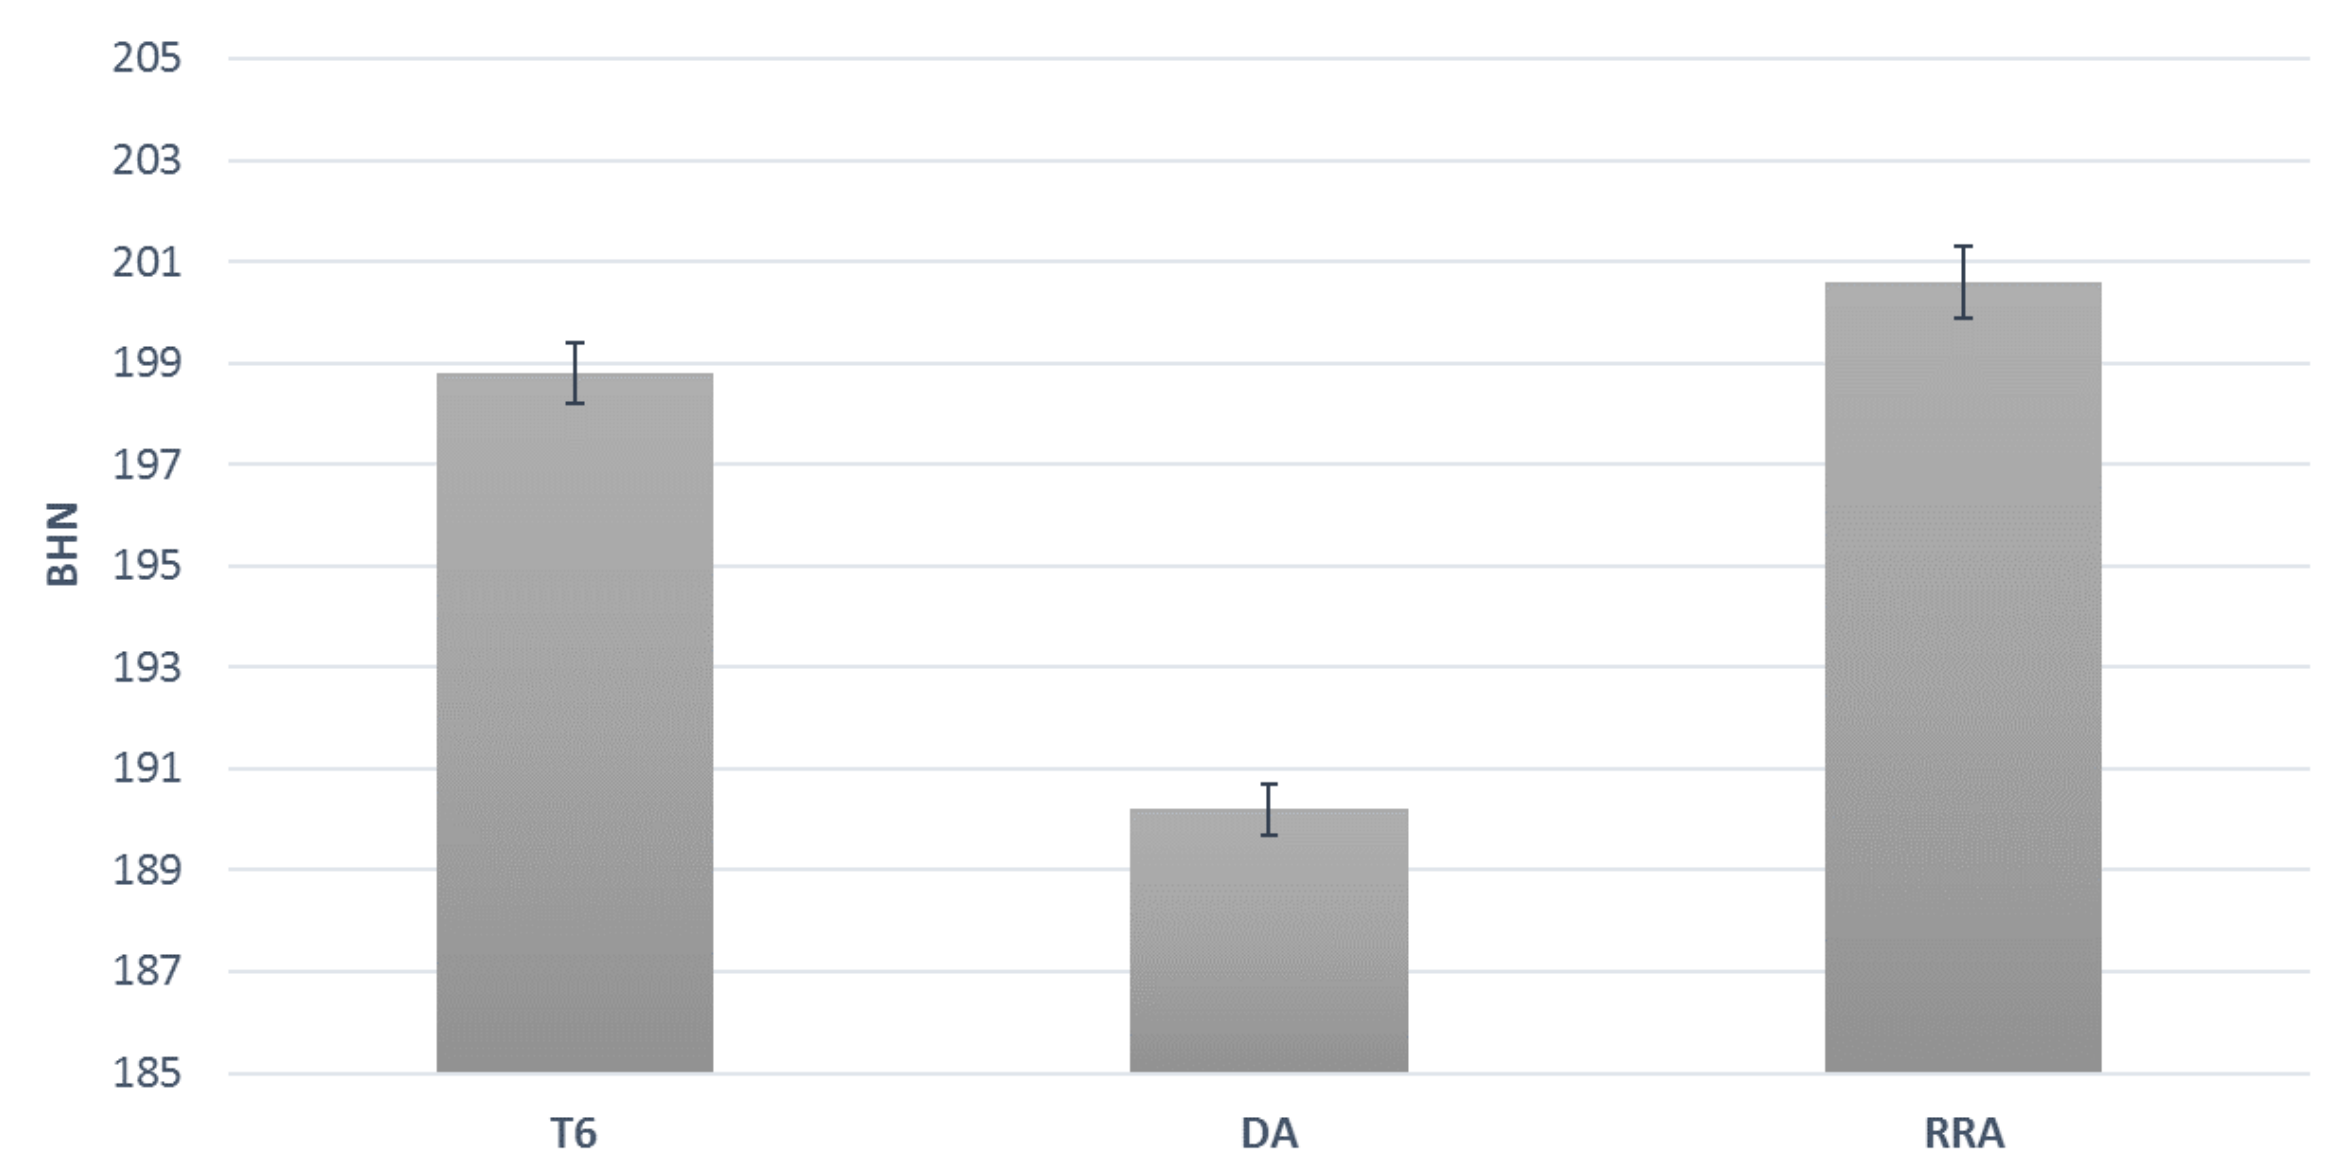
3.1. Hardness Measurements

The RRA heat treatment aimed to increase resistance to stress corrosion cracking while maintaining a high strength level. An important indicator in this respect is the hardness value. On the basis of the measurements carried out, it can be stated that the proposed heat treatment affected the material strength level (Figure 2). It was found that the hardness of the AW7075 alloy increased in the following order: DA < T6 < RRA. The highest hardness of the AW7075 alloy was achieved after RRA heat treatment, while the material subjected to heat treatment to obtain the T6 state was slightly lower. It is worth noting that the dual-stage aging applied adversely affected the strengthening of the alloy, as the hardness after this process was lowest. In comparison, Wang et al. [41] reported a 10% increase in hardness compared to T6. The increase in strength is related on the one hand to precipitation hardening, but also to the reduction in defects in the matrix. The time of the applied regression was short, which positively influenced the final hardness of the material. Ozer et al. [6] indicated that the use of short regression times (up to 10 min) increases the hardness due to an increase in the proportion of transition phases in the microstructure compared to the peak-aged state. Park et al. [11] also confirmed that a high hardening level after RRA is associated with a higher volume fraction of particles in the microstructure. The use of longer times contributes to the formation of larger precipitates, which may result in a decrease in the strengthening compared to the T6 state [7].
The material before the precipitation strengthening (supersaturated-state S) was characterized by a low hardness of 100 ± 2 HV0.5, which corresponds to 95 HB. The tests were also repeated for the coupon 14 days after supersaturation. The obtained results confirmed the ability of the alloy to natural aging, as after this period, the hardness of the material was 152 ± 1 HBW 2.5/187.5. The value of hardness after supersaturation and natural aging (T4 state) was thus about 50% higher than that of the S state. On the other hand, the naturally aged alloy had a significantly lower hardness than the artificially aged material.

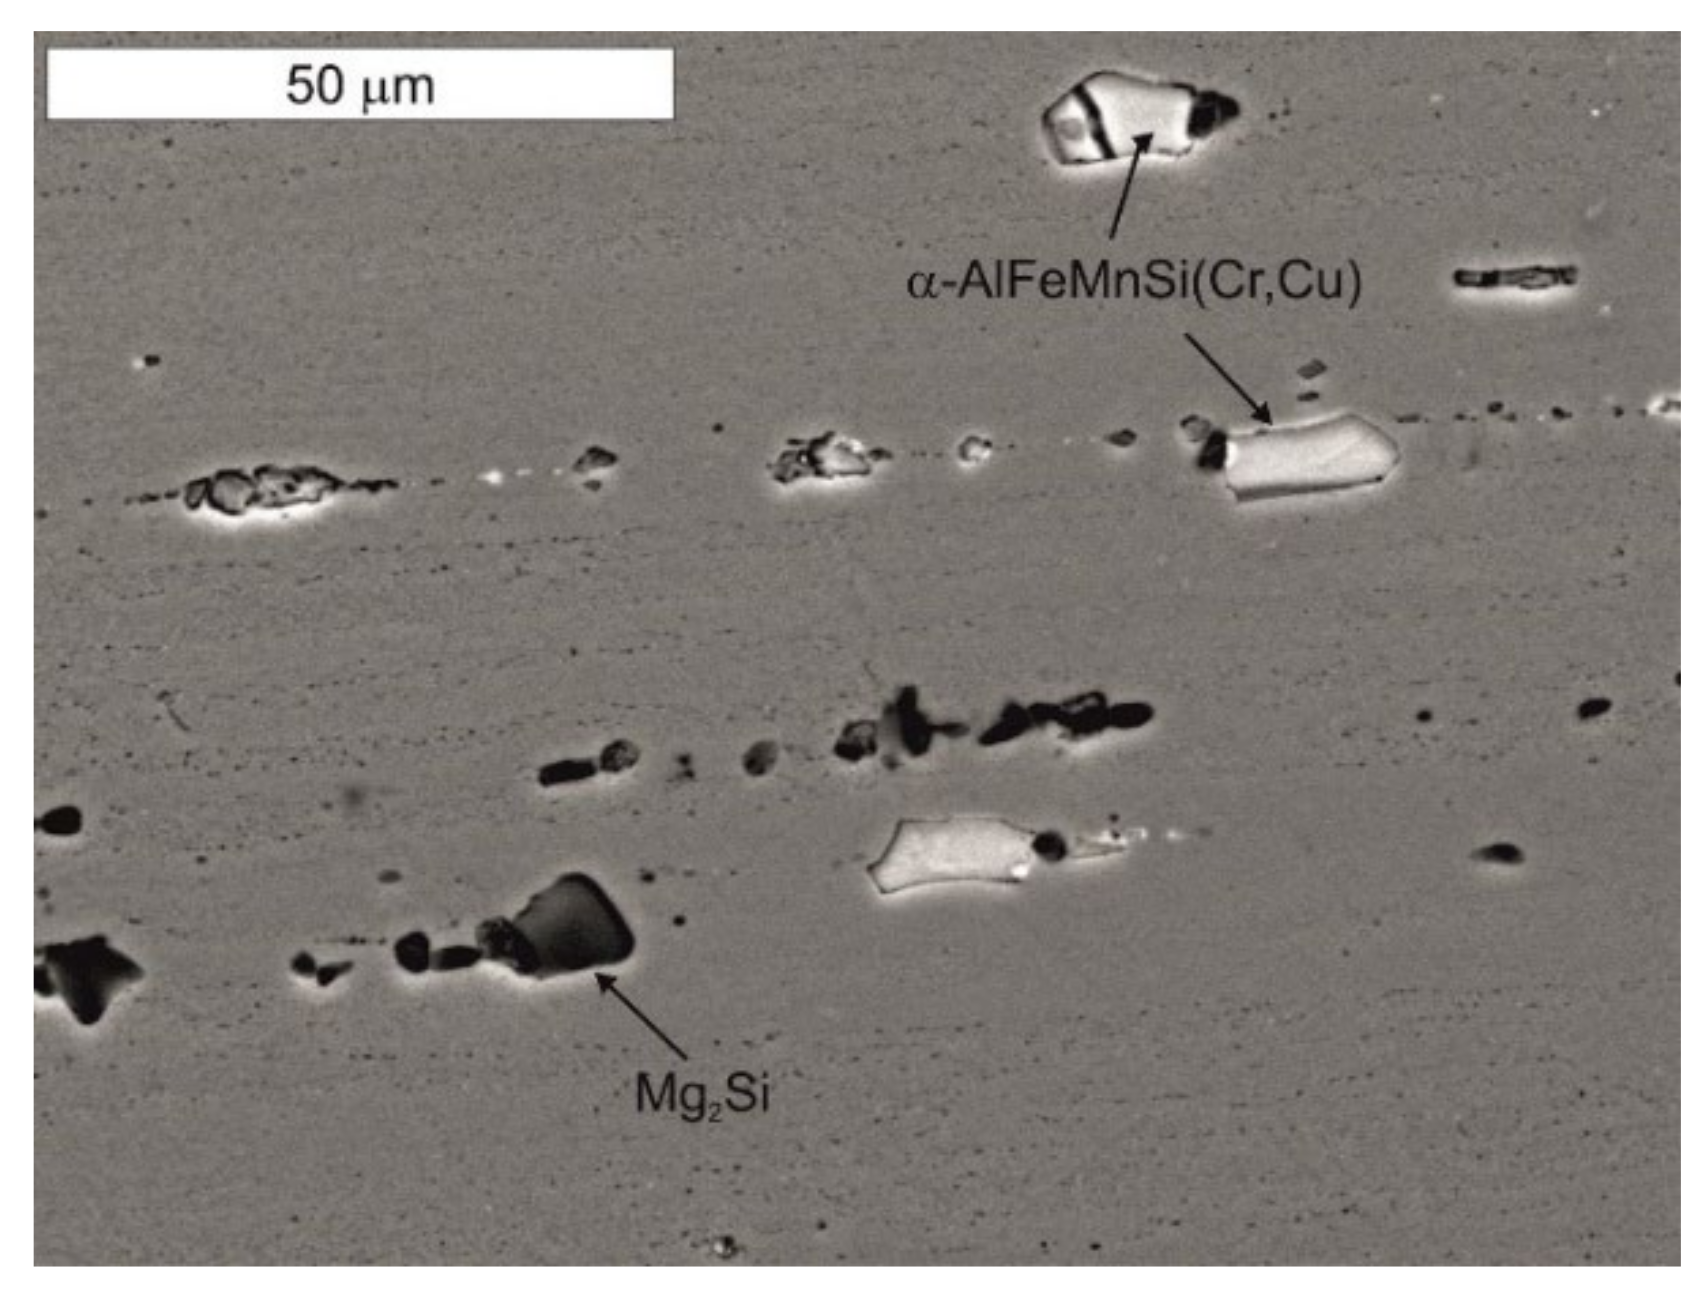
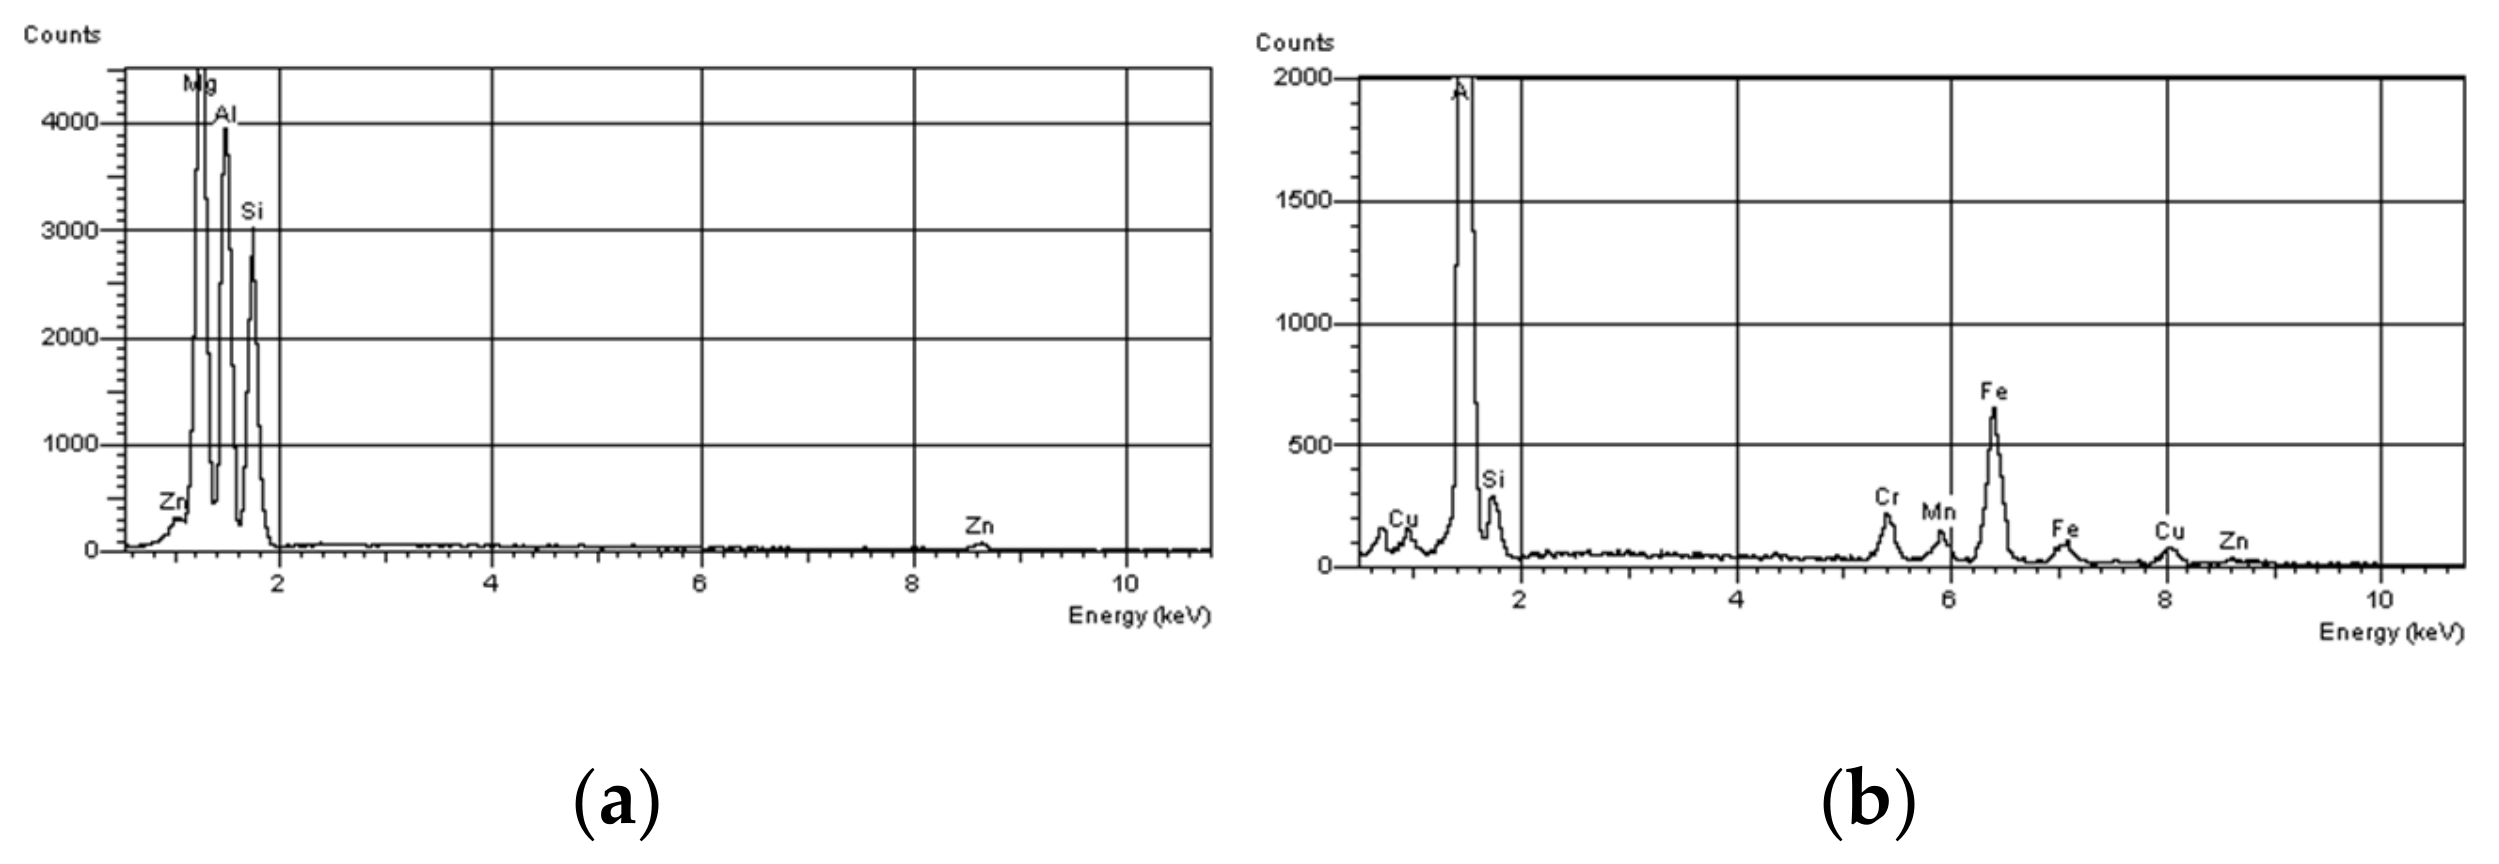
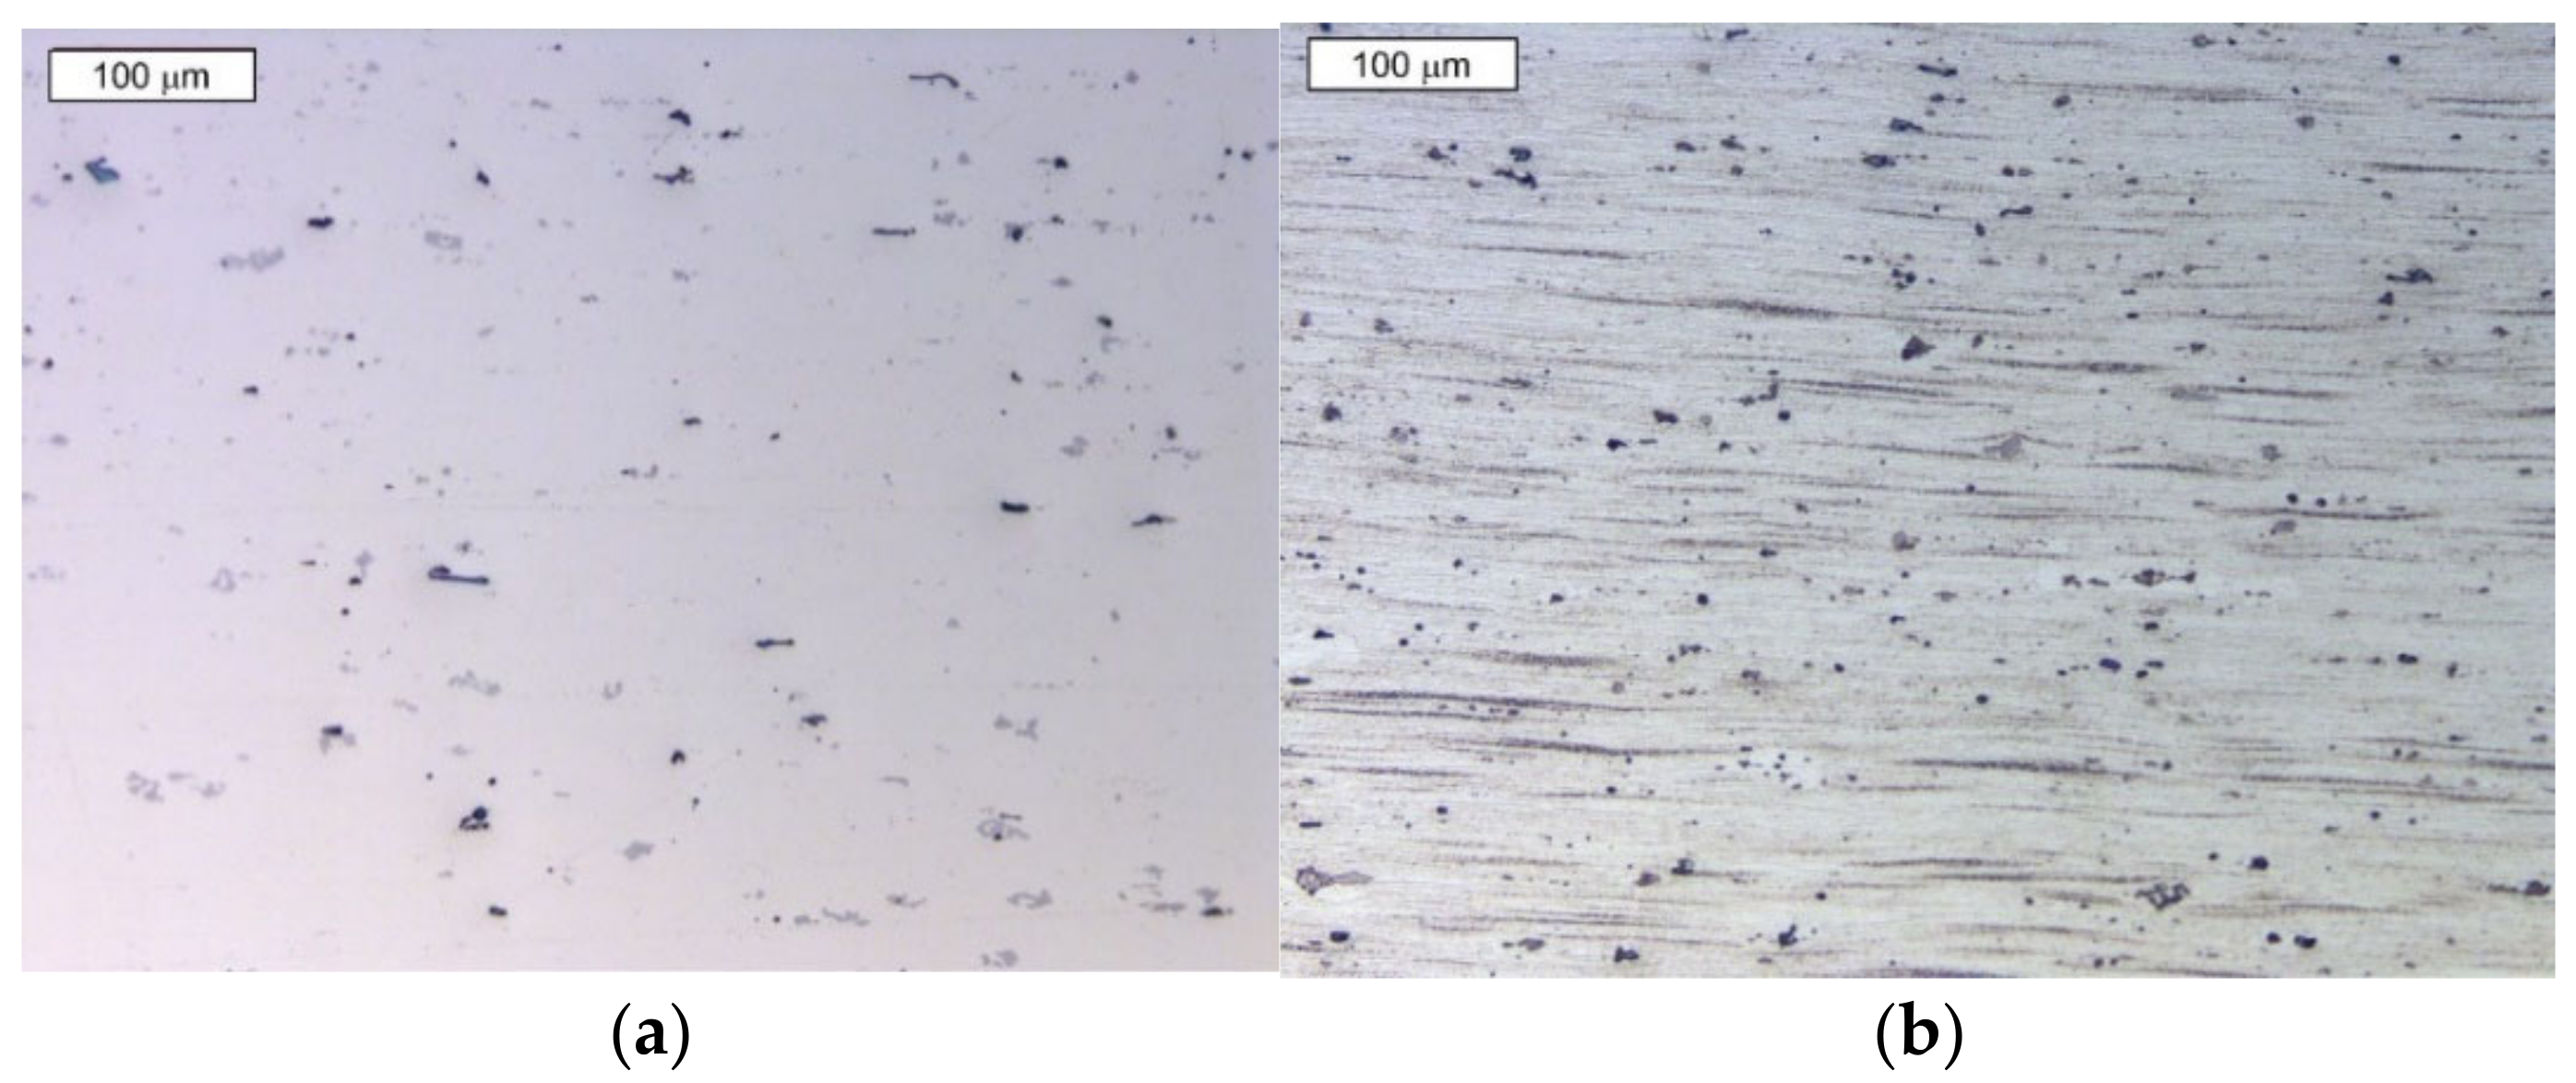
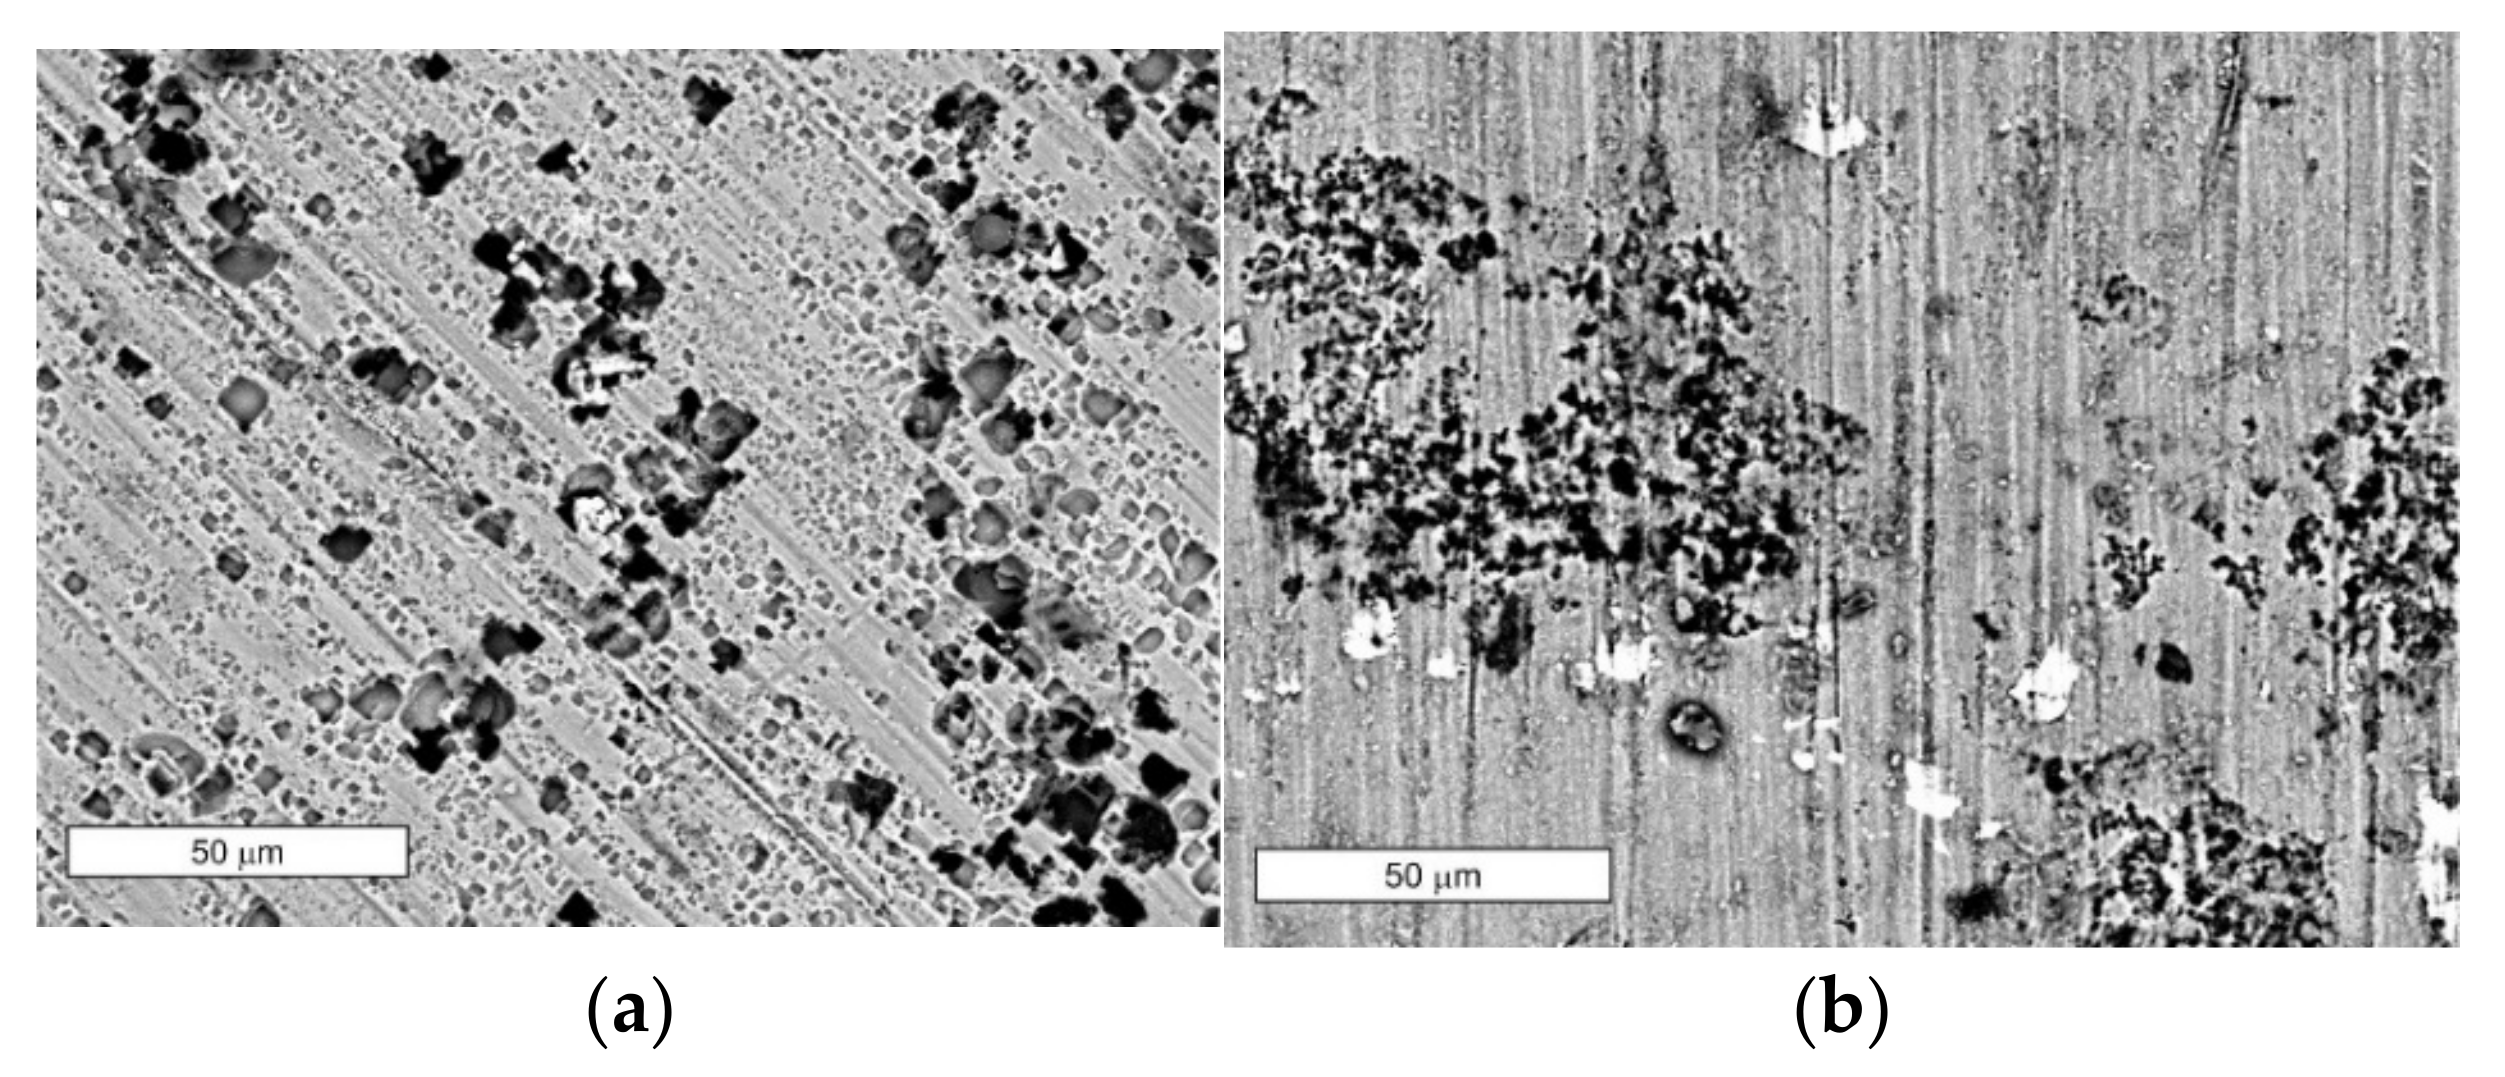
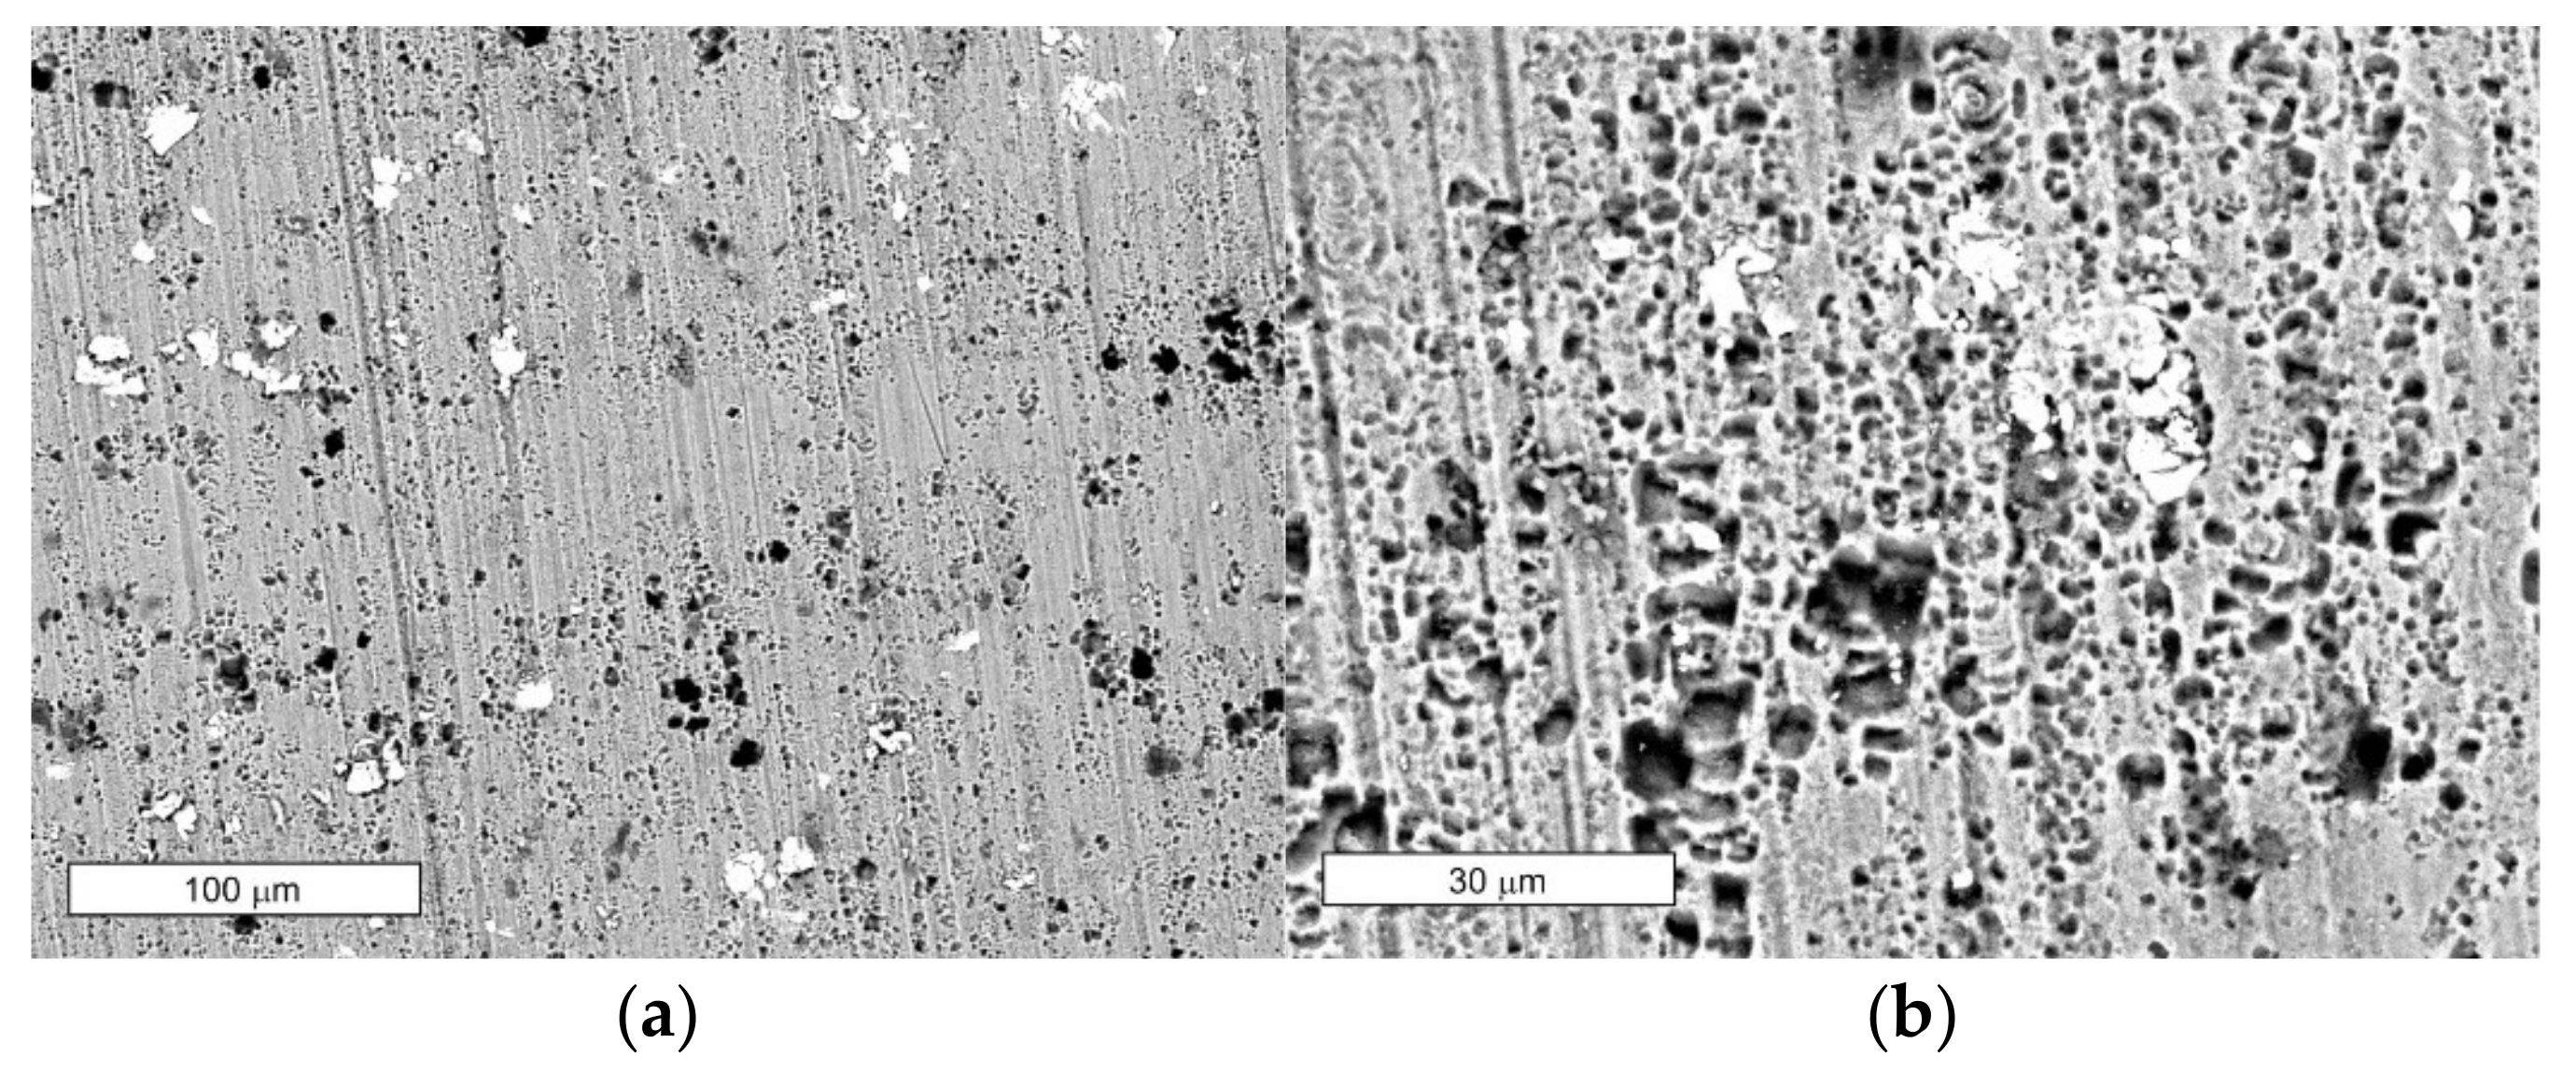
3.2. Study of Microstructure after Heat Treatment
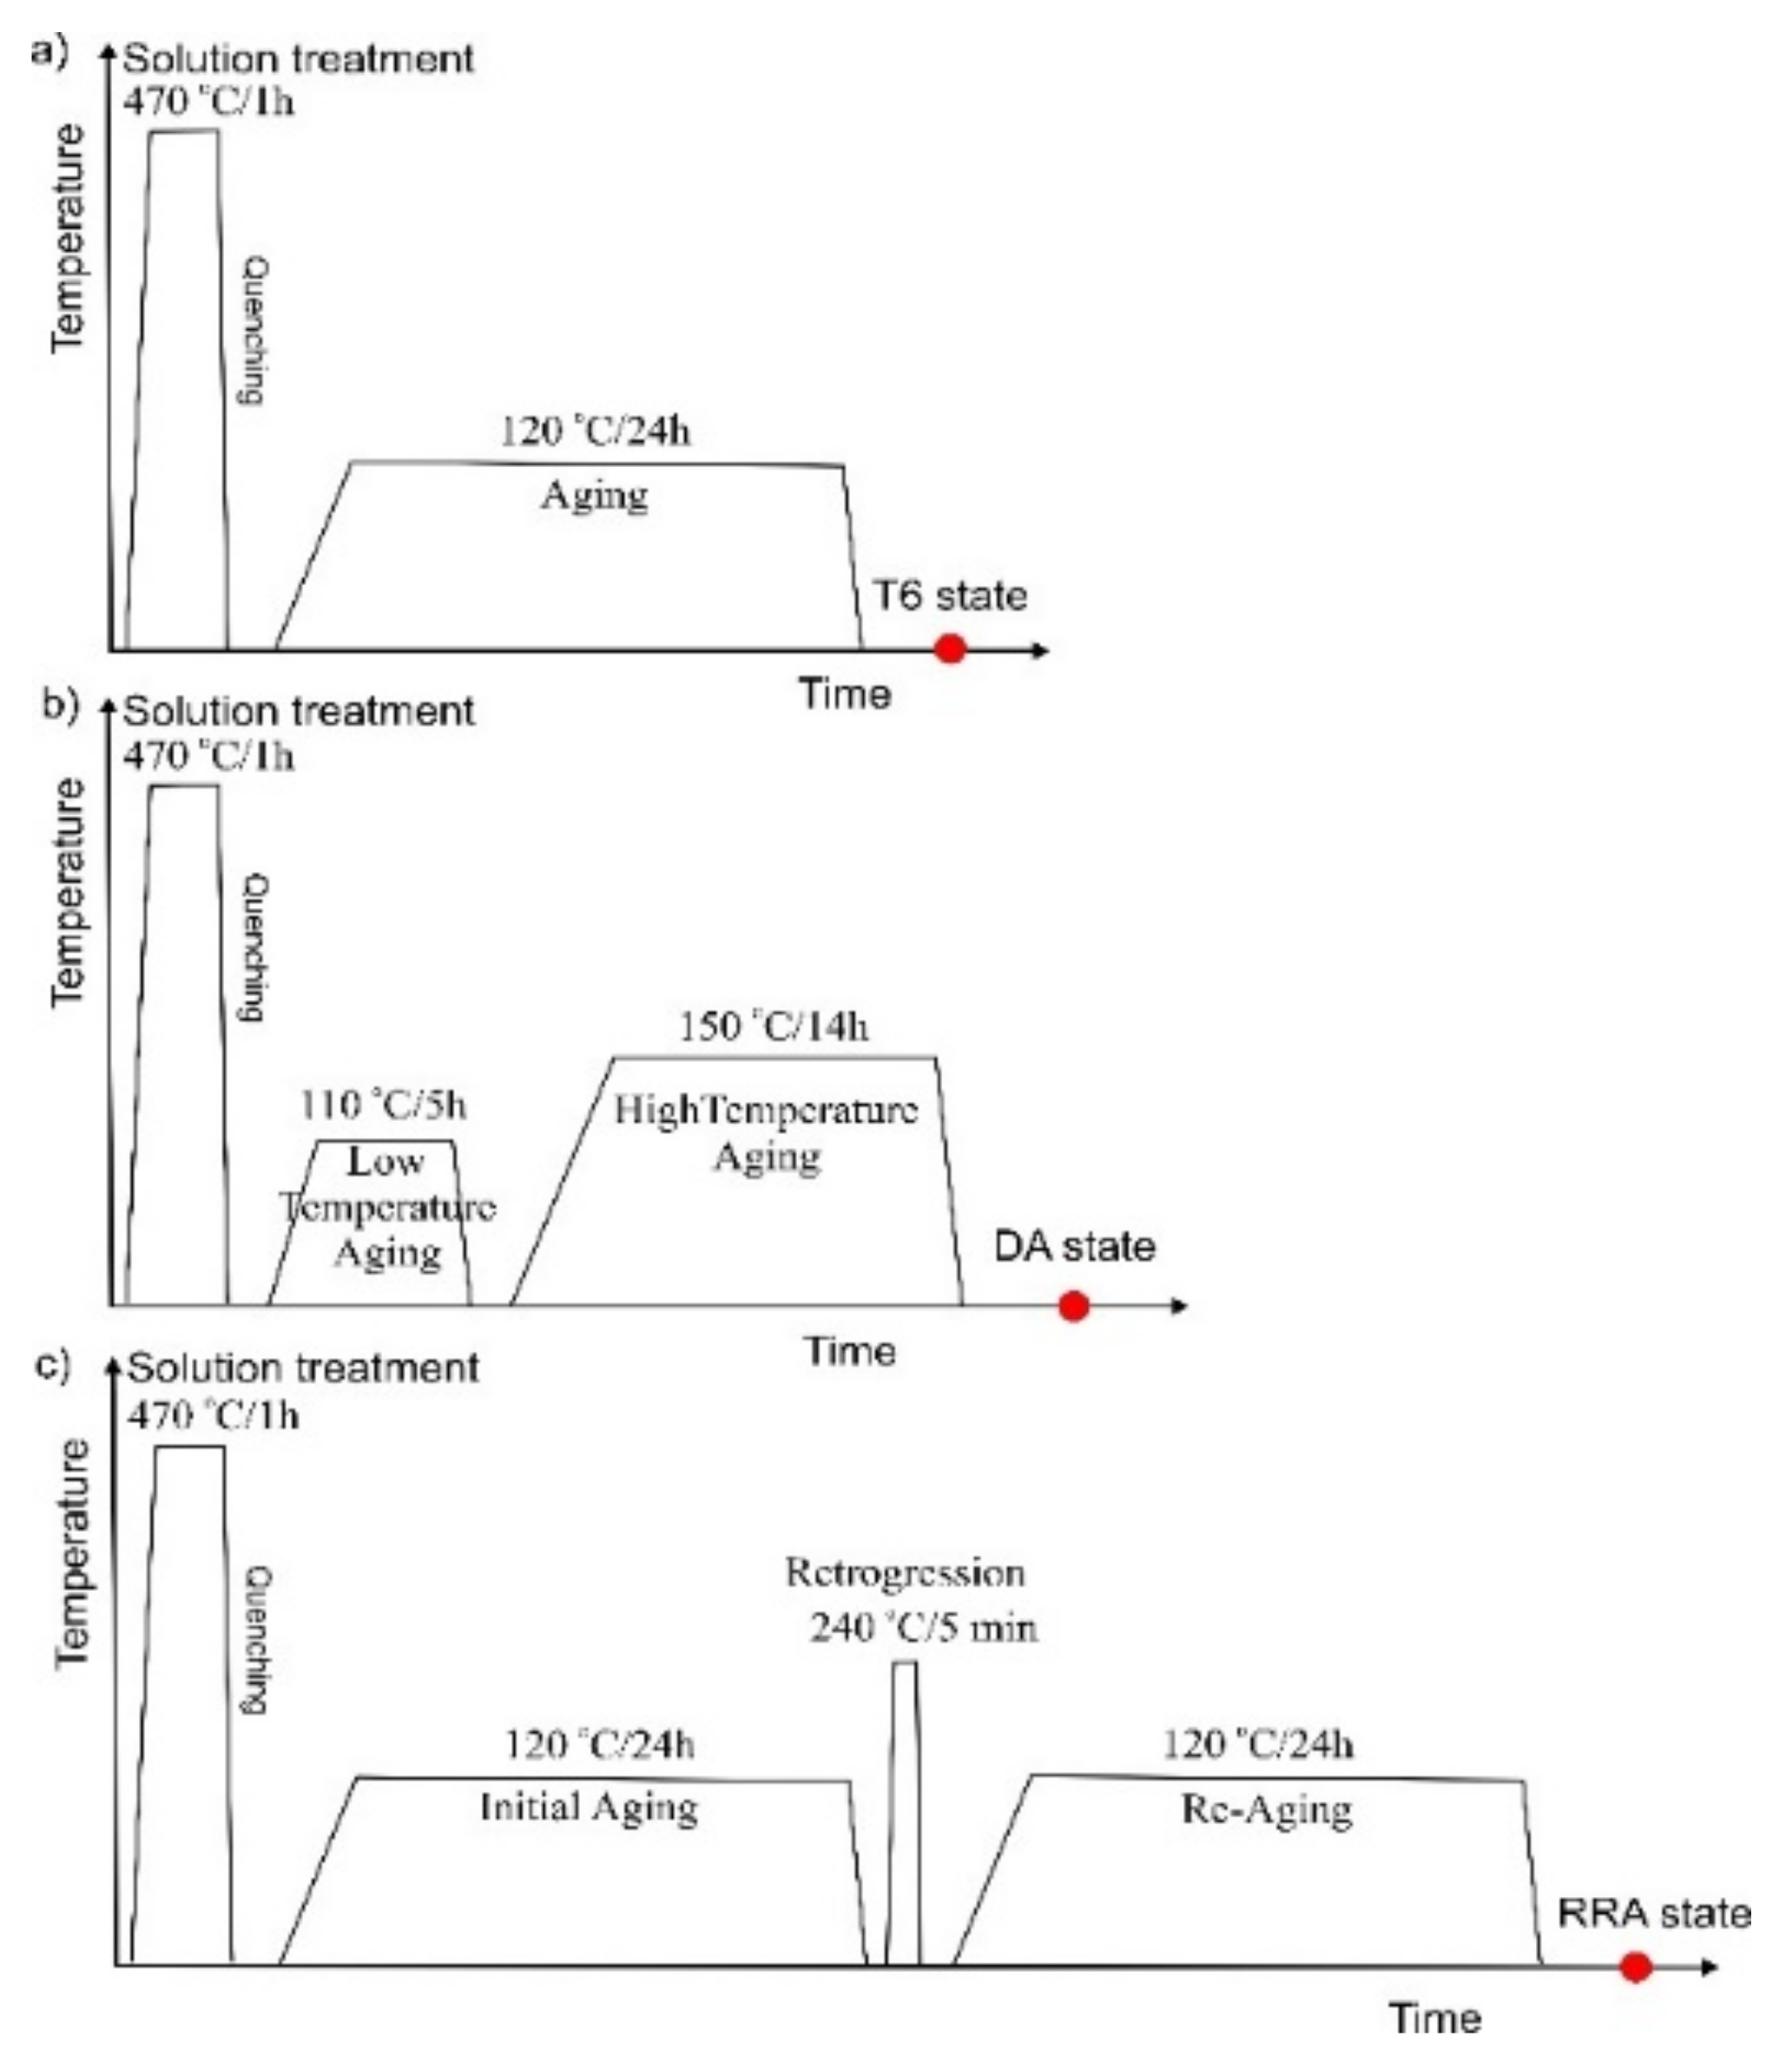
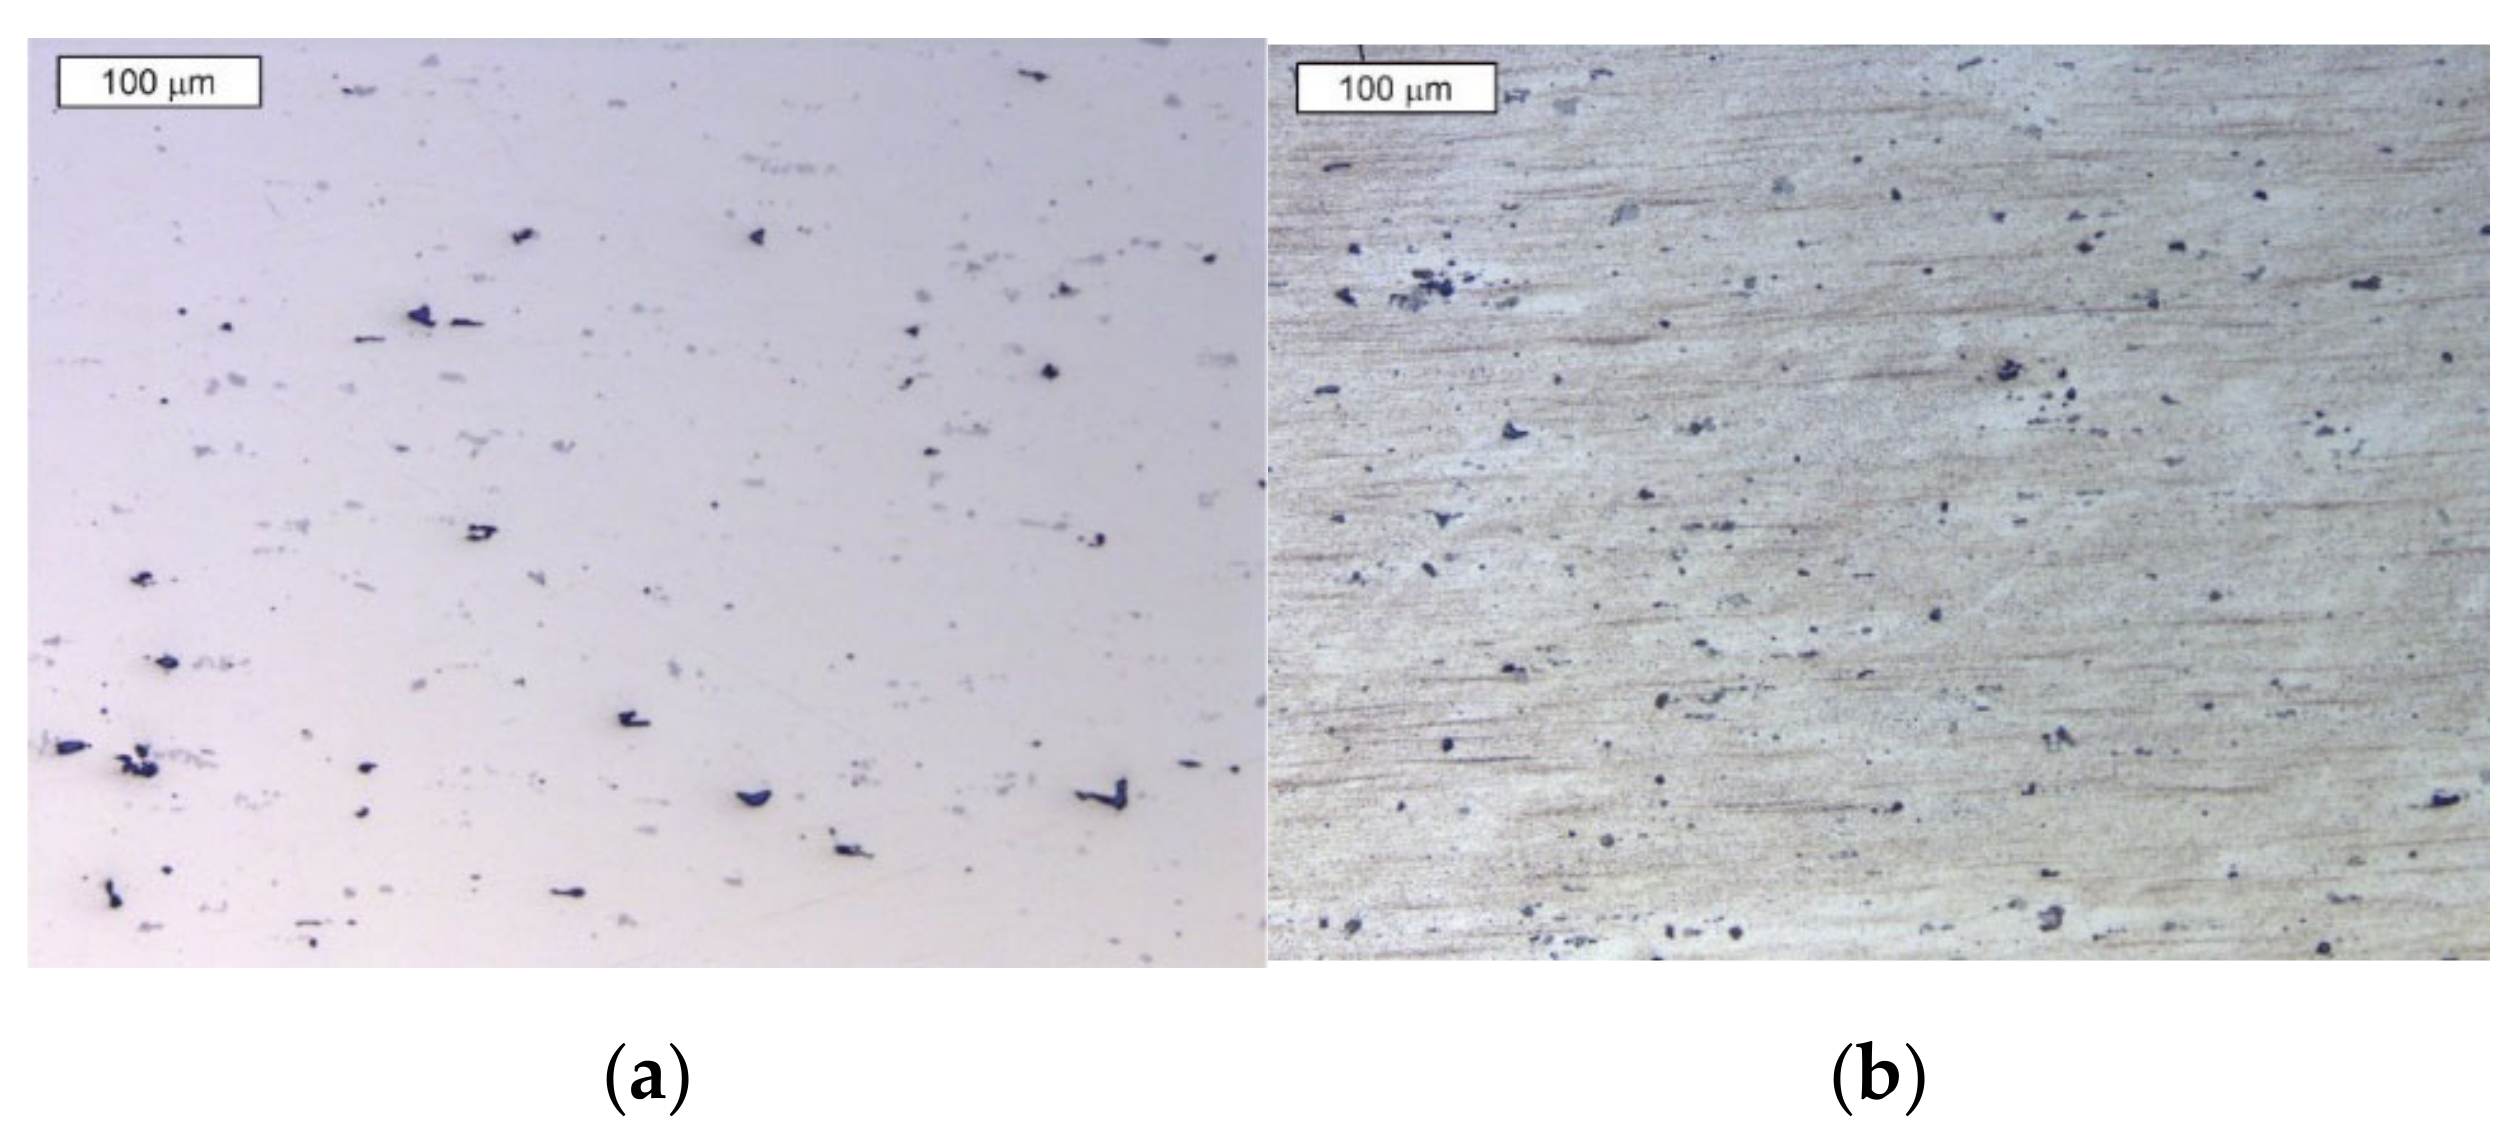
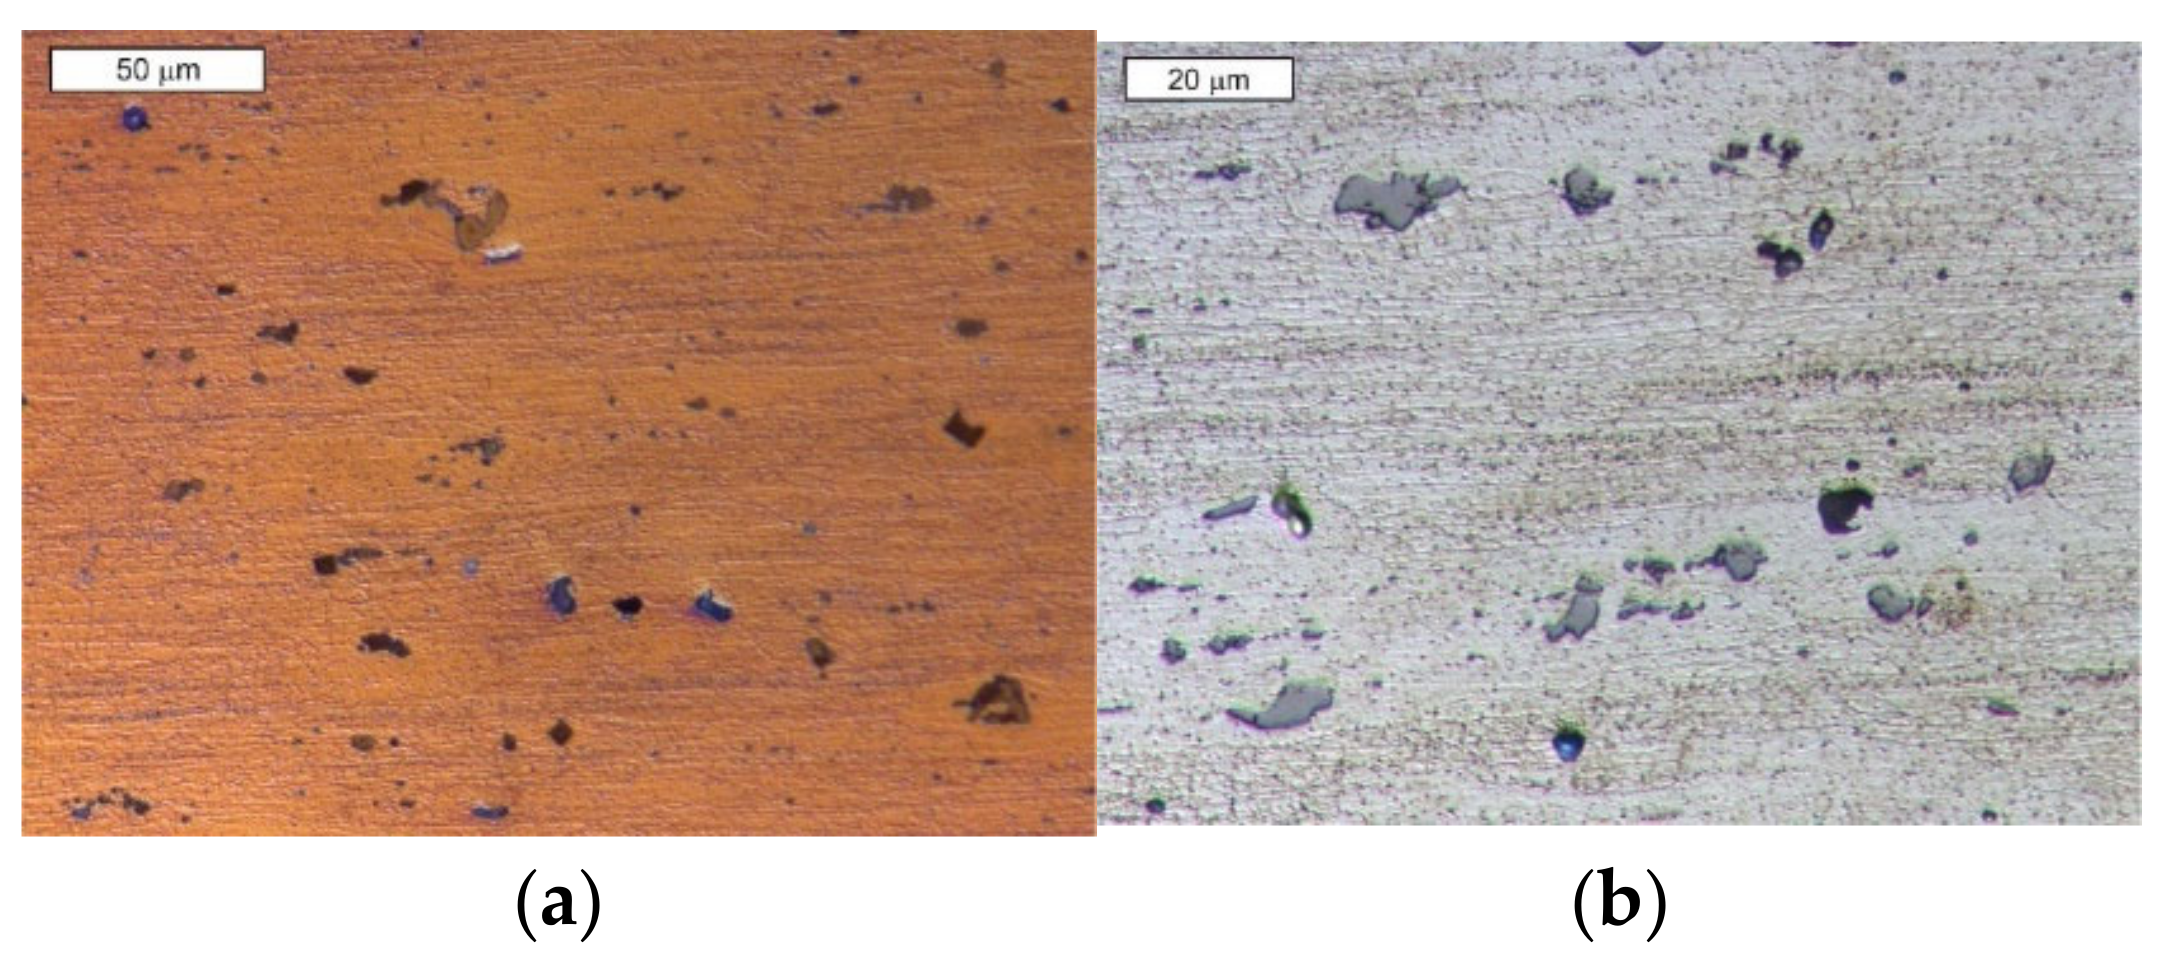
3.2.1. T6 State

In the microstructure of all the samples studied, regardless of the heat treatment state, large grayish precipitates of the iron-rich phase were visible, as well as dark precipitates of the Mg2Si phase (Figure 3, Figure 4, Figure 5 and Figure 6). In the case of wrought aluminum alloys, the iron-rich phase was the α-AlFeMnSi phase, which was confirmed in the material investigated using the EDS method (Figure 3 and Figure 4). In the case of the studied precipitates, the presence of chromium and copper was repeatedly observed in the spectrum of the characteristic X-ray radiation, which indicates that some atoms were replaced by these elements, creating a complex α-AlFeMnSi(Cr,Cu) phase (Figure 4b). Optical microscopic observations carried out at higher magnifications indicated a fine grain size of α solid solution, but locally, its heterogeneous character was observed, especially in the vicinity of large precipitates of the iron-rich phase (Figure 5 and Figure 6).
The aging process of 7xxx series aluminum alloys is well known and can be summarized as: SSSS (super-saturated solid solution) → GP zones → metastable η’ → stable η. GP zones are metastable coherent solute clusters of Zn, Mg, and Cu. The inter-phase energy of the GP zone in the Al-Zn-Mg system is so low that precipitates of small size (~3 nm) can form already in the range from ambient temperature to 120 °C [45,46]. Metastable η’ phases are based on MgZn2, Mg(ZnCuAl)2, or Mg(Zn2,AlMg) phases and appear as discrete semi-coherent particles with the matrix. The η phase as pseudo-stable and incoherent fills the grain boundary [5].
In the case of the alloy state after a single artificial aging, the grain boundaries were less defined, which indicates that the precipitation strengthening phase did not occur at grain boundaries or was coherent with it (Figure 6). At the same time, comparing the microstructure of the alloy in the T6 state to the DA state, numerous precipitates of the precipitation strengthening phase in the matrix (MPs) could be observed, which suggests their lower coherence and probably larger dimensions (significant atomic mismatch results in easier interaction with the etching reagent). Locally, these precipitates formed bands resulting from the segregation of the chemical composition.

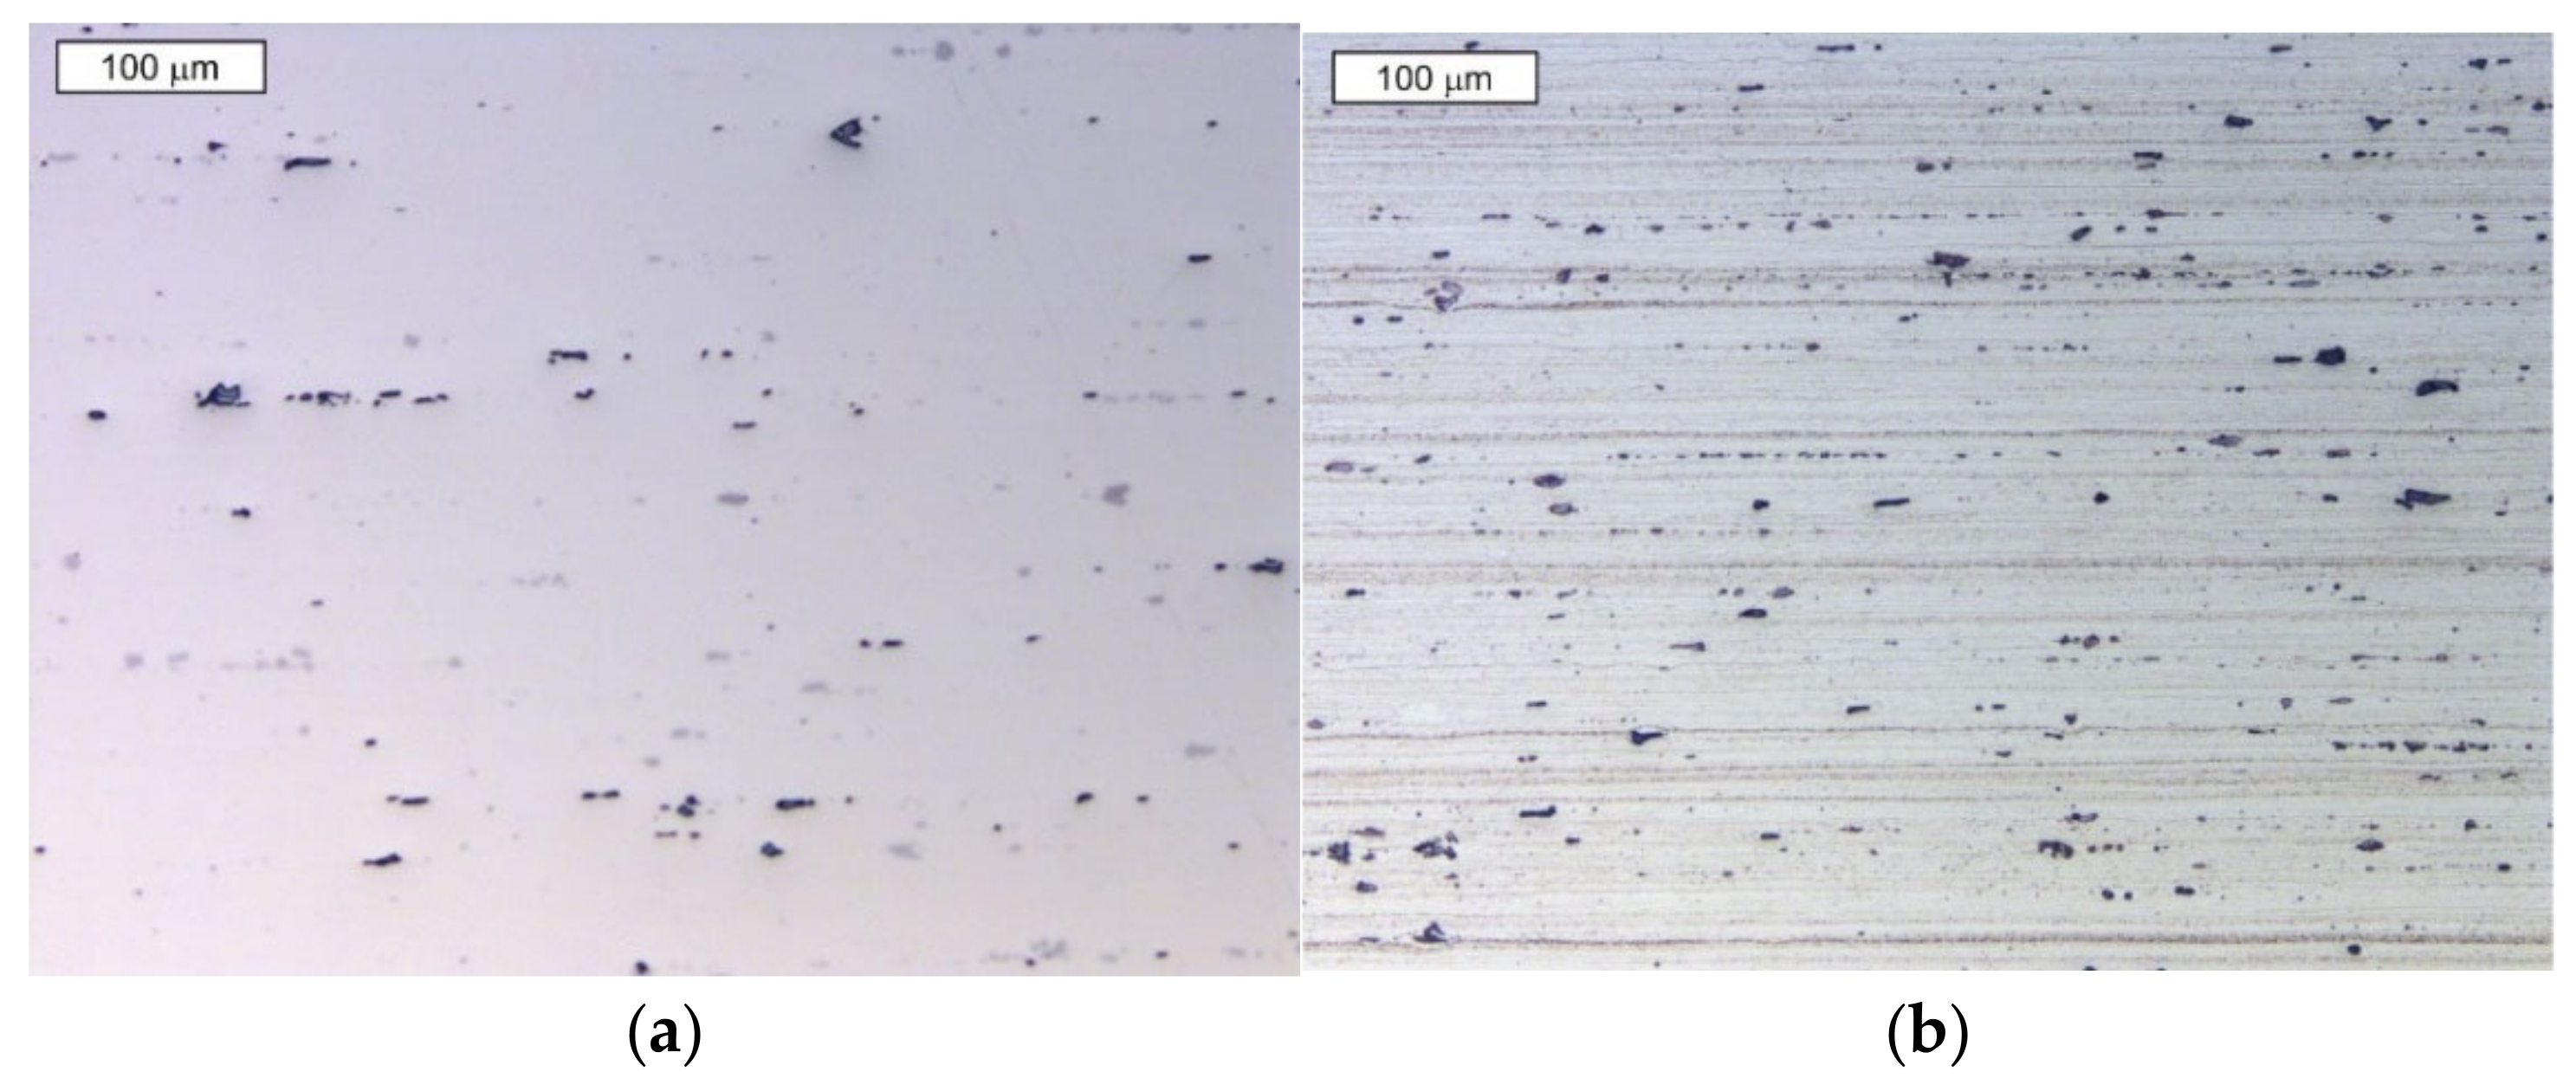
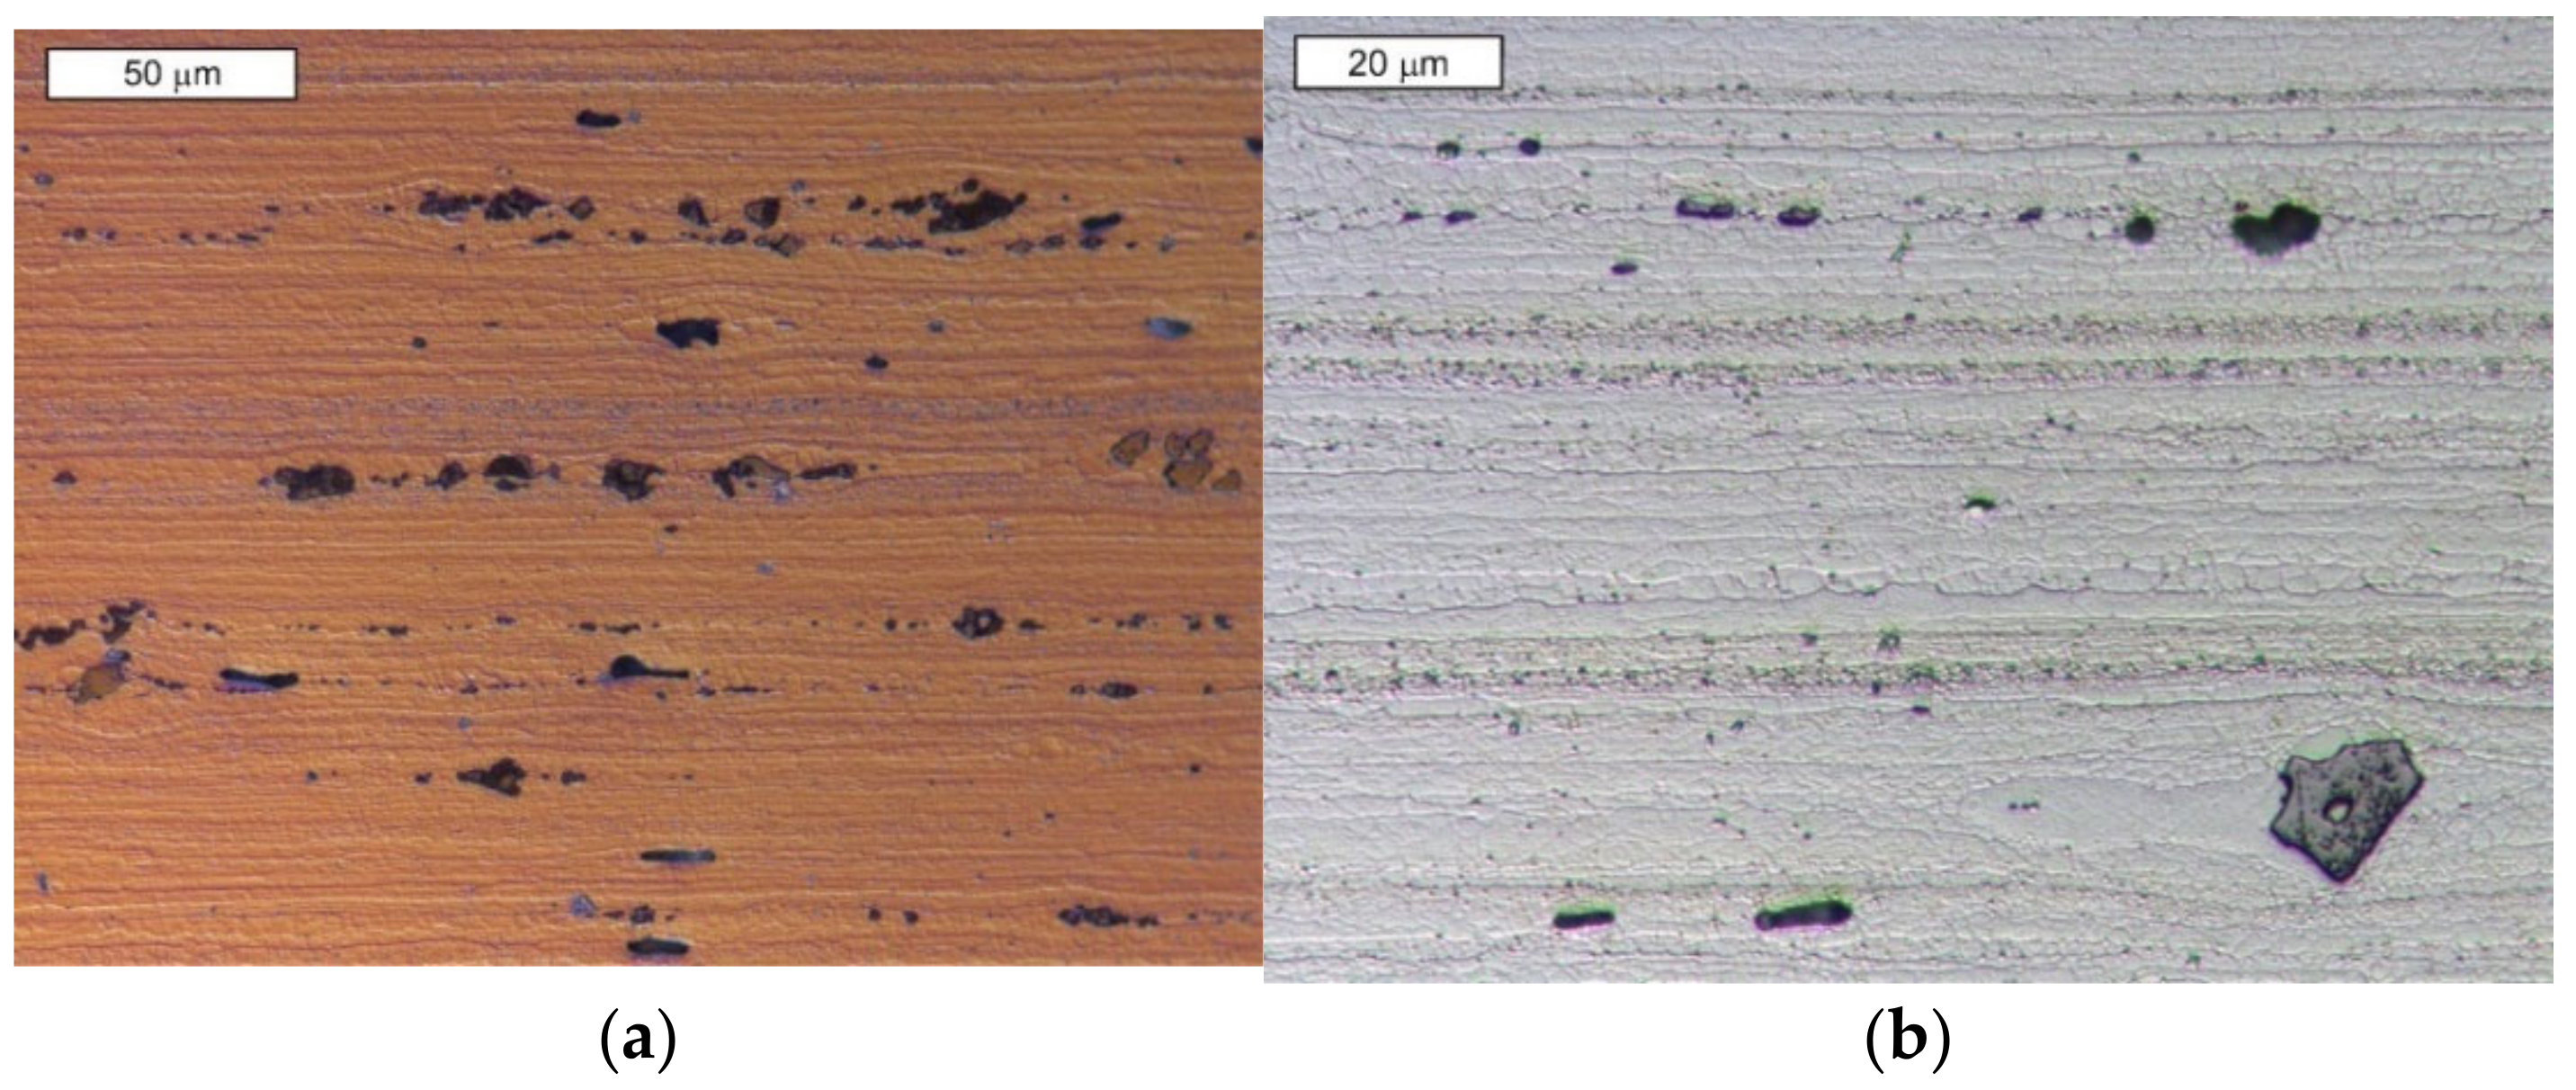
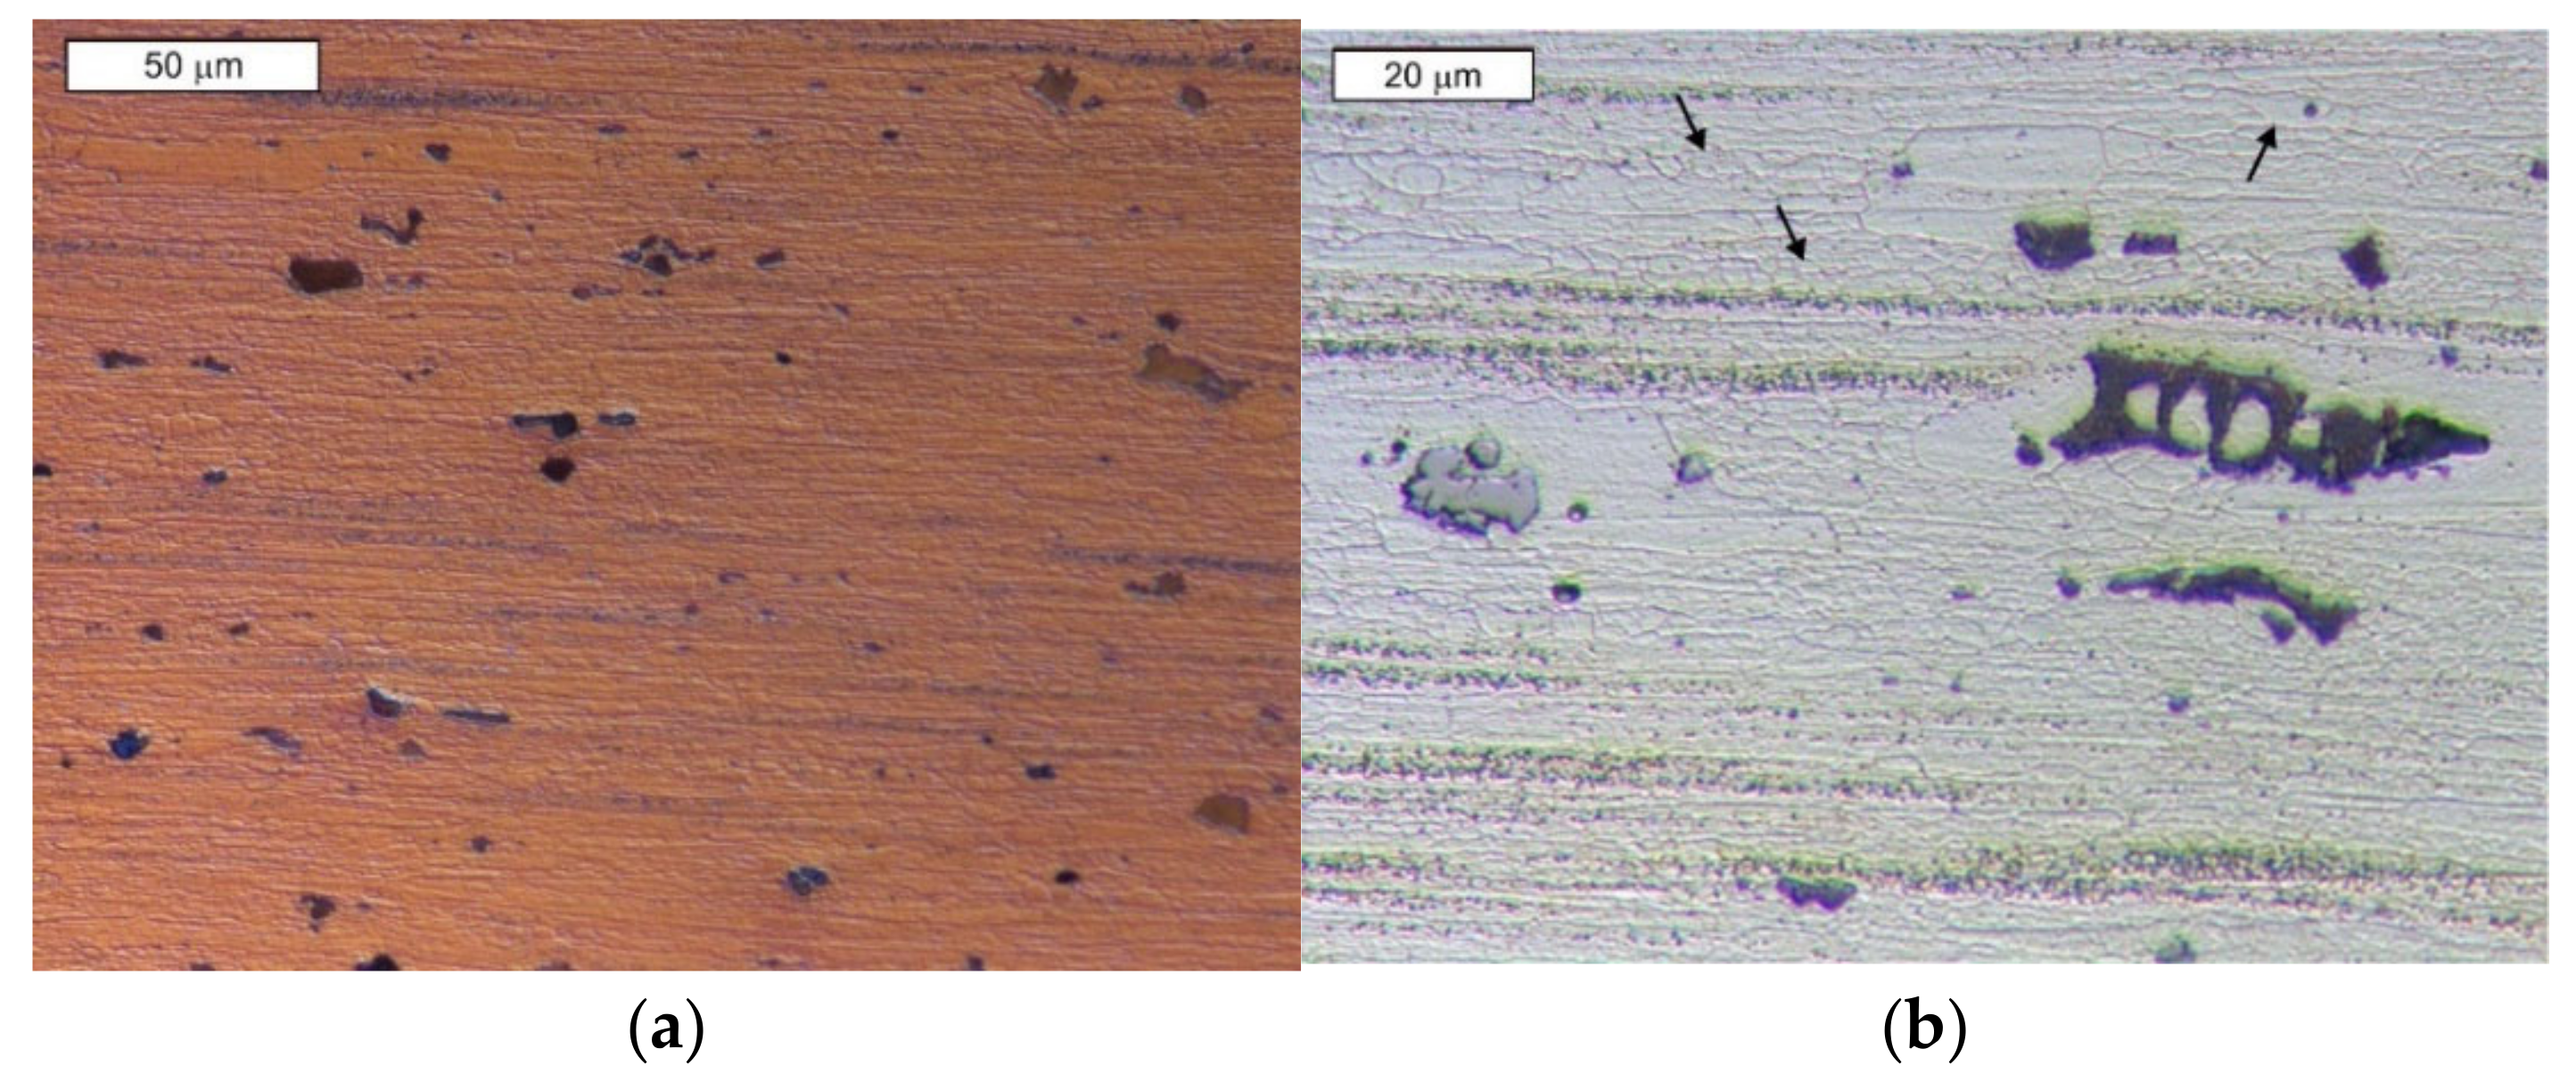
3.2.2. Double Aging (DA)

After double aging (DA), the precipitates of the precipitation strengthening phase were mainly present in the form of clearly separated bands. In the light microscope image, practically no precipitates outside these bands were observed, to a similar extent as after RRA treatment. This suggests the formation of larger precipitates mainly in areas of chemical composition segregation.
As in the case of the coupon aged once, precipitates of an iron-rich phase, most likely α-AlFeMnSi, as well as dark precipitates of the Mg2Si phase were observed in the unetched state (Figure 7a). In the case of other heat treatment states, the results of the EDS tests were not presented, as these phases did not undergo phase transition during the applied heat treatment. For this material, the full strengthening effect could not be achieved, as evidenced by a lower hardness value by about 10 HBW 2.5/187.5 compared to the other states. The strengthening coefficient, which can be defined as hardness after heat treatment/hardness after supersaturation, was 2.00 in this case, while for the T6 and RRA states: 2.09 and 2.11, respectively. It should be remembered that the strengthening in aluminum alloys showed a gradual increase in the initial stage of aging, and a slow decrease after reaching a maximum. The highest strengthening was obtained when the precipitates reached a size typical of the change in the mechanism of precipitate bypassing by dislocation from shearing (Friedel effect) to Orowan looping [12]. This is closely related to the moment of loss of semi-coherence by precipitation strengthening phases. It should be noted that the total aging time was shorter than the T6 state, which was reflected in the obtained hardness value. The first stage of aging during DA treatment was directed toward a uniform distribution of GP zones and only the second stage of aging contributed to the hardness peak. The lack of clearly visible precipitates in the microstructure of the material and the relatively low hardness indicate that the hardening peak of the alloy was not reached in these cases. The associated partial coherence of the precipitates will make them difficult to observe in light microscope images (Figure 7b and Figure 8).

3.2.3. RRA Treatment

In the unetched state, precipitates of the iron-rich phase and dark precipitates of the Mg2Si phase were observed, which were a constant element of the microstructure (Figure 9a). After etching, the precipitates were revealed to be mainly in the form of distinct bands arranged according to the plastic formation direction (Figure 9b and Figure 10). The presence of large precipitates in the microstructure of the alloy prevented its comminution in their environment during the plastic formation of the alloy, resulting in grain heterogeneity. In addition to these bands, the alloy after RRA treatment exhibited a microstructure characterized by the absence of distinct precipitates in the α solid solution region (MPs).
The authors are unanimous on the evaluation of the microstructure during RRA. Generally, GP zones and some η’ phases appear and grow during the pre-aging stage. During the regression treatment, the GP zones dissolve back into the matrix and some intermediate phases continue to grow [41]. After reaging, the η’ phases again precipitate and the hardness of the alloy returns to a higher level. Consequently, the greatest strength was achieved for this alloy. During RRA, the η phase in GBPs became thicker and discontinuous. This resulted in the grain boundaries becoming visible in the microscopic image (marked with arrows in Figure 10b).

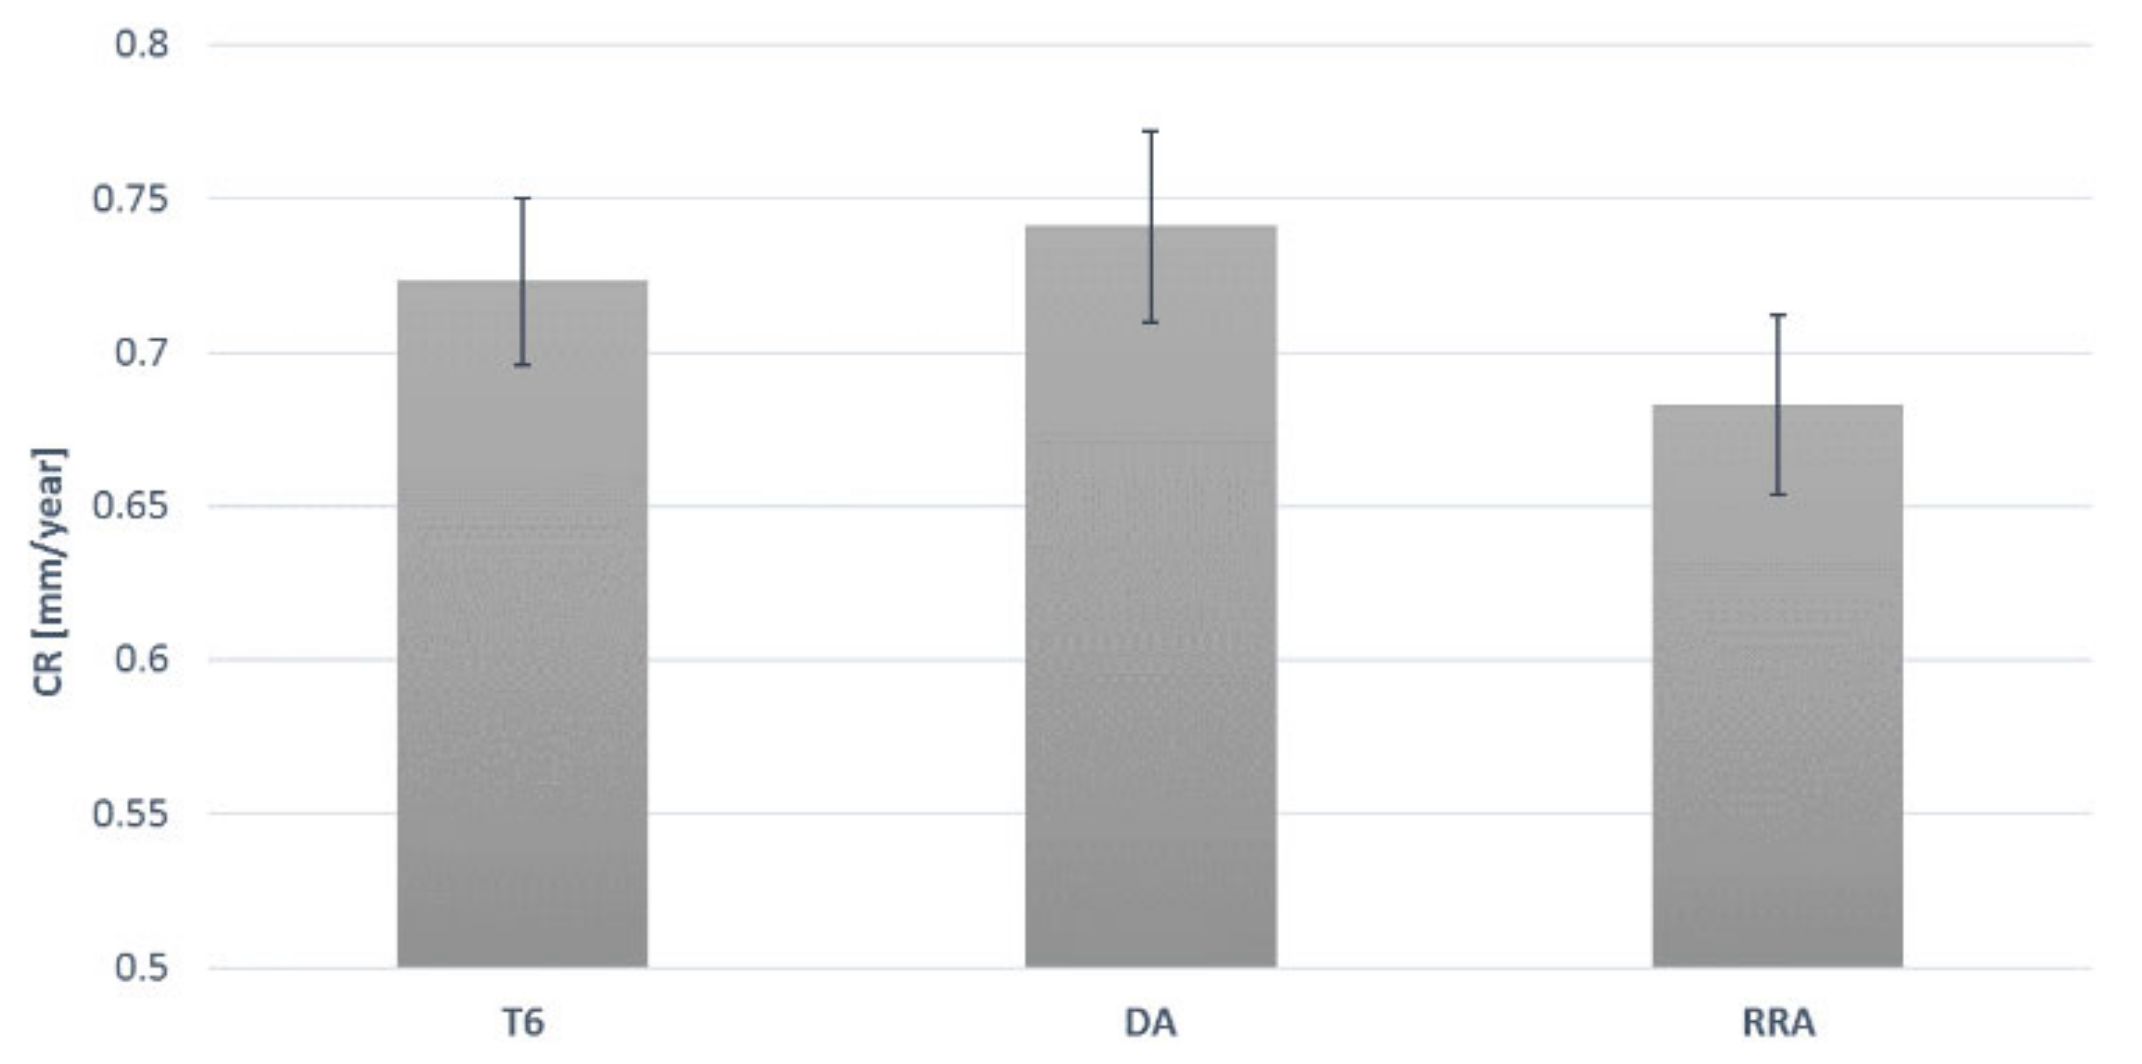
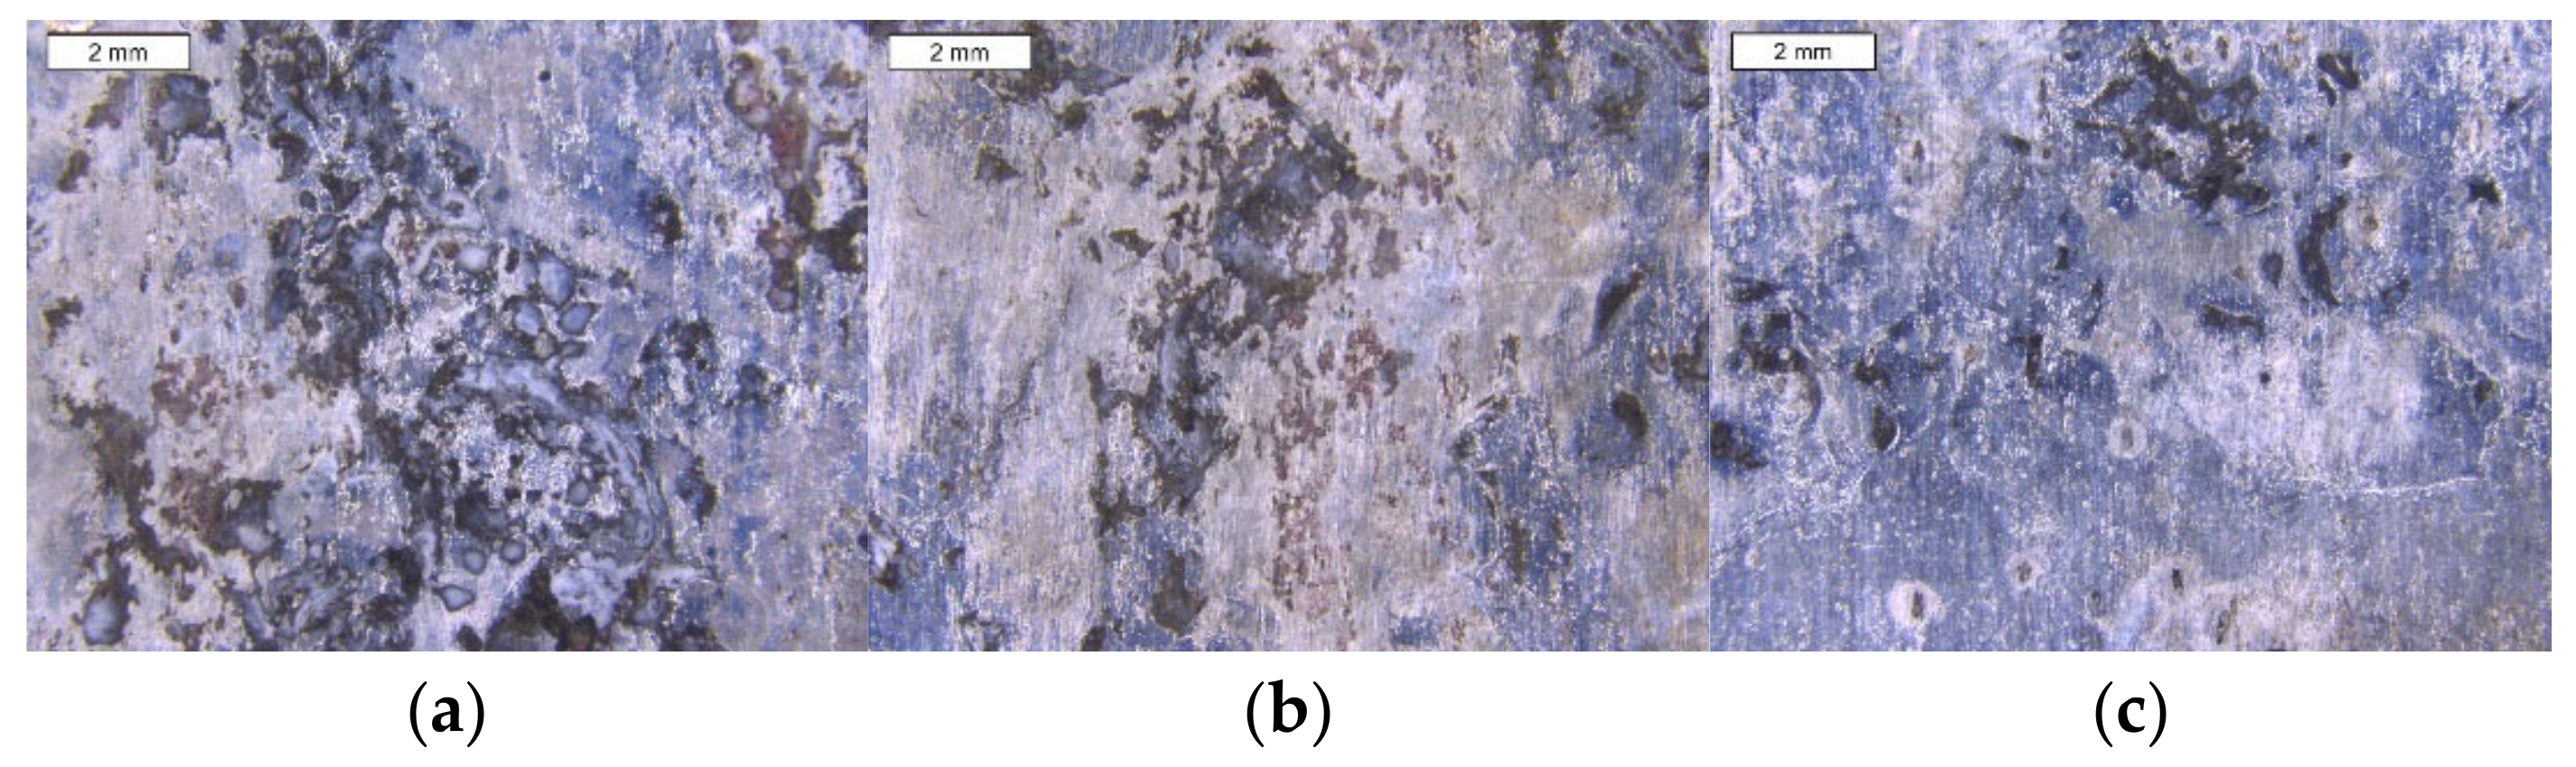
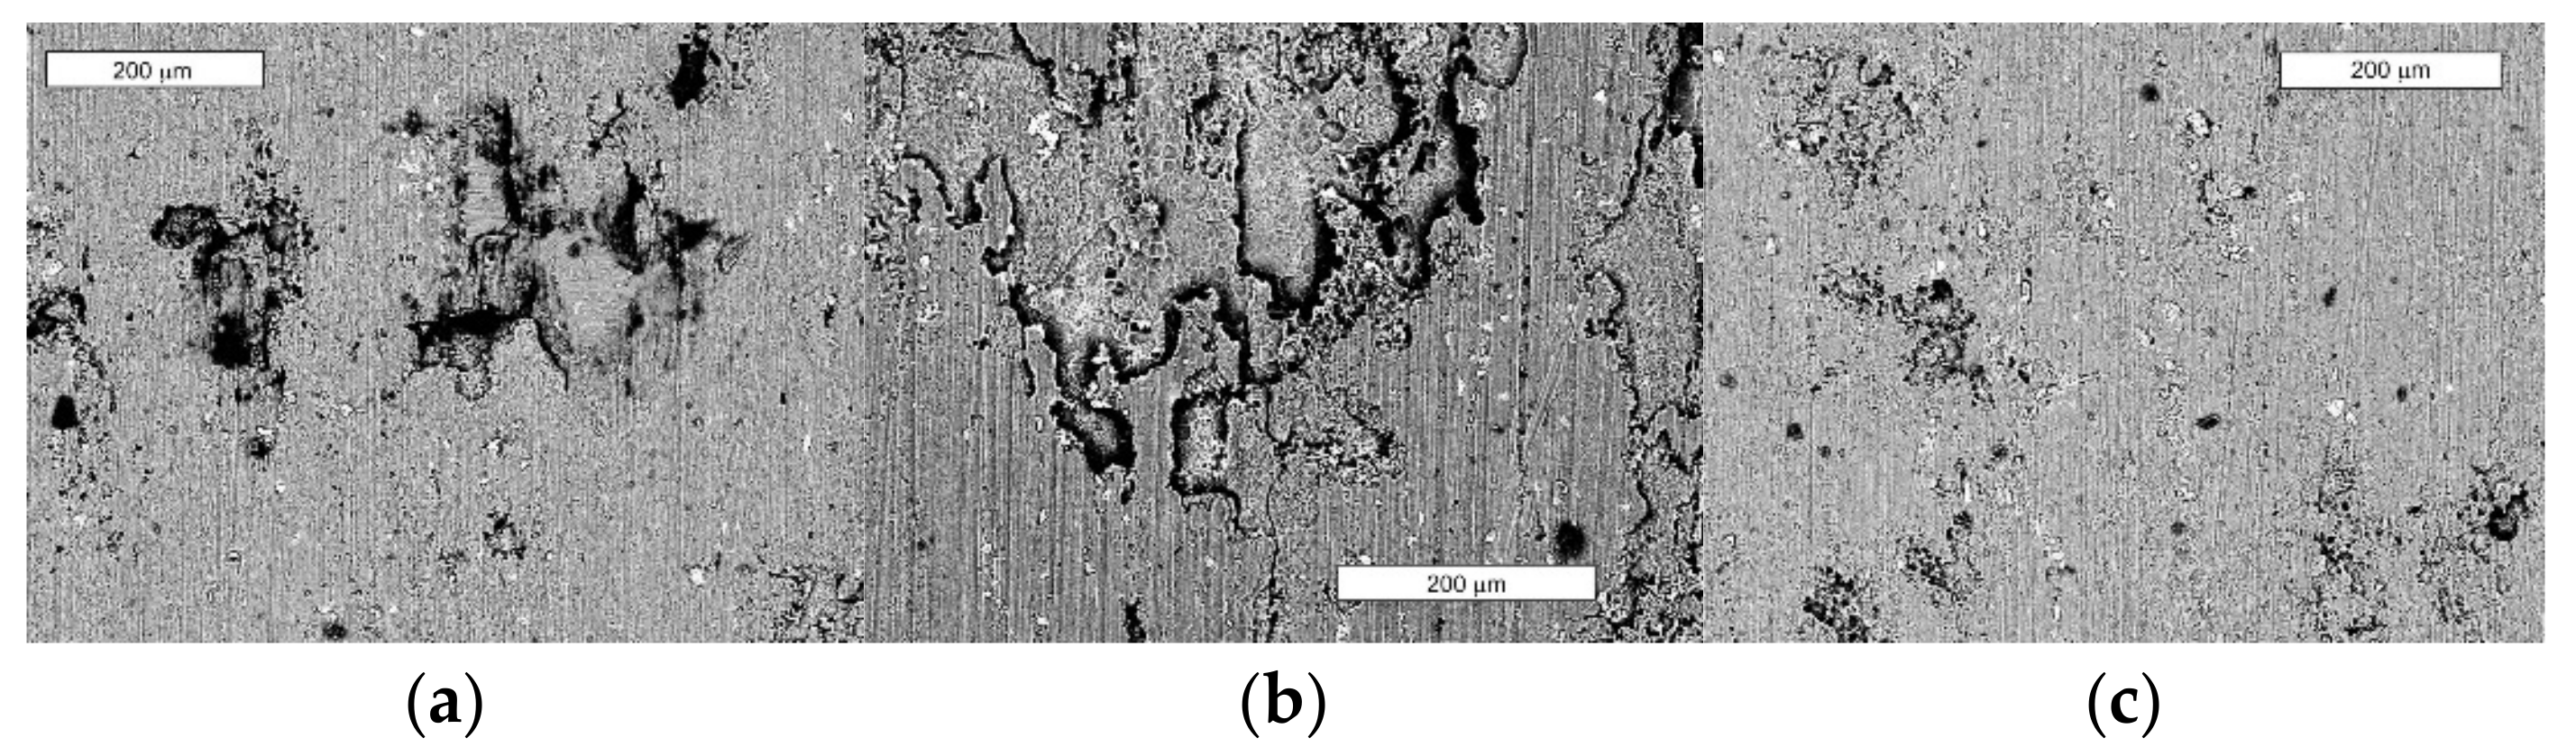
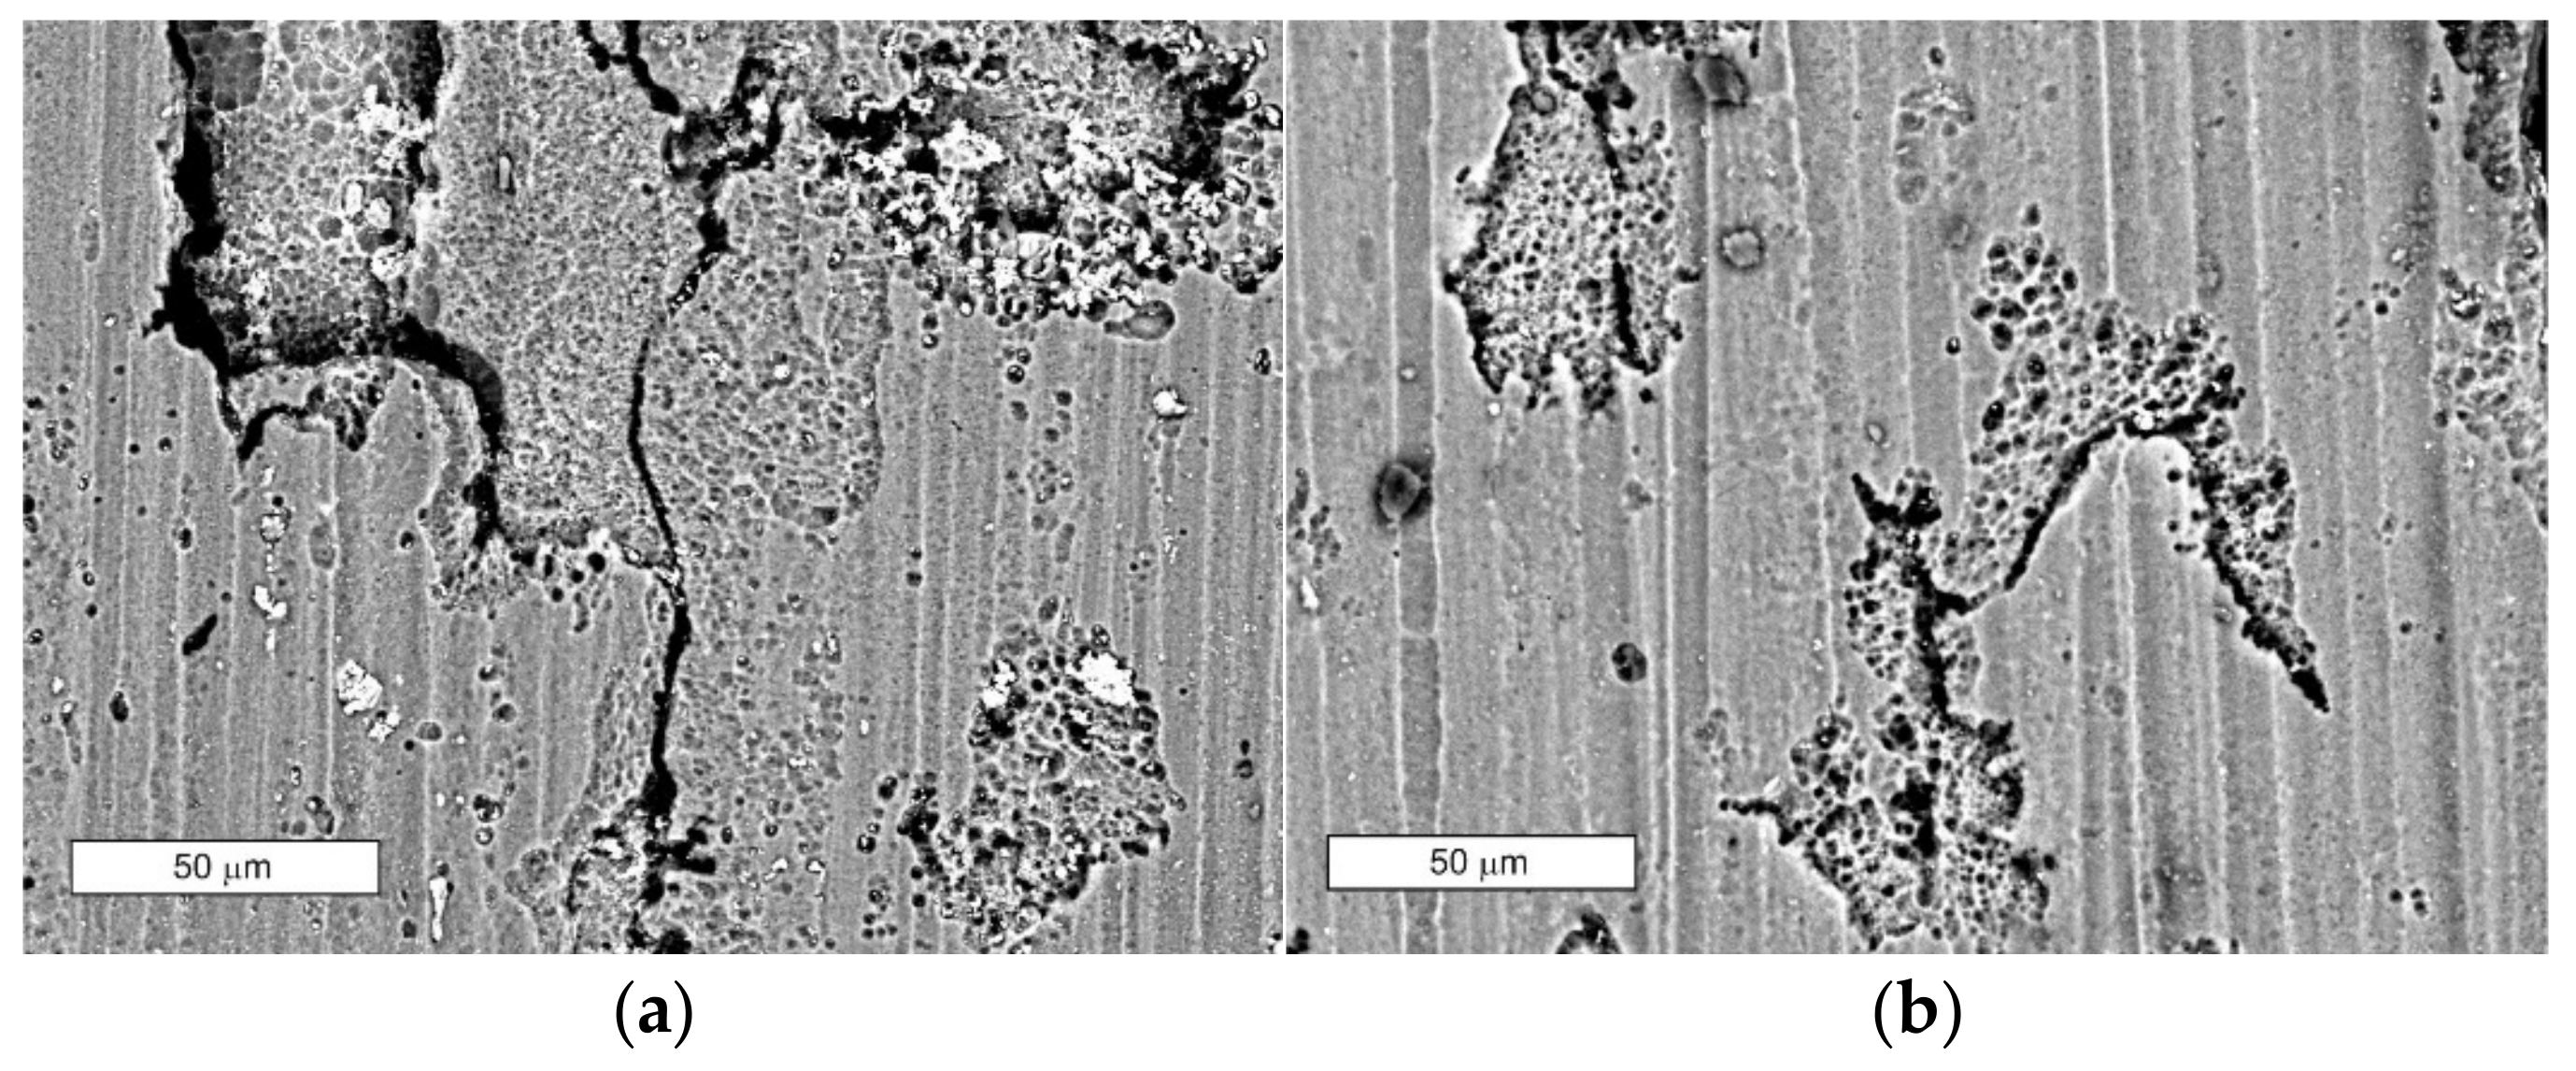
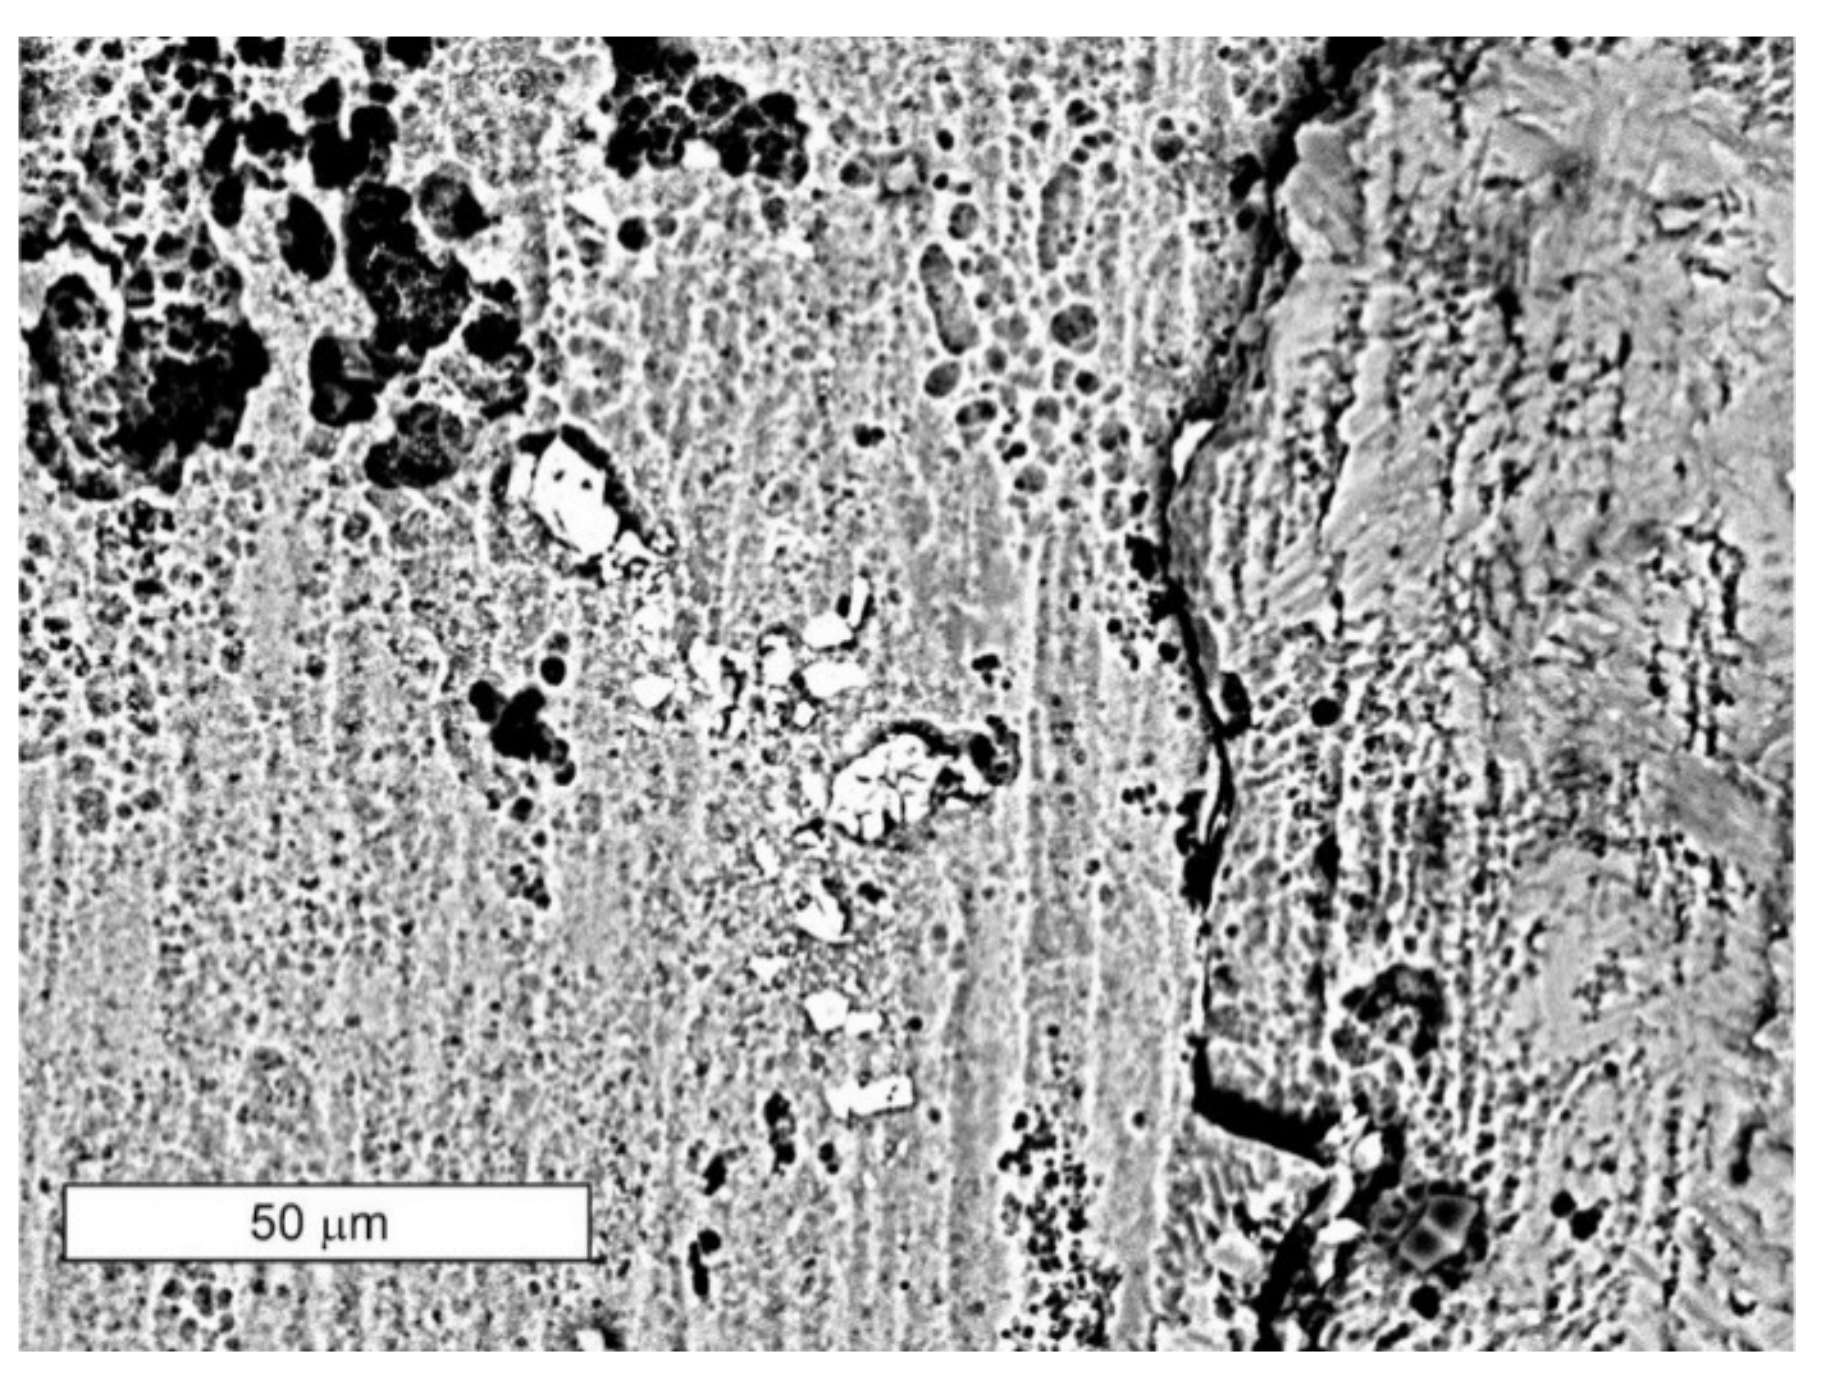
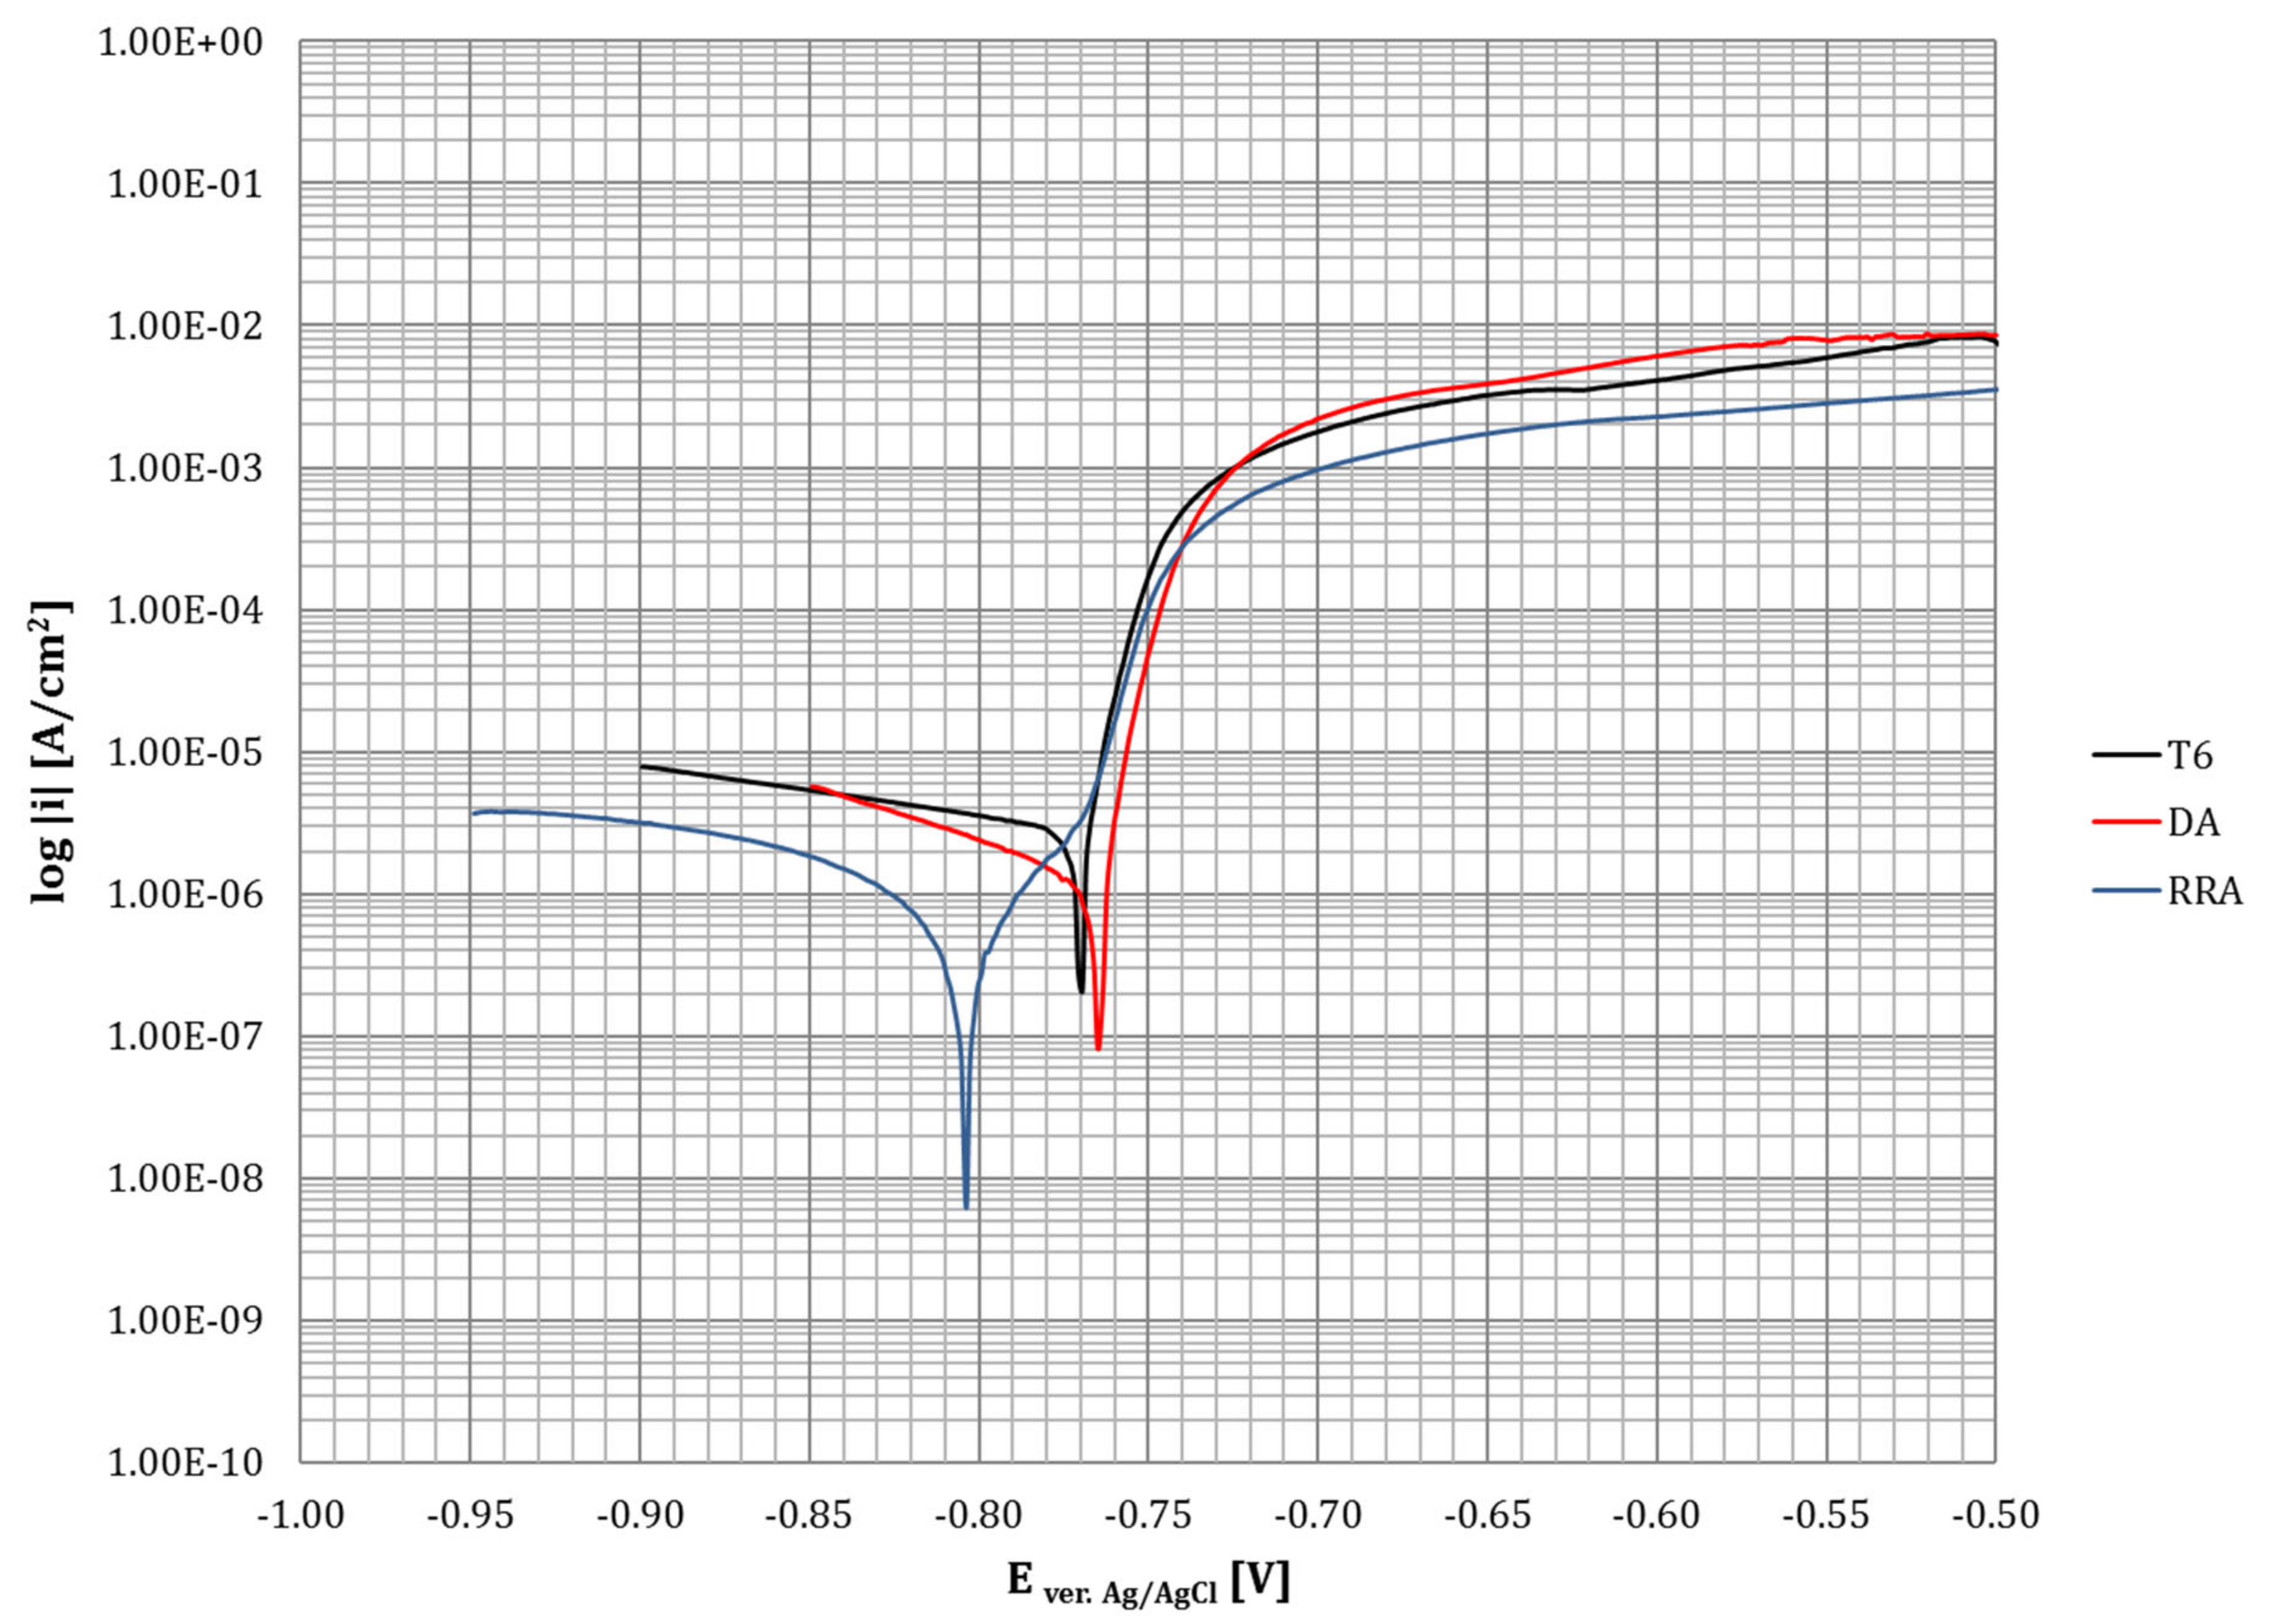
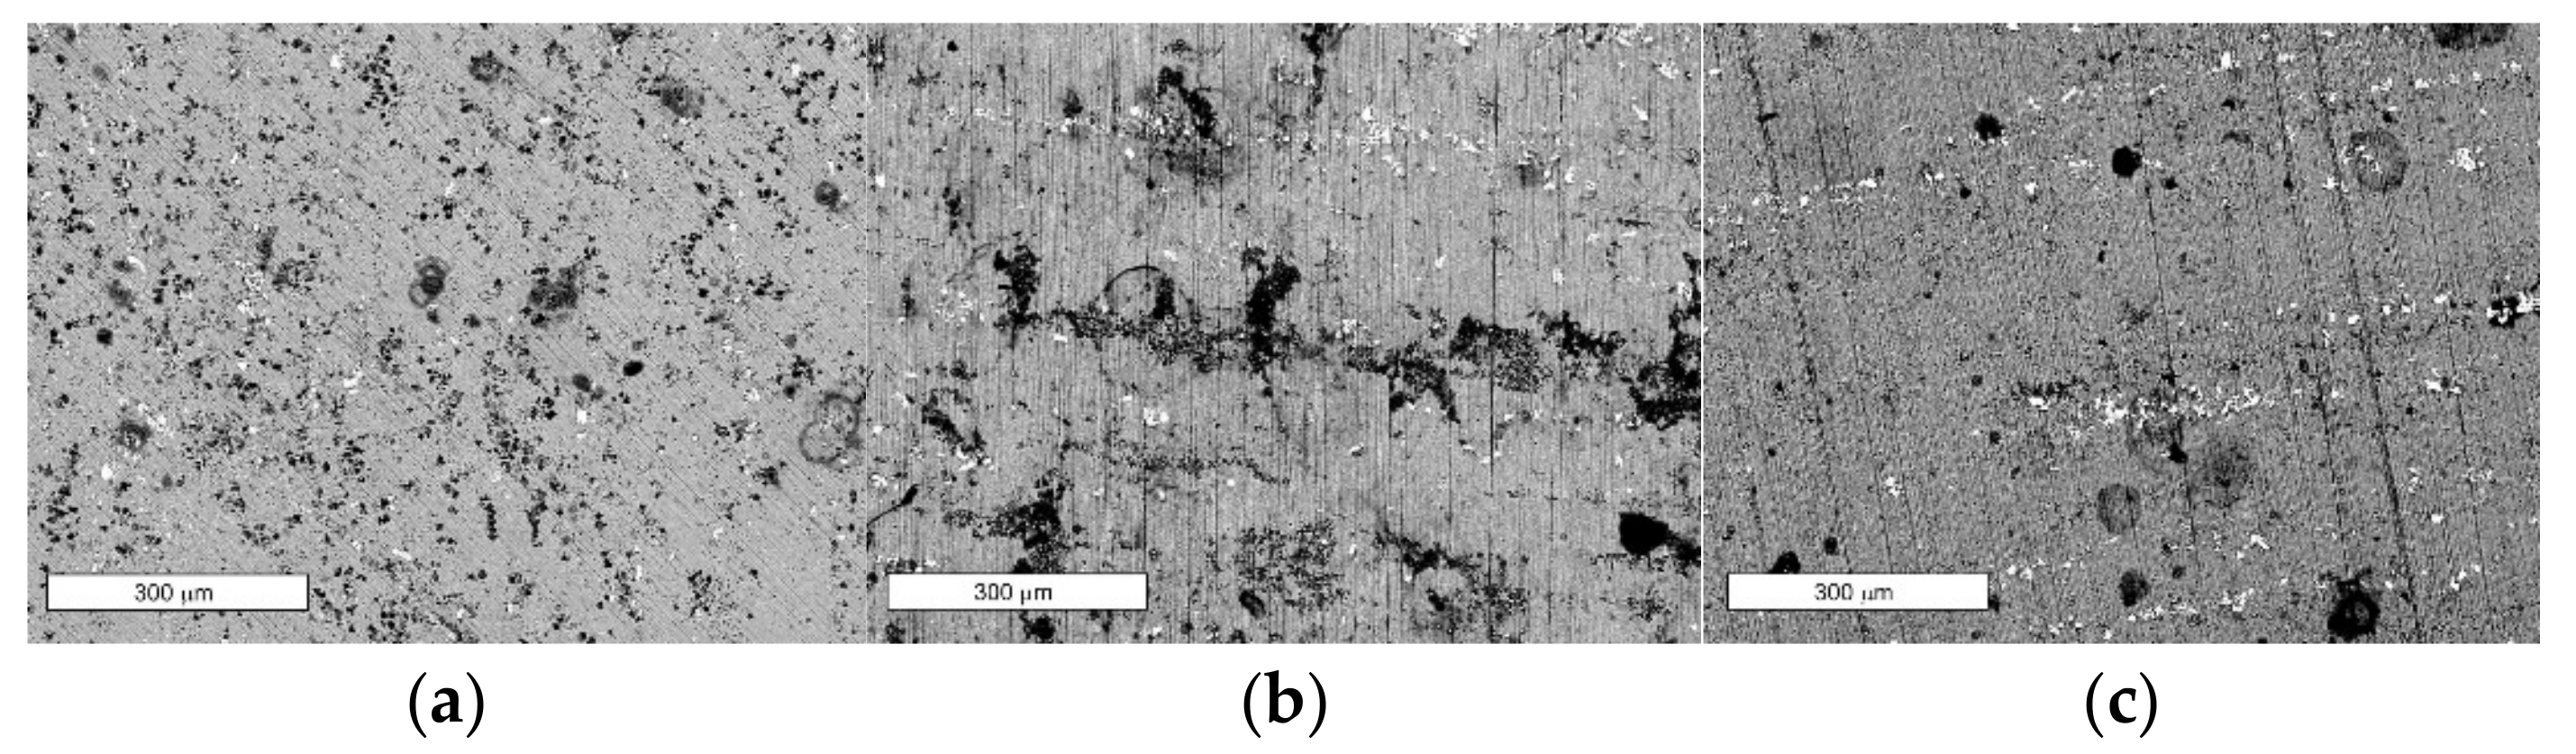
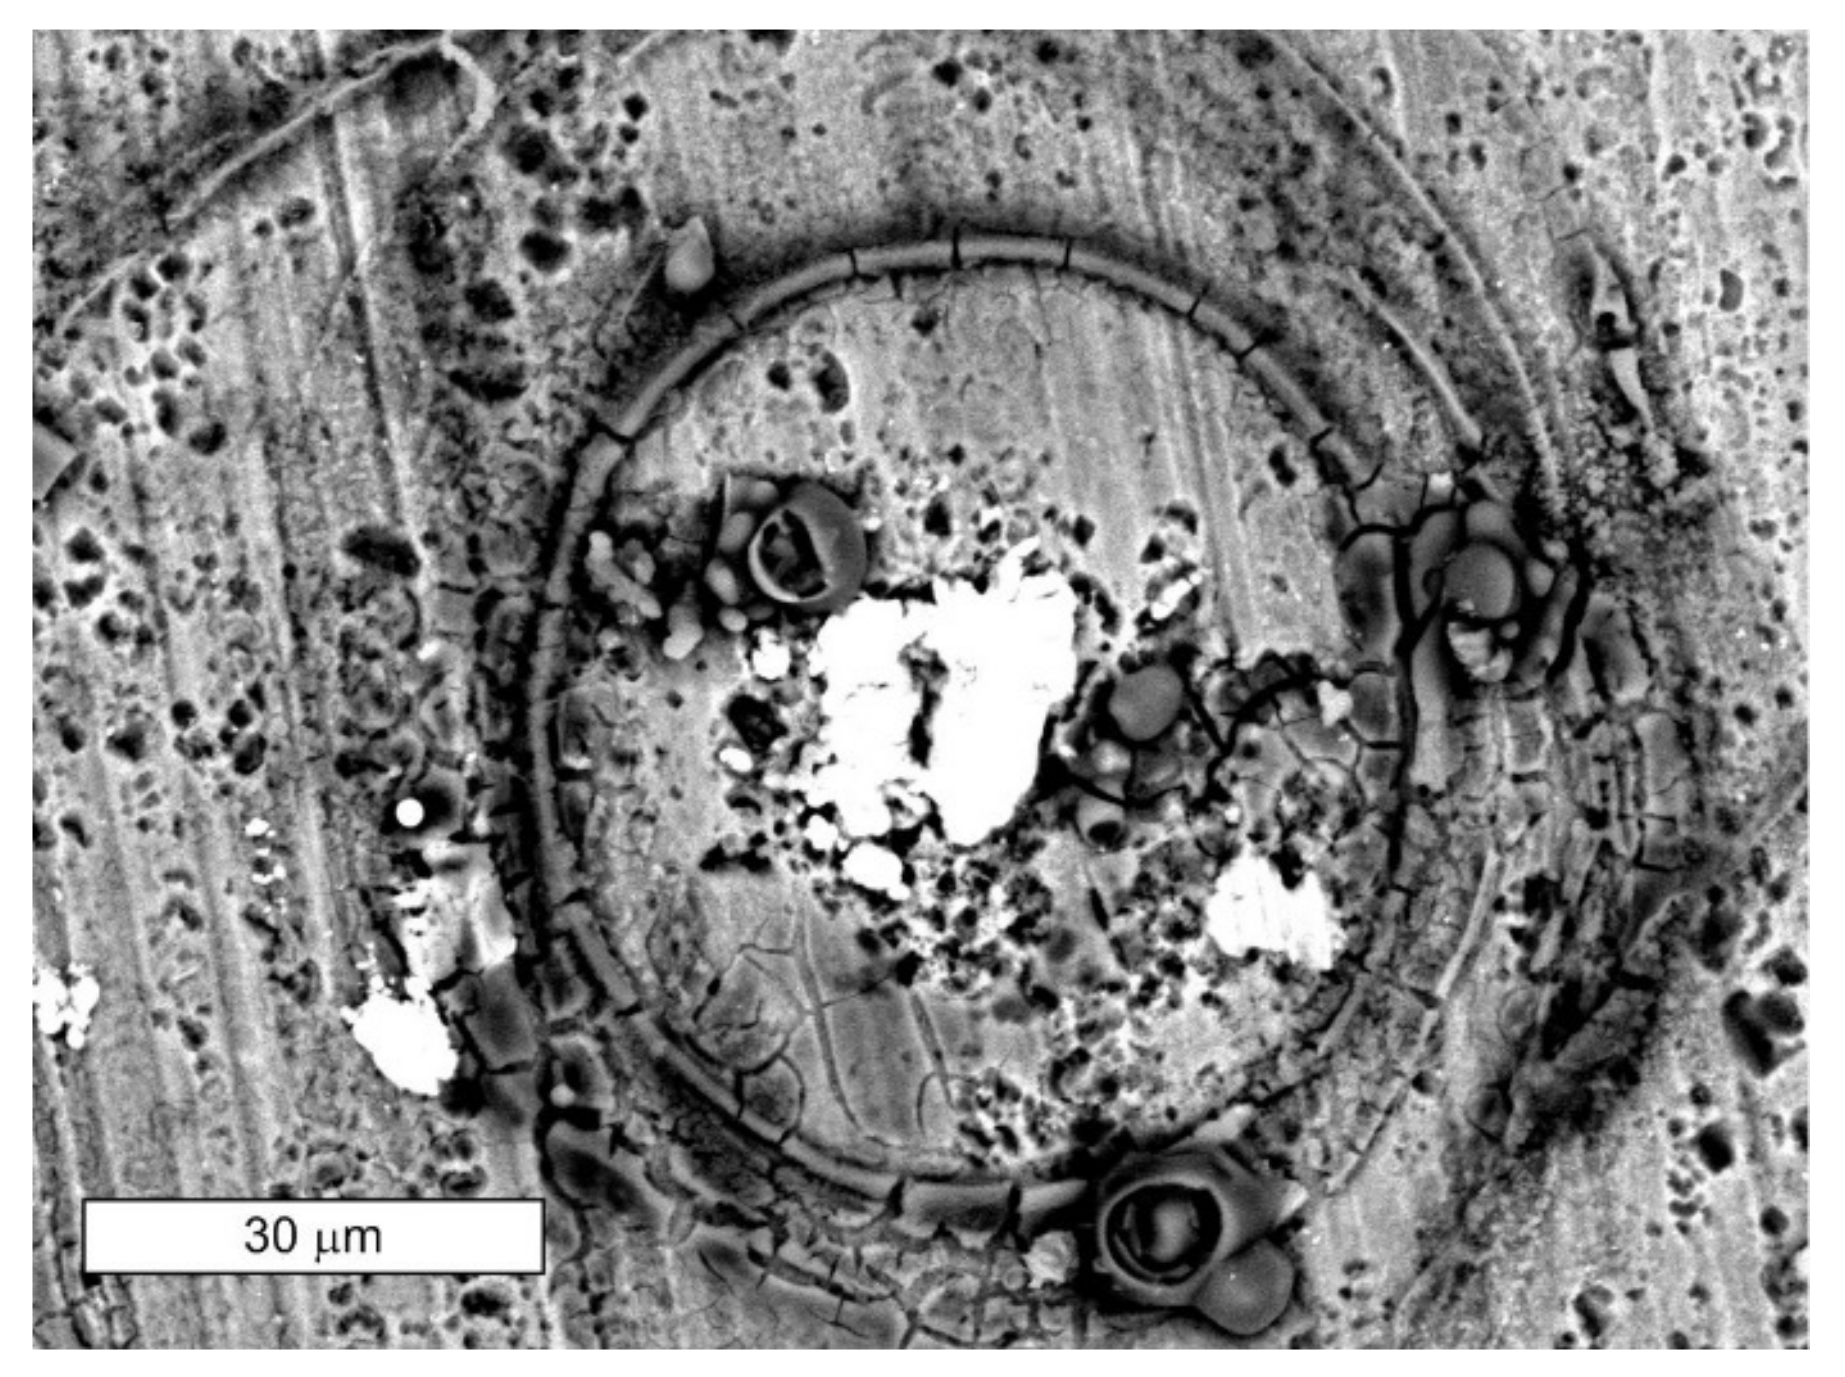
3.3. Corrosion Resistance Tests

Based on the results obtained from the weight loss measurement of the NSS test, it can be concluded that RRA treatment promoted an improvement in the general corrosion resistance compared to the T6 and DA states. The average corrosion rate for the coupon after the RRA process was 0.683 ± 0.029 mm/year. The following values were obtained for the T6 and DA states, respectively: 0.723 ± 0.027 and 0.741 ± 0.031 (Figure 11).
Observation of the samples after salt chamber testing showed local shallow pitting corrosion. After the removal of corrosion products, the fewest corrosion changes were observed for RRA, indicating a more uniform corrosion development after RRA. In the case of T6 and DA samples, the nature of the changes was similar, and the pits formed bands, indicating a significant influence of MPs present in the microstructure and precipitating in bands on the corrosion development. Stereoscopic images of the corroded surfaces of the samples after the NSS test are shown in Figure 12. The microstructure after RRA treatment was characterized by the occurrence of finely dispersed MgZn2 precipitates in the grains (MPs) and fragmented, discontinuous precipitates occurring along the grain boundaries (GBPs). The discontinuously distributed and separated precipitates occurring after RRA decreased the anodic dissolution rate along the grain boundaries as they crossed the corrosion channels. Thus, this microstructure arrangement favored the uniform development of corrosion. This was confirmed by the microscopic SEM observations (Figure 13). The smallest local changes were observed for this state. The largest changes concerned the states of T6 and DA. After single aging, the pitting nature of the corrosion was observed, in which the pits penetrated deep into the material. In the case of double aging, the changes were flatter, and at the same time, a clear relationship between the developing corrosion and the grain boundaries was observed locally. In the microscopic image, the corrosion clearly followed a specific path, along the line initiated at the grain boundaries (Figure 14). In the case of RRA, it was observed at higher magnifications that corrosion was initiated on the entire surface of the sample, although the influence of grain boundaries on the course of corrosion could be observed locally (Figure 15). In this case, the corrosion resulted from preferential dissolution of precipitates present in the matrix and caused α solid-solution reaction. This combined dissolution of minor precipitates and the surrounding solid solution resulted in the formation of an Al(OH)3 product layer that limited the depth of corrosion attack [33].
The obtained potentiodynamic curves determined electrochemical parameters, such as OCP potential, corrosion potential, corrosion current density, and polarization resistance. As can be seen from the electrochemical investigations, the electrochemical parameters determined from the obtained curves changed noticeably for various heat treatment conditions (Figure 16, Table 2). The higher polarization resistance and corrosion rate density indicate better corrosion resistance of the material after RRA. However, this was accompanied by a decrease in corrosion and open-circuit potential values. The presence of precipitates at the grain boundaries of GBPs in the material microstructure resulted in a large potential difference between the anodic grain boundary and its cathodic center. It is suggested that as the aging stage deepened, alloy segregation occurred, leading to an increase in the copper content of GBPs as a result of the η phase moving toward equilibrium content [2,12,18,41,44]. The size, spacing, and copper content of GBPs after RRA treatment increased as the aging step deepened, which is beneficial for the grain boundary to resist anodic dissolution [43]. The separated and coarse-grained GBPs with high Cu content formed in the deepening aging process enhanced corrosion resistance. The increased copper concentration at grain boundaries and the induced decrease in copper content in the matrix caused the matrix potential to shift toward more negative values. A decrease in Zn and Mg content in GBPs’ chemical composition or an increase in Cu content results in a growth of GBPs’ potential value (shift toward more noble direction) [12,39]. This leads to a decrease in the relative potential difference between the cathodic matrix and anodic GBPs. This translates into a lower electrochemical activity of the alloy, which lowers the hydrogen emission rate [13]. This reduces the driving force for local corrosion and contributes to improved resistance to intergranular corrosion [43]. At the same time, grain centers become susceptible to dissolution [44]. In the RRA state, the MPs precipitates are also enriched in copper, which further promotes the reduction of copper content in the matrix [47]. Thus, the accompanying heat treatment segregation of copper to GBPs and the reduction in its content in the matrix can be explained by the shift in the Ecorr and EOCP potential toward lower values. At the same time, this is consistent with the microscopic observations after the NSS test. The microstructure of aluminum alloys after RRA favors the lowering of the potential difference between the matrix and the precipitates, which favors the lowering of the corrosion rate and the formation of changes of a more uniform character.
The corrosion rate was directly proportional to the corrosion current density, indicating that the alloy after RRA had the lowest corrosion rate, which is also consistent with the NSS test. Considering the corrosion current density, the different heat treatment states can be assigned the following order: T6 > DA > RRA. In addition, other authors [3,7,39] obtained in the case of the AW7055 alloy a lower value of current density for the state after RRA than in the state aged once.
The comparison of SEM images obtained from the surface after electrochemical tests allows the conclusion to be made that in the T6 state in the matrix area, diffuse corrosion was observed, which is a form of pitting corrosion depending on the crystallographic orientation of the grains. After DA, the changes were clearly streaked in accordance with the direction of plastic working, which indicates a significant influence of MPs on the development of corrosion. In the case of the condition after RRA on the surface, the least changes were observed, although the research was completed with the same overpotential value in relation to Ecorr (Figure 17, Figure 18 and Figure 19). This is consistent with the obtained results, because the lowest corrosion rate was obtained for this alloy in both types of corrosion tests. At the same time, in the case of the post-RRA condition, the formation of tubercles caused by local anodic corrosion of the matrix around the primary precipitates of the copper-rich phase was observed (Figure 20).

4. Conclusions

The corrosion resistance of the AW7075 alloy after Retrogression and Reaging (RRA) heat treatment was evaluated. The results were compared to conventional single-stage aging to the T6 state and dual-stage aging (DA). The selection of suitable heat treatment parameters for the AW7075 alloy allowed the optimization of the hardening of the material studied, which translated into the mechanical properties obtained. In order to determine the hardening state of the alloy, the tests were carried out together with the measurements of the material hardness, as well as microscopic observations. The results of the research carried out can be summarized as follows:
(1)
RRA treatment improved the hardening of the tested alloy, which will result in better strength properties. The alloy after RRA treatment was characterized by the highest hardness. The hardness of the AW7075 alloy increased in the following order: DA < T6 < RRA.
(2)
The tests also revealed that the achieved increase in hardening was correlated with the preservation of high resistance to general corrosion of the alloy after RRA treatment. The corrosion rate determined after the salt spray tests can be arranged in the following order: RRA < T6 ≈ DA.
(3)
Higher polarization resistance and corrosion rate density values also indicated better corrosion resistance of the material after RRA treatment. However, this was accompanied by a decrease in corrosion and open-circuit potential values. The corrosion potential value can be presented in increasing order: RRA < T6 ≈ DA.
(4)
Nevertheless, it should be remembered that resistance to one type of corrosion does not ensure resistance to the others. At the same time, the literature analysis showed that RRA treatment provides better resistance to stress corrosion cracking and relatively good resistance to intergranular corrosion.
These facts mean that RRA treatment should be considered beneficial in preventing various types of corrosion of 7000 series alloys with copper. It is uncertain whether the 7000 series aluminum alloys without copper addition will show similar behavior. This requires further research in this area.

Author Contributions

Conceptualization, M.L.; methodology, M.L.; software, M.L.; validation, A.Ł., M.C. and M.L.; formal analysis, A.Ł., M.C. and M.L.; investigation, A.Ł., M.C. and M.L.; resources, M.L.; data curation, A.Ł., M.C. and M.L.; writing—original draft preparation, A.Ł. and M.C.; writing—review and editing, M.L.; visualization, M.L.; supervision, M.L.; project administration, M.L.; funding acquisition, M.L. All authors have read and agreed to the published version of the manuscript.

Funding

This research received no external funding.

Institutional Review Board Statement

Not applicable.

Informed Consent Statement

Not applicable.

Data Availability Statement

Not applicable.

Conflicts of Interest

The authors declare no conflict of interest.

References

  1. Rometsch, P.A.; Zhang, Y.; Knight, S. Heat treatment of 7xxx series aluminium alloys—Some recent developments. Trans. Nonferrous Met. Soc. China 2014, 24, 2003–2017. [Google Scholar] [CrossRef]
  2. Peng, G.; Chen, K.; Chen, S.; Fang, H. Influence of repetitious-RRA treatment on the strength and SCC resistance of Al–Zn–Mg–Cu alloy. Mater. Sci. Eng. A 2011, 528, 4014–4018. [Google Scholar] [CrossRef]
  3. Wang, T.; Yang, L.; Tang, Z.; Liu, C.; Ma, Y.; Wu, L.; Yan, H.; Yu, Z.; Liu, W. Effect of aging treatment on microstructure, mechanical and corrosion properties of 7055 aluminum alloy prepared using powder by-product. Mater. Sci. Eng. A 2021, 822, 141606. [Google Scholar] [CrossRef]
  4. Li, J.; Birbilis, N.; Li, C.; Jia, Z.; Cai, B.; Zheng, Z. Influence of retrogression temperature and time on the mechanical properties and exfoliation corrosion behavior of aluminium alloy AA7150. Mater. Charact. 2009, 60, 1334–1341. [Google Scholar] [CrossRef]
  5. Su, R.; Qu, Y.; Li, X.; You, J.; Li, R. Effect of Retrogression and Reaging on Stress Corrosion Cracking of Spray Formed Al Alloy. Mater. Sci. Appl. 2016, 7, 1–7. [Google Scholar] [CrossRef] [Green Version]
  6. Ozer, G.; Karaaslan, A. Properties of AA7075 aluminum alloy in aging and retrogression and reaging process. Trans. Nonferrous Met. Soc. China 2017, 27, 2357–2362. [Google Scholar] [CrossRef]
  7. Guo, F.; Duan, S.; Wu, D.; Matsuda, K.; Wang, T.; Zou, Y. Effect of retrogression re-aging treatment on corrosion behavior of 7055 Al-Zn-Mg alloy. Mater. Res. Express 2020, 7, 106523. [Google Scholar] [CrossRef]
  8. Podrez-Radziszewska, M.; Jóźwik, P. Influence of heat treatment on resistance to electrochemical corrosion of the strain-hardened strips made of the Ni3Al phase based alloys. Arch. Civ. Mech. Eng. 2011, 11, 1011–1021. [Google Scholar] [CrossRef]
  9. Lachowicz, M.M.; Jasionowski, R. Effect of Cooling Rate at the Eutectoid Transformation Temperature on the Corrosion Resistance of Zn-4Al Alloy. Materials 2020, 13, 1703. [Google Scholar] [CrossRef] [Green Version]
  10. Golański, G.; Lachowicz, M.M. Failure cause analysis for the suspension element of boiler superheater. Eng. Fail. Anal. 2019, 105, 490–495. [Google Scholar] [CrossRef]
  11. Park, J.K.; Ardell, A.J. Effect of retrogression and reaging treatments on the microstructure of Ai-7075-T651. Met. Mater. Trans. A 1984, 15, 1531–1543. [Google Scholar] [CrossRef]
  12. Marlaud, T.; Deschamps, A.; Bley, F.; Lefebvre, W.; Baroux, B. Evolution of precipitate microstructures during the retrogression and re-ageing heat treatment of an Al–Zn–Mg–Cu alloy. Acta Mater. 2010, 58, 4814–4826. [Google Scholar] [CrossRef]
  13. Rao, A.U.; Vasu, V.; Govindaraju, M.; Srinadh, K.S. Stress corrosion cracking behaviour of 7xxx aluminum alloys: A literature review. Trans. Nonferrous Met. Soc. China 2016, 26, 1447–1471. [Google Scholar] [CrossRef]
  14. Cooper, K.R.; Kelly, R. Crack tip chemistry and electrochemistry of environmental cracks in AA 7050. Corros. Sci. 2007, 49, 2636–2662. [Google Scholar] [CrossRef]
  15. Puiggali, M.; Zielinski, A.; Olive, J.; Renauld, E.; Desjardins, D.; Cid, M. Effect of microstructure on stress corrosion cracking of an Al-Zn-Mg-Cu alloy. Corros. Sci. 1998, 40, 805–819. [Google Scholar] [CrossRef]
  16. Zieliński, A.; Chrzanowski, J.; Warmuzek, M.; Gazda, A.; Jezierska, E. Influence of retrogression and reaging on microstructure, mechanical properties and susceptibility to stress corrosion cracking of an Al-Zn-Mg alloy. Mater. Corros. 2004, 55, 77–87. [Google Scholar] [CrossRef]
  17. Liu, L.; Pan, Q.; Wang, X.; Xiong, S. The effects of aging treatments on mechanical property and corrosion behavior of spray formed 7055 aluminium alloy. J. Alloy. Compd. 2018, 735, 261–276. [Google Scholar] [CrossRef]
  18. Park, J.; Ardell, A. Microchemical analysis of precipitate free zones in 7075-A1 in the T6, T7 and RRA tempers. Acta Met. Mater. 1991, 39, 591–598. [Google Scholar] [CrossRef]
  19. Liu, Y.; Jiang, D.; Li, W. The effect of multistage ageing on microstructure and mechanical properties of 7050 alloy. J. Alloy. Compd. 2016, 671, 408–418. [Google Scholar] [CrossRef]
  20. Krishnanunni, S.; Gupta, R.; Ajithkumar, G.; Kumar, V.A.; Ghosh, R. Investigation on effect of optimized RRA in strength and SCC resistance for aluminium alloy AA7010. Mater. Today Proc. 2020, 27, 2385–2389. [Google Scholar] [CrossRef]
  21. Hou, Y.; Chen, L.; Li, Z.; Zhao, G.; Zhang, C. Effects of artificial aging on microstructure, mechanical properties and stress corrosion cracking of a novel high strength 7A99 Al alloy. Mater. Sci. Eng. A 2020, 780, 139217. [Google Scholar] [CrossRef]
  22. Wang, Y.; Jiang, H.; Li, Z.; Yan, D.; Zhang, D.; Rong, L. Two-stage double peaks ageing and its effect on stress corrosion cracking susceptibility of Al-Zn-Mg alloy. J. Mater. Sci. Technol. 2018, 34, 1250–1257. [Google Scholar] [CrossRef]
  23. Emani, S.V.; Benedyk, J.; Nash, P.; Chen, D. Double aging and thermomechanical heat treatment of AA7075 aluminum alloy extrusions. J. Mater. Sci. 2009, 44, 6384–6391. [Google Scholar] [CrossRef]
  24. Wang, Y.; Liu, M.; Xiao, W.; Zhao, W.; Ma, C. Effects of multi-stage aging treatments on the precipitation behavior and properties of 7136 aluminum alloy. J. Alloy. Compd. 2020, 814, 152256. [Google Scholar] [CrossRef]
  25. Wei, L.; Han, B.; Ye, F.; Ditta, A.; Li, L.; Xu, Y.; Wu, S. Influencing mechanisms of heat treatments on microstructure and comprehensive properties of Al–Zn–Mg–Cu alloy formed by spray forming. J. Mater. Res. Technol. 2020, 9, 6850–6858. [Google Scholar] [CrossRef]
  26. Xiao, Y.-P.; Pan, Q.-L.; Li, W.-B.; Liu, X.-Y.; He, Y.-B. Influence of retrogression and re-aging treatment on corrosion behaviour of an Al–Zn–Mg–Cu alloy. Mater. Des. 2011, 32, 2149–2156. [Google Scholar] [CrossRef]
  27. Zieliński, A.; Warmuzek, M.; Gazda, A.; Jezierska, E.; Chrzanowski, J. Influence of retrogression and reaging (RRA) heat treatment on microstructure, mechanical and chemical behaviour of an Al-Zn-Mg alloy. Adv. Mater. Sci. 2002, 2, 33–69. [Google Scholar]
  28. Xia, P.; Liu, Z.; Bai, S.; Lu, L.; Gao, L. Enhanced fatigue crack propagation resistance in a superhigh strength Al–Zn–Mg–Cu alloy by modifying RRA treatment. Mater. Charact. 2016, 118, 438–445. [Google Scholar] [CrossRef]
  29. Lin, Y.; Jiang, Y.-Q.; Chen, X.-M.; Wen, D.-X.; Zhou, H.-M. Effect of creep-aging on precipitates of 7075 aluminum alloy. Mater. Sci. Eng. A 2013, 588, 347–356. [Google Scholar] [CrossRef]
  30. Li, Y.; Xu, G.; Liu, S.; Peng, X.; Yin, Z.; Wang, L.; Liang, X. Effect of ageing treatment on fatigue crack growth of die forged Al-5.87Zn-2.07Mg-2.42Cu alloy. Eng. Fract. Mech. 2019, 215, 251–260. [Google Scholar] [CrossRef]
  31. Nandana, M.S.; Bhat, K.U.; Manjunatha, C.M. Influence of retrogression and re-ageing heat treatment on the fatigue crack growth behavior of 7010 aluminum alloy. Procedia Struct. Integr. 2019, 14, 314–321. [Google Scholar] [CrossRef]
  32. Özer, G.; Kaya, I.; Karaaslan, A. Effects of retrogression and reaging heat treatment on the microstructure, exfoliation corrosion, electrical conductivity, and mechanical properties of AA7050. Mater. Corros. 2019, 70, 1788–1797. [Google Scholar] [CrossRef]
  33. Reda, Y.; Abdel-Karim, R.; Elmahallawi, I. Improvements in mechanical and stress corrosion cracking properties in Al-alloy 7075 via retrogression and reaging. Mater. Sci. Eng. A 2008, 485, 468–475. [Google Scholar] [CrossRef]
  34. Yang, R.X.; Liu, Z.Y.; Ying, P.Y.; Li, J.L.; Lin, L.H.; Zeng, S.M. Multistage-aging process effect on formation of GP zones and mechanical properties in Al–Zn–Mg–Cu alloy. Trans. Nonferrous Met. Soc. China 2016, 26, 1183–1190. [Google Scholar] [CrossRef]
  35. Xu, L.; Zhan, L.; Xu, Y.; Liu, C.; Huang, M. Thermomechanical pretreatment of Al-Zn-Mg-Cu alloy to improve formability and performance during creep-age forming. J. Mater. Process. Technol. 2021, 293, 117089. [Google Scholar] [CrossRef]
  36. Yuan, Z.-S.; Lu, Z.; Xie, Y.-H.; Dai, S.-L.; Liu, C.-S. Effects of RRA Treatments on Microstructures and Properties of a New High-strength Aluminum-Lithium Alloy-2A97. Chin. J. Aeronaut. 2007, 20, 187–192. [Google Scholar] [CrossRef] [Green Version]
  37. Mayén, J.; Abúndez, A.; Porcayo-Calderón, J.; Pereyra, I.; Serna, S.; Puente-Lee, I.; Salinas-Bravo, V.M.; Torres-Islas, Á. Part 1: Design and development of new sustainable coatings applied on aluminium 6061 alloy-RRA heat treated for engineering applications. Surf. Coatings Technol. 2017, 328, 488–498. [Google Scholar] [CrossRef]
  38. Mayén, J.; Abúndez-Pliego, A.; Pereyra, I.; Alcudia, E.; Porcayo-Calderón, J.; Colín, J.; Campillo, B. Correlation between mechanical properties and corrosion behavior of an Al 6061 alloy coated by 5% CH3COOH pressurized steam and RRA heat treated. Surf. Coatings Technol. 2017, 309, 344–354. [Google Scholar] [CrossRef]
  39. Ren, J.; Wang, R.; Peng, C.; Zhang, H.; Xu, C.; Wu, Y.; Feng, Y. Effect of repetitious retrogression and re-aging treatment on the microstructure, strength and corrosion behavior of powder hot-extruded 7055 Al alloy. Mater. Charact. 2020, 162, 110190. [Google Scholar] [CrossRef]
  40. Liu, Y.; Pan, Q.; Li, H.; Huang, Z.; Ye, J.; Li, M. Revealing the evolution of microstructure, mechanical property and corrosion behavior of 7A46 aluminum alloy with different ageing treatment. J. Alloy. Compd. 2019, 792, 32–45. [Google Scholar] [CrossRef]
  41. Wang, Y.; Cao, L.; Wu, X.; Tong, X.; Liao, B.; Huang, G.; Wang, Z. Effect of retrogression treatments on microstructure, hardness and corrosion behaviors of aluminum alloy 7085. J. Alloy. Compd. 2020, 814, 152264. [Google Scholar] [CrossRef]
  42. Sun, Y.; Pan, Q.; Lin, S.; Zhao, X.; Liu, Z.; Li, W.; Wang, G. Effects of critical defects on stress corrosion cracking of Al–Zn–Mg–Cu–Zr alloy. J Mater. Res. Technol. 2021, 12, 1303–1318. [Google Scholar] [CrossRef]
  43. Ren, J.; Wang, R.; Peng, C.; Feng, Y. Multistage aging treatment influenced precipitate characteristics improve mechanical and corrosion properties in powder hot-extruded 7055 Al alloy. Mater. Charact. 2020, 170, 110683. [Google Scholar] [CrossRef]
  44. Tian, Q.; Yang, Q.-M.; Lin, Y.-C.; Wang, J.-Q.; Zhu, X.-H. Effects of Aging Treatment on Corrosion Behavior of a Tensile Deformed Al-Cu-Mn-Fe-Zr Alloy in 3.5% NaCl Solution. Materials 2021, 14, 5062. [Google Scholar] [CrossRef] [PubMed]
  45. Marlaud, T.; Deschamps, A.; Bley, F.; Lefebvre, W.; Baroux, B. Influence of alloy composition and heat treatment on precipitate composition in Al–Zn–Mg–Cu alloys. Acta Mater. 2010, 58, 248–260. [Google Scholar] [CrossRef]
  46. Kumar, S.; Namboodhiri, T.K.G. Precipitation hardening and hydrogen embrittlement of aluminum alloy AA7020. Bull. Mater. Sci. 2011, 34, 311–321. [Google Scholar] [CrossRef]
  47. Zhao, H.; Gault, B.; Ponge, D.; Raabe, D. Reversion and re-aging of a peak aged Al-Zn-Mg-Cu alloy. Scr. Mater. 2020, 188, 269–273. [Google Scholar] [CrossRef]
Figure 1. Diagram of the heat treatments: (a) T6, (b) DA, and (c) RRA.
Cmd 03 00008 g001
Figure 2. Results of hardness measurements of AW7075 alloy after heat treatments.
Cmd 03 00008 g002
Figure 3. Microstructure of the investigated alloy in the scanning electron microscope image. Visible precipitations of primary phases in the α(Al) solid solution.
Cmd 03 00008 g003
Figure 4. Characteristic X-ray spectra obtained from the phases shown in Figure 3: (a) Mg2Si phase, (b) α-AlFeMnSi(Cr,Cu) phase
Cmd 03 00008 g004
Figure 5. Microstructure of the alloy in the T6 state: (a) unetched state and (b) etched state. Light microscopy, BF.
Cmd 03 00008 g005
Figure 6. Magnified image of the alloy microstructure in the T6 state: (a) DIC contrast and (b) bright-field (BF). Etched state, light microscopy.
Cmd 03 00008 g006
Figure 7. Microstructure of the alloy in the DA state: (a) unetched state and (b) etched state. Light microscopy, BF.
Cmd 03 00008 g007
Figure 8. Magnified image of the alloy microstructure in the DA state: (a) DIC contrast and (b) bright-field (BF). Etched state, light microscopy.
Cmd 03 00008 g008
Figure 9. Microstructure of the alloy in the RRA state: (a) unetched state and (b) etched state. Light microscopy, BF.
Cmd 03 00008 g009
Figure 10. Magnified image of the alloy microstructure in the RRA state: (a) DIC contrast and (b) bright-field (BF). Etched state, light microscopy.
Cmd 03 00008 g010
Figure 11. Corrosion rate CR obtained for particular states of heat treatment.
Cmd 03 00008 g011
Figure 12. Stereoscopic image of the surface of the samples after the NSS test: T6 state (a), DA (b), and RRA (c).
Cmd 03 00008 g012
Figure 13. SEM images obtained from the surface of samples after the NSS test at low magnification:state T6 (a), DA (b), RRA (c), and SEM.
Cmd 03 00008 g013
Figure 14. Corrosion initiated in the area of the grain boundary and propagating to the matrix in the DA state (a,b), SEM.
Cmd 03 00008 g014
Figure 15. Corrosion developing in the area of grain boundaries and matrix in RRA state, SEM.
Cmd 03 00008 g015
Figure 16. Example of potentiodynamic curves obtained for each heat treatment condition.
Cmd 03 00008 g016
Figure 17. An exemplary general view of the surface of samples after electrochemical tests in the states: T6 (a), DA (b), and RRA (c); SEM.
Cmd 03 00008 g017
Figure 18. Corrosion with a clear character of a crystallographic attack observed on the surface of the sample after electrochemical tests in the T6 (a) state and localized corrosion in the sample DA (b); SEM.
Cmd 03 00008 g018
Figure 19. Corrosion changes observed after electrochemical tests on the sample surface in RRA state (a,b), SEM.
Cmd 03 00008 g019
Figure 20. Corrosive changes evidencing the formation of tubercles during electrochemical tests on the surface of the sample in RRA state, SEM.
Cmd 03 00008 g020
Table 1. Chemical composition of tested aluminum alloy AW7075.
ElementZnMgCuFeCrSiMnTiAl
Content [%]5.422.341.450.390.260.120.100.03rest
Table 2. Electrochemical parameters obtained for each heat treatment condition.
STANE0 (I = 0)
[mV]
Ecorr vs Ag/AgCl
[mV]
icorr
[µA/cm2]
Rp
[Ohm·cm2]
T6−771 ± 3−769 ± 41.94 ± 0.212135 ± 22
DA−766 ± 4−765 ± 20.79 ± 0.153438 ± 44
RRA−805 ± 7−802 ± 30.31 ± 0.1114 801 ± 103
Publisher’s Note: MDPI stays neutral with regard to jurisdictional claims in published maps and institutional affiliations.

