Social Jet-Lag in Tertiary Students Following a Modern Curriculum with Few Time-Tabled Contact Hours: A Pilot Study


Abstract
1. Introduction
2. Results
2.1. Demographics
2.2. Sleep Diary Data
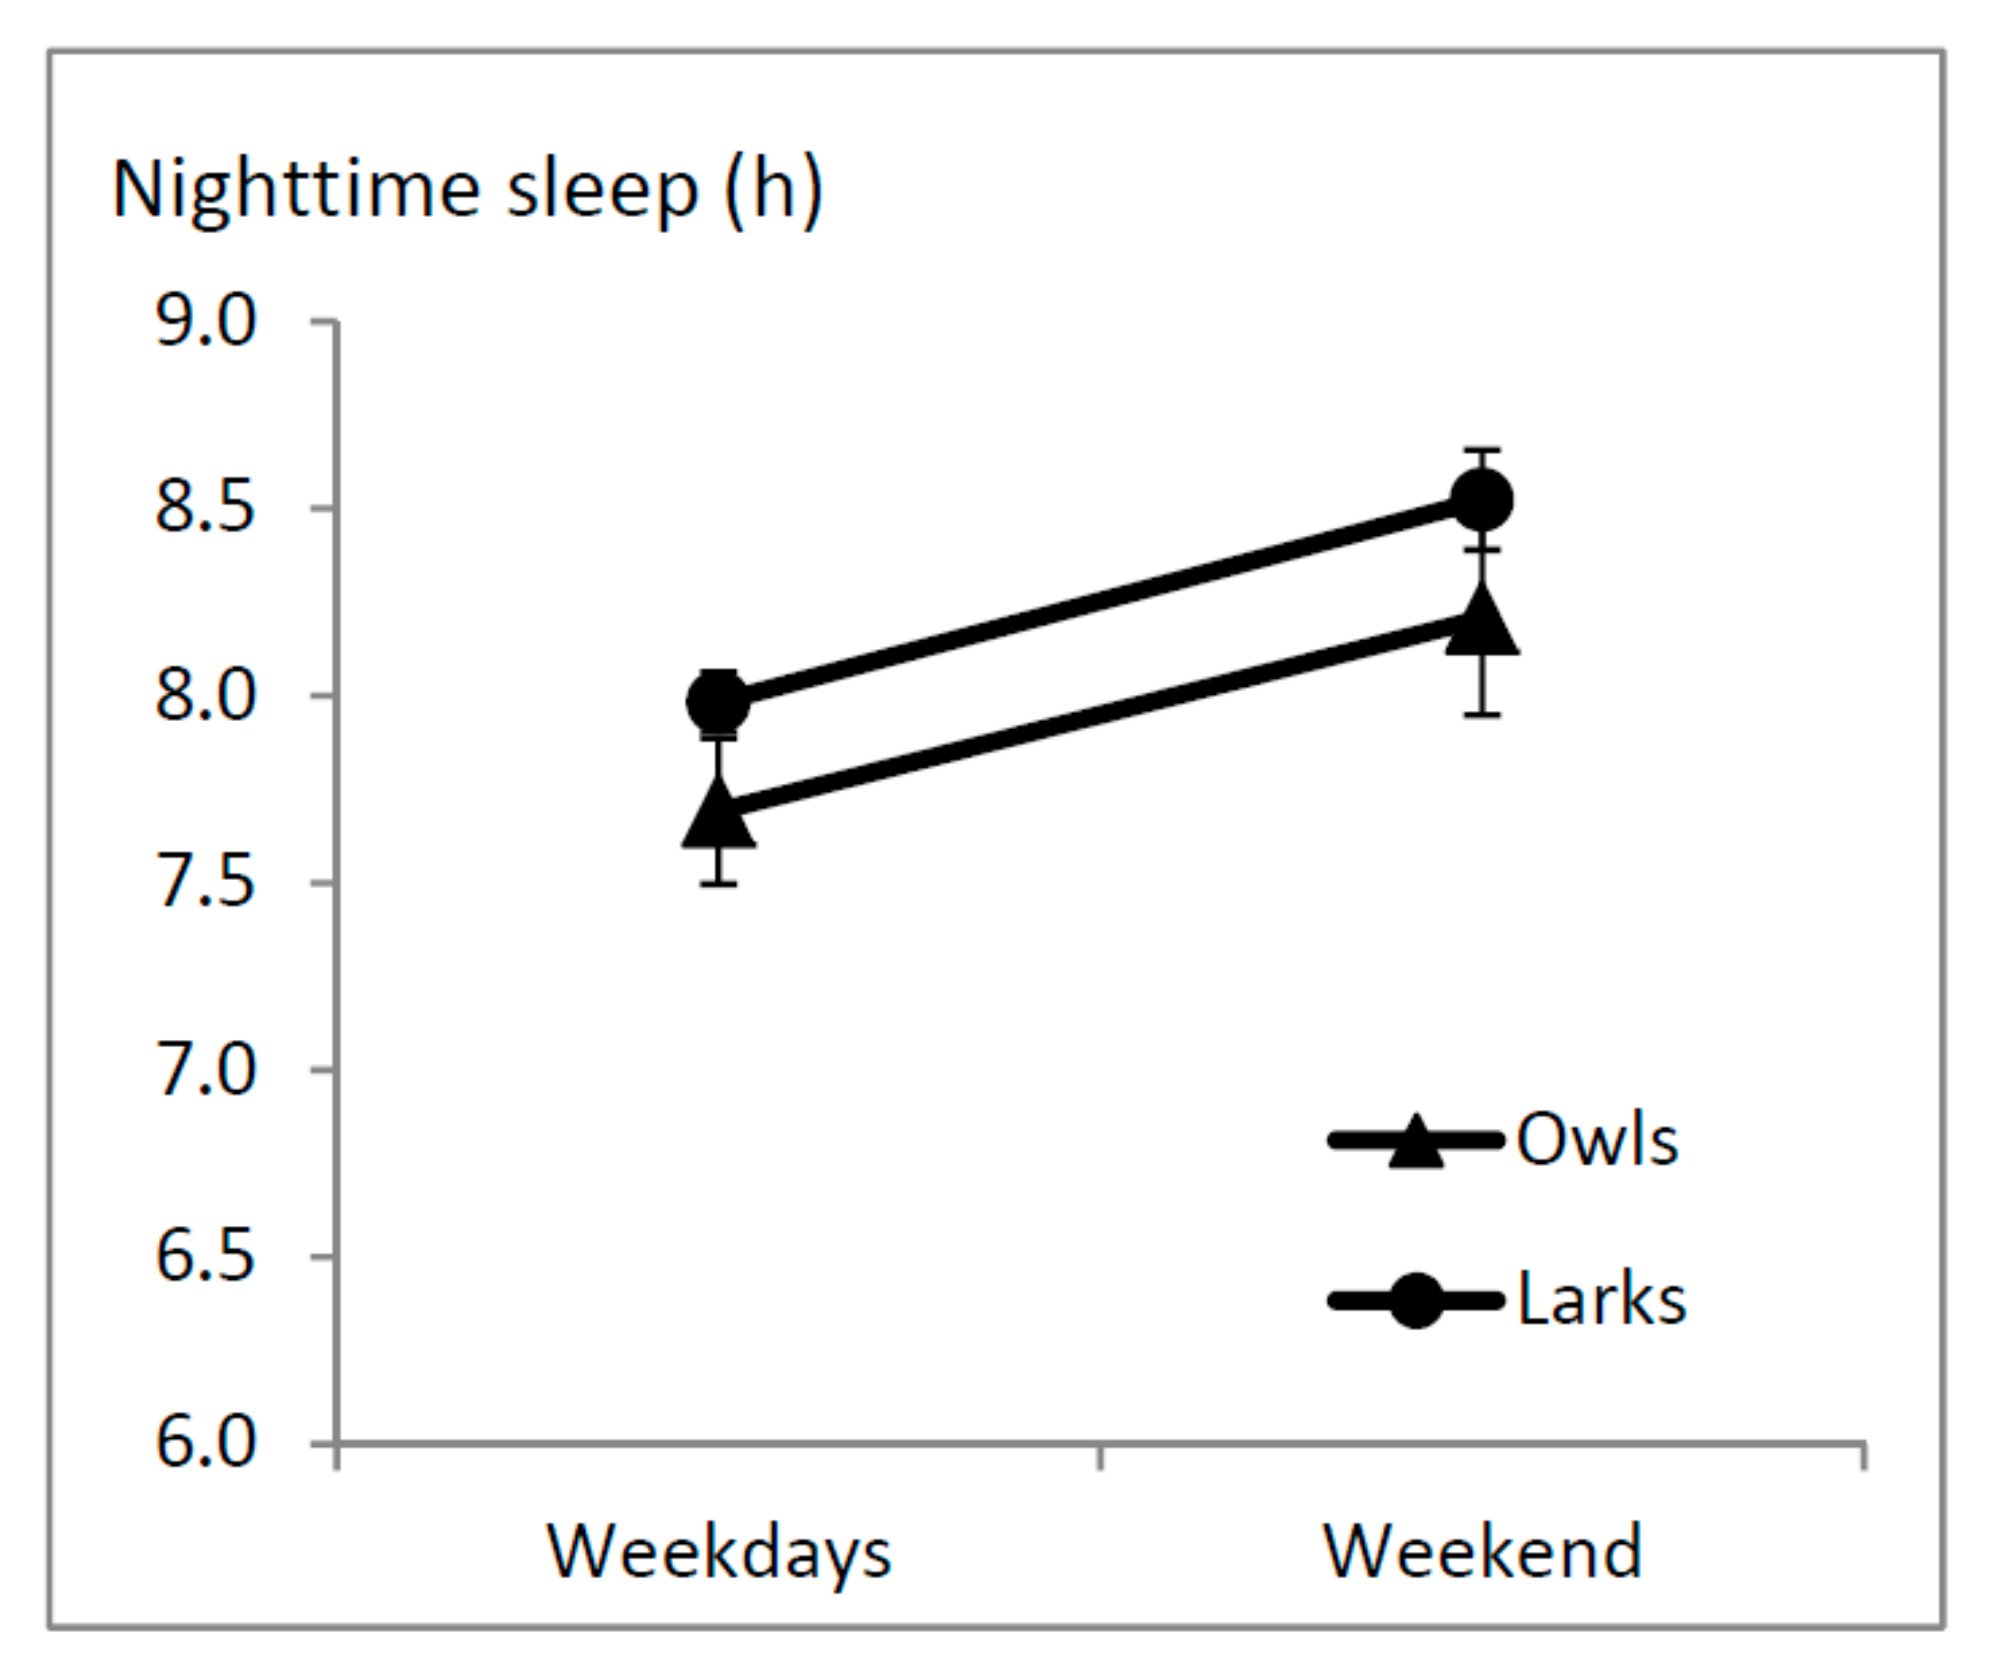
2.2.1. Sleep Duration
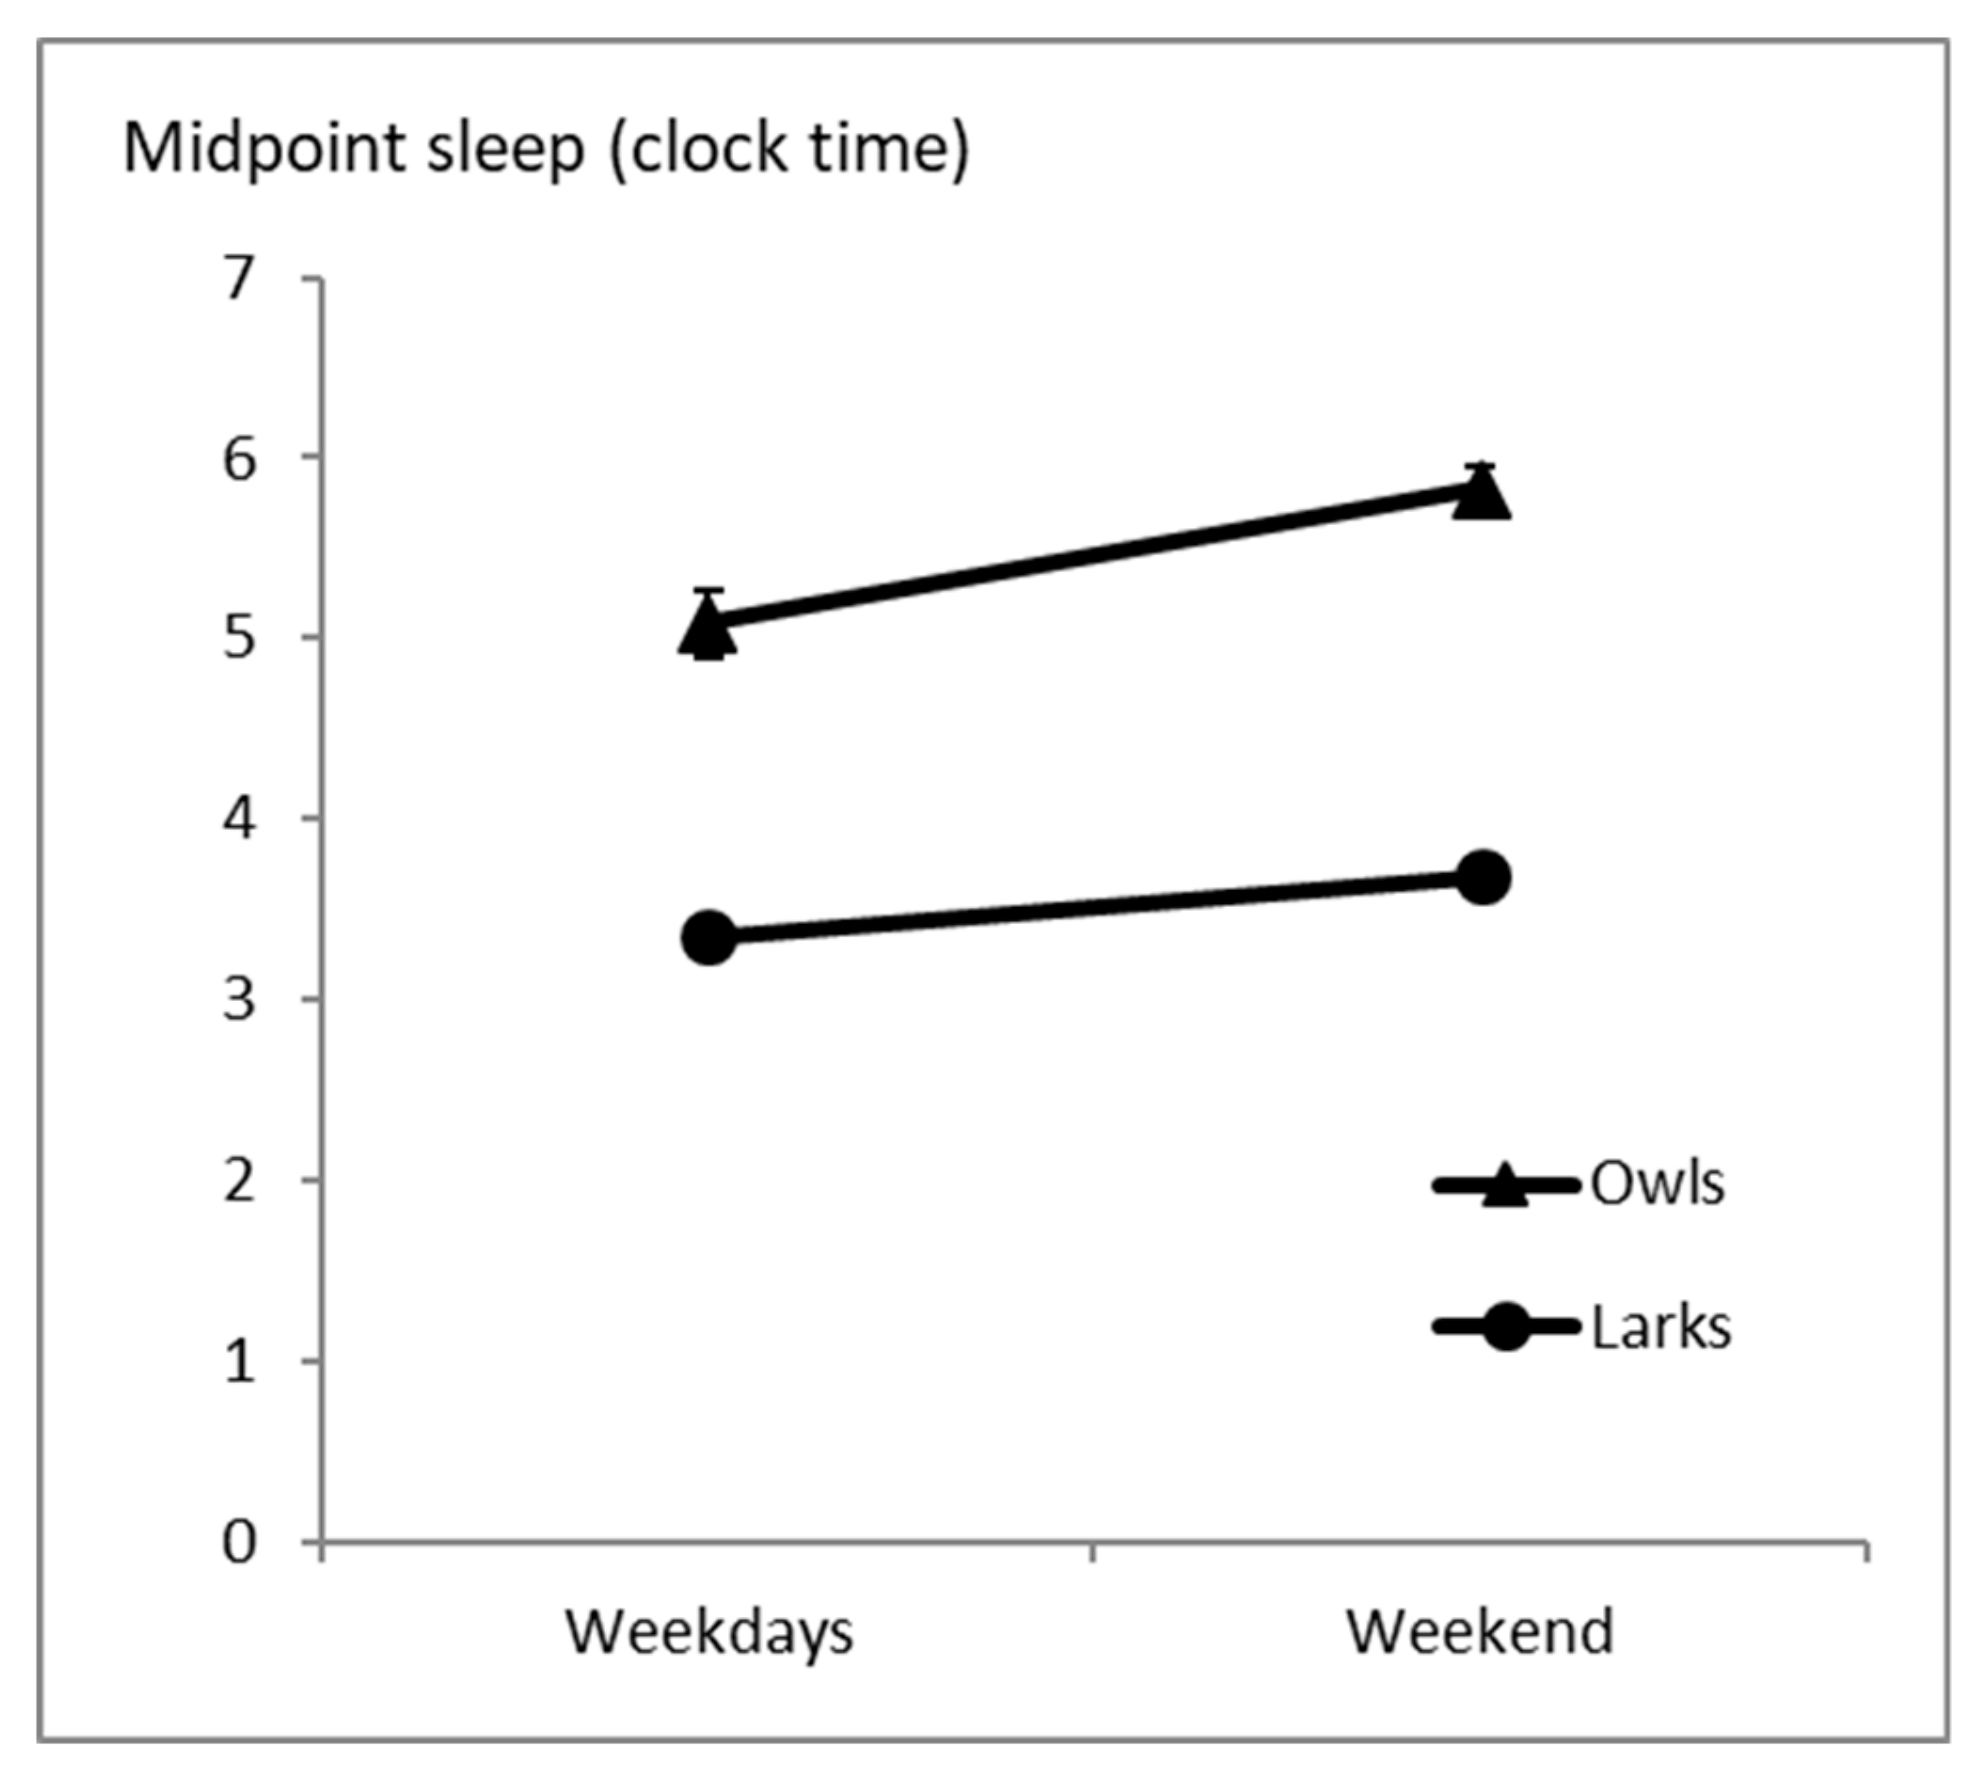
2.2.2. Midpoint Sleep
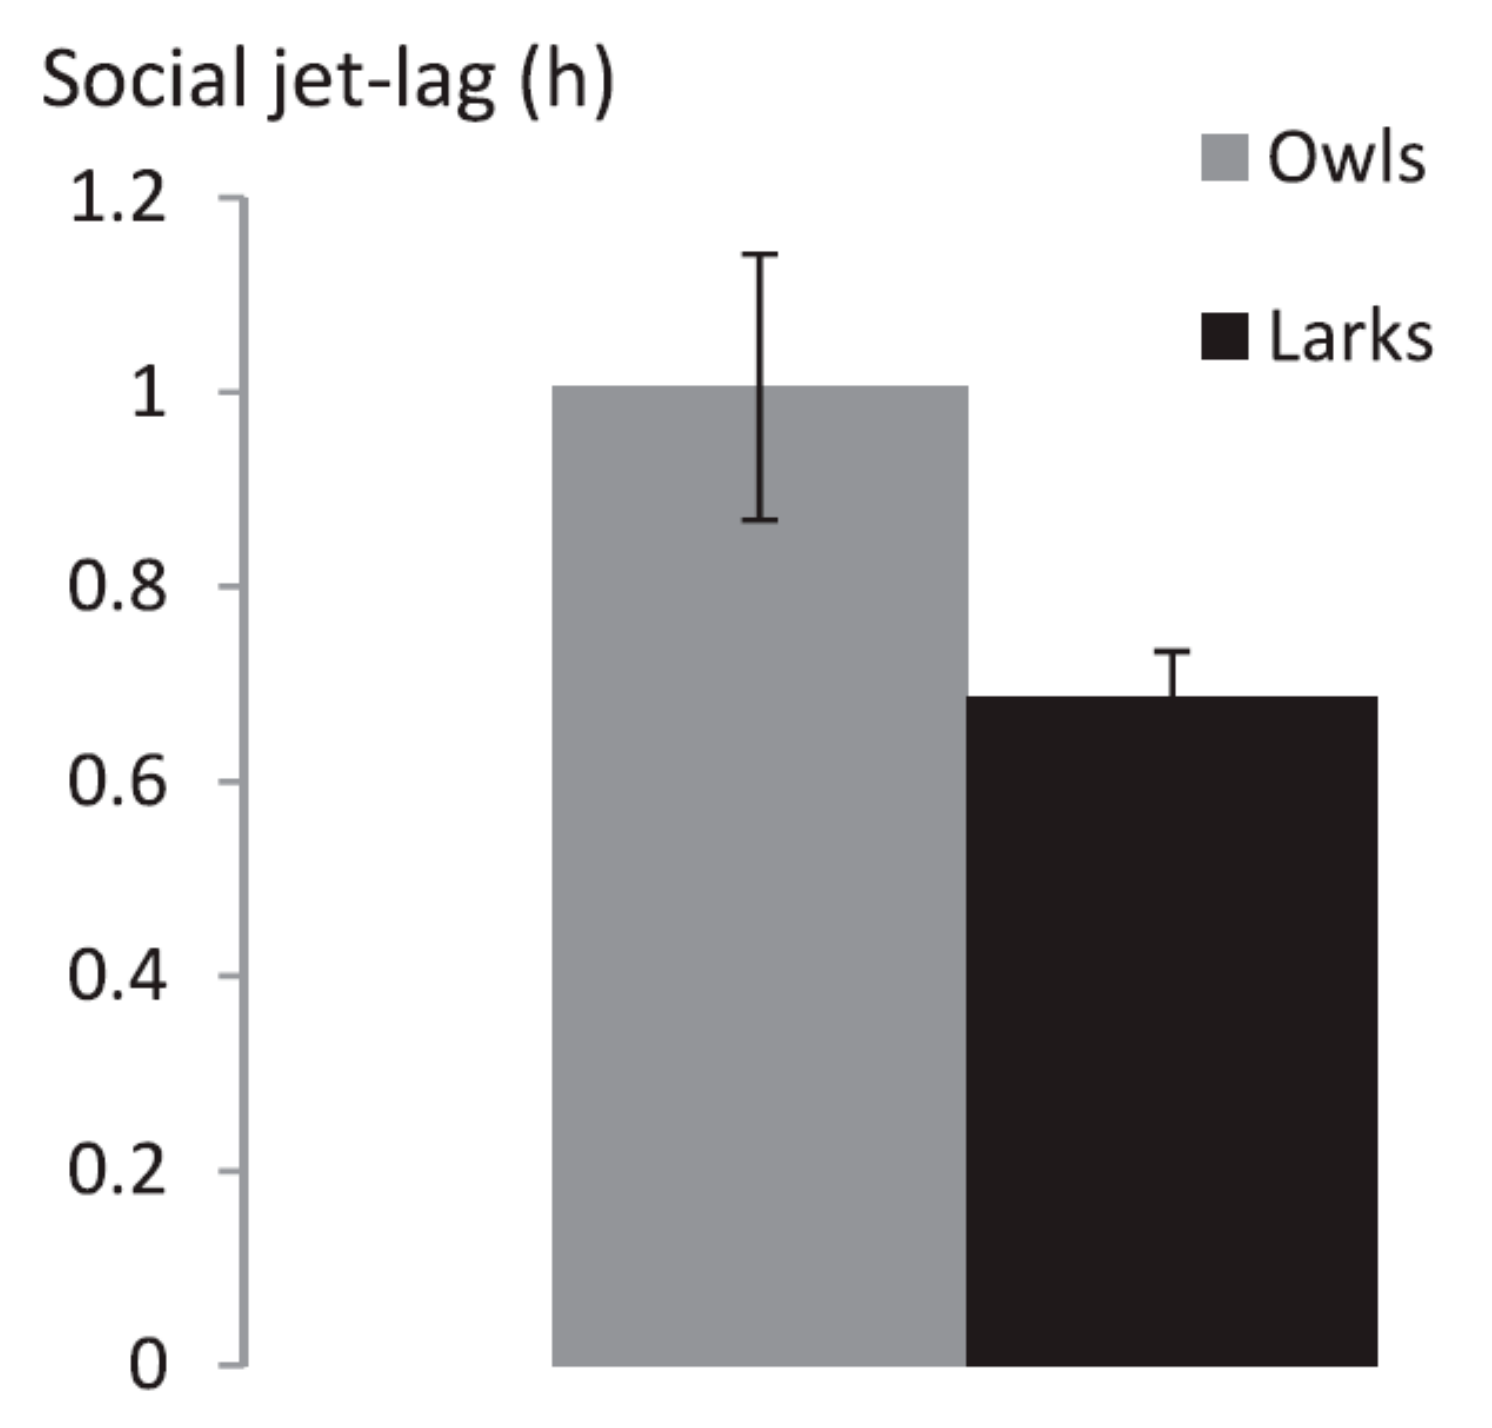
2.2.3. Social Jet-Lag
2.2.4. Daytime Napping
2.3. PSQI
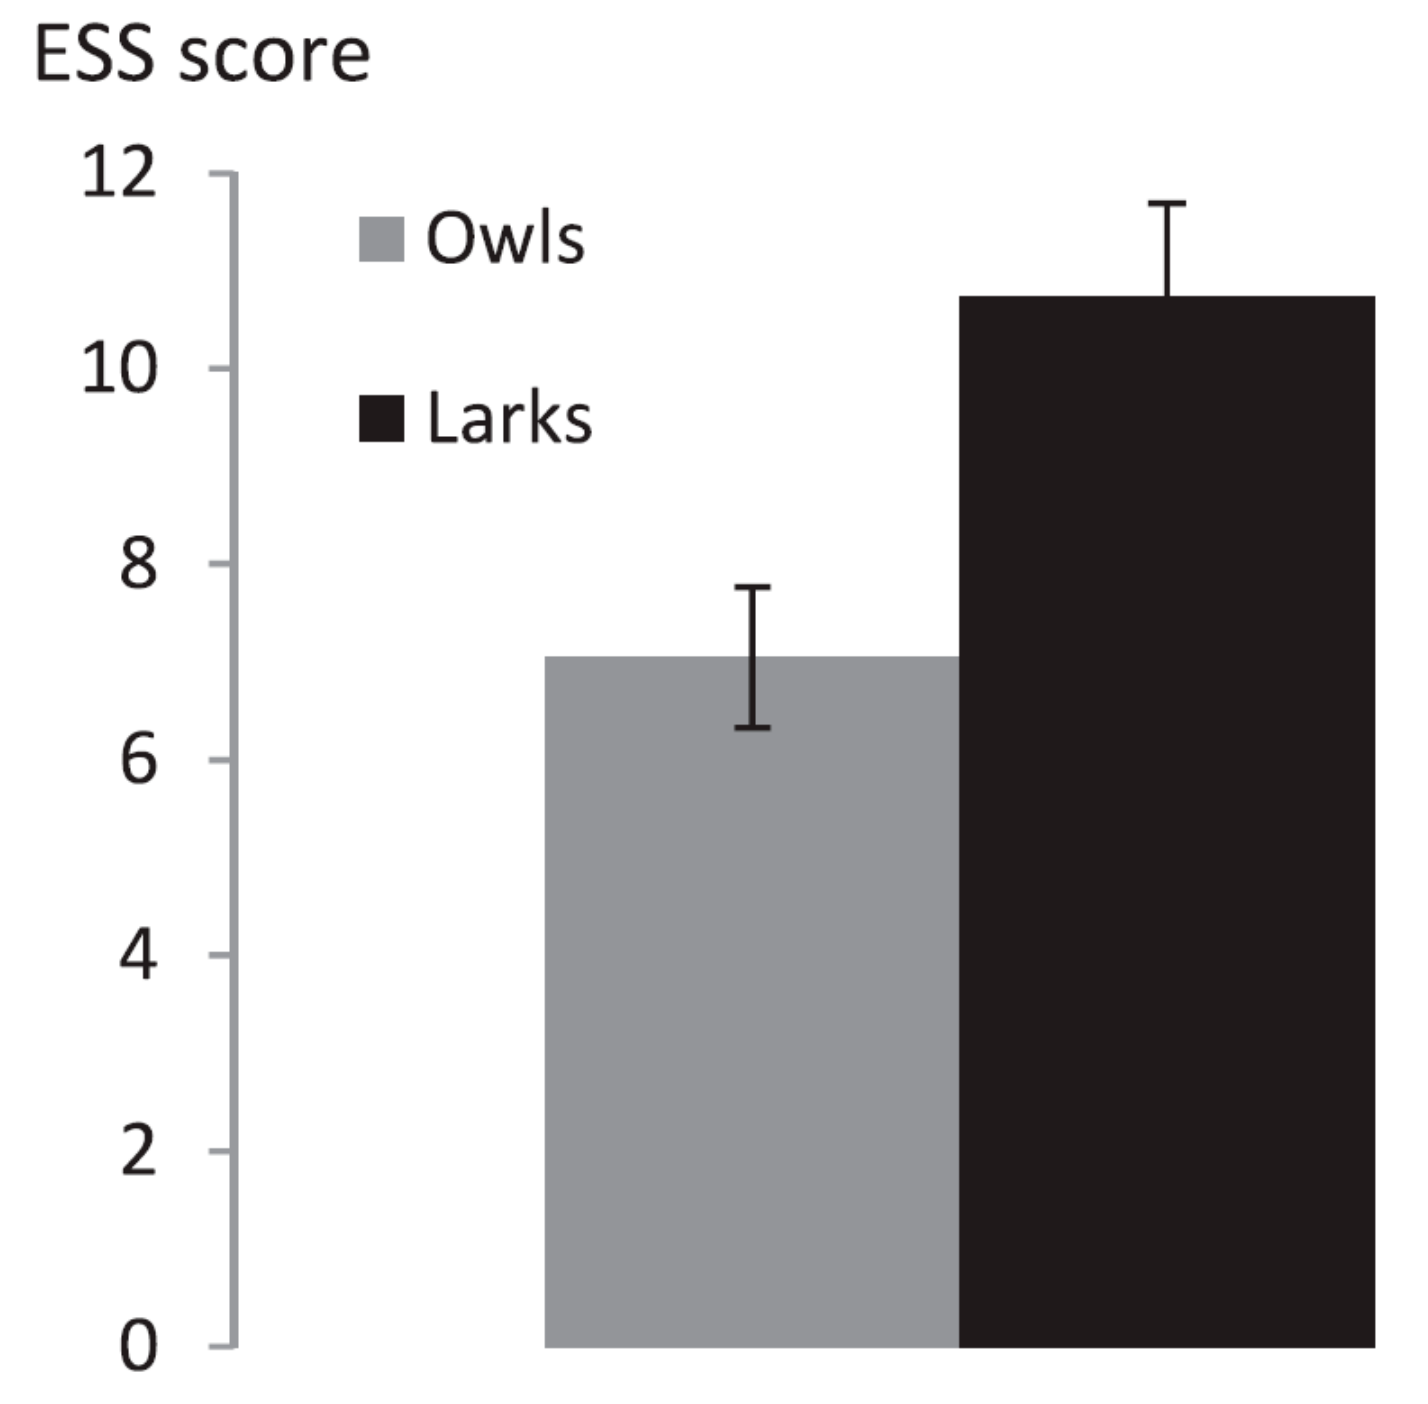
2.4. ESS
3. Discussion
4. Materials and Methods
4.1. Participants & Procedure
4.2. Sleep Diary & Questionnaires
4.3. Data Analysis
Author Contributions
Funding
Acknowledgments
Conflicts of Interest
Abbreviations
| ANOVA | Analysis Of VAriance |
| ESS | Epworth Sleepiness Scale |
| h | hour |
| PBL | Problem-Based Learning |
| PSQI | Pittsburgh Sleep Quality Index |
| SEM | Standard Error of the Mean |
| SJL | Social Jet-Lag |
| TST | Total Sleep Time |
References
- Wittmann, M.; Dinich, J.; Merrow, M.; Roenneberg, T. Social Jetlag: Misalignment of Biological and Social Time. Chrono. Int. 2006, 23, 497–509. [Google Scholar] [CrossRef] [PubMed]
- Horne, J.A.; Ostberg, O. A self-assessment questionnaire to determine morningness-eveningness in human circadian rhythms. Int. J. Chrono. 1976, 4, 97–110. [Google Scholar]
- De Souza, C.M.; Hidalgo, M.P. Midpoint of sleep on school days is associated with depression among adolescents. Chronobiol. Int. 2014, 31, 199–205. [Google Scholar] [CrossRef] [PubMed]
- Haraszti, R.Á.; Ella, K.; Gyongyosi, N.; Roenneberg, T.; Káldi, K. Social jetlag negatively correlates with academic performance in undergraduates. Chronobiol. Int. 2014, 31, 603–612. [Google Scholar] [CrossRef] [PubMed]
- Hasler, B.P.; Bruce, S.; Scharf, D.; Ngari, W.; Clark, D.B. Circadian misalignment and weekend alcohol use in late adolescent drinkers: Preliminary evidence. Chronobiol. Int. 2019, 36, 1–15. [Google Scholar] [CrossRef]
- Jankowski, K.S. The role of temperament in the relationship between morningness-eveningness and mood. Chronobiol. Int. 2014, 31, 114–122. [Google Scholar] [CrossRef] [PubMed]
- Komada, Y.; Ikeda, Y.; Sato, M.; Kami, A.; Masuda, C.; Shibata, S. Social jetlag and menstrual symptoms among female university students. Chronobiol. Int. 2019, 36, 258–264. [Google Scholar] [CrossRef]
- Lau, E.Y.Y.; Wong, M.L.; Ng, E.; Hui, C.-C.H.; Cheung, S.F.; Mok, D.S.Y. “Social Jetlag” in Morning-Type College Students Living On Campus: Implications for Physical and Psychological Well-being. Chronobiol. Int. 2013, 30, 910–918. [Google Scholar] [CrossRef]
- Carskadon, M.A.; Wolfson, A.R.; Tzischinsky, O.; Seifer, R.; Acebo, C. Adolescent Sleep Patterns, Circadian Timing, and Sleepiness at a Transition to Early School Days. Sleep 1998, 21, 871–881. [Google Scholar] [CrossRef]
- Levine, B.; Roehrs, T.; Zorick, F.; Roth, T. Daytime sleepiness in young adults. Sleep 1988, 11, 39–46. [Google Scholar]
- Preckel, F.; Lipnevich, A.A.; Schneider, S.; Roberts, R.D. Chronotype, cognitive abilities, and academic achievement: A meta-analytic investigation. Learn. Individ. Differ. 2011, 21, 483–492. [Google Scholar] [CrossRef]
- Smarr, B.L.; Schirmer, A.E. 3.4 million real-world learning management system logins reveal the majority of students experience social jet lag correlated with decreased performance. Sci. Rep. 2018, 8, 4793. [Google Scholar] [CrossRef] [PubMed]
- Arrona-Palacios, A.; Diaz-Morales, J.F. Morningness-eveningness is not associated with academic performance in the afternoon school shift: Preliminary findings. Br. J. Educ. Psychol. 2018, 88, 480–498. [Google Scholar] [CrossRef] [PubMed]
- Tavernier, R.; Munroe, M.; Willoughby, T. Perceived morningness–eveningness predicts academic adjustment and substance use across university, but social jetlag is not to blame. Chronobiol. Int. 2015, 32, 1233–1245. [Google Scholar] [CrossRef] [PubMed]
- Wijnen, M.; Loyens, S.M.M.; Smeets, G.; Kroeze, M.J.; Van Der Molen, H.T. Students’ and Teachers’ Experiences With the Implementation of Problem-Based Learning at a University Law School. Interdiscip. J. Probl. Learn. 2017, 11, 1–11. [Google Scholar] [CrossRef]
- Leenaars, C.H.; Klinkenberg, I.P.; Aussems, A.; Borger, N.; Faatz, V.; Hak, A.; Houben, E.; Ramackers, J.; Snackers, D.; Kalsbeek, A. Sleep and Food Choice in a Dutch Student Population. J. Circadian Rhythm. 2015, 13, 619. [Google Scholar] [CrossRef] [PubMed]
- Leenaars, C.H.; Zant, J.C.; Aussems, A.; Faatz, V.; Snackers, D.; Kalsbeek, A. The Leeds food preference questionnaire after mild sleep restriction—A small feasibility study. Physiol. Behav. 2016, 154, 28–33. [Google Scholar] [CrossRef]
- Buysse, D.J.; Reynolds, C.F., 3rd; Monk, T.H.; Berman, S.R.; Kupfer, D.J. The Pittsburgh Sleep Quality Index: A new instrument for psychiatric practice and research. Psychiatry Res. 1989, 28, 193–213. [Google Scholar] [CrossRef]
- Johns, M.W. A New Method for Measuring Daytime Sleepiness: The Epworth Sleepiness Scale. Sleep 1991, 14, 540–545. [Google Scholar] [CrossRef]
- Lovato, N.; Lack, L.; Wright, H. The Napping Behaviour of Australian University Students. PLoS ONE 2014, 9. [Google Scholar] [CrossRef]
- Díaz-Morales, J.F.; Escribano, C. Social jetlag, academic achievement and cognitive performance: Understanding gender/sex differences. Chronobiol. Int. 2015, 32, 822–831. [Google Scholar] [CrossRef] [PubMed]
- Roenneberg, T.; Kuehnle, T.; Pramstaller, P.P.; Ricken, J.; Havel, M.; Guth, A.; Merrow, M. A marker for the end of adolescence. Curr. Boil. 2004, 14, R1038–R1039. [Google Scholar] [CrossRef] [PubMed]
- Tonetti, L.; Fabbri, M.; Natale, V. Sex Difference in Sleep-Time Preference and Sleep Need: A Cross-Sectional Survey among Italian Pre-Adolescents, Adolescents, and Adults. Chronobiol. Int. 2008, 25, 745–759. [Google Scholar] [CrossRef] [PubMed]
- Van der Vinne, V.; Zerbini, G.; Siersema, A.; Pieper, A.; Merrow, M.; Hut, R.A.; Roenneberg, T.; Kantermann, T. Timing of examinations affects school performance differently in early and late chronotypes. J. Biol. Rhythms. 2015, 30, 53–60. [Google Scholar] [CrossRef] [PubMed]
- Manni, R.; Ratti, M.T.; Barzaghi, N.; Galimberti, C.A.; Zucca, C.; Perucca, E.; Tartara, A. Daytime sleepiness in healthy university students: A multiparametric study. Neurol. Sci. 1991, 12, 303–309. [Google Scholar] [CrossRef]
- Castaño, V.; Campos, R.M.; Rosenthal, L.; Resendiz, M.; Vergara, P.; Ramos, G.G.; Bliwise, D.L.; Valencia-Flores, M.; Aguilar-Roblero, R.; Valencia-Flores, M.; et al. The siesta culture concept is not supported by the sleep habits of urban Mexican students. J. Sleep Res. 1998, 7, 21–29. [Google Scholar]
- Mateo, M.J.C.; Díaz-Morales, J.F.; Barreno, C.E.; Prieto, P.D.; Randler, C. Morningness-eveningness and sleep habits among adolescents: Age and gender differences. Psicothema 2012, 24, 410–415. [Google Scholar]
- Kabrita, C.S.; A Hajjar-Muça, T.; Duffy, J.F.; Hajjar-Muça, T. Predictors of poor sleep quality among Lebanese university students: Association between evening typology, lifestyle behaviors, and sleep habits. Nat. Sci. Sleep 2014, 6, 11–18. [Google Scholar] [CrossRef]
- Lemma, S.; Gelaye, B.; Berhane, Y.; Worku, A.; A Williams, M.; Lemma, S. Sleep quality and its psychological correlates among university students in Ethiopia: A cross-sectional study. BMC Psychiatry 2012, 12, 237. [Google Scholar] [CrossRef]
- Lund, H.G.; Reider, B.D.; Whiting, A.B.; Prichard, J.R. Sleep Patterns and Predictors of Disturbed Sleep in a Large Population of College Students. J. Adolesc. Health 2010, 46, 124–132. [Google Scholar] [CrossRef]
- Jahrami, H.; Alshomili, H.; Almannai, N.; Althani, N.; Aloffi, A.; AlGahtani, H.; Brown, C.A. Predictors of Excessive Daytime Sleepiness in Medical Students: A Meta-Regression. Clocks Sleep 2019, 1, 18. [Google Scholar] [CrossRef]
- Martin, J.S.; Hébert, M.; LeDoux, É.; Gaudreault, M.; Laberge, L. Relationship of Chronotype to Sleep, Light Exposure, and Work-Related Fatigue in Student Workers. Chronobiol. Int. 2012, 29, 295–304. [Google Scholar] [CrossRef] [PubMed]
- Lai, P.P.; Say, Y.H. Associated Factors of Sleep Quality and Behavior among Students of Two Tertiary Institutions in Northern Malaysia. Med. J. Malays. 2013, 68, 195–203. [Google Scholar]
- Johns, M.W. Reliability and Factor Analysis of the Epworth Sleepiness Scale. Sleep 1992, 15, 376–381. [Google Scholar] [CrossRef] [PubMed]
- O’Brien, E.; Hart, C.; Wing, R.R. Discrepancies Between Self-Reported Usual Sleep Duration and Objective Measures of Total Sleep Time in Treatment-Seeking Overweight and Obese Individuals. Behav. Sleep Med. 2016, 14, 539–549. [Google Scholar] [CrossRef] [PubMed]
- Ibáñez, V.; Silva, J.; Cauli, O.; Abdullah, J. A survey on sleep assessment methods. Peer J. 2018, 6, e4849. [Google Scholar]
- Faul, F.; Erdfelder, E.; Lang, A.-G.; Buchner, A. G*Power 3: A flexible statistical power analysis program for the social, behavioral, and biomedical sciences. Behav. Res. Methods 2007, 39, 175–191. [Google Scholar] [CrossRef]
- Cohen, J. A power primer. Psychol. Bull. 1992, 112, 155–159. [Google Scholar] [CrossRef]
- Genzel, L.; Ahrberg, K.; Roselli, C.; Niedermaier, S.; Steiger, A.; Dresler, M.; Roenneberg, T. Sleep timing is more important than sleep length or quality for medical school performance. Chronobiol. Int. 2013, 30, 766–771. [Google Scholar] [CrossRef]
- Oluwole, O.S.A. Sleep habits in Nigerian undergraduates. Acta Neurol. Scand. 2010, 121, 1–6. [Google Scholar] [CrossRef]
- Bahammam, A.S.; Al-Khairy, O.K.; A Al-Taweel, A. Sleep habits and patterns among medical students. Neurosciences 2005, 10, 159–162. [Google Scholar] [PubMed]
- Jankowski, K.S. Social jet lag: Sleep-corrected formula. Chronobiol. Int. 2017, 4, 1–5. [Google Scholar] [CrossRef] [PubMed]


| Analysis Group | Nighttime Sleep in h (SEM) | Statistics | |
|---|---|---|---|
| Weekdays | Weekend | ||
| Larks | 8.0 (0.1) | 8.5 (0.1) | |
| Owls | 7.7 (0.2) | 8.2 (0.3) | |
| Week vs. Wknd: F(1,31) = 4.5; p = 0.043 Lark vs. Owl: F(1,31) = 0.85; p = 0.36 Interaction: F(1,31) = 0.003; p = 0.96 | |||
| Self-reported morning types | 7.9 (0.3) | 8.4 (0.4) | |
| Self-reported evening types | 7.9 (0.2) | 8.1 (0.2) | |
| Week vs. Wknd: F(1,50) = 4.2; p = 0.045 Lark vs. Owl: F(1,50) = 0.85; p = 0.36 Interaction: F(1,50) = 0.11; p = 0.74 | |||
| 25% extreme early sleepers | 7.6 (0.3) | 7.5 (0.2) | |
| 25% extreme late sleepers | 7.3 (0.2) | 8.1 (0.4) | |
| Week vs. Wknd: F(1,24) = 1.9; p = 0.19 Lark vs. Owl: F(1,24) = 0.19; p = 0.67 Interaction: F(1,24) = 3.9; p = 0.059 | |||
| Analysis Group | Midpoint Sleep; Clock Time (SEM in h) | Statistics | |
|---|---|---|---|
| Weekdays | Weekend | ||
| Larks | 3:21 (0:05) | 3:41 (0:06) | |
| Owls | 5:14 (0:11) | 5:50 (0:07) | |
| Week vs. Wknd: F(1,31) = 10.8; p = 0.003 Lark vs. Owl: (F(1,31) = 55.6; p < 0.001 Interaction: F(1,31) = 1.5; p = 0.22 | |||
| Self-reported morning types | 3:26 (0:14) | 4:01 (0.19) | |
| Self-reported evening types | 4:54 (0:08) | 5:14 (0:09) | |
| Week vs. Wknd: F(1,50) = 7.4; p = 0.009 Lark vs. Owl: F(1,50) = 33.3; p < 0.001 Interaction: F(1,50) = 0.52; p = 0.47 | |||
| 25% extreme early sleepers | 3:52 (0:22) | 3:30 (0:16) | |
| 25% extreme late sleepers | 5:09 (0:16) | 6:14 (0:06) | |
| Week vs. Wknd: F(1,24) = 2.67; p = 0.12 Lark vs. Owl: F(1,24) = 11.1; p = 0.003 Interaction: F(1,24) = 42.8; p < 0.001 | |||
| Analysis Group | Social Jet-Lag in h (SEM) | Statistics |
|---|---|---|
| Larks | 0:41 (0:03) | T = −1.4; p = 0.16 |
| Owls | 1:00 (0:08) | |
| Self-reported morning types | 0:52 (0:12) | T = −0.20; p = 0.85 |
| Self-reported evening types | 0:54 (0:07) | |
| 25% extreme early sleepers | 0:52 (0:15) | T = −1.13; p = 0.33 |
| 25% extreme late sleepers | 1:15 (0:12) |
| Analysis Group | PSQI (SEM) | Statistics |
|---|---|---|
| Larks | 4.6 (0.7) | U = 137; p = 0.56 |
| Owls | 5.1 (0.5) | |
| Self-reported morning types | 9.3 (1.1) | U = 314; p = 0.24 |
| Self-reported evening types | 7.5 (0.6) | |
| 25% extreme early sleepers | 4.7 (0.6) | U = 91; p = 0.50 |
| 25% extreme late sleepers | 5.0 (0.5) |
| Analysis Group | ESS (SEM) | Statistics |
|---|---|---|
| Larks | 10.7 (1.0) | U = 52; p = 0.007 |
| Owls | 7.0 (0.7) | |
| Self-reported morning types | 4.1 (0.7) | U = 183; p = 0.11 |
| Self-reported evening types | 4.9 (0.3) | |
| 25% extreme early sleepers | 10.0 (1.1) | U = 39; p = 0.03 |
| 25% extreme late sleepers | 6.5 (1.1) |
© 2019 by the authors. Licensee MDPI, Basel, Switzerland. This article is an open access article distributed under the terms and conditions of the Creative Commons Attribution (CC BY) license (http://creativecommons.org/licenses/by/4.0/).
Share and Cite
Leenaars, C.H.C.; Lucassen, M.F.G.; Borger, N.; Houben, E.; Kalsbeek, A. Social Jet-Lag in Tertiary Students Following a Modern Curriculum with Few Time-Tabled Contact Hours: A Pilot Study. Clocks & Sleep 2019, 1, 306-318. https://doi.org/10.3390/clockssleep1030026
Leenaars CHC, Lucassen MFG, Borger N, Houben E, Kalsbeek A. Social Jet-Lag in Tertiary Students Following a Modern Curriculum with Few Time-Tabled Contact Hours: A Pilot Study. Clocks & Sleep. 2019; 1(3):306-318. https://doi.org/10.3390/clockssleep1030026
Chicago/Turabian StyleLeenaars, Cathalijn H. C., Mathijs F. G. Lucassen, Nedim Borger, Ellen Houben, and Andries Kalsbeek. 2019. "Social Jet-Lag in Tertiary Students Following a Modern Curriculum with Few Time-Tabled Contact Hours: A Pilot Study" Clocks & Sleep 1, no. 3: 306-318. https://doi.org/10.3390/clockssleep1030026
APA StyleLeenaars, C. H. C., Lucassen, M. F. G., Borger, N., Houben, E., & Kalsbeek, A. (2019). Social Jet-Lag in Tertiary Students Following a Modern Curriculum with Few Time-Tabled Contact Hours: A Pilot Study. Clocks & Sleep, 1(3), 306-318. https://doi.org/10.3390/clockssleep1030026