Article

Exploring Bismuth Oxide Supported Kaolinite for Photocatalytic Application

by
Punyanuch Thammaacheep
1,
Pornpraphatson Phetthai
1,
Suthitra Suchai
1,
Panatda Jannoey
2,3 and
Duangdao Channei
1,3,4,*
1
Department of Chemistry, Faculty of Science, Naresuan University, Phitsanulok 65000, Thailand
2
Department of Biochemistry, Faculty of Medical Science, Naresuan University, Phitsanulok 65000, Thailand
3
Center of Excellence for Innovation and Technology for Detection and Advanced Materials, Faculty of Science, Naresuan University, Phitsanulok 65000, Thailand
4
Centre of Excellence for Innovation and Technology for Water Treatment, Naresuan University, Phitsanulok 65000, Thailand
*
Author to whom correspondence should be addressed.
Surfaces 2024, 7(3), 698-713; https://doi.org/10.3390/surfaces7030045
Submission received: 24 July 2024 / Revised: 30 August 2024 / Accepted: 1 September 2024 / Published: 3 September 2024
(This article belongs to the Special Issue Porous Materials for Photocatalysis)

Abstract

:
Bismuth oxide (Bi2O3) and Bi2O3–supported Kaolin were synthesized using household microwave–assisted methods (350 W, 5 min), with catalyst characteristics analyzed. XRD patterns confirmed the monoclinic structure of Bi2O3. Incorporating 20%w/w Kaolin increased the specific surface area of Bi2O3 from 6.2879 to 16.1345 m2/g, observed in FESEM images showing a hierarchical flower-like morphology resembling French fries alongside Kaolin plates. XRF analysis identified elements in Kaolin contributing to self–doping in band structure of Bi2O3, reducing its band gap and PL intensity. Kaolin/Bi2O3 composites demonstrated enhanced photocatalytic degradation of tetracycline (TC) under visible light, attributed to Bi2O3-generated radicals and increased surface area. The composite photocatalyst can be recycled up to three times. This research not only enhances the photocatalytic activity of Bi2O3 but also increases the value of a local waste material, Kaolin clay. Such enhancements could potentially extend to other metal oxides and abundant waste materials within the country.

1. Introduction

Semiconductor photocatalysts have gained significant interest for their potential applications in breaking down organic compounds. Among these, TiO2 stands out as a widely utilized photocatalyst, known for its excellent chemical stability, potent oxidizing capability, and non-toxic nature [1,2]. However, its functionality is limited to ultraviolet light, which constitutes less than 5% of total sunlight, making it challenging for practical applications. As a result, many researchers have dedicated efforts to developing visible-light photocatalysts, among which are bismuth-containing semiconductors like BiOX (X = Cl, Br, I) [3,4,5], Bi2WO6 [6], Bi2MoO6 [7], BiVO4 [8,9], and Bi2O3 [10,11,12,13,14,15].
The latter, bismuth oxide (Bi2O3), is gaining more attention due to its non-toxicity, stability in heat, eco-friendliness, high visible light absorption, and effectiveness in oxidation when used as a photocatalyst [16].
Bi2O3 typically exists in different phases and crystallite forms. The predominant phases include the alpha (α) phase, characterized by a monoclinic crystal structure, the beta (β) phase with a tetragonal crystal structure, and the gamma (γ) phase with a cubic crystal structure. Each phase has distinct crystal structures and properties [17,18]. Notably, the alpha (α) phase is the most stable at room temperature, and it has demonstrated effectiveness in the photocatalytic degradation of certain harmful pollutants with a discrete band gap of ~2.2–2.8 eV [19].
On the part of synthesis, there are several methods for the synthesis of Bi2O3. Table 1 provides summarized data for the synthesis of Bi2O3, including the precursor, steps of synthesis, and disadvantages of conventional methods. Notable among these conventional methods are solid-state reaction, the hydrothermal method, sol–gel, co-precipitation, and ultrasound-assisted methods. Many of these approaches involve multiple processing steps and longer reaction times. Among the methods mentioned in Table 1, the microwave-assisted method is a simple and effective way of generating nanoparticles, offering several advantages compared to conventional methods. The key advantages of this method include two factors: (i) rapid reaction rates, as microwave irradiation enables the swift and uniform heating of the reaction mixture, leading to accelerated reaction rates, which can significantly reduce the synthesis time compared to traditional methods; and (ii) uniform heating: microwave irradiation ensures uniform heating throughout the reaction volume, promoting homogeneous nucleation and growth of nanoparticles. This can lead to more uniform and reproducible particle sizes [20,21]. To overcome the dependency on specialized microwave equipment, household microwave ovens were selected in this study, with control over wattage and time. The phase structures, morphologies, and optical absorption properties of the synthesized Bi2O3 were examined.
Even though Bi2O3 is a widely used material with applications in various fields, one of its drawbacks is its low surface area, which can limit its effectiveness in certain applications. The surface area of a material is crucial in processes like catalysis, where more surface area provides more active sites for reactions to occur. Lately, there has been a growing interest in utilizing clays as carriers for metal oxide-based photocatalysts. These clays demonstrate the ability to adsorb organic substances both on their external surfaces and within their interlaminar spaces, attributed to their substantial surface area and significant pore volume. In addition, modified clay materials have found application in treating different pollutants. These modifications facilitate changes in the semiconductor structure, promoting enhanced charge-separation mobility and, as a result, increasing the efficiency of photocatalytic oxidation processes [22,23].
Clay minerals, such as kaolinite, commonly known as kaolin, represent a type of clay mineral characterized by the chemical formula Al2Si2O5(OH)4. This mineral exhibits a layered silicate structure, linking a tetrahedral sheet of silica (SiO4) linked to an octahedral sheet of alumina (AlO6) through oxygen atoms. Kaolin holds significance as a crucial raw material in various industries and applications, including the production of high-quality ceramics, porcelain ceramics, paper, paints, and rubber, as well as in applications demanding chemical inertness and adsorption capabilities [24,25]. This material shows great potential for support because of its mechanical–chemical stability, cost-effectiveness, and effective adsorption capacity. These properties reduce the aggregation of metal oxide nanoparticles, resulting in improved photocatalytic performance.
Researchers have been developing mineral clay-modified photocatalysts from various types of mineral clay. For example, Oliveira et al. [26] employed titanium isopropoxide as a precursor to synthesize TiO2 supported on fibrous clay (sepiolite). The immobilization of TiO2 in the clay was achieved through the sol–gel method. The resulting samples exhibited a noteworthy 72% photocatalytic efficiency in discoloring eosin (EA) dye after 150 min under UV light. This high efficiency was attributed to the radicals produced by TiO2 and the increased specific surface area modified by sepiolite. These findings suggest that TiO2/sepiolite shows promise as a candidate for efficiently degrading organic pollutants. In relation to photocatalysis and the use of TiO2, Zhang et al. [27] synthesized a new composite mixed-phase, TiO2/kaolinite composites, and systematically studied the removal of acid red G (ARG) and 4–nitrophenol (4–NP), under UV light. According to the results, the enhanced photocatalytic performance of the TiO2/Kaolin composite, which undergoes drying at 70 °C, can be attributed to various factors. These include the crystal structure and phase composition, effective charge separation, increased surface area, and higher adsorption capacity. In this same sense, Li et al. [28] synthesized TiO2 nanoparticles assembled on kaolinites with varying morphologies, such as fake-like kaolinite (FK) and rod-like kaolinite (RK), using a simple precipitation method. They explored the effects of different operational parameters on the photocatalytic performance. The degradation of the antibiotics (tetracycline hydrochloride) was evaluated under UV light irradiation using TiO2 and TiO2/fake-like kaolinite composites. Overall, composites of TiO2 with fake-like kaolinite exhibited superior stability and enhanced photocatalytic performance compared to alternative materials. This improvement is attributed to the synergistic influence of the two-dimensional morphology and enhanced adsorption capacity.
In this study, combining Bi2O3 with these porous materials can significantly increase the overall surface area of the composite material. This is advantageous in applications where a higher surface area is required for enhanced reactivity or adsorption. Additionally, the porous nature of clay or kaolinite introduces additional pore spaces in the composite material. These pores can act as reservoirs for molecules or facilitate the diffusion of reactants and products, improving the efficiency of certain processes. Moreover, clay minerals are abundant and relatively low-cost materials. Incorporating them into Bi2O3 can make the composite more cost-effective compared to using Bi2O3 alone, especially in large-scale applications. The mixed-phase Bi2O3 supported on kaolinite (Bi2O3/Kaolin) was synthesized by introducing the Bi cations precursor into the kaolinite medium by domestic microwave-assisted methods. The main objectives are to study the impact of kaolin on the structural, morphological, surface, and optical properties of Bi2O3.
While tetracycline, commonly used to treat bacterial infections, can be effective in combating such infections [29,30], its use and release into the environment can lead to harmful effects. Therefore, this study aimed to investigate the photocatalytic degradation of tetracycline under visible light exposure. The photocatalytic properties, as well as the adsorption activity of the Bi2O3/Kaolin composites, were evaluated in comparison to the single-phase Bi2O3.

2. Materials and Methods

The Kaolin powder (Kaolinite, Al2Si2O5(OH)4) found in Kaolin clay, obtained from Lampang, a province in northern Thailand, is an important source of raw material for ceramics. Bismuth(III) nitrate pentahydrate (Bi(NO3)3·5H2O, 98%) was supplied from KemAus™ (Cherrybrook, Australia). Tetracycline hydrochloride (C22H24N2O8·HCl ≥ 95%) powder was obtained from Sigma-Aldrich (St. Louis, MO, USA). Sodium hydroxide (NaOH) Pellets and Nitric acid (HNO3), Grade AR were supplied from the Merck Chemical Company (Rahway, NJ, USA). The materials were used as received without purification.

2.1. Synthesis of Bi2O3 Powders by Microwave-Assisted Method

The solutions, including 0.01 mol Bi(NO3)3·5H2O in 50 mL of 1 mol/L HNO3, were prepared at room temperature and were stirred for 10 min. The obtained solutions were mixed with 50 mL of 1.5 mol/L NaOH (dropwise) and stirred continuously for a period of 60 min until a precipitate was formed. The obtained mixture was introduced into a household microwave reactor and subjected to optimal conditions, with a power setting of 350 W for a duration of 5 min. During this period, we continuously released internal heat every minute and maintained this process for a total of 5 min to prevent the risk of suspension explosion. Finally, the Bi2O3 products were separated from the solvent by centrifugation, washed multiple times with distilled water, and dried in an oven at 100 °C for 120 min to eliminate any residual water content. The chemical reactions of each step and the chemicals used are shown as follows:
2Bi(NO3)3 (aq) + 6NaOH (aq) → Bi2O3 (s) + 6NaOH (aq) + 3H2O (l)

2.2. Synthesis of Bi2O3/Kaolin Composite by Microwave-Assisted Method

The Kaolin powder was ground, dried at 100 °C for 120 min, and then sieved to separate dense particles from the fine ones. Then, Kaolin powder was added in amounts of 20%w/w during the precursor-solution preparation step, and the heat treatment step followed the same procedure as that with Bi2O3.

2.3. Characterization

Elemental analysis was performed using a wavelength dispersive X-ray fluorescence (WDXRF) spectrometer (Rigaku, ZSX Primus, Auburn Hills, MI, USA). The samples were characterized using various analytical techniques. Powder X-ray diffraction (XRD) analysis was conducted with CuKα radiation on a Bruker Model: D2 PHASER instrument (Billerica, MA, USA) to determine their crystalline structure and phase composition. Surface area, pore volume, and pore size were analyzed using N2 adsorption/desorption isotherms based on the Brunauer–Emmett–Teller (BET) theory, employing a Micromeritics Model: TriStar II 3020 instrument (Norcross, GA, USA). The morphology of the specimens was investigated using field-emission transmission electron microscopy (FESEM) with the Thermo Scientific Apreo model. Optical absorption spectra in the solid state were studied using UV–VIS diffuse reflectance spectroscopy (DRS UV–vis) with a Shimadzu UV-3101PC instrument (Kyoto, Japan). Photoluminescence spectra (PL) were recorded at room temperature with a Fluoromax-4 Horiba Jobin Yvon instrument (Kyoto, Japan), exciting at a wavelength of 350 nm. This instrument was also utilized to measure terephthalic acid (TA) formed with hydroxyl radicals, employing an excitation wavelength of 312 nm and a slit width of 5 nm at room temperature. The Nyquist plots were recorded using an Autolab PGSTAT302N (Herisau, Switzerland) at pH 6 with a Na2SO4 electrolyte (0.1 M) within a frequency range of 1–1000 Hz at an amplitude of 0.1.

2.4. Photocatalytic Activity Measurement

The effectiveness of Bi2O3 in comparison to Bi2O3-supported Kaolin for the photocatalytic degradation of TC was assessed in an aqueous environment. To conduct the experiment, the photocatalysis procedure was evaluated under controlled reaction conditions: a photocatalyst dose of 0.05xx g and a TC concentration of 5 ppm (or mg/L) in a 100 mL reaction medium with a pH of 4.0.
Before light activation, dark adsorption experiments on Bi2O3/KO were conducted for 20, 30, 40, and 60 min to ensure adsorption/desorption equilibrium was achieved. Following this, the mixed suspension was kept in the dark for 30 min to maintain the conditions established during the dark adsorption experiments. The suspension was then exposed to visible light for 90 min using a 54 W halogen lamp with an intensity of 3.98 W/m2, positioned approximately 30 cm from the suspension. The temperature of the photoreactor during the reaction was controlled at a constant 35.0 °C (or not exceeding 35.0 °C), using an industrial fan built into the chamber.
Photodegradation experiments were conducted in a batch photoreactor, as shown in Figure 1. It is important to note that each time interval was tested with a separate beaker to control the amount of catalyst and TC solution. If the suspension were to be taken from the same beaker, the ratio of solid catalyst to the concentration of the TC solution would change, and the temperature of the reduced suspension volume might increase during the final stage.
Throughout the interaction period, samples of 3.0 mL each were extracted at specified intervals and subsequently subjected to centrifugation at 5000 rpm for 10 min. The resulting supernatants were then analyzed using a MAPADA UV–6100 double-beam spectrophotometer (Shanghai, China) to measure the absorbance of TC at a wavelength of 350 nm. The changes in TC concentrations over time were determined by converting absorbance intensity using a calibration curve based on the Beer–Lambert law [31]. The percent degradation of the TC was calculated using Equation (1):
D e g r a d a t i o n   % = 100 × C 0 C t C 0
Here, “C0” represents the initial concentration of TC (mg/L), while “Ct” indicates the concentration of TC remaining (mg/L) at a specific time (t).
Additionally, a kinetic study was conducted to compare the reaction rates (k1, min−1) of each catalyst at the same temperature. The equation represented by Equation (2) below, is referred to as the pseudo-first-order model [32].
ln C t C 0 = k 1 t

2.5. Detection of Hydroxyl Radical (•OH)

Hydroxyl radical-detection experiments were conducted using terephthalic acid (TA) as a probe molecule to detect hydroxyl radicals (•OH), as reported in many studies [33,34,35]. A 1000 mL aqueous solution of TA (0.08xx g, 5 × 10⁻⁴ M) was prepared and mixed with 0.05xx g of Bi2O3 photocatalyst. The pH of the solution was adjusted to 8.0 using NaOH solution, by adding 0.24xx g to the 1000 mL solution to achieve a concentration of 6 × 10⁻³ M. The mixture was stirred for 30 min and then irradiated with a visible light lamp. Samples were taken at different time intervals (30, 60, and 90 min), and centrifuged to separate the composite. Finally, the fluorescence of the supernatant was measured by excitation at 312 nm.

3. Results

3.1. Microstructure Analysis

The Kaolin sample collected in this study was analyzed using an XRF instrument, and the results are presented in Table 2. The analysis identified that the Kaolin primarily contains SiO2 and Al2O3, with compositions of approximately 49.6% and 48.8%, respectively, which is consistent with the typical composition of Kaolin (silicate and alumina). However, the sample also contains various impurities, including TiO2, Fe2O3, P2O5, MgO, CaO, and other compounds.
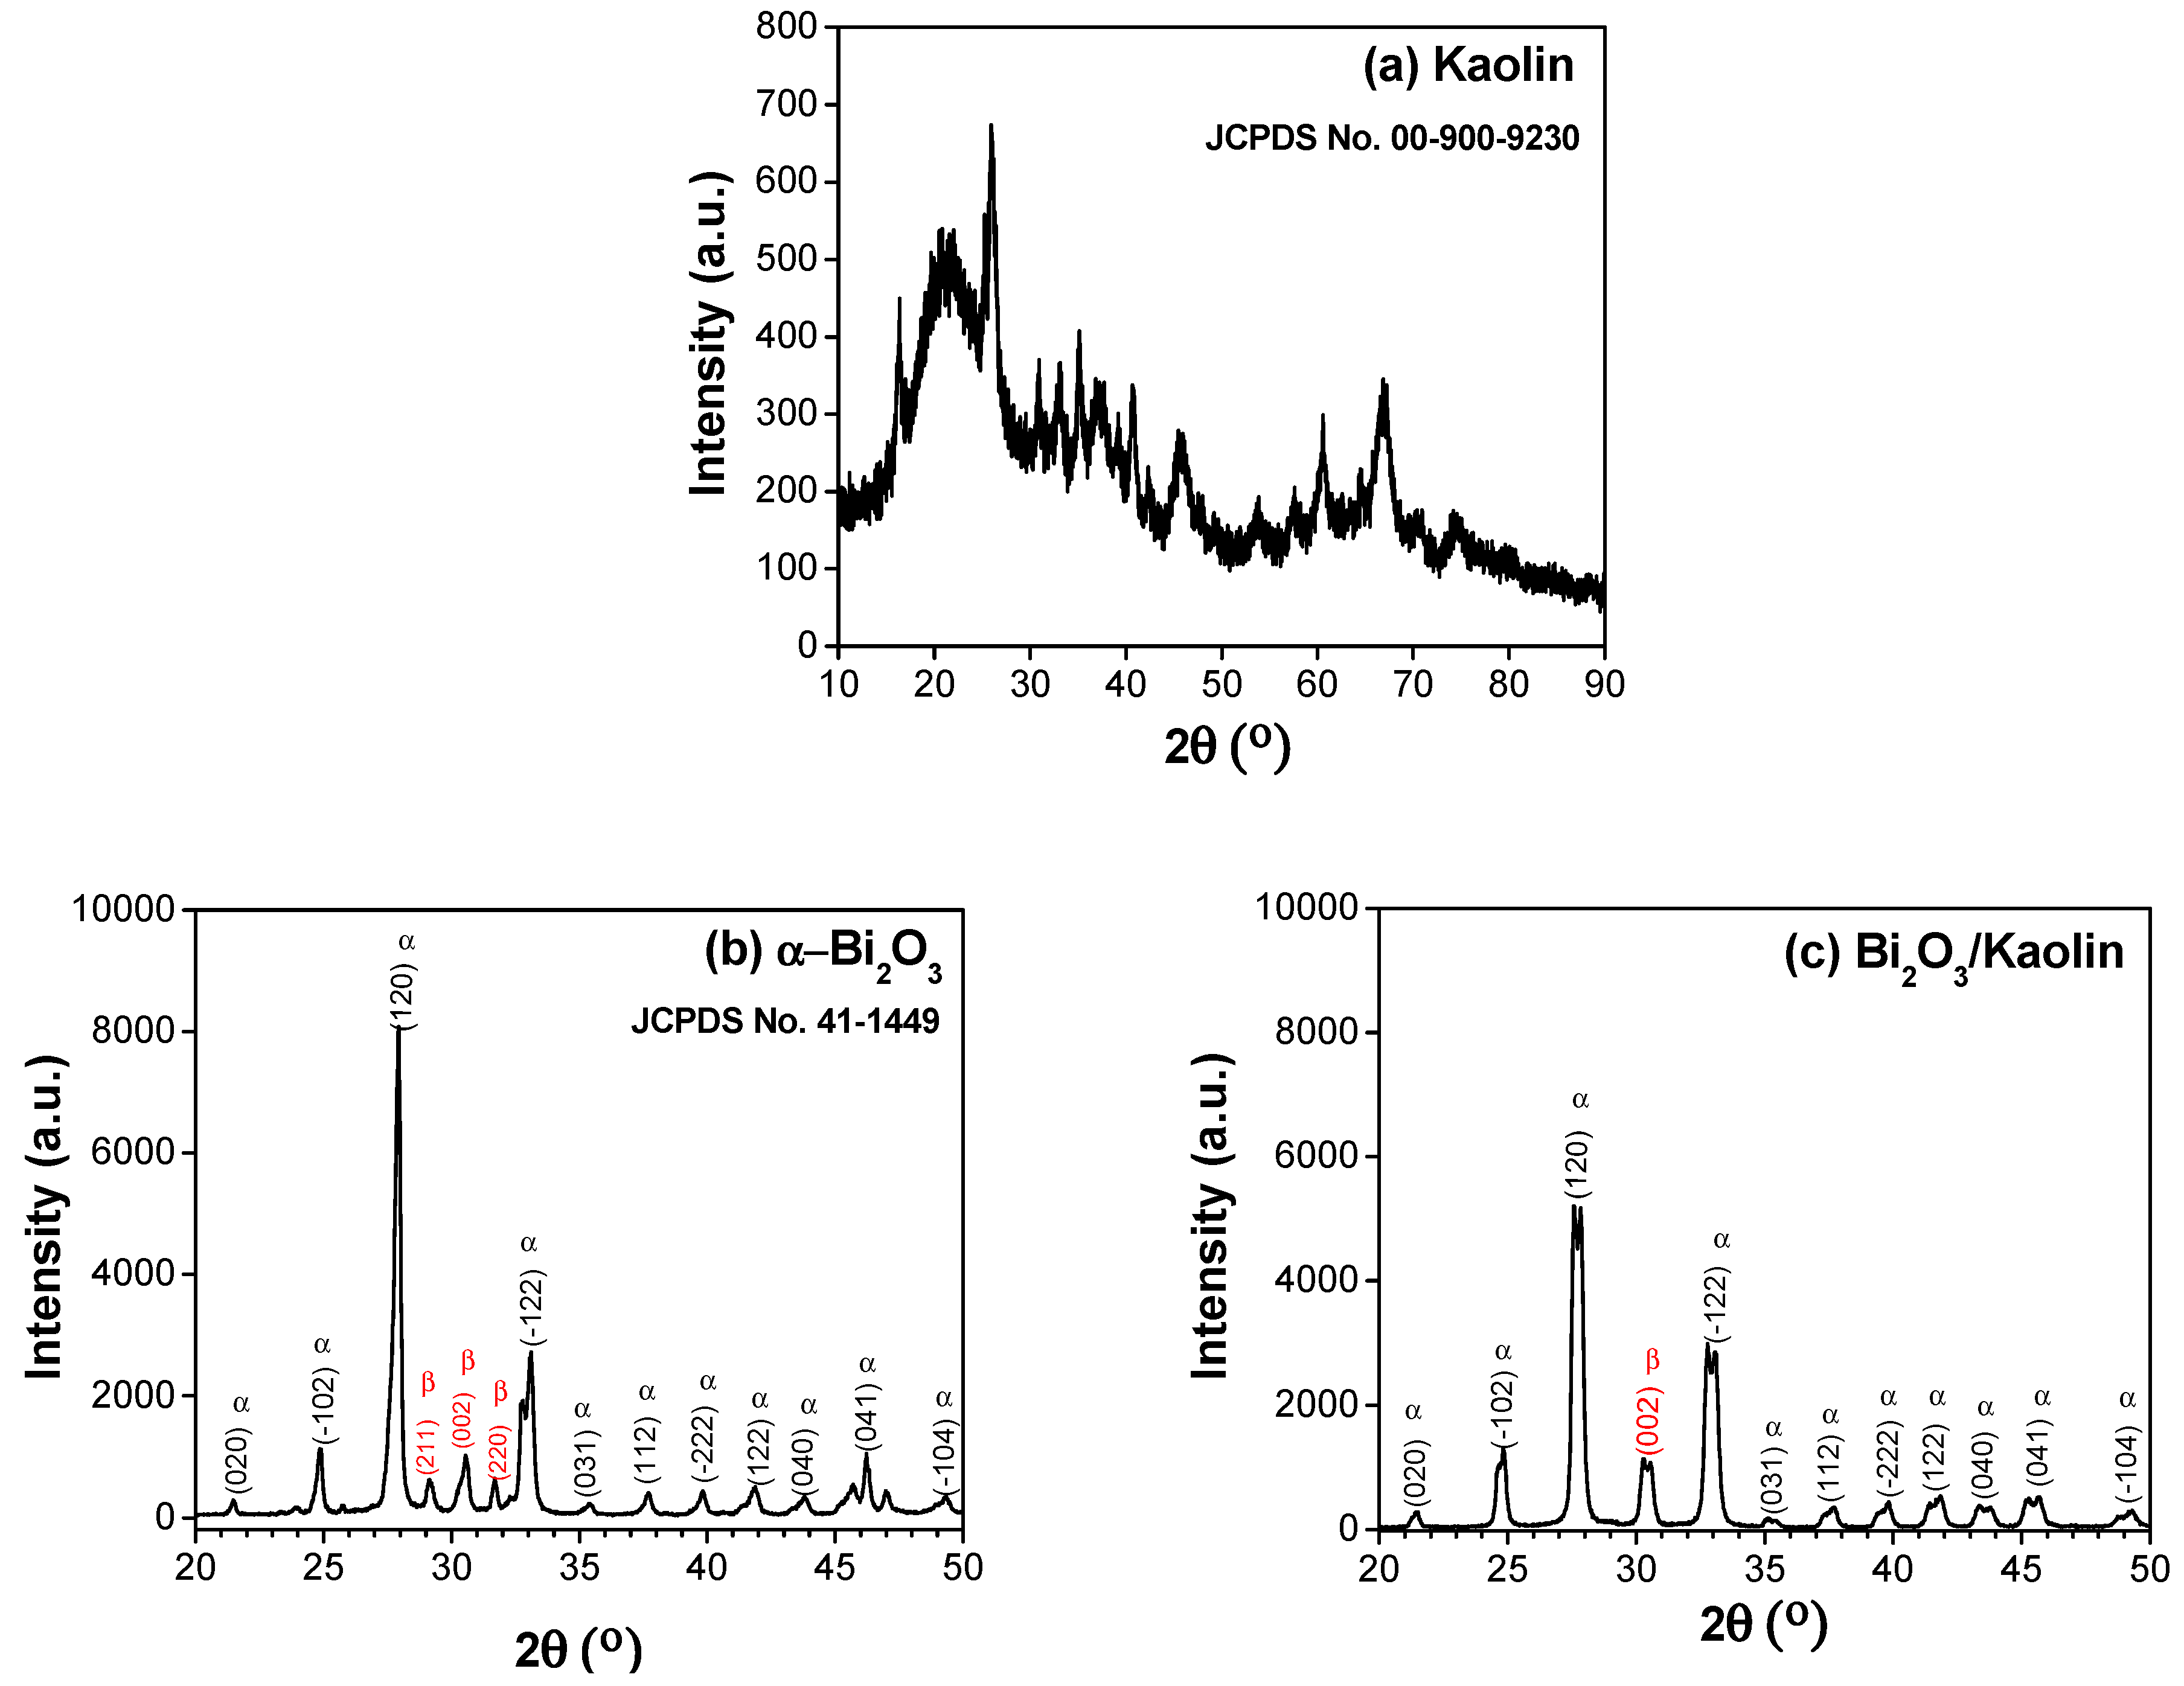
The Kaolin structure was investigated by powder XRD, as shown in Figure 2a. The untreated Kaolin showed a diffraction pattern corresponding to crystalline-layered Kaolinite, consistent with JCPDS standards No. 00−900−9230 [36,37]. In Figure 2b, all diffraction peaks in the XRD pattern of the powder sample strongly correspond to the monoclinic α-Bi2O3 lattice planes. The observed XRD results match well with previously reported literature and JCPDS card no. 41–1449, which is consistent with the reports by H. Cheng et al. [38] and J. Eberl et al. [39].
Additionally, peaks corresponding to secondary crystalline phases of β-Bi2O3 (JCPDS No. 27–0050) were detected at 2θ values of 29.2°, 30.5°, and 31.5°, indicating the presence of a mixed phase. However, the primary phase remains α-Bi2O3. The distinct diffraction peaks of α-Bi2O3 demonstrates its high crystallinity. Conversely, in Figure 2c, β-Bi2O3/Kaolin exhibits broader and weaker diffraction peaks, indicating reduced crystallinity. No apparent peak of Kaolin was observed, which suggests that the Kaolin may be in an amorphous form or have low crystallinity.
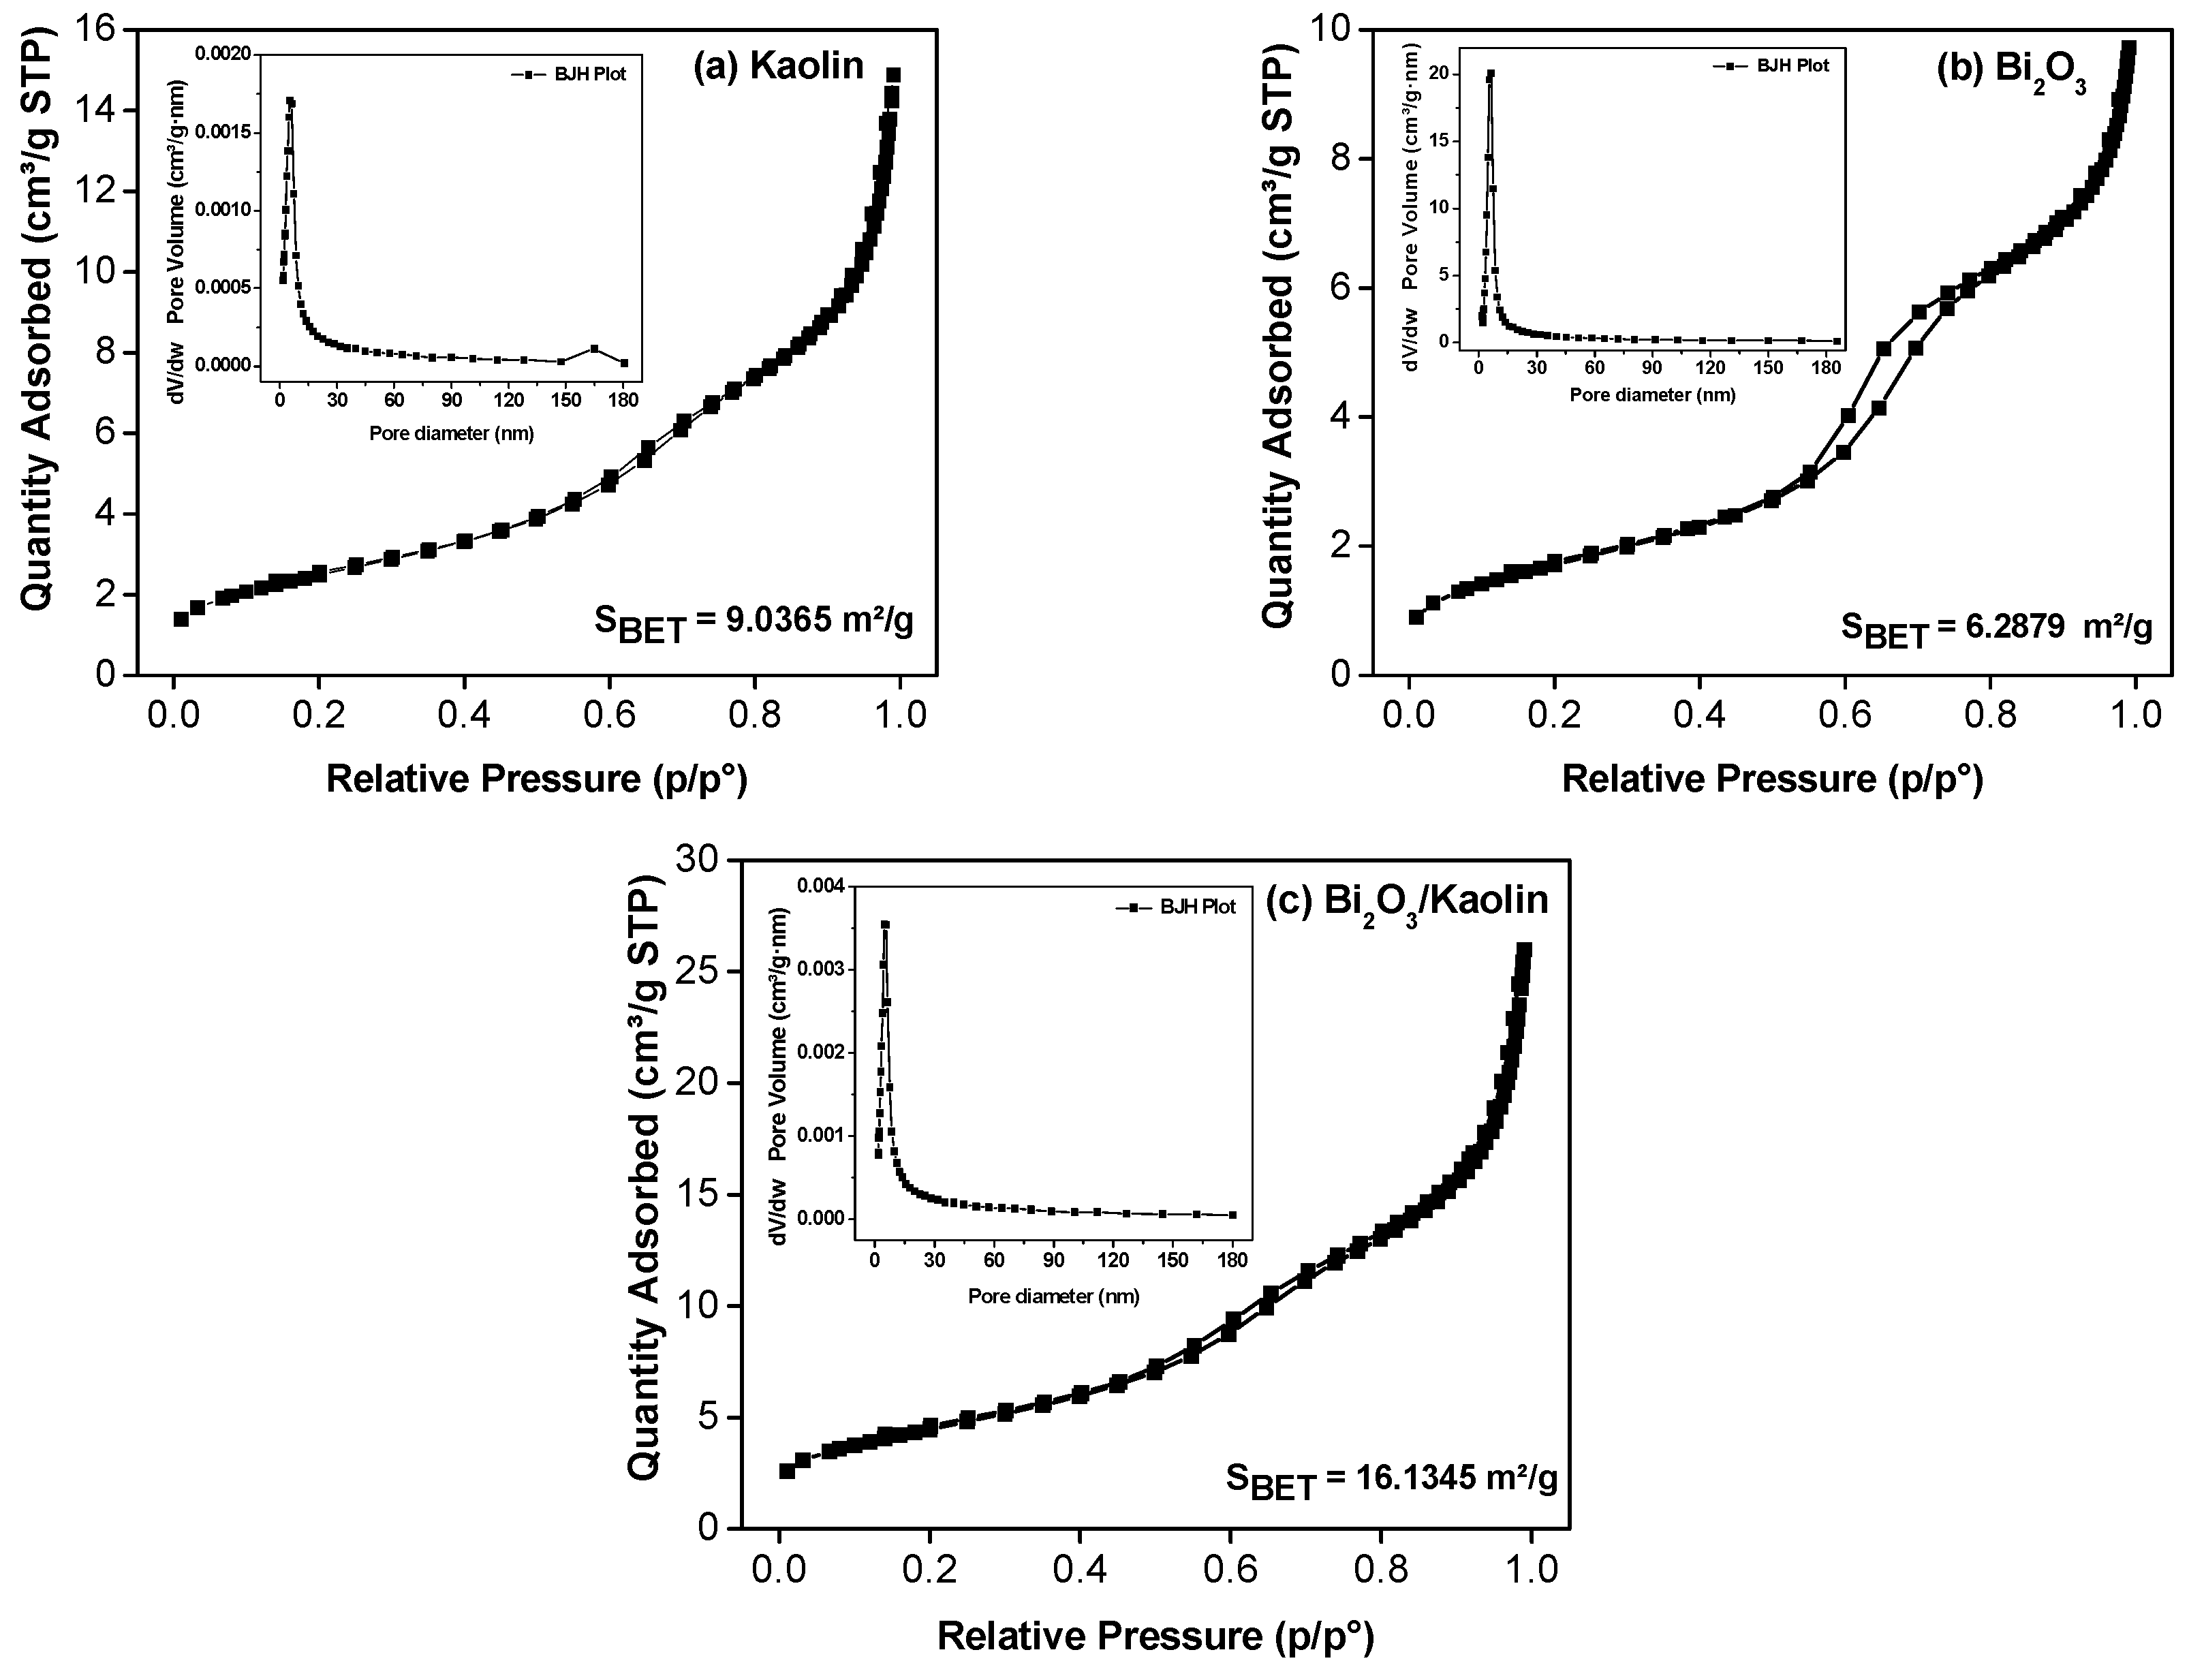
The adsorption capabilities of the samples were studied using N2 adsorption–desorption measurements. N2 adsorption–desorption isotherms for the pure Bi2O3, Kaolin, and Bi2O3-supported Kaolin samples are depicted in Figure 3a–c, with corresponding BET equation results detailed in Table 3. According to the findings, the Bi2O3/Kaolin composite exhibits a larger specific surface area compared to pure Bi2O3. The BET surface area of Bi2O3, Kaolin, and Bi2O3/Kaolin was measured at 6.2879, 9.0365, and 16.1345 m2/g, respectively. This increase may be attributed to the addition of Kaolin to Bi2O3, which results in a rougher surface, as depicted in the FESEM images.
The increase in the specific surface area of the Bi2O3/Kaolin composite enhances the feasibility of enhancing surface-active sites and facilitates charge transport. This structural modification accelerates the degradation of TC molecules during the photocatalytic process, thereby resulting in superior photocatalytic performance of the Bi2O3/Kaolin composite. According to the IUPAC classification, all adsorption–desorption isotherms exhibited type-IV curves accompanied by hysteresis loops, indicating the presence of mesoporous structures ranging in diameter from 2 to 50 nm. Additionally, the inset in Figure 3 illustrates the corresponding pore size distribution plots, measured from the adsorption isotherms of nitrogen isotherms using the Barrett–Joyner–Halenda (BJH) method. The mean pore diameters for Bi2O3, Kaolin, and the Bi2O3/Kaolin composite were 8.2698 nm, 9.6641 nm, and 9.3547 nm, respectively, all within the mesoporous range.
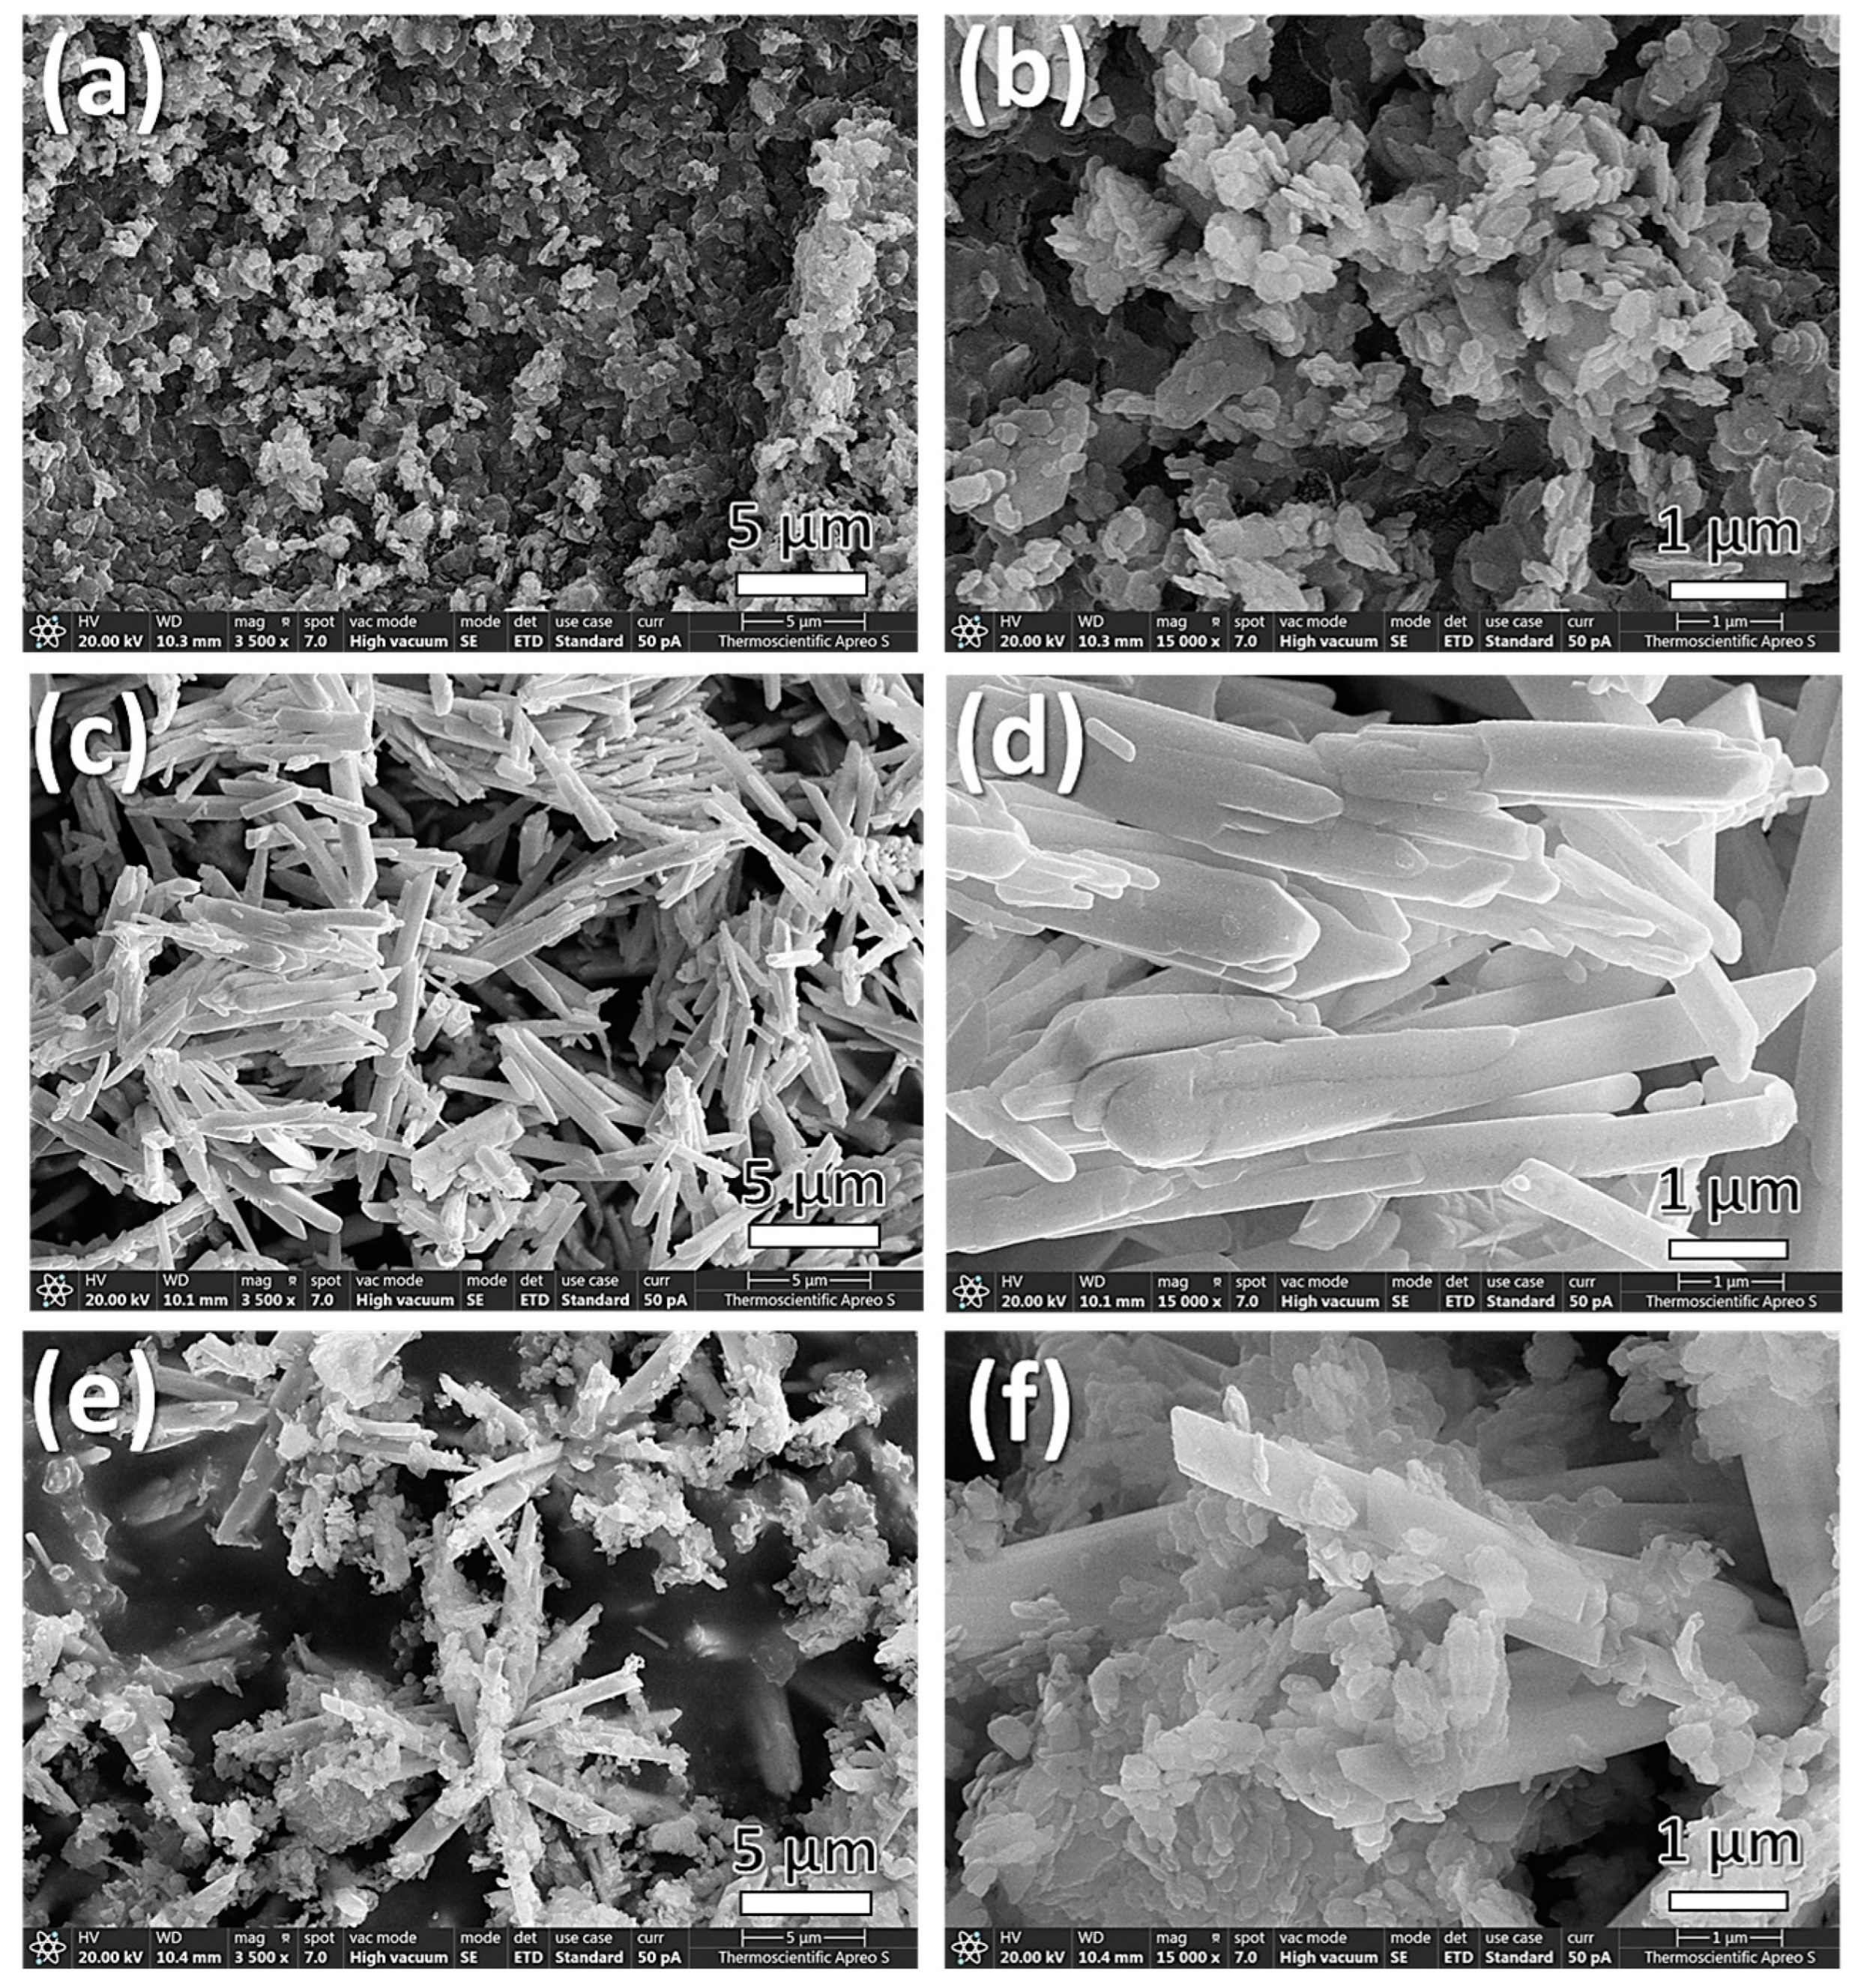
FESEM was employed to analyze the morphologies of the Bi2O3 obtained after the addition of Kaolin. The morphology and surface microstructure of all samples were initially magnified for comparison. The morphology of Kaolin depicted in Figure 4a,b appears predominantly as plates and large aggregations, with an average size of around 1 μm. The FESEM images in Figure 4c,d reveal that Bi2O3 exhibits an almost identical French-fries-like shape. The lengths of the Bi2O3 particles ranged from 1.0 to 5.3 µm, while their widths varied from 0.5 to 1.2 μm. As shown in Figure 4e,f, micromorphology of the Bi2O3/Kaolin composite displays a hierarchical flower structure formed by the assembly of Bi2O3 in a French-fries-like shape. Kaolin is present in the composite structure, with small particles identifiable on the surface of Bi2O3. The rough surface and complex morphology of the composite sample result in a higher surface area, enabling it to adsorb more TC molecules.
The diffuse reflectance spectra of pure and Kaolin-doped Bi2O3 are shown in Figure 5a. The absorption spectra of the powder samples were acquired using the Kubelka–Munk method in DRS mode.
The Kubelka–Munk equation is expressed as F(R) = (1 − R)2/2R, where R represents the reflectance and F(R) denotes the absorbance [40]. The F(R) curves of the samples, or absorbance spectra, are shown in Figure 5b. In pure Bi2;O3 samples, there is an absorption peak at 420 nm, which represents the peak absorption wavelength where electrons are excited from the valence band to the conduction band. Kaolin-doped samples show a shift in the absorption peak to higher wavelengths in the visible region, with one peak occurring at 440 nm and another absorption hump appearing around 580 nm. The two-step change observed in the absorption spectra after doping might be due to the introduction of new energy levels within the band gap and alterations in the electronic structure of the Bi2;O3. The doping with Kaolin could create defect states or impurity levels that facilitate additional electronic transitions, leading to the observed shifts in the absorption peaks. From the absorption spectra analysis of the samples, it is evident that doping Bi2;O3 with Kaolin shifts its absorption edge. Consequently, the effective reduction in the band gap (Eg) of Bi2;O3 can be determined, due to the incorporation of impurity ions from Kaolin. Figure 5c illustrates the comparison between the band gap of pure Bi2;O3 and Kaolin-doped Bi2;O3. For band gap determination, [F(R)hν]n is plotted against hν. Since monoclinic Bi2O3 is an indirect band-gap semiconductor, the value of = ½ (n = 2 for a direct band gap) [41]. The band gap is found by drawing a line on the linear part of the [F(R)hν](1/2)-versus-hν curve and identifying the intercept where [F(R)hν](1/2) equals zero. The energy levels of Kaolin-doped Bi2O3 were found to be 2.1 eV and 2.5 eV, whereas the energy gap of pure Bi2O3 is 2.6 eV. Thus, with a decrease in the band gap, the energy associated with defects also increases.
This provides evidence that the formation of sub-band states between the valence and conduction bands results in the reduction of the band gap, depicted in the energy-level diagram shown in Figure 6a. As shown in the proposed diagram, the valence band (VB) and conduction band (CB) could be determined using the following equations [42]:
E V B = χ E O + 0.5 E g
E C B = E V B E g
where EO is the energy of free electrons in the hydrogen size (4.5 eV), χ is the absolute electronegativity of Bi2O3 (5.986 eV) [43], Eg is the calculated band gap of Bi2O3 (2.6 eV), and EVB and ECB are the valence-band edge and conduction-band edge, respectively.
Combined with the results with equations, the CB and VB values for the pure Bi2O3 are 0.19 eV and 2.79 eV, respectively.
Introducing impurities not only creates additional energy levels within the bandgap of the semiconductor but also acts as traps for electrons, resulting in a reduced recombination process, as shown in Figure 6b. Since photoluminescence (PL) intensity measures electron–hole recombination in semiconductors, higher intensity indicates increased electron recombination and photoluminescence signal release. Kaolin introduces defects or trap states, reducing electron–hole recombination and PL intensity. This suggests improved carrier separation and potentially enhanced charge transport in doped Bi2;O3. This effect is also demonstrated in the research by L.T.S Thao et al. [44], where vetiver grass was added to a TiO2 photocatalyst. The addition of rice straw not only reduced the bandgap energy but also provided impurities that helped trap electrons, leading to improved dye degradation. The Nyquist plot in the high-frequency region corresponds to the charge transfer resistance, while the smaller semicircle implies a reduced charge transfer resistance at the interfaces. Figure 6c shows that the radius of the Bi2O3/Kaolin composite (319.98 Ω) is smaller than that of pristine Bi2O3 (483.82 Ω), indicating that the introduction of Kaolin can reduce the interfacial charge transfer resistance and improve the separation of photo-generated electron–hole pairs, consistent with the results from PL intensity.

3.2. Photocatalytic Performance

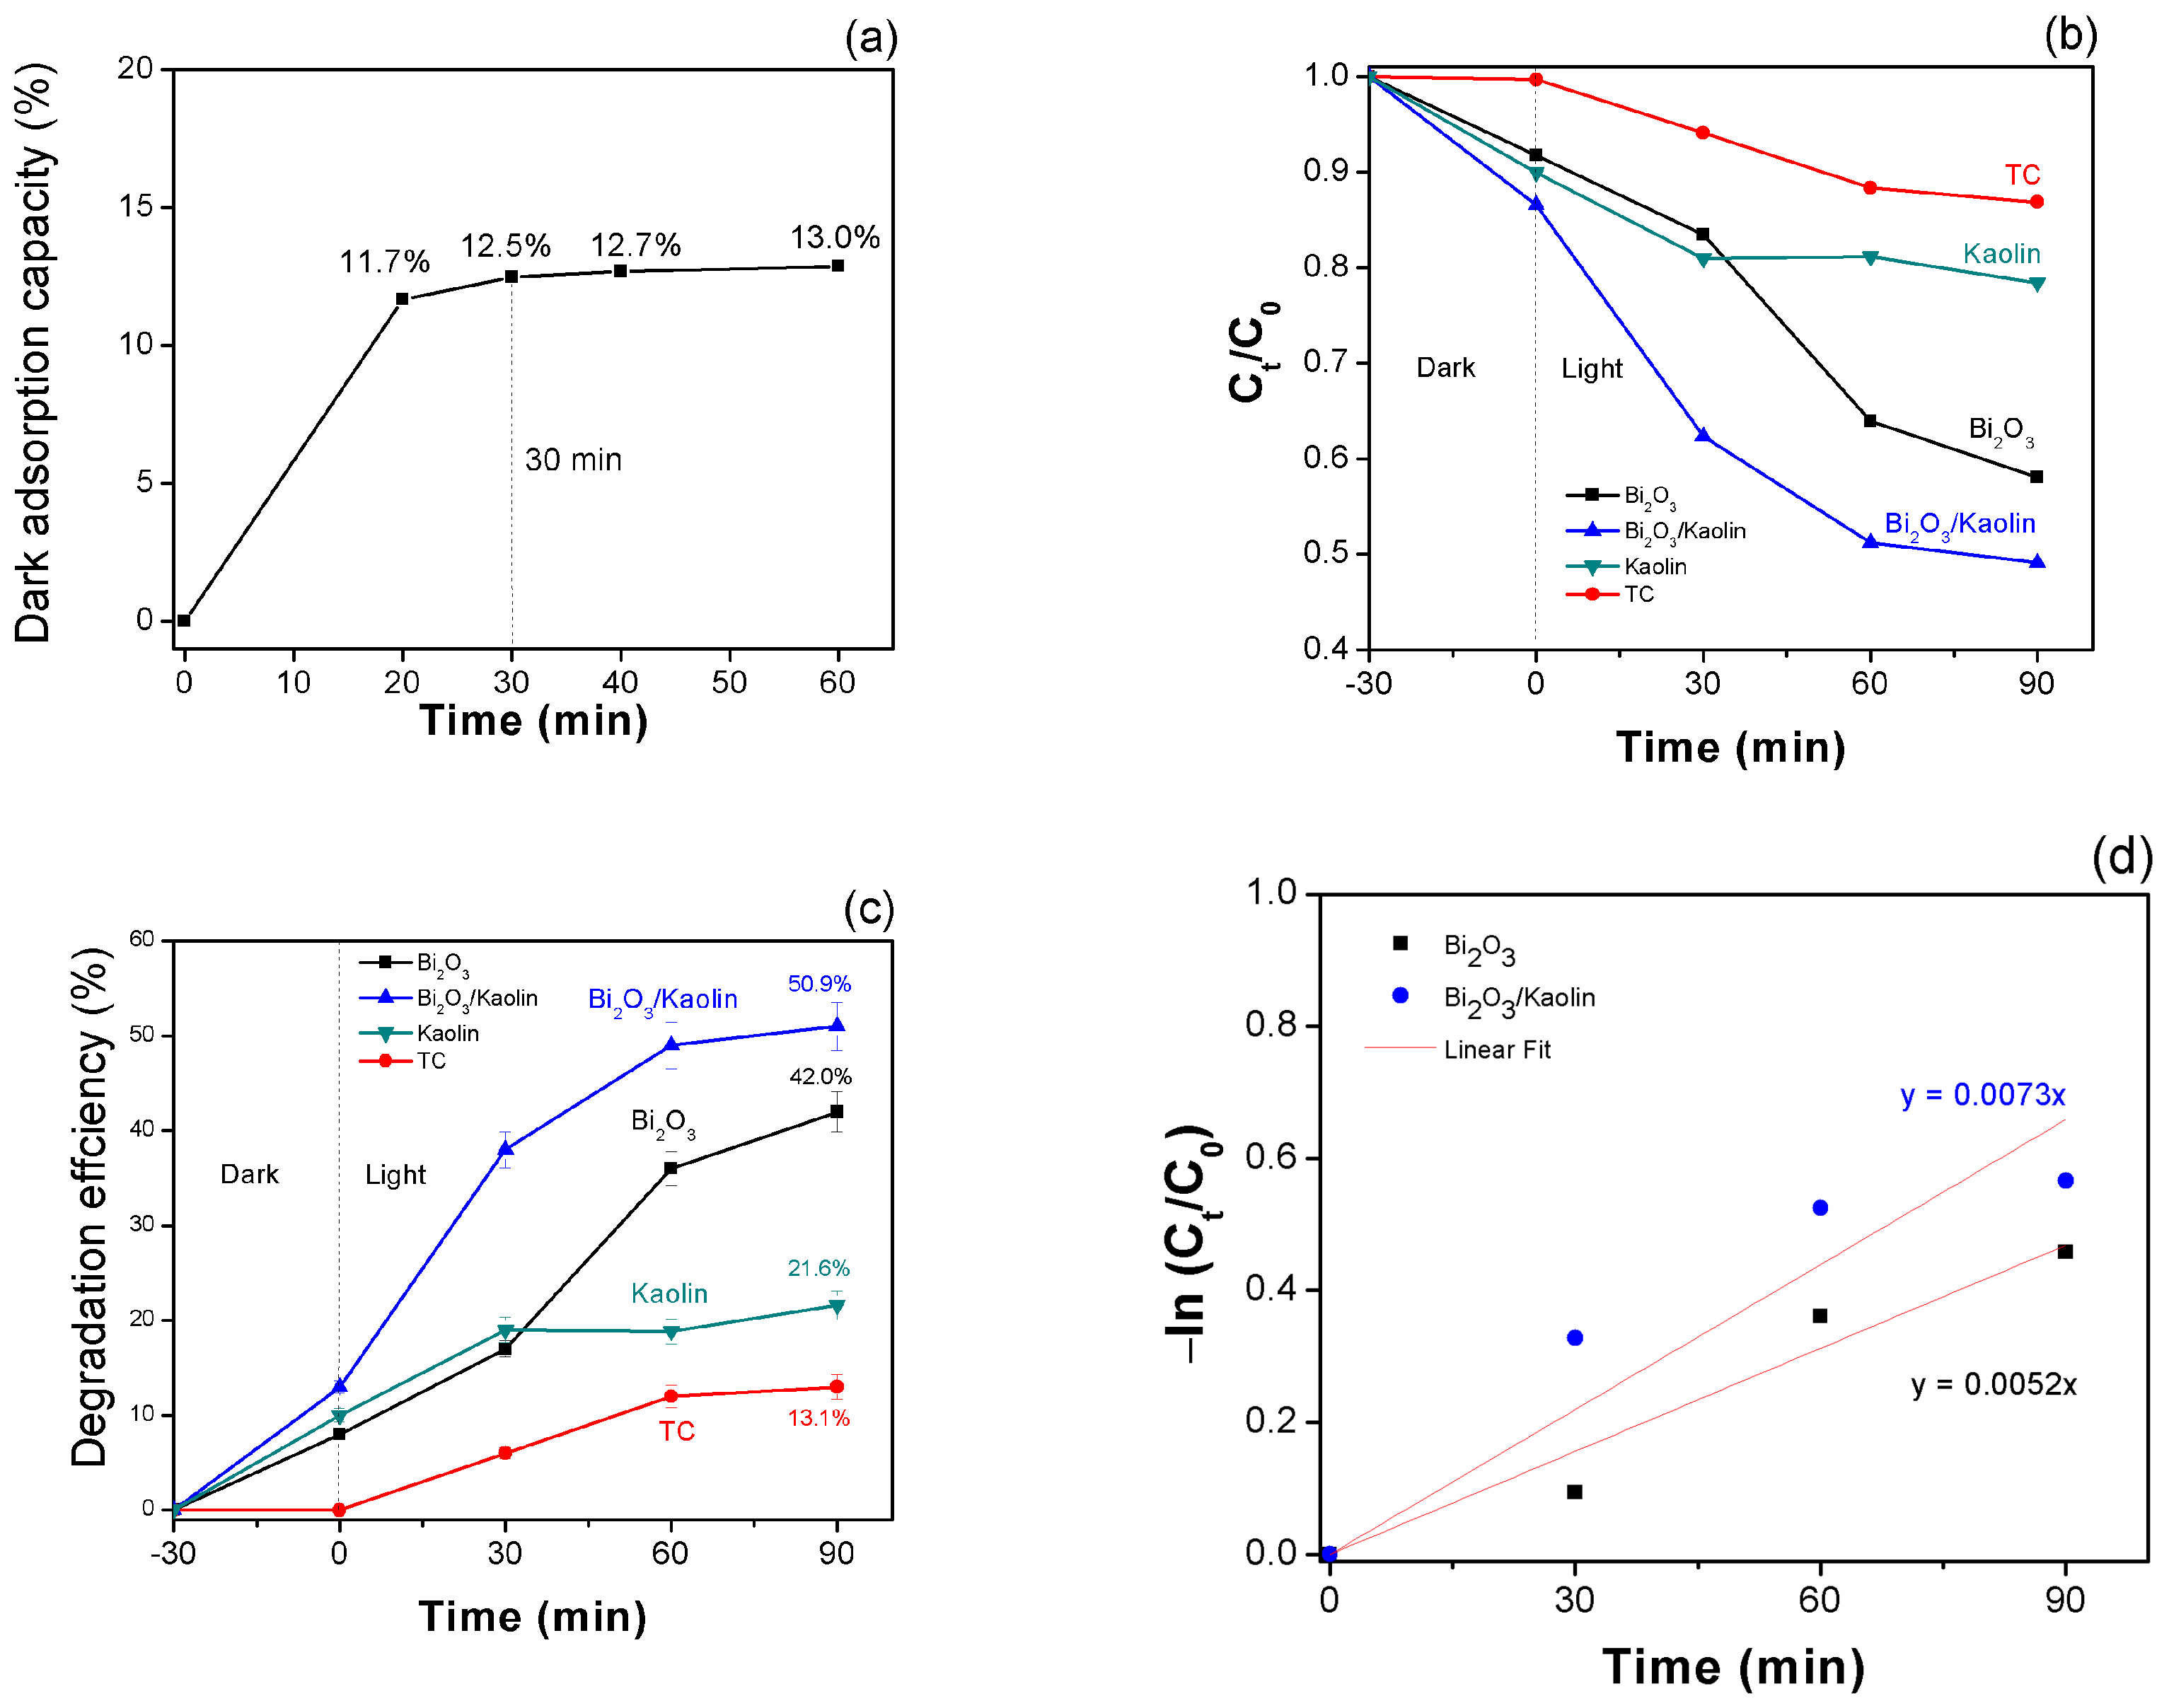
The photocatalytic activity of all prepared photocatalysts was evaluated by testing their degradation of TC under visible light irradiation for 90 min. This procedure was repeated twice, with a standard deviation of 5–7. Before the light was turned on, a suspension of the solid catalyst (0.05 g) in a 5 ppm TC solution was kept in the dark for 60 min to ensure that the observed degradation efficiency after light irradiation was not influenced by adsorption. As illustrated in Figure 7a, equilibrium was achieved at 30 min with an adsorption rate of 13.0% using the Bi2;O3/KO composite. Therefore, a 30 min period was set for dark adsorption for the remaining samples.
As shown in Figure 7b,c, the adsorption in the dark for Kaolin, Bi2O3, and Kaolin–doped Bi2O3 were 10%, 8.3%, and 13.5%, respectively, ensuring that any degradation of TC after exposure to light is solely due to the photocatalytic response. Therefore, a higher BET surface area leads to greater degradation efficiency, as it enhances the adsorption of TC molecules on the catalyst surface, preparing them for the subsequent photocatalytic step.
After an additional 90 min of visible light exposure, the Bi2O3/Kaolin composite demonstrated the highest degradation efficiency at 50.9%, compared to pure Bi2O3, which achieved about 42.0%. Thus, adding Kaolin to Bi2O3 in the composite sample significantly impacts the absorption and degradation of TC. The difference between adsorption in the dark and efficiency under light represents the actual photocatalytic degradation efficiency. It was found that the photoactive efficiency of pure Bi2O3 was 33.7%, while the composite showed a slightly higher efficiency, at 37.4%. For Kaolin, the degradation efficiency remains constant at about 18 to 21.6%, whether in the dark or under light. Regarding the photolysis of TC, self-degradation reaches 13% by the end of the testing process. Figure 7d shows that the Kaolin-doped Bi2O3 catalyst exhibits the highest photocatalytic degradation rate for TC (0.0073 min−1), which is 1.4 times greater than that of pure Bi2O3 (0.0052 min−1).
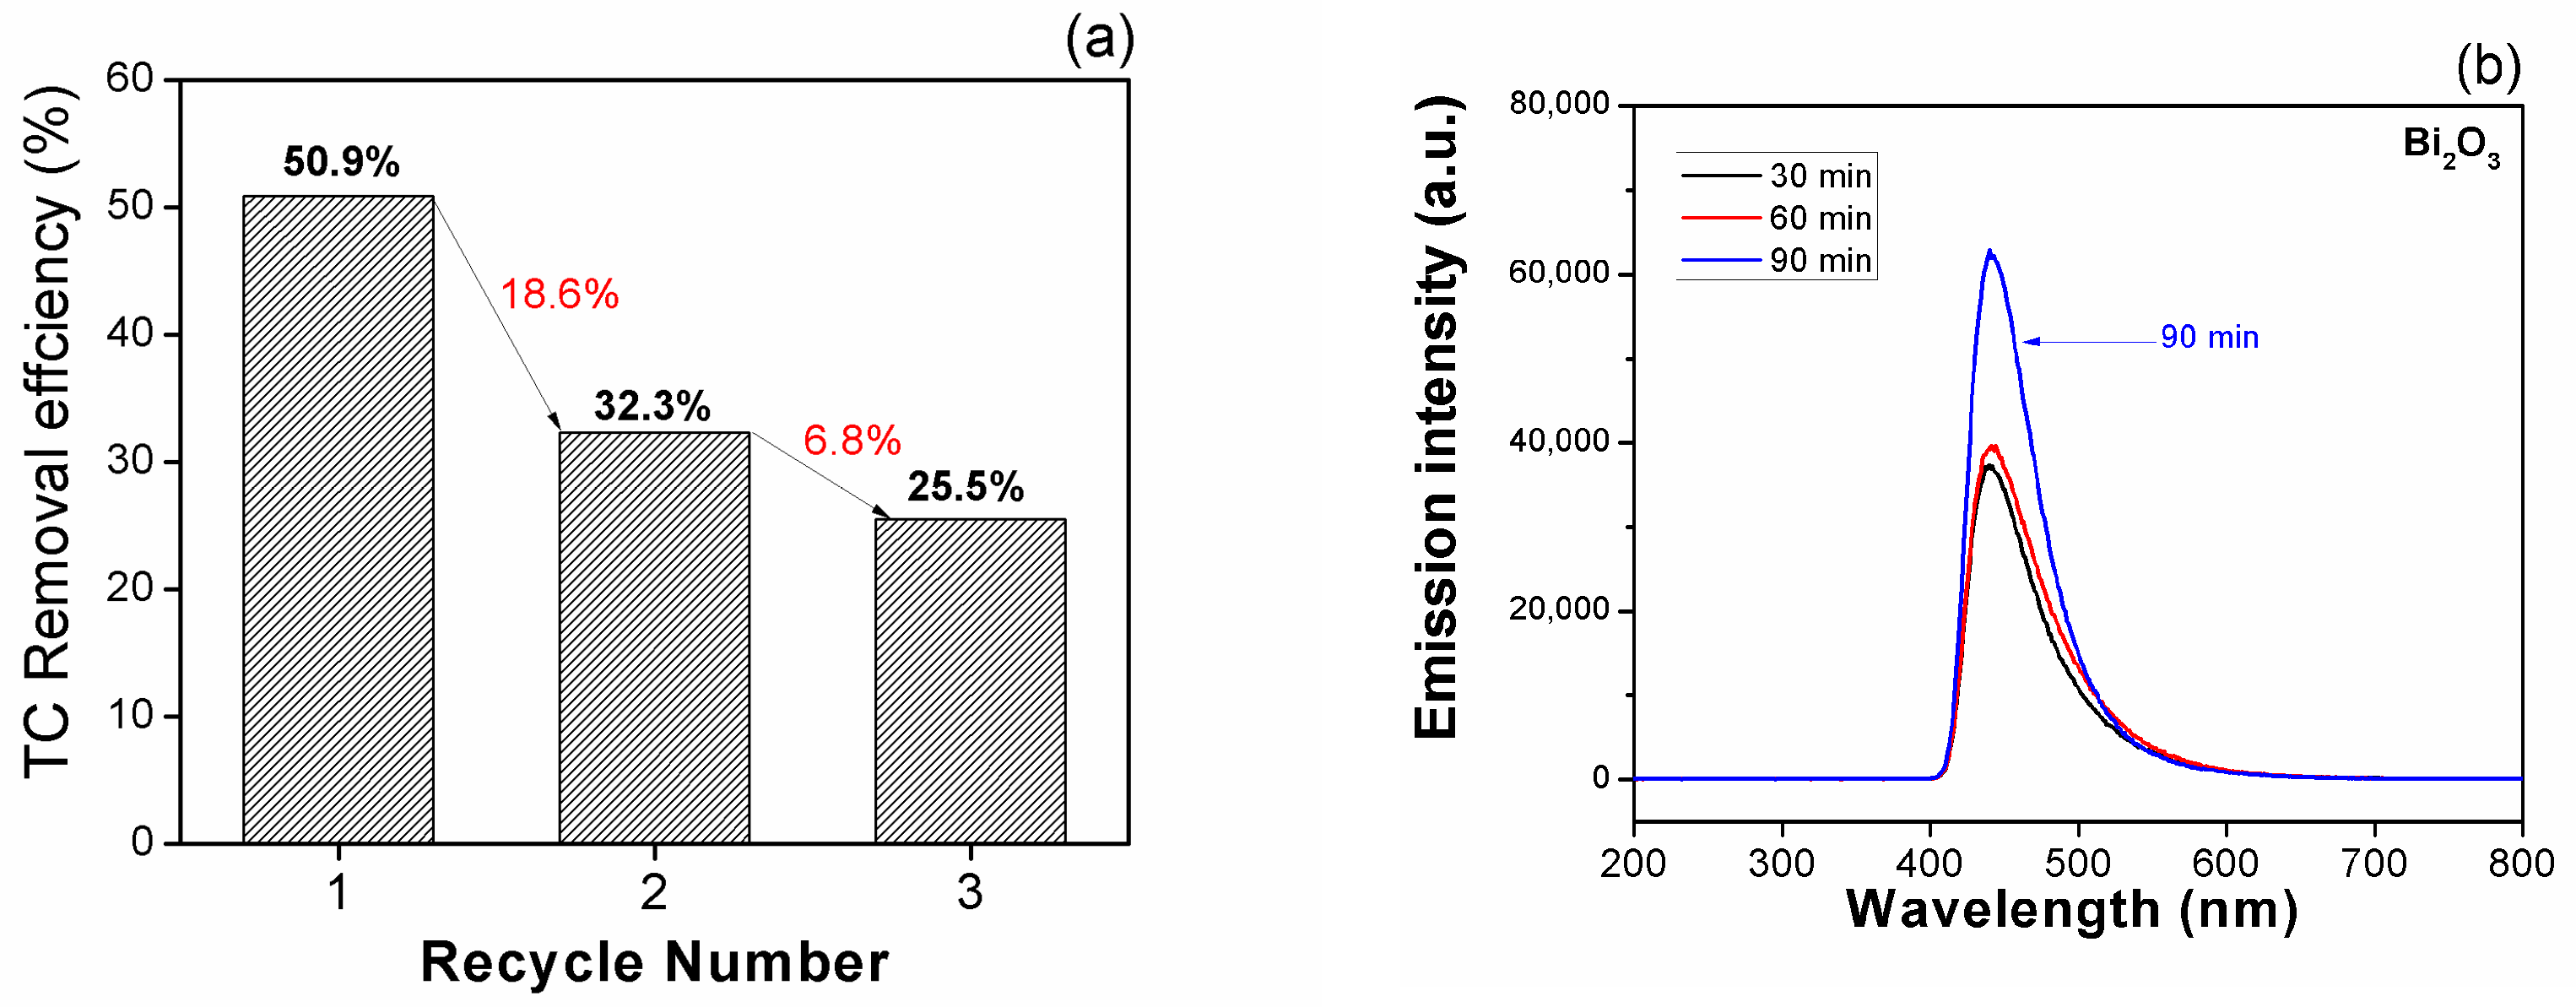
The reusability of the catalyst is a critical factor for industrial applications. Therefore, the recyclable performance of the Bi2O3/KO composites, which exhibited the highest efficiency, was tested under identical conditions. After the first run, centrifugation was employed to separate the solid catalyst from the TC liquid phase. The collected catalyst was then reused in subsequent runs. As illustrated in Figure 8a, the degradation efficiency of TC decreased from 50.9% to 32.3% and further declined to 25.5% after three recycling cycles. Additionally, there is an 18.6% difference between Cycle 1 and Cycle 2, and a 25.4% difference between Cycle 1 and Cycle 3. In many cases, Bi2;O3-based photocatalysts can sustain their efficiency with a reduction of less than 20% over multiple cycles [45,46,47].
Thus, the use of two cycles of reuse in this study is acceptable, while continuing to a third cycle results in reduced efficiency. This may be attributed to changes in the surface morphology of the photocatalyst due to repeated cycles, which can lead to a reduction in surface area or alterations in the distribution of active sites.
The confirmation of hydroxy radical (•OH) formation by the Bi2O3 photocatalyst is represented in Figure 8b. In typical experiments, the intensity of fluorescence is directly related to the concentration of •OH radicals present in the system. The higher the concentration of hydroxyl radicals, the greater the fluorescence intensity observed. This observation indicates the generation of •OH radicals under light irradiation, which is consistent with the results of degradation experiments showing that the degradation effectiveness (%) increases with the increase in •OH formation.
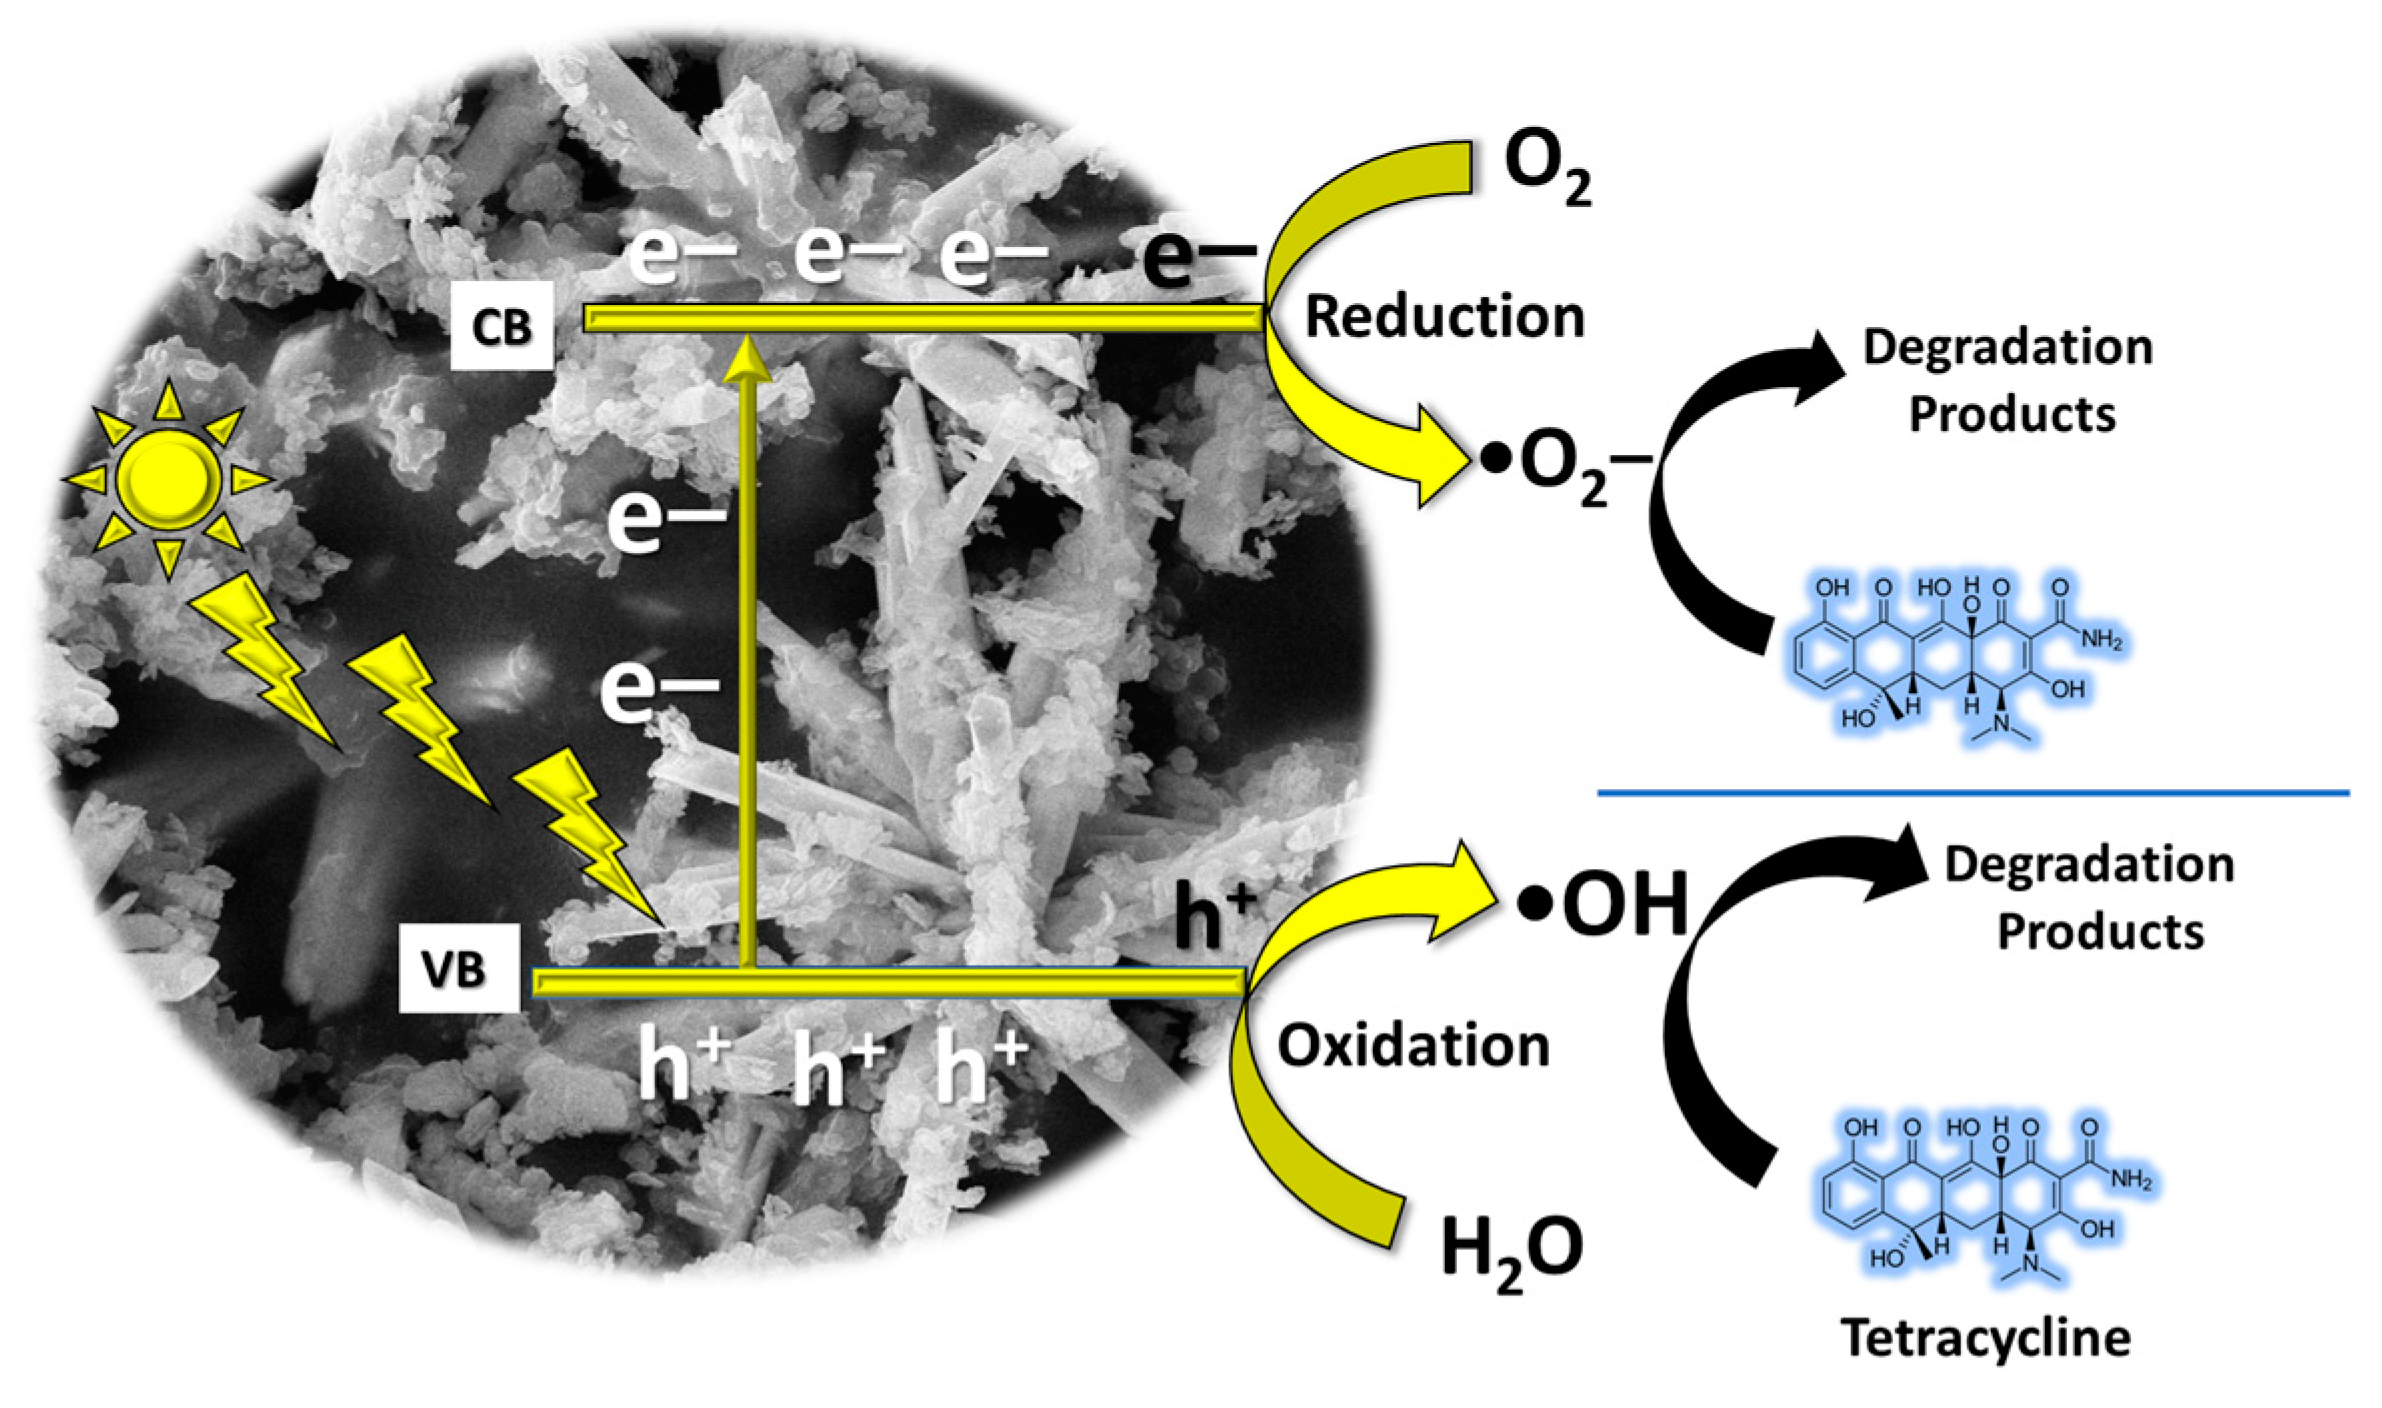
Due to the confirmation of the existence of hydroxyl radicals (•OH), the photocatalytic mechanism, as shown in Figure 9, can be proposed and explained through the following steps.
(i)
Light absorption: the process initiates when the Bi2O3 photocatalyst absorbs photons from incident light.
(ii)
Generation of electron–hole pairs: when exposed to light, electrons within the valence band of the Bi2O3 photocatalyst become energized to the conduction band, creating positively charged holes (known as electron–hole pairs), in the process.
B i 2 O 3 / K a o l i n + h ν e + h +
(iii)
Redox reactions: the electrons in the conduction band and the holes in the valence band are both highly reactive species. They can participate in redox (reduction–oxidation) reactions with other molecules adsorbed onto the surface of the photocatalyst. The electron–hole pairs generated on the surface of the photocatalyst can react with O2 molecules adsorbed from the surrounding environment, producing reactive oxygen species (ROS) such as superoxide radicals (O2) and hydroxyl radicals (•OH).
e + O 2 O 2
2 e + O 2 + 2 H + H 2 O 2
H 2 O 2 + O 2     O H + O H
h + + H 2 O   O H + H +
(iv)
Adsorption of contaminants: organic contaminants, such as the target molecule TC in this study, adsorb onto the surface of the Bi2O3 photocatalyst with the assistance of Kaolin.
(v)
Degradation of contaminants: the generated ROS, particularly hydroxyl radicals, are highly oxidative and can react with the adsorbed organic contaminants, including TC, breaking down their molecular structure into smaller, less harmful molecules such as carbon dioxide, water, and other byproducts.
O H / O 2 + T C   C O 2 + H 2 O    
By following these steps, the combined Bi2O3/Kaolin photocatalyst effectively degrades organic contaminants like TC under irradiation, offering a promising solution for water purification and environmental remediation applications.

4. Conclusions

This study successfully synthesized Bi2;O3 using a household microwave reactor in a rapid, single-step process that took only 5 min at a power of 350 W, and further modified it by incorporating Kaolin as a composite material.
-
The addition of Kaolin to Bi2O3 did not alter its monoclinic crystal structure; however, it significantly reduced the band gap and created sub-band states that acted as non–radiative recombination centers.
-
The addition of kaolin significantly increased the surface area of Bi2O3, enhancing its photocatalytic degradation efficiency, which is the primary focus of this study (from 6.2879 to 16.1345 m2/g).
-
Regarding photocatalytic performance, after an additional 90 min of visible light exposure, the Bi2O3/Kaolin composite exhibited the highest degradation efficiency at 50.9%, compared to pure Bi2O3, which achieved approximately 42.0%. For the recycled Bi2O3/Kaolin composite, the degradation efficiency decreased from 50.9% to 32.3% and further declined to 25.5% after three recycling cycles.
Overall, Bi2O3 remains the primary photoactive phase, while Kaolin serves as a supporting adsorbent, facilitating the adsorption process prior to photocatalysis.

Author Contributions

Conceptualization, D.C.; data curation, P.T., P.P., S.S. and D.C.; funding acquisition, D.C.; methodology, P.T., P.P. and S.S.; formal analysis, P.T., P.P., S.S., P.J. and D.C.; investigation, P.T., P.P., S.S., P.J. and D.C.; resources: P.J. and D.C.; writing—original draft preparation, P.T., P.J. and D.C.; supervision, D.C.; writing—review and editing, P.T. and D.C. All authors have read and agreed to the published version of the manuscript.

Funding

This research was funded by Naresuan University (NU), and the National Science Research and Innovation Fund (NSRF). Grant No. R2567B013. The authors would like to acknowledge the Tuition Fee Grant for graduate students from the Faculty of Science, Naresuan University.

Institutional Review Board Statement

Not applicable.

Informed Consent Statement

Not applicable.

Data Availability Statement

Data are contained within the article.

Acknowledgments

This work was supported by Naresuan University (NU), and National Science, Research and Innovation Fund (NSRF). Grant No. R2567B013. The authors would like to acknowledge the Tuition Fee Grant for graduate students from the Faculty of Science, Naresuan University. The author also acknowledge the assistance with measurement and data analysis of the EIS Nyquist plot provided by the lab of Tawat Suriwong at the School of Renewable Energy and Smart Grid Technology.

Conflicts of Interest

The authors declare no conflicts of interest.

References

  1. Dharma, H.N.C.; Jaafar, J.; Widiastuti, N.; Matsuyama, H.; Rajabsadeh, S.; Othman, M.H.D.; Rahman, M.A.; Jafri, N.N.M.; Suhaimin, N.S.; Nasir, A.M.; et al. A review of titanium dioxide (tio2)–based photocatalyst for oilfield–produced water treatment. Membranes 2022, 12, 345. [Google Scholar] [CrossRef] [PubMed]
  2. Apopei, P.; Catrinescu, C.; Teodosiu, C.; Royer, S. Mixed–phase TiO2 photocatalysts: Crystalline phase isolation and reconstruction, characterization and photocatalytic activity in the oxidation of 4–chlorophenol from aqueous effluents. Appl. Catal. B Environ. 2014, 160–161, 374–382. [Google Scholar] [CrossRef]
  3. Lv, X.; Lam Frank, L.Y.; Hu, X. A Review on bismuth oxyhalide (BiOX, X=Cl, Br, I) based photocatalysts for wastewater remediation. Front. Catal. 2022, 2, 839072. [Google Scholar] [CrossRef]
  4. Chang, A.M.; Chen, Y.H.; Lai, C.C.; Pu, Y.C. Synergistic effects of surface passivation and charge separation to improve photo–electrochemical performance of BiOI nanoflakes by Au nanoparticle decoration. ACS Appl. Mater. Inter. 2021, 13, 5721–5730. [Google Scholar] [CrossRef] [PubMed]
  5. Chang, X.; Huang, J.; Cheng, C.; Sui, Q.; Sha, W.; Ji, G.; Deng, S.; Yu, G. BiOX (X = Cl, Br, I) photocatalysts prepared using NaBiO3 as the Bi Source: Characterization and catalytic performance. Catal. Commun. 2010, 11, 460–464. [Google Scholar] [CrossRef]
  6. Ren, X.; Wu, K.; Qin, Z.; Zhao, X.; Yang, H. The construction of type II heterojunction of Bi2WO6/BiOBr Photocatalyst with Improved Photocatalytic Performance. J. Alloys Compd. 2019, 788, 102–109. [Google Scholar] [CrossRef]
  7. Zhang, L.; Xu, T.; Zhao, X.; Zhu, Y. Controllable synthesis of Bi2MoO6 and effect of morphology and variation in local structure on photocatalytic activities. Appl. Catal. B Environ. 2010, 98, 138–146. [Google Scholar] [CrossRef]
  8. Chen, S.H.; Jiang, Y.S.; Lin, H.Y. Easy Synthesis of BiVO4 for photocatalytic overall water splitting. ACS Omega. 2020, 5, 8927–8933. [Google Scholar] [CrossRef]
  9. Channei, D.; Thammaacheep, P.; Kerdphon, S.; Jannoey, P.; Khanitchaidecha, W.; Nakaruk, A. Domestic microwave–assisted synthesis of Pd doped–BiVO4 photocatalysts. Inorg. Chem. Commun. 2023, 150, 110478. [Google Scholar] [CrossRef]
  10. Qiu, T.; Liu, S.; Cai, H.; Zhou, Y.; Chen, K.; Huang, Y.; Feng, Q. One step solid–state reaction synthesis, characterization, and catalytic performance of n–p SnO2/Bi2O3 composite. J. Mater. Sci. Mater. Electron. 2018, 29, 17463–17472. [Google Scholar] [CrossRef]
  11. Sohail, A.; Shah, M.A.; Majid, K. Ultrathin α–Bi2O3 Nanosheets prepared via hydrothermal method for electrochemical supercapacitor applications. ECS J. Solid. State Sci. Technol. 2023, 12, 011001. [Google Scholar] [CrossRef]
  12. Mallahi, M.; Shokuhfar, A.; Vaezi, M.R.; Esmaeilirad, A.; Mazinani, V. Synthesis and characterization of bismuth oxide nanoparticles via sol–gel method. Am. J. Eng. Res. 2014, 3, 162–165. [Google Scholar]
  13. Senthamilselvi, R.; Velavan, R. Microstructure and photocatalytic properties of bismuth oxide (Bi2O3) nanocrystallites. Malaya J. Math. 2020, 2, 4870–4874. [Google Scholar]
  14. Azizian–Kalandaragh, Y.; Sedaghatdoust–Bodagh, F.; Habibi–Yangjeh, A. Ultrasound–assisted preparation and characterization of β–Bi2O3 nanostructures: Exploring the photocatalytic activity against rhodamine B. Superlattices Microstruct. 2015, 81, 151–160. [Google Scholar] [CrossRef]
  15. Yahyazadehfar, M.; Sheikhhosseini, E.; Ahmadi, S.A.; Ghazanfari, D. Microwave–assisted synthetic method of novel Bi2O3 nanostructure and its application as a high–performance nano–catalyst in preparing benzylidene barbituric acid derivatives. Front. Chem. 2022, 10, 951229. [Google Scholar] [CrossRef]
  16. Lu, H.; Hao, Q.; Chen, T.; Zhang, L.; Chen, D.; Ma, C.; Yao, W.; Zhu, Y. A high–performance Bi2O3/Bi2SiO5 p–n heterojunction photocatalyst induced by phase transition of Bi2O3. Appl. Catal. B Environ. 2018, 273, 59–97. [Google Scholar] [CrossRef]
  17. Hou, J.; Yang, C.; Wang, Z.; Zhou, W.; Jiao, S.; Zhu, H. In situ synthesis of α–β phase heterojunction on Bi2O3 nanowires with exceptional visible– light photocatalytic performance. Appl. Catal. B Environ. 2013, 142–143, 504–511. [Google Scholar] [CrossRef]
  18. Elizarraras–Peñaloza, A.; Estrada–Flores, M.; Reza–San Germán, C.M.; Manríquez Ramírez, M.E.; Díaz Barriga-Arceo, L.G.; Santiago-Jacinto, P. Change of phase from α–Bi2O3 to β–Bi2O3 using the ceramic microwave–assisted approach and its increase of capacitance. Superficies y Vacío. 2019, 32, 14–21. [Google Scholar] [CrossRef]
  19. Guo, X.; Liang, T.T.; Rager, M.; Cui, X. Low–temperature controlled synthesis of novel bismuth oxide (Bi2O3) with microrods and microflowers with great photocatalytic activities. Mater. Lett. 2018, 228, 427–430. [Google Scholar] [CrossRef]
  20. Rao, S.S.; Saptami, K.; Venkatesan, J.; Rekha, P.D. Microwave–assisted rapid synthesis of silver nanoparticles using fucoidan: Characterization with assessment of biocompatibility and antimicrobial activity. Int. J. Biol. Macromol. 2020, 163, 745–755. [Google Scholar] [CrossRef]
  21. Sreeju, N.; Rufus, A.; Philip, D. Microwave–assisted rapid synthesis of copper nanoparticles with exceptional stability and their multifaceted applications. J. Mol. Liq. 2016, 221, 1008–1021. [Google Scholar] [CrossRef]
  22. Papoulis, D.; Panagiotaras, D.; Tsigrou, P.; Christoforidis, K.C.; Petit, C.; Apostolopoulou, A. Halloysite and sepiolite –TiO2 nanocomposites: Synthesis characterization and photocatalytic activity in three aquatic wastes. Mater. Sci. Semicond. Process. 2018, 85, 1–8. [Google Scholar] [CrossRef]
  23. Szczepanik, B. Photocatalytic degradation of organic contaminants over clay–TiO2 nanocomposites: A review. Appl. Clay Sci. 2017, 141, 227–239. [Google Scholar] [CrossRef]
  24. Kasumba, A.; Buyondo, H.K.; Kirabira, J.B. A comprehensive review on kaolin as pigment for paint and coating: Recent trends of chemical–based paints, their environmental impacts and regulation. Case Stud. Chem. Environ. Eng. 2022, 6, 100244. [Google Scholar]
  25. Ekosse, G.I.E. Kaolin deposits and occurrences in Africa: Geology, mineralogy and utilization. Appl. Clay Sci. 2010, 50, 212–236. [Google Scholar] [CrossRef]
  26. Oliveira, W.V.; Morais, A.S.; Honorio, L.M.C.; Trigueiro, P.A.; Almeida, L.C.; Garcia, R.R.P.; Viana, B.C.; Furtini, M.B.; Silva–Filho, E.C.; Osajima, J.A. TiO2 Immobilized on Fibrous Clay as Strategies to Photocatalytic Activity. Mater. Res. 2020, 23, 20190463. [Google Scholar] [CrossRef]
  27. Zhang, Y.; Gan, H.; Zhang, G. A novel mixed–phase TiO2/kaolinite composites and their photocatalytic activity for degradation of organic contaminants. Chem. Eng. J. 2011, 172, 936–943. [Google Scholar] [CrossRef]
  28. Li, X.; Peng, K.; Chen, H. TiO2 nanoparticles assembled on kaolinites with different morphologies for efficient photocatalytic performance. Sci. Rep. 2018, 8, 11663. [Google Scholar] [CrossRef]
  29. Oluwole, A.O.; Olatunji, O.S. Photocatalytic degradation of tetracycline in aqueous systems under visible light irridiation using needle–like SnO2 nanoparticles anchored on exfoliated g–C3N4. Environ. Sci. Eur. 2022, 34, 5. [Google Scholar] [CrossRef]
  30. Bui, T.S.; Bansal, P.; Lee, B.K.; Mahvelati–Shamsabadi, T.; Soltani, T. Facile fabrication of novel Ba–doped g–C3N4 photocatalyst with remarkably enhanced photocatalytic activity towards tetracycline elimination under visible–light irradiation. Appl. Surf. Sci. 2020, 506, 144184. [Google Scholar] [CrossRef]
  31. Rosario, D. Misuse of Beer–Lambert Law and other calibration curves. R. Soc. Open Sci. 2022, 9, 211103. [Google Scholar]
  32. Balakrishnan, A.; Gopalram, K.; Appunni, S. Photocatalytic degradation of 2,4–dichlorophenoxyacetic acid by TiO2 modified catalyst: Kinetics and operating cost analysis. Environ. Sci. Pollut. Res. 2021, 28, 33331–33343. [Google Scholar] [CrossRef] [PubMed]
  33. Ali, H.; Jana, N.R. Plasmonic photocatalysis: Complete degradation of bisphenol A by a gold nanoparticle–reduced graphene oxide composite under visible light. Photochem. Photobiol. Sci. 2018, 17, 17628–17637. [Google Scholar] [CrossRef]
  34. Essawy, A.A.; El-Massry, K.F.; Alsohaimi, I.H.; El-Ghorab, A. Managing Encapsulated Oil Extract of Date Seed Waste for High Hydroxyl Radical Scavenging Assayed via Hybrid Photo-Mediated/Spectrofluorimetric Probing. Molecules 2023, 28, 5160. [Google Scholar] [CrossRef]
  35. Abdullah, A.M.; Garcia-Pinilla, M.Á.; Pillai, S.C.; O'Shea, K. UV and Visible Light-Driven Production of Hydroxyl Radicals by Reduced Forms of N, F, and P Codoped Titanium Dioxide. Molecules 2019, 24, 2147. [Google Scholar] [CrossRef] [PubMed]
  36. Belachew, N.; Hinsene, H. Preparation of cationic surfactant−modified kaolin for enhanced adsorption of hexavalent chromium from aqueous solution. Appl. Water. Sci. 2020, 10, 38. [Google Scholar] [CrossRef]
  37. Bish, D.L.; Von Dreele, R.B. Rietveld Refinement of Non−Hydrogen Atomic Positions in Kaolinite. Clays Miner. 1989, 37, 289–296. [Google Scholar] [CrossRef]
  38. Cheng, H.; Baibiao, H.; Jibao, L.; Zeyan, W.; Bing, X.; Xiaoyan, Q.; Xiaoyang, Z.; Ying, D. Synergistic effect of crystal and electronic structures on the visible–light–driven photocatalytic performances of Bi2O3 polymorphs. Phys. Chem. Chem. Phys. 2010, 12, 15468. [Google Scholar] [CrossRef]
  39. Eberl, J.; Kisch, H. Mineralization of Phenol and 4–Chlorophenol Induced by Visible Light and Assisted by Semiconducting β–Bi2O3. Z. Naturforsch B. 2010, 65, 399–404. [Google Scholar] [CrossRef]
  40. Choudhury, B.; Borah, B.; Choudhury, A. Ce–Nd codoping effect on the structural and optical properties of TiO2 nanoparticles. Mater. Sci. Eng. B. 2013, 178, 239–247. [Google Scholar] [CrossRef]
  41. Choudhury, B.; Dey, M.; Choudhury, A. Defect generation, d–d transition, and band gap reduction in Cu–doped TiO2 nanoparticles. Int. Nano Lett. 2013, 3, 25. [Google Scholar] [CrossRef]
  42. Buckeridge, J.; Butler, K.T.; Catlow, C.R.A.; Logsdail, A.J.; Scanlon, D.O.; Shevlin, S.A.; Woodley, S.M.; Sokol, A.A.; Walsh, A. Polymorph engineering of TiO2: Demonstrating how absolute reference potentials are determined by local coordination. Chem. Mat. 2015, 27, 3844–3851. [Google Scholar] [CrossRef]
  43. Peng, H.; Guo, R.T.; Lin, H.; Liu, X.Y. Synthesis of Bi2O3/g–C3N4 for enhanced photocatalytic CO2 reduction with a Z–scheme mechanism. RSC Adv. 2019, 9, 37162–37170. [Google Scholar] [CrossRef]
  44. Thao, L.T.S.; Dang, T.T.T.; Khanitchaidecha, W.; Channei, D.; Nakaruk, A. Photocatalytic Degradation of Organic Dye under UV–A Irradiation Using TiO2–Vetiver Multifunctional Nano Particles. Materials 2017, 10, 122. [Google Scholar] [CrossRef]
  45. Poorsajadi, F.; Sayadi, M.H.; Hajiani, M.; Rezaei, M.R. Synthesis of CuO/Bi2O3 nanocomposite for efficient and recycling photodegradation of methylene blue dye. J. Environ. Anal. Chem. 2020, 102, 7165–7178. [Google Scholar] [CrossRef]
  46. Bouziani, A.; Yahya, M.; Bianchi, C.L.; Falletta, E.; Celik, G. Ternary Polyaniline@Bi2O3-BiOCl Nanocomposites as Innovative Highly Active Photocatalysts for the Removal of the Dye under Solar Light Irradiation. Nanomaterials 2023, 13, 713. [Google Scholar] [CrossRef] [PubMed]
  47. Wang, M.; Li, C.; Liu, B.; Qin, W.; Xie, Y. Facile Synthesis of Nano-Flower β-Bi2O3/TiO2 Heterojunction as Photocatalyst for Degradation RhB. Molecules 2023, 28, 882. [Google Scholar] [CrossRef] [PubMed]
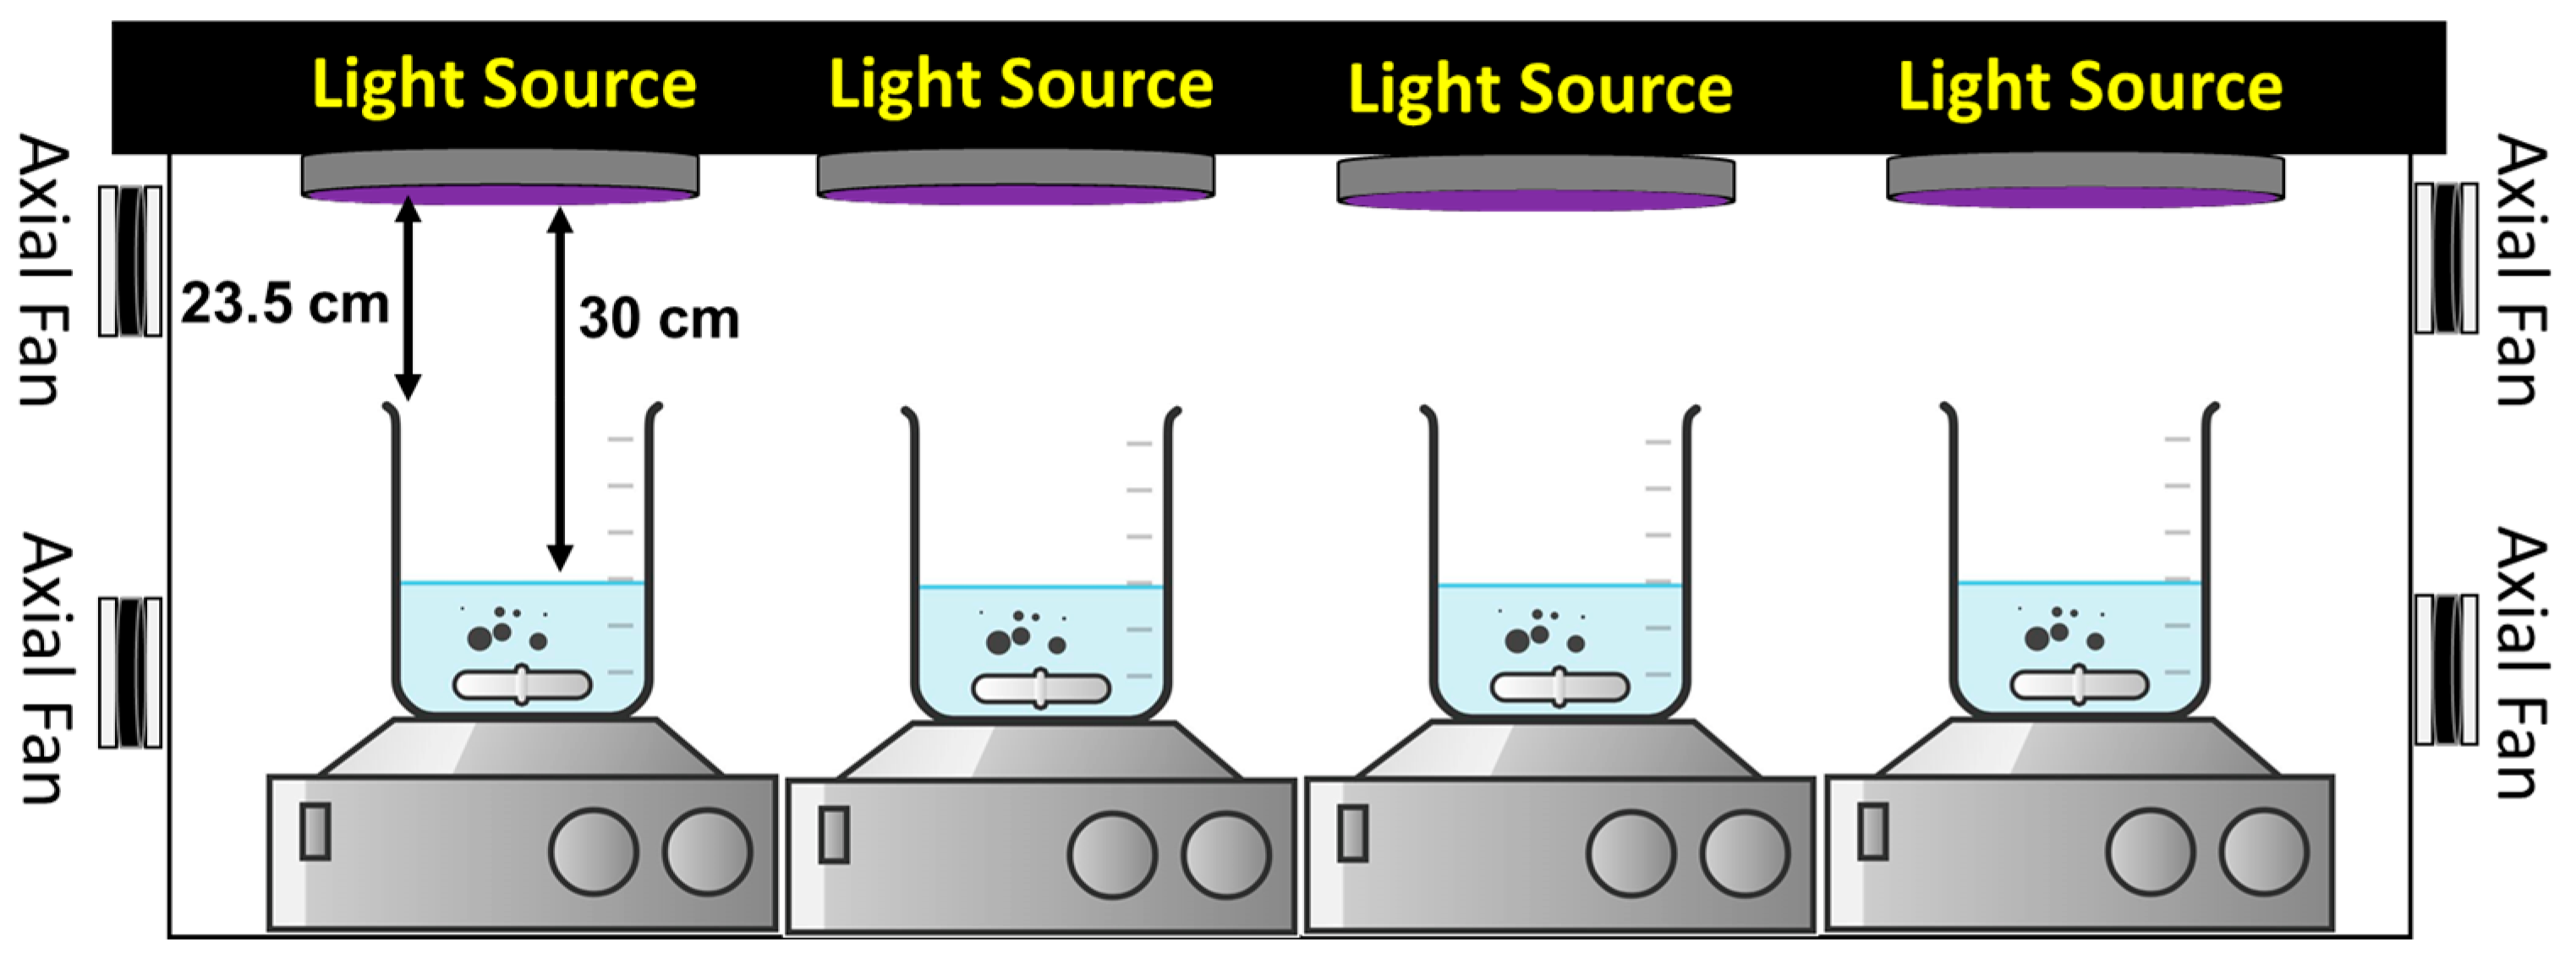
Figure 1. Schematic diagram of the photoreactor: 0.05 g photocatalyst mixed with 100 mL of 5 ppm TC, at pH = 4.5.
Surfaces 07 00045 g001
Figure 2. Powder XRD diffractogram of (a) pure Kaolin, (b) Bi2O3, and (c) Bi2O3/Kaolin composite.
Surfaces 07 00045 g002
Figure 3. N2 adsorption–desorption isotherms of (a) Kaolin, (b) Bi2O3, and (c) Bi2O3/Kaolin.
Surfaces 07 00045 g003
Figure 4. FESEM images of (a,b) Kaolin, (c,d) Bi2O3, and (e,f) Bi2O3-supported Kaolin at magnifications of 3500× and 15,000×.
Surfaces 07 00045 g004
Figure 5. (a) Diffuse reflectance, (b) Kubelka–Munk curves and (c) band gap determination.
Surfaces 07 00045 g005
Figure 6. (a) Energy level diagram, (b) PL intensity, and (c) Nyquist plots of pure and Kaolin-doped Bi2O3.
Surfaces 07 00045 g006
Figure 7. (a) Dark adsorption capacity, indicated by the dotted line, of Bi2O3/KO, (b) plot of Ct/Co, (c) degradation efficiency, and (d) kinetic process of TC degradation vs. irradiation time: 0.05 g photocatalyst mixed with 100 mL of 5 ppm TC, at pH = 4.5.
Surfaces 07 00045 g007
Figure 8. (a) Recovery and reuse of Bi2O3/KO composite and (b) change in fluorescence intensity observed during the irradiation of a 0.05xx g catalyst suspended in a 5 × 10⁻⁴ M TA solution and NaOH 6 × 10⁻³ M.
Surfaces 07 00045 g008
Figure 9. The photocatalytic mechanism of Kaolin-doped Bi2O3.
Surfaces 07 00045 g009
Table 1. Common synthesis methods of Bi2O3 powder.
Synthesis MethodSteps of SynthesisDisadvantagesRef.
Solid-State ReactionMixing of precursors, calcination at elevated temperatures followed by cooling and grinding.Requires high temperatures and longer reaction times.[10]
Hydrothermal Method Aqueous reaction at high temperature and pressure.High-pressure conditions and longer reaction times.[11]
Sol–Gel MethodSolution preparation, gel formation through controlled hydrolysis, and heat treatment (drying and calcination).Complex process and multiple processing steps.[12]
Co-precipitationPrecipitation of bismuth hydroxide (Bi(OH)3), washing, drying followed by calcination to produce Bi2O3.Challenges in controlling particle size, agglomeration issues, and impurity incorporation.[13]
Ultrasound-assisted methodDissolving a bismuth precursor in a suitable solvent, applying ultrasound irradiation to induce formation and precipitation of Bi2O3 nanoparticles, followed by washing and drying.High heat production during sonication, leading to the agglomeration of nanoparticles.[14]
Microwave-assisted methodPreparing a precursor solution, subjecting to microwave irradiation for rapid heating, leading to the formation of Bi2O3 particles, followed by washing and drying. Dependency on specialized microwave equipment and limited scalability for large-scale production.[15]
Table 2. Sample chemical composition (%wt) in Kaolin.
ComponentUnit (%wt)
SiO249.6
Al2O348.8
TiO20.53
Fe2O30.46
P2O50.22
MgO0.18
CaO0.06
Other compounds0.15
Table 3. Comparison of specific surface area of various prepared samples.
SamplesBET Surface Area
(SBET, m2/g)
BJH Pore Size
(nm)
Total Pore Volume
(cm3/g)
Bi2O36.28798.26980.01099
Kaolin9.03659.66410.01382
Bi2O3-supported Kaolin16.13459.35470.02454
Disclaimer/Publisher’s Note: The statements, opinions and data contained in all publications are solely those of the individual author(s) and contributor(s) and not of MDPI and/or the editor(s). MDPI and/or the editor(s) disclaim responsibility for any injury to people or property resulting from any ideas, methods, instructions or products referred to in the content.