Molecular Dynamics Simulation Study of the Mechanical Properties of Nanocrystalline Body-Centered Cubic Iron


Institute of General Mechanics, RWTH Aachen University, Eilfschornsteinstraße 18, 52062 Aachen, Germany
*
Author to whom correspondence should be addressed.
Surfaces 2020, 3(3), 381-391; https://doi.org/10.3390/surfaces3030028
Submission received: 4 June 2020
/
Revised: 15 July 2020
/
Accepted: 19 July 2020
/
Published: 4 August 2020
(This article belongs to the Special Issue Theory of Hetero-Interfaces and Surfaces: From Fundamentals to Applications)
Abstract
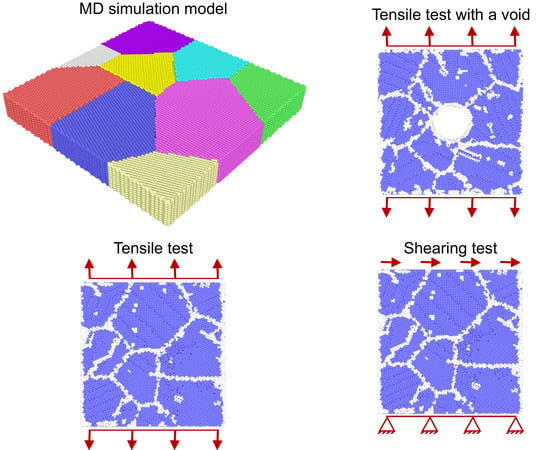
:In the present work, the mechanical properties of nanocrystalline body-centered cubic (BCC) iron with an average grain size of 10 Å were investigated using molecular dynamics (MD) simulations. The structure has one layer of crystal grains, which means such a model could represent a structure with directional crystallization. A series of uniaxial tensile tests with different strain rates and temperatures was performed until the full rupture of the model. Moreover, tensile tests of the models with a void at the center and shear tests were carried out. In the tensile test simulations, peak stress and average values of flow stress increase with strain rate. However, the strain rate does not affect the elasticity modulus. Due to the presence of void, stress concentrations in structure have been observed, which leads to dislocation pile-up and grain boundary slips at lower strains. Furthermore, the model with the void reaches lower values of peak stresses as well as stress overshoot compared to the no void model. The study results provide a better understanding of the mechanical response of nanocrystalline BCC iron under various loadings.
1. Introduction
Nanocrystalline (NC) materials in which the grain size is in the range of nanometers can have interesting and compared to macrocrystalline materials unpredictable values of material properties, such as high modulus of elasticity, ultimate strength, hardness, flow stress and high ductility [1,2,3,4,5,6]. One of the reasons for such properties is a high ratio of grain boundaries (GBs) which act as an obstacle for dislocation movements [1,3,7,8,9]. The reason for high elasticity moduli and ultimate strengths in molecular dynamics (MD) simulations can also be caused by high strain rates [2,3,4], which need to be applied due to limited computational resources when investigating large models. It is found in the literature that the strain rates in the tensile test should be held under 5 × 10 s to get reasonable structure responses and stress values [4,10]. The most common stress-strain curves of NC solids in MD simulations have an overshoot of stress values, which are nearly constant as loading continues (at high strain values) [1,4,11].
Usually, modeled BCC structures in MD simulations have a low ratio of BCC lattice in crystal grains compared to the volume of GBs [3,5,12,13]. In this work, we increased the ratio of BCC lattice in grains. Therefore, the models of one layer of grains with periodic boundary conditions were constructed. With such a model, the effect of GBs to act as seeds for dislocation movements was lowered [8]. This should lead to lower stress values during the tensile test. Moreover, mechanical properties of NC metals are highly dependent on grain size [1,14,15,16]. Jeon et al. [1] found that the highest values of strength in NC BCC iron are reached at the grain sizes of approximately 14.7 nm, which is the size where the Hall–Patch behavior becomes inverse.
In MD simulations of NC iron, high plastic strains can be reached. Generally, three mechanisms leading to plastic deformation occur GB slip, dislocation glide and diffusion connected processes [17]. It is investigated that increasing grain size ratio of dislocation glide mechanisms gets higher than GB slip [7]. Since the diffusion of atoms has a high effect on deformation behavior [18,19,20,21], it is presented that the diffusion coefficient is highly increased by prestraining, especially at lower temperatures [22]. Furthermore, it is investigated that high strain rates cause GB shearing to be a more superior deformation mechanism than diffusion-based ones [10,23,24]. Mechanical properties are also affected by the number of grains, grain rotation, grain orientation and nanoscale impurities [1,10]. The initial structures which are usually modeled in MD simulations can be described as perfect with no vacancies or impurities, which also contributes to the difference in values of derived mechanical properties compared to the ones of macrocrystalline iron. Despite the differences in derived mechanical properties, the beauty of MD simulations is that one can still obtain the influence of different parameters on the mechanical properties of the nanostructure, which also have the same effect on the macrostructure. Moreover, in the recent literature, there have been first-principles MD methods proposed to eliminate the intrinsic limitations of classical MD simulations [25,26].
This work aims to study the influence of different temperatures and strain rates on nanocrystalline BCC iron in the uniaxial tensile test and shear test. In the tensile test, the dependency of stress to strain is derived. In the shear test, we observed shear stress and shear strain relationship. Compared to the tensile tests in [1] and following the Hall–Petch rule [24], our model has the average grain size in the range at which we can expect the highest values of stresses for the chosen strain rates. In the tensile test it is expected the stresses increase with the strain rate [2,3,4,27] and decrease with the temperature [22,27]. In the second part, the influence of a hole in the NC BCC iron during the tensile test is investigated. It is expected void leads to stress concentrations, which initiates dislocation glides at lower external loads. Moreover, in the shear tests, the peak volumetric stress and flow stresses increase with the strain rate [28] and decrease with temperature [29].
2. Molecular Dynamics Simulations
2.1. Model Generation
The initial atom coordinates were programmed in Wolfram Mathematica software [30]. Firstly, x and y coordinates of crystal grain corners were chosen. Hence, the grain shapes and sizes were determined, as shown in Figure 1a. A small gap up to 2 Å was created between the grains. Therefore, there was no instability and excessive heating at the start of the MD simulations. If the gap between the grains kept smaller than 2 Å, then there were possibilities of overlap of electron clouds, i.e., nuclei are less well shielded. Therefore, the atoms from one grain would have repelled strongly with the neighboring atoms from other grains, which resulted in high kinetic energy. The thermodynamic temperature of the system arises from the kinetic energy of the vibrational motion of its atoms. Thus, one may observe the excessive heat in the MD system. We constructed the model of nine crystal grains. For each grain, the lattice orientation was chosen. Secondly, x and y coordinates of atoms with corresponding orientation were put into each grain (see Figure 1b). Therefore, we modeled a two-dimensional (2D) layer of each grain. Lastly, each grain’s corner and central atoms were extruded, respectively, in the normal direction of the initial 2D structure, with the step of lattice length. Such grain orientation could represent directional crystallization since the material structure in the extruded direction does not change. OVITO software is used to visualize the structure and results [31].
2.2. Simulation Details
All the MD simulations were performed in LAMMPS [32], developed by Plimpton. In this work, the interatomic potential of BCC iron developed by Mendelev was used [33]. In all three Cartesian directions, periodic boundary conditions (PBCs) were applied. Firstly, we performed the energy minimization by using the steepest descent algorithm. In order to get the best-conformation structure without residual stresses, we carried out the annealing heat cycle followed by equilibration. For the first equilibration, canonical (NVT) ensemble was used where Langevin thermostat was set to the temperature of 300 K. Annealing cycle was done in NVT ensemble where the structure was heated to 650 K in 25 ps, held at this temperature for 25 ps and cooled down to 300 K in 25 ps. The second equilibration was done in NVT, microcanonical (NVE) and isothermal-isobaric (NPT) ensemble, respectively, each lasting 25 ps. Lastly, the structure was heated to the desired temperature (300, 500 and 700 K) and deformed till rupture. The motion of each atom was determined by the forces produced by Newton’s equation of motion. In the mechanical tests, the normal and shear deformation at different strain rates (0.004, 0.006, 0.008, 0.010, 0.012 ps) were applied. During deformation in the tensile test, the PBCs and zero pressures were assigned to the other two directions. In the shear test, pressure normal to the shearing plane is set to zero. Visualization and dislocation analysis (DXA) were done in OVITO visualization software [31].
3. Results and Discussion
3.1. Tensile Test
In Figure 2 and Figure 3, the snapshots of the model at different strains during the tensile test for different strain rates and temperatures are shown. In both figures, the 1st snapshot was taken at a strain of 0.0, the 2nd in the elastic region of deformation at the strain of 0.03, and the 3rd at the strain where each structure reached peak stress. The 4th and 5th snapshots are taken in the plastic region of flow stresses at strains of 0.15 and 0.25. For analysis and visualization, OVITO’s module dislocation analysis (DXA) [34] was used. The module allows us to observe ratios of different lattice configurations and identification of all dislocation line defects. The purple atoms are arranged in the BCC lattice while the white represents the dislocation types of <111>, <100> and <110> (see Figure 2 and Figure 3). In all tensile simulations, the two most common deformation mechanisms were recognized, GB slip and dislocation glide [13]. Moreover, grain rotation [17] and growth were noticed.
The undeformed state at a strain of zero represents the structure right after the equilibrations, which was obtained after the annealing cycle. After those cycles, initial structure with 9 flawless BCC monocrystals changed to the polycrystalline structure of 9 grains containing a different density of dislocations (see numbered grains in Figure 2a). It was observed that the highest density of dislocation in the initial structure developed in grain number 4 and the lowest in the grain 2 (using DXA tool of the OVITO software [31]). Due to model construction, the ratio of BCC lattice before deformation in all the samples equals 84.3%, which is higher than most of the literature [3,12,13]. In all samples, we noticed a decrease in the BCC ratio with deformation, where the ratio change in elastic compared to the plastic region is negligible. With increased strain rates, a significant decrease of BCC lattice was noticed at the same strain values. Even if only one layer of atoms, such effect is observed as a higher increase in a number of white atoms in the top layer in Figure 2b from strain 0 to 0.25, compared to Figure 2a. This means that the fraction of stacking faults in the grain lattice and fraction of GBs increases with increased strain rate in the flow stress region. From the tests done at different temperatures and the same values of strain rate, we found that the BCC ratio is also reduced with an increase in temperatures. Still, the effect of different strain rates was a more dominant factor in the BCC lattice ratio change (see Figure 3).
During the tensile test some of the initial dislocations (yellow arrows in Figure 2a and Figure 3a,b) started to move to the boundaries and piled up there, presumably because of high energy GBs [13]. Others, which ended on GBs of neighboring grains with a low difference in lattice angle, initiated dislocations in the neighboring grain. At high values of strain, some GBs started to lose their improper lattice structure. Such regions changed to the boundary at which neighboring grains share a plane of atoms. GB that went through such a process of generating twin planes from strain 0 to 0.25 are shown in Figure 2a,b (green ellipses). The main difference in GB configurations happened after the peak stresses. The reason for such processes could be more frequent GBs slides at the high strain values and increased diffusion coefficient at the higher prestrains [22]. Furthermore, before some grains grew in a way that the GB between neighbor grains disappeared, and grains started to share a plane of atoms. In Figure 2b, grain growth was observed gradually from strain 0 to 0.15. Newly formed GB is marked with a black ellipse. It is seen that grain number 8 is dissolved and became part of neighboring grains 7 and 9. Therefore, both the grains sizes were increased. The grain rotation can be observed in Figure 2a and Figure 3b from strain 0 to 0.25 in grain number 2, which is marked with red lines.
Figure 4 shows the stress-strain curves at different temperatures and strain rates. All the stress-strain curves have a linear elastic region, which is followed by a stress overshoot. After the peak stresses, nearly constant values of flow stress were observed. The fluctuation of the curves in the flow stress region is dependent on the distribution, orientation and size of grains. The averaging of more stress-strain curves with a change in the parameters, as mentioned above, leads to more constant flow stress values.
In Figure 4a, tensile tests were performed at the temperature of 300 K, and strain rates from 0.004 to 0.012 ps with a step size of 0.002 ps were applied. It is noticed that the change in strain rate does not affect the elastic modulus. However, the peak stresses increase significantly with strain rates. Moreover, the flow stresses increased moderately with strain rates. The reason for the increase in the flow stress is that the density of partial dislocations in the region before the strain at peak stresses decreases with increased strain rate. This leads to increased values of delayed partial dislocations with increased strain rate, causing stress overshoots after the overshoot dislocation density starts to rise, which leads to stress reduction to the constant value of flow stress. Similar observations were made by Rida et al. [28].
Figure 4b demonstrates the stress-strain curves of tensile tests, which were carried out at temperatures 500 and 700 K with strain rates of 0.006 and 0.008 ps. It is observed that the elastic modulus decreases with increased temperature. Moreover, a decrease of the elastic modulus with temperature leads to a lower ratio of peak to flow stresses, which is seen as lower overshoot. Furthermore, higher temperatures lead to lower peak and flow stresses. As mentioned before, not only higher strain rates but also higher temperatures decreased the BCC lattice ratio in the model when being deformed. In addition, we compared strains at a temperature of 300, 500 and 700 K at strain rates of 0.006 and 0.008 ps. It is found that high temperatures decrease the energy needed for GBs sliding more than for dislocation glide, making GBs dominant deformation mechanism, which is also discussed by Ghaffarian et al. [35]. The reduction of energy needed to initiate GBs slide makes plastic deformation easier, which leads to lower peak and flow stresses.
3.2. Specimen with Void
At the nanoscale, continuum approximations based on the finite element method are no longer valid since the technique can not consider dislocation movement and grain slides. From the continuum mechanics, a problem of the plate with a hole is known, where a stress concentration is three times higher on the hole edge than the pressure applied on the plate edges [36]. In this section, the influence of a hole on the mechanical properties of NC BCC iron is discussed. In the [37] deformation process of NC monocrystal with a hole is analyzed, where the NC model response can be described as follows
- Dislocations nucleate near the void;
- With additional deformation, dislocations initiated near void propagate to the specimen edges;
- Reduction of specimen stress resistance;
- Necking of specimen seen at higher strain values.
In our simulations, the initial model (see Figure 1) was taken, and a through-hole with a diameter of 30 Å was made in the center of the model, as it is shown in the most left snapshot in Figure 5. We were interested in the influence such a hole would make on the stress-strain curve in a uniaxial tensile test. We need to be aware of periodic boundary conditions used, which means the necking will not form the same way as in the work of Potirniche et al. [37]. Here, MD simulations were performed at a temperature of 300 K and strain rates of 0.006 and 0.008 ps. Snapshots of the deformed structure at different strains are shown in Figure 5.
In Figure 5, at the strain value of zero, the model after minimizations, equilibration and annealing is shown. We can comprehend the structure of 9 grains in the model. The snapshot at a strain of 0.015 shows von-Misses stress of each atom in linearly elastic structure response. One can notice that the highest stresses are formed in the GBs, however, a small stress increase formed in the BCC lattice next to the hole edge (yellow ellipses) was observed. At a strain value of 0.08, we recognized stress concentration in BCC lattice near the edge on both sides of a hole increases (red ellipses). This does not only correspond to stress concentration in NC monocrystal [37] but also to the continuum mechanics model. The next snapshot at a strain of 0.12, the structure is loaded with the highest stress. Here, we can observe that grain with number 6 starts to slide into the void. Furthermore, crack initiation is seen (black ellipse). With further increase in strain, the grain 6 kept sliding into the hole while the hole in pulling axis direction kept increasing its size.
Figure 6 depicts the stress-strain curves of the models with and without holes at the center. The model with a hole reached lower peak stress than the model without a hole. However, the flow stresses of both models are nearly the same values for the considered range of strain rates. The significant difference was also observed in the low strain region. The model without a hole has a linearly elastic response over an extended range of strain 0.04, while the hole model curve starts to divert from the linearity at a strain of 0.018. With further investigation of change in neighbor atom distances, we concluded that curve flattening at low strains happens due to small GBs slips, which became more frequent with further deformation, leading to additional stress-strain curve flattening.
We observed that the hole first initiated stress concentrations, leading to dislocation nucleation at smaller strains. The hole also represented a volume to where the grains could be pushed more easily, making GB slips possible at lower strains. When such a slip happened, structure relaxation occurred. The described process leads to lower overshoot compared to the one without the hole model.
3.3. Shearing Test
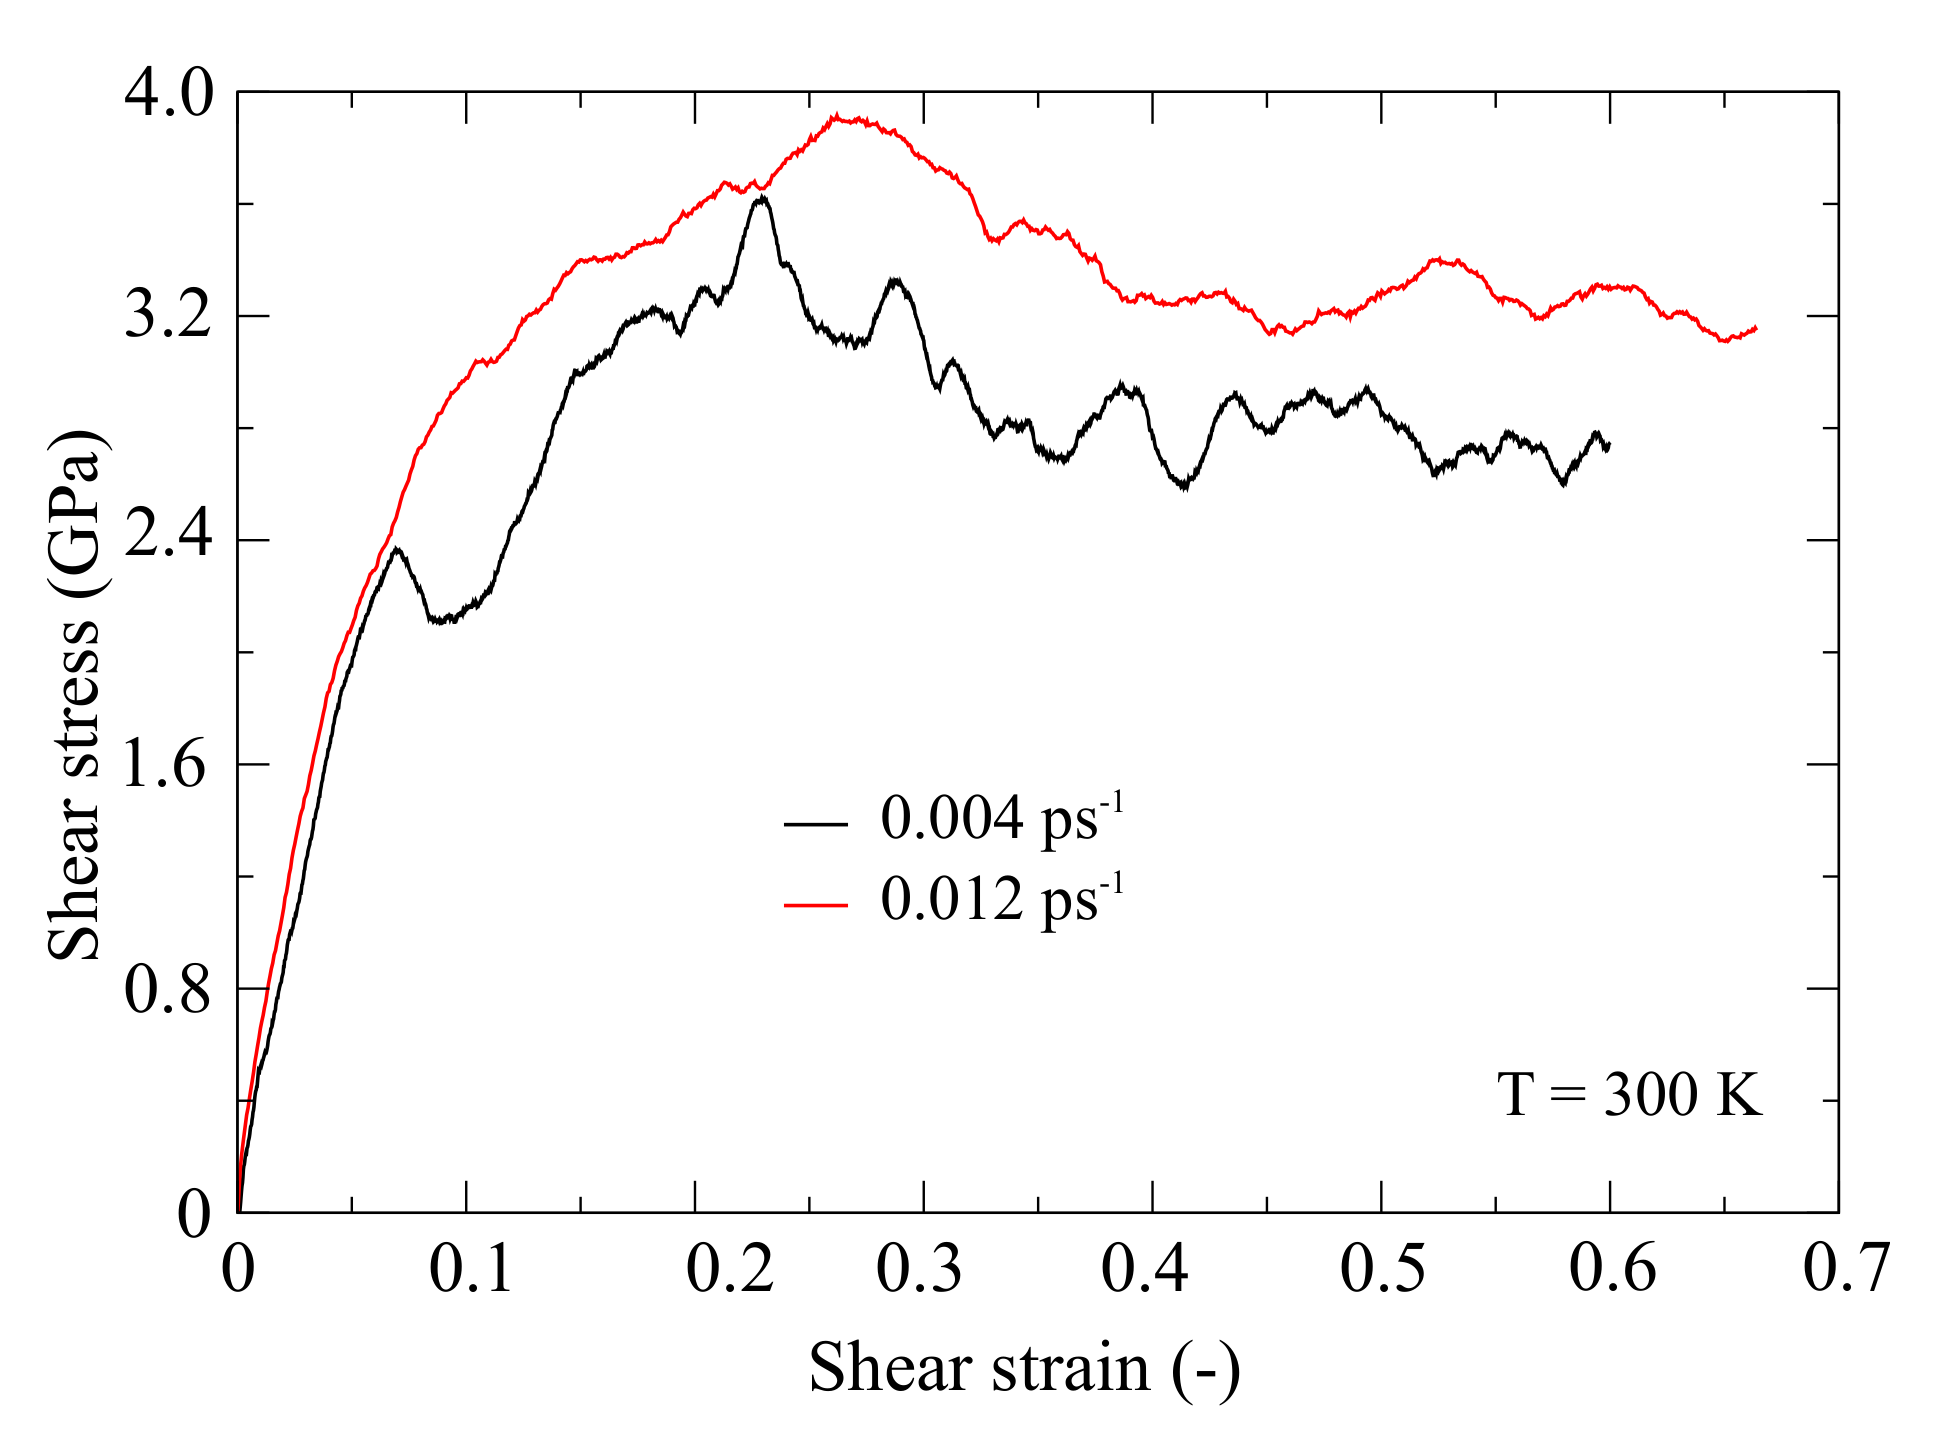
In this section, shearing tests on NC BCC iron are discussed, focusing on the influence of different strain rates on the mechanical properties. The MD simulations were carried out with two different strain rates of 0.004 and 0.012 ps, which defined the upper face of the simulation box’s translatory motion. The bottom part of the box was fixed. We need to be aware that the chosen simulation boundary conditions do not allow the simulation box to be deformed orthogonally to the translatory direction of the upper cell face. This means the shearing component of stress is the main load for structure deformation at lower shear strains. However, as loading continues, the influence of normal stresses increases.
Figure 7 shows the snapshots of the model at different shear strains during shearing test simulation at a strain rate of 0.012 ps. As mentioned earlier, the purple atoms represent the ones arranged in the BCC lattice, and the white represents the dislocation types of <111>, <100> and <110>. The first snapshot is taken at the shear strain equal to zero, which shows the structure after the minimizations, equilibration and annealing. As in the tensile test, 9 grains were formed with different density of dislocations. The shear strain of 0.06 represents the structure in its maximum shear strain in the linear elastic response, where no dislocation activity was found. Atom configuration at a shear strain of 0.24 shows the structure at its maximum stress load. As we compared it to the undeformed state, grain boundary slips were noticed by observing a change in neighbor atom distances. We found out that the ratio of BCC lattice stays constant—it fluctuates around the initial value of 82%, which is different compared to the tensile test, where the ratio decreases. The last two snapshots represent the structure response in the shear stress flow region where grain boundary slips were the main deforming mechanism recognized.
Figure 8 depicts the shear stress-strain curves. The structure response is linearly elastic for small shear strains—for both strain rates up to shear strain of approximately 0.05. At the shear strain of 0.05, the curve for strain rate 0.012 ps starts to flatten and makes a small stress overshoot over a long shear strain. In the case of a slow strain rate of 0.004 ps, at a shear strain of 0.075, the stress suddenly drops. The reason for such a response was sudden GB slip, which happened in the model. If simulations results are averaged for different grain configurations, the curves do not have such fluctuations before the peak values of shear stress and also in the flow stress region. Both overshoots are followed by constant shear flow stresses. We concluded that higher shear strain rates lead to higher peak shear stresses and higher shear flow stresses. Moreover, the strain rate has no significant influence on the shear modulus.
The cross-section of the specimen is the same as in the tensile test. It is seen that for the same cross-section and strain rate, the structure can be plastically deformed with lower flow stresses when shear stress is applied instead of a normal one. This work can be effectively used to investigate the high-speed forming of nanocrystalline metals, e.g., iron and aluminum, using MD simulations [38,39,40,41].
4. Conclusions
A detailed study has been performed to investigate the mechanical properties of nanocrystalline BCC iron through all-atom molecular dynamics simulations. In this work, the structure of the model has one layer of crystal grains, which means such a model could represent a structure with directional crystallization. The mechanical properties of the nanocrystalline BCC iron MD model in uniaxial tension, tension with a void at the center of the model and shear were studied. The following most notable findings are summarized.
- In the tensile test MD simulations, peak values of stress and average values of flow stress increase with strain rate, however, the strain rate does not affect the elasticity modulus. Moreover, an increase in temperature leads to a decrease in elasticity modulus, peak stress value and flow stress.
- When the model with the void at the center is under tension, stress concentrations in structure occur, which leads to dislocation pile up and grain boundary slips at lower strains. Furthermore, the model with the void reaches lower values of peak stresses as well as stress overshoot compared to the no void model. Furthermore, for different strain rate values, the stress flows of both models have approximately the same values.
- For high strain rates, in shear test simulations, the peak shear stress values, as well as flow stresses, were higher. However, the shearing modulus was not affected.
Author Contributions
Conceptualization, J.H., M.G. and S.P.P.; methodology, J.H., M.G. and S.P.P.; software, J.H. and M.G.; validation, S.P.P.; formal analysis, J.H., M.G. and S.P.P.; investigation, J.H. and M.G.; data curation, J.H., M.G. and S.P.P.; writing—original draft preparation, J.H., M.G. and S.P.P.; visualization, J.H., M.G. and S.P.P.; supervision, S.P.P. and B.M. All authors have read and agreed to the published version of the manuscript.
Funding
This research received no external funding.
Acknowledgments
The authors gratefully acknowledge the computing time granted by the JARA Vergabegremium and provided on the JARA Partition part of the supercomputer CLAIX at RWTH Aachen University.
Conflicts of Interest
The authors declare no conflict of interest.
References
- Jeon, J.; Lee, B.J.; Chang, Y. Molecular dynamics simulation study of the effect of grain size on the deformation behaviour of nanocrystalline body-centered cubic iron. Scr. Mater. 2011, 64, 494–497. [Google Scholar] [CrossRef]
- Jia, D.; Ramesh, K.T.; Ma, E. Effects of nanocrystalline and ultrafine grain sizes on constitutive behavior and shear bands in iron. Acta Mater. 2003, 51, 3495–3509. [Google Scholar] [CrossRef]
- Kumar, K.; Van Swygenhoven, H.; Suresh, S. Mechanical behavior of nanocrystalline metals and alloys. Acta Mater. 2003, 51, 5743–5774. [Google Scholar] [CrossRef]
- Schiøtz, J.; Jacobsen, K. A Maximum in the Strength of Nanocrystalline Copper. Science 2003, 301, 1357–1359. [Google Scholar] [CrossRef] [PubMed] [Green Version]
- Wei, Q.; Pan, Z.; Wu, X.; Schuster, B.; Kecskes, L.; Valiev, R. Microstructure and mechanical properties at different length scales and strain rates of nanocrystalline tantalum produced by high-pressure torsion. Acta Mater. 2011, 59, 2423–2436. [Google Scholar] [CrossRef] [Green Version]
- Valiev, R.; Islamgaliev, R.; Alexandrov, I.V. Bulk nanostructured materials from severe plastic deformation. Prog. Mater. Sci. 2000, 45, 103–189. [Google Scholar] [CrossRef]
- Hansen, N. Hall–Petch relation and boundary strengthening. Scr. Mater. 2004, 51, 801–806. [Google Scholar] [CrossRef]
- Siegel, R.W.; Thomas, G.J. Grain boundaries in nanophase materials. Ultramicroscopy 1992, 40, 376–384. [Google Scholar] [CrossRef]
- Van Swygenhoven, H.; Farkas, D.; Caro, A. Grain-boundary structures in polycrystalline metals at the nanoscale. Phys. Rev. B 2000, 62, 831–838. [Google Scholar] [CrossRef] [Green Version]
- Rajgarhia, R.; Spearot, D.; Saxena, A. Plastic deformation of nanocrystalline copper-antimony alloys. J. Mater. Res. 2010, 25, 411–421. [Google Scholar] [CrossRef]
- Vo, N.; Averback, R.; Bellon, P.; Caro, A. Yield strength in nanocrystalline Cu during high strain rate deformation. Scr. Mater. 2009, 61, 76–79. [Google Scholar] [CrossRef]
- Van Swygenhoven, H. Polycrystalline materials - Grain Boundaries and Dislocations. Science 2002, 296, 66–67. [Google Scholar] [CrossRef] [PubMed]
- Van Swygenhoven, H.; Spaczer, M.; Caro, A.; Farkas, D. Competing plastic deformation mechanisms in nanophase metals. Phys. Rev. B 1999, 60, 22–25. [Google Scholar] [CrossRef]
- Armstrong, R. The influence of polycrystal grain size on several mechanical properties of materials. Metall. Mater. Trans. 1970, 1, 1169–1176. [Google Scholar] [CrossRef]
- Armstrong, R.W.; Codd, I.; Douthwaite, R.M.; Petch, N.J. The plastic deformation of polycrystalline aggregates. Philos. Mag. 1962, 45–58. [Google Scholar] [CrossRef]
- Hugo, R.; Kung, H.; Weertman, J.; Mitra, R.; Knapp, J.; Follstaedt, D. In-situ TEM tensile testing of DC magnetron sputtered and pulsed laser deposited Ni thin films. Acta Mater. 2003, 51, 1937–1943. [Google Scholar] [CrossRef]
- Hasnaoui, A.; Van Swygenhoven, H.; Derlet, P. Cooperative processes during plastic deformation in nanocrystalline FCC metals a molecular dynamics simulation. Phys. Rev. B. 2002, 66. [Google Scholar] [CrossRef]
- Yamakov, V.; Wolf, D.; Phillpot, S.; Gleiter, H. Grain-boundary diffusion creep in nanocrystalline palladium by molecular-dynamics simulation. Acta Mater. 2002, 50, 61–73. [Google Scholar] [CrossRef]
- Mohammadzadeh, M.; Mohammadzadeh, R. Effect of grain size on apparent diffusivity in nanocrystal α-iron by atomistic simulation. Comput. Mater. Sci. 2017, 129, 239–246. [Google Scholar] [CrossRef]
- Mohammadzadeh, R.; Mohammadzadeh, M. Effect of grain boundary misorientation on the apparent diffusivity in nanocrystalline aluminum by atomistic simulation study. J. Appl. Phys. 2018, 124, 035102. [Google Scholar] [CrossRef]
- Yamakov, V.; Wolf, D.; Phillpot, S.; Mukherjee, A.; Gleiter, H. Deformation-mechanism map for nanocrystalline metals by molecular-dynamics simulation. Nat. Mater. 2004, 3, 43–47. [Google Scholar] [CrossRef] [PubMed]
- Mohammdzadeh, R. Analysis of plastic strain-enhanced diffusivity in nanocrystalline iron by atomistic simulation. J. Appl. Phys. 2019, 125, 135103. [Google Scholar] [CrossRef]
- Van Swygenhoven, H.; Weertman, J. Deformation in nanocrystalline metals. Mater. Today 2006, 9, 24–31. [Google Scholar] [CrossRef]
- Argon, A.; Yip, S. The strongest size. Philos. Mag. 2006, 86, 713–720. [Google Scholar] [CrossRef]
- Cassone, G.; Giaquinta, P.V.; Saija, F.; Saitta, A.M. Effect of electric field orientation on the mechanical and electrical properties of water ices: An Ab-initio study. J. Phys. Chem. B 2014, 118, 12717–12724. [Google Scholar] [CrossRef]
- Mortazavi, B.; Rahaman, O.; Makaremi, M.; Dianat, A.; Cuniberti, G.; Rabczuk, T. First-principles investigation of mechanical properties of silicene, germanene and stanene. Physica E 2017, 87, 228–232. [Google Scholar] [CrossRef] [Green Version]
- Gupta, P.; Yedla, N. Strain Rate and Temperature Effects on the Strength and Dissipative Mechanisms in Al-Cu50Zr50 Interface Model: Molecular Dynamics Simulation Study. Procedia Eng. 2017, 184, 631–636. [Google Scholar] [CrossRef]
- Rida, A.; Micoulaut, M.; Rouhaud, E.; Makke, A. Understanding the strain rate sensitivity of nanocrystalline copper using molecular dynamics simulations. Comput. Mater. Sci. 2019, 172. [Google Scholar] [CrossRef]
- Babicheva, R.; Dmitriev, S.; Zhang, Y.; Kok, S.; Zhou, K. Effect of Co Distribution on Plastic Deformation of Nanocrystalline Al-10.2 at.% Co Alloy. J. Nanomater. 2015, 2015, 1–8. [Google Scholar] [CrossRef]
- Inc., W.R. Mathematica, Version 12.1. Available online: https://www.wolfram.com/mathematica/ (accessed on 21 July 2020).
- Stukowski, A. Visualization and analysis of atomistic simulation data with OVITO–the Open Visualization Tool. Modell. Simul. Mater. Sci. Eng. 2010, 18, 015012. [Google Scholar] [CrossRef]
- Plimpton, S. Fast Parallel Algorithms for Short-Range Molecular Dynamics. J. Comput. Phys. 1995, 117, 1–19. [Google Scholar] [CrossRef] [Green Version]
- Mendelev, M.I.; Srolovitz, D.J.; Ackland, G.; Sun, D.; Asta, M. Development of new interatomic potentials appropriate for crystalline and liquid iron. Philos. Mag. 2003, 83, 3977–3994. [Google Scholar] [CrossRef]
- Stukowski, A.; Bulatov, V.; Arsenlis, A. Automated identification and indexing of dislocations in crystal interfaces. Model. Simul. Mater. Sci. 2012, 20, 085007. [Google Scholar] [CrossRef]
- Ghaffarian, H.; Karimi Taheri, A.; Kang, K.; Ryu, S. Molecular dynamics simulation study of the effect of temperature and grain size on the deformation behavior of polycrystalline cementite. Scr. Mater. 2014, 95. [Google Scholar] [CrossRef]
- Kadam, M.; Pawar, K.; Mantri, K. Effect of loading conditions on the stress concentration factor for a plate. IOSR J. Mech. Civil Eng. 2015, 3, 55–65. [Google Scholar]
- Potirniche, G.P.; Horstemeyer, M.; Wagner, G.; Gullett, P. A molecular dynamics study of void growth and coalescence in single crystal nickel. Int. J. Plast. 2006, 22, 257–278. [Google Scholar] [CrossRef]
- Jenkouk, V.; Patil, S.; Markert, B. Joining of tubes by gas detonation forming. J. Physics Conf. Ser. 2016, 734, 032101. [Google Scholar] [CrossRef]
- Patil, S.P.; Popli, M.; Jenkouk, V.; Markert, B. Numerical modelling of the gas detonation process of sheet metal forming. J. Physics Conf. Ser. 2016, 734, 032099. [Google Scholar] [CrossRef] [Green Version]
- Patil, S.; Prajapati, K.; Jenkouk, V.; Olivier, H.; Markert, B. Experimental and Numerical Studies of Sheet Metal Forming with Damage Using Gas Detonation Process. Metals 2017, 7, 556. [Google Scholar] [CrossRef] [Green Version]
- Patil, S.; Murkute, R.; Shirafkan, N.; Markert, B. Deformation of Stacked Metallic Sheets by Shock Wave Loading. Metals 2018, 8, 679. [Google Scholar] [CrossRef] [Green Version]
Figure 1.
Initial grain configuration of the MD simulation model. (a) The front view and (b) the three-dimensional view of the model. Each different color represents a different grain.
Figure 1.
Initial grain configuration of the MD simulation model. (a) The front view and (b) the three-dimensional view of the model. Each different color represents a different grain.
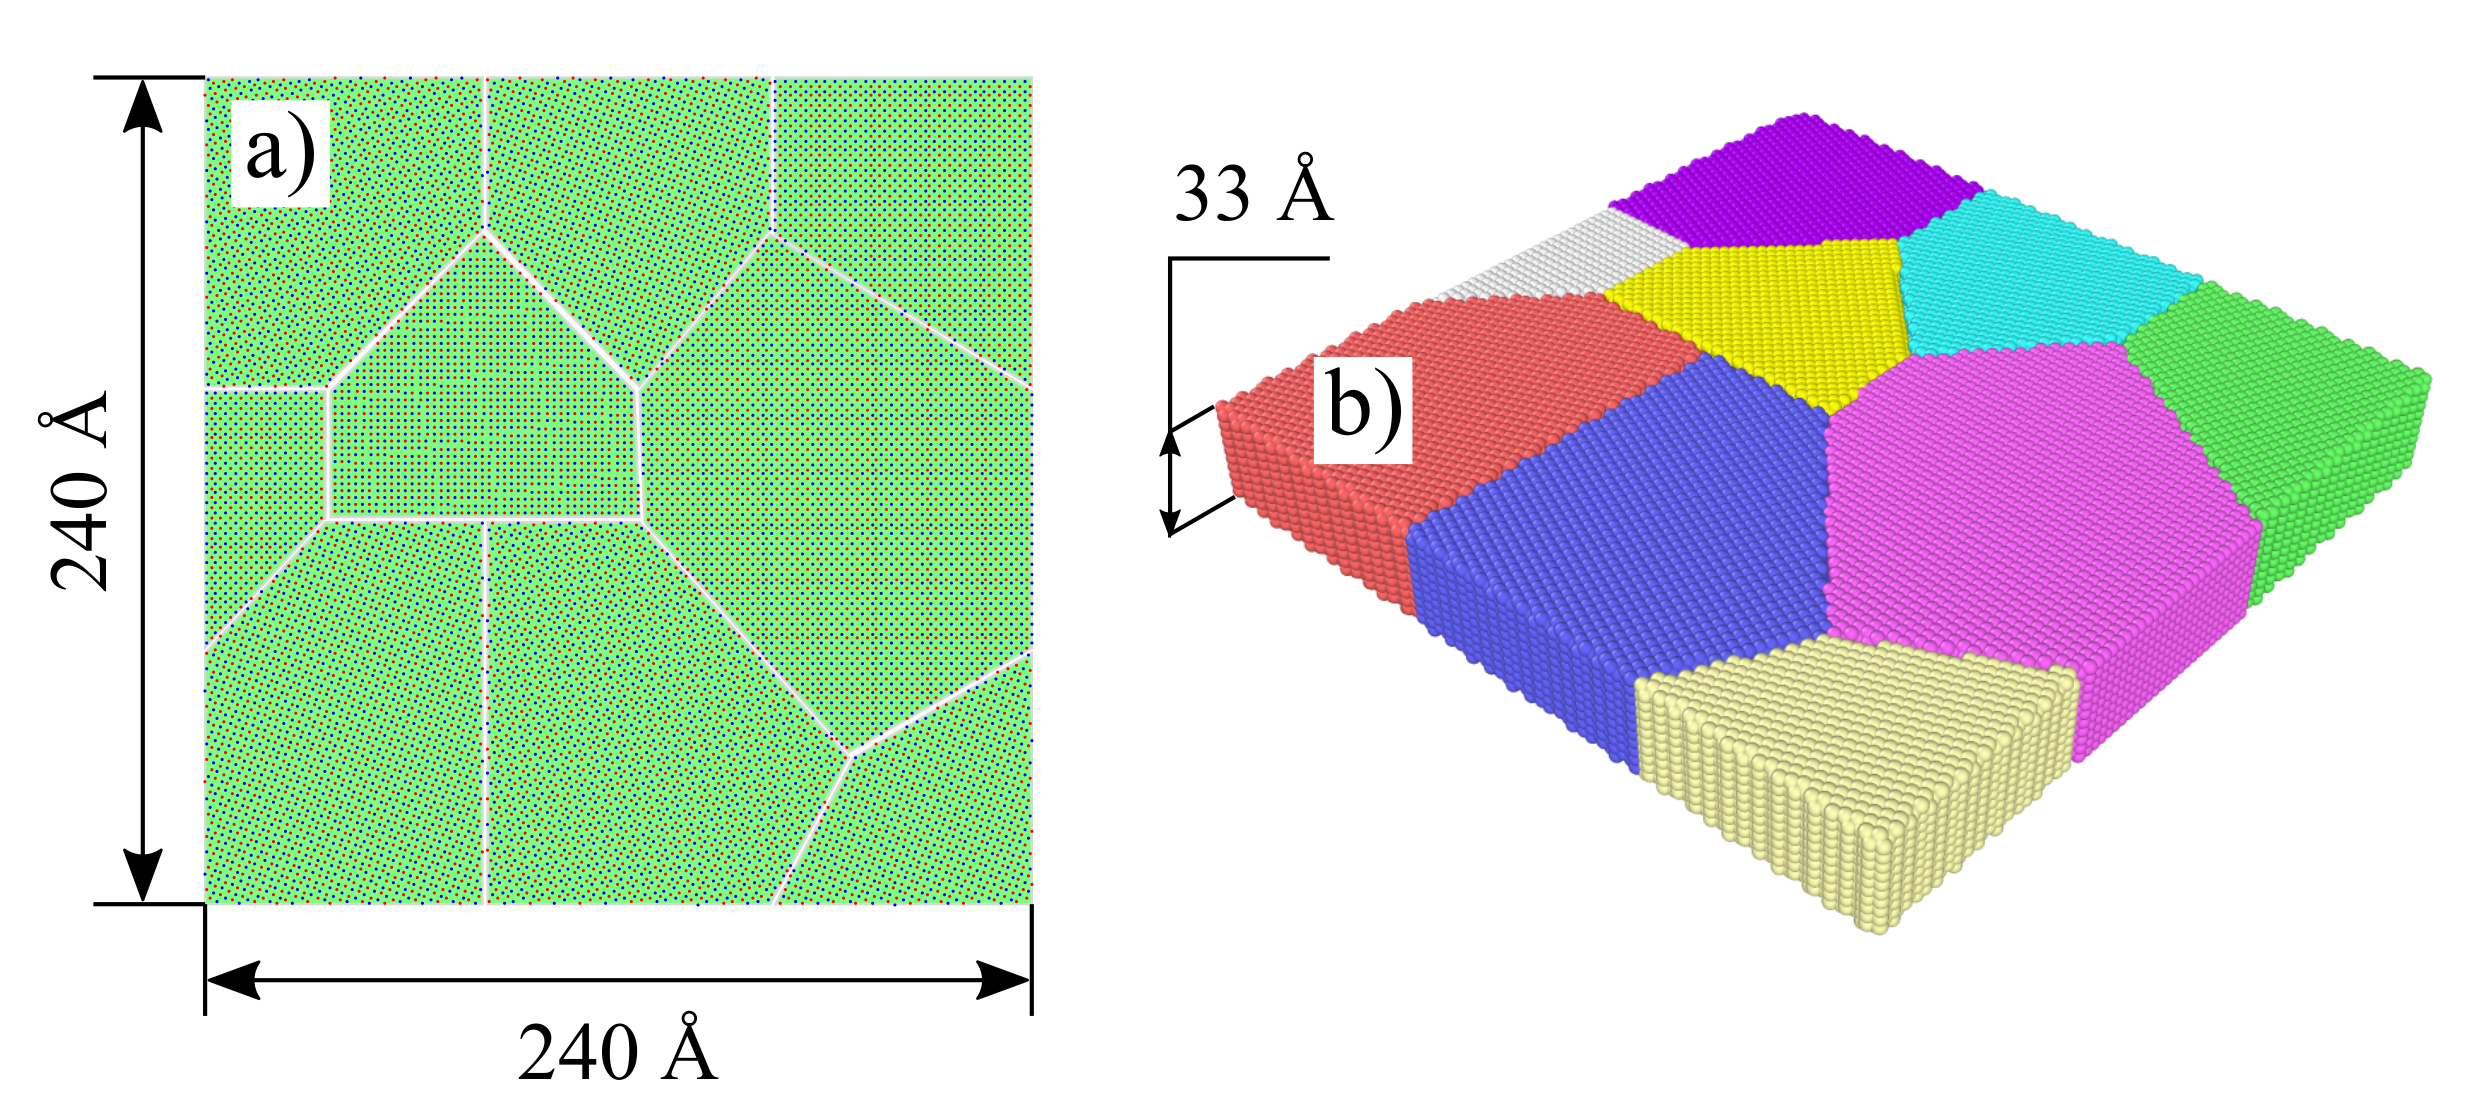
Figure 2.
Deformation snapshots of the specimen show the progress in tensile loading at constant temperature and different strain rates.
Figure 2.
Deformation snapshots of the specimen show the progress in tensile loading at constant temperature and different strain rates.
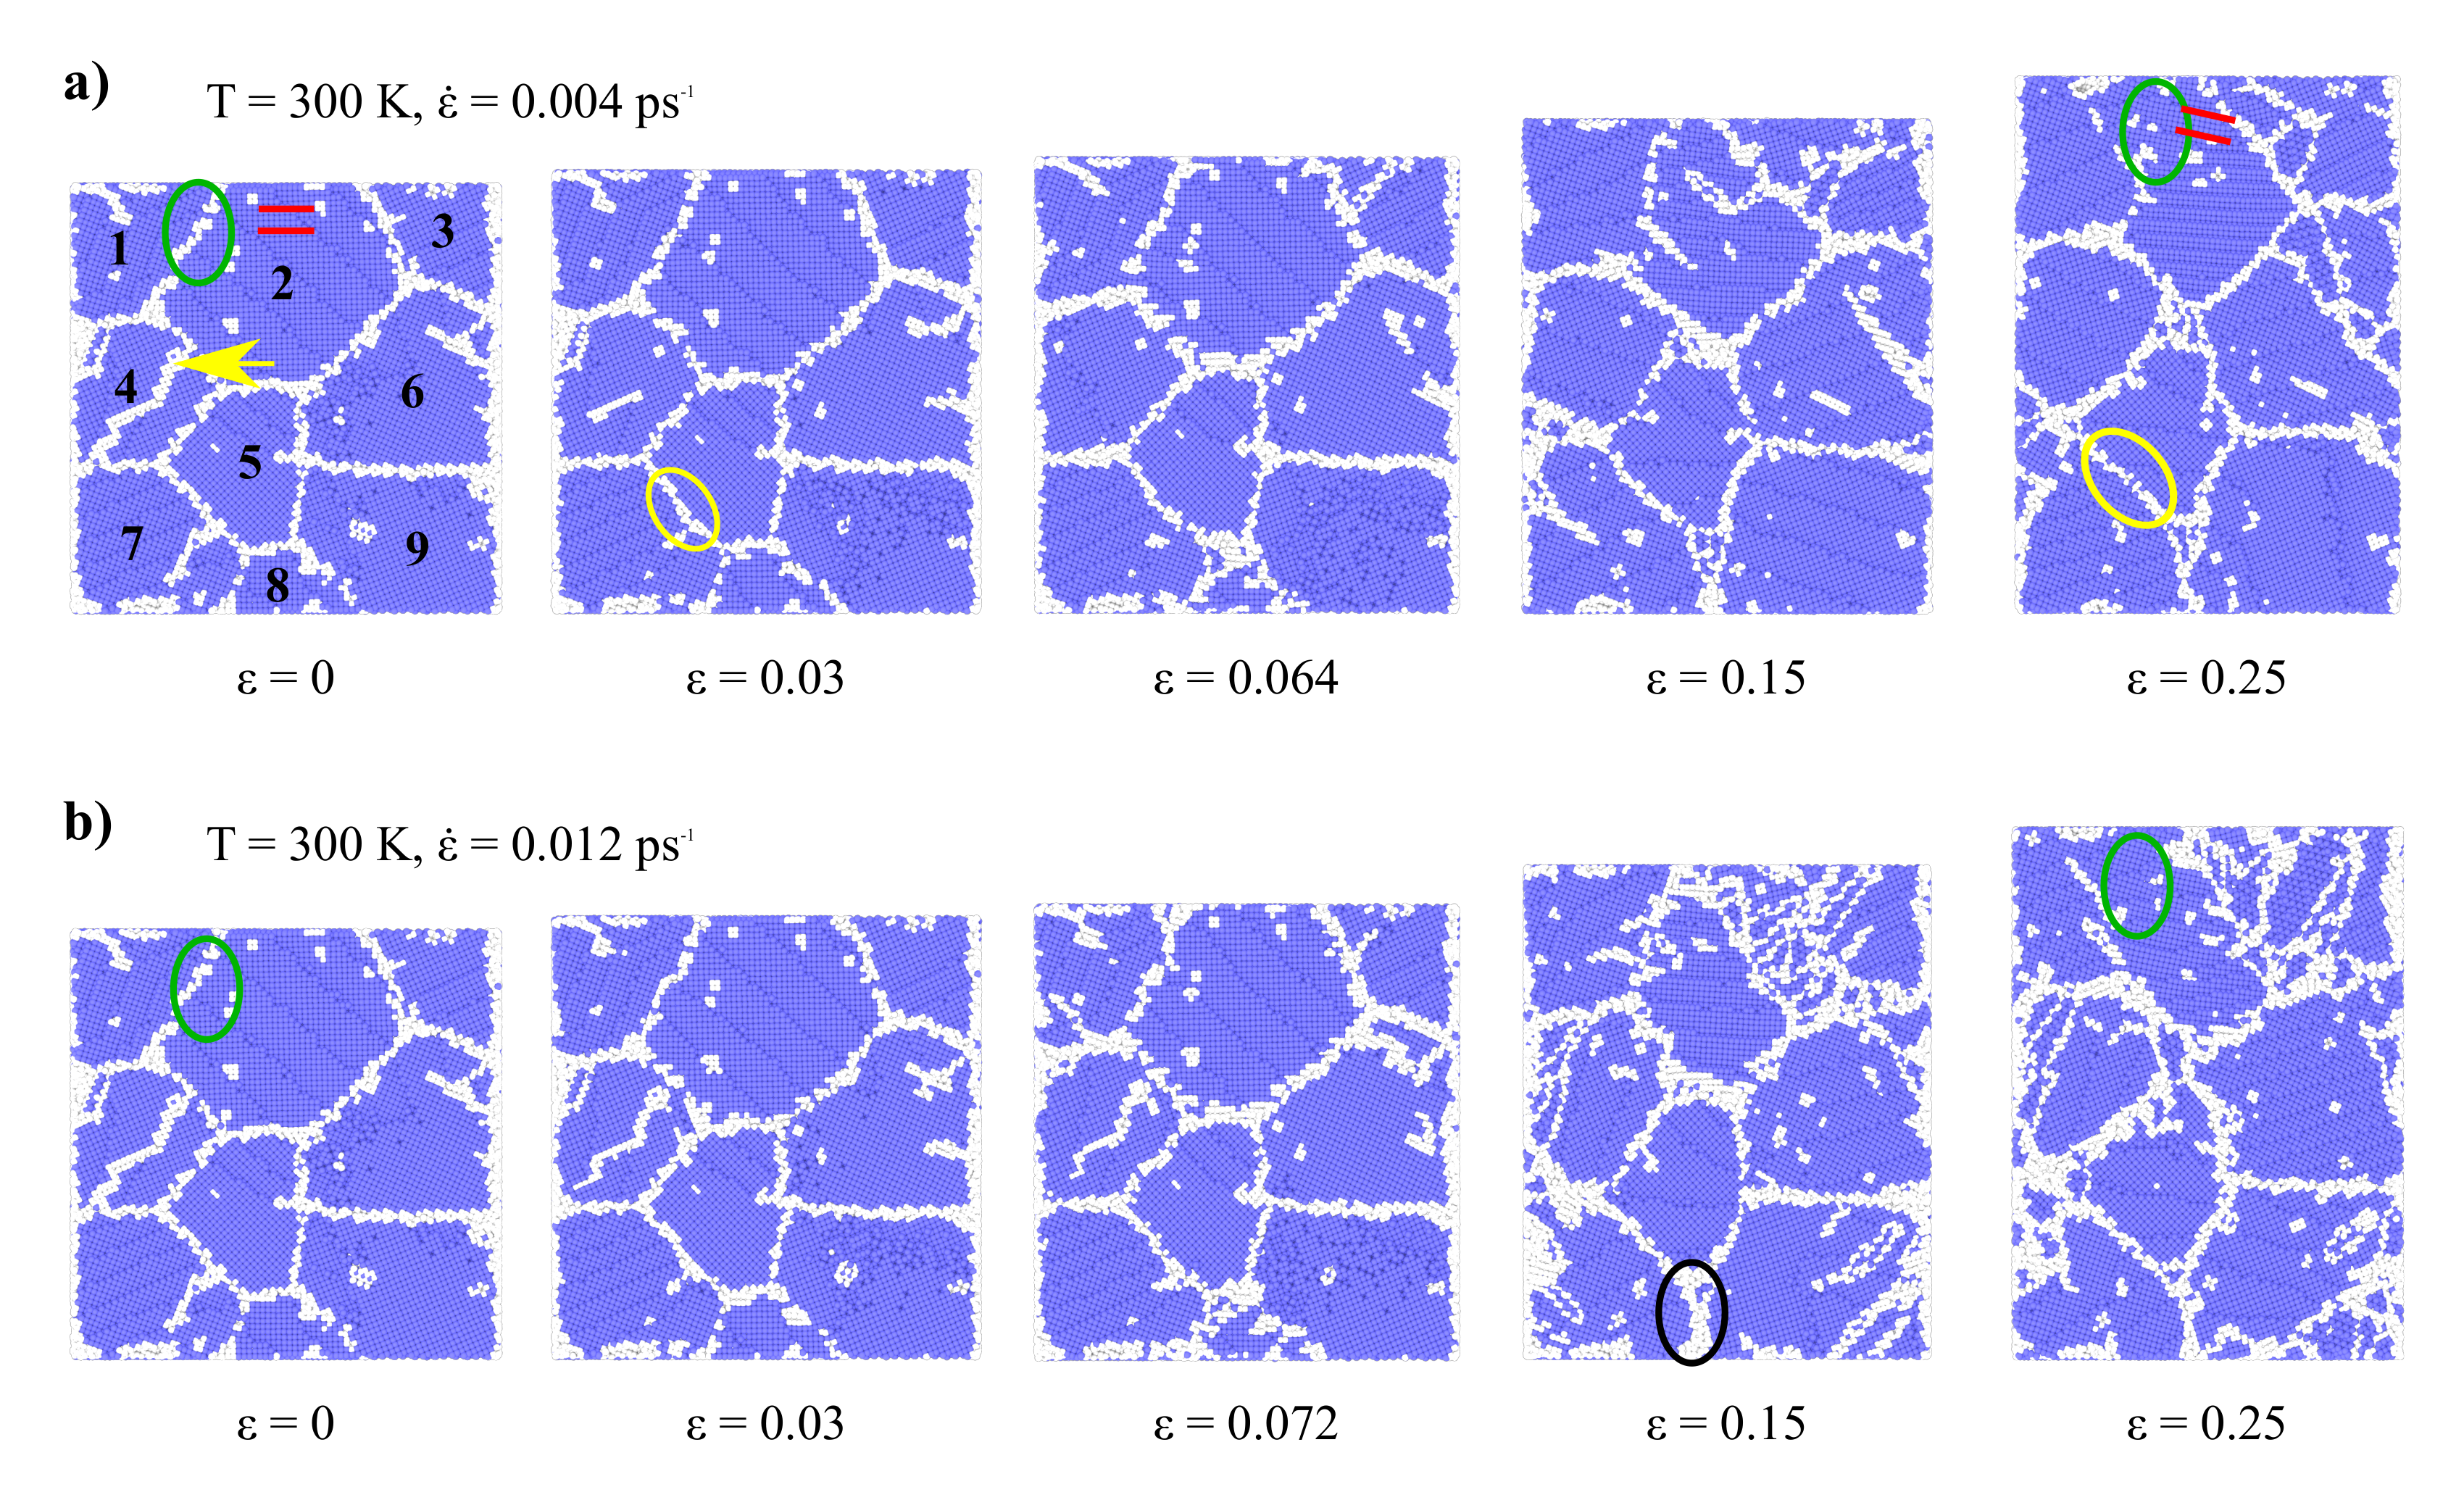
Figure 3.
Snapshots of the specimen observe during tensile loading at a constant strain rate and different temperatures.
Figure 3.
Snapshots of the specimen observe during tensile loading at a constant strain rate and different temperatures.
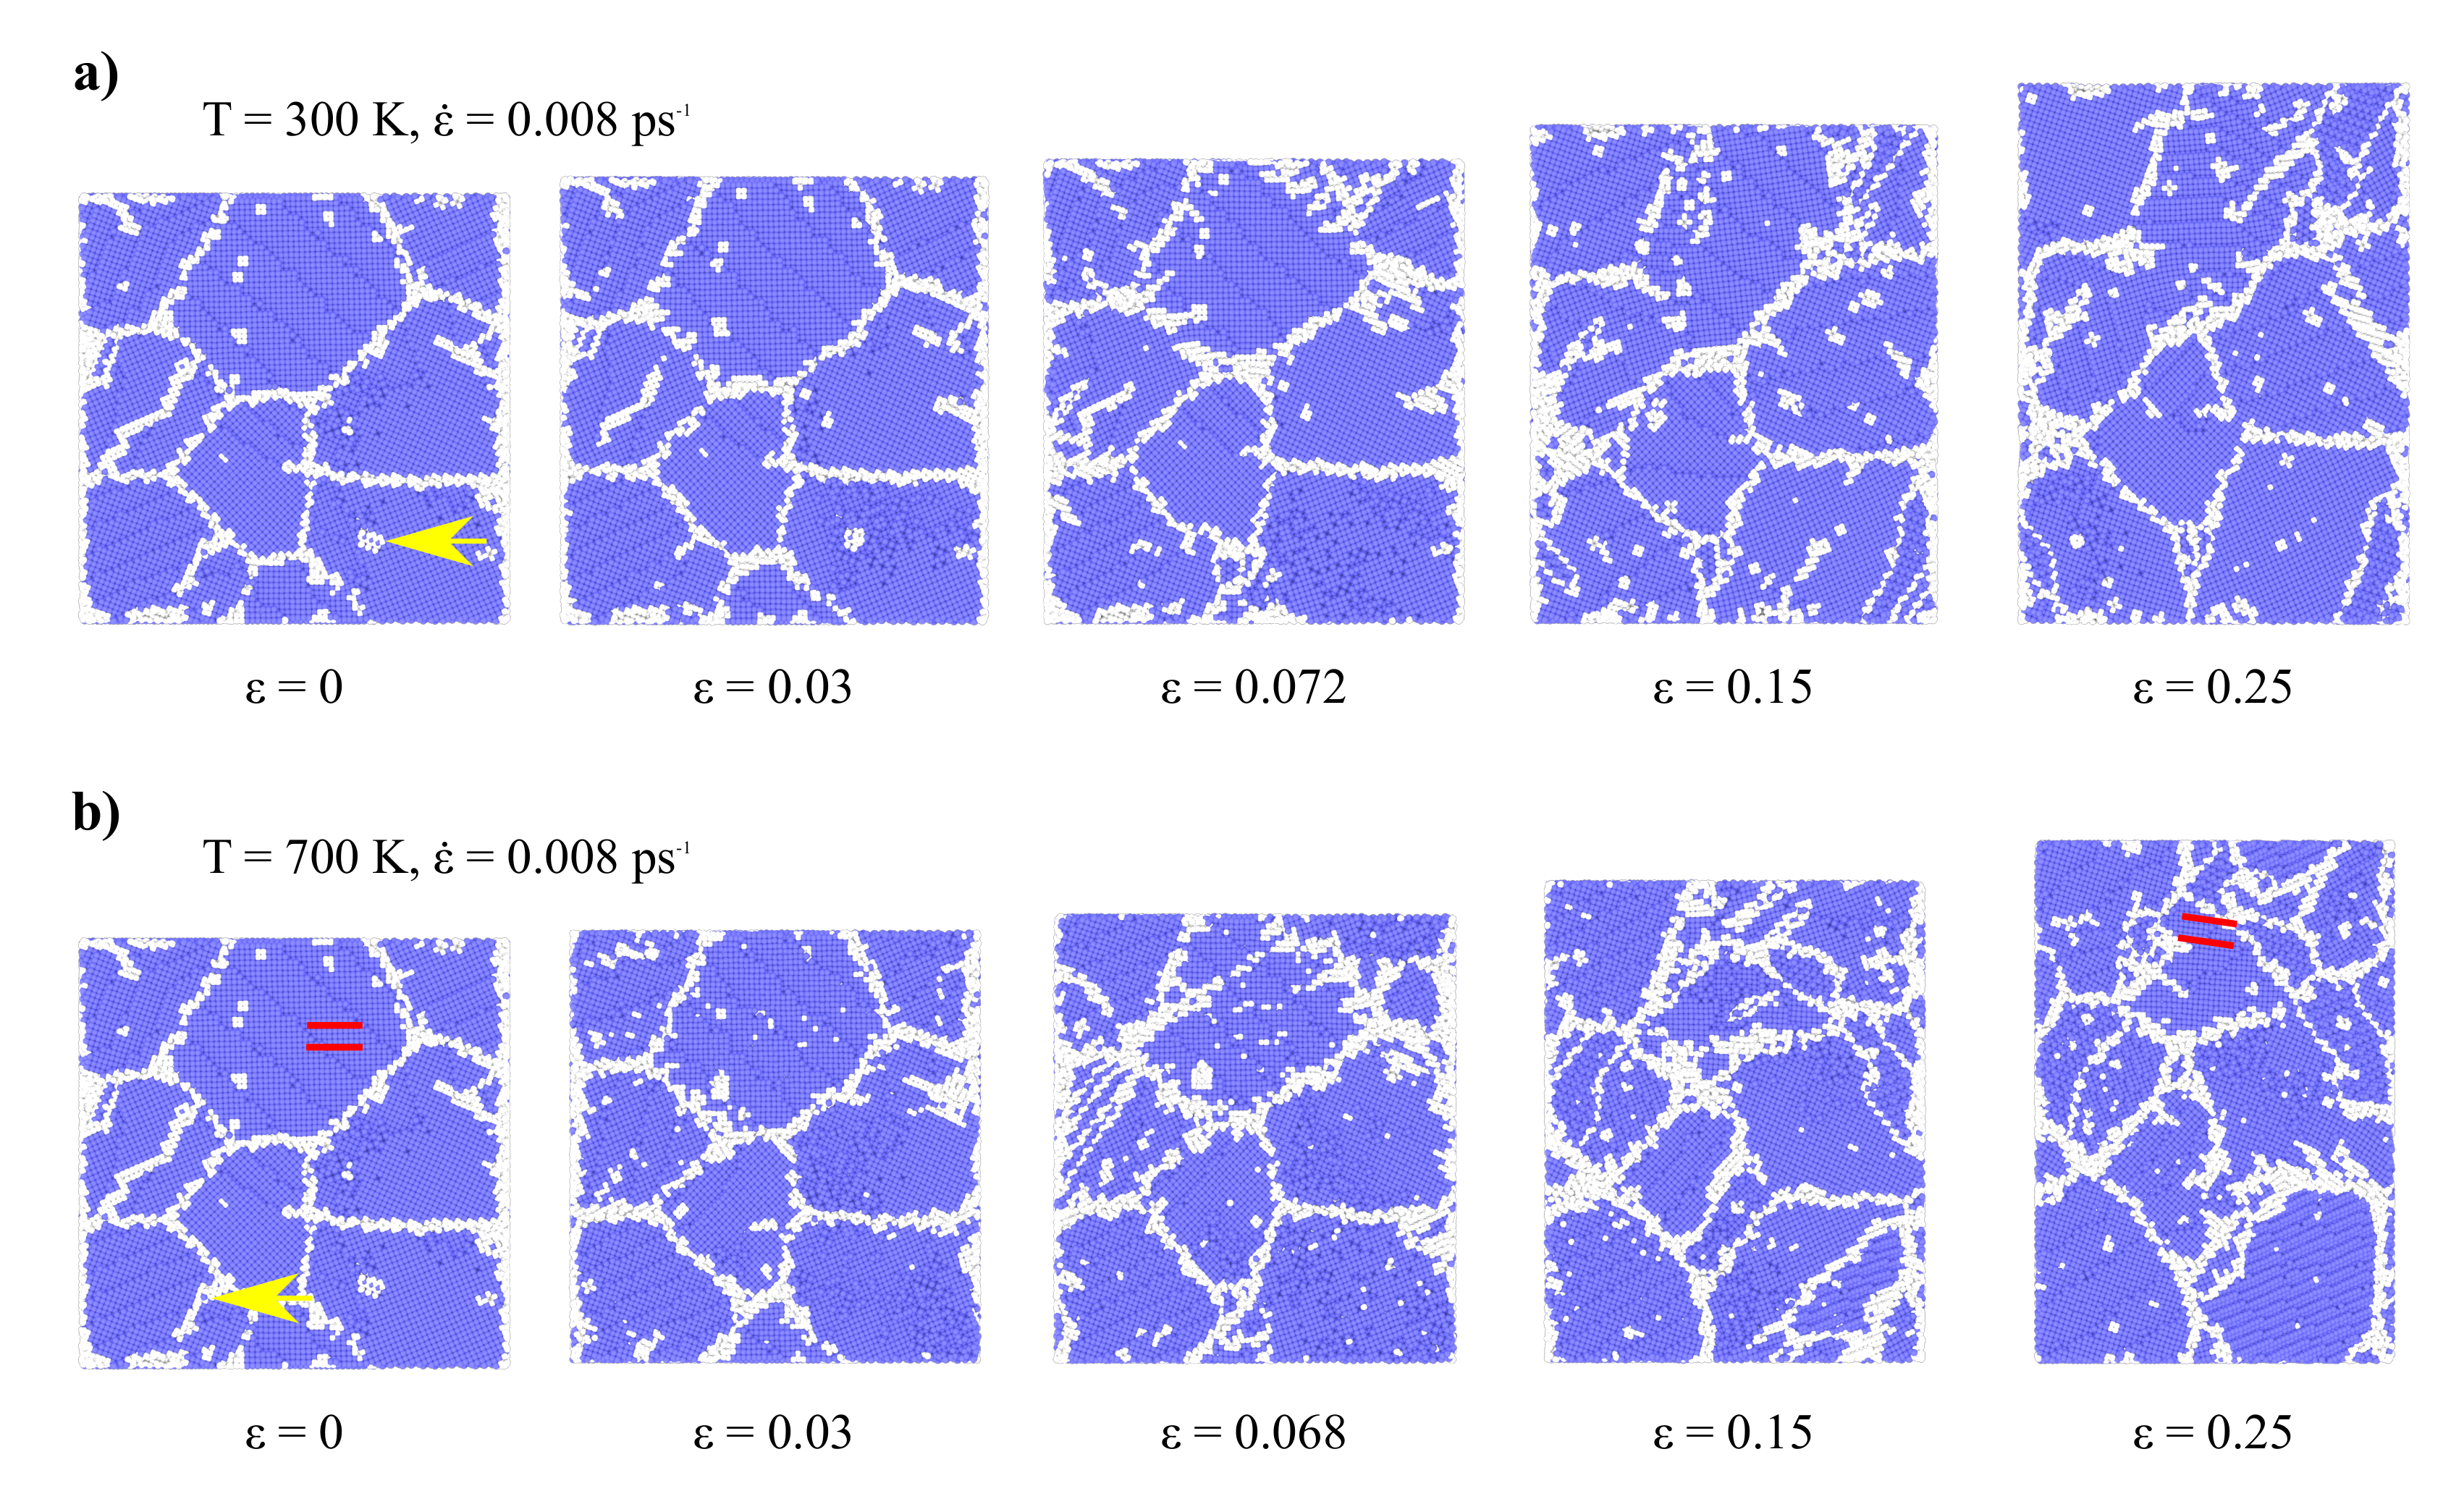
Figure 4.
Stress-strain curves at (a) different strain rates and (b) temperatures.
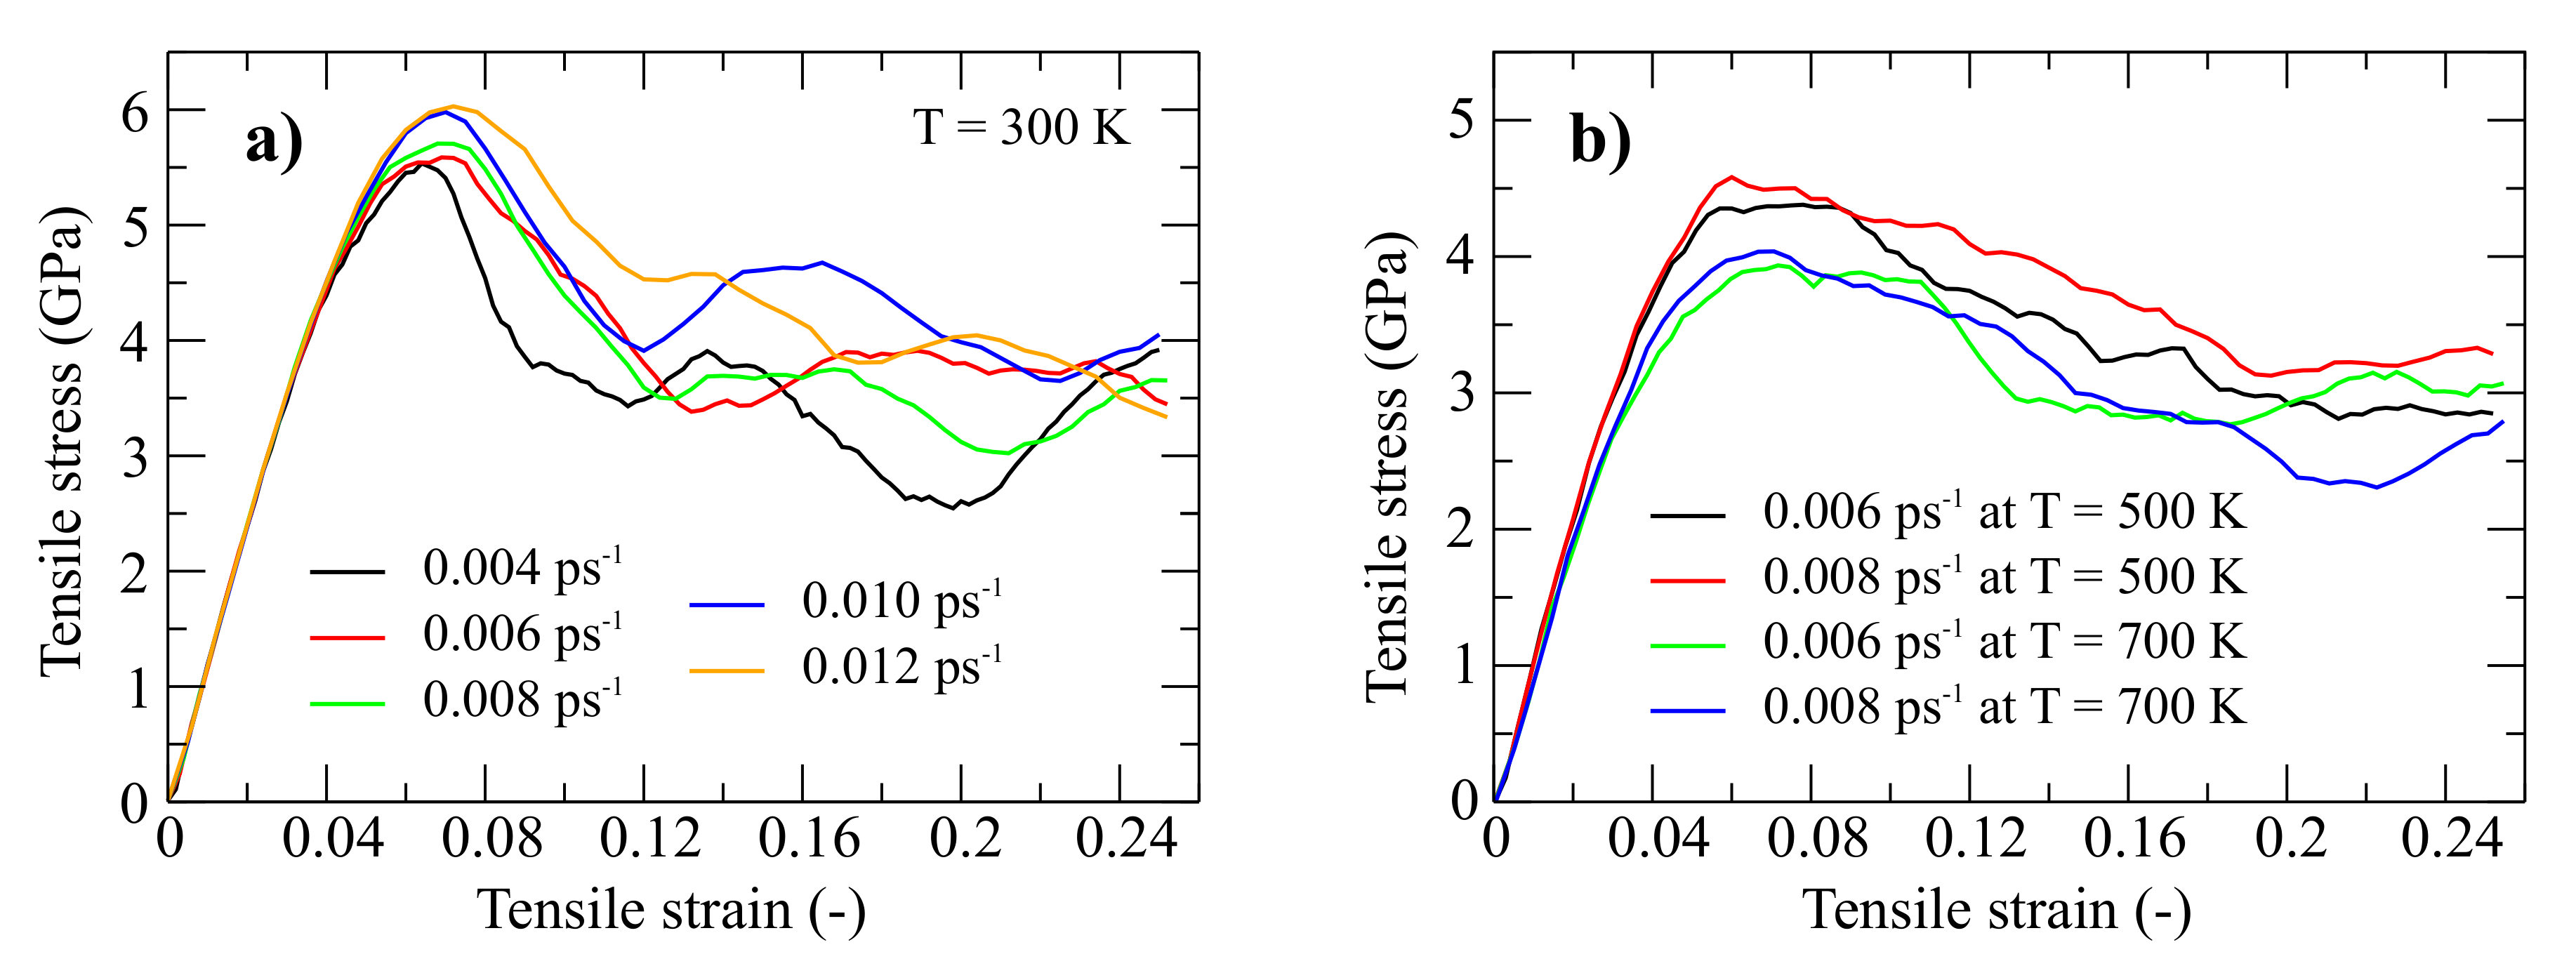
Figure 5.
Sanpshots of specimen with a hole during the tesile test.
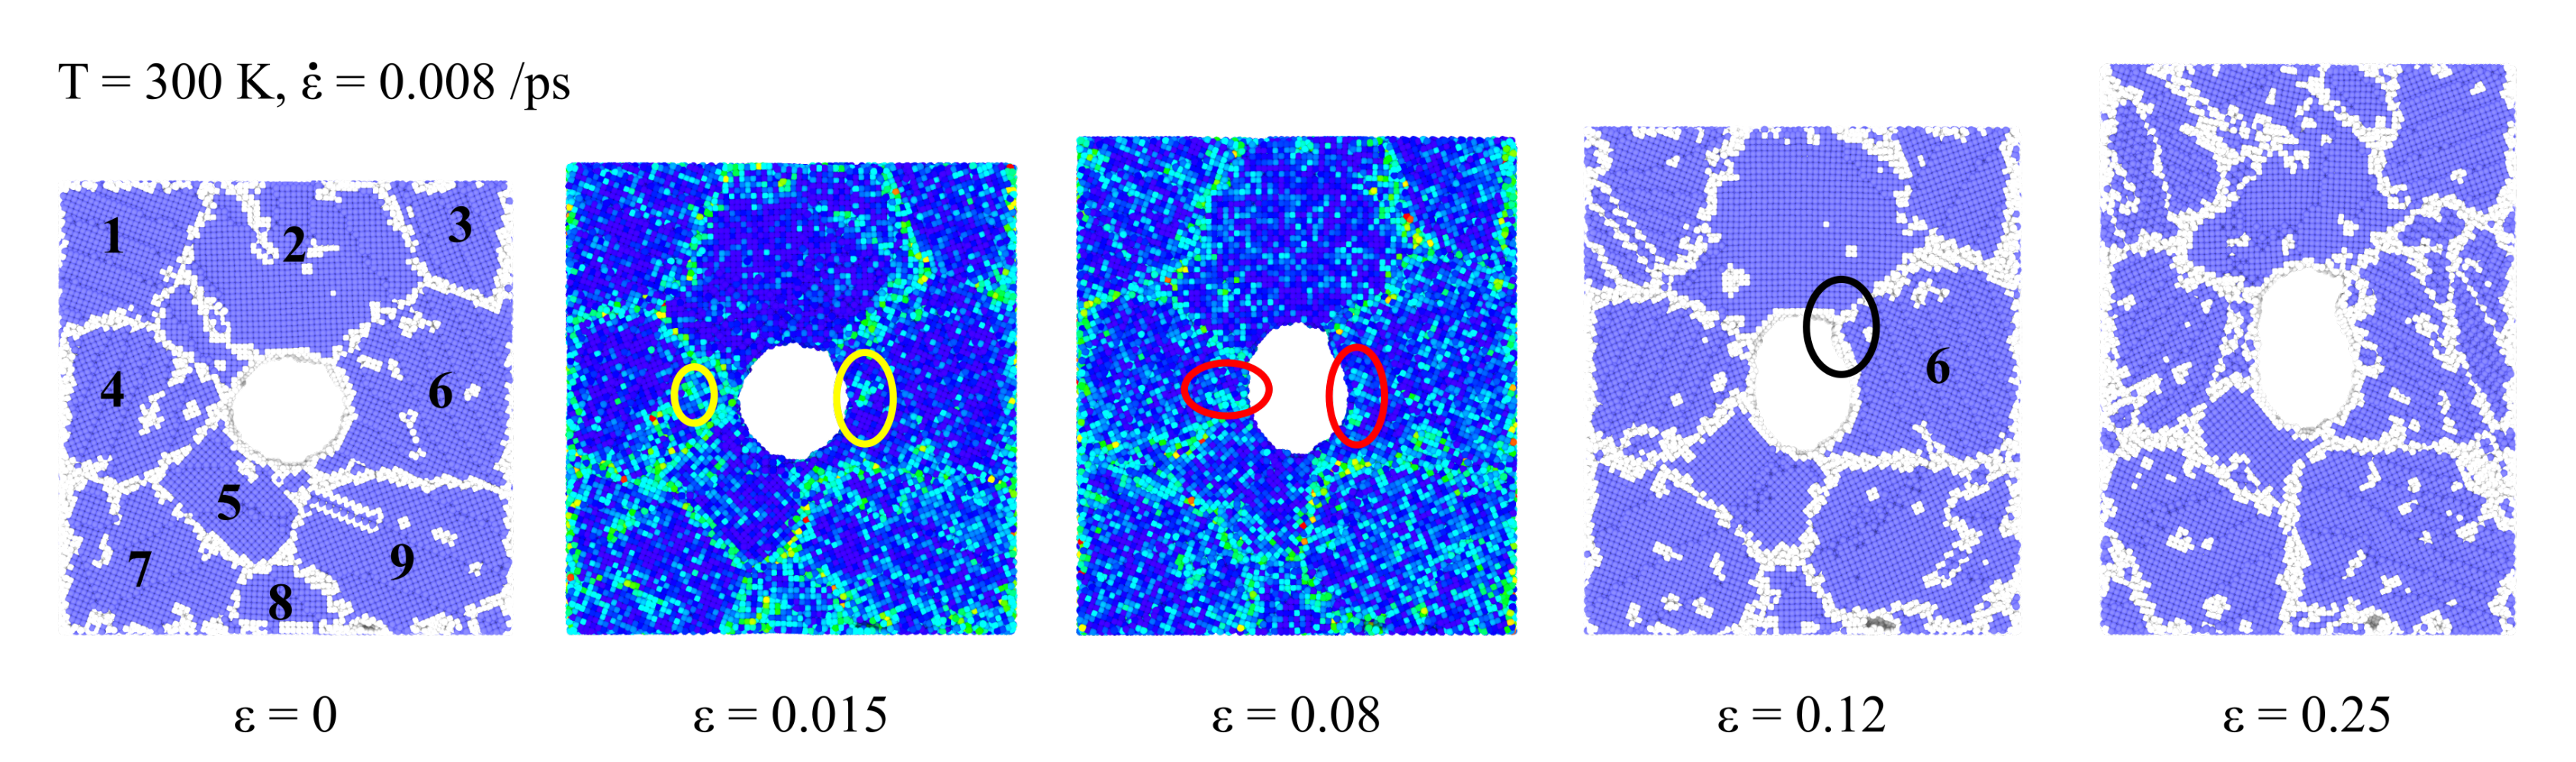
Figure 6.
Stress-strain curves for model with and without hole at the center.
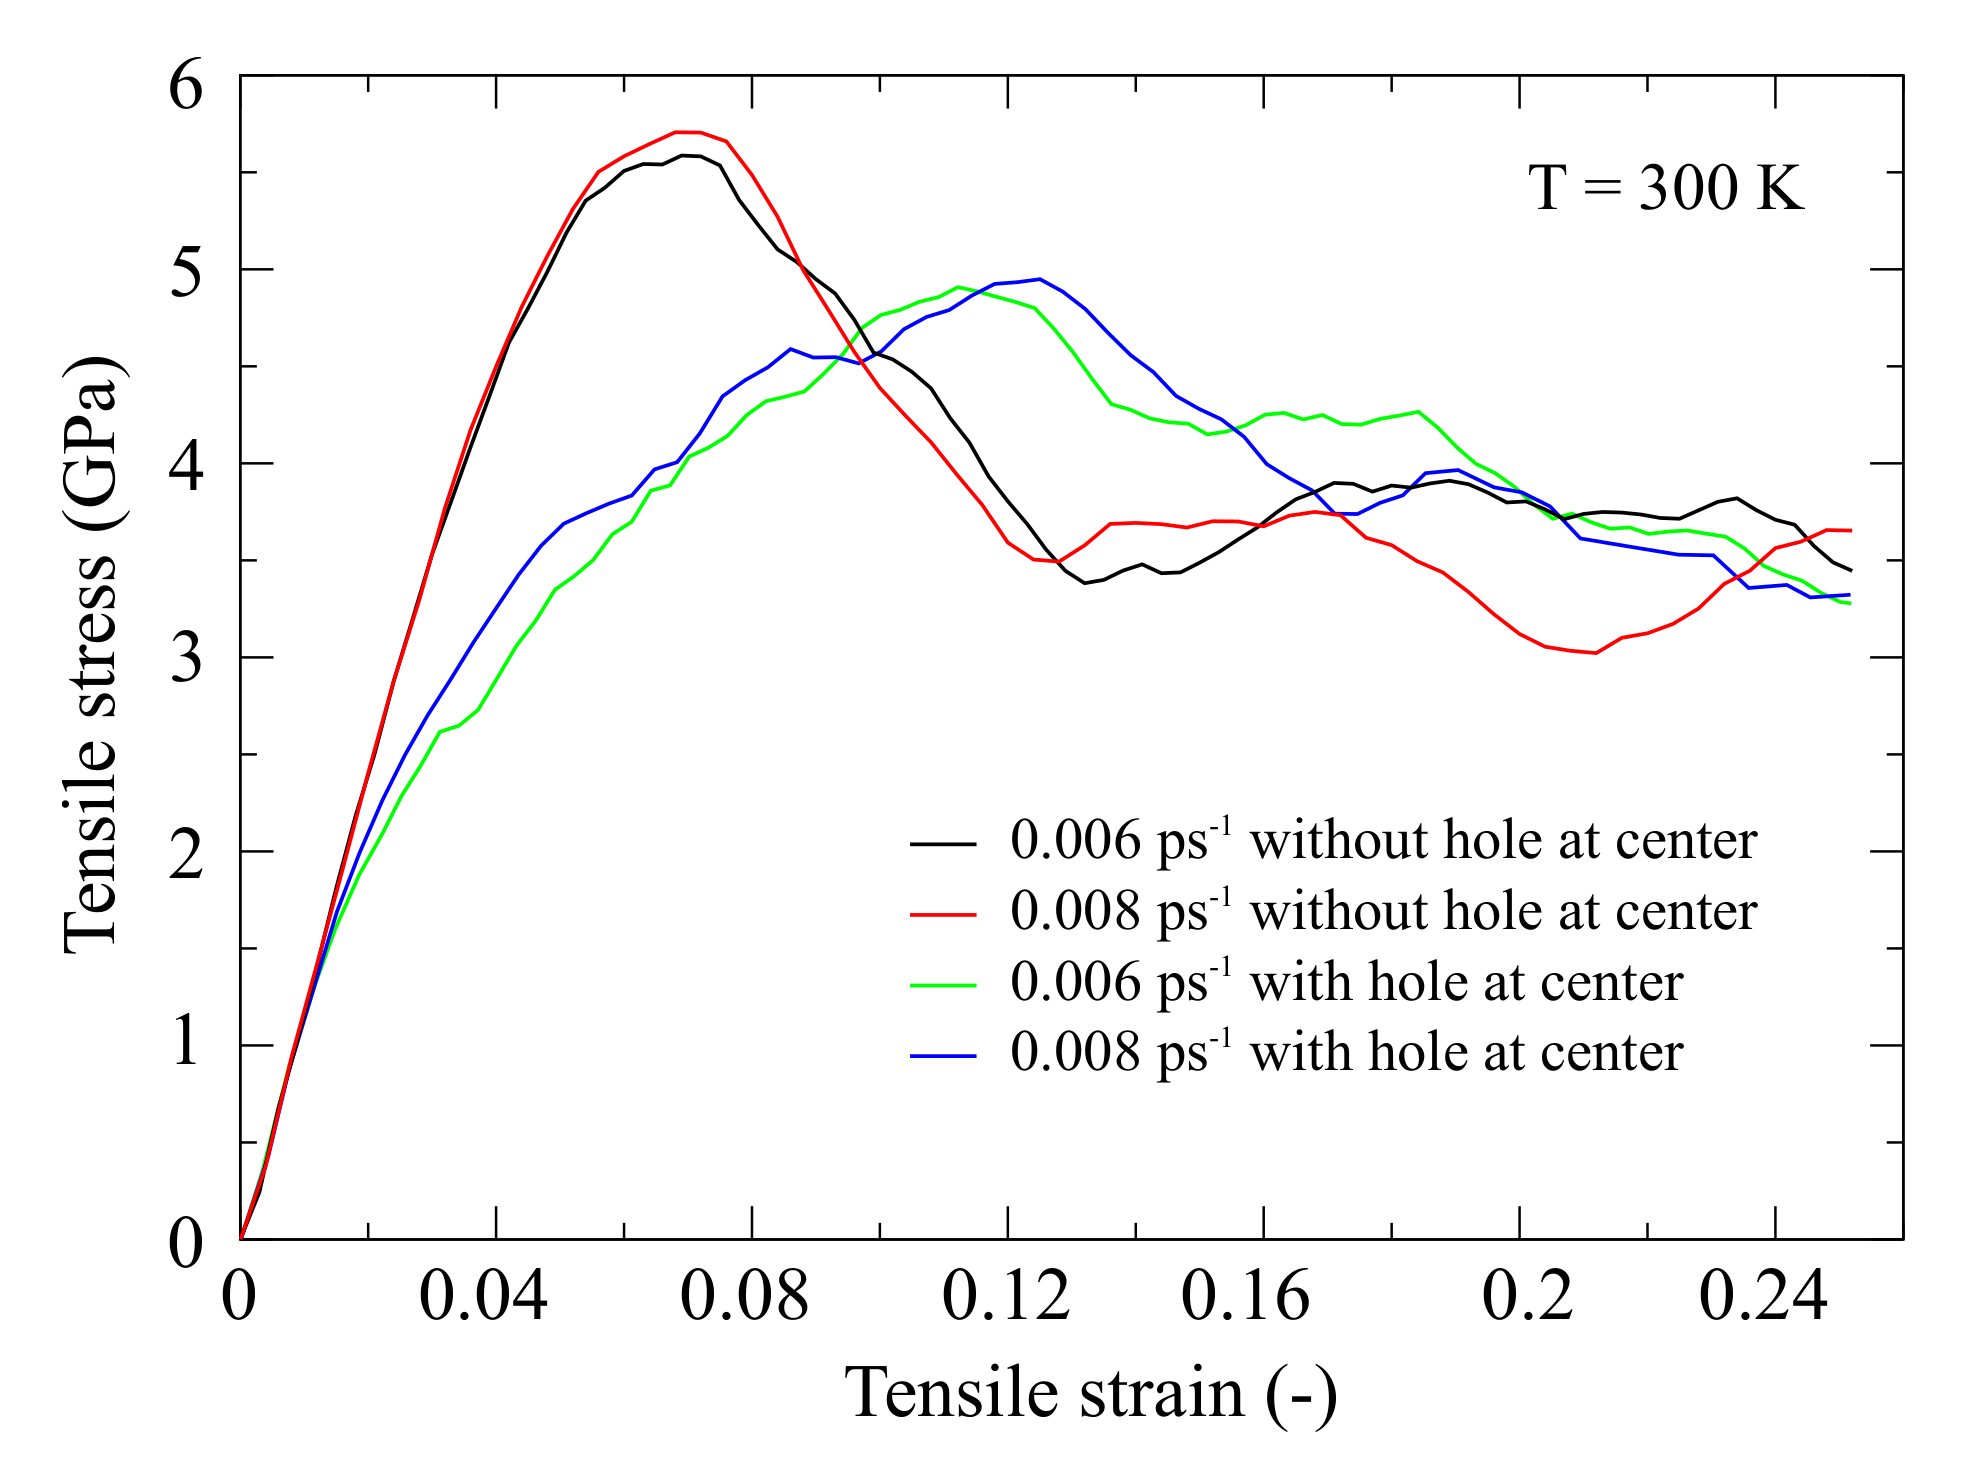
Figure 7.
Snapshots of the MD simulation model during shearing test.
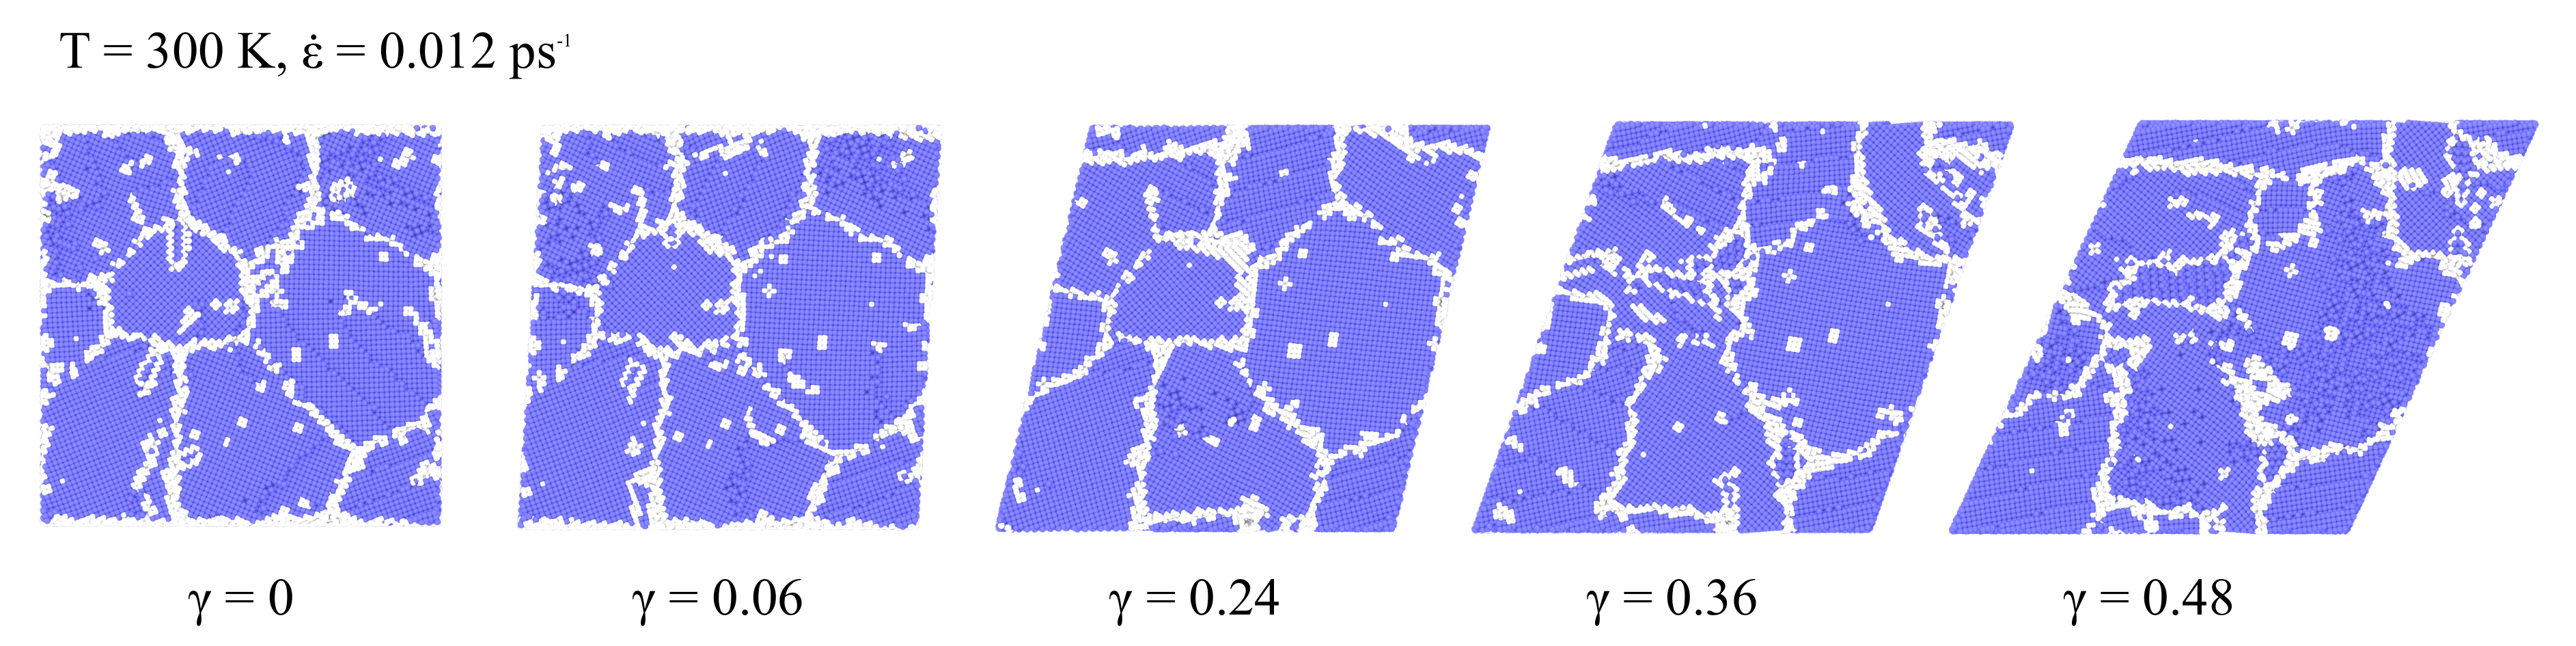
Figure 8.
Shear stress-strain curves at different strain rate loading.
© 2020 by the authors. Licensee MDPI, Basel, Switzerland. This article is an open access article distributed under the terms and conditions of the Creative Commons Attribution (CC BY) license (http://creativecommons.org/licenses/by/4.0/).
Share and Cite
MDPI and ACS Style
Herman, J.; Govednik, M.; Patil, S.P.; Markert, B. Molecular Dynamics Simulation Study of the Mechanical Properties of Nanocrystalline Body-Centered Cubic Iron. Surfaces 2020, 3, 381-391. https://doi.org/10.3390/surfaces3030028
AMA Style
Herman J, Govednik M, Patil SP, Markert B. Molecular Dynamics Simulation Study of the Mechanical Properties of Nanocrystalline Body-Centered Cubic Iron. Surfaces. 2020; 3(3):381-391. https://doi.org/10.3390/surfaces3030028
Chicago/Turabian StyleHerman, Jan, Marko Govednik, Sandeep P. Patil, and Bernd Markert. 2020. "Molecular Dynamics Simulation Study of the Mechanical Properties of Nanocrystalline Body-Centered Cubic Iron" Surfaces 3, no. 3: 381-391. https://doi.org/10.3390/surfaces3030028