Article

Cross-Dating in Archaeology: A Comparative Archaeomagnetic, Thermoluminescence and Radiocarbon Dating of an Ancient Kiln, Ceva, Northern Italy

by
Evdokia Tema
1,2,*,
Georgios S. Polymeris
3,
Marco Casola
4 and
Simone Giovanni Lerma
5
1
Dipartimento di Scienze della Terra, Università degli Studi di Torino, Via Valperga 35, 10125 Torino, Italy
2
CIMaN-ALP Alpine Laboratory of Palaeomagnetism, Via G.U. Luigi Massa 6, 12016 Peveragno, Italy
3
Institute of Nanoscience and Nanotechnology, NCSR “Demokritos”, Ag. Paraskevi, 15310 Athens, Greece
4
F.T. Studio S.r.l., Piazza San Domenico 2, 12016 Peveragno, Italy
5
Soprintendenza Archeologia Belle Arti e Paesaggio per le Province di Alessandria, Asti e Cuneo, Cittadella, Via Pavia, 15121 Alessandria, Italy
*
Author to whom correspondence should be addressed.
Heritage 2025, 8(9), 358; https://doi.org/10.3390/heritage8090358
Submission received: 17 July 2025 / Revised: 28 August 2025 / Accepted: 30 August 2025 / Published: 2 September 2025

Abstract

In this study, we present the dating results of an ancient kiln excavated near Ceva (Northern Italy) obtained through combined archaeomagnetic and thermoluminescence approaches. For archaeomagnetic dating, the full geomagnetic field vector (both direction and intensity) was determined. The archaeomagnetic direction was defined through stepwise alternating field demagnetization of in situ-oriented samples of baked clay, and the archaeointensity value was obtained through the Thellier–Coe protocol, including corrections for magnetic anisotropy and cooling rate effects. Thermoluminescence analyses were obtained individually on three samples, using the conventional multiple-aliquot, additive dose procedure. Archaeomagnetic dating was carried out twice, once using the directional results only and once using the full geomagnetic field vector. The independent dating provided by the thermoluminescence analysis was used for comparison, examining the added value of incorporating archaeointensity measurements alongside directional data. The new archaeomagnetic and thermoluminescence results were integrated with previously available radiocarbon dating, using Bayesian modeling for chronological reconstructions. Our results show that the use of archaeointensity in archaeomagnetic dating can be advantageous, better refining the dating. This multidisciplinary strategy underscores the significance of cross-dating in establishing robust chronological frameworks and highlights the crucial role of transdisciplinary methodologies in advancing and refining dating techniques in archaeology.

1. Introduction

Dating plays a crucial role in archaeology, particularly when historical records or age-diagnostic artifacts are absent. In such cases, laboratory-based scientific dating techniques become essential. Archaeological research has long benefited from a wide array of these methods, especially from the mid-20th century onwards, following World War II, when rapid advancements in physics and technology significantly improved the experimental protocols and the precision of such dating methods.
Radiocarbon and thermoluminescence (TL) are among the most widely used and well-established dating techniques in archaeology. These methods are particularly effective for dating ancient combustion structures, where charcoal is often preserved, and where high-temperature processes reset the TL signal to zero. Archaeomagnetic dating, though less widely known and relatively recent, has also shown strong potential in dating ancient kilns and has been successfully applied in the past [1,2]. While radiocarbon dating estimates the age of charcoal, typically resulting from incomplete wood combustion, TL and archaeomagnetic methods date the last firing of a structure, such as a kiln, effectively dating the time of its final use [3,4]. Each of these techniques relies on the ability to precisely measure a physical quantity that changes over time, and each one depends on a specific event that sets a “time-clock” to zero.
Thermoluminescence is one of the most widely recognized and effective techniques for dating heated or burnt materials [5,6,7]. TL dating determines the time elapsed since crystalline minerals in a material were last heated to high temperatures, as occurs in ceramics and combustion structures, or last exposed to sunlight, as in sediments or sun-dried clays. Two physical quantities are essential for TL dating: the total accumulated radiation dose over time, known as the paleodose or equivalent dose (ED, measured in Gy), and the annual dose rate (DR, measured in Gy/ka or mGy/a), which reflects the rate of energy accumulation. The age of the sample is calculated by dividing the paleodose by the annual dose rate.
Archaeomagnetic dating, on the other hand, is based on the property of certain minerals to acquire remanent magnetization when heated, recording the Earth’s magnetic field at the time of their last firing [4]. These magnetic signatures, preserved in rocks, clays, and soils, and often in archaeological ceramics and baked clays, can be analyzed to reconstruct the geomagnetic field’s direction and/or intensity at the time of heating. Archaeomagnetic dating is obtained by comparing this magnetic information with reference to secular variation (SV) curves that document changes in the Earth’s magnetic field over time. This technique has been considerably refined in recent decades, with the development of high-resolution SV curves for several countries, and the establishment of geomagnetic field models at both regional and global scales. Most archaeomagnetic studies focus on in situ fired features, such as kilns, ovens, hearths, furnaces, and burnt floors, typically using the geomagnetic direction. However, applications based on geomagnetic intensity or the full field vector remain relatively rare [8,9,10], mainly due to the complexity and low success rate of archaeointensity experiments and the limited availability of reliable intensity SV curves.
In recent years, archaeomagnetic dating has become a valuable tool not only when traditional dating methods are unavailable or unsuitable but also because it allows for the direct dating of the structure itself, rather than associated materials. Notably, both TL and archaeomagnetic dating aim to date the same event: the last high-temperature firing of the artifact or structure. In contrast, radiocarbon dating targets the age of the wood from which the charcoal was formed, i.e., the time of tree cutting, which may not coincide exactly with the last use of an ancient combustion structure. Each technique, however, has its specific advantages and limitations, influenced by factors such as material availability, sample characteristics, preservation conditions, and the chronological range. When feasible, comparing and combining the results obtained from independent dating methods yields undoubtedly a more precise and robust chronological framework [11,12,13,14].
In this study, we present a cross-dating analysis of an ancient kiln excavated in Ceva, Northern Italy, by integrating new archaeomagnetic and thermoluminescence dating results with one previously obtained radiocarbon date and archaeological evidence. The inclusion of independent TL dating allowed us to evaluate the added value of incorporating archaeointensity data into archaeomagnetic analyses, alongside directional information. To our knowledge, this is the first study to successfully combine three entirely independent laboratory dating techniques applied to material from the same combustion structure. Our findings emphasize not only the benefits of cross-dating for establishing reliable chronological results but also the vital role of interdisciplinary approaches in enhancing dating methodologies.

2. Materials and Methods

2.1. Archaeological Site and Sampling

During the construction of a new rest area along the A6 Torino–Savona highway in Ceva (CN), in the locality of Mollere (44.37° N, 8.05° E), the remains of an ancient production site were identified approximately 0.6 m below ground level. The archaeological excavation, conducted by F.T. Studio s.r.l. under the direction of the Soprintendenza ABAP-AL (Ministry of Culture), revealed a complex comprising a rectangular kiln and a small service room with a square plan and a pebble foundation [15]. The kiln remains allowed for the identification of a combustion chamber (measuring 12.4 m in length and 4.3 m in width) and a praefurnium (measuring 4 m in length and 1–1.9 m in width), both carved into the natural clay layer of the hillside. The combustion chamber was divided longitudinally into two corridors by a central septum. A set of five pillars, which originally supported as many arches, is still visible (Figure 1a). The perforated baking floor, most likely resting on these arches, was not preserved, although some collapsed fragments were found within the kiln. The praefurnium, located north of the combustion chamber, had a funnel shape and a lowered canopy cover. Abundant charcoal remains, likely from the last firing, were discovered on the highly heat-altered, bluish-gray kiln floor. The kiln was excavated and shaped directly in the unfired clay, as evidenced by visible finger impressions left by its builders along the walls. Structural solidity was achieved through heat-induced hardening. The characteristics of the structure correspond to a typology used in the Italic region during the Roman era, dating back to the Republican period (V–I century BC) [16], type II c. Unfortunately, only seven non-diagnostic sherds of coarse pottery were found within the destruction layers: the presence of traces of pitch inside some of them may be linked to a ceramic typology attested in the area between the Late Iron Age (“Ligurian III C”, 250–125 BC) [17] and the beginning of Roman penetration in this part of Piedmont (II–I century BC) [18]. In the same layer of destruction that filled the kiln combustion chamber, a bronze coin was also found. Although illegible, the weight and dimensions of the coin are probably attributable to a semi-uncial republican triens, minted between 91 and 82 BC or, alternatively, to non-Roman issues that can be dated between 130 and 90 BC [15]. Therefore, based on the general production context, the kiln can be archaeologically attributed to the late Republican period: the site bears witness to the presence of a Roman settlement along a communication route that connected the inland areas of Piedmont with the Ligurian coast at Vada Sabatia (modern-day Vado-Savona), a likely southern branch of the Via Fulvia, constructed around 125 BC [19].
For this study, a total of 22 samples of baked clay were collected: 17 from the main combustion chamber and 5 from the praefurnium. To be able to use the samples for archaeomagnetic directional analysis, all samples were oriented in situ with both a magnetic and a solar compass and an inclinometer. Sampling was performed either with the plaster of Paris, used to create a flat orientation surface, or with gluing small plastic disks on the baked clay (Figure 1b,c). Three of these samples were used for TL analysis. One charcoal sample was also extracted from the praefurnium (US29) and used for radiocarbon dating at the CEDAD Laboratory in Lecce, Italy.

2.2. Archaeomagnetic Analysis

Archaeomagnetic analyses were conducted at the ALP-CIMaN Palaeomagnetic Laboratory in Peveragno, Italy. The magnetic mineralogy of representative samples was examined using isothermal remanent magnetization (IRM) acquisition curves, obtained with an ASC pulse magnetizer, which applied IRM at increasing magnetic fields up to 1 T. A JR6 spinner magnetometer (AGICO) was used to measure the remanent magnetization after each IRM step.
The archaeomagnetic direction was determined through stepwise alternating field demagnetization, performed up to a peak field of 100–120 mT using a D2000 demagnetizer (ASC Scientific, Narragansett, RI, USA). The demagnetization results were plotted on orthogonal projection diagrams [20], and the direction of the Characteristic Remanent Magnetization (ChRM) for each sample was calculated using principal component analysis with Remasoft 3.0 software [21].
Archaeointensity was assessed using the classical Thellier method, as modified by Coe [22,23]. Samples were subjected to multiple zero-field and in-field heating and cooling steps in aTD-48 furnace (ASC Scientific, USA), up to a maximum temperature of 500–530 °C. During the in-field steps, a laboratory field of 60 μT was applied during both heating and cooling. To monitor potential mineralogical alterations, additional partial thermoremanent magnetization (pTRM) checks were performed every two experimental temperature steps. The effect of magnetic anisotropy on the thermoremanent magnetization (ATRM) was also investigated through the acquisition of six additional TRM in six different directions (+x, −x, +y, −y, +z, −z) in order to define the ATRM tensor. Finally, the cooling rate dependence of TRM acquisition was estimated by applying three additional in-field heating steps: one with rapid cooling time of around 45 min, one with slow cooling time of around 6 h, and one more with rapid cooling time of around 45 min. From these three steps, we obtained the correction factor for the effect of cooling rate upon TRM intensity, and the alteration factor used to estimate changes in the TRM acquisition capacity of the specimens during the cooling rate protocol. Archaeointensity results were plotted in Arai diagrams and analyzed using the Thellier Tool v.4.22 software [24].

2.3. Thermoluminescence Analysis

TL analyses were carried out at the Nuclear Physics Laboratory of the Physics Department, Aristotle University of Thessaloniki, Greece. ED was calculated using the multigrain, multiple-aliquot, additive dose thermoluminescence procedure (MAAD TL), as described in [5,7,25]. Handling and pretreatment of the samples were performed in subdued red-light conditions. Grains of dimensions within the range between 4 and 12 μm were suspended in acetone and finally precipitated onto 1 cm diameter aluminum discs according to [26]. The chemical protocol suggested by [27] was applied, following mechanical treatment. A 5% water content was used for the calculation of the dose rate.
All TL measurements were performed by means of a Littlemore-type 711 setup, with a PM tube (EMI 9635QA bialkali; Sb K-Cs), a thermocouple-type 90/10 Ni/Cr and 97/03 Ni/Al, and a heat filter transmitting in the 320–440 nm range. In all cases, for beta doses, a 90Sr/90Y beta source delivering 1.72 Gy/min at the sample position was used. All TL measurements were performed in a nitrogen atmosphere up to a maximum temperature of 500 °C at a constant heating rate of 2 °C/s. Three different additive doses were used, namely, 7, 14, and 20 Gy. Only linear fittings were used in the present approach. Equivalent doses were calculated with 1σ error values. Errors were mainly derived from the uncertainties in curve fitting and were calculated by standard error propagation analysis.
The annual dose rate was calculated based on the decay rates of naturally occurring radionuclides inside the clay matrix, namely, potassium (40K), thorium (232Th), and natural uranium (235U and 238U), along with cosmic rays. Uranium and thorium concentrations (in units of parts per million, ppm) were estimated using thick source alpha counting [28,29], while the potassium concentration (in %) by using Scanning Electron Microscopy coupled with Energy Dispersion X-ray (SEM-EDX) analysis [30]. Dose-rate calculations were made using the conversion factors of [31]. Only the clay matrix was measured for the dose rate calculations.

3. Results

3.1. Direction and Archaeointensity Determination

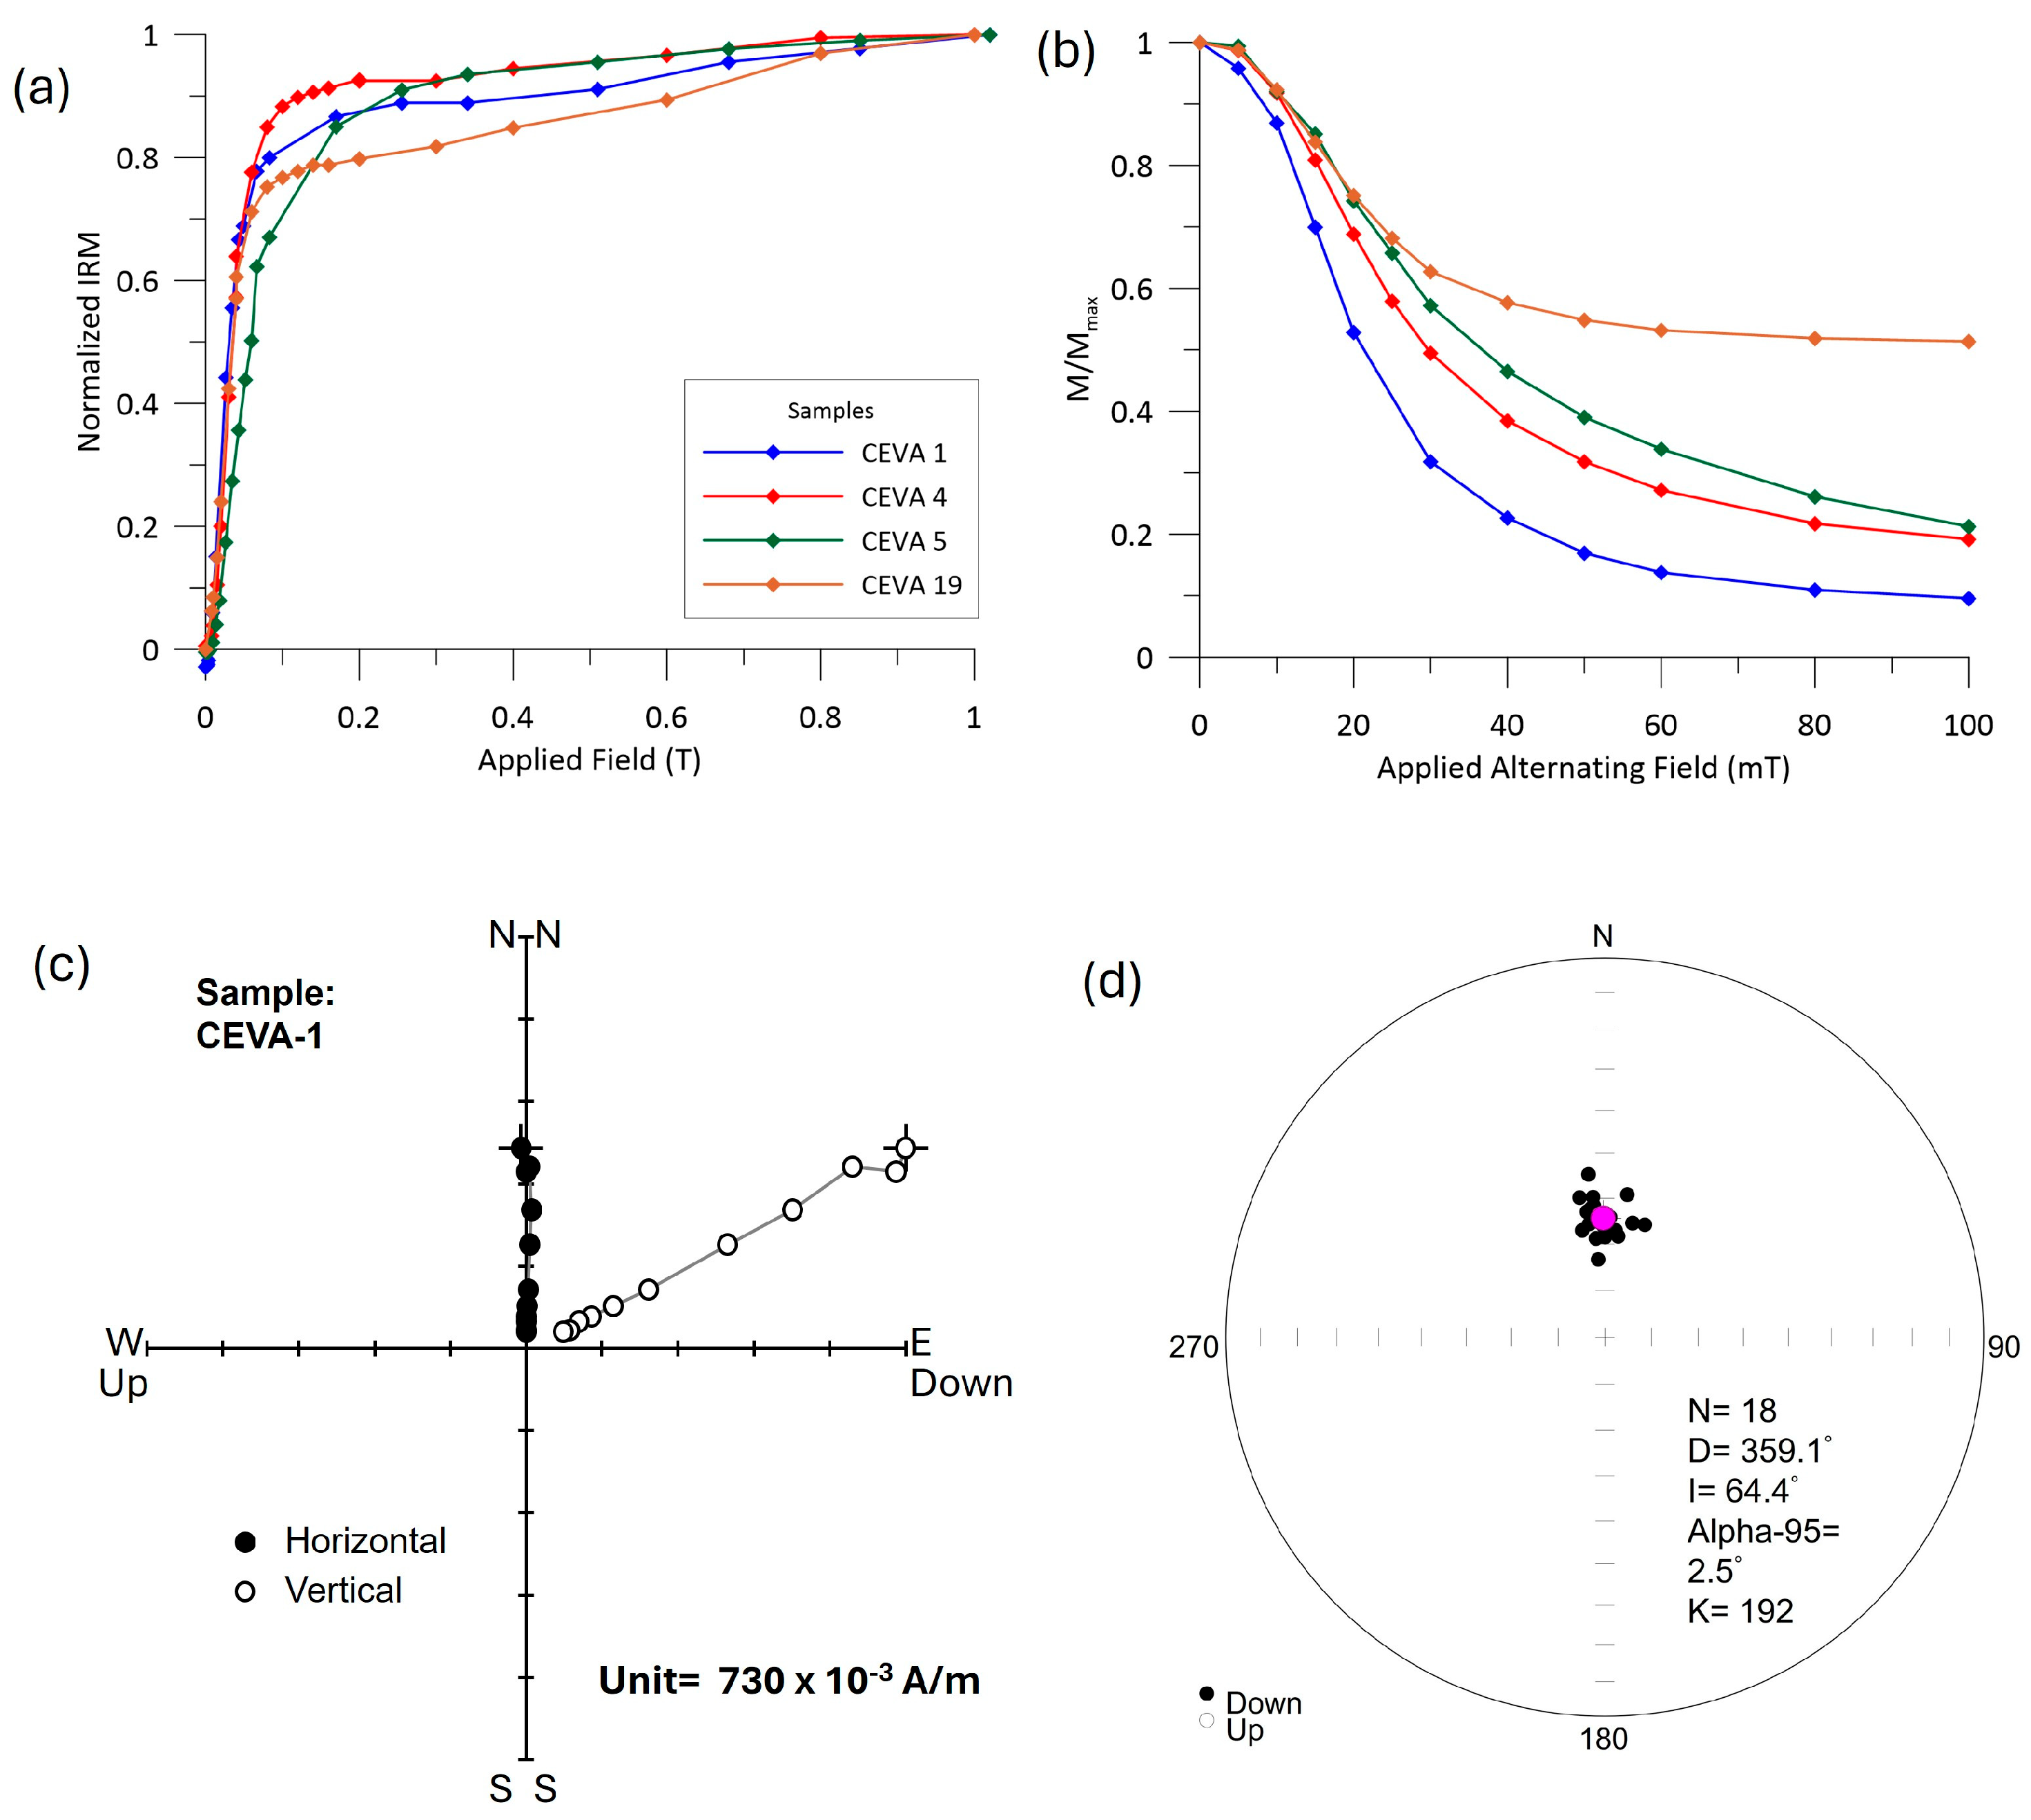
Magnetic mineralogy investigated through stepwise IRM curves shows the presence of low coercivity minerals, most probably magnetite and/or Ti-magnetite, together with a contribution of high-coercivity minerals, most probably hematite. These results are further confirmed by the intensity decay curves obtained through stepwise AF demagnetization, which show that about 70 to 80% of the Natural Remanent Magnetization (NRM) is canceled at applied fields of 100 mT, while in some cases (e.g., sample 19) an important portion of the NRM is not demagnetized (Figure 2a,b). In general, almost all samples show a very stable and easily isolated ChRM, with linear and well-defined Zijdelveld diagrams (Figure 2c). The mean ChRM direction, calculated from 18 independently oriented samples, is D = 359.1° I = 64.4 °, alpha-95 = 2.5°, and precision parameter k = 192 (Figure 2d).
Archaeointensity results show generally well-defined and linear Arai plots, with successful pTRM checks (Figure 3). From the 17 specimens investigated, coming from 6 independent samples (generally three specimens per sample were investigated), 15 gave successful archaeointensity determinations. Archaeointensity values at the specimen level were accepted only when the linear segment in the Arai plots was defined by more than four points (N > 6), quality parameter q was higher than five (generally q > 15), and no clear magnetomineralogical alteration was observed. All results were corrected for anisotropy and cooling-rate effects. The application of these corrections resulted in a reduction in the initial archaeointensity value by approximately 10%, underscoring their significance in ensuring the reliability and accuracy of archaeointensity determinations. The final mean archaeointensity value for the kiln calculated after the cooling rate and anisotropy corrections, based on the mean values of the six independently collected samples, is F = 61.6 ± 3.7 µT. The detailed archaeointensity results, at both specimen and sample levels, are given in the Supplementary Materials (Table S1).

3.2. Archaeomagnetic Dating

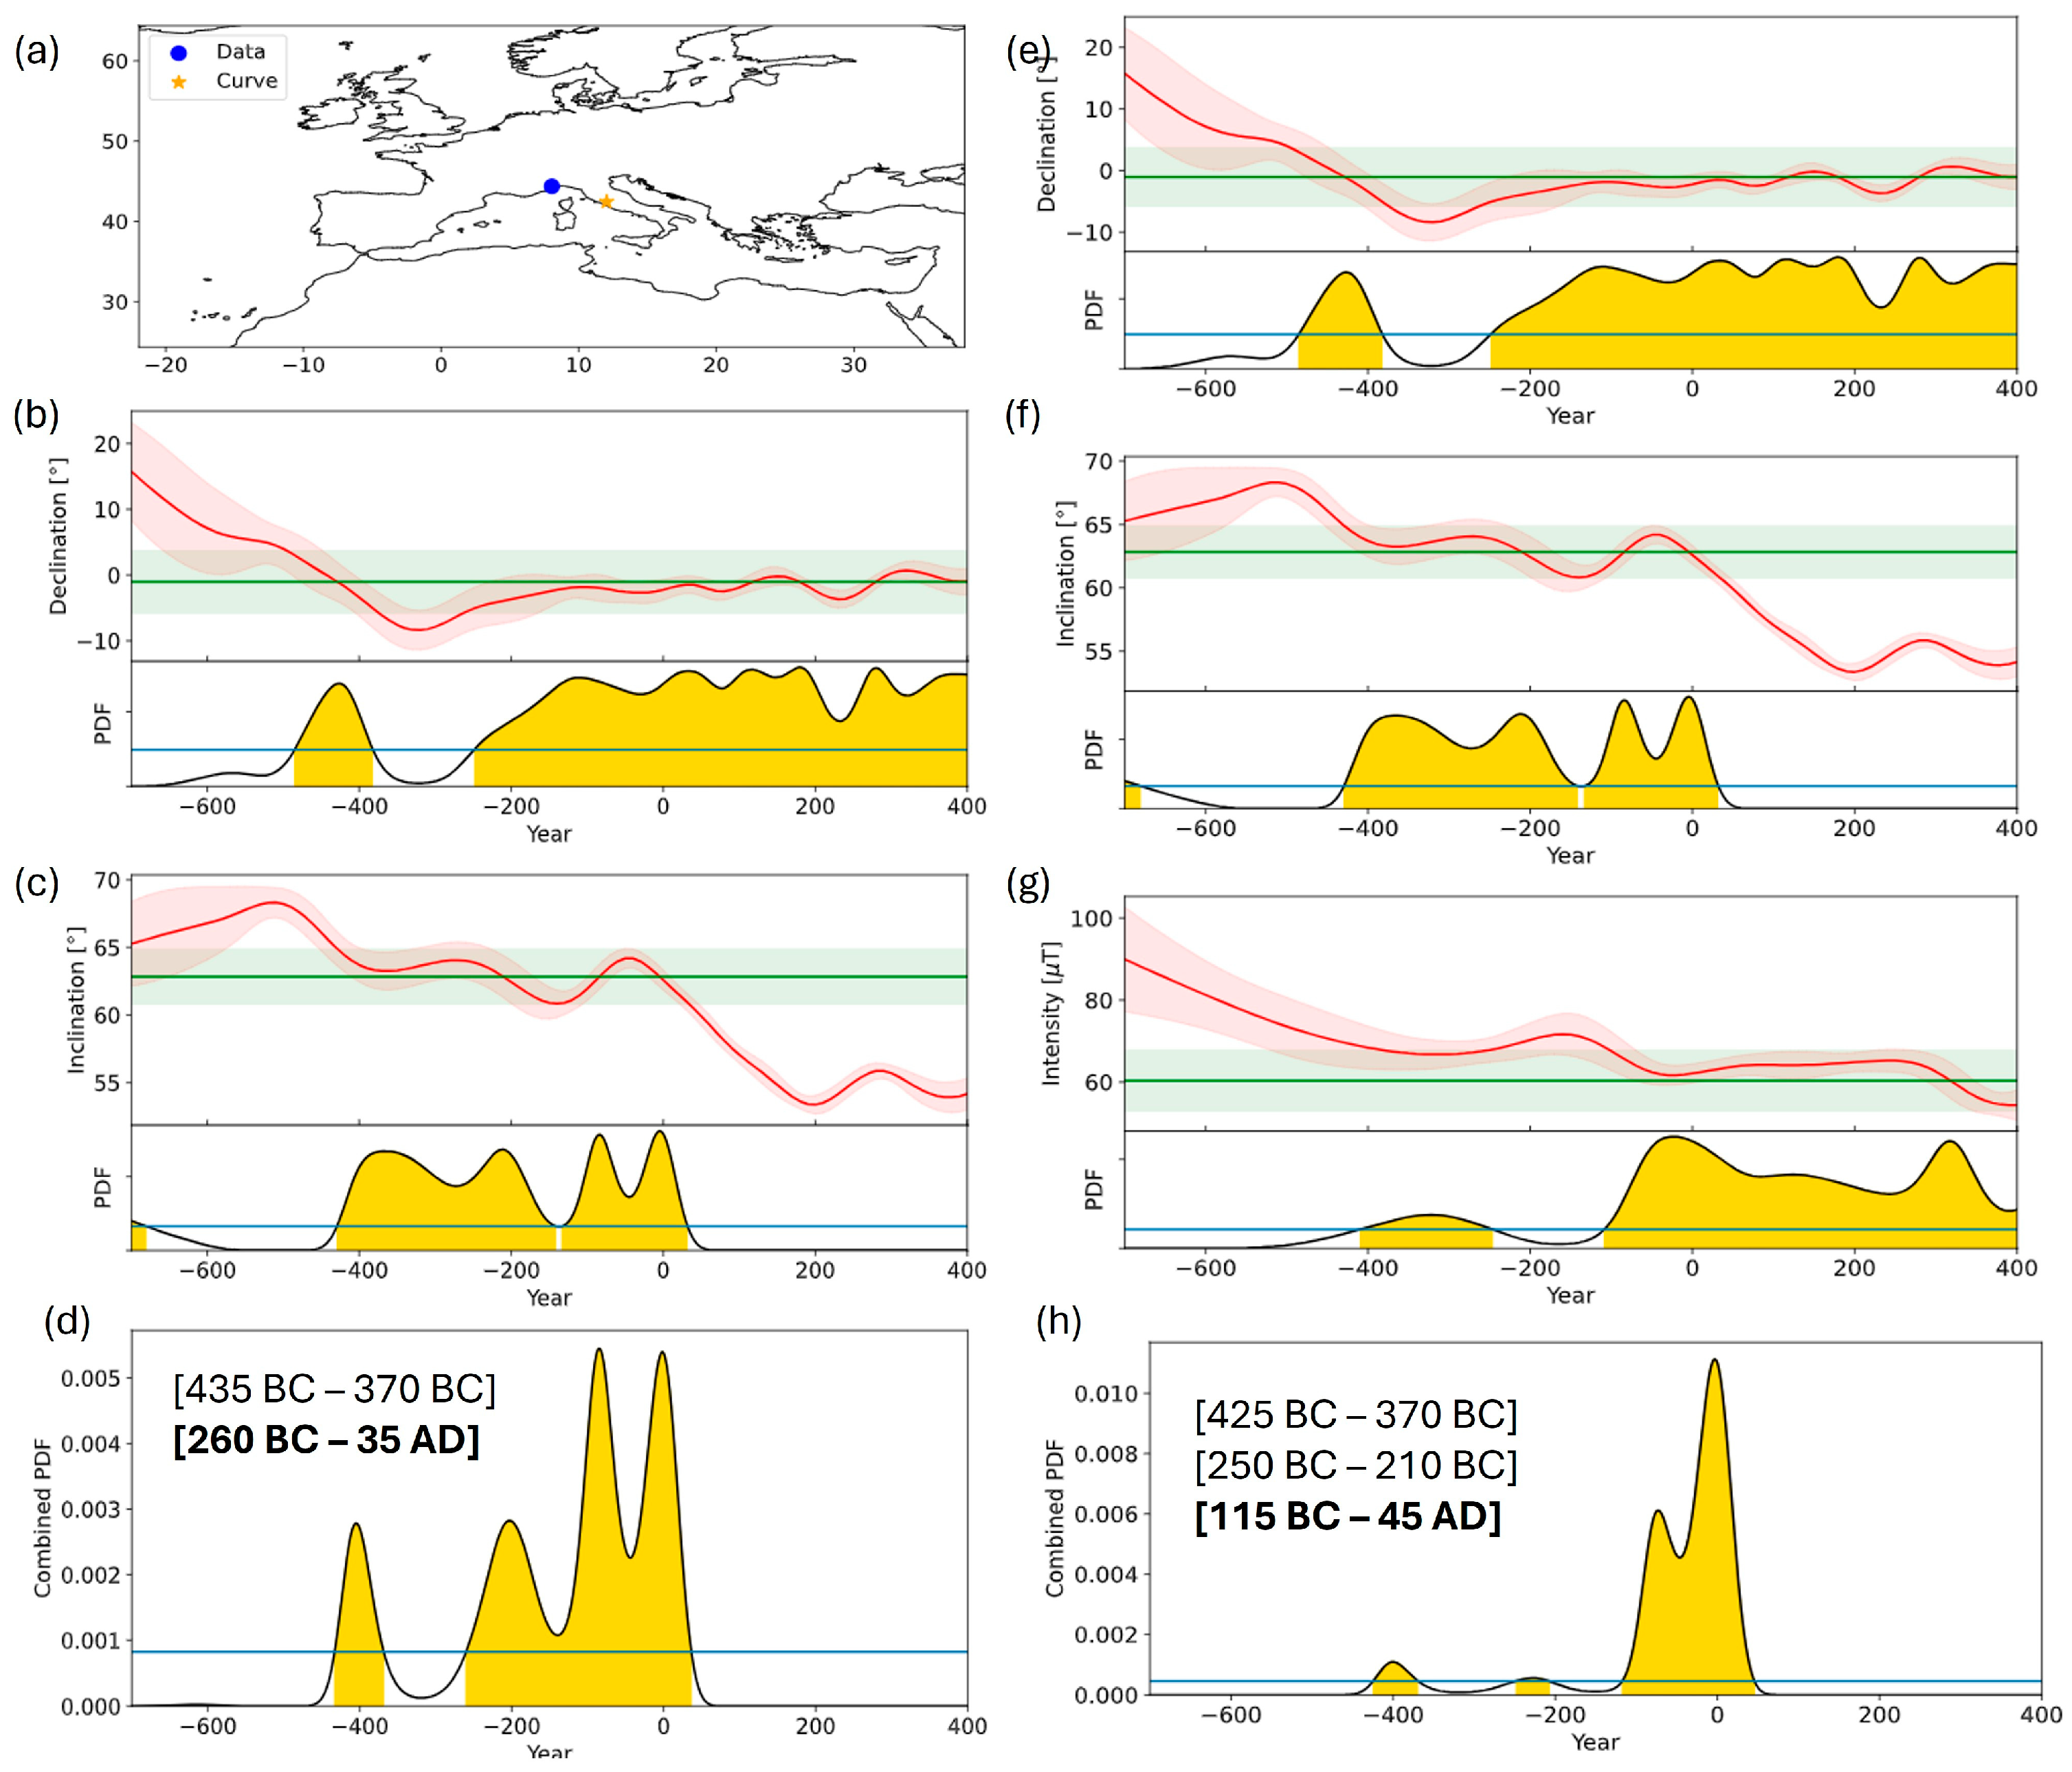
Archaeomagnetic dating of the last firing of the Ceva kiln was obtained using the ArchaeoPyDating tool [32], which is an online, open-access web-based interface that allows the comparison of the experimentally determined directional and intensity values from the investigated material with a reference SV curve available for a certain geographical area. In this study, we calculated a temporal probability density separately for each geomagnetic field element (declination, inclination, and intensity), after comparison with the most recently published Italian secular variation curve [33], calculated at the locality of Viterbo (Figure 4a). Archaeomagnetic dating was conducted twice: first using only directional data, and then using the full geomagnetic vector (combining both direction and intensity). Comparison of the directional data with the Italian SV curves [33] yielded two possible age intervals at a 95% probability level: 435–370 BC and 260 BC–35 AD (Figure 4b–d). Based on the stratigraphy and the available archaeological evidence, which suggests a late Republican period for the findings, the earlier interval can be confidently excluded, suggesting that the final firing of the Ceva kiln most likely occurred between 260 BC and 35 AD. Dating was then repeated for a second time, this time incorporating the full geomagnetic vector (direction and intensity). This yielded a better constrained chronological range, placing the last use of the kiln in a very narrow and well-defined time interval, between 115 BC and 45 AD (35 BC ± 80) (Figure 4e–h).

3.3. Thermoluminescence Dating

TL results for the three independent samples are reported in Table 1. TL glow curves and a typical plot of ED against glow curve temperature for representative samples are shown in Figure 5. In all cases, ED plateaus are wide enough, over 105 °C wide (Figure 5a and Table 1). Linearity was established using the slope curve S over the entire TL glow curve temperature region [25], as clearly seen in both insets of Figure 5b. The equivalent doses were obtained as the mean values of the best plateaus for each sample. The calculated ages for the three samples investigated are very consistent among each other, providing an average age of 137 BC to 181 AD, at 95% probability. Insignificant fading (<1%) was detected over a period of one month.

4. Discussion and Conclusions

One of the unique strengths of comparing TL and archaeomagnetic dating results lies in their ability to independently date the same physical event, which corresponds to the last high-temperature firing of a structure or object. This overlap is especially valuable in fired archaeological structures, such as the kiln investigated in our study, where materials have been repeatedly heated at high temperatures during the continuous kiln’s use. In such cases, comparing results from these two methods offers several key advantages for refining and validating chronological interpretations, while at the same time, multidisciplinary dating cross-checking strongly contributes to overcoming the specific technical and methodological limitations related to each single dating technique.
Like all dating techniques, TL has specific limitations mainly related to the sensitivity to environmental radiation and to the relatively high uncertainty of the final result. Accurate dose rate estimation requires detailed knowledge of the surrounding soil’s radioactivity over time, which may not always be possible, while clay matrix inhomogeneity induced by repeated heatings can result in age overestimations [14]. Another possible error source could be the leaching of the potassium content [34]. On the other hand, archaeomagnetic dating is importantly limited by the availability and resolution of well-constrained reference SV curves, which are more developed in some parts of the world than others, and better detailed for some chronological periods than others [35]. Moreover, determining the direction of the past geomagnetic field requires that the material is still found in situ (at the exact position it was heated for the last time), while laboratory archaeointensity determination procedures are complicated and time-consuming, with often a low success rate. Post-depositional movements or re-heating of the material can alter the magnetic signal, complicating interpretations.
In this perspective, and given the individual limitations of each method, integrating multiple dating approaches as proposed in this study, undoubtedly enhances chronological precision and confidence, while at the same time, such cross-checking offers the opportunity to test and improve the single techniques. In the case of the Ceva kiln, apart from the new TL and archaeomagnetic data presented here, radiocarbon analysis was previously carried out on one charcoal sample (LTL21346) collected from the stratigraphic level US29 from the praefurnium of the kiln. Since this charcoal-rich layer lies immediately beneath the remains of the destruction of the praefurnium covering, it is likely that it consists of the combustion remains of the last firing. Sample preparation and measurements were performed at the CEDAD Laboratory in Lecce (Centro di Datazione e Diagnostica), and the radiocarbon dating was obtained using the accelerator mass spectroscopy (AMS) technique. The result was corrected for δ13C [36] and calibrated to calendar age [37], using the OxCal3.10 software (the uncalibrated age is 2134 ± 45 BP). According to the report, the calibrated radiocarbon age of the sample calculated at 95% of probability is 355 BC–279 BC (19.9%) and 232 BC–42 BC (75.5%) (CEDAD Technical report, 2021: Rif. CEDAD: 2021_00116, see Supplementary Materials Table S2). Thanks to this radiocarbon result, the Ceva kiln represents a unique case study so far in the literature, giving the possibility to directly cross-check three of the most widely used dating techniques in archaeology: TL, archaeomagnetism, and radiocarbon.
Our new TL and archaeomagnetic results show exceptionally good agreement. Based on the TL dating, the last heating of the kiln occurred within the time range between 137 BC to 181 AD (22 ± 159 AD) within a 95.4% confidence level (2σ). On the other hand, the archaeomagnetic dating based on the directional results gives an age of 260 BC and 35 AD. It is interesting to note that using the full geomagnetic field vector for archaeomagnetic dating purposes (instead of direction only) further constrains the archaeomagnetic age at 115 BC to 45 AD, being in excellent agreement with the TL results. These results are also in agreement with the radiocarbon date, even if radiocarbon suggests a slightly older age, most probably due to the well-known old wood effect, taking into consideration that radiocarbon dates the age of the investigated wood and not the time of the kiln’s abandonment.
Having this exceptional opportunity to have dating results involving three different dating methods, we applied Bayesian modelling to integrate TL, archaeomagnetic, and radiocarbon dates into a unique age. Analysis was performed using the ChronoModel software v. 3.2.7 [38,39], which provides a robust Bayesian tool for chronology building in order to estimate the date of a target event by a combination of individual dates of various techniques obtained from archaeological materials, assuming the samples are contemporaneous. ChronoModel is open-source and freely available [40], ensuring full transparency, repeatability, and reproducibility of the analyses. Its calculations are based on Markov Chain Monte Carlo (MCMC) numerical methods, providing a statistically sound framework for estimating the timing of archaeological events.
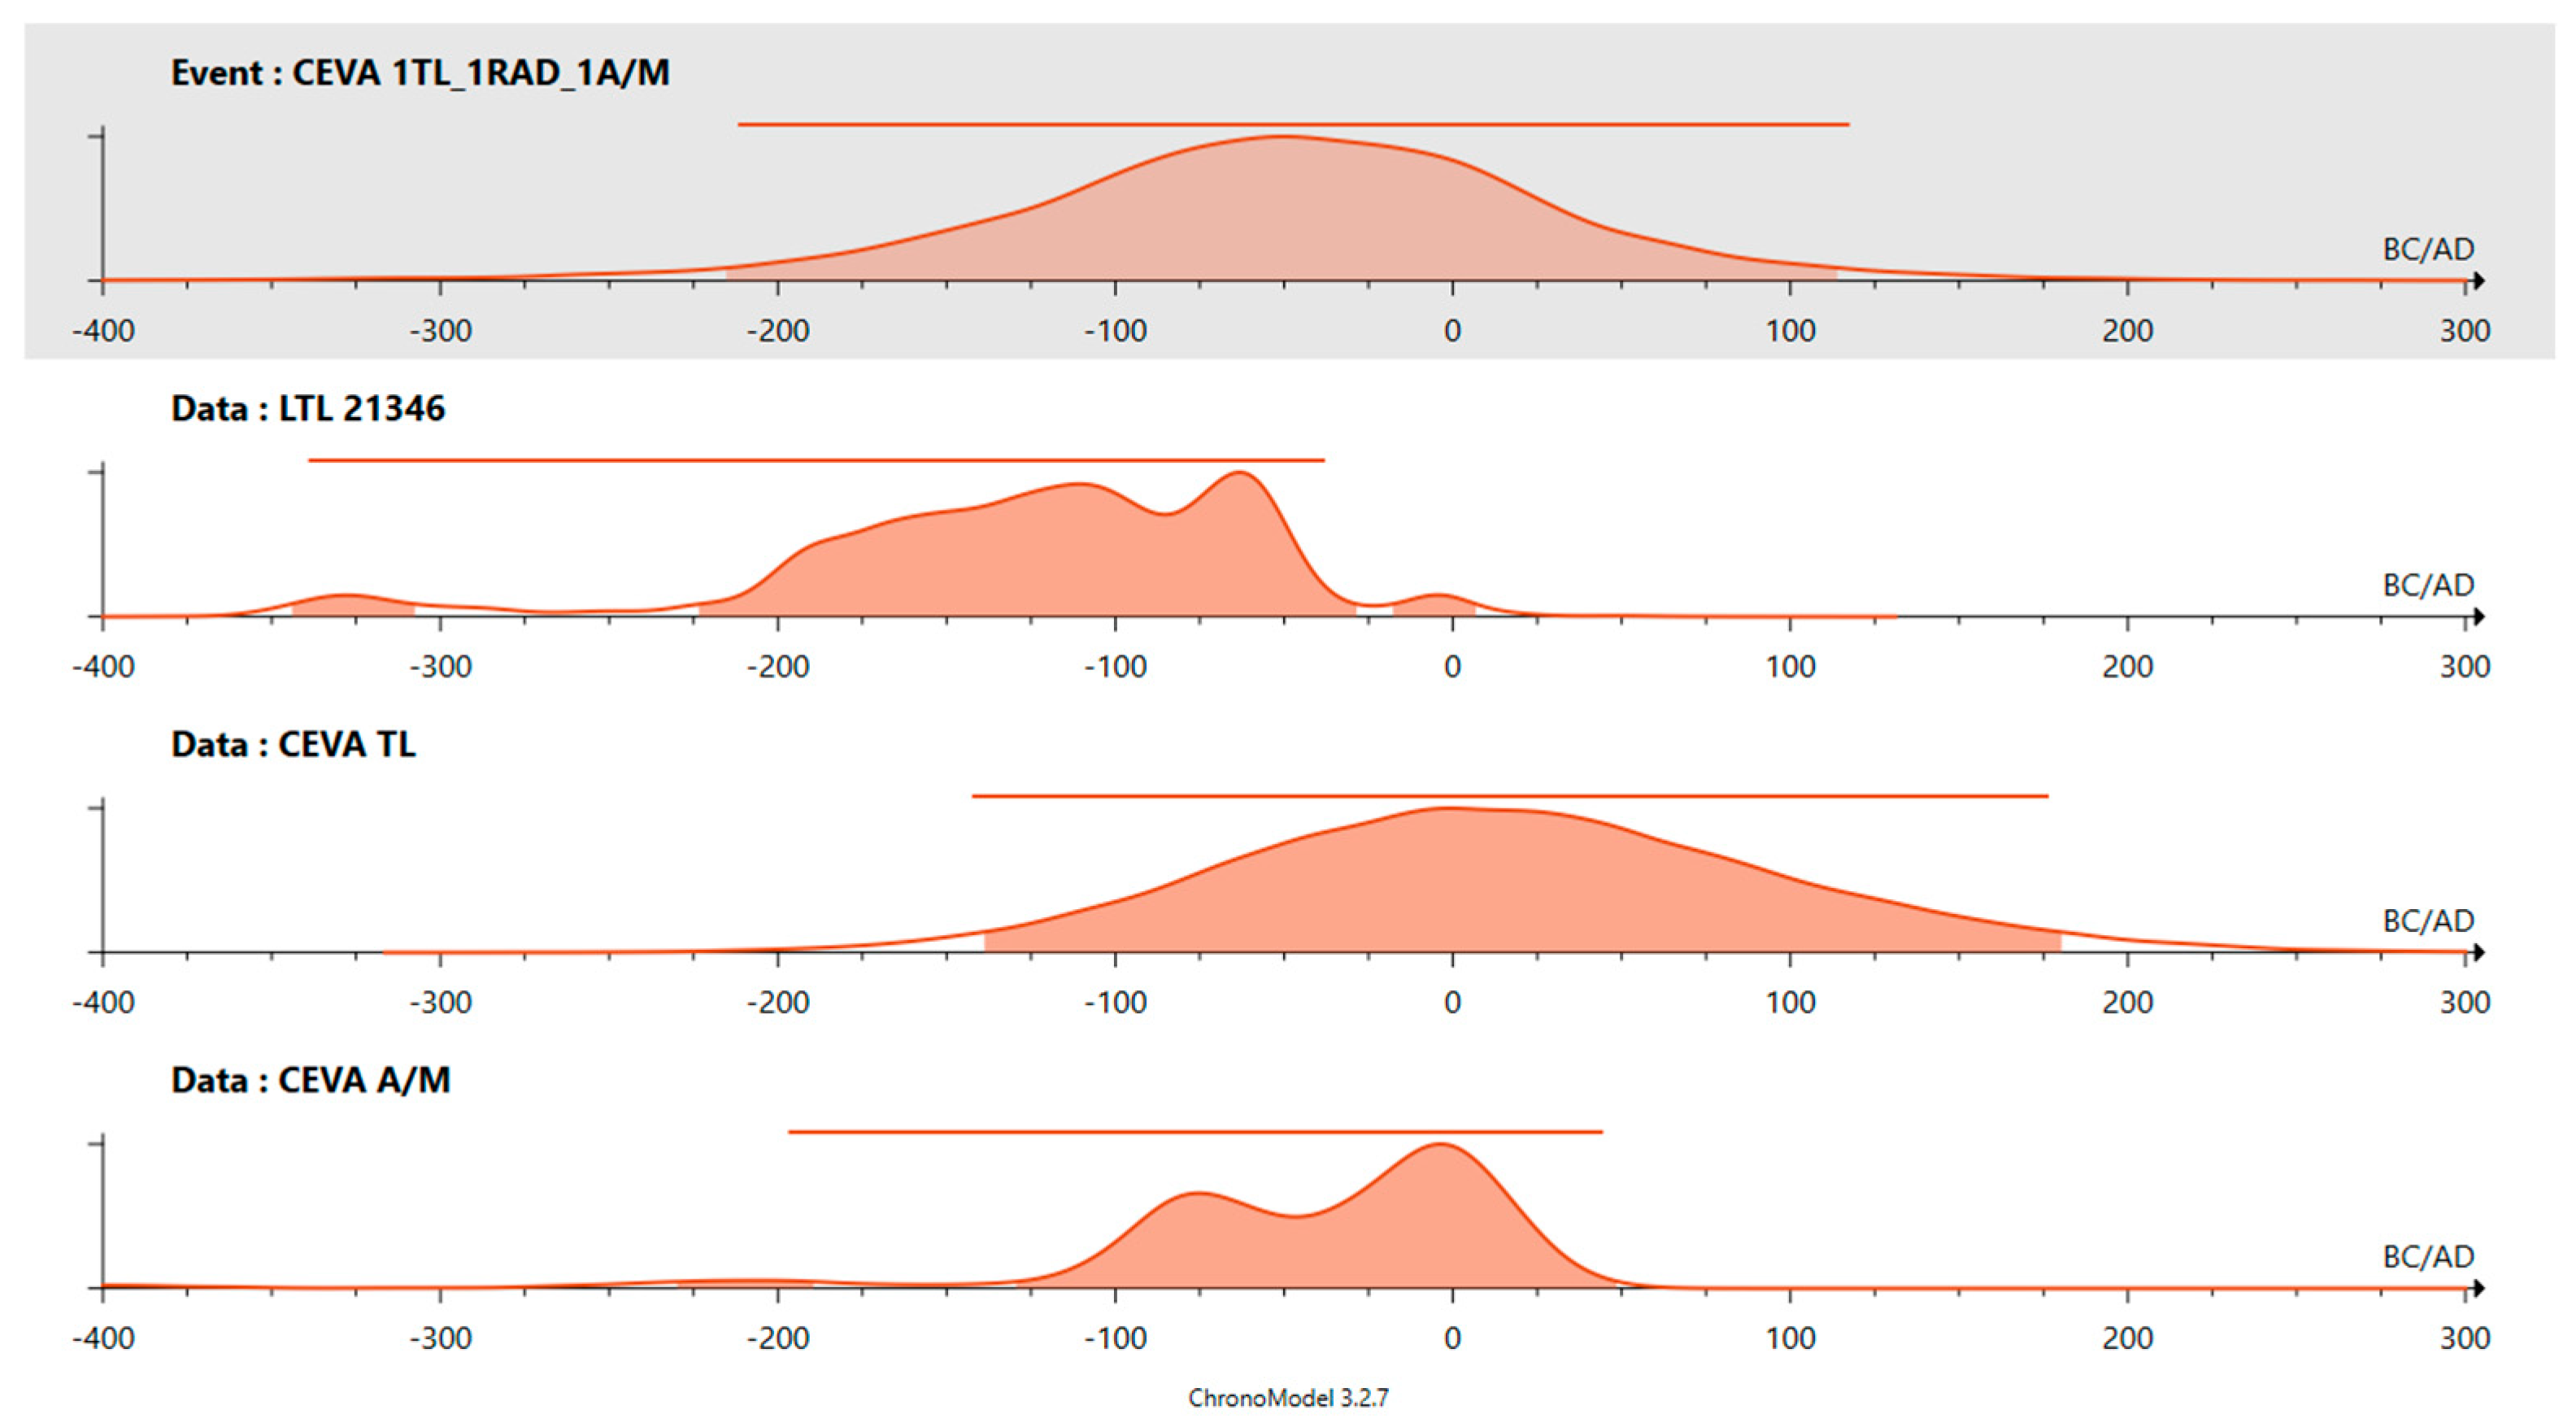
The comparison of all dating results confirms their very good agreement, while the combined Bayesian analysis constrains the last use of the kiln to between 213 BC and 111 AD at a 2σ confidence level (Figure 6). This interval is fully consistent with the archaeological evidence and, although broader than those obtained from the individual techniques, it provides a more reliable chronological framework and emphasizes the importance of cross-checking dating methods in archaeology. Extremely narrow dating intervals are not necessarily more reliable, particularly when derived from a single method, which may give a misleading impression of precision.
Our study demonstrates that, although laboratory-based dating methods such as TL, archaeomagnetism, and radiocarbon dating each have inherent limitations, their strategic integration and cross-validation are essential for building robust archaeological chronologies. Moreover, the inclusion of archaeointensity measurements in archaeomagnetic dating proves particularly beneficial, as it helps to refine age estimates and achieve tightly constrained results. Undoubtedly, integrative approaches not only compensate for the limitations of individual techniques but also contribute to a more detailed and reliable understanding of the archaeological record.

Supplementary Materials

The following supporting information can be downloaded at: https://www.mdpi.com/article/10.3390/heritage8090358/s1, Table S1: Detailed archaeointensity results; Table S2: Radiocarbon results obtained for the charcoal sample US29-C1.

Author Contributions

E.T.: Conceptualization; Methodology; Sampling; Laboratory analysis; Data interpretation; Data curation; Writing—Original Draft. G.S.P.: Methodology; Laboratory analysis; Data interpretation; Data curation; Writing—Review & Editing. M.C.: Sampling; Resources; Data curation; Visualization; Writing—Review & Editing. S.G.L.: Resources; Visualization; Writing—Review & Editing. All authors have read and agreed to the published version of the manuscript.

Funding

This study was partially funded by F.T. Studio s.r.l. and Autostrada dei Fiori S.p.A.

Data Availability Statement

All data are freely available upon request.

Acknowledgments

We warmly acknowledge AIAr—Associazione Italiana di Archeometria for fully covering the costs of this Open Access publication. We also thank F.T. Studio s.r.l. and Autostrada dei Fiori S.p.A. for their financial support in funding the excavation and part of the analysis. Enzo Ferrara is also warmly acknowledged for his valuable assistance during the sampling process.

Conflicts of Interest

The authors declare no conflicts of interest.

References

  1. Tema, E.; Fantino, F.; Ferrara, E.; Lo Giudice, A.; Morales, J.; Goguitchaichvili, A.; Camps, P.; Barello, F.; Gulmini, M. Combined archaeomagnetic and thermoluminescence study of a brick kiln excavated at Fontanetto Po (Vercelli northern Italy). J. Archaeol. Sci. 2013, 40, 2025–2035. [Google Scholar] [CrossRef]
  2. Tema, E.; Fantino, F.; Ferrara, E.; Allegretti, S.; Lo Giudice, A.; Re, A.; Barello, F.; Vella, S.; Cirillo, L.; Gulmini, M. Archaeological archaeomagnetic and thermoluminescence investigation of a baked clay kiln excavated at Chieri, northern Italy: Contribution to the rescue of our cultural heritage. Ann. Geophys. 2014, 57, G0548. [Google Scholar] [CrossRef]
  3. Becker, H.; Göksu, H.Y.; Regulla, D.F. Combination of archaeomagnetism and thermoluminescence for precision dating. Quaternary Sci. Rev. 1994, 13, 563–567. [Google Scholar] [CrossRef]
  4. Batt, C. Archaeomagnetic Dating. In Handbook of Archaeological Sciences; Pollard, A.M., Armitage, R.A., Makarewicz, C.A., Eds.; Wiley: Hoboken, NJ, USA, 2023. [Google Scholar] [CrossRef]
  5. Aitken, M.J. Thermoluminescence Dating; Academic Press: London, UK, 1985. [Google Scholar]
  6. Aitken, M.J. Science-Based Dating in Archaeology; Longman Press House: London, UK; New York, NY, USA, 1990. [Google Scholar]
  7. Wagner, G.A. Age Determination of Young Rocks and Artifacts: Physical and Chemical Clocks in Quaternary Geology and Archaeology; Springer: Berlin/Heidelberg, Germany, 1998. [Google Scholar]
  8. Carrancho, Á.; Goguitchaichvili, A.; Morales, J.; Espinosa-Soto, J.A.; Villalaín, J.J.; Arsuaga, J.L.; Baquedano, E.; Pérez-González, A. Full-Vector Archaeomagnetic Dating of a Medieval Limekiln at Pinilla Del Valle Site (Madrid, Spain). Archaeometry 2017, 59, 373–394. [Google Scholar] [CrossRef]
  9. Principe, C.; Goguitchaichvili, A.; Devidze, M.; La Felice, S.; Cejudo, R.; Morales, J.; Cantini, F. Archaeomagnetic Dating of Three Furnaces inside the Middle Age Settlement of San Genesio (San Miniato Pisa, Italy). Land 2022, 11, 1936. [Google Scholar] [CrossRef]
  10. Tema, E.; Camps, P.; Ferrara, E.; Poidras, T. Directional results and absolute archaeointensity determination by the classical Thellier and the multispecimen DSC protocols for two kilns excavated at Osterietta Italy. Stud. Geophys. Geod. 2015, 59, 554–577. [Google Scholar] [CrossRef]
  11. Tema, E.; Polymeris, G.; Morales, J.; Goguitchaichvili, A.; Tsaknaki, V. Dating of ancient kilns: A combined archaeomagnetic and thermoluminescence analysis applied to a brick workshop at Kato Achaia, Greece. J. Cult. Herit. 2015, 16, 496–507. [Google Scholar] [CrossRef]
  12. Tema, E.; Ferrara, E.; Angelici, D.; Fantino, F.; Panero, E. The importance of multidisciplinary dating in rescue excavations: The case of Santhià Northern Italy. J. Archaeol. Sci. Rep. 2019, 28, 102059. [Google Scholar] [CrossRef]
  13. Kondopoulou, D.; Aidona, E.; Ioannidis, N.; Polymeris, G.S.; Tsolakis, S. Archaeomagnetic study and thermoluminescence dating of Protobyzantine kilns (Megali Kypsa, North Greece). J. Archaeol. Sci. Rep. 2015, 2, 156–168. [Google Scholar] [CrossRef]
  14. Aidona, E.; Polymeris, G.; Camps, P.; Kondopoulou, D.; Ioannidis, N.; Raptis, K. Archaeomagnetic versus Luminescence Methods: The case of an Early Byzantine Ceramic Workshop in Thessaloniki. Greece. Arch. Anthropol. Sci. 2018, 10, 725–741. [Google Scholar] [CrossRef]
  15. Lerma, S.G.; Casola, M.; Barello, F.; Tema, E. Ceva frazione Mollere, autostrada A6 Torino-Savona. Realizzazione area di sosta di Priero Sud. Fornace per laterizi di età romana. Quad. Archeol. Del Piemonte 2023, 7, 165–169. [Google Scholar]
  16. Cuomo Di Caprio, N. Proposta di classificazione delle fornaci per ceramica e laterizi nell’area italiana dalla preistoria a tutta l’epoca romana. Sibrium Cent. Studi Preist. Archeol. Varese Italy 1971–1972, 11, 371–464. [Google Scholar]
  17. Ferrero, L.; Giaretti, M.; Padovan, S. Gli abitati della Liguria interna: La ceramica domestica. In Ligures Celeberrimi, la Liguria Interna Nella Seconda età del Ferro: Atti del Convegno Internazionale (Mondovì, 26–28 Aprile 2002); Istituto Internazionale di Studi Liguri: Bordighera, Italy, 2004; pp. 51–80. [Google Scholar]
  18. Ferrero, L. Insediamenti e popolamento dell’Ager di Augusta Bagiennorum dall’età del Ferro ai primi secoli dell’Impero. In Augusta Bagiennorum. Storia e Archeologia di una Città Augustea; CELID: Torino, Italy, 2014; pp. 39–59. [Google Scholar]
  19. Negro Ponzi Mancini M., M. Strade e insediamenti nel cuneese dall’età romana al Medioevo: Materiali per lo studio della struttura del territorio. Boll. Soc. St. Stor. Arch. ed Art. Prov. Cuneo 1981, 85, 8–84. [Google Scholar]
  20. Zijderveld, J. AC demagnetization of rocks: Analysis of results. In Methods in Paleomagnetism Collinson; Collinson, D.W., Creer, K.M., Runcorn, S.K., Eds.; Elsevier: New York, NY, USA, 1967; pp. 254–256. [Google Scholar]
  21. Chadima, M.; Hrouda, F. Remasoft 3.0 a user-friendly paleomagnetic data browser and analyzer. Trav. Geophys. 2006, XXVII, 20–21. [Google Scholar]
  22. Thellier, E.; Thellier, O. Sur l’intensité du champ magnétique terrestre dans le passé historique et géologique. Ann. Geophys. 1959, 15, 285–376. [Google Scholar]
  23. Coe, R.S.; Grommé, S.; Mankinen, A. Geomagnetic paleointensities from radiocarbon dated lava flows on Hawai and the question of the Pacific nondipole low. J. Geophys. Res. 1978, 83, 1740–1756. [Google Scholar] [CrossRef]
  24. Leonhardt, R.; Heunemann, C.; Krása, D. Analysing absolute paleointensity determinations: Acceptance criteria and the software Thelliertool4.0. Geochem. Geophys. Geosyst. 2004, 5. [Google Scholar] [CrossRef]
  25. Polymeris, G.S. Thermoluminescence as a Tool for Age Assessment and Palaeothermometry Studies of Baked Clayey Artefacts. In Ceramic Analysis: Laboratory Methods; Hein, I., Ed.; Cambridge Elements, Current Archaeological Tools and Techniques; Cambridge University Press: Cambridge, UK, 2025; Volume 2025. [Google Scholar]
  26. Zimmerman, D.W. Luminescence dating using fine grains from pottery. Archaeometry 1971, 13, 29–56. [Google Scholar] [CrossRef]
  27. Vieillevigne, E.; Guibert, P.; Bechtel, F. Luminescence chronology of the medieval citadel of Termez, Uzbekistan: TL dating of bricks masonries. J. Archeol. Sci. 2007, 34, 1402–1416. [Google Scholar] [CrossRef]
  28. Hossain, S.M.; De Corte, F.; Vandenberghe, D.; van den haute, P. A comparison of methods for the annual radiation dose determination in the luminescence dating of loess sediment. Nucl. Inst. Methods Phys. Res. A 2002, 490, 598–613. [Google Scholar] [CrossRef]
  29. Liritzis, I.; Vafiadou, A. Calibration aspects of thick source alpha counter ZnS system. Measurement 2012, 45, 1966–1980. [Google Scholar] [CrossRef]
  30. Liritzis, I.; Mavrikis, D.; Zacharias, N.; Sakalis, A.; Tsirliganis, N.; Polymeris, G.S. Potassium determinations using SEM, FAAS and XRF: Some experimental notes. Mediter. Archaeol. Archaeom. 2011, 11, 169–178. [Google Scholar]
  31. Liritzis, I.; Stamoulis, K.; Papachristodoulou, C.; Ioannides, K. A re-evaluation of radiation dose rate conversion factors. Mediterr. Arch. Archaeomet. 2013, 13, 1–15. [Google Scholar]
  32. Serrano, M.; Pavón-Carrasco, F.J.; Campuzano, S.A.; Osete, M.L. ArchaeoPyDating: A new user-friendly release for archaeomagnetic dating. Archaeometry 2024, 66, 1424–1437. [Google Scholar] [CrossRef]
  33. Tema, E.; Lanos, P. New Italian directional and intensity archaeomagnetic reference curves for the past 3000 years: Insights on secular variation and implications on dating. Archaeometry 2021, 63, 428–445. [Google Scholar] [CrossRef]
  34. Zacharias, N.; Buxeda i Garrigos, J.; Mommsen, H.; Schwedt, A.; Kilikoglou, V. Implications of burial alterations on luminescence dating of archaeological ceramics. J. Archaeol. Sci. 2005, 32, 49–57. [Google Scholar] [CrossRef]
  35. Casas, L.; Tema, E. Investigating the expected archaeomagnetic dating precision in Europe: A temporal and spatial analysis based on the SCHA.DIF.3K geomagnetic field model. J. Archaeol. Sci. 2019, 108, 104972. [Google Scholar] [CrossRef]
  36. Stuiver, M.; Polach, H.A. Discussion Reporting of 14C Data. Radiocarbon 1977, 19, 355–363. [Google Scholar] [CrossRef]
  37. Reimer, P.J.; Bard, E.; Bayliss, A.; Beck, J.W.; Blackwell, P.G.; Bronkamsey, C.; Buck, C.E.; Cheng, H.; Edwards, R.L.; Friedrich, M.; et al. IntCal13 and Marine13 radiocarbon age calibration curves 0–50,000 years cal BP. Radiocarbon 2013, 55, 1869–1887. [Google Scholar] [CrossRef]
  38. Lanos, P.; Philippe, A. Hierarchical Bayesian modeling for combining dates in archeological context. J. Société Française Stat. 2017, 158, 17. [Google Scholar]
  39. Lanos, P.; Philippe, A. Event date model: A robust Bayesian tool for chronology building. Commun. Stat. Appl. Methods 2018, 25, 131–157. [Google Scholar] [CrossRef]
  40. Lanos, P.; Dufresne, P. Chronomodel Version 2.0: Software for Chronological Modelling of Archaeological Data Using Bayesian Statistics. 2019. Available online: http://www.chronomodel.com.
Figure 1. (a) View of the investigated kiln at Ceva, località Mollere, with the position of the investigated samples (white dots: archaeomagnetic samples; red stars: TL samples; orange diamond: radiocarbon sample); (b) oriented samples collected for archaeomagnetic research with the use of plaster of Paris; (c) oriented samples with plastic disc.
Heritage 08 00358 g001
Figure 2. Archaeomagnetic results: (a) IRM acquisition curves and (b) intensity decay curves for representative samples; (c) stepwise AF demagnetization results represented in Zijderveld diagram; (d) equal area projection of the ChRM direction of the investigated samples. The pink dot illustrates the mean direction calculated for the kiln.
Heritage 08 00358 g002
Figure 3. Archaeointensity results obtained for representative samples and represented in NRM-TRM diagrams, known as Arai plots. Diagrams are normalized to the initial NRM intensity. During the archaeointensity experiments, regular pTRM checks were performed (triangles in the Arai plots).
Heritage 08 00358 g003
Figure 4. Archaeomagnetic dating results obtained after comparison with the Italian SV curves (Tema and Lanos, 2021) [33]: (a) Location of the Ceva kiln (blue dot) and origin coordinates of the Italian reference curve (Viterbo, yellow star); (b,c) Comparison of the declination and inclination values (in green) with the declination and inclination reference SV curves (in red), respectively. Bands represent the uncertainties of the laboratory measurements and the curves; (d) combined declination and inclination probability densities (from (b,c)), representing the final dating result based on the directional data; (e,f) same as (b,c); (g) comparison of the intensity value with the intensity reference curve; (h) combined directional and intensity probability densities (from (eg)), representing the final dating result based on the full geomagnetic field vector (direction and intensity). See text for further details.
Heritage 08 00358 g004
Figure 5. Thermoluminescence results: (a) TL glow curves related to the TL age calculation for the sample CE5. The additive doses delivered were 7, 15, and 20 Gy. Reheats have been subtracted. Each glow curve plotted is the average of three individually measured glow curves. (b) The equivalent dose plotted vs. temperature for the sample CE2. Solid line indicates the best ED plateau. Upper inset presents a representative NTL + β (filled points) dose response curve for the temperature of 300 °C. The arrow shows the equivalent dose. Lower inset presents the linearity curve S throughout the entire TL glow curve temperature regions for all three additive doses.
Heritage 08 00358 g005
Figure 6. Bayesian analysis combining the ages obtained by all applied techniques, namely, TL, archaeomagnetism (AM), and radiocarbon (sample LTL 21346), using Chronomodel software. Red lines correspond to the individual probability density calculated for each technique, while the red areas present the most significant density in the framework of the combined analysis procedure. The final combined interval at 95% of probability is reported at the upper part of the figure (indicated with grey shadow).
Heritage 08 00358 g006
Table 1. Summary of the TL dating results for the three samples investigated. Error values are within 1σ level for all values except the TL ages, which are presented within 2σ error level.
SampleU (ppm)232Th (ppm)40K (%)ED (Gy)ΔT (°C)DR (Gy/ka)TL Age
(ka)
TL Age (yrs BC)
CE27.01 ± 0.1011.14 ± 0.190.89 ± 0.057.93 ± 0.33125 ± 23.736 ± 0.2572.120 ± 0.20398 ± 203
CE57.44 ± 0.1112.18 ± 0.150.95 ± 0.068.36 ± 0.32108 ± 23.989 ± 0.2312.095 ± 0.19871 ± 198
CE207.22 ± 0.1111.44 ± 0.130.97 ± 0.058.04 ± 0.29114 ± 23.893 ± 0.2122.066 ± 0.20641 ± 206
Disclaimer/Publisher’s Note: The statements, opinions and data contained in all publications are solely those of the individual author(s) and contributor(s) and not of MDPI and/or the editor(s). MDPI and/or the editor(s) disclaim responsibility for any injury to people or property resulting from any ideas, methods, instructions or products referred to in the content.