Article

Image-Based POI Identification for Mobile Museum Guides: Design, Implementation, and User Evaluation

by
Bashar Egbariya
,
Rotem Dror
,
Tsvi Kuflik
* and
Ilan Shimshoni
The Information Systems Department, The University of Haifa, Haifa 3498838, Israel
*
Author to whom correspondence should be addressed.
Heritage 2025, 8(7), 266; https://doi.org/10.3390/heritage8070266
Submission received: 13 May 2025 / Revised: 20 June 2025 / Accepted: 30 June 2025 / Published: 6 July 2025

Abstract

Indoor positioning remains a significant challenge, particularly in environments such as museums, where the installation of specialized positioning infrastructure may be impractical. Recent advances in image processing offer effective and precise methods for object recognition, presenting a viable alternative. This study explores the feasibility of employing real-time image processing techniques for identifying points of interest (POIs) within museum settings. It outlines the ideation, design, development, and evaluation of an image-based POI identification system implemented in a real-world environment. To evaluate the system’s effectiveness, a user study was conducted with regular visitors at the Hecht Museum. The results showed that the algorithm successfully and quickly identified POIs in 97.6% of cases. Additionally, participants completed the System Usability Scale (SUS) and provided open-ended feedback, indicating high satisfaction with the system’s accuracy and speed while also offering suggestions for future improvements.

1. Introduction

Indoor localization refers to the determination of the precise locations of objects or people within an indoor environment. In cultural heritage, a key challenge is to know in front of which exhibit a visitor is standing to suggest relevant information about that point of interest (POI). Unlike outdoor localization, which primarily relies on GPS technology to achieve global coverage with an error margin of up to 3.5 m under optimal conditions [1,2], indoor environments render GPS ineffective due to reflection, diffraction, and blockage caused by obstacles such as walls and structural elements [3,4]. Consequently, indoor localization must employ alternative approaches, each offering varying degrees of accuracy and demanding different levels of infrastructure investment [5]. Given these challenges, advancing indoor localization technologies is a critical area of research to ensure the development of effective and reliable solutions.
Researchers have explored a wide range of technologies to achieve accurate indoor localization and tracking, each with distinct strengths and limitations, including Radio Frequency Identification (RFID) [6], wireless communication technologies such as Wi-Fi [7,8], acoustic localization methods [9], Pedestrian Dead Reckoning (PDR) [10], and more. Despite the diversity of available methods, all approaches must contend with trade-offs related to accuracy, cost, infrastructure requirements, and environmental sensitivity. The growing computational capabilities and widespread adoption of smartphones have further accelerated interest in leveraging embedded sensors for localization purposes [11].
Indoor positioning systems (IPSs) are highly valuable in cultural heritage settings like museums and historical sites, where they address unique challenges. The preservation of artifacts and structures often limits the installation of intrusive infrastructure, making non-invasive localization solutions essential. IPSs enhance visitor experiences by providing context-aware information, guiding visitors through exhibits, and offering detailed descriptions of artifacts [12].
Given the constraints imposed on infrastructure installation in cultural heritage sites, image-based indoor POI identification offers a promising solution for the unique challenges posed by cultural heritage environments. This approach leverages the ubiquity of smartphones equipped with cameras to determine the user’s location by matching captured images with a pre-existing database of images tagged with location data. Unlike other methods, image-based POI identification does not require the installation of hardware like beacons or sensors, preserving the integrity of cultural sites [13,14]. The primary advantage of image-based POI identification lies in its accuracy and non-intrusiveness. The approach’s scalability and low cost further enhance its appeal, as it primarily requires the maintenance of a digital image database rather than physical infrastructure [13]. It is worth noting that images are used for identifying users’ positions outdoors as well, as demonstrated, for instance, by [15], but our focus is on indoor POI identification; hence, we do not cover outdoor image-based POI identification.
In our study, we explored the viability of applying computer vision techniques combined with a smartphone camera to better derive the location of a person indoors. Our research question was “How can image-based POI identification be integrated efficiently into a mobile, location-aware museum visitors guide?” We hypothesize that an accurate and quick image-based POI identification system will contribute to visitors’ satisfaction with their cultural heritage experience. For the study, we developed an Android-based mobile visitors’ guide that leverages image-based POI identification to guide visitors within the Hecht Museum (https://mushecht.haifa.ac.il/?lang=en, accessed on 12 May 2025).
Our contribution is twofold: The system demonstrated quick position identification, accuracy, and reliability throughout its evaluation. Moreover, we proposed an easy-to-use and effective method for building a database of POIs’ representative images. By addressing key challenges in indoor POI identification in a cultural heritage context, this work contributes to the broader domain of location-based services and their application in cultural heritage settings.

2. Background and Related Work

Early technical approaches for indoor localization systems relied on techniques like Wi-Fi triangulation [16], Bluetooth signal strength [17], and Radio Frequency Identification (RFID) tags [18] to estimate the user’s position. According to [19], the most significant advantage of cellular positioning technology is its ability to achieve seamless indoor positioning. More robust approaches, like inertial sensors—such as accelerometers and gyroscopes—have become integral components in indoor localization systems [20]. However, a significant drawback of this approach is that it loses accuracy over time due to the accumulation of small errors in the sensor data [21]. Other approaches involve beacons such as Bluetooth Low Energy (BLE) Technology. Examples of uses include a localization system for car searching in indoor parking [22] and Estimote beacons (https://estimote.com/, accessed on 12 May 2025) to detect the user’s presence [23]. Finally, the sensor fusion approach, which is a modern indoor localization approach, integrates and analyzes data from various sources to provide more reliable positioning information [24]. Various indoor localization systems harness the capabilities of smartphones, utilizing features such as Wi-Fi connectivity, built-in sensors, and cameras [25].
Ongoing innovations in indoor localization technology, mainly due by advancements in fields such as computer vision, machine learning, and sensor technology, have significantly enhanced the accuracy and utility of these systems over the years, fostering their continual development and integration into various real-world scenarios. Further details can be found in numerous reviews, like [3] and [26]. Still, cultural heritage sites pose unique challenges to indoor positioning, as, in many cases, it is not possible to install any technological infrastructure in them.

2.1. Computer Vision and Its Use in Indoor Localization

Computer vision is a field focused on techniques for capturing, processing, and analyzing images, allowing systems to interpret and understand visual information [27]. In recent years, there has been a growing interest in applying computer vision to indoor localization due to its ability to provide accurate and robust localization in environments where GPS fails indoors, and even wireless signals like Wi-Fi and Bluetooth can suffer from interference caused by building materials or obstructions [28]. By contrast, computer vision offers a robust alternative by leveraging images or video streams captured by cameras to accurately estimate a user’s location [13].
An innovative approach in this field is Visual SLAM (Simultaneous Localization and Mapping), which uses computer vision to simultaneously map an environment and estimate the user’s position within it. By analyzing visual features extracted from camera images, Visual SLAM algorithms track user movement and generate a real-time map of the surrounding environment [29]. This technology has been employed in various indoor localization systems to provide precise localization.
In addition to Visual SLAM, augmented reality (AR) is often integrated into computer vision-based indoor localization. AR systems overlay digital information onto the camera view, offering real-time localization assistance [30]. Such systems typically analyze images captured by the user’s camera to recognize specific objects or landmarks.
Another widely used technique in indoor localization is visual landmark recognition, where computer vision algorithms identify distinctive landmarks within an environment. These systems estimate the user’s position based on their relative proximity and orientation to these landmarks. By integrating landmark recognition with sensor fusion techniques, such systems can enhance accuracy and provide more reliable localization [31].
Table 1 summarizes the advantages and limitations of the various indoor positioning techniques. As we can see from Table 1, all indoor positioning techniques, with the exception of image-based positioning, require technological infrastructure and maintenance that are challenging in museums and other cultural heritage sites.

2.2. Indoor Localization in Museums

A large variety of technologies have been experimented with in museums, including IR beacons [32], RF Zigbee beacons [33], Wi-Fi [34], and Landmark-based navigation [31]. Indoor localization solutions in museums not only guide visitors but also offer interactive and immersive experiences. Users can access multimedia content related to exhibits, including audio guides, videos, and additional contextual information [12,32]. These features transform the localization experience into an educational and engaging journey through the museum’s collections. Specifically, computer vision-based indoor localization systems can be tailored to enhance accessibility and inclusivity within museums. Meliones et al. [35] introduced an interactive autonomous localization system designed for indoor use, specifically targeting individuals and groups with visual impairments, referred to as the “Blind Museum Tourer.” The system included an indoor localization module, serving as a guide for individuals who are blind or visually impaired, facilitating self-guided tours on the museum premises. In real time, the system possesses the capability to pinpoint the user’s location within the indoor environment and subsequently provide guidance towards the next exhibit according to the predefined tour route. Upon reaching each exhibit, the system delivers auditory presentations to the user for an informative and engaging museum experience.
In conclusion, indoor localization technologies, including those based on computer vision and AR, are redefining how visitors explore and engage with museums. These innovative solutions not only streamline localization but also contribute to richer, more immersive, and inclusive museum experiences. As technology continues to advance, museums can look forward to further enhancing visitor engagement and education through indoor localization systems. Our unique contributions to this existing body of work include the simplicity of our approach, the process of optimizing images in the dataset, the resulting high speed and accuracy of POI identification (which are also the result of the novel technologies we adopted), and finally, the specific setting—the museum.

2.3. Using Large Language Models in Cultural Heritage

Since large language models (LLMs) emerged, they have quickly found their way into a wide range of applications, as they accelerate the process of content creation. Like many other domains, LLMs were also adopted in cultural heritage. Trichopoulos et al. [36] presented MAGICAL: Museum AI Guide for Augmenting Cultural Heritage with Intelligent Language Model—a system that demonstrated the capability of CHTGPT4 (https://openai.com/research/gpt-4 accessed on 12 May 2025) to be used as a tour guide that responds to visitors’ questions and provides answers about objects (also using speech-to-text and text-to-speech technologies). There are not many additional studies that explored the potential of LLMs to be used as a smart and personalized museum guide; still, it is beyond the scope of this paper to review them. However, one issue needs to be noted, and it is the validity of the content created by the LLMs. Dror et al. [37] demonstrated the potential of automatic content generation for descriptions of artifacts in a museum, where an image, a title, and sometimes a Wikipedia article were used to guide the creation of a textual description of the object of interest, not as a replacement for a tour guide but as an assistant to the content curator of the museum. The authors suggested that the created content would be verified manually and only then used by a visitor’s guide system, thus becoming a “curator’s helper.” We adopted this approach in our study, as the quality of the content is important as part of the overall experience.

3. Tools and Methods

3.1. POI Identification

The problem we are addressing is determining the location of a museum visitor using machine vision. Our goal is to provide a solution that enables visitors to easily and seamlessly access information about POIs they encounter. To build this solution, we need to overcome several key challenges. First, we must develop an efficient image representation so that the matching process is both accurate and optimized. Second, it is essential to construct a well-organized dataset for each POI. Finally, we need a fast and reliable method to recognize whether a POI exists in the database or not.

3.1.1. Image Representation

Many research efforts have focused on using feature extraction techniques to solve the challenge of image representation and matching. For example, Yang et al. [38] employed the SIFT algorithm for feature extraction and matching. SIFT [39] works by detecting key points in an image and describing them using distinctive feature vectors, which are then used to match images based on similarity. Given the above, we first explored SIFT and other tools like OpenCV’s ORB [40]. However, these models (based on detecting key points in the image) proved too slow and relatively inaccurate for our purposes. We then turned to deep learning-based representations and evaluated several candidates, including ResNet [41] and CLIP [42]. Among the models we tested, CLIP yielded the best performance and accuracy. As a result, we selected the CLIP-ViT-Large-Patch14 (https://huggingface.co/openai/clip-vit-large-patch14, accessed on 12 May 2025) model, which best suited our needs. We also experimented with the CLIP-ViT-Base-Patch32 version (https://huggingface.co/openai/clip-vit-base-patch32, accessed on 12 May 2025), but it did not perform as well as CLIP-ViT-Large-Patch14 in terms of accuracy and performance.

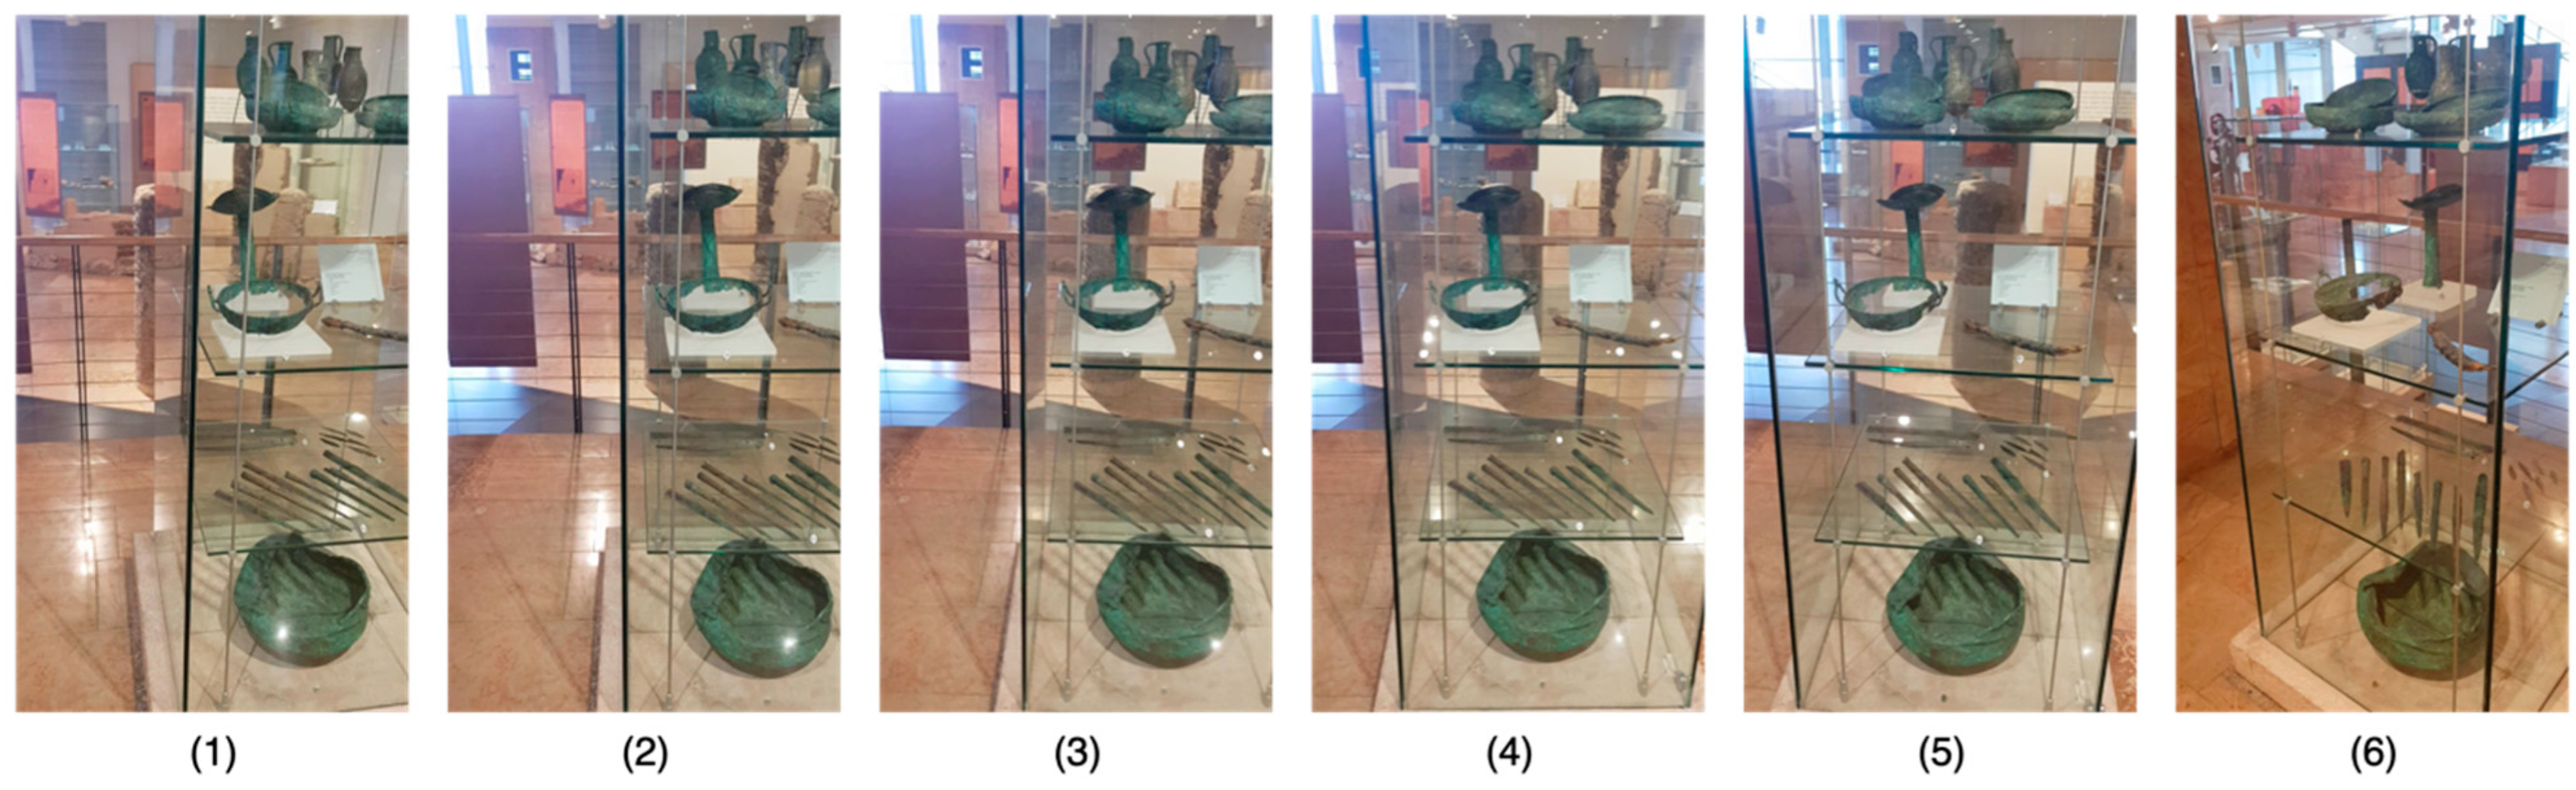
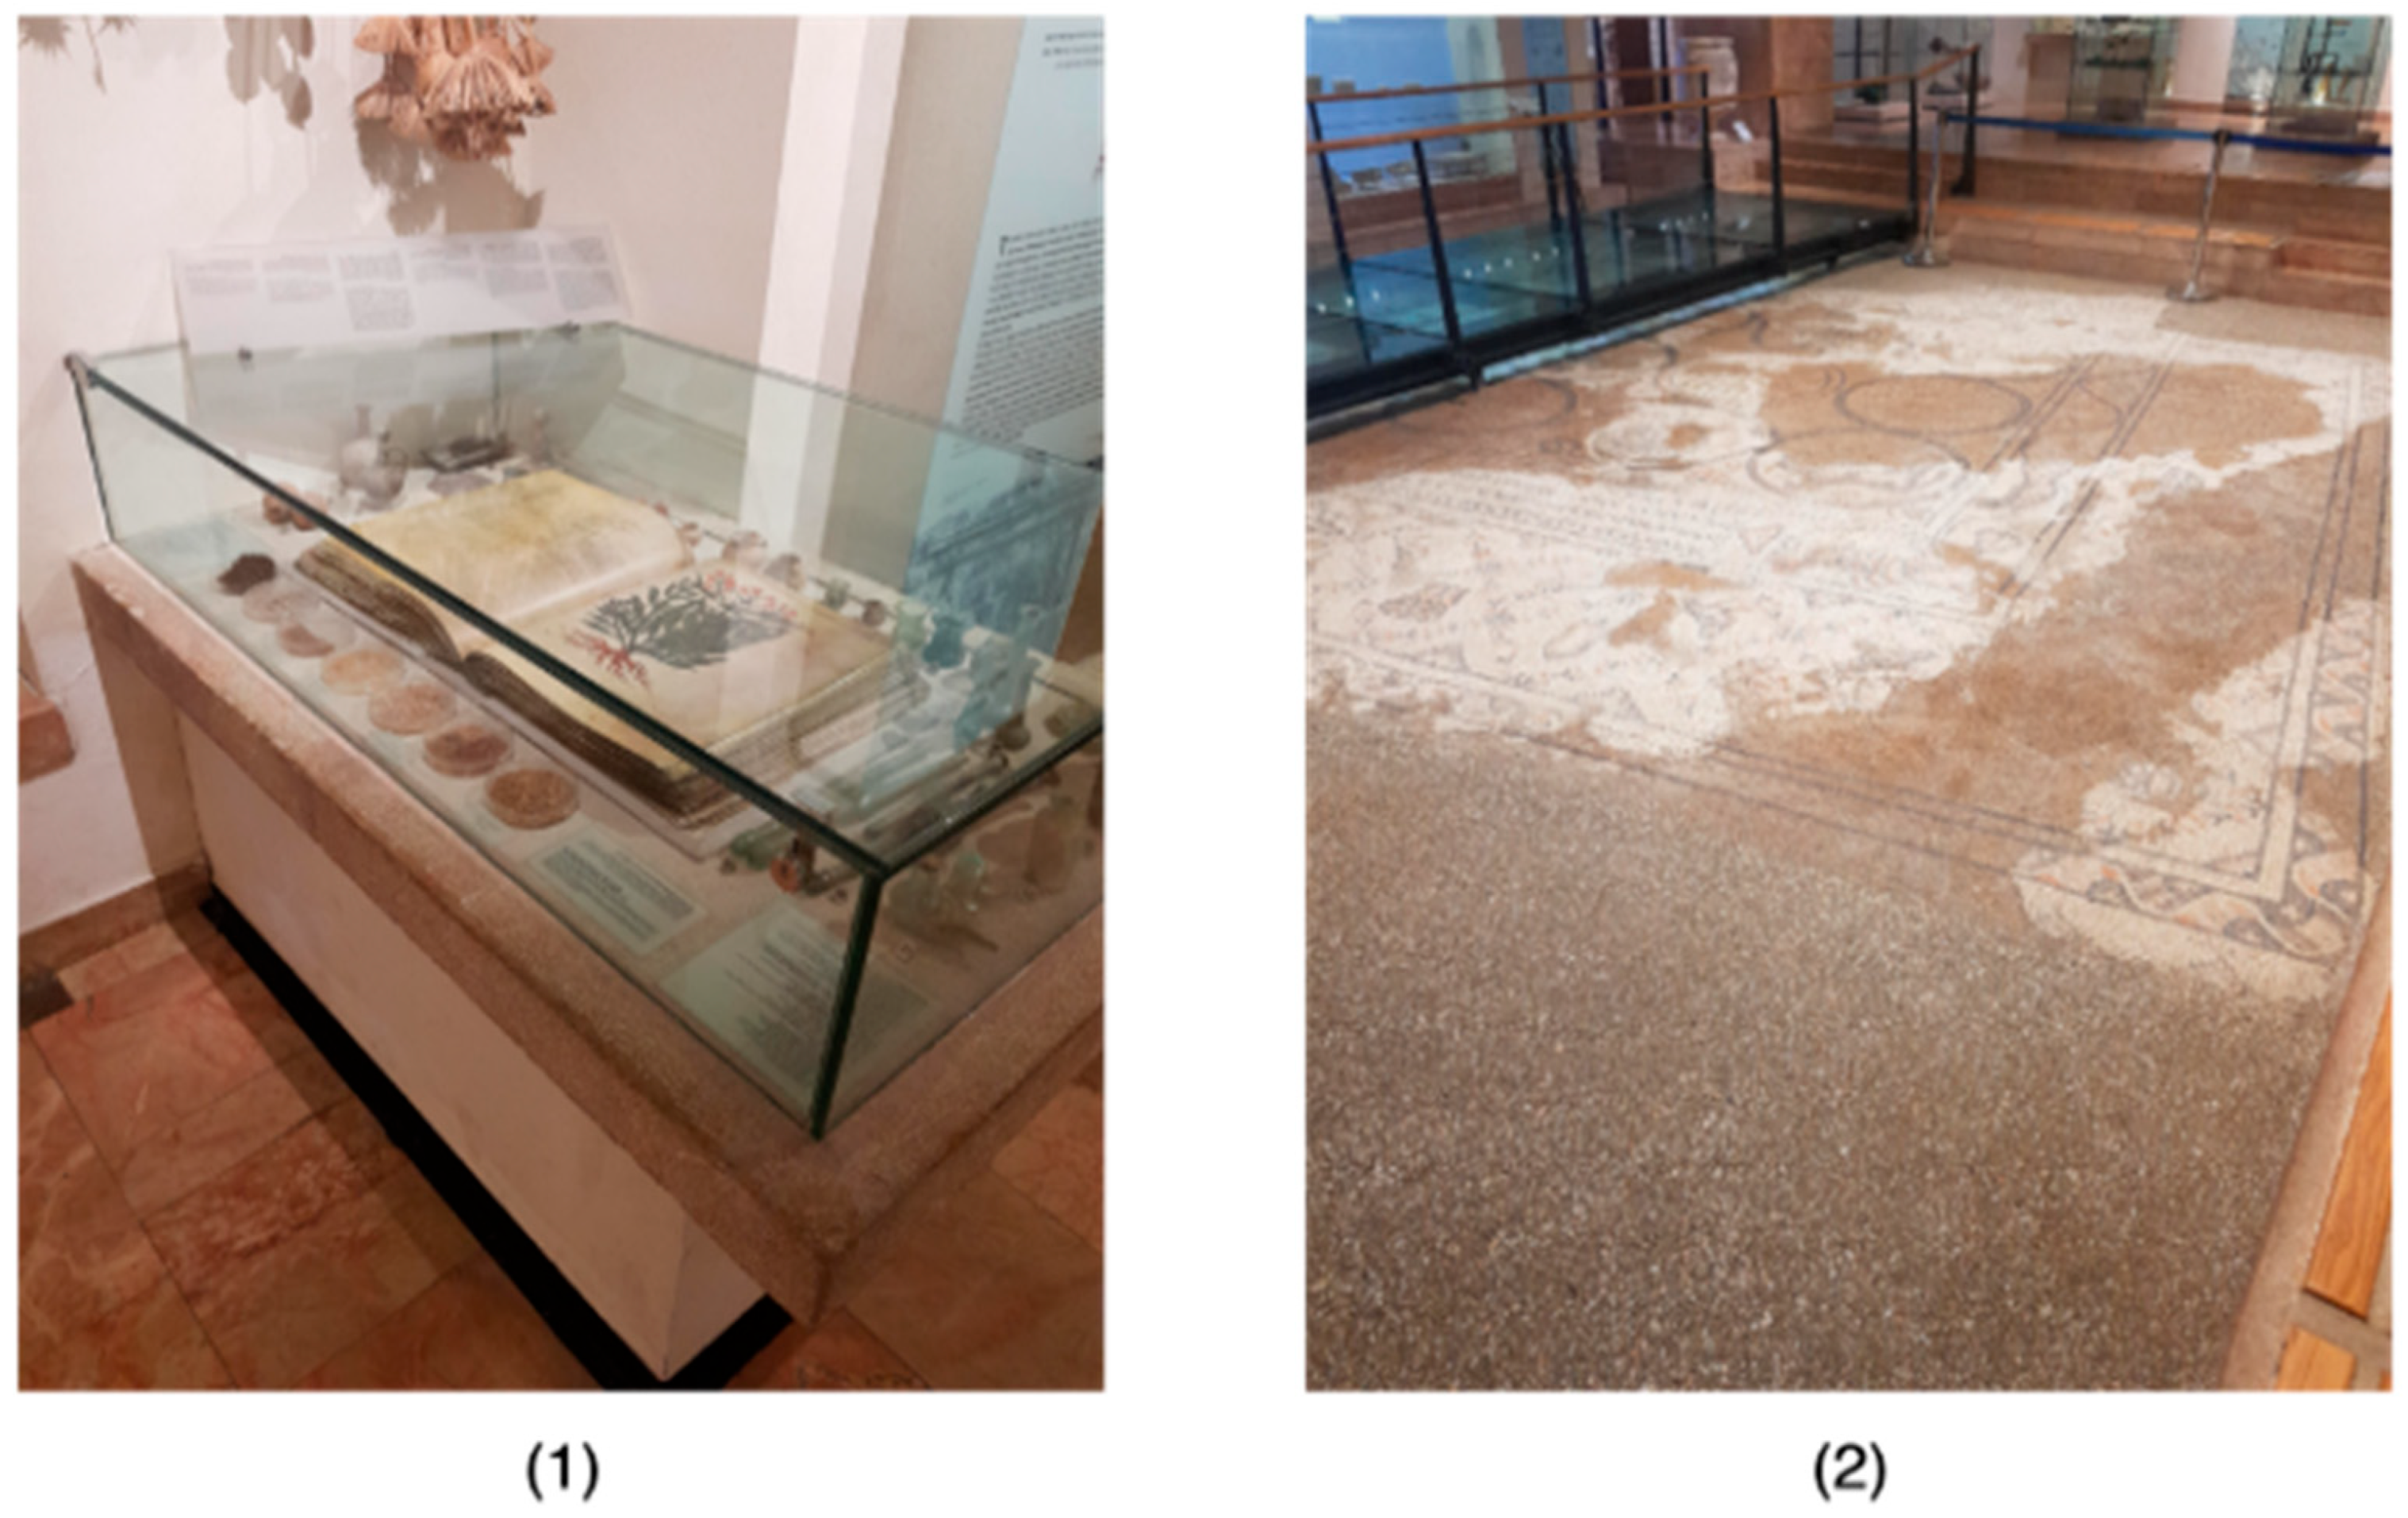
3.1.2. POI Dataset Construction

To build a database, for each POI, we captured videos around the POI (from all directions that visitors may view it) and applied CLIP to the complete set of frames of each video, generating a set of embeddings that represent the visual content. In this way, we improved a previously suggested process that relied on sets of manually taken pictures [43]. Then, the ARIDF (Automatic Representative Image Dataset Finder for Image-Based Localization) [43] algorithm was applied to select a small set of representative embeddings. Again, we improved the original process by using CLIP for image representation instead of SIFT. The process begins by initializing a distance matrix to store the pairwise Euclidean distances between the embeddings. Once the distance matrix is computed, it is converted into a binary matrix using a threshold. If a distance is greater than 0.38 (a value determined through a grid search on this parameter), the corresponding cell is set to 0, indicating dissimilarity; otherwise, it is set to 1, indicating similarity.
The goal of the algorithm is to identify the most representative embeddings. It does this by iteratively selecting the column with the most 1s, which indicates the embedding closest to the majority of other embeddings. The corresponding embedding index is added to a subset that will represent the entire set. The matrix is then updated to mark all similar embeddings as covered, reducing redundancy in subsequent iterations.
The process repeats until no 1s remain in the matrix, meaning all similar embeddings have been accounted for. The final output is a subset of embeddings that effectively represents the diversity within the entire set. This subset is returned as the final output, offering a reduced yet representative view of the data.

3.1.3. POI Recognition

The algorithm aims to find a matching POI in a database based on an input image using image embeddings. The process starts when an image is received as input. The first step is to generate an embedding (a vector of features) for this input image using the CLIP model. Next, the algorithm loops over all subsets of embeddings stored in the database, looking for the embedding with the smallest distance. Computing this distance only requires computing the distance between two vectors, which is very efficient. If it is below a predefined threshold, it indicates that a sufficiently similar POI was found. If the distance is greater than the threshold, the algorithm indicates that no matching location was found.

3.2. Experimental System

Our goal was to explore the potential of the proposed approach in a realistic setting. For this purpose, we had to develop a museum visitors’ guide system that implements the proposed image-based localization as a part of a complete museum visitors’ guide system.
Hence, we developed a museum visitors’ guide system for an exhibition at the Hecht Museum, located at the University of Haifa (https://mushecht.haifa.ac.il/?lang=en, accessed on 12 May 2025). Our system includes two main components: an Android application and a backend service. The two components interact using an API and serve two types of users: a visitor and a museum staff member.

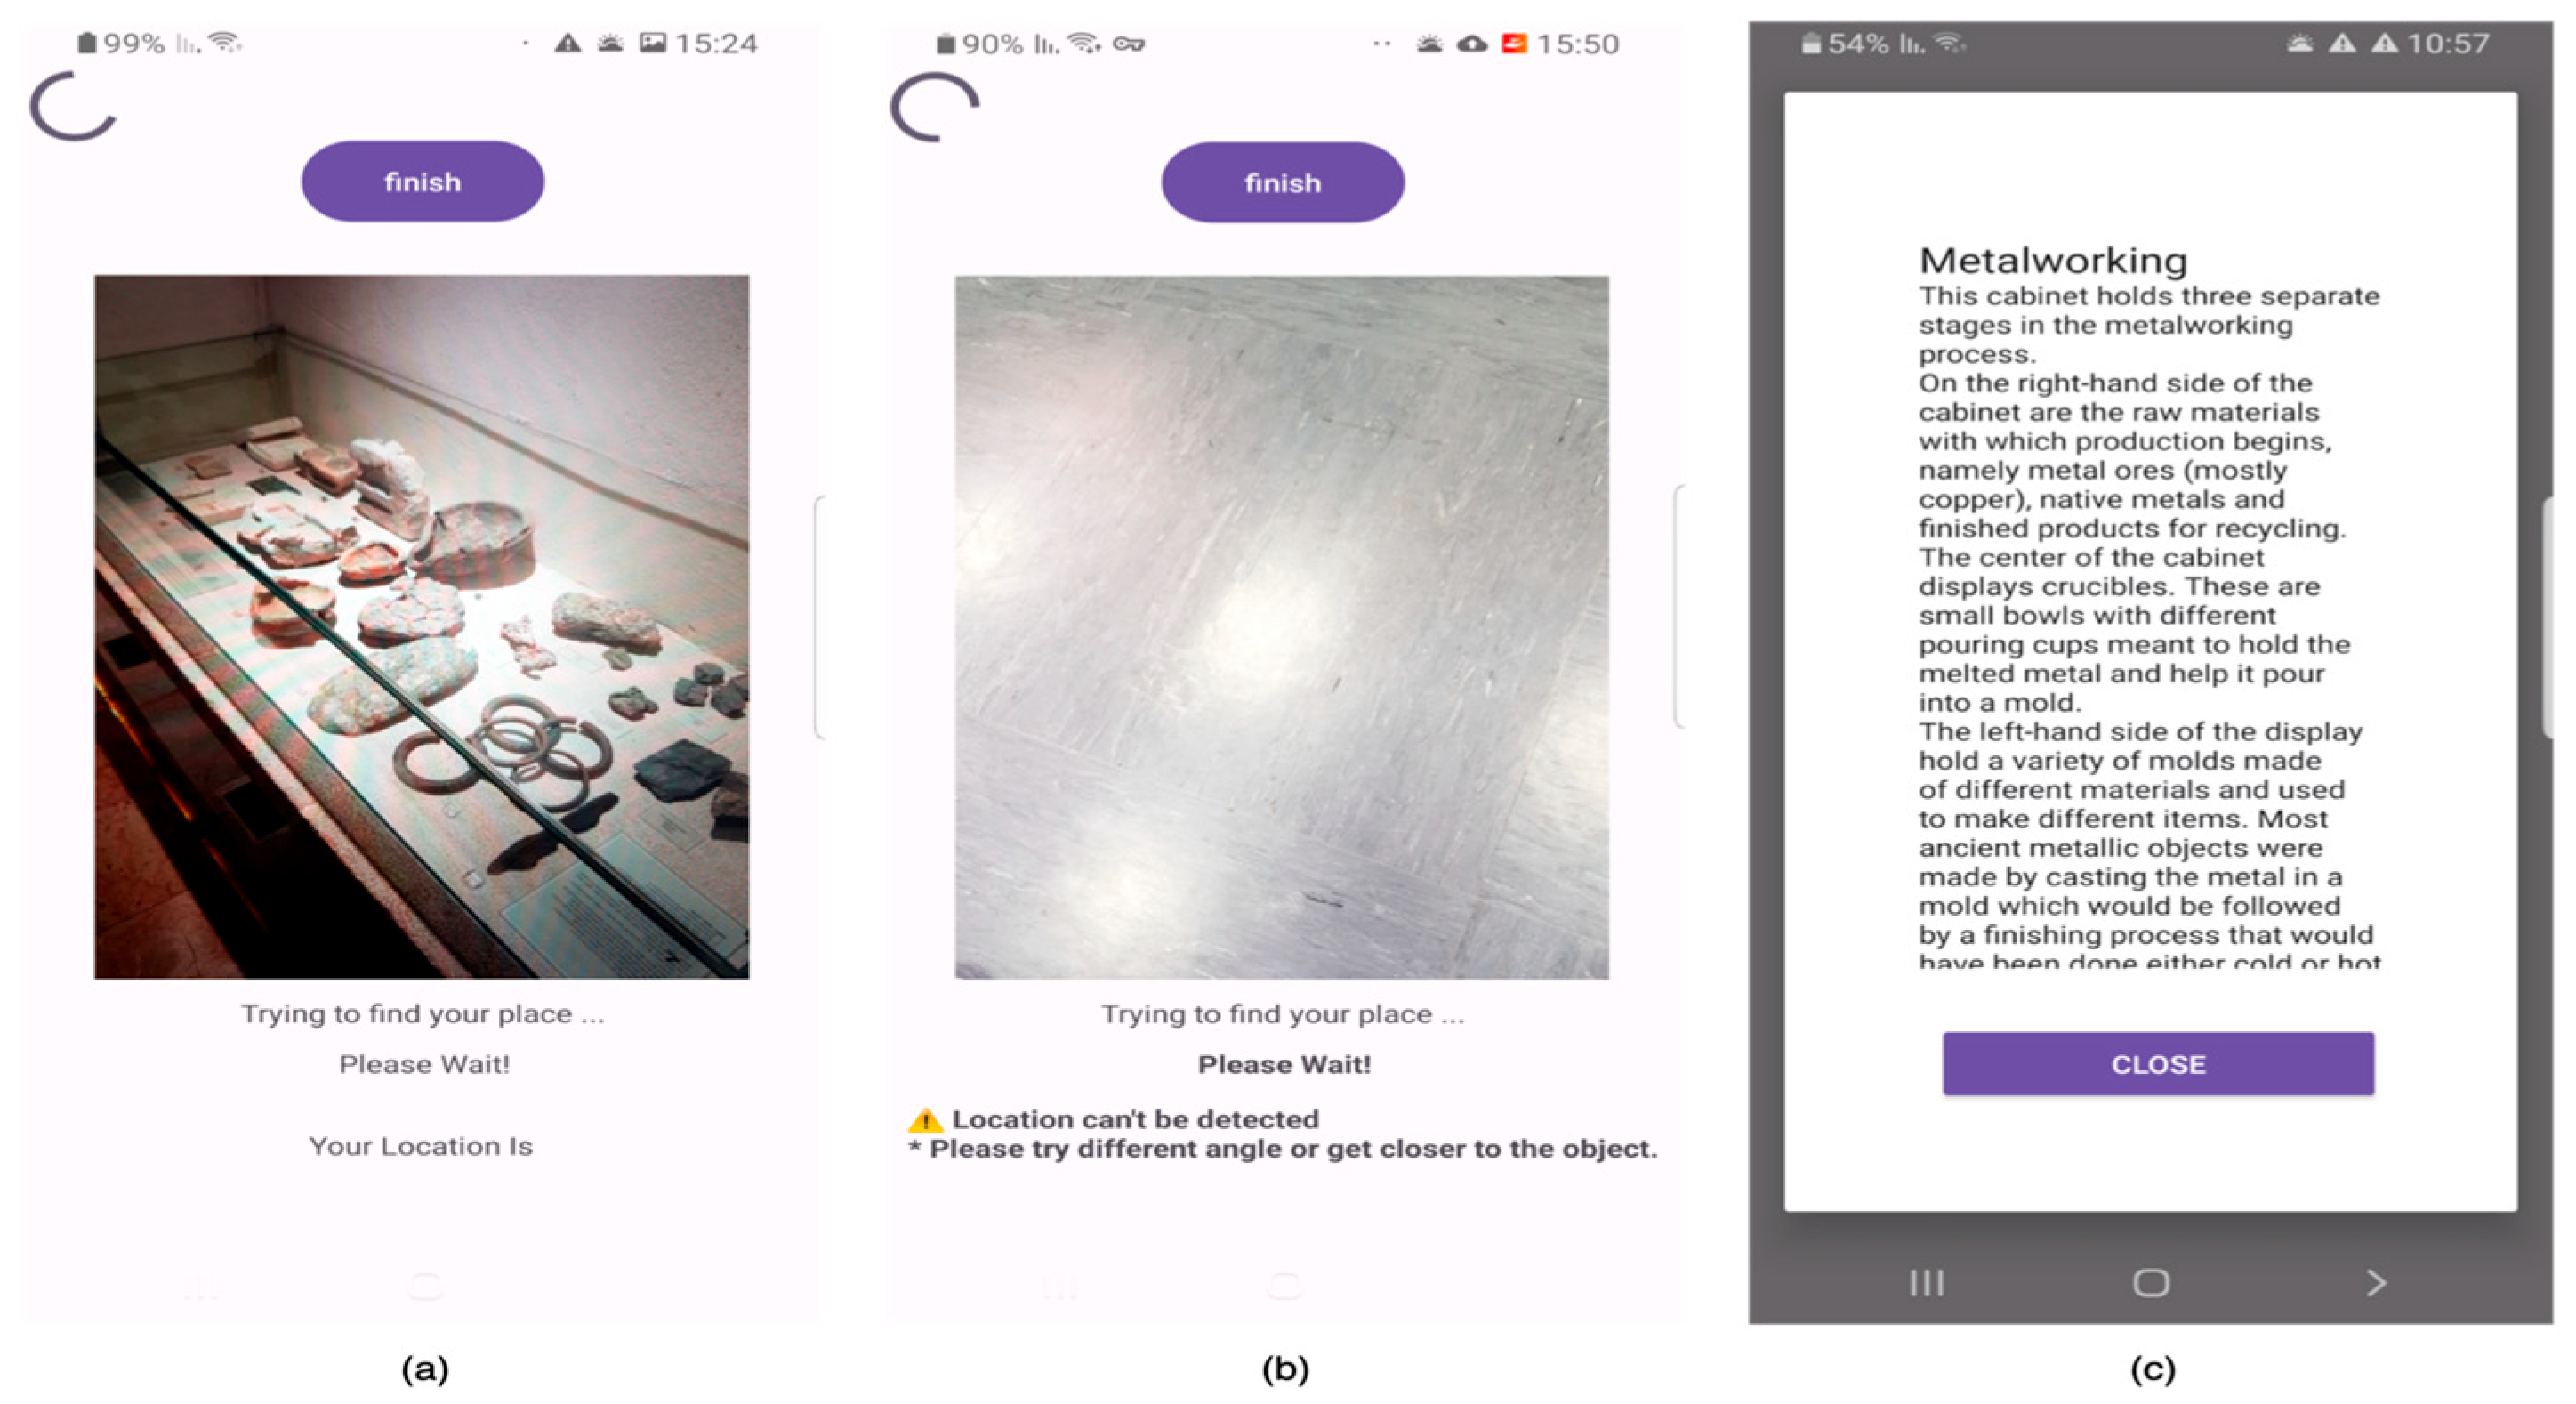
3.2.1. The Mobile App

The app was designed to continuously track the user’s movement within the museum by utilizing the device’s camera. The primary aim is to determine the visitor’s location, specifically identifying which exhibit the visitor is currently viewing. In this context, “location” refers to the exhibit in front of the visitor rather than any arbitrary position within the museum. To achieve this goal, the application incorporates two key functionalities: (1) detecting whether the visitor is standing still in a specific position, and then (2) querying a service with images captured in that position. This process allows the app to accurately identify the visitor’s position within the museum.
Additionally, the application supports an enrichment process intended for museum staff or other designated users. These users can upload content related to specific POIs, which may be a textual description or any kind of multimedia. The app facilitates the submission of this data to a backend service responsible for maintaining and updating the dataset of POIs and their associated content.
This dual functionality ensures that the application not only enhances the visitor experience by providing location-aware content but also continuously improves the museum’s data repository through museum staff members’ contributions.
To determine whether a user is standing still, the application calculates the difference in averages between consecutive images and checks whether the difference remains below a predetermined threshold. This threshold accounts for small movements, ensuring robustness to minor positional adjustments. If the difference stays below the threshold for a continuous duration, configured to be 3 s, the application concludes that the user is stationary. This threshold was chosen to balance accuracy and speed, allowing the system to efficiently process image data in real time.
We aimed to avoid using phone sensors like gyroscopes because these sensors vary across devices, with newer models having better sensors than older ones. Relying on sensors would limit the system’s usability, as our users may use any type of device. Regarding the continuous use of the camera, it does affect the battery; however, other functions of the application are lightweight, so the camera is the primary factor impacting battery life. Nonetheless, this did not present a significant issue, nor did device conditions, such as temperature.
Once the stationary state is detected, an image is captured (see Figure 1a) and transmitted to the backend service. The backend service responds with either a positive or a negative response. If the response is positive, the application displays a pop-up screen with detailed information about the POI, including metadata about the identified location, such as the exhibit’s ID, name, and description (see Figure 1c). If the response is negative, the application continues to capture the image stream and informs the user that the position could not be identified (see Figure 1b).

3.2.2. POI Identification Service

A backend service was built using Python, version 3.11.13. (Python was chosen for this project due to its robust library ecosystem and compatibility with deep learning models, particularly the CLIP model, which contains libraries like Pandas and NumPy, facilitating efficient data manipulation, numerical computations, and model development. Moreover, Python’s seamless integration with frameworks such as TensorFlow allows for the effective implementation of advanced models like CLIP.) It contains a minimal set of images of all the POIs that are stored (these minimal sets are created automatically, as described in Section 3.1.2). For storing the images, we used the NoSql database, MongoDB, so our POIs are stored as documents, each one representing a POI.
The server initiates a search-and-matching process when an image-based query is made by the mobile app. First, it processes the image, returning its corresponding embeddings using CLIP, as described in Section 3.1.1. Then, it iterates over the images that are stored in the database, calculating the Euclidean distance between the input embeddings and each embedding from the database, identifying the embedding that represents the POI, if one exists, as described in Section 3.1.3. If a match is found, information related to the POI is sent back to the app for presentation to the visitor; if no POI is identified, an appropriate message is sent.

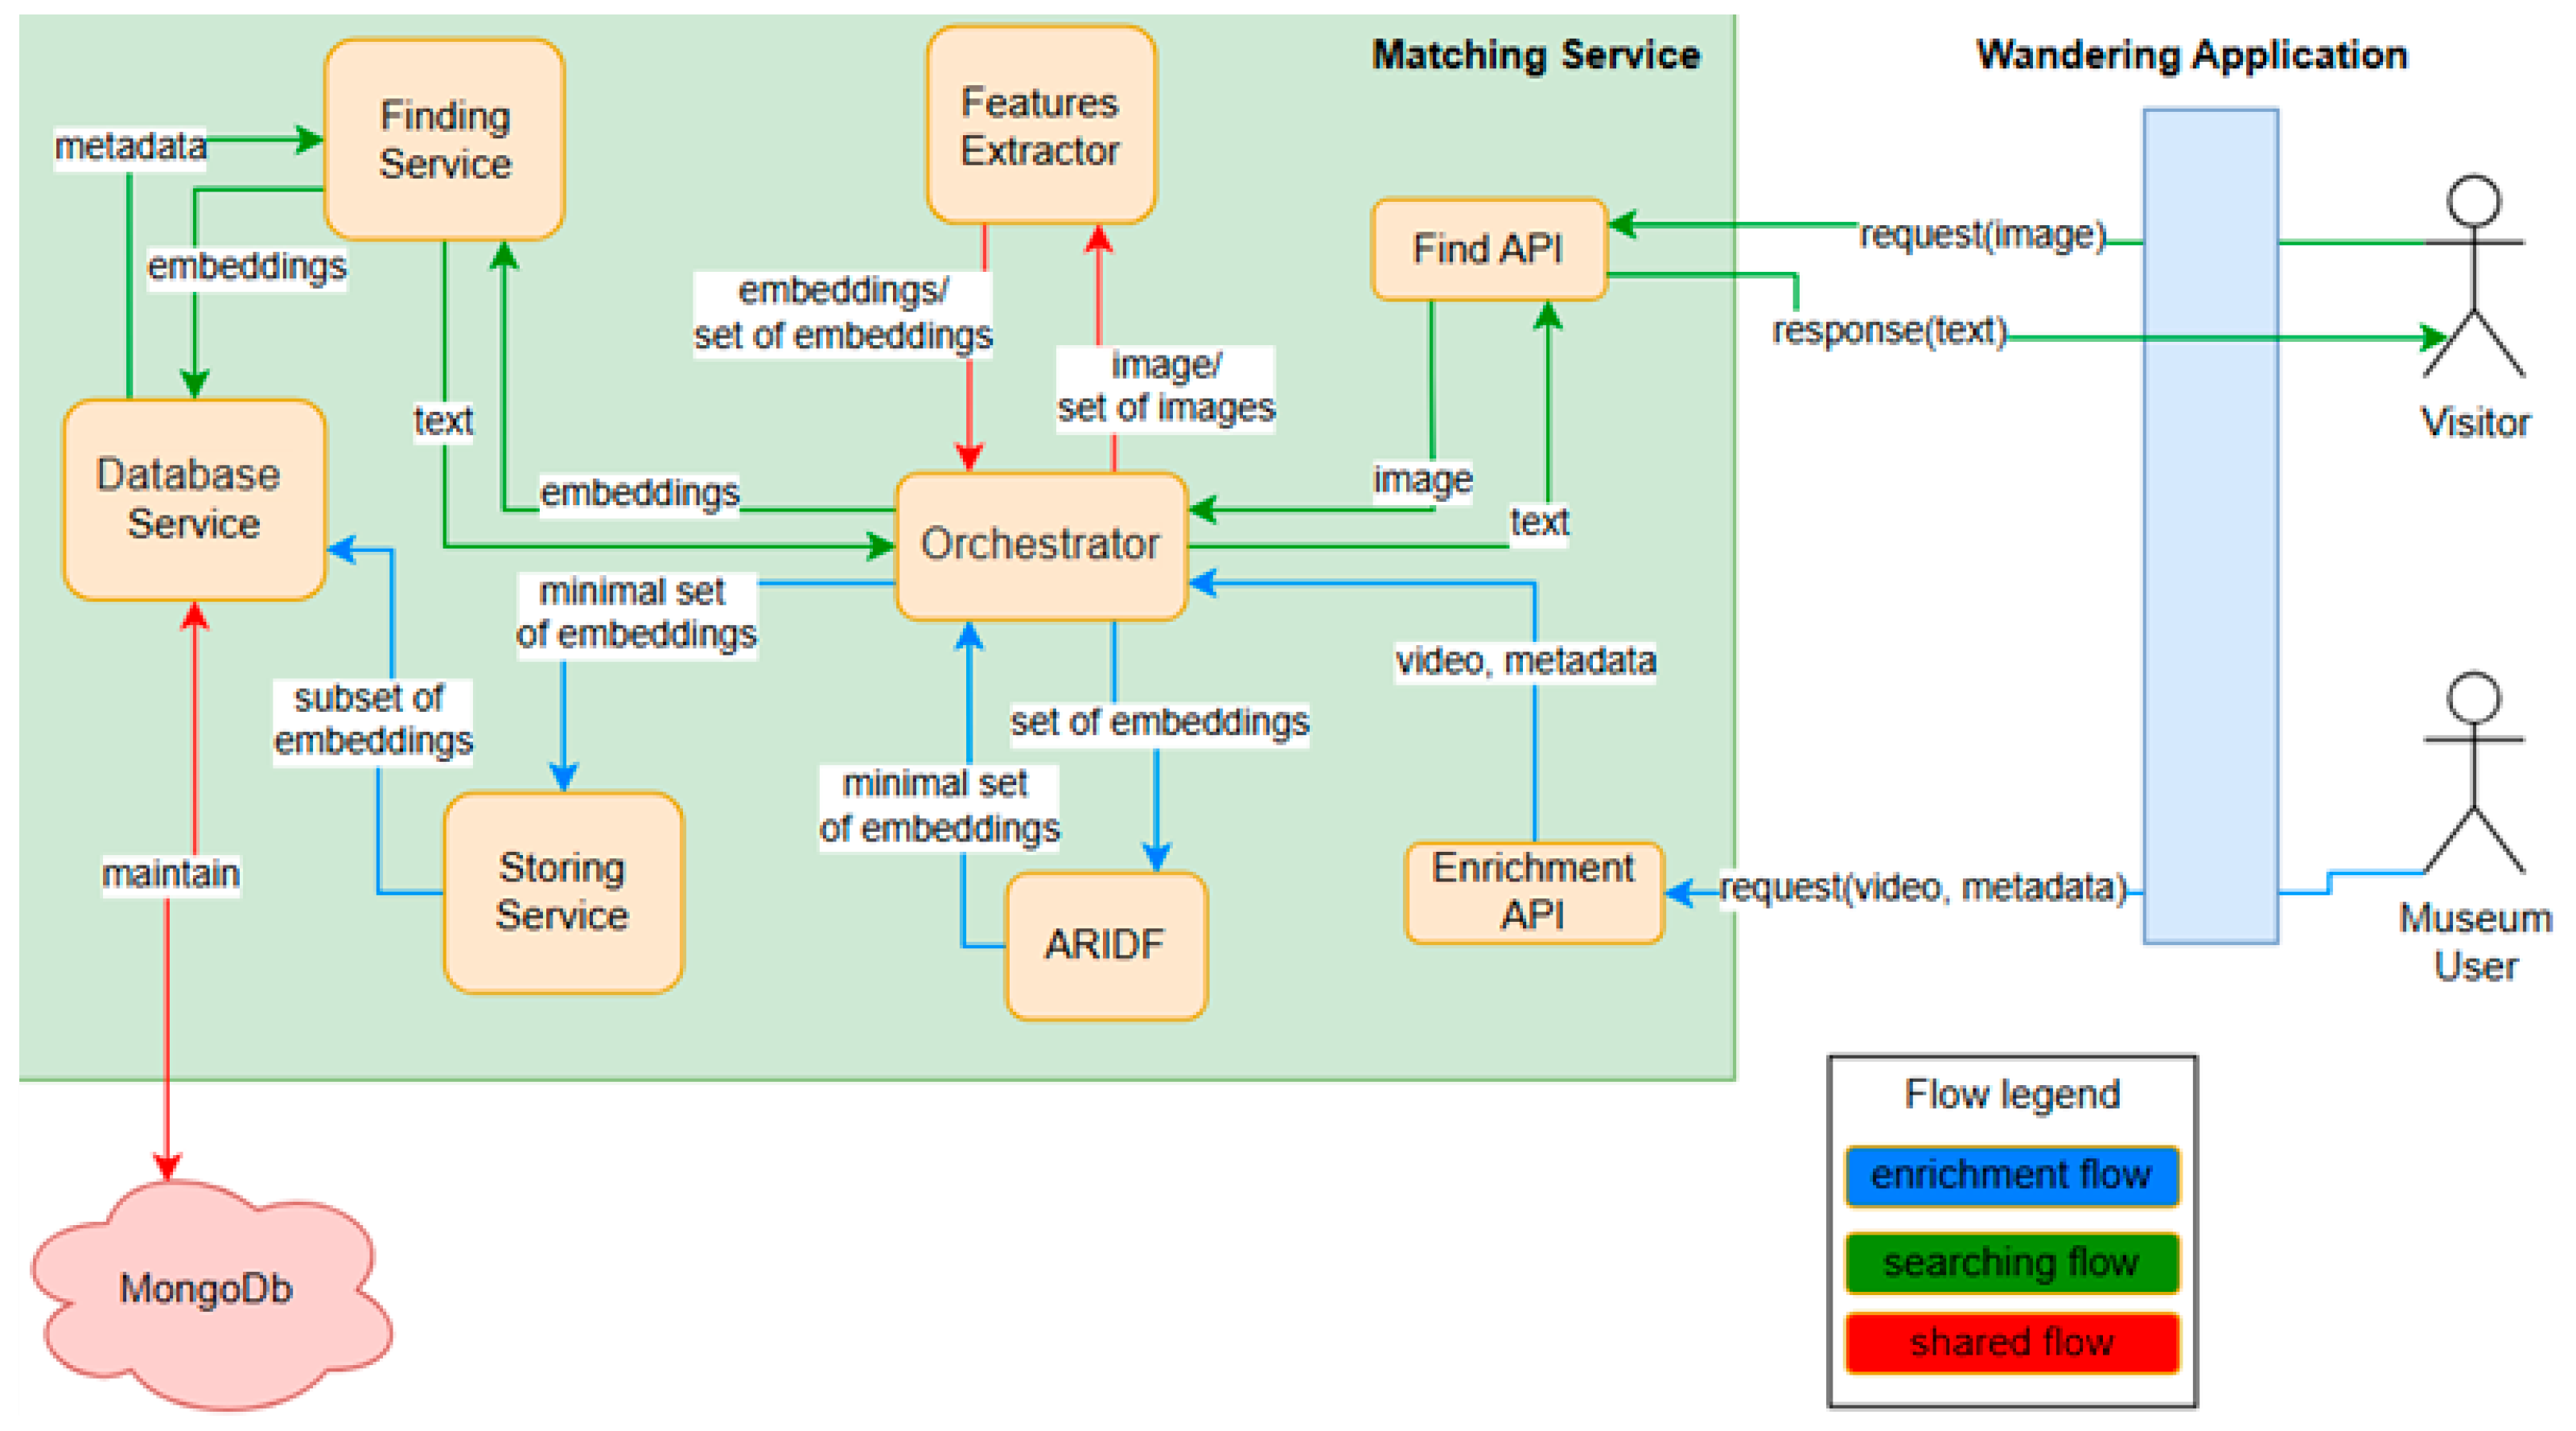
3.2.3. System Architecture

The overall system architecture and the interaction between its components are represented in Figure 2 and briefly described below.
As noted above, there are two different types of users. A visitor and a museum staff member. A visitor may be walking around the museum, using what is called the “Wandering app”, which continuously takes images of the space in front of the user. When the user stands still for three seconds, a request that includes an image is sent via an API to the server—the “Matching service” for POI identification. The actions of the server are controlled by an orchestrator. First, the features of the image are extracted (as described in Section 3.1.1). Then, a matching process takes place using the system’s database (as described in Section 3.1.3). If a match is found, the user is notified and information is delivered via the app; if no match is found, an appropriate message is sent to the app.
A museum staff member may use the app to add new POIs and/or update the content of existing POIs—the staff member uploads a video taken around the POI that is analyzed and stored in the database, together with relevant content (as described in Section 3.1.1 and Section 3.1.2).

3.3. LLM-Assisted Content Creation and Delivery

As we planned to carry out a user study in a realistic setting, we had to develop a complete visitors’ guide system. In addition to the image-based indoor positioning that is at the heart of the system and the main target of the experiment, we had to create relevant content about the different POIs. For this purpose, we decided to follow [37] and to use LLMs for initial content creation that was later validated by the museum staff. Multiple LLMs were experimented with to identify the most concise and clear option. The prompt to the LLMs included the title, an image of the POI, and the following prompt: “Create a short description for the artifact in the attached image.” Gemini API (Gemini 1.0 Pro https://console.cloud.google.com/vertex-ai/publishers/google/model-garden/gemini-pro-vision?hl=it&pli=1, accessed on 12 May 2025) was selected for this purpose, as its generated text proved to be the most satisfactory. The text was subsequently verified, edited, and carefully examined by the authors and the museum staff to ensure its soundness. Once the descriptions were generated, they were added to the dataset of the relevant POIs. When users directed their smartphone cameras at a specific artifact, the system identified the POI and displayed the corresponding description on the screen. In cases where a showcase contained multiple items, the system first presented a general explanation about the items in the showcase and then expanded on several specific items included in the presentation.

4. Experimentation

The primary aim of the experiment was to evaluate the effectiveness and usability of the proposed image-based positioning as part of a mobile, location-aware museum guide.

4.1. Experimental Setup

To achieve this goal, we designed a user study in which participants utilized the museum visitors’ guide system developed for this purpose. The experiment was approved by the IRB of the Faculty of Social Sciences at the University of Haifa (approval number 094/24). It took place at the Hecht Museum (https://mushecht.haifa.ac.il/, accessed on 12 May 2025), situated within the University of Haifa. The museum’s unique environment, rich in archaeological displays and art, offers a diverse array of exhibits that provide a stimulating backdrop for research.
For this experiment, we selected the “Ancient Crafts and Industries” exhibition area, which focuses on seven ancient crafts: metalworking, woodworking, stone vessels, glassmaking, mosaic art, the art of writing, and the physician’s craft. This area includes 29 displays, each showcasing artifacts and information related to these ancient practices.
For each POI, a short video was taken. Most of the videos were short (average duration of about 22.6 s and standard deviation of about 15.3; see Table 2). For each POI, the most representative frames were stored in the database. Figure 3 illustrates the frames selected by the ARIDF that are stored in the database to represent the video describing the “Bronze Vessels” POI.

4.2. Procedure

Upon entering the museum, visitors were approached and given a brief overview of the research. If interested, they signed an informed consent form and were then provided with a detailed explanation of the study. Then, they were provided with an Android device pre-loaded with the application. They were instructed to navigate the designated area and interact with at least 15 POIs from the 29 available in the area. For each POI, participants were required to stand in front of the exhibit and point the device’s camera towards it. The application was expected to present information related to the POI. If the information provided was accurate, the interaction was logged as successful. In cases where the information was incorrect, it was logged as a false positive. If the application failed to recognize the POI, participants could attempt multiple times from different angles or distances. All interactions were automatically logged and also monitored and documented by a researcher accompanying the participant. Upon completing their exploration, participants were asked to fill out a System Usability Score (SUS) [44] questionnaire and participate in a semi-structured interview.

4.3. Participants

Our primary focus was on museum visitors, who generally seem to have an interest in archaeological artifacts. We recruited 30 adult participants without imposing specific demographic restrictions. Although the study was open to all eligible individuals, we particularly targeted older adults, as they are more likely to face challenges with new technologies.

4.4. Data Collection and Analysis

Data collection included the log file from our remote service, which recorded a time-stamped record of every interaction of the visitor with the system, including the images captured, the results of the queries, POI IDs, similarity scores, and response times.
Additionally, participants completed a SUS questionnaire and participated in a semi-structured interview.
Log analysis was used to analyze issues related to the identification of the POIs—errors in identification and the time it took to identify a POI.
For the SUS questionnaire, we utilized an online calculator available at SUS Calculator (https://blucado.com/sus-calculator/, accessed on 12 May 2025).
Regarding the semi-structured interviews, most of the questions required yes/no responses. We reviewed all responses, tallying the number of affirmative and negative answers. For the open-ended questions, we performed a qualitative analysis to identify the most frequently mentioned topics. This process involved categorizing and coding the responses to determine common themes and insights.

4.5. Data Availability

The datasets used and quantitatively analyzed during the current study are available from the corresponding author on reasonable request. The questionnaires are in Hebrew and on paper; we will try to make them available as well.

5. Results

5.1. ARIDF Performance

In most cases, a short video of no more than 100 frames (less than 1 min) was sufficient to represent a POI. This indicates that these videos provided enough data for the ARIDF to successfully create a representative set that accurately reflects the original video. As shown in Table 2, the minimum number of frames selected to represent some POIs was as low as 6, from an initial set of more than 20 frames, demonstrating that many POIs were adequately represented with just 6 frames. On average, the ARIDF reduced the number of frames in the input videos by about three-quarters (from 43.678 frames to 10.071 frames on average). However, there were still some POIs that required longer videos for the ARIDF to adequately represent them, resulting in a larger set of frames being stored in the database. In some cases, this number can exceed 40 frames per POI. This is particularly true for POIs that are large or have multiple viewing angles, such as “Mosaic Art,” which needed coverage from all angles (see Figure 4). Another example is “De Materia Medica by the Greek,” which also has multiple angles, requiring a video that accounts for its three corners and includes overhead coverage.

5.2. Log Analysis

As previously mentioned, we implemented a logging mechanism to monitor every action within the system. This setup enabled us to track each request, including its status, response, and progression, providing insights into system performance and user interactions.

5.2.1. Participants’ Perspective

According to Table 3, 8 out of 30 participants visited at least 20 POIs, more than the required number (15), indicating a high level of engagement. Conversely, some participants found the application less engaging. Despite being asked to visit at least 15 POIs, two participants visited only 12 POIs. However, the overall average number of POIs visited by all participants was 17.53, which exceeds the minimum requirement.
The application demonstrated high reliability, with POIs being identified immediately. POI identification took an average of only 1.145 (STD 0.11) attempts to receive a positive response. In fact, some participants consistently received a positive response on their first attempt throughout the entire experiment. There were also differences in how easily participants could use the application. For example, participant number 19 managed to visit 15 POIs and received a positive response on the first try for all of them, while participant number 3 was less successful.
Additionally, our analytics revealed a low incidence of errors: from 621 tries (Table 2, the number of visits), only in 8 cases was the POI not recognized at all, and in 7 cases the POI was incorrectly recognized (see Table 2, the two right columns: errors and unrecognized POIs). Hence, the system correctly identified the POIs 606 times out of 621 attempts, giving an overall success rate of 97.6% (621 − (8 + 7)/621 = 0.9758), thus making it useful as a basis for a real application.

5.2.2. POI Perspective

The number of frames used for POI representation was not uniformly distributed, as can be seen in Table 2. While most of the POIs were represented by six or seven frames, about 25% required a larger number of frames to be adequately represented, leading to a larger number of attempts before a POI was identified. For example, for the POI “De Materia Medica by the Greek”, a high average number of attempts was needed for successful recognition, indicating that participants had to try more than with other POIs to achieve a correct identification. This suggests that this POI was particularly challenging.
Another issue worth mentioning occurred with the POI “Glassmaking-Part 2.” As indicated in Table 3, this POI was incorrectly recognized twice, which is relatively high compared to other POIs. In both cases, the POI was mistakenly identified as “Producing the Raw Glass-Part 1.” This error is understandable, as these two POIs appear quite similar (see Figure 5), leading to confusion and incorrect recognition. Although we at-tempted to resolve this by uploading more videos for each of these POIs, the solution was not particularly effective. Thus, determining the best approach to handle such cases remains an open question.

5.3. SUS Score

The average SUS score for all 30 participants was 87.08, which is classified as an excellent rating (according to [45], a score within the range of approximately 85 to 100 is typically deemed “Excellent”), signifying a high level of perceived usability of the system. This result indicates that users found the system highly intuitive and easy to use, requiring minimal effort to learn and navigate.

5.4. Qualitative Findings

The qualitative findings from the semi-structured interviews provide insights into the user experience and the perceived effectiveness of the system. Given the performance of the system, as already reported, most of the answers were simple and short, with little elaboration, if any. Next is a summary of the responses to each interview question.

5.4.1. Errors in Location Identification

Among the 30 participants, there were only 7 instances of incorrect location identification out of more than 500 requests. These findings were already discussed.

5.4.2. Total Number of Location Queries

The participants made a total of approximately 559 location queries, averaging about 17.5 requests per user, which is above the average of 15. This suggests that users were actively engaging with the system.

5.4.3. Perceived Response Time

Regarding the system’s response time, one user reported that the response time was too long, ten users indicated that it was “a little” too long, and the remaining users felt that the response time was satisfactory. This feedback suggests that while most users were satisfied with the response time, there is room for improvement to enhance the user experience.

5.4.4. Instances of Failure in Location Identification

Among all thirty participants, there were only eight instances where the system failed to identify a location out of more than 500 requests.

5.4.5. Clarity of Location Search Initiation

When asked if it was clear when the application started searching for their location, 29 participants answered “yes,” while 2 participants responded “no.” This indicates that the majority of users found the system’s cues for initiating location searches to be clear and understandable.

5.4.6. Clarity of Location Search Identification

All 30 participants responded “yes” when asked if it was clear when their location was identified. This unanimous positive feedback highlights the system’s effectiveness in communicating successful location identification.

5.4.7. General Feedback About the System

The open-ended question about general feedback yielded predominantly positive responses, such as “Easy to use,” “Great app,” “Encouraging to visit the museum”, “Working great”, “Recommended app”, and “Understandable flow.” However, two users mentioned that they needed a little help or guidance when first using the app, suggesting a potential area for improving the onboarding experience.

5.4.8. Suggestions for Improvement

Participants also provided constructive feedback for enhancing the system. The most frequently mentioned suggestions included support for different languages (eight mentions) and audio description (eight mentions), faster response times (four mentions), improvements to the app’s design (three mentions), clearer instructions (two mentions), enriching descriptions with images and links (one mention), and making the system more interactive by answering user questions (one mention). These suggestions offer valuable insights into potential areas for future development.

6. Discussion

The results of the experiment conducted at the Hecht Museum provide valuable insights into the potential of the proposed image-based POI identification approach. Additionally, we received feedback regarding the application’s usability, comfort, quality, and accuracy in delivering a seamless user experience within a real-world setting. All in all, our hypothesis that accurate and quick image-based POI identification that is independent of the museum infrastructure will contribute to visitors’ satisfaction was confirmed. It is important to note that similar work was performed by Xia et al. [13]. However, our approach differs in several ways: we optimized the image dataset creation to reduce the computational effort of image matching, employed deep learning for image matching, achieved higher accuracy, and conducted a user study to evaluate our approach in a realistic setting. Below, we further discuss the implications of our results. When planning an experiment in a realistic setting, it is essential to have a high-quality and robust system so users can enjoy the system and evaluate the novel contribution without being hindered by usability issues. This is evident from the feedback received, as discussed further below.

6.1. Accuracy

One of the primary objectives of this experiment was to evaluate the application’s accuracy in identifying and providing information about various POIs. As outlined in the quantitative findings section, the results are highly promising, with only 7 instances of incorrect location identification out of 621 queries and just 8 instances of failed location identification. These low error rates demonstrate the application’s reliability and accuracy in delivering the correct information, which is crucial for maintaining user trust and satisfaction.
The quantitative findings also indicate that most issues occurred with specific POIs, suggesting that certain POIs are more challenging due to factors such as lighting effects, size, position, structure, and more. A possible solution that worked for us was creating a comprehensive video that captures the POI from all relevant viewing angles.
Another challenge arose when two POIs were very similar. The visual similarity between POIs sometimes led to identification errors. This issue underscores the complexity of accurately distinguishing between similar exhibits. This remained an unresolved issue that requires further research.

6.2. Quality and Performance

The identification of the POIs was very good, demonstrating the quality of the suggested solution, as was evident from the small number of attempts to identify a POI and the small number of errors. While the response time was generally satisfactory for most users, it was identified as an area for potential improvement, as about a third of the participants noted the need for a quicker system response. Improving the application’s responsiveness could further enhance the user experience, minimizing moments of frustration or disengagement. One possible solution for the process is optimizing the search by considering the visitor’s movement history, searching for POIs in the visitor’s vicinity, and considering the visitor’s direction.

6.3. Usability

The System Usability Scale (SUS) score of 87.08, categorized as “Excellent,” is a strong indicator of the application’s high usability. This score not only reflects the ease with which participants navigated the application but also suggests that the application requires minimal effort to learn and use, which is crucial for user adoption and satisfaction. The SUS score places the application in the top tier of systems, making it highly competitive in the realm of digital tools designed for museum environments or similar contexts.
The positive responses from participants underscore the success of the application in delivering a user-friendly experience that is accessible even to those who might typically struggle with technology.

6.4. Users’ Comfort

Comfort, both physical and cognitive, is another critical aspect of user experience. The experiment’s results indicate that the application successfully provided a comfortable user experience, with users able to easily interact with the system and understand its functionality. The fact that 29 out of 30 participants found the location search initiation cues to be clear and that all participants understood when their location was identified underscores the clarity and accessibility of the application’s interface.

6.5. Enjoyment and Engagement

The experiment highlighted the application’s success in engaging users, as demonstrated by the active participation and the generally positive feedback. The application not only facilitated an informative and enjoyable experience but also encouraged participants to explore the museum in greater depth. Comments like “Encouraging to visit the museum” suggest that the application has the potential to significantly enhance visitor engagement and satisfaction, which is a key goal of the solution.
The constructive feedback provided by participants offers valuable insights into areas for further development. The most common suggestions, such as the need for faster response times, more interactive features, and support for additional languages, provide a clear roadmap for future iterations of the application. By addressing these areas, the application can evolve to better meet the needs of a broader audience and provide an even more enriched user experience.

6.6. Contribution

The field of indoor localization within cultural heritage sites presents unique challenges that differ significantly from those encountered in other environments. Unlike conventional indoor localization systems, which are typically designed for locations such as shopping malls or office buildings, cultural heritage sites like museums and historical landmarks require localization solutions that are not only accurate but also sensitive to the context and significance of the environment. These sites often feature complex layouts, dense exhibits, and a rich array of POIs, all of which must be navigated in a manner that enhances, rather than detracts from, the visitor’s experience.
One of the primary difficulties in developing indoor localization systems for cultural heritage sites is the need to balance technological innovation with the preservation of the site’s integrity. Any solution must be unobtrusive, ensuring that the technology does not overshadow the cultural and educational value of the exhibits. Additionally, the system must be robust enough to handle the unique architectural features of heritage sites, such as thick walls, varied room sizes, and often limited or inconsistent lighting conditions. These factors can significantly impact the performance of traditional localization technologies, making it difficult to achieve the level of accuracy and reliability required.
Our proposed application addresses these challenges by integrating an image-based POI identification service into a user-friendly interface tailored to the needs of cultural heritage sites. The application’s ability to accurately identify and provide information about various POIs, even in the complex environment of the Hecht Museum, demonstrates its potential as a valuable tool for indoor localization in similar contexts. By utilizing the camera on a mobile device, the application minimizes the need for additional infrastructure, such as beacons or Wi-Fi triangulation, which can be intrusive or challenging to deploy in historical settings.

6.7. Limitations

While the experiment yielded valuable insights, it is important to acknowledge its limitations. The study was conducted within a specific area of the Hecht Museum, focusing on the “Ancient Crafts and Industries” section with a limited number of POIs. This restricted scope may not fully represent the application’s performance in other museum settings or with a broader range of exhibits. Additionally, the application relies on wireless or device connectivity to upload requests and download responses, a feature that may not be available in every indoor environment. This dependence on connectivity could limit the app’s effectiveness in settings with poor or no network coverage.
Another limitation is the lack of demographic information. Since we approached regular visitors, we tried to avoid invasive questions.
While we experimented with real visitors, 30 participants is a small number, but still provided very encouraging results. Future work may consider a longitudinal study for better evaluation.
Finally, as this was an exploratory study and since there is no indoor positioning system installed at the Hecht Museum (like many other cultural heritage sites), we did not compare the accuracy and speed of our approach with any baseline.

7. Conclusions and Future Work

Our goal was to explore the potential of image-based POI identification in a realistic setting. The results of the experiment conducted at the Hecht Museum demonstrated that an image-based POI identification system can be effectively designed to create a robust and user-friendly application, as indicated by the log analysis as well as by the high SUS score and positive feedback from participants.
The experiment also identified several practical areas for future development to enhance the application’s usability and effectiveness, including fine-tuning the system’s response time, adding language support, and providing audio commentary.
Future research should explore the application’s effectiveness in larger and more diverse museums, where it may encounter different challenges in terms of layout, exhibit types, and visitor interactions, as well as varying levels of connectivity.
Moreover, it may be interesting to evaluate the accuracy and speed of the suggested approach with existing systems that are based on other indoor positioning technologies and to perform a longitudinal study over a long period of time.
During the preparation of this work, the author(s) used ChatGPT version 4 to enhance the text and improve clarity. After using this tool, the author(s) reviewed and edited the content as needed and take(s) full responsibility for the content of the publication.

Author Contributions

Conceptualization, B.E., R.D., T.K., and I.S.; methodology, B.E., R.D., T.K., and I.S.; software, B.E.; validation, B.E., R.D., T.K., and I.S.; data curation, B.E.; writing—original draft preparation, B.E.; writing—review and editing, B.E., R.D., T.K., and I.S.; supervision, R.D., T.K., and I.S. All authors have read and agreed to the published version of the manuscript.

Funding

This research received no external funding.

Data Availability Statement

The original data presented in the study are openly available in https://github.com/basharE/ThesisData and the code is available in https://github.com/basharE/MatchingService.

Acknowledgments

The authors would like to thank the Hecht Museum for allowing us to use the museum for the user study.

Conflicts of Interest

The authors declare no conflict of interest.

References

  1. Misra, P. Global Positioning system: Signals. Measurements, and Performance; Ganga-Jamuna Press: Nanded, India, 2006. [Google Scholar]
  2. Morley, S.K.; Sullivan, J.P.; Carver, M.R.; Kippen, R.M.; Friedel, R.H.W.; Reeves, G.D.; Henderson, M.G. Energetic particle data from the global positioning system constellation. Space Weather 2017, 15, 283–289. [Google Scholar] [CrossRef]
  3. Brena, R.F.; García-Vázquez, J.P.; Galván-Tejada, C.E.; Muñoz-Rodriguez, D.; Vargas-Rosales, C.; Fangmeyer, J., Jr. Evolution of indoor positioning technologies: A survey. J. Sens. 2017, 2017, 2630413. [Google Scholar] [CrossRef]
  4. Wahab, N.H.A.; Sunar, N.; Ariffin, S.H.; Wong, K.Y.; Aun, Y. Indoor positioning system: A review. Int. J. Adv. Comput. Sci. Appl. 2022, 13, 477–490. [Google Scholar] [CrossRef]
  5. Chintalapudi, K.; Padmanabha Iyer, A.; Padmanabhan, V.N. Indoor localization without the pain. In Proceedings of the Sixteenth Annual International Conference on Mobile Computing and Networking, Chicago, IL, USA, 20–24 September 2010; pp. 173–184. [Google Scholar] [CrossRef]
  6. Bai, Y.B.; Wu, S.; Wu, H.R.; Zhang, K. Overview of RFID-Based Indoor Positioning Technology. GSR, 2012. Available online: https://ceur-ws.org/Vol-1328/GSR2_Bai.pdf (accessed on 12 May 2025).
  7. Gu, Y.; Chen, M.; Ren, F.; Li, J. HED: Handling environmental dynamics in indoor WiFi fingerprint localization. In Proceedings of the 2016 IEEE Wireless Communications and Networking Conference, Doha, Qatar, 3–6 April 2016; pp. 1–6. [Google Scholar]
  8. Bai, L.; Ciravegna, F.; Bond, R.; Mulvenna, M. A low cost indoor positioning system using bluetooth low energy. IEEE Access 2020, 8, 136858–136871. [Google Scholar] [CrossRef]
  9. Gupta, P.; Sharma, V.; Gairolla, J.; Thakur, U.; Pandey, N.; Khurana, D.; Ramavat, A.S. Mobile Based Indoor Hospital Navigation System for Tertiary Care Setup: A Scoping Review. 2024; preprint. [Google Scholar]
  10. Zhang, L.; Huang, L.; Yi, Q.; Wang, X.; Zhang, D.; Zhang, G. Positioning method of pedestrian dead reckoning based on human activity recognition assistance. In Proceedings of the 2022 IEEE 12th International Conference on Indoor Positioning and Indoor Navigation (IPIN), Beijing, China, 5–7 September 2022; pp. 1–8. [Google Scholar]
  11. Naser, R.S.; Lam, M.C.; Qamar, F.; Zaidan, B.B. Smartphone-based indoor localization systems: A systematic literature review. Electronics 2023, 12, 1814. [Google Scholar] [CrossRef]
  12. Kuflik, T.; Stock, O.; Zancanaro, M.; Gorfinkel, A.; Jbara, S.; Kats, S.; Sheidin, J.; Kashtan, N. A visitor’s guide in an active museum: Presentations, communications, and reflection. J. Comput. Cult. Herit. 2011, 3, 1–25. [Google Scholar] [CrossRef]
  13. Xia, Y.; Xiu, C.; Yang, D. Visual indoor positioning method using image database. In Proceedings of the 2018 Ubiquitous Positioning, Indoor Navigation and Location-Based Services (UPINLBS), Wuhan, China, 22–23 March 2018; pp. 1–8. [Google Scholar]
  14. Liu, X.; Huang, H.; Hu, B. Indoor Visual Positioning Method Based on Image Features. Sensors Mater. 2022, 34, 337–348. [Google Scholar] [CrossRef]
  15. Brusch, I. Identification of travel styles by learning from consumer-generated images in online travel communities. Inf. Manag. 2022, 59, 103682. [Google Scholar] [CrossRef]
  16. Youssef, M.A.; Agrawala, A.; Shankar, A.U. WLAN location determination via clustering and probability distributions. In Proceedings of the First IEEE International Conference on Pervasive Computing and Communications, 2003 (PerCom 2003), Fort Worth, TX, USA, 23–26 March 2003; pp. 143–150. [Google Scholar]
  17. Feldmann, S.; Kyamakya, K.; Zapater, A.; Lue, Z. An Indoor Bluetooth-Based Positioning System: Concept, Implementation and Experimental Evaluation. In Proceedings of the International conference on wireless networks, Las Vegas, NV, USA, 23–26 June 2003; Volume 272. [Google Scholar]
  18. Renaudin, V.; Yalak, O.; Tomé, P.; Merminod, B. Indoor navigation of emergency agents. Eur. J. Navig. 2007, 5, 36–45. [Google Scholar]
  19. Chen, R.; Chen, L. Smartphone-based indoor POI positioning. Urban Inform. 2021, 3, 467–490. [Google Scholar]
  20. Barbour, N.; Schmidt, G. Inertial sensor technology trends. IEEE Sensors J. 2001, 1, 332–339. [Google Scholar] [CrossRef]
  21. Cohen, N.; Dror, R.; Klein, I. Diffusion-Driven Inertial Generated Data for Smartphone Location Classification. arXiv 2025, arXiv:2504.15315. [Google Scholar]
  22. Wang, S.S. A BLE-based pedestrian navigation system for car searching in indoor parking garages. Sensors 2018, 18, 1442. [Google Scholar] [CrossRef] [PubMed]
  23. Sawaby, A.M.; Noureldin, H.M.; Mohamed, M.S.; Omar, M.O.; Shaaban, N.S.; Ahmed, N.N.; Elhadidy, S.; Hassan, A.; Mostafa, H. A smart indoor navigation system over BLE. In Proceedings of the 2019 8th International Conference on Modern Circuits and Systems Technologies (MOCAST), Thessaloniki, Greece, 13–15 May 2019; pp. 1–4. [Google Scholar]
  24. Elmenreich, W. An Introduction to Sensor Fusion; Technical Report; Vienna University of Technology: Vienna, Austria, 2002; Volume 502, pp. 1–28. [Google Scholar]
  25. Piras, M.; Lingua, A.; Dabove, P.; Aicardi, I. Indoor navigation using Smartphone technology: A future challenge or an actual possibility? In Proceedings of the 2014 IEEE/ION Position, Location and Navigation Symposium-PLANS 2014, Monterey, CA, USA, 5–8 May 2014; pp. 1343–1352. [Google Scholar]
  26. Geok, T.K.; Aung, K.Z.; Aung, M.S.; Soe, M.T.; Abdaziz, A.; Liew, C.P.; Hossain, F.; Tso, C.P.; Yong, W.H. Review of indoor positioning: Radio wave technology. Appl. Sci. 2020, 11, 279. [Google Scholar] [CrossRef]
  27. Morris, T. Computer Vision and Image Processing; Palgrave Macmillan Ltd.: New York, NY, USA, 2004. [Google Scholar]
  28. Morar, A.; Moldoveanu, A.; Mocanu, I.; Moldoveanu, F.; Radoi, I.E.; Asavei, V.; Gradinaru, A.; Butean, A. A comprehensive survey of indoor localization methods based on computer vision. Sensors 2020, 20, 2641. [Google Scholar] [CrossRef]
  29. Cheng, J.; Zhang, L.; Chen, Q.; Hu, X.; Cai, J. A review of visual SLAM methods for autonomous driving vehicles. Eng. Appl. Artif. Intell. 2022, 114, 104992. [Google Scholar] [CrossRef]
  30. Cavallari, T.; Golodetz, S.; Lord, N.A.; Valentin, J.; Prisacariu, V.A.; Di Stefano, L.; Torr, P.H. Real-time RGB-D camera pose estimation in novel scenes using a relocalisation cascade. IEEE Trans. Pattern Anal. Mach. Intell. 2019, 42, 2465–2477. [Google Scholar] [CrossRef]
  31. Wecker, A.J.; Lanir, J.; Kuflik, T.; Stock, O. Where to go and how to get there: Guidelines for indoor landmark-based navigation in a museum context. In Proceedings of the 17th International Conference on Human-Computer Interaction with Mobile Devices and Services Adjunct, Copenhagen, Denmark, 24–27 August 2015; pp. 789–796. [Google Scholar]
  32. Stock, O.; Zancanaro, M.; Busetta, P.; Callaway, C.; Krüger, A.; Kruppa, M.; Kuflik, T.; Not, E.; Rocchi, C. Adaptive, intelligent presentation of information for the museum visitor in PEACH. User Model. User-Adapt. Interact. 2007, 17, 257–304. [Google Scholar] [CrossRef]
  33. Kuflik, T.; Lanir, J.; Dim, E.; Wecker, A.; Corra, M.; Zancanaro, M.; Stock, O. Indoor positioning: Challenges and solutions for indoor cultural heritage sites. In Proceedings of the 16th International Conference on Intelligent User Interfaces, Palo Alto, CA, USA, 13–16 February 2011; pp. 375–378. [Google Scholar]
  34. Jiang, Y.; Zheng, X.; Feng, C. Toward Multi-area Contactless Museum Visitor Counting with Commodity WiFi. ACM J. Comput. Cult. Herit. 2023, 16, 1–26. [Google Scholar] [CrossRef]
  35. Meliones, A.; Sampson, D. Blind MuseumTourer: A system for self-guided tours in museums and blind indoor navigation. Technologies 2018, 6, 4. [Google Scholar] [CrossRef]
  36. Trichopoulos, G.; Konstantakis, M.; Caridakis, G.; Katifori, A.; Koukouli, M. Crafting a Museum Guide Using ChatGPT4. Big Data Cogn. Comput. 2023, 7, 148. [Google Scholar] [CrossRef]
  37. Dror, R.; Hutchinson, D.; Jones, M.; Van Hyning, V.; Kuflik, T. The Curator’s Helper. In Proceedings of the 32nd ACM Conference on User Modeling, Adaptation and Personalization, New York, NY, USA, 16–19 June 2024; pp. 496–504. [Google Scholar]
  38. Yang, S.; Ma, L.; Jia, S.; Qin, D. An improved vision-based indoor positioning method. IEEE Access 2020, 8, 26941–26949. [Google Scholar] [CrossRef]
  39. Lowe, D.G. Distinctive image features from scale-invariant keypoints. Int. J. Comput. Vis. 2004, 60, 91–110. [Google Scholar] [CrossRef]
  40. Rublee, E.; Rabaud, V.; Konolige, K.; Bradski, G. ORB: An efficient alternative to SIFT or SURF. In Proceedings of the 2011 International Conference on Computer Vision, Barcelona, Spain, 6–13 November 2011; pp. 2564–2571. [Google Scholar]
  41. He, K.; Zhang, X.; Ren, S.; Sun, J. Deep residual learning for image recognition. In Proceedings of the IEEE Conference on Computer Vision and Pattern Recognition, Las Vegas, NV, USA, 27–30 June 2016; pp. 770–778. [Google Scholar]
  42. Radford, A.; Kim, J.W.; Hallacy, C.; Ramesh, A.; Goh, G.; Agarwal, S.; Sastry, G.; Askell, A.; Mishkin, P.; Clark, J.; et al. Learning transferable visual models from natural language supervision. In Proceedings of the International Conference on Machine Learning, PMLR, online, 18–24 July 2021; pp. 8748–8763. [Google Scholar]
  43. Mokatren, M.; Kuflik, T.; Shimshoni, I. ARIDF: Automatic Representative Image Dataset Finder for Image Based Localization. In Proceedings of the 30th ACM Conference on User Modeling, Adaptation and Personalization, Barcelona, Spain, 4–7 July 2022; pp. 383–390. [Google Scholar]
  44. Brooke, J. SUS-A quick and dirty usability scale. Usability Eval. Ind. 1996, 189, 4–7. [Google Scholar]
  45. Bangor, A.; Kortum, P.; Miller, J. Determining what individual SUS scores mean: Adding an adjective rating scale. J. Usability Stud. 2009, 4, 114–123. [Google Scholar]
Figure 1. Application screenshots: (a) A screenshot displaying a museum exhibit, where the POI is recognized. The application is actively attempting to determine the exhibit’s position, sending a request and awaiting a response. (b) A screenshot showing a random position that is not stored in the database. The instructions on the screen inform the user that “Location can’t be detected” and advise them to “Please try a different angle or get closer to the object.” (c) A screenshot showing a successful response for the scenario in (a), where the position has been accurately detected. The relevant data is retrieved from the database and presented to the user.
Heritage 08 00266 g001
Figure 2. The overall architecture of the system and the interaction of the wandering application with the backend service.
Heritage 08 00266 g002
Figure 3. The frames selected by the ARIDF that are stored in the database to represent the video describing the “Bronze Vessels” POI. These frames are not necessarily in the same order as they appear in the original video. In this particular instance, the frames are sorted as in the original sequence, but this is not the case for all videos. According to the ARIDF, frame (1) represents 5 other frames, (2) represents 1, (3) represents 1, (4) represents 15, (5) represents 1, and frame (6) represents 4; these cover the whole 27 frames extracted from the “Bronze Vessels” video.
Heritage 08 00266 g003
Figure 4. (1) The “De Materia Medica by the Greek” POI, which has many possible viewing angles that need to be considered; (2) the “Mosaic Art” POI, located in the center of the “Ancient Crafts and Industries” exhibition area. The identification of this central POI requires a greater variety of viewing angles around it.
Heritage 08 00266 g004
Figure 5. (1) Glassmaking-Part2; (2) Producing the Raw Glass-Part1.
Heritage 08 00266 g005
Table 1. A summary of the advantages and disadvantages of the different methods.
MethodAdvantagesDisadvantages
Wi-Fi TriangulationWidely available in most indoor environments.
Cost-effective as it uses existing Wi-Fi networks.
Susceptible to interference from walls and objects.
Limited accuracy in complex or crowded environments.
Bluetooth Beacons (BLE)Low power consumption.
Easy to deploy.
Provides good accuracy within short ranges.
Requires maintenance or infrastructure (power).
Signal may weaken in large spaces or through obstacles.
RFIDHigh precision for short-range localization.
No reliance on batteries for tags.
Limited range.
Expensive to deploy over large areas.
Requires specialized readers.
Inertial SensorsCan work without external infrastructure.
Suitable for real-time tracking.
Accumulates errors over time (drift).
Limited standalone accuracy.
Computer VisionHigh accuracy in recognizing locations and landmarks.
Cost-effective using existing cameras.
Dependent on lighting conditions.
Computationally intensive.
Accuracy can be impacted by moving objects.
Visual SLAMProvides simultaneous localization and mapping.
Works in real time for dynamic environments.
High computational cost.
Requires advanced hardware for real-time processing.
Augmented RealityEnhances user engagement.
Real-time overlay of information onto the environment.
Requires advanced hardware for real-time processing.
Limited accuracy for large or cluttered spaces.
High battery usage in devices.
Landmark RecognitionHigh reliability using unique landmarks.
Improves accuracy with sensor fusion.
Requires pre-mapped landmarks.
Less effective in environments lacking distinctive features.
Sensor FusionCombines data from multiple sources for improved accuracy.
Works in diverse conditions.
High computational complexity.
May require multiple sensors, increasing system cost.
Smartphones (General)Widely available and versatile.
Integrates multiple features (Wi-Fi, sensors, cameras).
Dependent on smartphone hardware capabilities.
Battery drain can be significant during continuous use.
Table 2. An overview of the image-based representation of the POIs, including the number of frames used by the ARIDF, the number of frames remaining after applying the ARIDF, and various statistics related to these POIs.
POI #POI NameFrames Before ARIDFFrames After ARIDFDuration (sec)% Reduction# of Visits# of Errors# of Unrecognized POIs
1De Materia Medica by the Greek157557865%2501
2Human Illnesses in Ancient Times2171067%1500
3Metal working2761378%1510
4Lost Wax2761378%1510
5Bronze Vessels2661377%1501
6Selection of Metal Objects2861479%2000
7Artifacts made of Iron2861479%2001
8Physician90254572%2001
9Glassmaking-Part13461782%1700
10Glassmaking-Part24562287%1811
11Producing the Raw Glassp-Part15262588%1510
12Producing the Raw Glassp-Part23861884%2800
13Ossuary27111359%1201
14Burial coffin43132270%1500
15Selection of Wooden Objects5662789%1500
16Lead coffin42102076%1521
17Carpenter’s Tools71263463%1900
18Frieze fragment2791367%1700
19Burial coffin (Sarcophagus)3681778%1500
20Hebrew Promissory Note2561276%1500
21Alphabetic Script6873290%1710
22Jewish Tombstone3071477%1800
23Hieroglyphic Script3661783%1200
24Jewish ossuaries3271578%1900
25Stone Vessels Everyday Life4762387%2101
26Tables3161581%1600
27Stone Vessels (Late 2nd Temple Period)4862388%1800
28Stone Jar3171577%2200
29Mosaic Art123416167%2100
Average43.6810.0722.5877.3%17.590.280.24
Min2161059%1200
Max157557890%2811
STD27.38610.19415.2810.0833.5900.4540.510
Count 62178
Table 3. A summary of the experiment from the participants’ perspective. For each participant, we can find information about the number of POIs visited, the maximum number of tries to obtain information about a POI, how many POIs were not detected, how many were wrongly identified, and additional statistics.
Participant ## of Visited POIs# of Successful Searching Tries# of
Unrecognized POIs
# of Wrongly Recognized POIsAvgMinMaxSTD
Number of Tries for Successfully Recognized POI
12527101.08120.34
21519001.27130.59
31520011.33130.65
41517011.13120.43
51516101.07120.36
62025001.25120.44
72022101.10120.37
82022101.10130.55
91722001.29120.47
101820111.11130.58
111515010.93110.00
122836001.29120.46
131213101.08130.60
141516001.07120.26
151517001.13120.35
161515121.00120.38
171925001.32120.48
181720001.18130.53
191515001.00110.00
201520001.33130.62
211721011.24130.60
221819001.06120.24
231213001.08120.29
241923001.21120.42
252122101.05120.22
261617001.06120.25
271821001.17120.38
282226001.18120.39
292126001.24130.54
301616001.00110.00
Sum52660687
Avg17.5320.170.270.23
Min12.0013.000.000.00
Max28.0036.001.002.00
STD3.544.960.450.50
Disclaimer/Publisher’s Note: The statements, opinions and data contained in all publications are solely those of the individual author(s) and contributor(s) and not of MDPI and/or the editor(s). MDPI and/or the editor(s) disclaim responsibility for any injury to people or property resulting from any ideas, methods, instructions or products referred to in the content.

