Article

Sustainability of Maintaining Glass Collections

English Heritage, Ranger’s House, Chesterfield Walk, London SE10 8QX, UK
*
Authors to whom correspondence should be addressed.
Heritage 2025, 8(7), 251; https://doi.org/10.3390/heritage8070251
Submission received: 30 April 2025 / Revised: 19 June 2025 / Accepted: 20 June 2025 / Published: 25 June 2025
(This article belongs to the Special Issue The Conservation of Glass in Heritage Science)

Abstract

Maintaining a tight RH range for unstable glass is energy- and carbon-intensive. The carbon footprint of several methods for controlling showcases and storerooms, including sorbents, dehumidifiers and sorbents, Miniclima, and RK2, has been measured. Dehumidifiers outperformed Miniclima and RK2 units in control capability, but all three exhibited a higher carbon footprint than passive control methods. However, tailoring the right conditions for the right objects is crucial. The decay of different glass compositions in atmospheric conditions was measured using surface ion swabbing. Conditions below 40% in addition to forced air movement universally slowed deterioration. Formic acid was found to significantly accelerate glass alteration but could be removed using the RK2 unit.

1. Introduction

Heritage institutions face challenges with sustainability. There are pressing twin issues: climate control energy use, increasing global warming (leading to the current and increasing climate emergency), and economic sustainability due to recent energy price increases. This work considers the sustainability aspects of preventive conservation and one conservation treatment for glass artefacts. There is a focus on global warming potential as this is driving recent climate changes [1].
It has been recognised for some time that certain glass objects are much more environmentally sensitive or ‘unstable’. The term ‘unstable glass’ is not one type of glass but rather encompasses a range of glass compositions and states. Some are chemically unstable due to a low proportion of formative and stabilising compounds like silica and lime in their structure [2,3]. Others could be more durable but have undergone severe corrosion and, therefore, have a fragile, altered surface. In all cases, such glass actively deteriorates in normal museum conditions and, therefore, requires specialist intervention and strictly controlled environments.
Recent research [
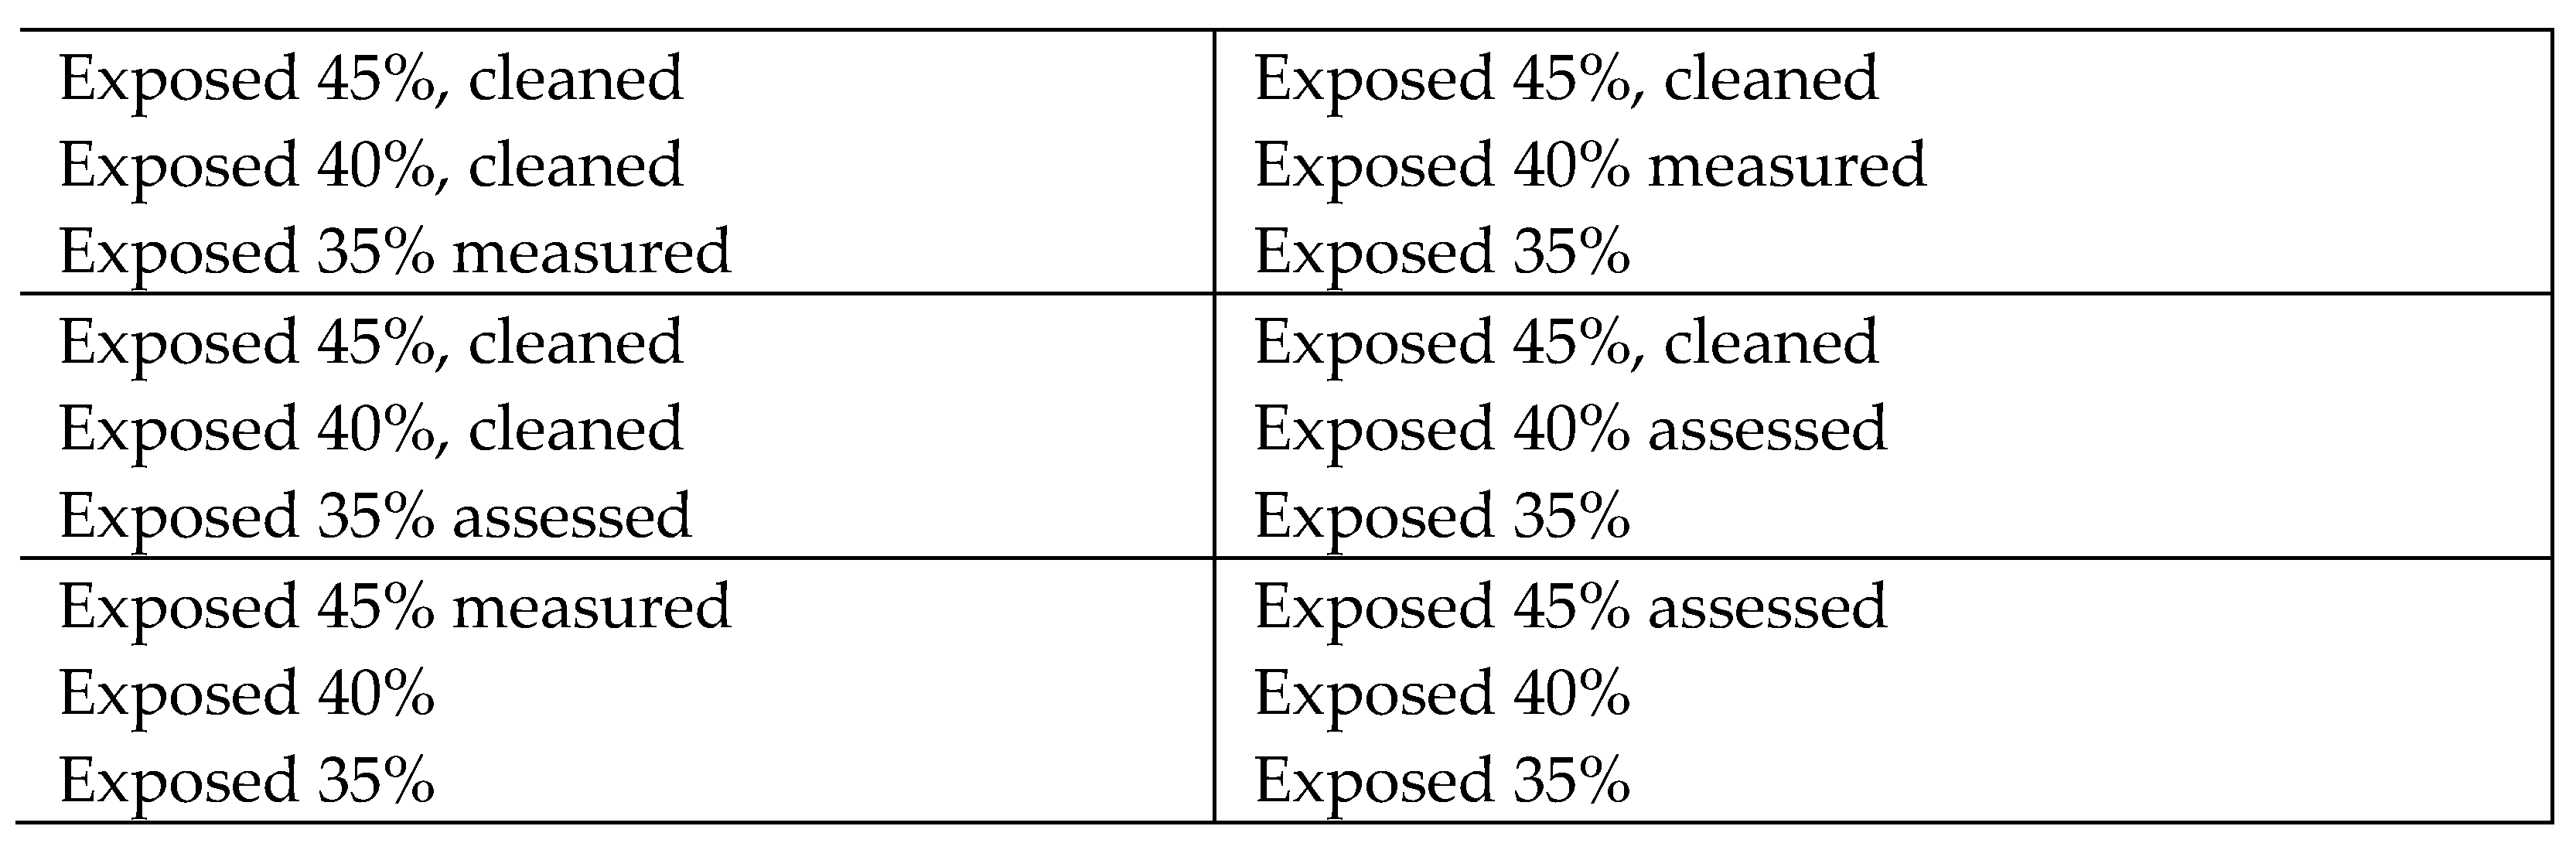
4] has recommended RH conditions of 40–42% RH for unstable glasses. This is difficult to achieve and even difficult to validate. Most heritage institutions use RH probes with accuracies of ±2 or 3%. Whilst more accurate probes are available (Rotronic Hygroclip II probes have stated accuracy + 0.8%), their cost limits their use. Even with this accuracy level, validating a 2% RH band is challenging. A wider band (40–50% RH) is recommended for other glass objects, although the exact recommended ranges vary between authors (Table 1). Maintaining this tight RH range for unstable glass is energy- or carbon-intensive, but only a small portion of glass objects require it. Moving air was also recommended to slow deterioration rates [4].
For archaeological glass or objects where sampling is straightforward, cross sections and SEM-EDX or EPMA provide unambiguous analyses to separate unstable from stable glass. Complete objects are much more challenging. Research has indicated that surface ion concentrations and Germanium ATR-FTIR can detect the earliest stages of degradation, indicating unstable compositions in the environment [16]. Germanium ATR has more sensitivity than the more common diamond ATR technique [17]. The techniques of reflectance FTIR, Raman, NIR, and OCT were found to be able to detect more degraded glass but lack sensitivity for the early stages of deterioration. The vast majority of glass is assessed by eye by conservators. Some issues were discussed in a previous work [16] using this approach, and attempts have been made to quantify the comparison with surface ions.
The sustainability of managing glass collections has been investigated. The RH band to be maintained has already been shown to have a large impact on energy use and carbon footprint [18].
Maintaining a 2% RH control band is difficult. Four methods have previously been shown to be capable of this in some conditions.
  • Munters MG50 dehumidifiers coupled with lower air exchange rate (AER) showcases and large amounts of silica gel. The dehumidifier works on a humidistat, turning on when the RH rises to its set point. As the capacity is most often much larger than a single showcase, this results in a distinctive saw-tooth pattern. As the dehumidifier turns on, it dries too much; when it turns off, the showcase’s RH slowly increases again. Adding silica gel at the dehumidifier’s inlet reduces the size of these fluctuations. The correct combination of showcase AER, volume, and loading of silica gel (<0.8/day, 2 m3, and 10 kg/m3 Prosorb) and dehumidifier capacity can reduce them to the 2% recommended.
  • Miniclima units work by adding conditioned air to the showcase when the humidistat registers showcase RHs below 40% or above 42%. The drying occurs via a Peltier cooler. Careful positioning of the inlet/outlet and humidistat is essential for correct conditioning.
  • Hahn RK2 units condition air and then provide a low airflow to the showcase based on a humidistat. The low airflow can mean that it is some time before the correct RH is established. The unit also works on the Peltier principle to dehumidify. It also allows continuous chemical filtration.
  • Saturated potassium carbonate solutions have been reported to maintain RH very close to 43% [19].
Whilst it is possible to maintain RH with silica gels and low air exchange rate showcases, this extremely tight RH band is considered to entail reconditioning of the gel too frequently for most institutions.
Some museums, including the British Museum, Victoria and Albert Museum, and the Corning Museum, use showcases to store glass, but a large amount is stored on shelving units in storerooms. With very low AER storerooms, desiccant dehumidifiers can maintain 40–42% RH, and in most storerooms, 40–50% is achievable. It has been shown that air conditioning units use more energy the tighter the RH band used [18].
The performance and carbon footprint of several methods for controlling showcases, including sorbents, saturated potassium carbonate, dehumidifiers and sorbents, Miniclima, and RK2, have been measured. The energy used to maintain these conditions has been estimated for storerooms with dehumidifiers. However, as RH is not the only environmental risk to glass, the performance of the conditioning systems in removing formic acid has been assessed, and the suitability of emission tests such as the BEMMA scheme [20] and ISO16000 series [21] for showcase materials for glass has been investigated. Formic acid is present in many showcases (9) and has been reported to accelerate glass deterioration at low concentrations (12t).
The approach to conditioning a full room is more complex. The air exchange rate is even more significant for buildings than showcases. There are two common methods to measure building air exchange rates: tracer gas and constant pressurisation. Tracer gas decay gives a direct measure of the air exchange rate, but only for the one to three days during the measurement. The value will change due to atmospheric conditions, particularly solar gain, wind velocity, and pressure changes. The constant pressurisation method, normally expressed as m3/m2/h@50Pa of the envelope, requires the application of an actual pressure difference to obtain an actual air exchange rate. The pressure difference between the room and the external environment will vary hourly and throughout the year.
A method to predict dehumidifier performance and energy usage for showcases has been developed and extensively tested [22]. The amount of water vapour per time period is calculated from the room temperature and RH (measured at a time period, e.g., 30 min or 60 min), the controlled showcase RH, and its volume and air exchange rate. The run time of the dehumidifier in the time period is estimated from capacity data from the manufacturer (using room temperature and RH).
Run time (min) = amount of water needed to be removed to maintain RH (g)/dehumidifier capacity under those temperatures and RH conditions (g/min)
This fraction is multiplied by the power of the dehumidifier to estimate energy usage. The air from the room surrounds all the joints of the showcases, so it is reasonable to use it as the external condition. Four sets of measurements underneath showcases did not show significant differences in climate from the room conditions, and most showcase designs are well sealed underneath. The method was modified to generate an estimate for storage rooms. This situation is more complex, with uncertainty as to where the air exchanging with the internal room environment comes from. For a room within a room design, the external room temperature and RH can be used. This approach is probably also valid for rooms with external walls, with no entrances or windows and a vapour barrier incorporated into the external wall. For rooms with external windows or permeable external walls, floors, or ceilings, the relative amount of ingress from outside or other adjacent rooms is unknown. These volumes will have different (and often very different) temperatures and RHs. An approach to estimate from uncontrolled T/RH data was investigated. A previous year’s temperature RH data in the uncontrolled room was used along with the control RH (generally 40 or 50%), the room volume, and the air exchange rate. Situations with dehumidifiers to condition whole rooms have been investigated.
Research has shown that the degradation rate of glass reduces as RH reduces, but the lowest RH values investigated were 40% [12,23]. Initial experiments have been undertaken to assess the conditions required to minimise the degradation rate with five glass compositions, including two potassium glasses. The glasses were selected from suitable-sized pieces that could reasonably undergo the conditions investigated. The deterioration rate at 35, 40, and 45% RH has been previously measured in still air for a series of sodium glass daguerreotype cover glasses [24]. Further glass types were tested. Tests at 40% were also run in moving air. Formic acid has been shown to accelerate deterioration at very low concentrations, 30.5 µg/m3 [23]. Formaldehyde has also been shown to have a significant effect in some situations [25]. Tests with the more aggressive formic acid were undertaken.

2. Materials and Methods

2.1. Showcase Performance and Carbon Footprints

Performance and carbon footprints for showcases and silica gel control have been previously published [22]. Six existing showcases and three test showcases were used to investigate the energy used to maintain a 40–42% RH band, as recommended. Air exchange rates were measured with the carbon dioxide tracer gas method to ISO 12569. Energy consumption was measured using energy meters (Maxico Dual Tariff), and embedded carbon was estimated by weighing and identification of components to BS PAS 2050 of Munters MG50, Miniclima EBC08, and Hahn RK2. The UK electricity mix has an emission factor of 0.20493 kg CO2-eq per kWh [26], which can be used to convert the consumption figures. The temperature and RH inside the showcase and in the room were measured with Rotronic Hygroclip II probes. Calculations for lifetimes between silica gel changes have been extensively tested [27]. Calculations were undertaken for each showcase, assuming Prosorb conditioned to 40%. The time to reach 42% and the need for reconditioning was calculated. This depends on the date the Prosorb is added to the showcase (due to seasonal variations in room RH). Calculations were undertaken on the 1st of the months of January, April, August, and October. For the test showcases, room temperature and RH were altered with electric heaters and Munters MG90 dehumidifiers and MGS 300 humidifiers. The RH values were selected for quite damp UK rooms. Such values are probably representative of many locations, with the exception of the tropics. Lower RH values would require some humidification from the units or buffering from sorbents. Tests were run for 10 days, with the first 3 days ignored to allow the Miniclima and RK2 units to settle. The showcase air exchange rates of the three test showcases were reduced by adding 3M 425 tape. Some of the experiments were repeated with a 40–50% RH band. For the dehumidifier, the separate Meaco LAE controller was set appropriately. Both Miniclima and RK2 have factory-set hysteresis values, which cannot be changed. The set points were raised from 41% to 45%. The test showcase conditions are summarised in Table 2. Those for the existing showcases in historic buildings are shown in Table 3.

2.2. Formic Acid Testing

A 6 × 6 cm piece of dried Dulux-1060Y paint was placed in some of the test showcase experiments (with various RH values) as a formic acid source. The formic acid concentration was measured using quadruplicate diffusion tubes [28].
The published target levels for formic acid for the BEMMA and ISO 16000-based scheme are 15 and 12 µg/m3, respectively. The test parameters for BEMMA are: sample loading—34 m2/m3, chamber volume—0.05 m3, and AER—38.06/day. For the ISO16000-based tests, the loading factor was 1 m2/m3, volume chamber 0.25 m3, and AER 0.18/day. The well-validated Meyer–Hermanns equation [29] was applied to this data. It determines what concentrations would be expected for different AERs at given loadings of emissive material. The formic acid concentrations were calculated for showcases 1.0 by 0.5 by 0.3 m, giving a loading of 3.33 m2/m3. The expected formic acid concentration was calculated at 0.1 intervals of air exchange rate between 0.1 and 3.0 per day.

2.3. Room Carbon Footprints

The air exchange rate of a number of rooms used as stores was measured using carbon dioxide tracer gas to ISO12569 [30]. Vaisala HMP200 probes and HM360 loggers were used. Two recently built rooms in large stores (one a refurbishment of an existing historic building, the second purpose-built) were also tested using constant pressurisation [31]. Blower doors were used. The dimensions of the rooms were measured by hand.
Internal and external temperature and RH were measured using Rotronic Hygroclip II probes on a continuous radio telemetry system. Data for the previous year was used with the volume and air exchange rate (tracer gas) to calculate the mass of water vapour needed to be removed from the room per 30 min (the data interval). The RH and temperature were used to calculate the water vapour removal capacity of a Munters MG50, 90, and MCS dehumidifier from manufacturer-published data [32,33,34]. For each 30-min interval, the capacity was compared to the mass of water vapour that needed to be removed. The ratio of mass water vapour to be removed/capacity was used to estimate the percentage run time of the dehumidifier in that 30-min interval. This was multiplied by the power rating to estimate how much electricity would be needed. The relevant dehumidifier was installed in each space and run for a year with the electricity metered using a Maxico Dual Tariff meter. Performance to 50% RH was checked from the RH/T monitoring. Whilst this work used rooms in the UK, the approach using room temperature and RH data can be adopted anywhere. The room data also, to a degree, considers thermal mass, RH buffering, different materials present, and any water ingress into the space.

2.4. Impact of Environmental Condition Tests

Six glasses were tested. The conditions were expected to produce low corrosion rates; hence, relatively large pieces were used. This allowed the sodium or potassium ions to be collected from a large area, increasing analytical sensitivity. The glasses were selected from suitable-sized pieces that could reasonably undergo the conditions investigated. Samples from accessioned museum objects had undergone similar conditions previously, limiting ethical concerns. The samples were two sodium glasses from the mid-18th century showing extensive mineralisation on their surfaces (i, ii), a stable sodium glass from the 20th century (iii), two mixed, potentially high-lime, low alkali (HLLA) glasses (iv, v) and a high-magnesia, potassium-fluxed glass (vi). The compositions were determined by preparing cross sections and undertaking SEM-EDS analysis in the centre sections of the glass using an FEI Inspect F50 system scanning electron microscope with energy dispersive X-ray spectroscopy (SEM-EDS) (Oxford Instruments, Abingdon, UK) with Oxford Instruments INCA software (v21b). Results are shown in Table 4.
The durability of the glass samples was assessed by quantifying the balance of their network formers that make up the insoluble glass and network modifiers that disrupt this structure, making it easier to melt and work but also more chemically unstable. These network modifiers create loosely chemically bound non-bridging oxygens (NBO), therefore breaking the links between the glass-forming silica (SiO2) tetrahedra (T). The normalised quantitative analyses of the glasses produced were used to calculate the theoretical stability of the glass matrix. This was performed by obtaining the ratio of NBO-to-T within the glass structure and provides an estimate of the degree of cross-linking. The closer the ratio NBO/T is to zero, the more the glass corresponds to pure silica, which has four oxygen atoms per one of silicon and no NBOs [35]. The equation employed for this process (Equation (1)) is based on the separation of glass formers, modifiers, and intermediates, according to the works of Mysen [36,37] and Pollard et al. [38].
NBO T wm = 2 MgO + CaO + Na 2 O + K 2 O + MnO + CuO Al 2 O 3 F e 2 O 3 SiO + 2 Al 2 O 3 + 2 Fe 2 O 3 + 2 P 2 O 5 + TiO 2
The glasses were exposed individually in heat-sealed Escal bags with preconditioned PROSORB silica gel cassettes and Meaco sensors.
Some of the glass pieces (II, III, IV) were parts of accessioned objects and so could not be cut. All had been exposed to 45% RH for several years previously. The others were exposed as individual pieces. Each glass was cleaned with 18.2 MΩ∙cm water and polyester TexWipe TX761 Alpha Swabs before each exposure. Repeat cleanings indicated less than 0.01% of sodium or potassium ions removed, indicating full cleaning of the surfaces. Each piece was exposed in three different environments, first at 45% RH, then at 40% RH, and finally at 35% RH, each for a period of six months. Different 20 cm2 areas of the glass were cleaned after each exposure with 18.2 MΩ∙cm water and polyester TexWipe TX761 Alpha Swabs [39]. The surface sodium and potassium concentration of half the area was measured after each six-month period using ion chromatography with an increased sample loop size of 14 µL. The swab was extracted in 3 mL of 18.2 MΩ∙cm water and then evaporated to 0.5 mL. The extracts were filtered and analysed using a Dionex ICS 1100 ion chromatograph with an Ionpac CS12 column and 18 mM methane sulfonic acid eluent. The large sampling area, high flow rate, and larger injection loop produced a high instrumental sensitivity.
Smaller pieces of each glass were also exposed above pure magnesium chloride solution (RH 33%) and to 80 µg/m3 of formic acid generated above saturated magnesium chloride solution [40]. After these exposures, the crystals observed on the surface of glass I were analysed with a Virsa confocal micro-Raman (Renishaw, Wotton-under-Edge, UK) with a 785 nm laser at the high-resolution setting.
The potassium glass IV was also tested with a Dymax 5 pump (Charles Austen, Byfleet, UK) running at 5 mL/min in a sealed polycarbonate vessel with preconditioned PROSORB at 45% for six months. This airflow value was selected from measurements in showcases conditioned with Hahn RK2 and RK 2.5 units.
The final RH-exposed glass pieces had sections that had been cleaned and then exposed to 35, 40, and 45% RH and had clearly different amounts of salts on the surface. Figure 1 shows the situation.
The salt crystals were characterised by microscopy (GXM-XPLPOLTEC-5 Trinocular (GT Vision, Haverhill, UK), Transmitted Light microscope with XCAM-U3 Series 5MP USB-3 Camera (GT vision, Haverhill, UK) + GXCapture (GT vision, Haverhill, UK) and Image J v1.54p), determining the percentage coverage and particle size distribution. Two glass conservators examined the glass pieces by eye under ×4 magnification and under ×10 magnification.

3. Results and Discussion

3.1. Showcase Performance and Carbon Footprints

The estimated embedded carbon was 93 kg CO2-eq for the Munters MG50, 47 for the Miniclima EBC 08, and 58 for the RK2 unit. The performance in the laboratory trials for the units and their energy usage is shown in Table 5.
In the test showcases, the MG50 worked well in all instances. The Miniclima struggled to dehumidify the larger showcase (G) sufficiently at higher RHs and especially higher RHs combined with higher temperatures. Reducing the AER to 0.04 allowed it to perform sufficiently. The RK2 performed better but still struggled in the high-temperature RH region. Energy consumption was fairly similar for the three systems and relatively high, as expected from the very tight RH band. The consumption increased as the dehumidification load increased, with the Munters MG50 being more efficient at higher temperatures and the Miniclima and RK2 less efficient. Widening the control band to 40–50% significantly reduced the energy consumed in all instances tested by 2 to 3 times. The dehumidifier showed the highest energy reduction, as the controller allowed the RH to move within most of the full range. The Miniclima and RK2 still kept tight ±2% RH bands. However, the less tight specification is likely to mean they keep within the band all the time and can be used successfully in larger showcases with higher air exchange rates. With sufficient data, a required energy surface against temperature and RH could be produced to predict the energy usage of Miniclimas and RK2s. This has already been developed using the manufacturer’s data for Munters MG50 dehumidifiers [22]. The potassium carbonate kept a 2% band around 43%. This is slightly higher than desired. The formic acid concentrations measured were below the threshold determined by Robinet in half of the test situations.
The installed showcases showed similar results (Table 6), with the dehumidifier working well and the Miniclima performing most of the time but struggling with high RH and temperature conditions. The RK2 performed very well in a moderate environment room but was overwhelmed for a small proportion of the time when the temperature rose above 25 °C and the RH was above 72%. All units successfully kept the 40–50% RH band. The energy use was much higher for the tighter RH band, 3 to 4 times that for the wider band. The room environments were different, indicating the results are, to a degree, generalisable. All showcases were glass and metal construction, but previous measurements with acrylic showcases gave similar results. Controlling with PROSORB would require frequent changes for newly conditioned gel. The period between changes is very variable and depends on the season (and room conditions). These are calculated results, with an accuracy that cannot be achieved with most RH probes.

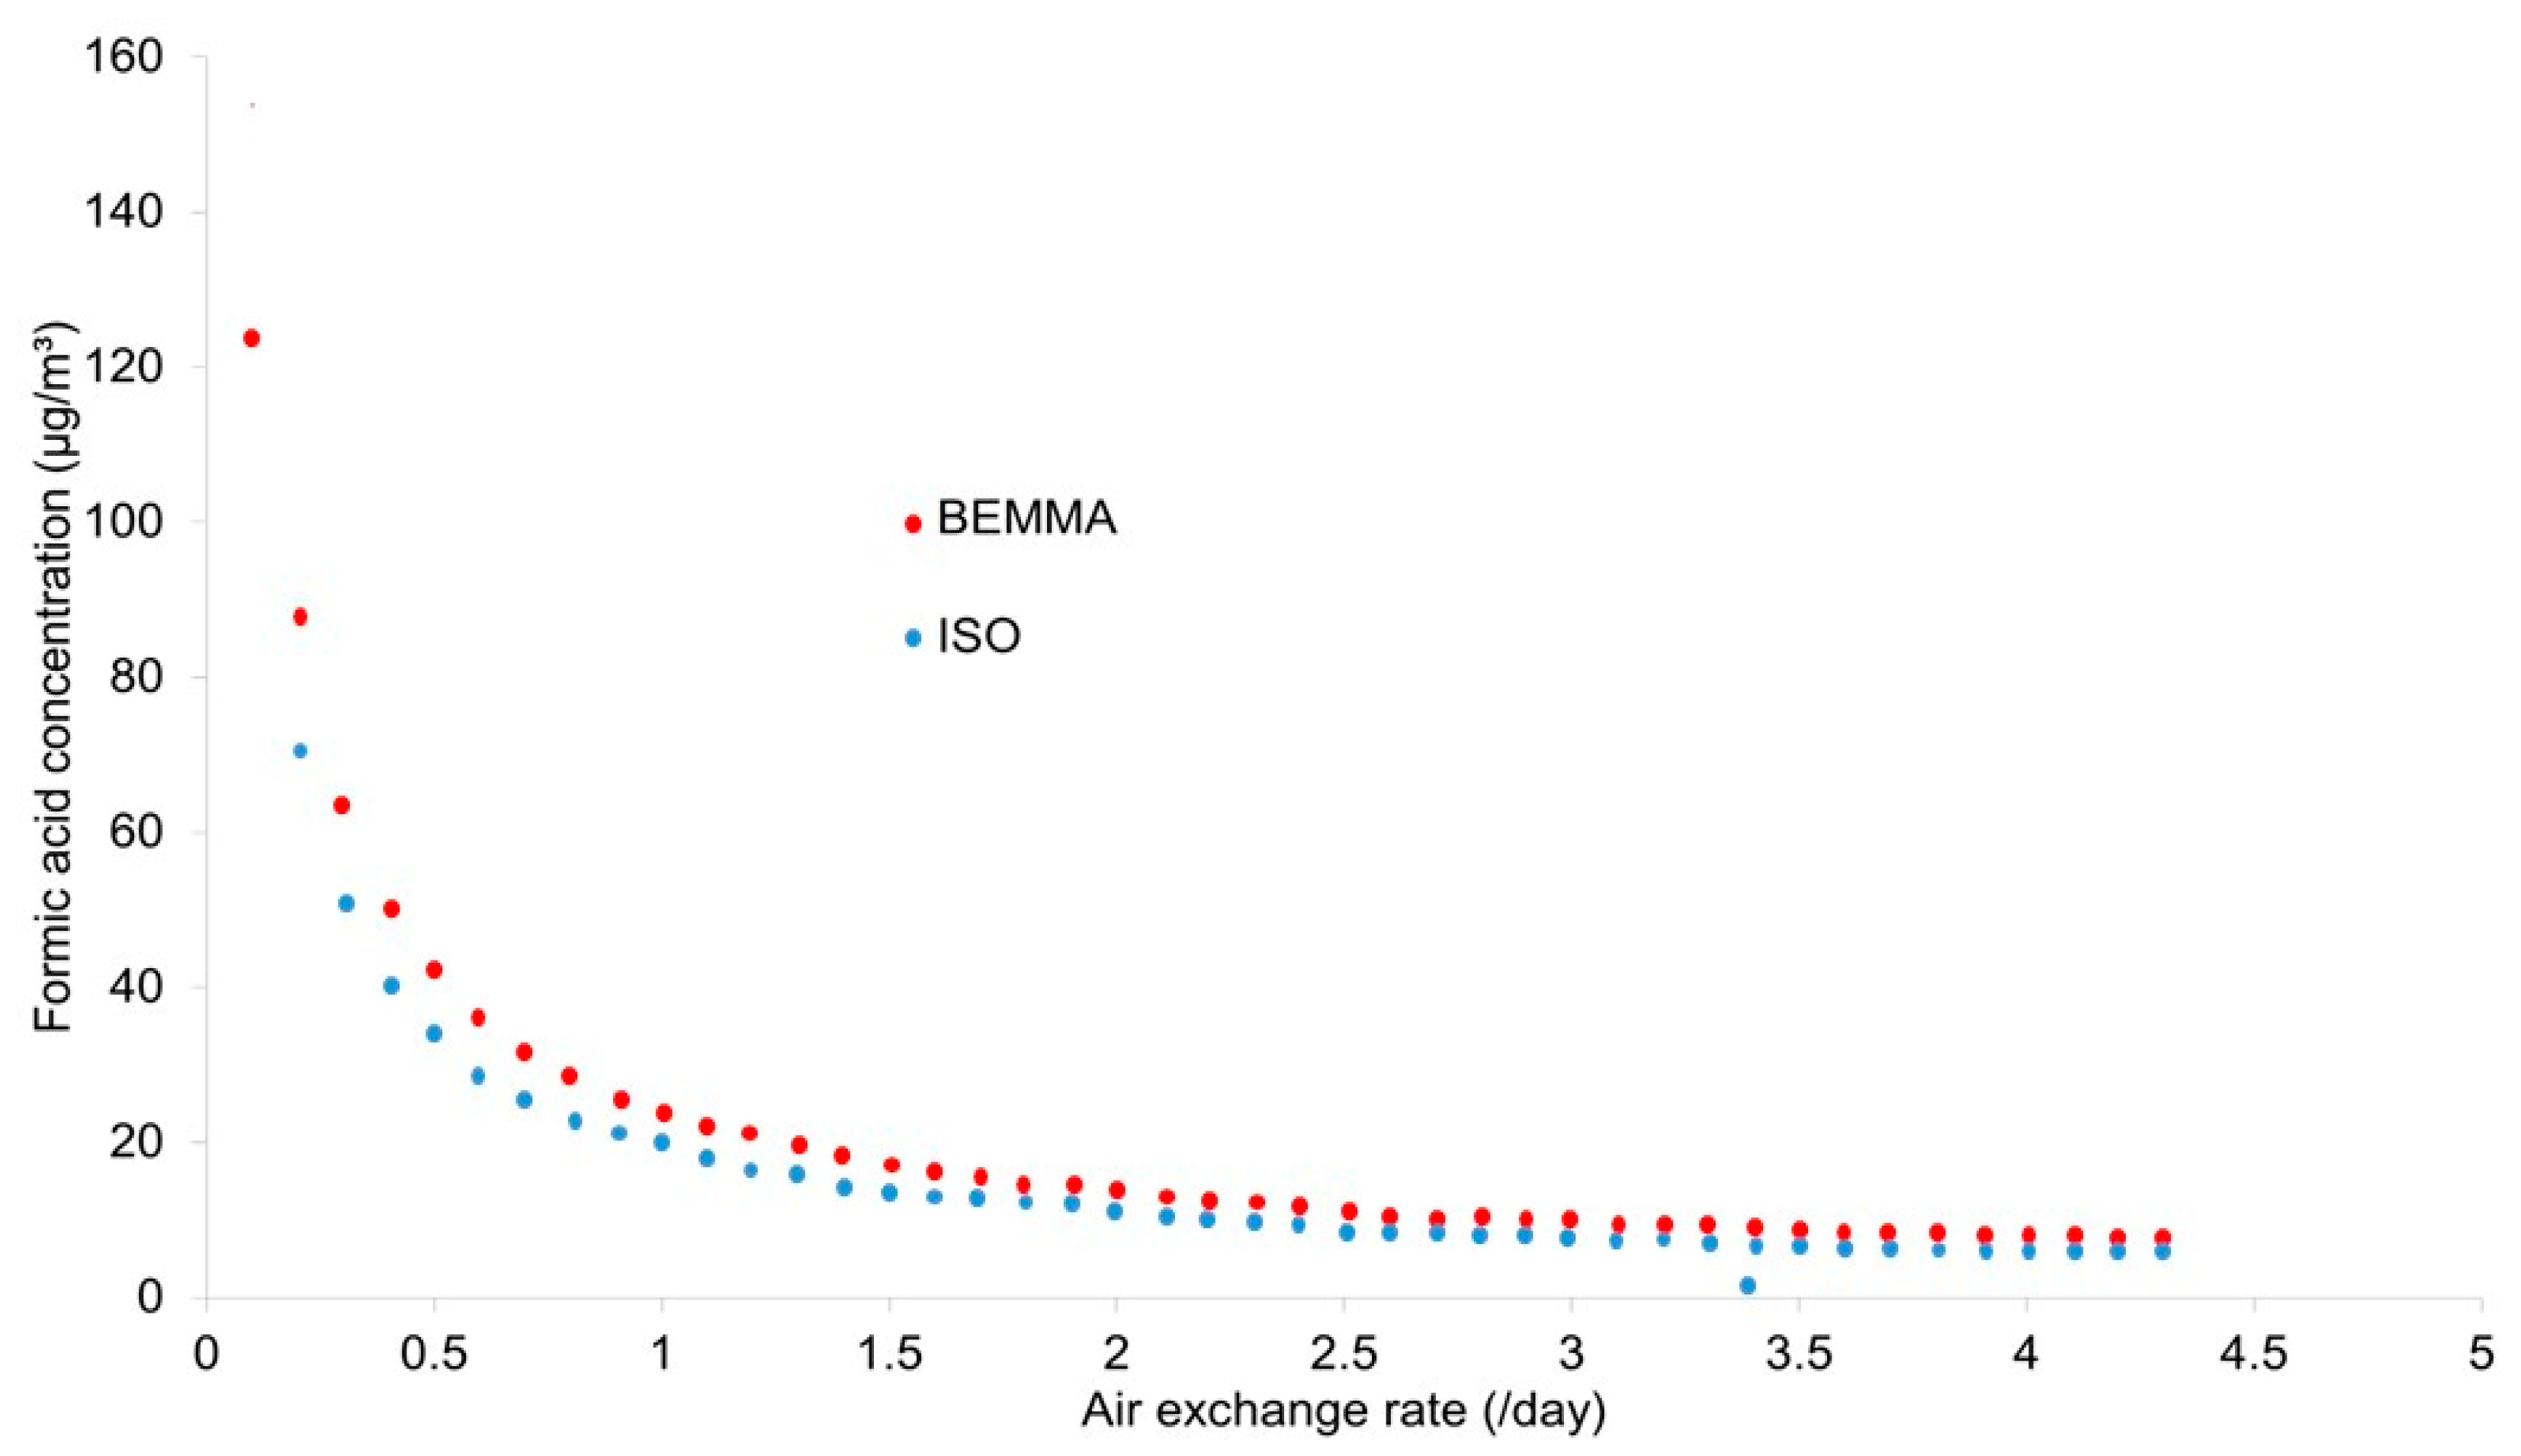
3.2. Formic Acid Testing

The continuous RK2 system reduced the formic acid concentration below the detection limit in all trials. Both the dehumidifier and Miniclima-controlled cases had formic acid present above the reported threshold (30.5 µg/m3) due to their intermittent operation. Higher room RH levels reduced the formic acid present.
Results of the formic acid calculations are shown in Figure 2.
With a detection limit of 15 µg/m3 in the conditions of the BEMMA test, the reported damage level will be reached with the desktop showcase considered at AERs below 0.9/day; a high proportion of such showcases have AERs below this value [41]. The ISO 16000-based test is lower, 0.5/day, but still well above the commonly used 0.1/day specification for AER for showcases. This indicates that, in some instances, a material can pass both tests and then go on to accelerate the degradation of susceptible glasses.

3.3. Room Carbon Footprints

Table 7 shows the room details, the measured air exchange rates, and the estimated and measured energy use of Munters MG50 and MCS 300 dehumidifiers.
With the levels of air exchange in most of the store buildings, Munters dehumidifiers can, at best, maintain a 4% RH band. With the lowest air exchange rate, achieved by sealing the windows at Ranger’s House, a 2% band was achieved at 50% RH.
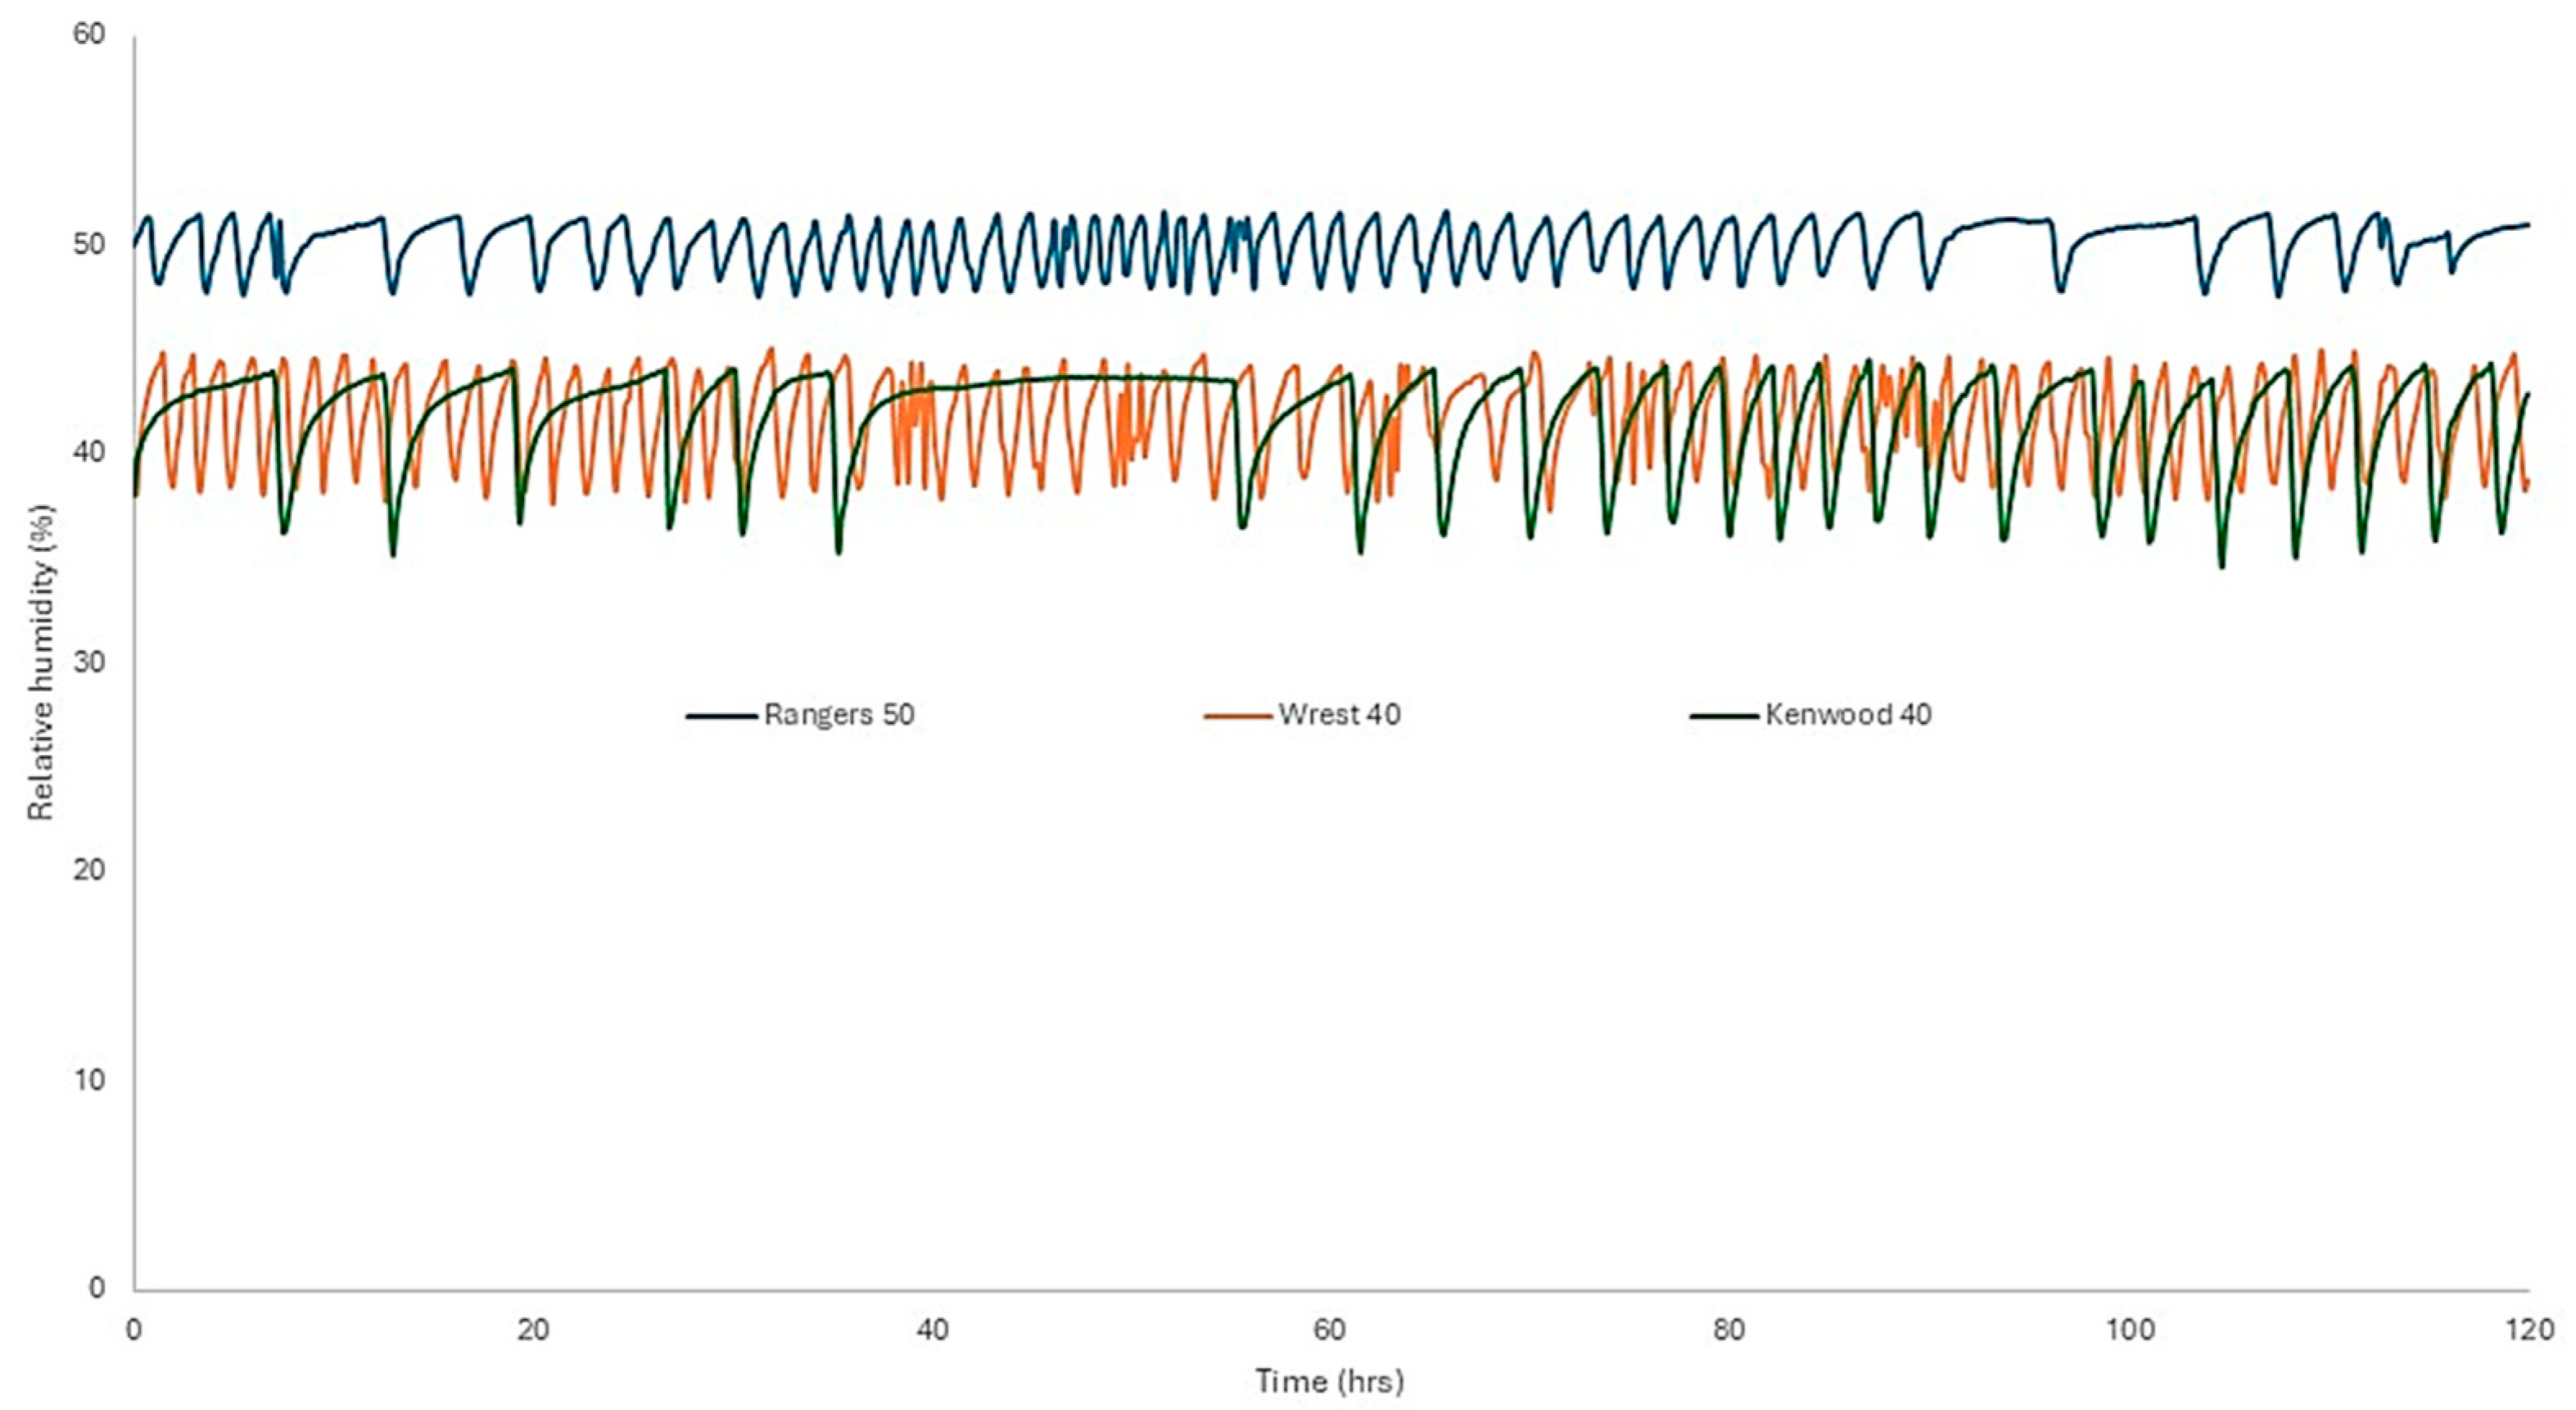
Figure 3 shows a week’s data for RH monitoring in selected rooms.
The Kenwood 40 trace shows much longer-term oscillations than the Rangers 50 or Wrest 40. This is probably due to the larger surface area of sorbent material present in the print store. This reduces the rate of RH increase after the dehumidifier has shut off. Tighter control could be achieved by sealing doors and windows (where present), as evidenced by the reduction in air exchange rates at both Dover Castle and Ranger’s House when windows were sealed. The stores all have conventional door wooden fittings.
Reducing the setpoint from 50% to 40% increased energy use by 54, 80, and 84% in the three storerooms where this was tested. The energy calculations were reasonably accurate—they were within 30% of the measured energy usage in all instances using tracer gas air exchange rates. The energy usage estimates using air exchange rates from pressurisation tests were significantly higher (as were the air exchange rate estimates). Improving the sealing of windows made the largest improvement in the air exchange rate. All the windows present were of the sash type; guidance has been published on reducing leakage from such windows [42,43]. The ASHRAE handbook chapter states that to achieve their AA rating (±5% RH fluctuations), moisture vapour barriers are required [44]. None of the buildings tested had this feature.

3.4. Impact of Environmental Condition Tests

The calculated durability (NBO/T) for the glasses studied is shown in Figure 4.
The glass compositions covered a wide range of durability, from just above 0.5 to slightly over 0.9. There was no systematic trend with the main network modifier.
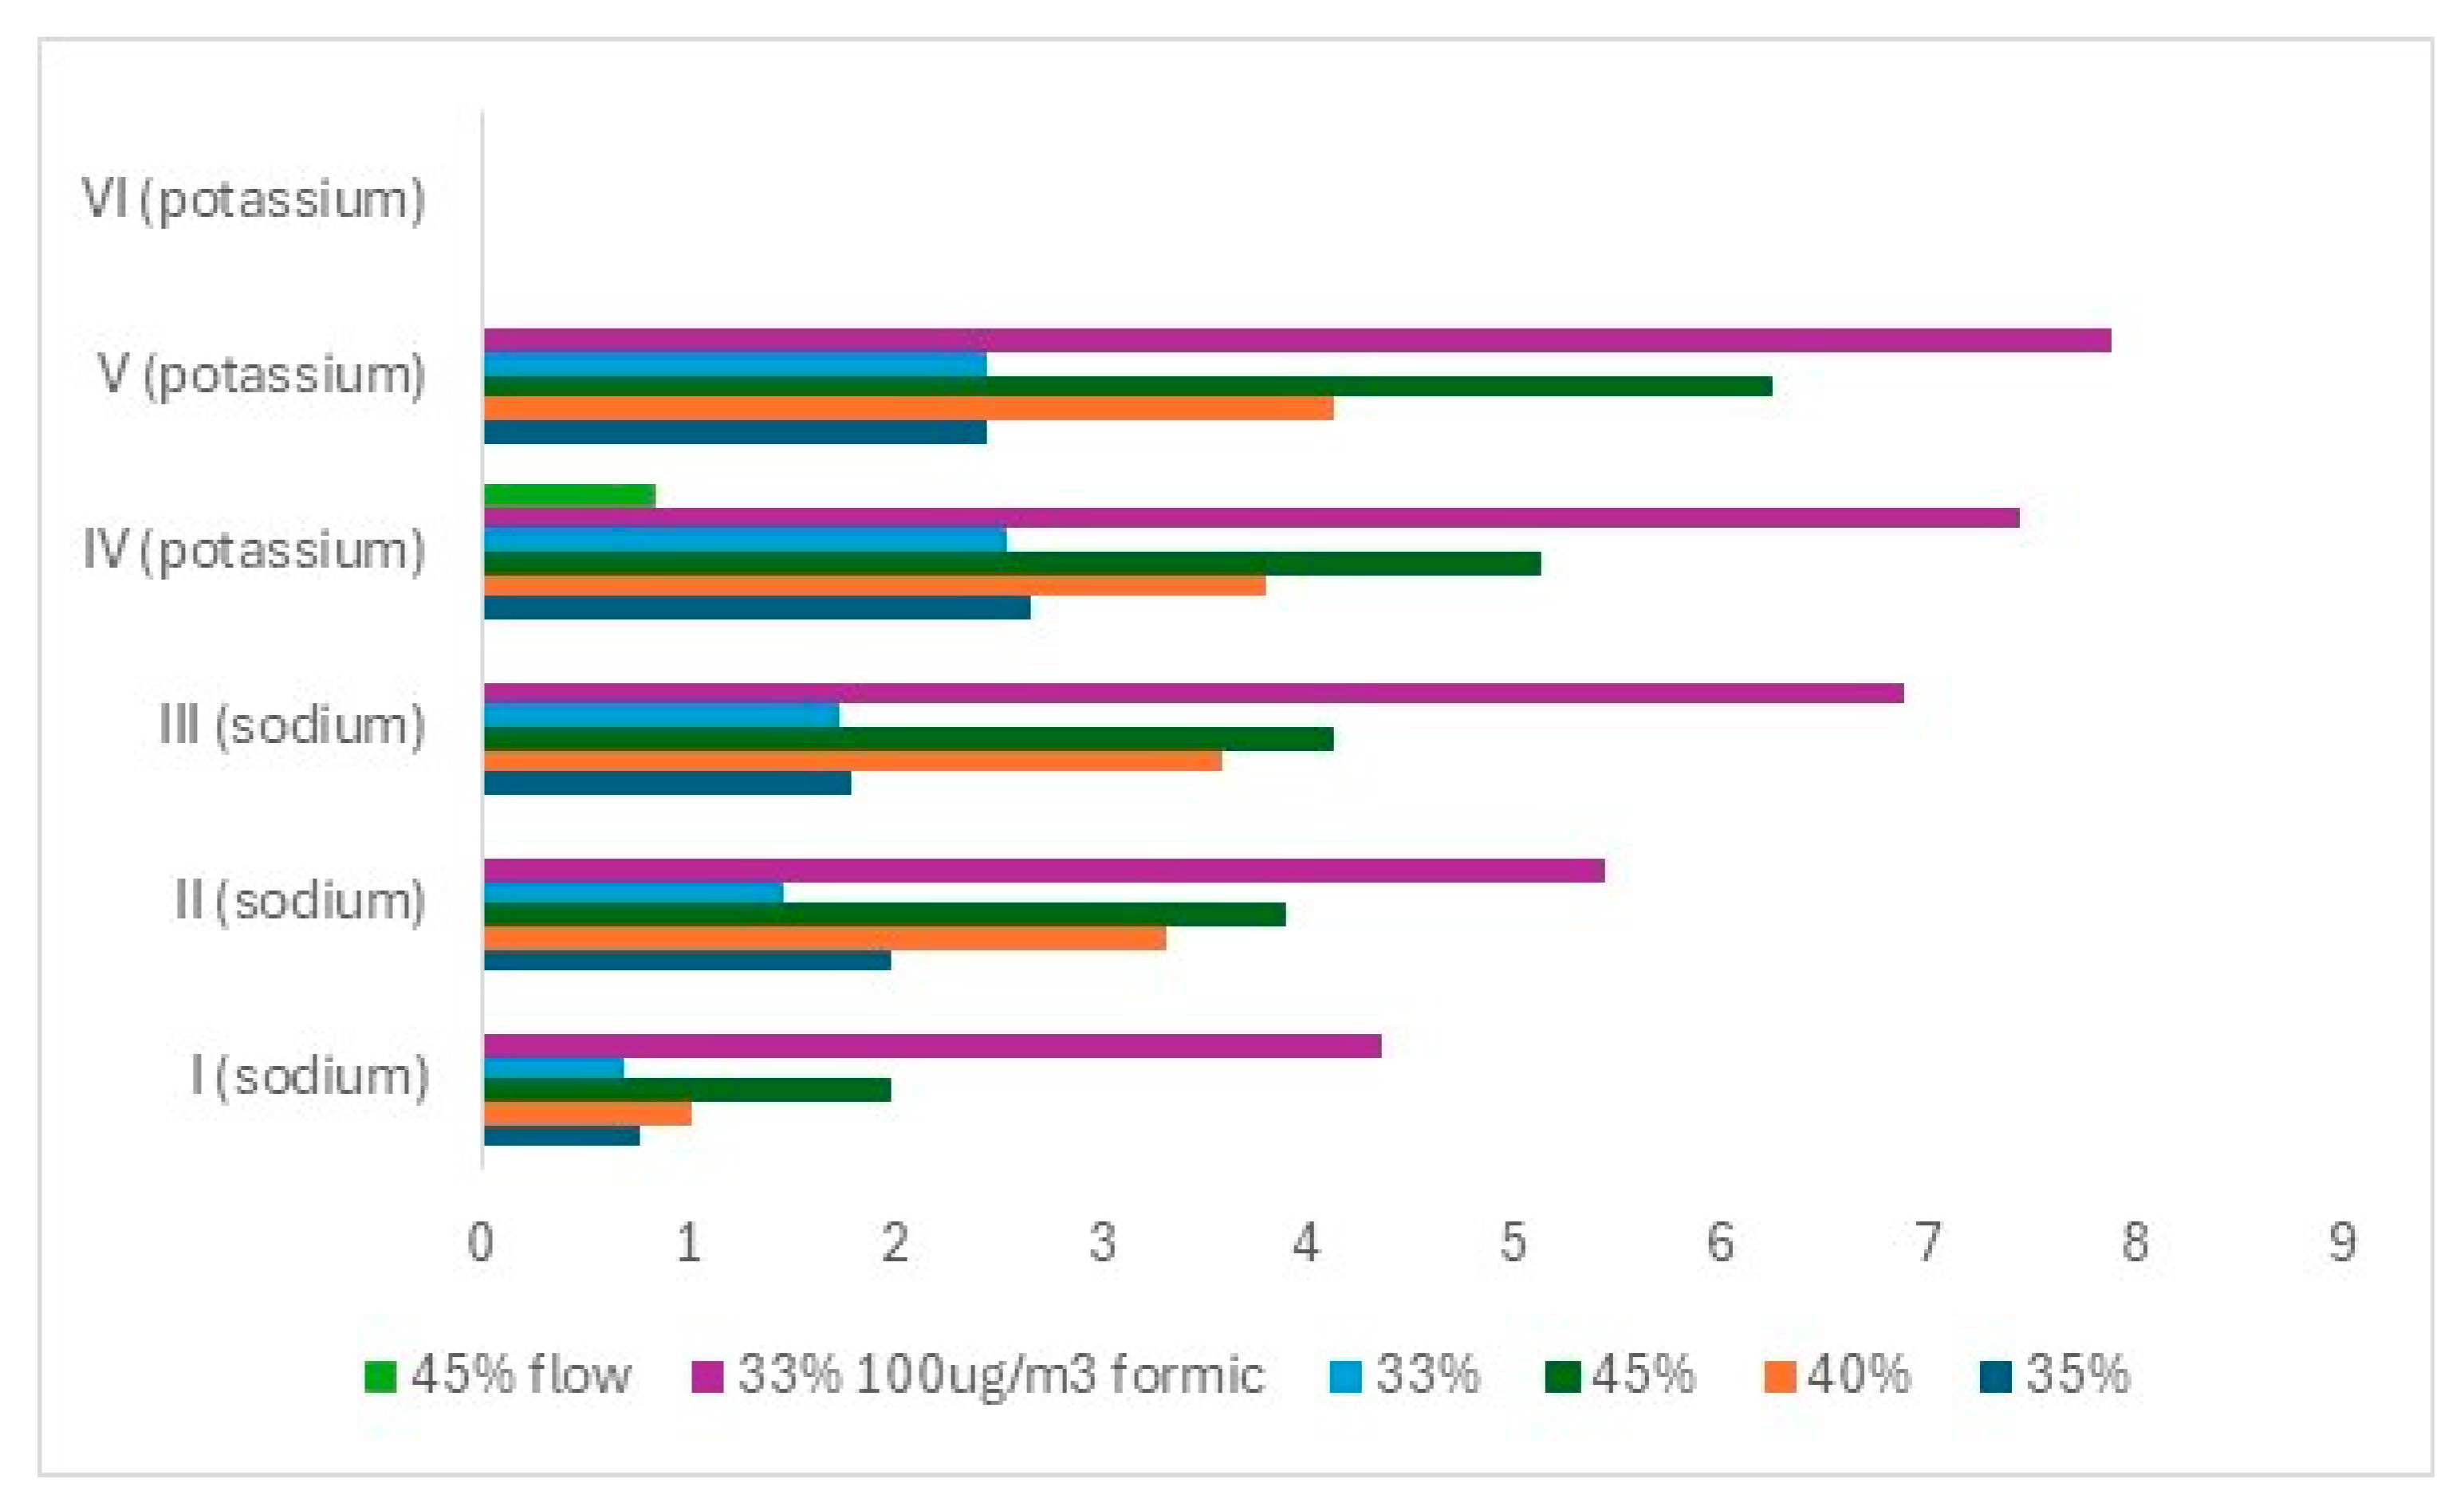
The ion concentrations on the glass surfaces after ageing are shown in Figure 5.
All glasses showed the most deterioration at 45%, followed by 40%, then 35%, and finally, 33%. The sodium glass I appeared to be the most resistant, with II and III similar. The potassium-containing glasses were less stable. The effect of RH exposure does not follow the calculated durabilities. This highlights the possible limitations of the NBO/T equation to accurately evaluate the role of components like sodium and potassium or calcium and magnesium oxides, which are chemically equivalent but impart different degrees of durability to the glass. Furthermore, the high silica content of all tested samples meant that they had a good base level of stability, meaning that the differences in their preservation may need many decades of exposure to be better highlighted.
The presence of 80 µg/m3 of formic acid dramatically accelerated the deterioration rate of all the glasses. The flowing air reduced deterioration dramatically by over 80% for the single glass tested. The crystals on glass I in clean air at 33% were identified as sodium carbonate. Those formed when exposed to a formic acid environment were sodium formate.
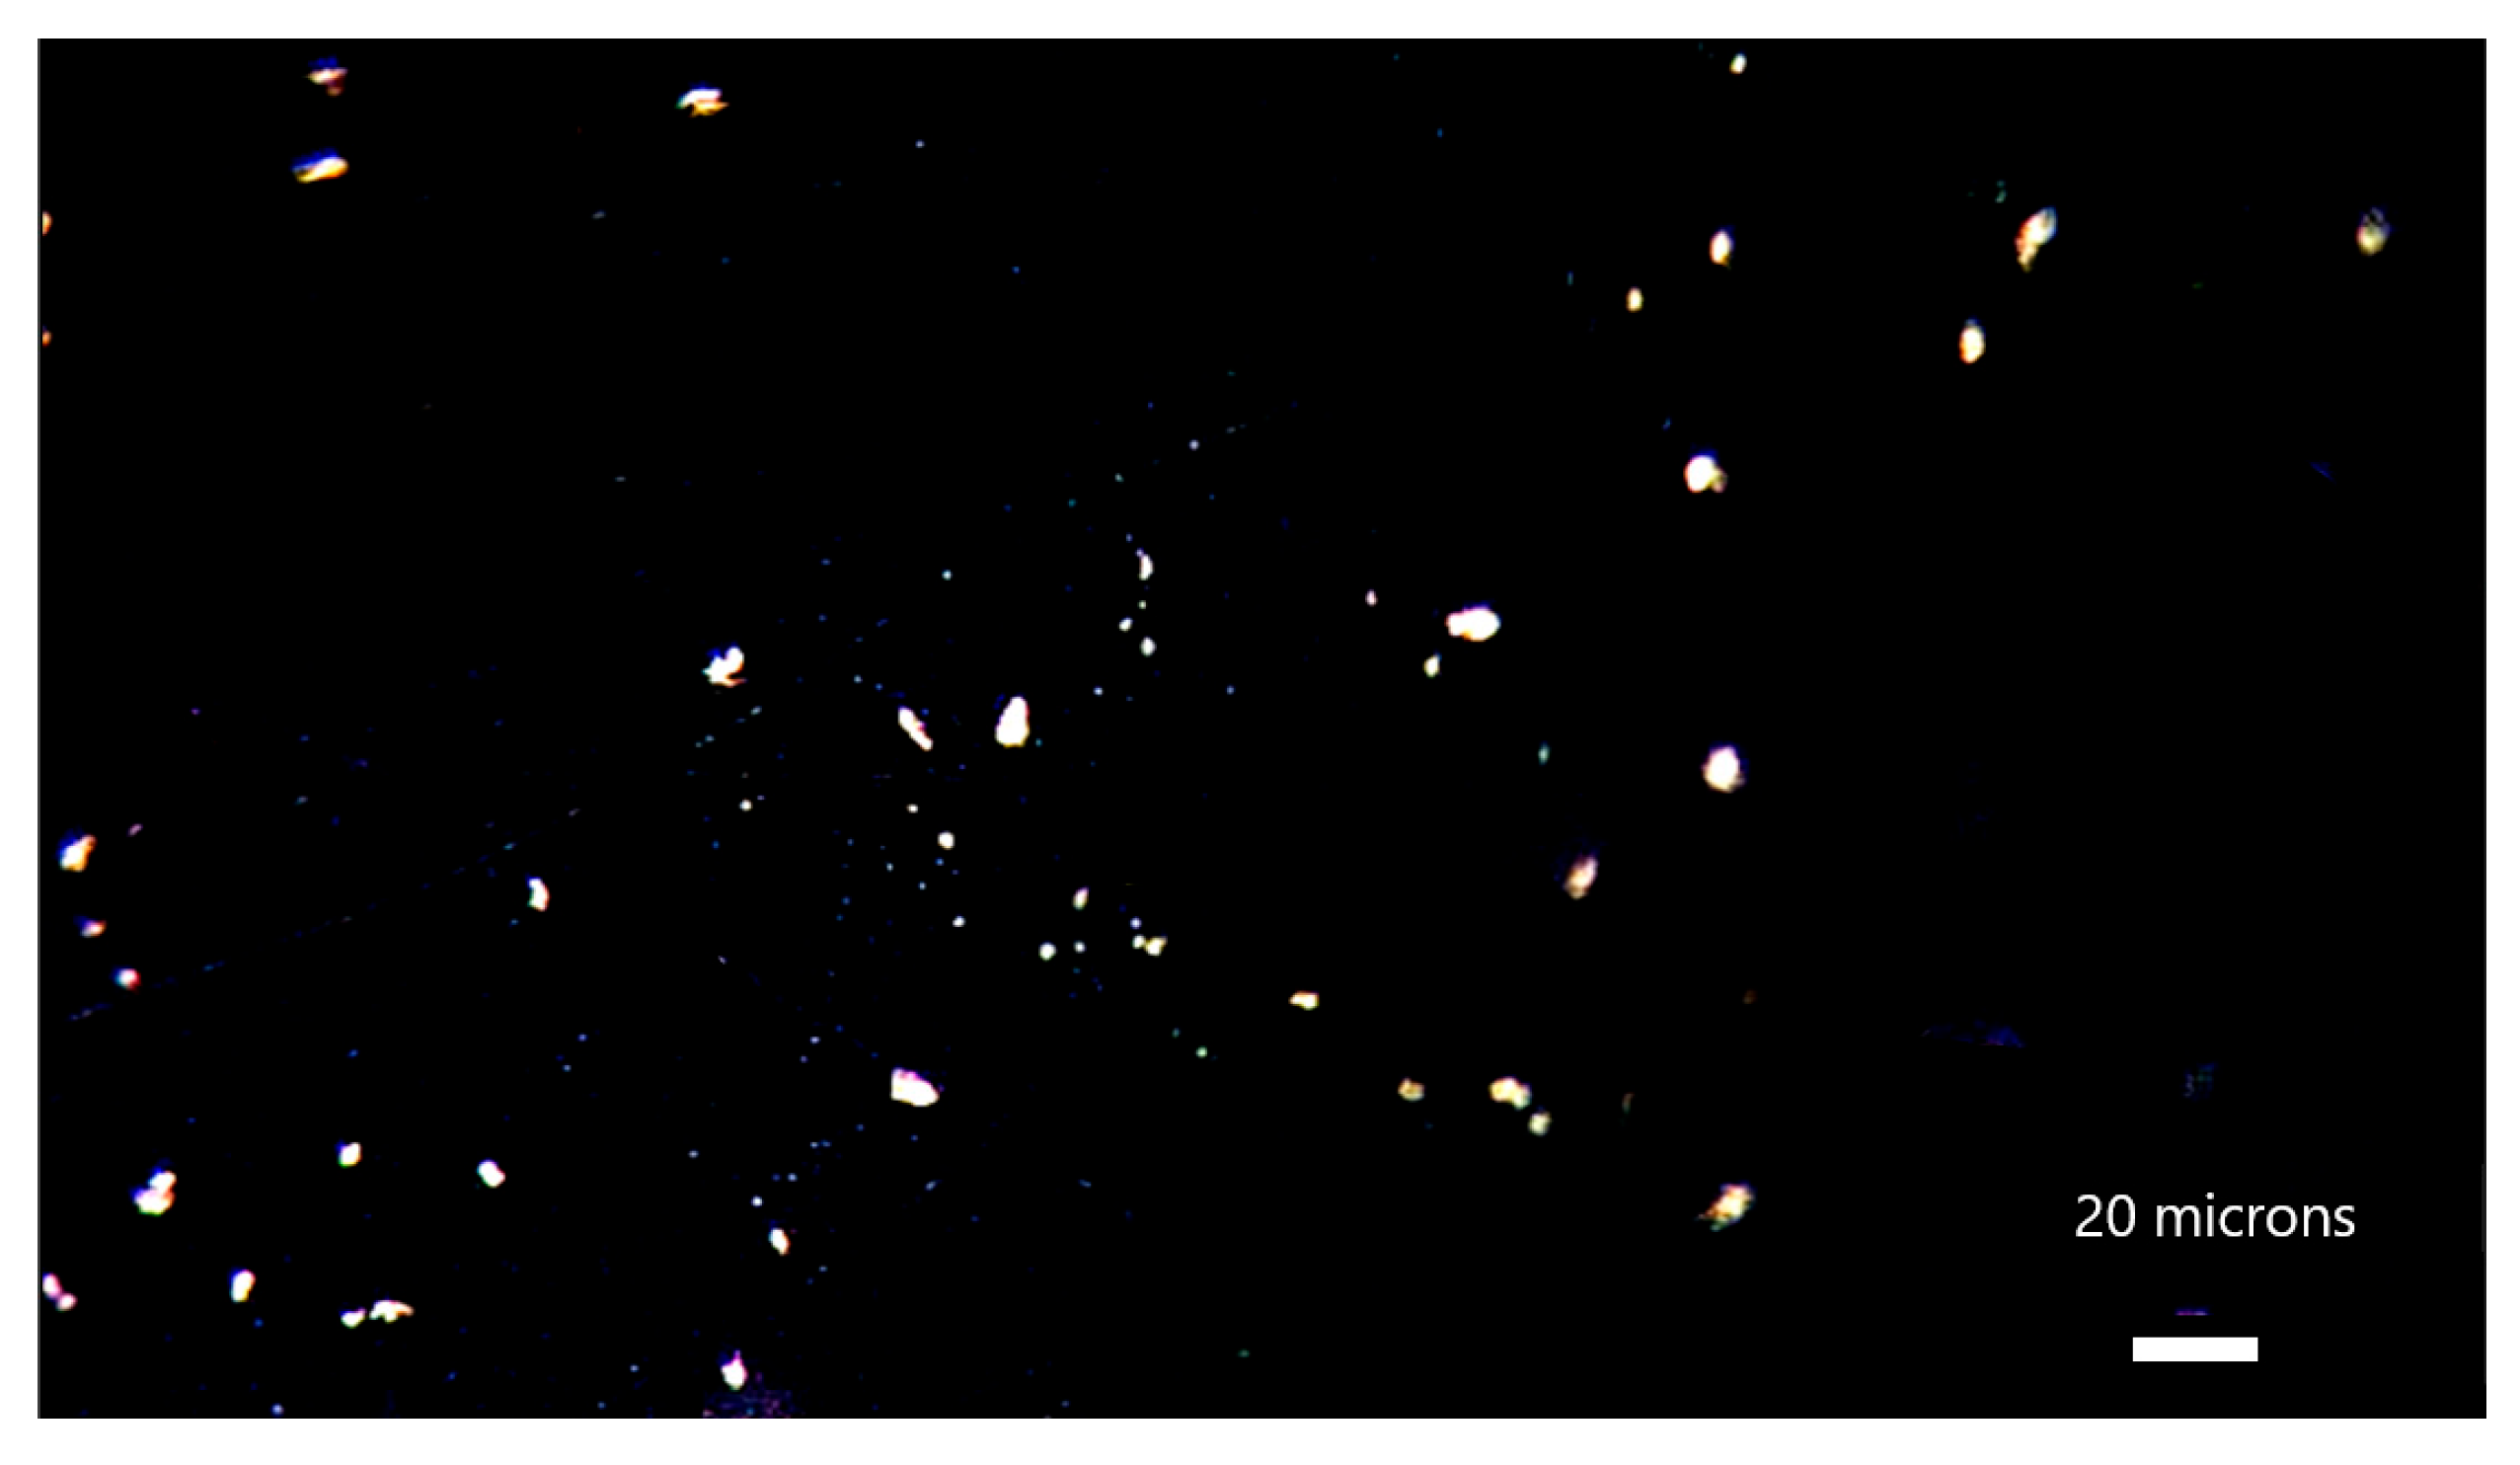
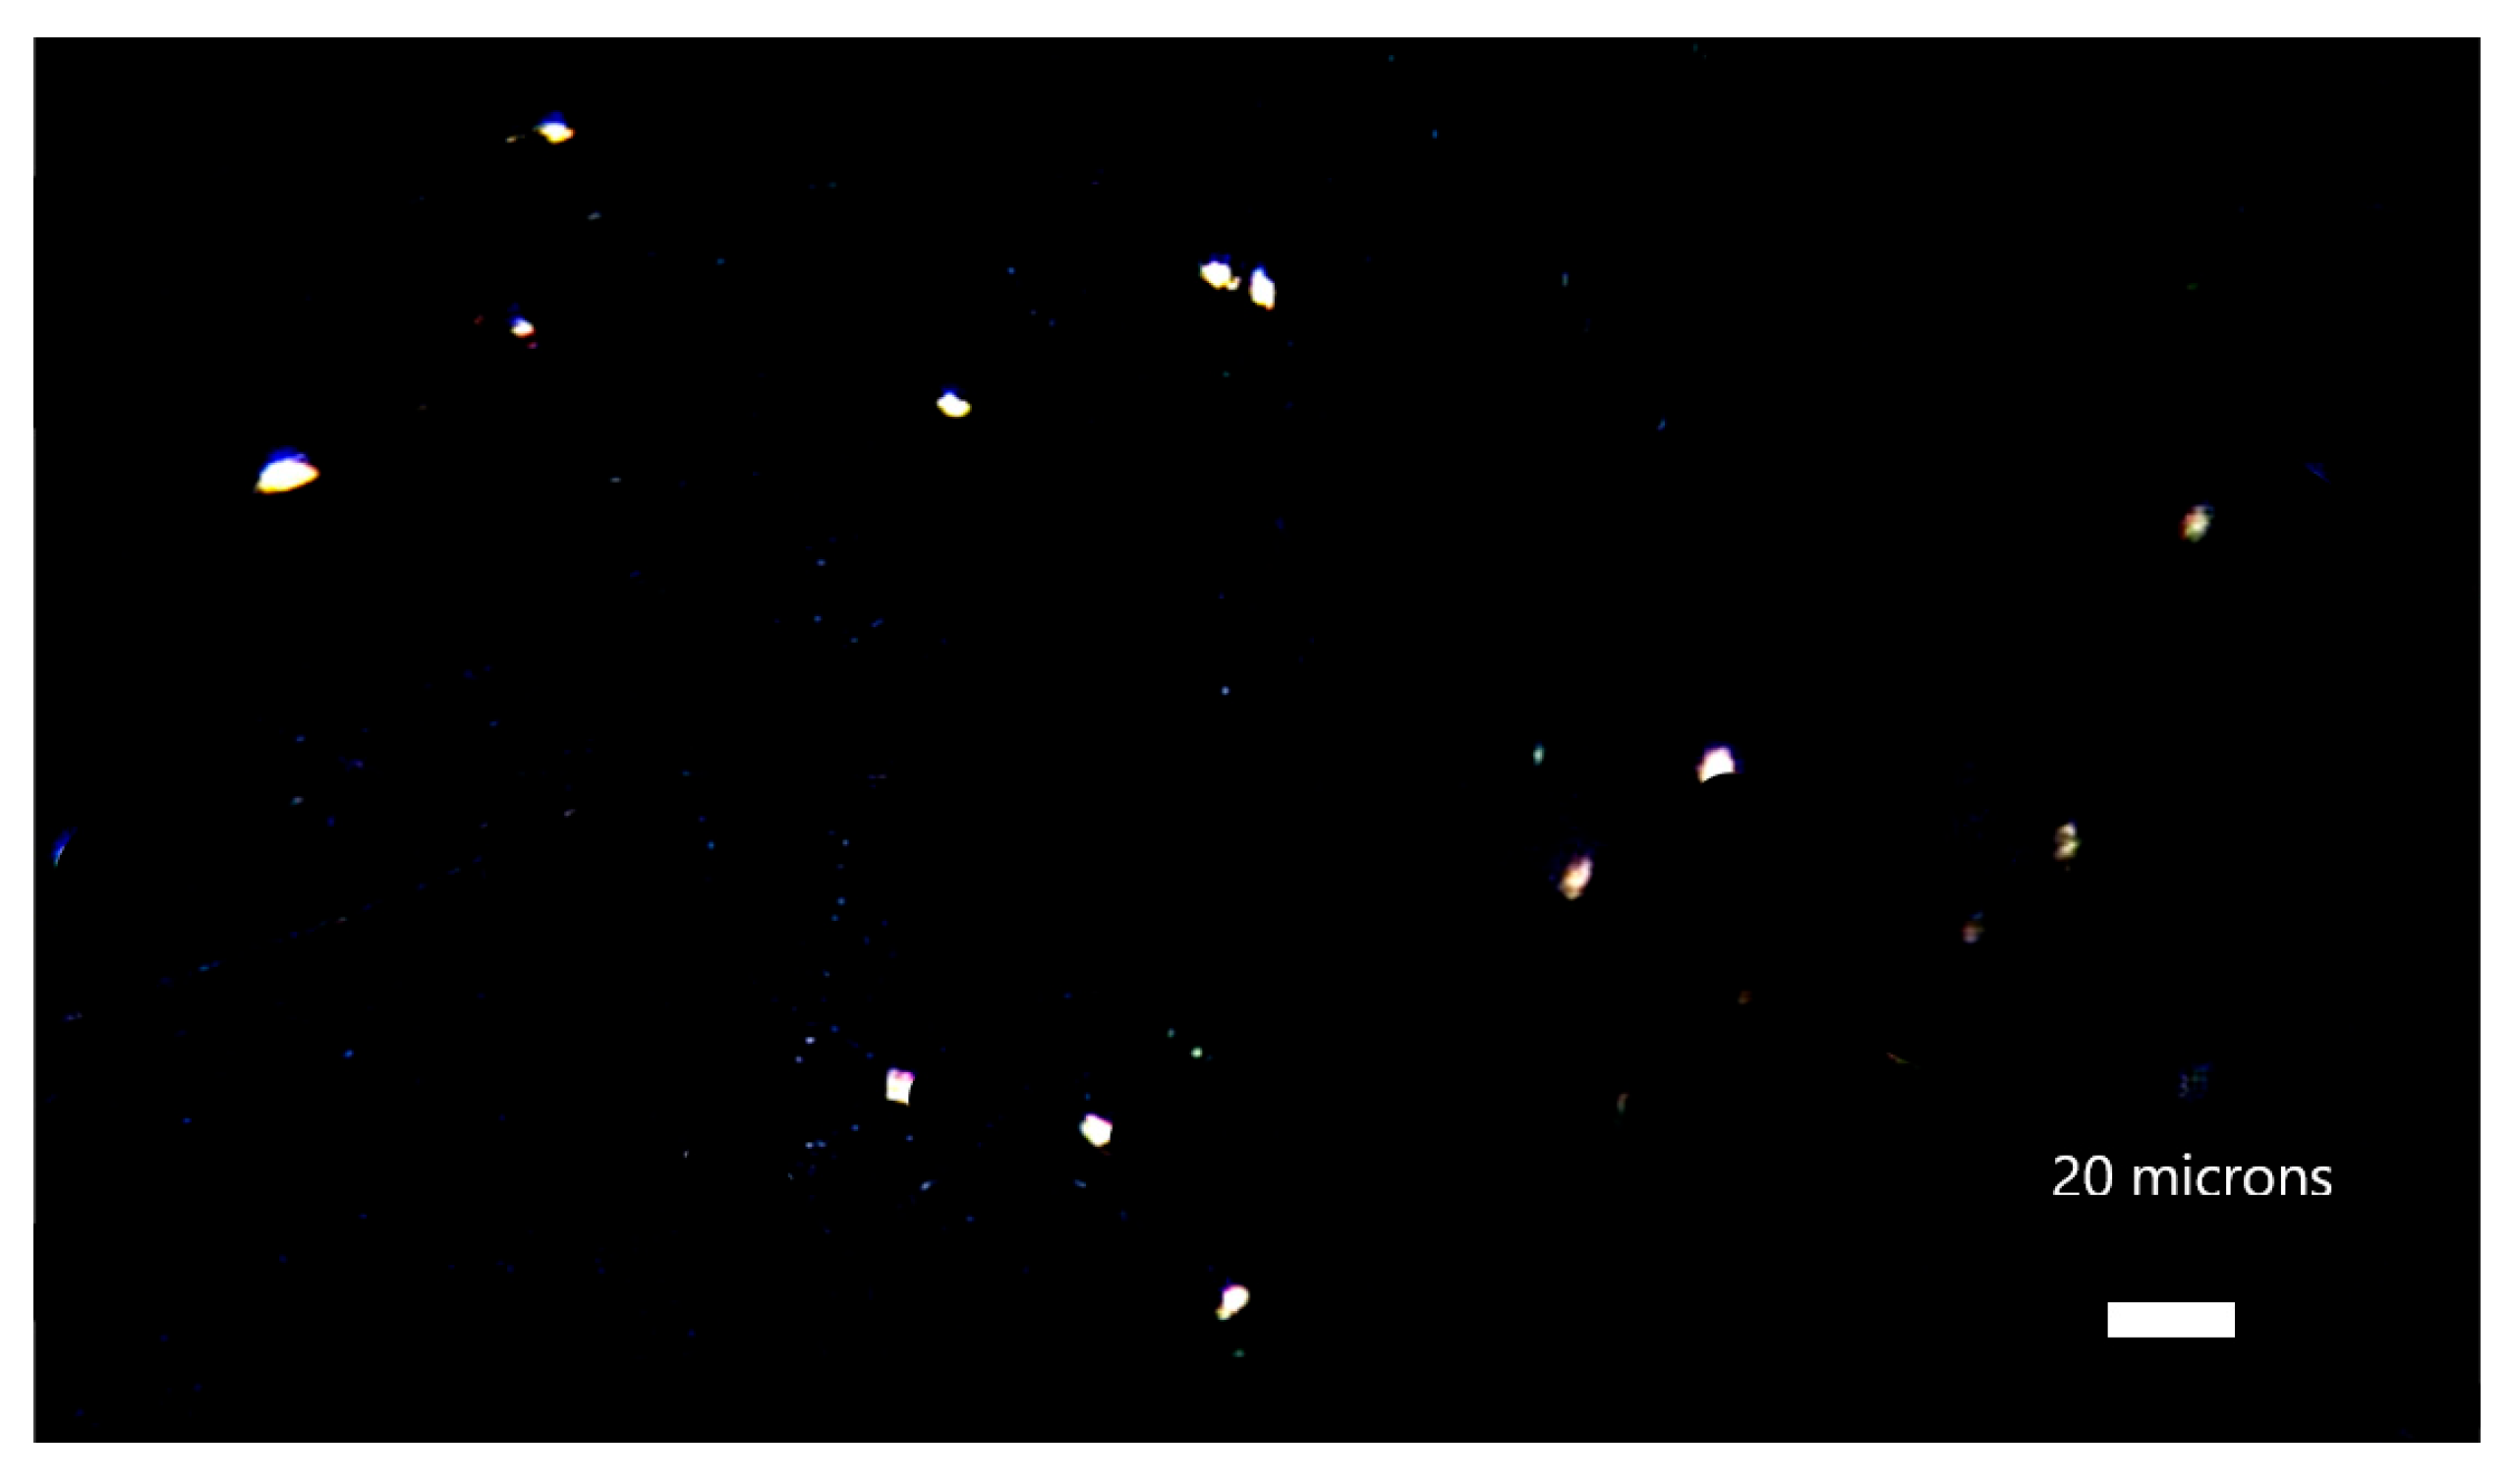
Two images of the exposed glass are shown in Figure 6 and Figure 7. The images were taken with the red channel of the RGB colour space. This has been found to compare better to standards on glass surfaces [45].
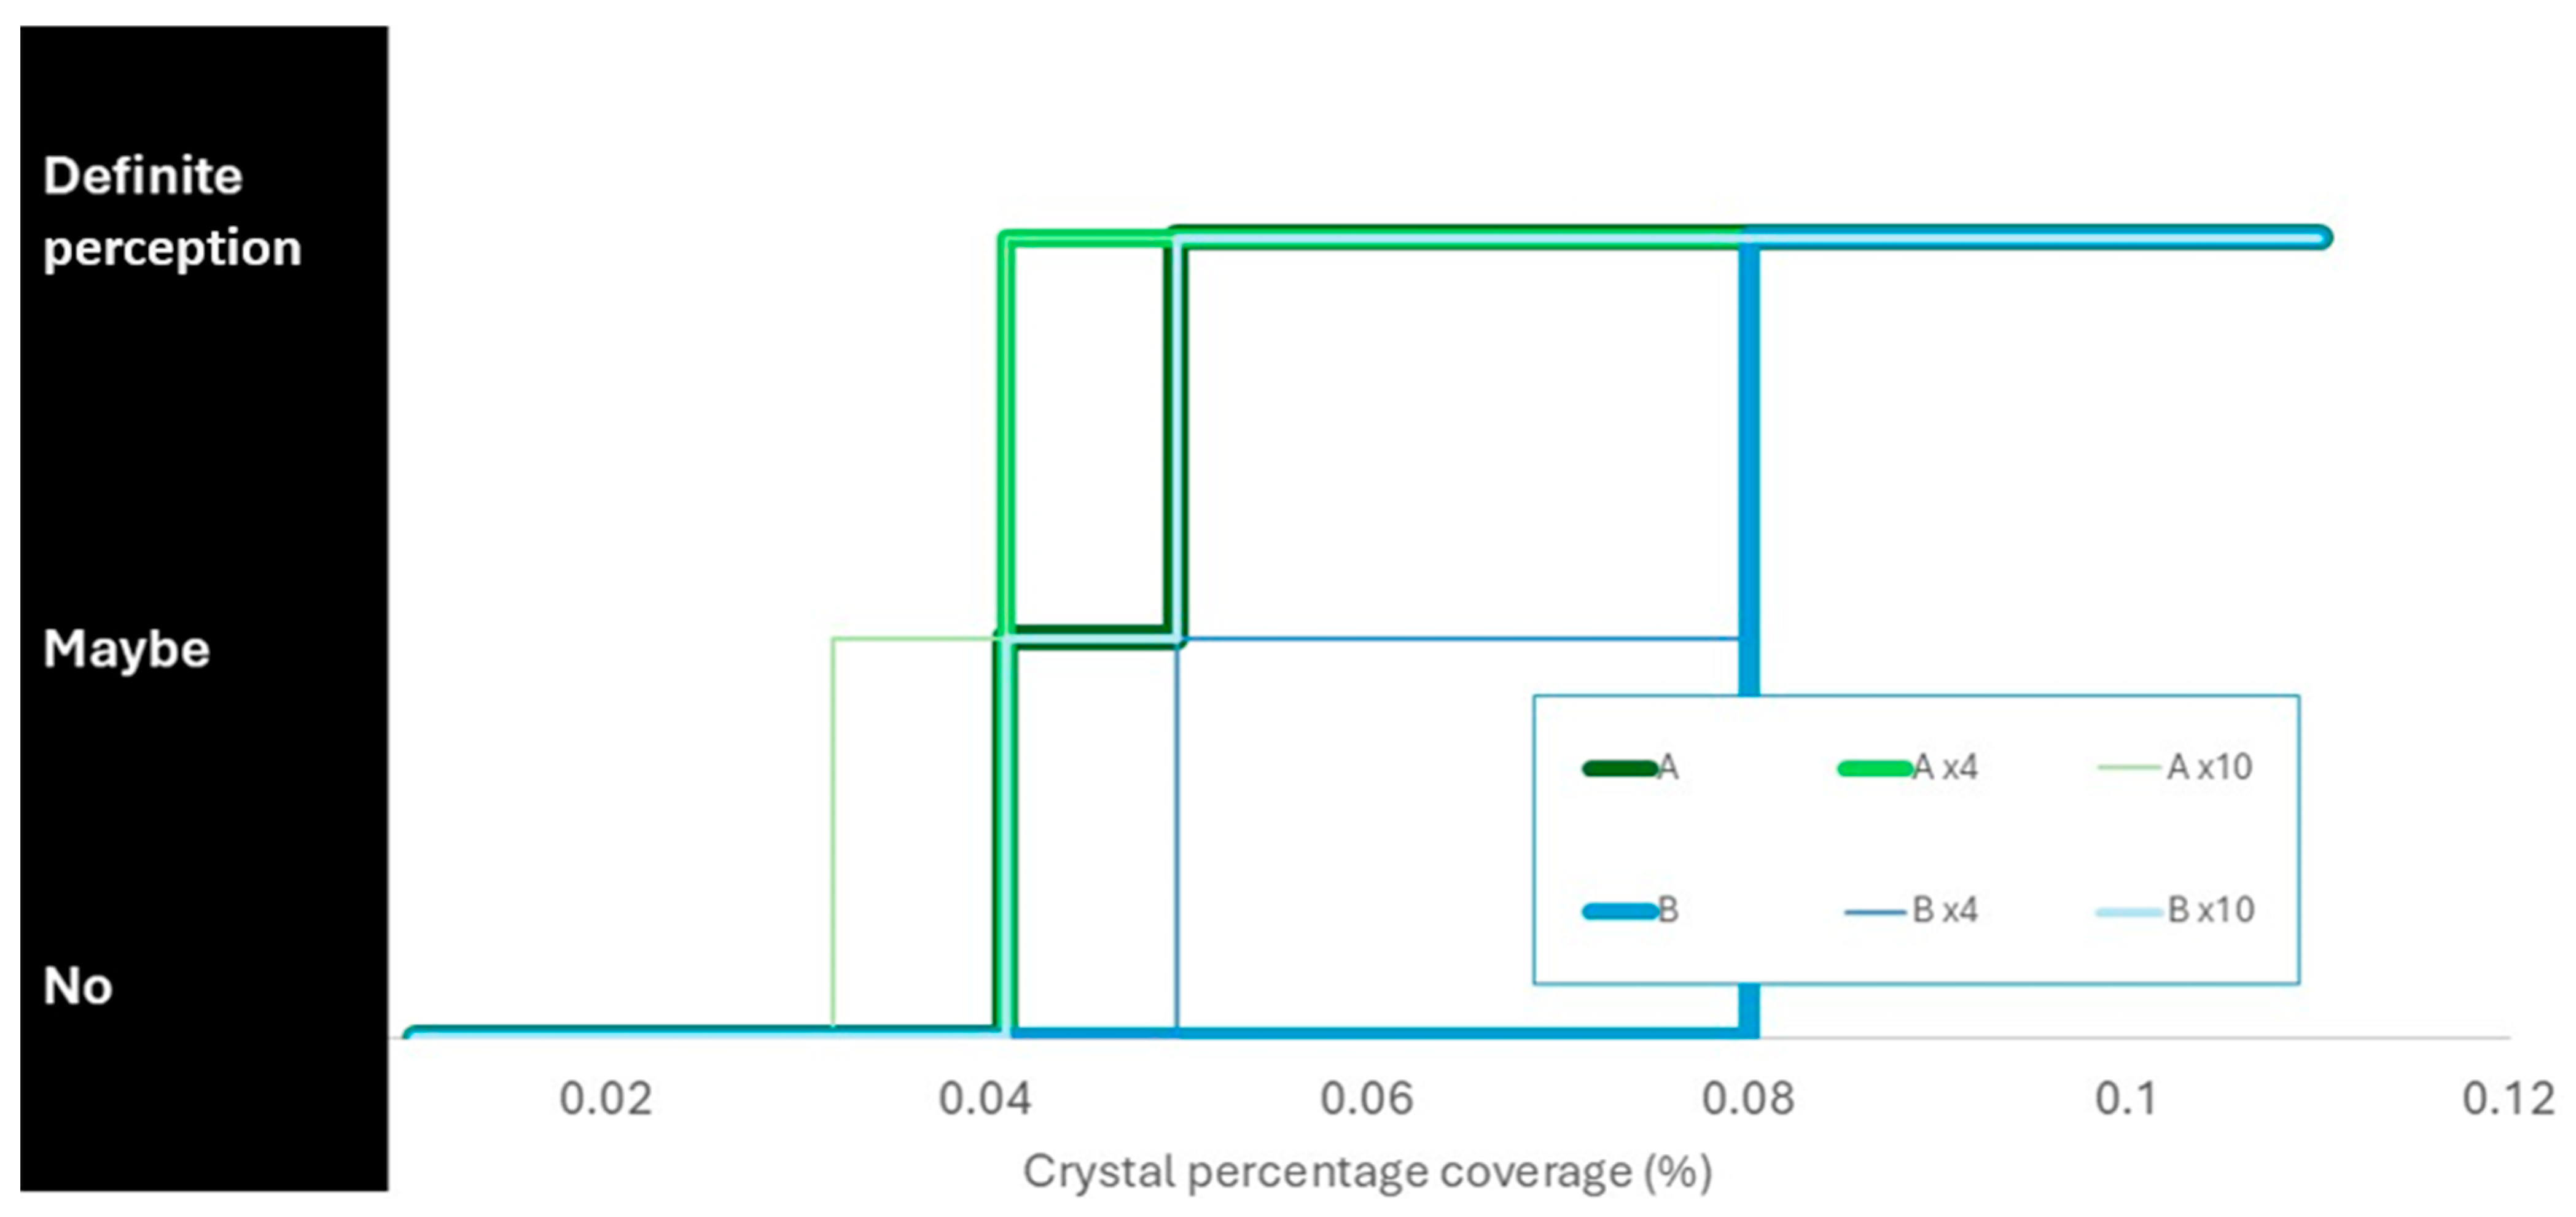
The two conservators’ perceptions of the glass showing signs of deterioration are summarised in Figure 8.
Conservator A perceived crystals at lower percentage coverages than Conservator B in all instances. The magnification helped, but Conservator A only rated 0.03% coverage as maybe and did not perceive 0.01% coverage at all, even with ×10 magnification. The ion chromatography easily detected both these levels and had an estimated detection limit 10x smaller than the lowest level tested (giving a coverage of 0.01%).

4. Conclusions

Experiments and site measurements evaluated three active control systems and two passive approaches. Dehumidifiers controlled RH well in all instances tested, whilst Miniclima and RK2 units performed most of the time. The Peltier dehumidification in these units struggled with very high room RH and higher temperatures. The energy usage and embedded carbon are in the same order of magnitude for the three active systems. The tight RH band recommended for unstable glasses was about 3–4 times more carbon-intensive to maintain. Silica gel (Prosorb or probably Silicagel E) would need changing quite frequently and at different periods over the year. Saturated potassium carbonate worked well at around 43% RH, but this is higher than the recommended range. Both passive systems have much lower carbon footprints.
Formic acid was effectively cleaned with the continuous RK2 unit, but the dehumidifier, Miniclima, and potassium carbonate left potentially damaging concentrations in the showcase in some situations. The single potassium carbonate test would need to be repeated to confirm this result. Some materials will pass the BEMMA and ISO 16000-based emission analyses and potentially reach damaging concentrations in some showcase designs.
Using dehumidifiers in storerooms was found to work, but only very low air exchange rate rooms can maintain the tight RH range. Most can maintain RH below 50%. The windows, doors, and building fabric are important for air exchange. Measurements with tracer gas decay gave much better estimates of dehumidifier energy use than those from pressurisation (fan) tests.
Exposure tests with six glass compositions indicated that reducing RH below 40% will slow deterioration. These results indicate the weakness of the saturated potassium carbonate approach to control, as only 43% can be achieved. Formic acid was confirmed as a very aggressive pollutant. Flowing air was shown to reduce the deterioration rate at 33% RH.
The newly started GoGreen project, Green Strategies to Conserve the Past and Preserve the Future of Cultural Heritage, will investigate the wider aspects of sustainability and the conservation profession’s transition to green practices. The research will include analysis to characterise the stability of glass objects and tailor their environments and preventive conservation strategies.

Author Contributions

Conceptualisation, D.T.; methodology, D.T. and A.M.; formal analysis, D.T. and A.M.; investigation, D.T. and A.M.; resources, D.T.; data curation, D.T.; writing—original draft preparation, D.T. and A.M.; writing—review and editing, D.T. and A.M. All authors have read and agreed to the published version of the manuscript.

Funding

This work was partly funded through the GoGreen project by the European Commission Horizon Program (grant agreement No. 101060768).

Data Availability Statement

The original contributions presented in this study are included in the article. Further inquiries can be directed to the corresponding authors.

Acknowledgments

The ion chromatograph was purchased by a Research Organisations Infrastructure Grant from the UK Department of Science, Innovation and Technology. The microscope and environmental chambers were purchased with a UK Arts and Humanities Research Council (AHRC) Capability for Collections Grant. The Raman spectrometer was purchased with an AHRC RiCHeS grant.

Conflicts of Interest

The authors declare no conflicts of interest.

Abbreviations

The following abbreviations are used in this manuscript:
RHRelative humidity
AERAir exchange rate

References

  1. UK Met Office. The Influence of Climate Change on Severe Weather. Available online: https://www.metoffice.gov.uk/blog/2024/the-influence-of-climate-change-on-severe-weather (accessed on 28 April 2025).
  2. Brill, R.H. Crizzling—A Problem in Glass Conservation. Stud. Conserv. 1975, 20, 121–134. [Google Scholar] [CrossRef]
  3. Bimson, M.; Organ, R.M. The Safe Storage of Unstable Glass. Mus. News 1968, 46, 39–47. [Google Scholar]
  4. Koob, S.; Van Griffen, N.A.; Kunicki-Goldfinger, J.J.; Brill, R. Caring for Glass Collections: The Importance of Maintaining Environmental Controls. Stud. Conserv. 2018, 63, 146–150. [Google Scholar] [CrossRef]
  5. Bailly, M. “En Verre et Malgré Tout” or the Daily Task of Glass Conservation in a French Museum Context: The Conservator’s Point of View. In Glass Atmospheric Alteration—Cultural Heritage, Industrial and Nuclear Glasses; Biron, I., Alloteau, F., Lehuédé, P., Majérus, O., Caurant, D., Eds.; Hermann: Paris, France, 2019; pp. 134–140. [Google Scholar]
  6. Biron, I. Le Materiaux Verre et les Objets du Patrimoine. Origine et Manifestation des Problemes Rencontres. In Conservation, Restauration du Verre, Actualites et Problematiques Museales, Actes du Colloque, Atelier-Musee du Verre, Trelon; Ecomusee de l’Avesnois: Trelon, France, 2007; pp. 13–23. [Google Scholar]
  7. Brill, R.H. The Use of Equilibrated Silica Gel for the Protection of Glass with Incipient Crizzling. J. Glass Stud. 1978, 20, 100–118. [Google Scholar]
  8. Fontaine-Hodiamont, C. Le Verre: Principes de Conservation, d’Exposition et d’Entretien. Royal Institute for Cultural Heritage: Brussels, Belgium. 2018. Available online: https://balat.kikirpa.be/document/532079 (accessed on 28 April 2025).
  9. Gerassimova, N.G.; Nogid, I.L.; Molchanov, V.S. Cleaning and conservation of glass objects in museums. Ху∂ожественное Насле∂ие (Artist. Herit.) 1975, 31, 88–102. (In Russian) [Google Scholar]
  10. Hetteš, K. O ochraně skleněných památek před odskelňováním’. Zprávy Památkové Péče (Herit. Care News) 1954, 14, 240–245. (In Czech) [Google Scholar]
  11. Oakley, V. Fighting the Inevitable: The Continuing Search for a Solution to Glass Decay at the V&A. Glass Tech. 2001, 42, 65–69. [Google Scholar]
  12. Ryan, J.L. The Atmospheric Deterioration of Glass: Studies of Decay Mechanisms and Conservation Techniques. Ph.D. Thesis, University of London, London, UK, 1996. [Google Scholar]
  13. Roemich, H.; Wittstadt, K.; Maas-Diegeler, G. Accelerated weathering and long-term experiments—Conclusions for preventive conservation of glass objects. In Glass Atmospheric Alteration: Cultural Heritage, Industrial and Nuclear Glasses; Biron, I., Alloteau, F., Lehuédé, P., Majérus, O., Caurant, D., Eds.; Hermann: Paris, France, 2019; pp. 25–35. [Google Scholar]
  14. von Wittenau, C.S. ‘Sick’ glasses—A case for the Veste Coburg. In Proceedings of the 18th International Congress on Glass, San Francisco, CA, USA, 5–10 July 1998; The American Ceramic Society: Westerville, OH, USA, 1998. [Google Scholar]
  15. Ulitzka, S. Schädigung von Museal Aufbewahrten Gläsern Durch Die “Glaskrankheit” und Abhilfemaßnahmen, Kurzfassung Des Abschlußberichts Zum Forschungsvorhaben S188; Gefördert Durch Die Stiftung Industrieforschung, Institut für Werkstoffwissenschaften III, Universität Erlangen–Nürnberg: Erlangen, Germany, 1992; Unpublished Report. (In German) [Google Scholar]
  16. Thickett, D.; Melinis, A.; Cheung, C.S.; Lang, H. Analysing Objects to Produce More Sustainable Conservation Environments. 2023. Available online: https://www.ndt.net/search/docs.php3?id=28945 (accessed on 28 April 2025).
  17. Thickett, D.; Pretzel, B. FTIR surface analysis for conservation. Herit. Sci. 2020, 8, 5. [Google Scholar] [CrossRef]
  18. Artigas, D.J. A Comparison of the Efficacy and Costs of Different Approaches to Climate Management in Historic Buildings and Museums. Ph.D. Thesis, University of Pennsylvania, Philadelphia, PA, USA, 2007. [Google Scholar]
  19. Eggert, G. Saturated Salt Solutions in Showcases: Humidity Control and Pollutant Absorption. Herit. Sci. 2022, 10, 54. [Google Scholar] [CrossRef]
  20. BAM. BEMMA-Scheme Version 10-2020: Description of the BEMMA Investigative and Evaluative Procedure. 2022. Available online: https://netzwerke.bam.de/Netzwerke/Content/DE/Downloads/Nike/bemma-testprocedures.pdf?__blob=publicationFile (accessed on 28 April 2025).
  21. Schieweck, A. Airborne Pollutants in Museum Showcases. Ph.D. Thesis, Hochschule für Bildende Künste Dresden, Dresden, Germany, 2009. [Google Scholar]
  22. Thickett, D. Better Use of Showcases for Preservation and Sustainability. Stud. Conserv. 2022, 67, 267–276. [Google Scholar] [CrossRef]
  23. Robinet, L. The Role of Organic Pollutants in the Alteration of Historic Soda Silicate Glasses. Ph.D. Thesis, Université Pierre et Marie Curie-Paris VI, Paris, France, University of Edinburgh, Edinburgh, UK, 2006. [Google Scholar]
  24. Thickett, D.; Pretzel, B.; Allen, S.; Paynter, S.; Downes, S. Investigating and Preventing Daguerreotype Glass Deterioration. In Recent Advances in Glass and Ceramics Conservation. Proceedings of the 6th Interim Meeting of the ICOM-CC Glass and Ceramics Working Group, Lisbon, Portugal, 9–11 November 2022; Gridley, R., Schussler, V., Eds.; ICOM-CC: Lisbon, Portugal, 2022; pp. 183–195. [Google Scholar]
  25. Thickett, D.; Ling, D. Investigation of Weeping Glass Deterioration Under Controlled Relative Humidity Conditions. Stud. Conserv. 2021, 67, 366–372. [Google Scholar] [CrossRef]
  26. BEIS. Greenhouse Gas Reporting: Conversion Factors 2024. Department for Business, Energy and Industrial Strategy and Department for Energy Security and Net Zero. 2024. Available online: https://www.gov.uk/government/publications/greenhouse-gas-reporting-conversion-factors-2024 (accessed on 28 April 2025).
  27. Thickett, D.; Lankester, P. Simple, Accessible Modelling for Showcase Performance. In Postprints of MOVE International Conference, Museum Environments: Challenges and Opportunities 2021, Cairo, Egypt, 14–15 December 2021; ICOM: Paris, France, 2021. [Google Scholar]
  28. Gibson, L.T.; Cooksey, B.G.; Littlejohn, D.; Tennent, N.H. A Diffusion Tube Sampler for the Determination of Acetic Acid and Formic Acid Vapours in Museum Cabinets. Anal. Chim. Acta 1997, 341, 11–19. [Google Scholar] [CrossRef]
  29. Meyer, B.; Hermanns, K. Formaldehyde Release from Pressed Wood Products. In Formaldehyde: Analytical Chemistry and Toxicology; Gold, B.G., Ed.; American Chemical Society: Washington, DC, USA, 1985; pp. 101–116. [Google Scholar]
  30. ISO 12569:2017; Thermal Performance of Buildings and Materials—Determination of Specific Airflow Rate in Buildings—Tracer Gas Dilution Method. International Organization for Standardization: Geneva, Switzerland, 2017.
  31. ISO 9972:2015; Thermal Performance of Buildings—Determination of Air Permeability of Buildings—Fan Pressurization Method. International Organization for Standardization: Geneva, Switzerland, 2015.
  32. Munters MG50 Technical Brochure. Available online: https://www.munters.com/globalassets/digizuite/6346-en-mg50-ps-en-201110pdf/ (accessed on 28 April 2025).
  33. Munters MG90 Technical Brochure. Available online: https://www.munters.com/globalassets/digizuite/6347-en-mg90-ps-en-201906pdf/ (accessed on 28 April 2025).
  34. Munters MCS300 Technical Brochure. Available online: https://www.munters.com/globalassets/digizuite/6344-en-mcs300-ps-en-200912pdf/ (accessed on 28 April 2025).
  35. Pollard, A.M.; Heron, C. The Chemistry, Corrosion and Provenance of Archaeological Glass. In Archaeological Chemistry; Pollard, A.M., Heron, C., Eds.; Royal Society of Chemistry: Cambridge, UK, 2008; pp. 144–192. [Google Scholar]
  36. Mysen, B.O. Relationships Between Silicate Melt Structure and Petrologic Processes. Earth Sci. Rev. 1990, 27, 281–365. [Google Scholar] [CrossRef]
  37. Mysen, B.O.; Richet, P. Silicate Glasses and Melts: Properties and Structure; Elsevier: Amsterdam, The Netherlands, 2005. [Google Scholar]
  38. Pollard, A.M.; Blockley, S.P.E.; Ward, K.R. Chemical Alteration of Tephra in the Depositional Environment: Theoretical Stability Modelling. J. Quat. Sci. 2003, 18, 385–394. [Google Scholar] [CrossRef]
  39. Verhaar, G.; Van Bommel, M.; Tennent, N. Development and Validation of an Analytical Protocol for the Sampling and Quantitative Analysis of Ions on the Surface of Unstable Historic Glass in Museum Collections Using Ion-Exchange Chromatography. J. Chromatogr. 2020, 1627, 461368. [Google Scholar] [CrossRef] [PubMed]
  40. Tétreault, J.; Sirois, J.; Stamatopoulou, E. Studies of lead corrosion in acetic acid environments. Stud. Cons. 1998, 43, 17–32. [Google Scholar] [CrossRef]
  41. Norwegian Institute for Air Research. The MEMORI Technology Open Environment Input and Results Presentation Module. 2012. Available online: https://memori.nilu.no (accessed on 28 April 2025).
  42. Historic Scotland. Thermal Performance of Traditional Windows: Improving the Performance of Traditional Windows; Technical Paper 1 (Revised Edition); Historic Scotland: Edinburgh, UK, 2010.
  43. Historic England. Energy Efficiency and Historic Buildings: Draught-Proofing Windows and Doors; Historic England: London, UK, 2016.
  44. ASHRAE. ASHRAE Handbook—HVAC Applications, Chapter: Museums, Galleries, Archives, and Libraries; American Society of Heating, Refrigerating and Air-Conditioning Engineers: Peachtree Corners, GA, USA, 2019. [Google Scholar]
  45. Howell, D.; Brimblecombe, P.; Lloyd, H.; Frame, K.; Knight, B. Monitoring Dust in Historic Houses in Conservation Science; Archetype: London, UK, 2002. [Google Scholar]
Figure 1. Schematic for tests on complete pieces of glass.
Heritage 08 00251 g001
Figure 2. Impact of air exchange rate on showcase loaded with 3.33 m2/m3 of materials passing BEMMA and ISO 16000-based emission tests.
Heritage 08 00251 g002
Figure 3. Performance of selected rooms.
Heritage 08 00251 g003
Figure 4. Calculated durability for glass compositions tested.
Heritage 08 00251 g004
Figure 5. Amount of ion on glass surface after aging.
Heritage 08 00251 g005
Figure 6. Red channel image of salts on exposed glass surface.
Heritage 08 00251 g006
Figure 7. Red channel image of salts on glass surface exposed to more benign conditions.
Heritage 08 00251 g007
Figure 8. Conservator perceptions of crystals formed on glass surfaces.
Heritage 08 00251 g008
Table 1. A sample list of glass storage recommendations based on observational studies.
Author(s)Recommended RH
Bailly, 2019 [5]c. 50% (unsp.) for all glass; 40–50% for ‘sick’ glasses
Biron, 2007 [6]35–40%
Brill, 1978 [7]45–55% with further adjustment depending on glass state
Fontaine-Hodiamont, 2018 [8]≤50% for all glass; 35–40% for unstable glass
Gerassimova et al., 1975 [9]20%
Hetteš, 1954 [10]40 ± 5%
Koob, 2018 [4]45 ± 5% for all glass; 40–42% for deteriorating glass
Oakley, 2001 [11]; Ryan, 1996 [12]38 ± 3%
Roemich et al., 2019 [13]≤50%
Schack von Wittenau, 1998 [14]37–42%
Ulitzka, 1992 [15]35 ± 3%
Table 2. Test showcase conditions. D—dehumidifier, m—Miniclima, r—RK2, pc—potassium carbonate.
TestRoom TemperatureRoom RHAER (/Day)Volume (m3)
Ad18–2160–660.830.672
Am18–2160–66
Ar18–2160–66
A1d18–2170–75
A1m18–2170–75
A1r18–2170–75
A2d21–2470–75
A2m21–2470–75
A2r21–2470–75
A3d18–2127–32
A3r18–2127–32
A3m18–2127–32
A4r21–2470–750.24
A4m21–2470–75
A5d23–2670–750.83
A5m23–2670–75
A5r23–2670–75
A6m23–2670–750.24
A6r23–2670–75
A7m23–2670–750.04
A8r23–2670–75
Bm23–2670–750.230.064
Br23–2670–75
B1m23–2670–750.03
B1r23–2670–75
CpcTRH0.23VOL
Table 3. Existing showcase conditions. D—dehumidifier, m—Miniclima, r—RK2, pc—potassium carbonate.
TestRoom TemperatureRoom RHAER (/day)Volume (m3)
Dd17.1–21.634–790.640.72
Ed18.9–22.529–680.420.92
Fm17.2–22.632–750.320.87
Gm16.2–22.541–740.760.87
Hr11.5–21.235–680.950.20
Ir11.5–21.235–680.810.43
Jd12.5–19.234–750.450.88
Kd12.5–19.234–750.760.88
Lm16.8–25.134–720.630.34
Mm20.1–26.635–650.451.04
Table 4. Composition of tested glasses (wt%).
Na2OMgOAl2O3SiO2SO3ClK2OCaOTiO2Fe2O3As2O3
I10.41 ± 0.040.334 ± 0.060.80 ± 0.0274.25 ± 0.170.64 ± 0.03<0.010.18 ± 0.0113.02 ± 0.050.08 ± 0.030.24 ± 0.02<0.06
II13.73 ± 0.090.10 ± 0.030.44 ± 0.0477.76 ± 0.120.37 ± 0.020.53 ± 0.010.28 ± 0.017.09 ± 0.060.10 ± 0.010.11 ± 0.010.40 ± 0.06
III14.03 ± 0.044.15 ± 0.050.84 ± 0.0171.52 ± 0.040.23 ± 0.030.03 ± 0.010.46 ± 0.028.68 ± 0.04<0.010.10 ± 0.02<0.01
IV2.51 ± 0.012.73 ± 0.013.21 ± 0.0169.44 ± 0.040.43<0.013.17 ± 0.0217.94 ± 0.060.03 ± 0.010.54 ± 0.03<0.01
V5.67 ± 0.011.05 ± 0.010.65 ± 0.0178.34 ± 0.13<0.01<0.013.39 ± 0.0110.64 ± 0.050.04 ± 0.010.21 ± 0.01<0.01
VI0.30 ± 0.018.15 ± 0.060.28 ± 0.0171.71 ± 0.14<0.01<0.0114.86 ± 0.043.92 ± 0.040.16 ± 0.010.20 ± 0.020.42 ± 0.02
Table 5. Performance of the test showcases.
%Time at 40–42% RHMax RH% in ShowcaseWeekly Energy Use (kWh 40–42%)Formic Acid Conc. (µg/m3)Weekly Energy Use (kWh 40–50%)
Ad100 3.00121 ± 130.98
Am100 2.63152 ± 211.30
Ar100 2.69Bd1.21
A1d100 3.3224 ± 41.31
A1m100 3.4743 ± 61.61
A1r100 3.36Bd1.56
A2d100 3.4034 ± 61.42
A2m85454.0361 ± 81.85
A2r92443.97Bd1.74
A4d100 0.87
A4m100 1.02
A4r100 0.93
A5d100 2.84
A5m100 2.56
A5r100 4.29
A6m72464.41
A6r92431.26
A7m91441.11
A7r98443.38
A8m100 0.73
A8r100 0.51
Bm93430.22
Br100 0.17
B1m100 0.08234 ± 32
B1r100 0.04Bd
Cpc100 (41–45) *450112 ± 12
* Note: different RH range used due to deliquescent point of salt. Bd below detection = 13 µg/m3.
Table 6. Performance and energy use in installed showcases.
ShowcaseControl
Method
Control Band%Time in BandAnnual Energy Use (kWh)Calculated Time Between Replacing Prosorb (Days)
1 Jan1 Apr1 Jul1 Oct
DdMG5040–42%10031144364490
EdMG5040–42%1004648121530
FmMiniclima40–42%985396283460
GmMiniclima40–42%9261144363890
HrRK240–42%1003848101030
IrRK240–42%994596202160
JdMG5040–50%1004196243460
KdMG5040–50%10046144303890
LmMiniclima40–50%1003196242960
MmMiniclima40–50%1003096202160
Table 7. Room air exchange rates and estimated and measured energy use to dehumidify to 50 or 40% RH.
Ext. Wall, %Area of WindowsFloorCeilingVolume m3 AER (Tracer Gas/h)AER (Pressurisation ACH @50Pa)Estimated Energy Use (kWh)Measured Energy Use (kWh)
Wrest Park Store (50)NConcrete 2532ND1.2043365551
Wrest Park Archive Store (40)NConcrete 2260.720.95280 (403)339
Temple Cloud Archive StoreY, 0ConcreteConcrete1570.811.10431 (495)401
Kenwood Print store (50)Y, 22woodPlaster52.61.95ND304267
Kenwood Print store (40)Y, 22WoodPlaster52.61.95ND307410
Dover (50)Y, 18WoodPlaster33.61.63ND167131
Dover windows sealedY, 18WoodPlaster33.60.82NDNDND
Dover floor sealedY, 18Al foilPlaster33.61.12NDNDND
Dover ceiling sealedY, 18WoodAl foil33.61.54NDNDND
Dover (40)Y, 18WoodPlaster33.61.63ND195208
Ranger’s (50)Y, 12LinoleumPlaster27.12.38NDNDND
Ranger’s (50)Y, 12WoodPlaster27.13.28NDND212
Ranger’s windows sealed (50)Y, 12WoodPlaster27.10.59NDND111
Ranger’s (40)Y, 12Woodplaster27.13.28ND460382
Disclaimer/Publisher’s Note: The statements, opinions and data contained in all publications are solely those of the individual author(s) and contributor(s) and not of MDPI and/or the editor(s). MDPI and/or the editor(s) disclaim responsibility for any injury to people or property resulting from any ideas, methods, instructions or products referred to in the content.

