Article

An Analysis of the Pore Distribution in Ceramic Vessels from the Akterek Burial Archeological Site Using Neutron Tomography Data

by
Murat Kenessarin
1,2,*,
Kuanysh Nazarov
1,2,3,
Veronica Smirnova
2,
Sergey Kichanov
2,
Nabira Torezhanova
4,
Olga Myakisheva
4,
Ayazhan Zhomartova
1,2,
Bagdaulet Mukhametuly
1,2,3,
Renata Nemkayeva
3 and
Elmira Myrzabekova
1,2,3
1
Institute of Nuclear Physics, Ministry of Energy of the Republic of Kazakhstan, Almaty 050032, Kazakhstan
2
Joint Institute for Nuclear Research, Dubna 141980, Russia
3
Department of Physics and Technology, Al-Farabi Kazakh National University, Almaty 050040, Kazakhstan
4
Central State Museum of the Republic of Kazakhstan, Almaty 050059, Kazakhstan
*
Author to whom correspondence should be addressed.
Heritage 2025, 8(6), 210; https://doi.org/10.3390/heritage8060210
Submission received: 20 April 2025 / Revised: 31 May 2025 / Accepted: 3 June 2025 / Published: 5 June 2025
(This article belongs to the Section Archaeological Heritage)

Abstract

:
The spatial arrangement, size distribution, and shape of internal pores in several archaeological ceramic vessels from the Akterek burial site at Zhambyl District of Almaty Region, Republic of Kazakhstan were studied using neutron tomography. The internal pores were segmented from the obtained neutron data and the porosity value for the ancient ceramic samples was calculated. Analysis of the structural tomography data showed that the ceramic materials contained a large number of relatively small pores, with an average diameter less than 1.5 mm, while some ceramic objects had larger pores or cavities exceeding 2 mm in diameter. In addition, there are differences in the morphological parameters of large and small pores. It was suggested that these large pores formed as a result of temperature changes during the firing of the pottery ceramics. The relative shifting of Raman peaks in the carbon group in amorphous carbon, as an indicator of the firing temperature of ceramic materials, confirms this assumption.

1. Introduction

Recently, a consistent trend has emerged in modern archaeology—the study of archaeological materials using experimental scientific methods, particularly nuclear physics methods [1,2]. This trend is primarily due to the non-destructive nature of these methods [3,4], which is of utmost importance in the study of unique and valuable historical artifacts. In addition, non-destructive diagnostic methods provide interesting and reliable scientific information that would be impossible or difficult to obtain using traditional archaeological research methods [5]. Among these methods, it is important to highlight the neutron structural diagnostic techniques: neutron diffraction and tomography. These methods have already been successfully applied in the non-destructive analysis of archaeological artifacts [6,7,8]. Already, classic examples of research in this field include neutron studies of metal weapons [9,10,11], household items [12,13], ancient coins [14,15,16], and medieval jewelry [17,18]. The high penetrating power of neutrons, as well as the specific formation of neutron radiographic contrast in neutron studies of massive archaeological materials [19], make neutron structural analysis methods an essential scientific tool in natural science research of archaeological objects [20].
Neutron structural diagnostics methods are actively used to characterize archaeological ceramic materials such as fragments of pottery [21] and construction and building materials [22]. As a constant companion to most historical finds in large archaeological excavations, ceramic material represents a complex and multi-component system. The phase composition, spatial distribution of components, porosity, and minor additional phases of clay, as well as features of decorative surface layers [23], can all serve as structural markers or indicators for determining the raw material sources or pottery workshops [24], reconstructing techniques and practices in ancient pottery artefacts [25], and tracing trade routes between ancient settlements or historical regions. For example, group cluster analysis [26] based on the structural characteristics of data obtained from neutron tomography and diffraction methods allowed for the classification of ceramic fragments from excavations at the Byzantine fortress in Dobruja (Romania). These studies analyzed statistical correlations between the phase composition of ceramic fragments and their porosity. This allowed for the division of the entire variety of archaeological ceramic samples into four groups based on the location of pottery manufactures [27]. Non-destructive neutron diagnostic methods have also revealed a high content of organic matter, possibly of plant origin, in ceramic materials [28] from archaeological excavations in the Tarbagatai and Zaisan districts of Eastern Kazakhstan. Based on Raman spectroscopy data for amorphous carbon inside ceramic fragments, the firing temperatures of pottery were estimated. In some of these samples, an abnormal concentration of mica was also found, which can be explained by the addition of granite chips to clay masses during the manufacturing of ceramics [29]. It should be noted that ancient Saka settlements were located in the mountainous regions of Kazakhstan, where there was no access to sources of sea or river quartz sand.
As one of the research directions in the study of different archaeological materials from ancient tribes [15,28,29] in the territory of modern Kazakhstan, as well as a comparative analysis of the structural characteristics of ancient objects from various geographical regions of the country, this work presents the results of neutron tomography of seven ceramic vessels excavated near the village of Akterek, Zhambyl District, Almaty Region. The study of Zhetysu monuments [30] in the Akterek burial site found some cases of burial pottery samples belong to an earlier era. This confirms a relative conservatism in burial rites. It is believed that religious cult rituals, expressed in burial, were passed down from generation to generation within specific tribal groups belonging to various political unions, such as the Saks, Usuns, and Turks [31].

2. Materials and Methods

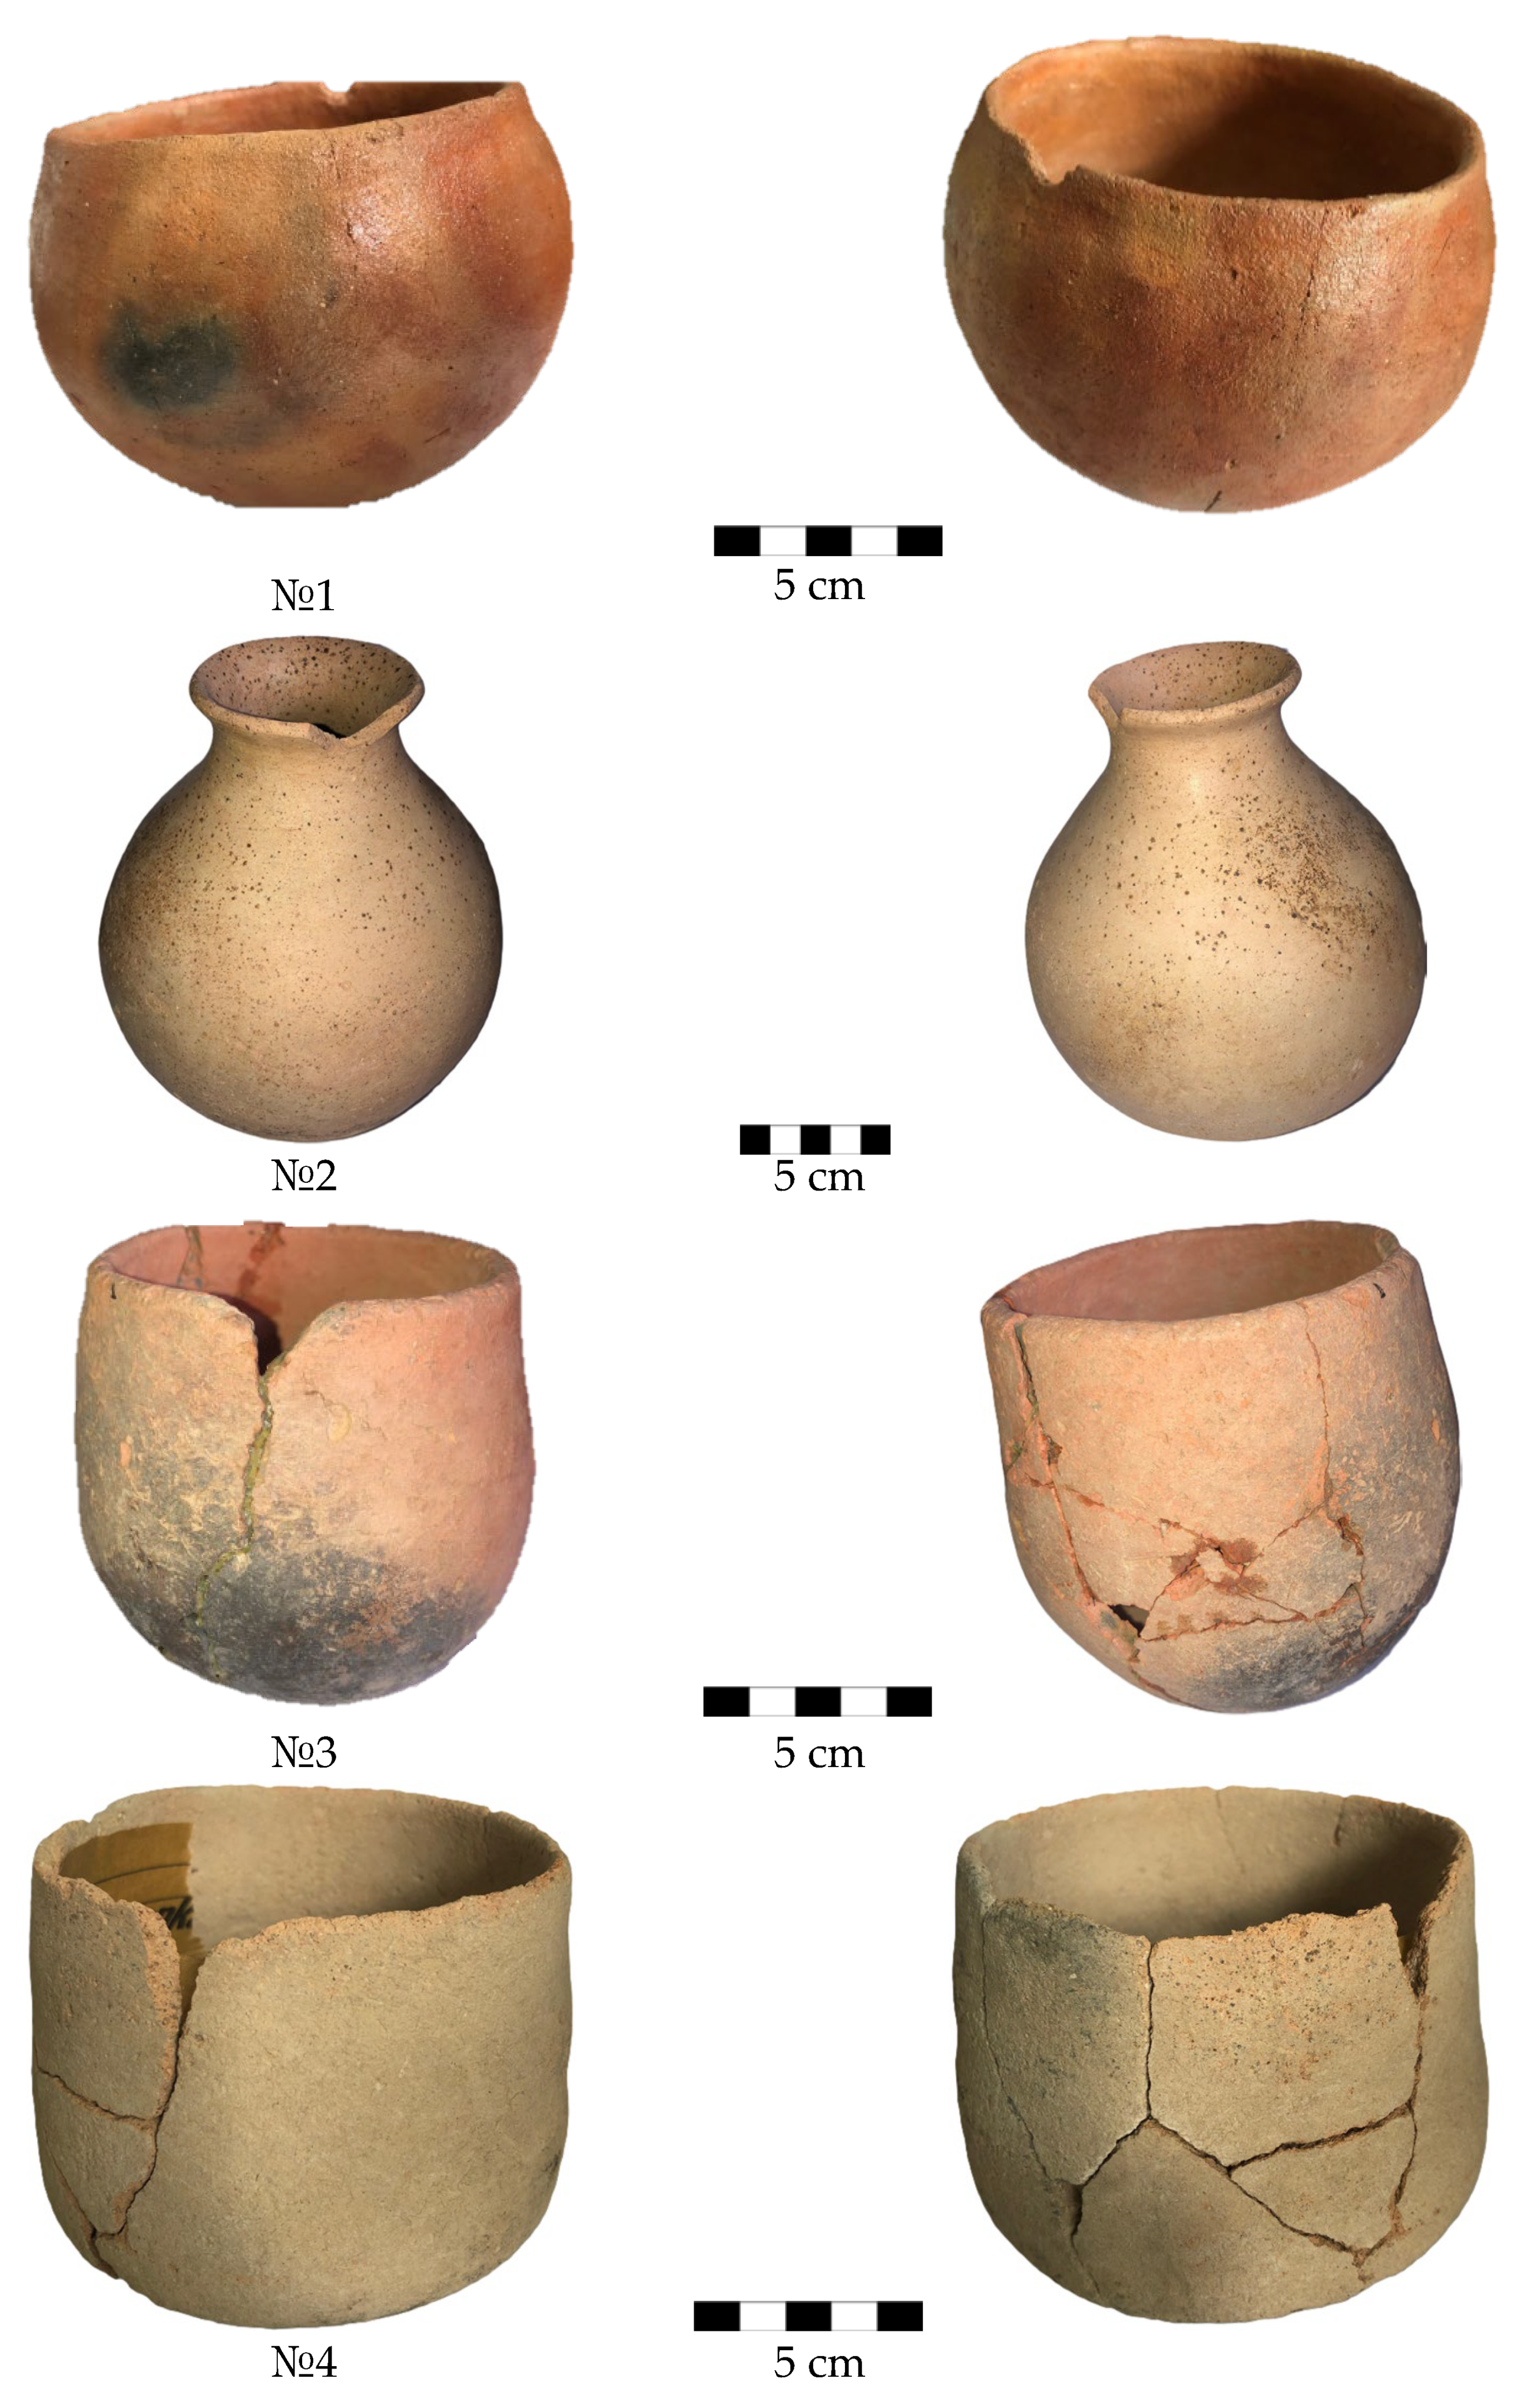
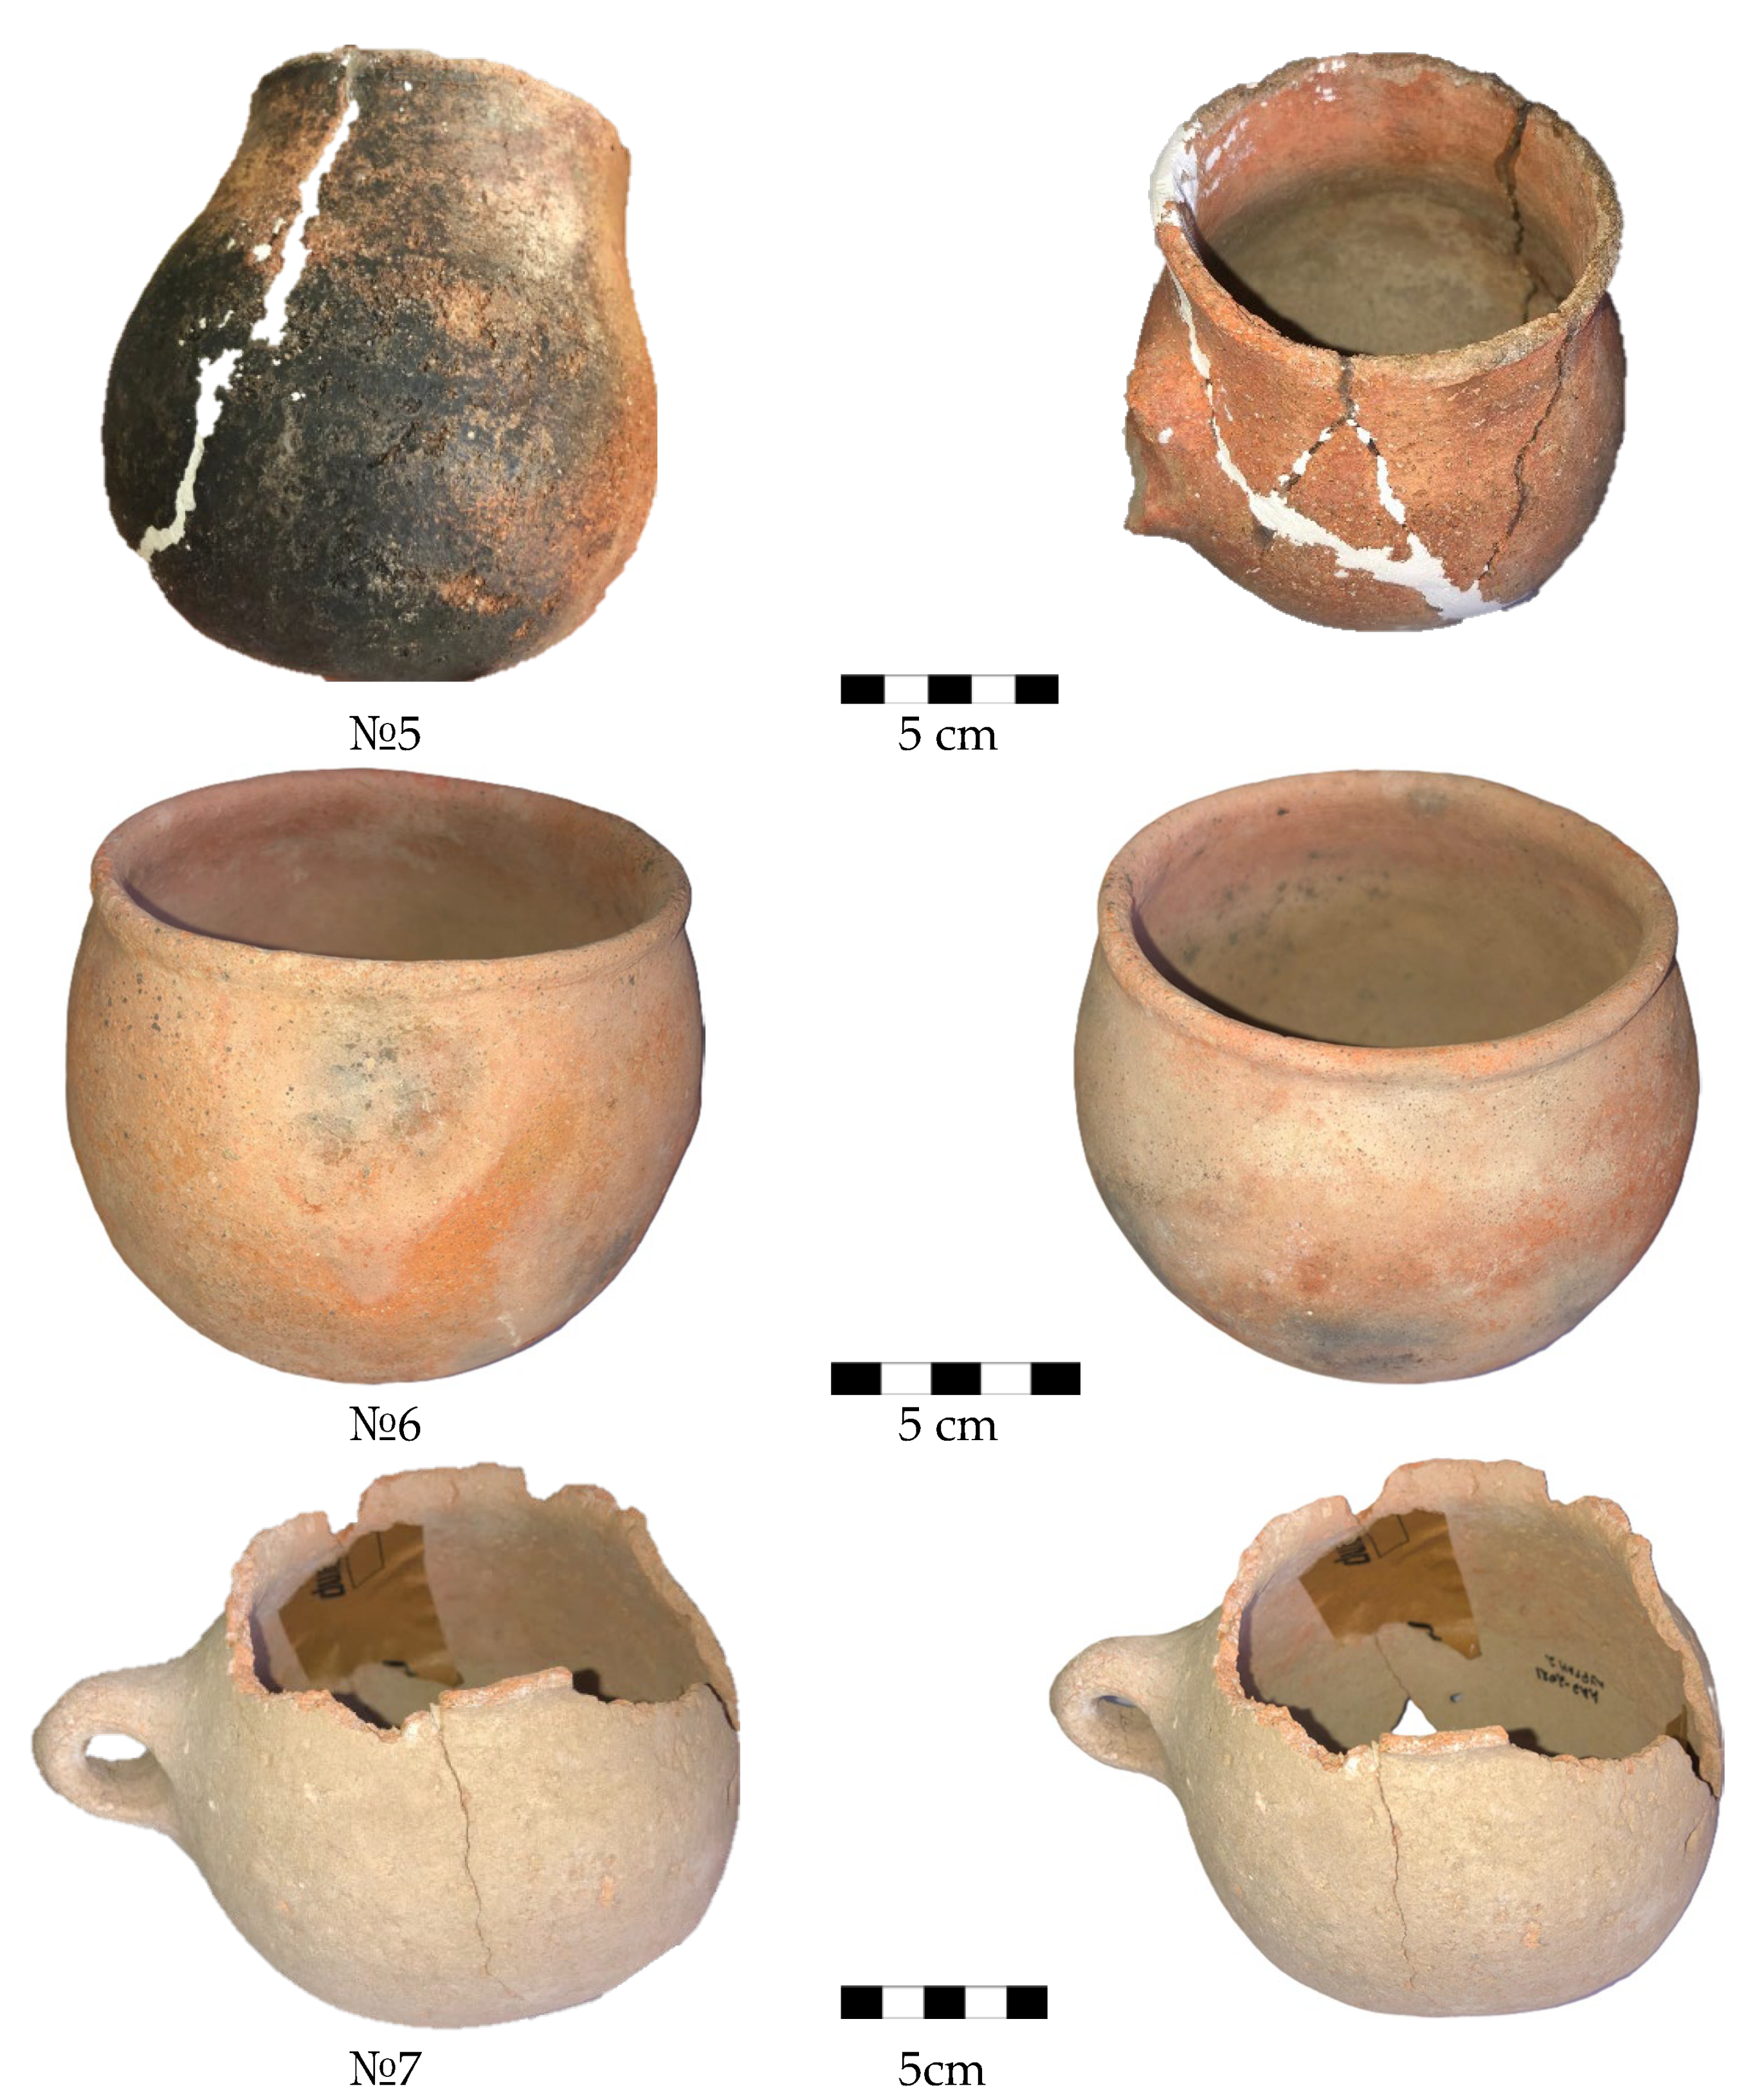
2.1. Description of the Studied Ceramic Materials

For this study, seven samples of ceramic vessels were selected from the collection of the Central State Museum of the Republic of Kazakhstan (CSM RK) in Almaty. The vessels were found during the archaeological expedition of the CSM RK, which conducted excavations at the Akterek burial site in 2017, 2018, and 2021. The archeological site is located near the village of Aktorek, Zhambyl District, Almaty region [32]. The Akterek site is located on the north-western slopes of the Ili Alatau and the eastern spurs of the Shuylian Mountains, on the northern slope of the Zhetyzhol ridge, which is a small mountain range on the western edge of the Zailiyskiy Alatau, between the Kendyktas Mountains and the Karakastek Range. Photograph images of studied ceramic vessels are presented (Figure 1). Some of these have red engobe on their outer and inner surfaces, as well as ornamentation made with red enamels.
Vessels No. 1, No. 2, and No. 3 were found by the archaeological expedition of the CSM RK in Mound No. 3 of the Aktorek burial site in 2017 [30]. Based on the comparative typological analysis of the material found in graves, these vessels are dated to the 4th century BC–3rd century AD, or they belong to the Saka–Usuns period.
Vessel No. 1 (catalog number of the CSM RK 28170/1), a handmade spherical object with a distinctive neck, straight rim, and rounded edge, has a height of 10.5 cm and a rim diameter of 12 cm. Its surface is decorated with arc-shaped polishing ornamentation made of red engobe. The body shows traces of soot. It is worth noting that similar vessels are found in the archaeological collection of the CSM RK from the excavations of K.A. Akishyev at the Kyzylauz-3 burial site, Mound 9 (CSM RK 19654/5) in the Ili River Valley, and a vessel with ornamentation made with red engobe found near the village of Karakastek, Zhambyl District, Almaty Region (CSM RK 25932/3).
The second ceramic vessel No. 2 (catalog number CSM RK 28170/2), handmade, has the following dimensions: a height of 18 cm, rim diameter of 7 cm, and body diameter of 16 cm. The body of the vessel is spherical with an elongated concave neck, straight rim, and horizontally cut edge. The surface of the vessel is covered with light beige engobe and polished.
The third vessel, No. 3 (CSM RK 28170/5), was found in the second burial mound No. 3, at a depth of 1.0 m, on the left side of the head of a buried person. The vessel is handmade and has the following dimensions: a height of 12.5 cm and rim diameter of 11.3 cm. The body of the vessel is cup-shaped, with a straight rim and a horizontally cut edge. There is a preserved base for a looped handle on one side. The surface of the vessel has been covered with red engobe and there are traces of soot on it.
The fourth and seventh vessels were found in 2021 by the archaeological expedition of the Central State Museum of the Republic of Kazakhstan (CSM RK) in mound No. 2 of the Akterek burial site, at a depth of 0.95 m near the northwestern wall of the ground burial [32]. Vessel No. 4 (CSM RK 28232/2) has a cup-shaped body with slightly convex walls narrowing towards the rim. The rim is straight, and oval in cross-section. The surface of the vessel is covered with a light beige engobe. For its dimensions, it has a height of 10.5 cm, rim diameter of 12 cm, and bottom diameter of 10 cm. Vessel No. 7 (CSM RK 28232/1) has a rounded (spherical) body, with walls narrowing towards the neck, the rim slightly turned outward, and an oval cross-section. The bottom is round. A looped vertical handle is located on the side of the body. For its dimensions, it has a height of 10.5 cm, rim diameter of 12 cm, body diameter of 14 cm, and bottom diameter of 10 cm. The vessel has two through-holes for attachment. Vessels No. 4 and No. 7 from mound No. 2 are characteristic of the pottery of the Usun period, dated to the 2nd–1st centuries BC.
Vessels No. 5 and No. 6 were found in 2018 by the archaeological expedition of the Central State Museum of the Republic of Kazakhstan (CSM RK) in mound No. 1 in the eastern group of the Akterek burial site. At a depth of 1.60 m, a human skeleton was discovered in an anatomically undisturbed position, oriented with the head to the west. On the right side of the head of the deceased, two ceramic vessels and fragments of a wooden dish with sheep bones were found. Vessel No. 5 (CSM RK 28216/11) is handmade, with a rounded body, a narrow cylindrical neck, a straight rim with a rounded edge, and a rounded bottom. The side has the remains of the base of a looped handle. The clay is dense and brown in color, and the surface is covered with a red engobe. There are traces of soot. For its dimensions, it has a height of 12 cm, rim diameter of 9 cm, body diameter of 13.5 cm, and neck height of 2 cm.
Vessel No. 6 (CSM RK 28216/12) is hand-made, with a rounded body, a narrow cylindrical neck, a straight rim with a rounded edge, and a round bottom. The side has the remains of the base of a looped handle. The clay is dense and brown in color, and the surface is covered with a red engobe. There are traces of soot. For its dimensions, it has a height of 12.5 cm, rim diameter of 12.3 cm, and body diameter of 12.5 cm. Vessels No. 5 and No. 6 are dated to the 4th century BC–3rd century AD.

2.2. Experimental Methods

Raman spectroscopy was used for phase analysis of the ceramic material. The Raman spectra at room temperature were collected using Solver Spectrum spectrometer (NT-MDT, Zelenograd, Russia), with an excitation wavelength of 473 nm. The device is located in the National Nanotechnology Open Laboratory, al-Farabi Kazakh National University, Almaty, Kazakhstan. Spectra were obtained from different local points on the surfaces of chips and cracks of the studied ceramic vessels. The laser radiation was focused using a 50× objective, forming a spot with a diameter of 4 µm on the surface. Identification of Raman spectra was performed by comparison with the characteristic frequencies of reference data from online databases [33].
To study the internal structure of the archaeological objects, experiments in neutron tomography were prepared at the TITAN experimental facility, located at the first horizontal beamline of the WWR-K research reactor [34]. Due to the different attenuation of the neutron beam intensity when passing through different components with different chemical compositions or densities inside the volume of the studied objects [35], required information about the internal structures of the materials can be obtained with a spatial resolution at the micron scale [36]. A neutron beam with a dimension of 20 × 20 cm2 was formed by a collimator system, with the characteristic parameter L/D equal to 350. The L is the distance between the input aperture of the collimator system and the position of the sample and D is the diameter of the input aperture of the collimator system. Integral flux of thermal neutrons at the sample position was 7.2(2) × 10⁶ neutrons/(cm2·s). Neutron radiography images were obtained using a detector system based on a scintillation screen made of 6LiF/ZnS with image registration by a highly sensitive video camera based on a CCD matrix HAMAMATSU-S121 (HAMAMATSU Photonics, Hamamatsu city, Japan). Tomography experiments were performed using a goniometer with an angular rotation of 0.5°. The neutron images were corrected for background noise data and normalized to incident neutron beam image using the ImageJ 1.54g software [37]. The tomography reconstruction from collection of angular neutron projections of the studied ceramic objects was performed using the SYRMEP 1.6.3 software [38]. After tomography reconstruction, three-dimensional models of the studied objects were obtained, representing an 3D array of volumetric voxels. Each voxel is characterized by the attenuation coefficient of the neutron beam at a certain point in the object volume. The resulting volume of each voxel was 1.25 × 10⁻⁴ mm3.

3. Results

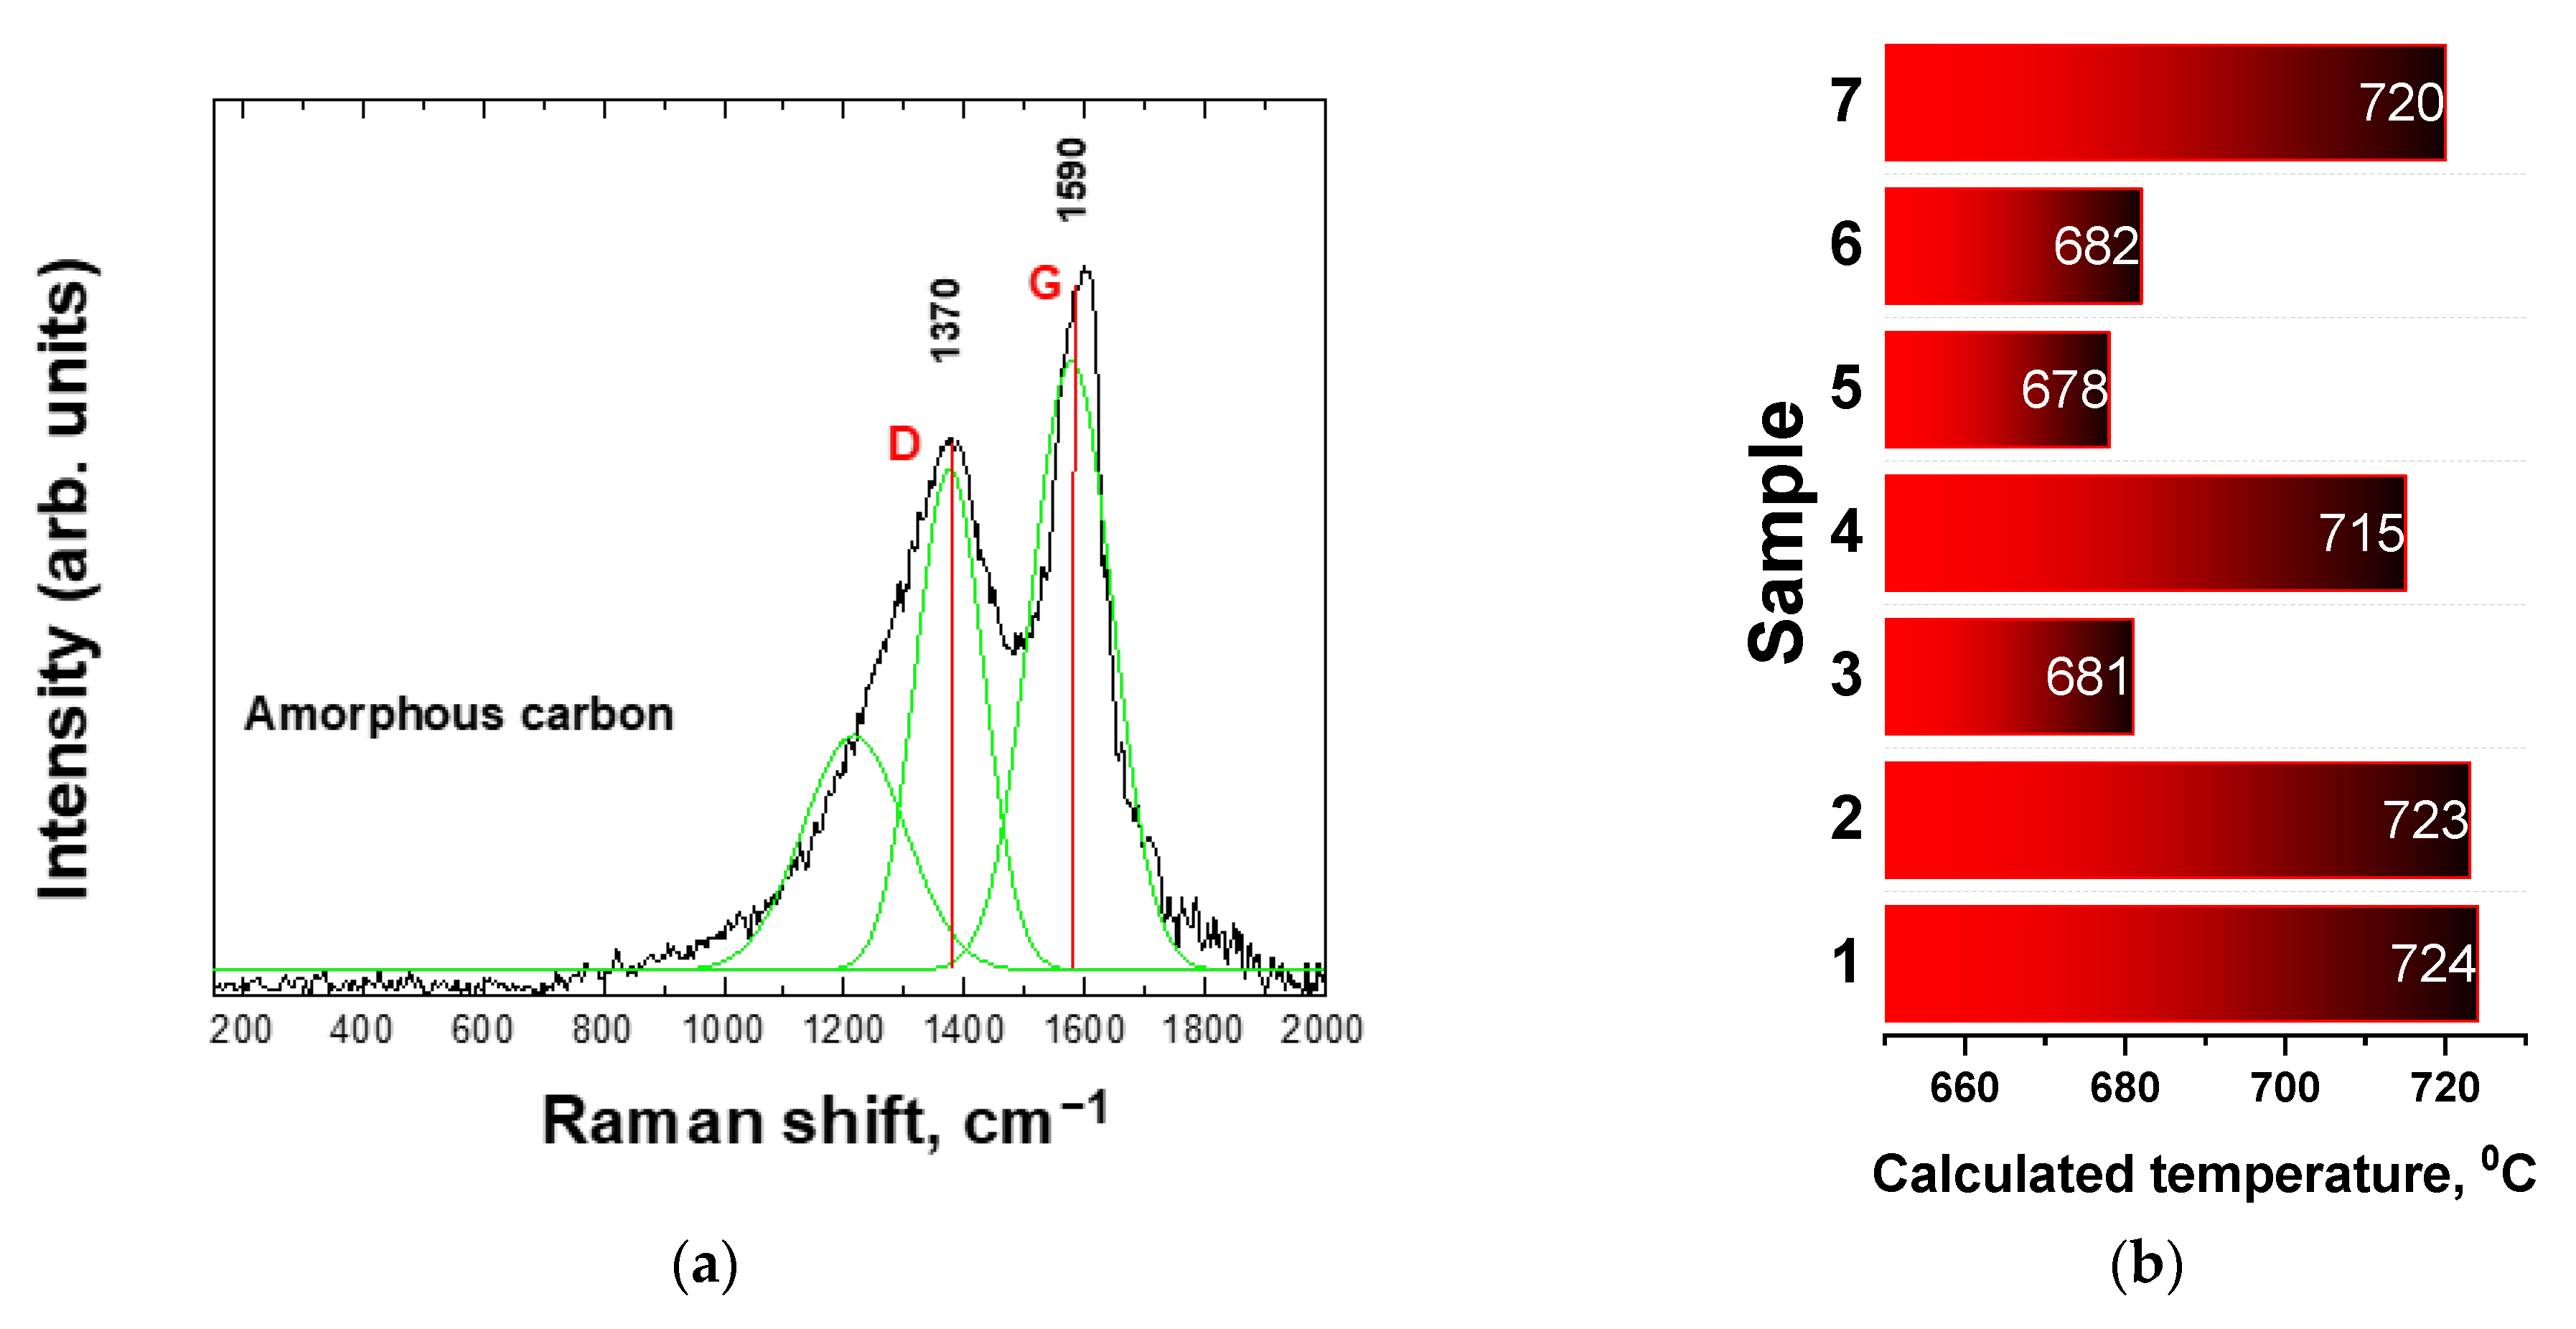
3.1. Raman Spectroscopy

Raman spectroscopy was used to identify the phases present in the material of the ceramic vessels. Due to the value of the archaeological material and the impossibility of applying mechanical destruction, Raman spectra were obtained from near-surface layers, chips, and cracks of the studied vessels. Chipped areas were cleaned of surface contaminants in order to identify phase components of ceramic matter; with this approach, data on phase composition of studied ceramics are primarily qualitative. During Raman spectroscopy experiments, several dominant and minor phase components were identified, and the results are presented (Table 1).
It can be seen that quartz is the dominant phase. Quartz spectra with characteristic Raman peaks at ~128, 202, 465, and 354 cm1 [39] were found in all the studied ceramic objects, regardless of the location of the sample. The second identified phase component is the hematite Fe2O3 phase. The raw material for the ceramic jugs contains iron oxides, which dehydrate during firing and partially transform into hematite, giving the vessels their reddish-brown color [40].
Additionally, according to Raman spectroscopy data, orthoclase was found in several samples. This mineral has a monoclinic crystal structure and is primarily composed of silicon, aluminum, and potassium [41]. Orthoclase is a common rock-forming mineral from the feldspar family of silicates and is used in ceramic production [42].
Small amounts of anatase TiO2 were found in samples No. 3 and 6. These, in our opinion, are incidental natural microimpurities in the clay raw material.
Interestingly, a tiny amount of burnt sienna—a natural iron oxide pigment—was detected in ceramic vessel No. 1. Sienna, or yellow hydrated iron oxide, is composed of silicon dioxide, manganese oxide, aluminosilicates, and small amounts of organic impurities [43]. By heating regular sienna, burnt sienna is produced, which is used to obtain darker and more saturated tones. It should be noted that, on the surfaces of almost all the studied ceramic objects, areas of grey or black color are clearly visible. This may be related to disturbed redox conditions, due to an incomplete firing process. As previously reported [44], the firing temperatures of ceramic objects are determined from Raman spectroscopy data of amorphous carbon. The phase of amorphous carbon was found inside the volume of almost all the studied ceramic vessels. This allows the firing temperature of ceramic objects to be estimated based on the relative height of the Raman doublet HD/HG [36]. Example of a part of the Raman spectra corresponding to the characteristic doublet for amorphous carbon (Figure 2). Using previously obtained data [45], firing temperatures for the studied vessels were calculated. It can be seen that ceramic objects No. 1, 2, 4, and 7 have a firing temperature around 720 °C, while the firing temperature for vessels No. 3, 5, and 6 is somewhat lower: ~680 °C. Although such calculations are approximate, they may indirectly indicate differences in manufacturing techniques for the studied ceramic objects.

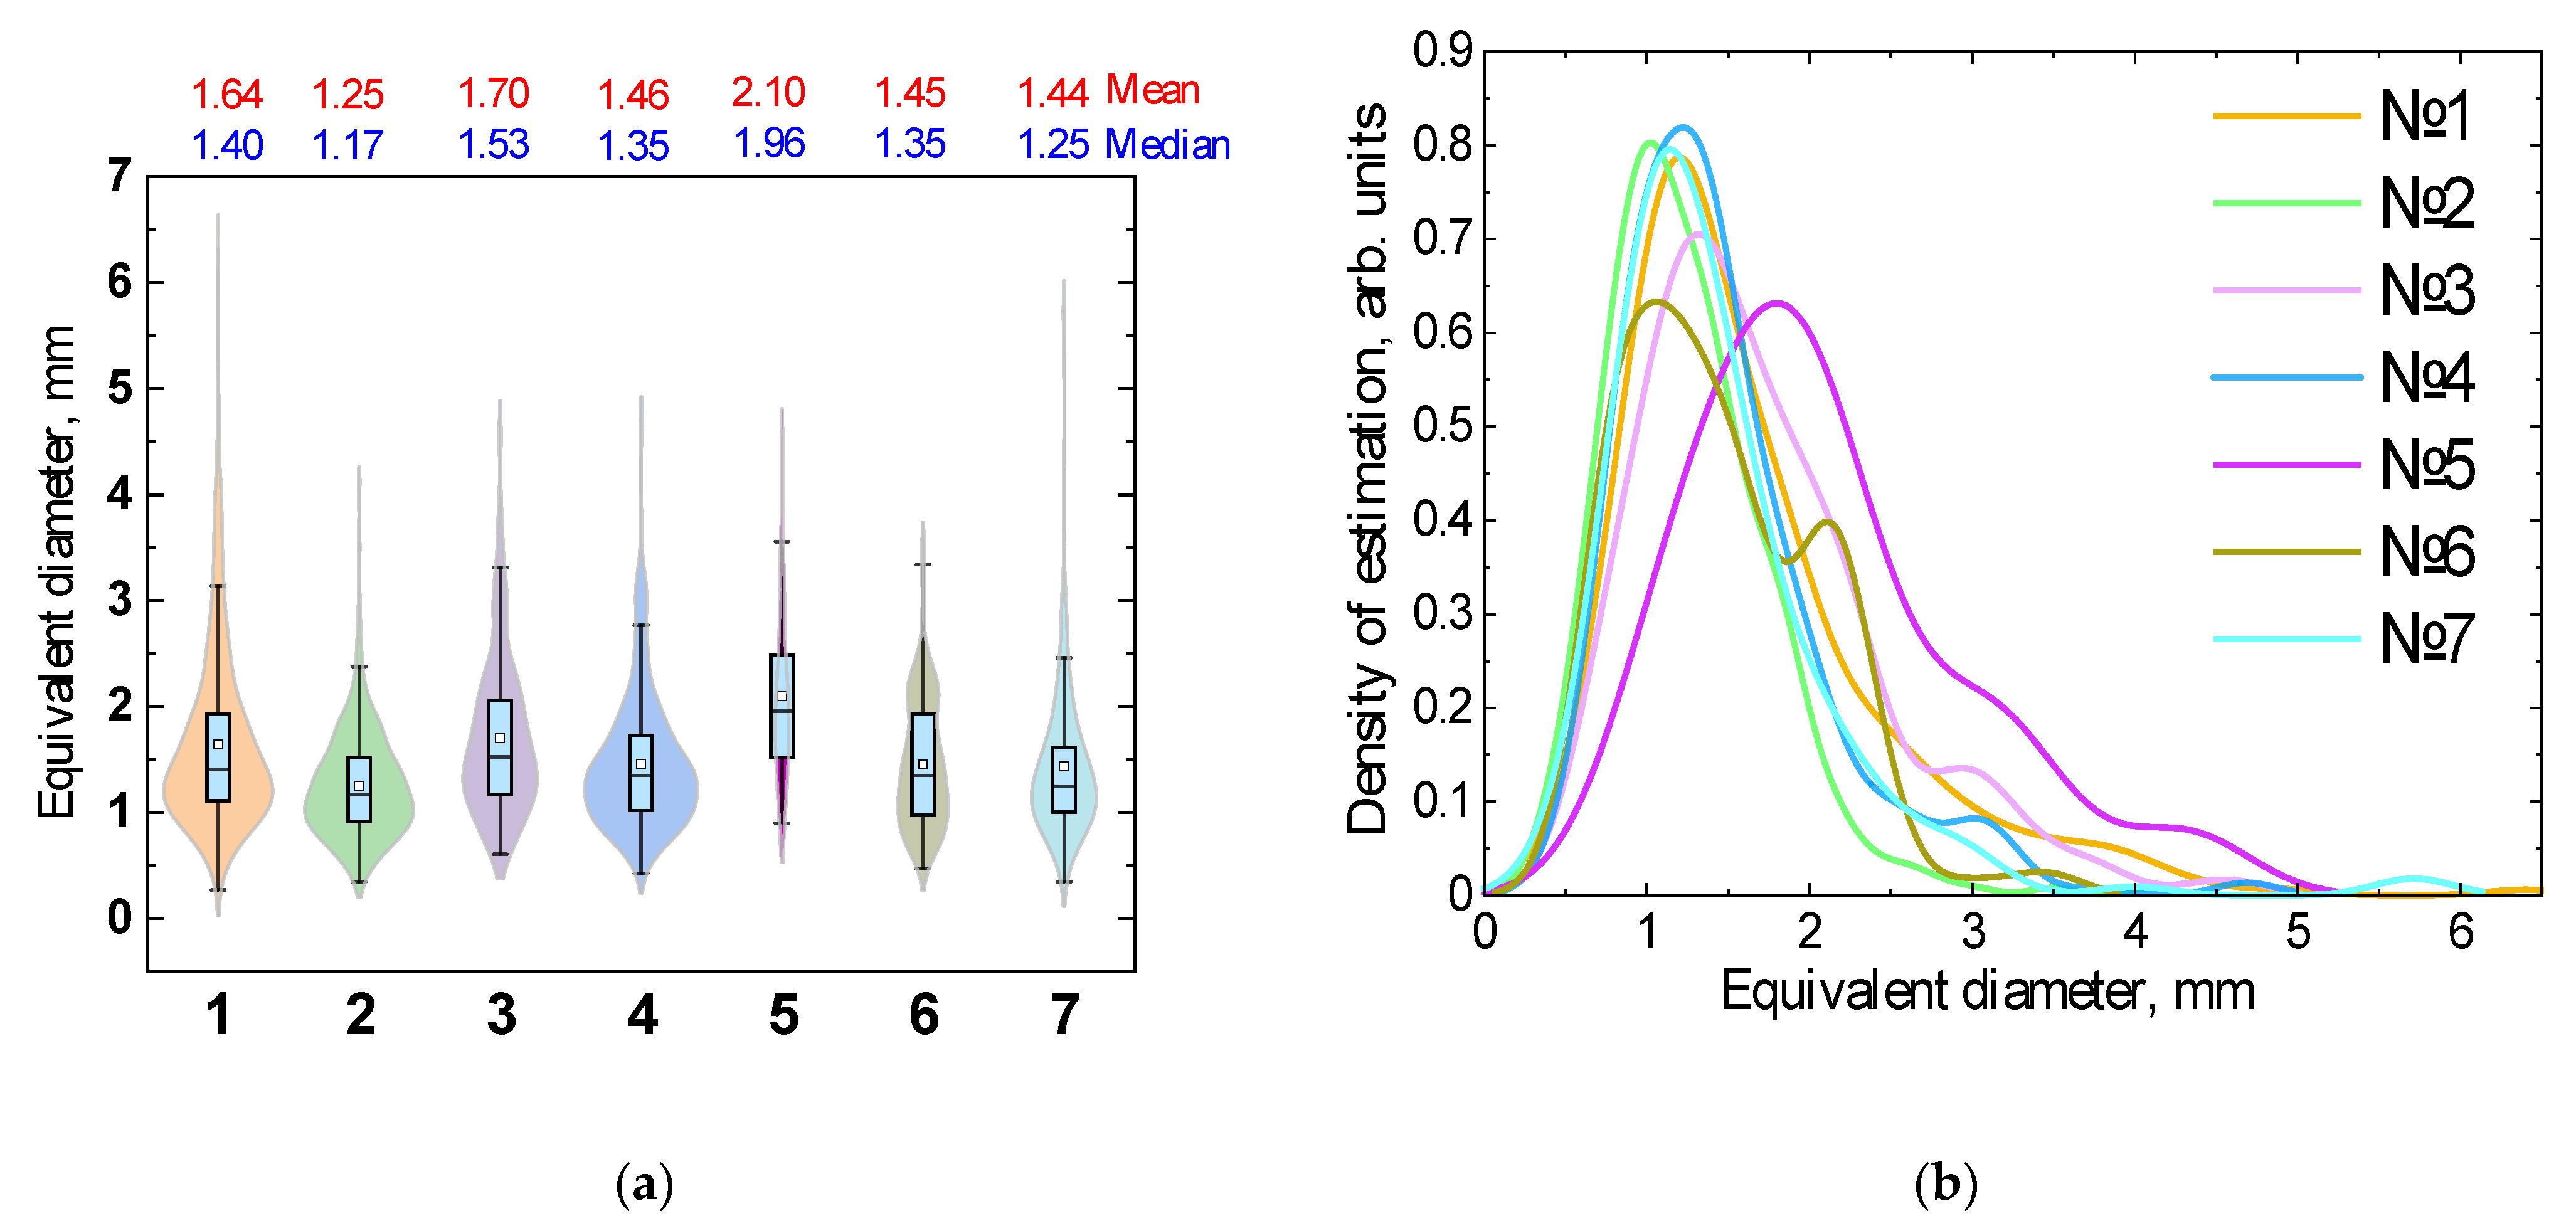
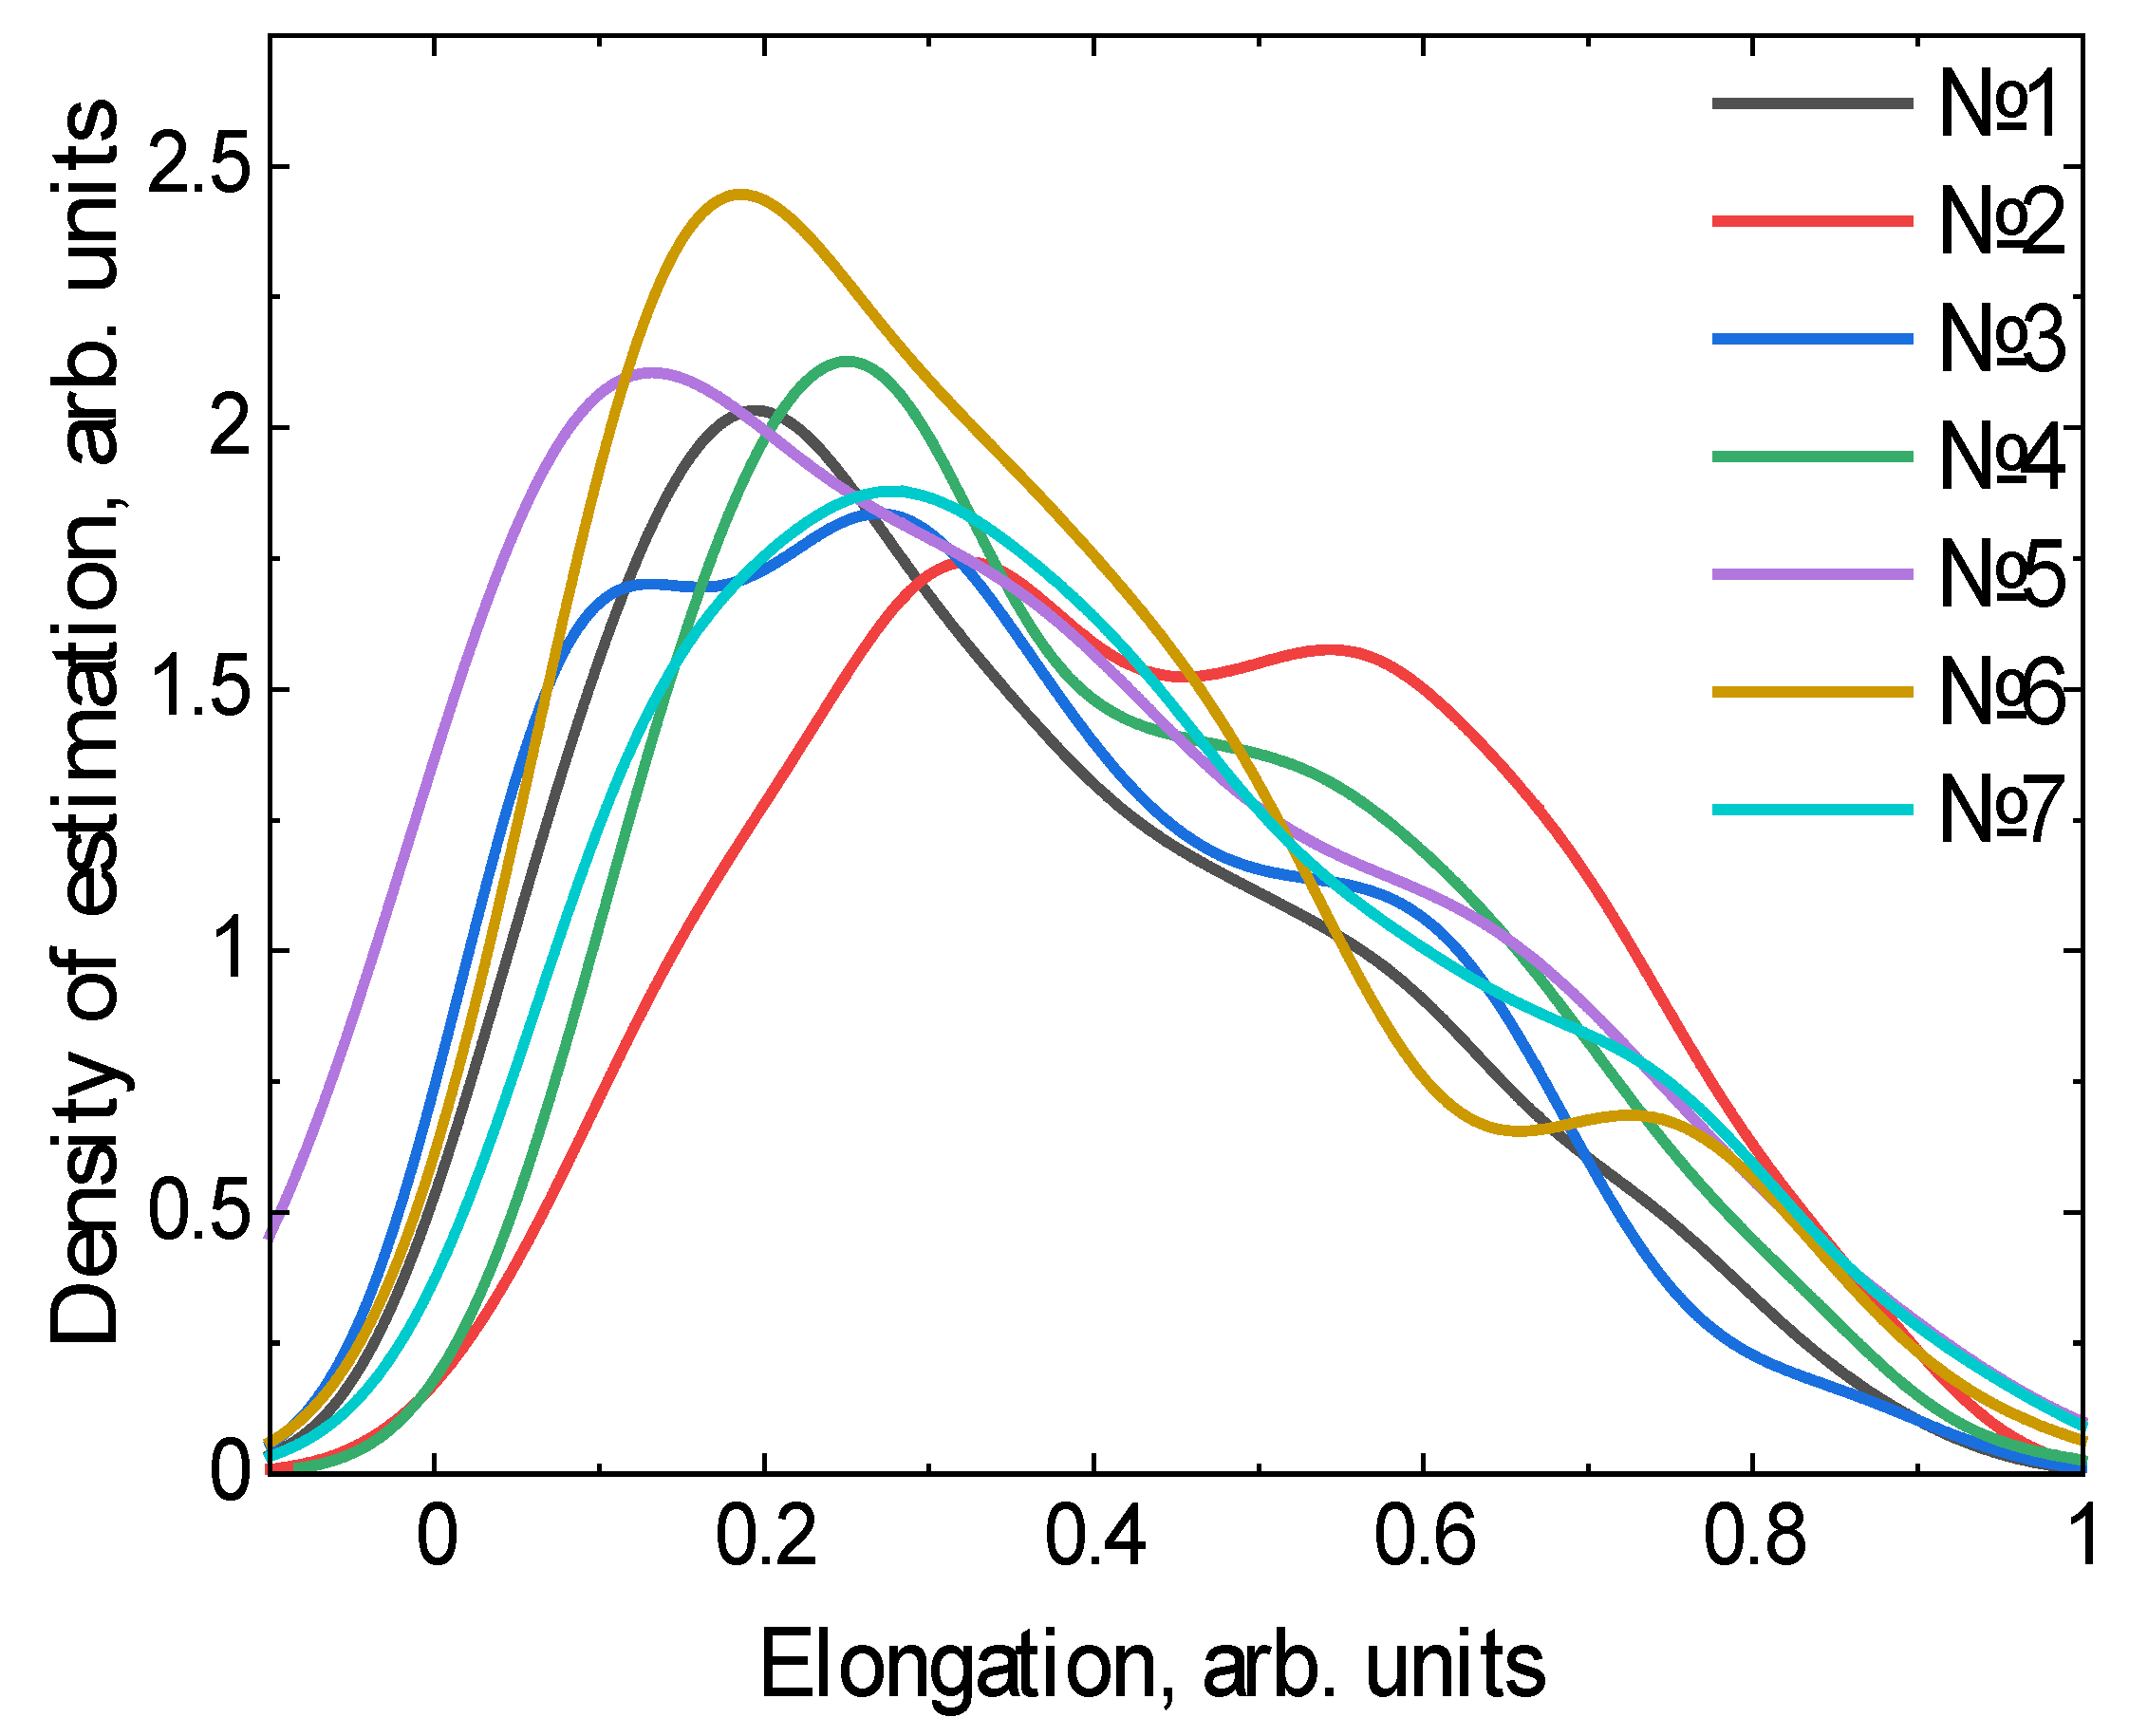
3.2. Neutron Tomography

Three-dimensional (3D) models of ceramic vessels were obtained using a neutron tomography reconstruction procedure (Figure 3). From these models, data on the volume distribution of heterogeneities in the samples were extracted, including information about the internal pore space (Table 2). The average pore volume and porosity of the samples range from a minimum value of 0.08% for sample No. 5 to a maximum of 0.39% for sample No. 1. Further, samples No. 2 and No. 7 contain additional inclusions characterized by a high neutron attenuation coefficient, with volumes of 0.36% and 0.14%, respectively. Based on previous studies, they may be calcite phases. Their negligible volumes do notallow for a qualitative analysis. Neutron tomography allows for detailed analysis of the structural features of the ceramic vessels. Thus, from analysis of obtained 3D models, average wall thicknesses of the vessels can be accurately estimated (Table 2).
After the segmentation of the pores from the volume of the studied ceramic objects, the average size of the internal pores of the ceramic vessels was studied (Table 2), and their morphological parameters were obtained. To assess pore sizes, an equivalent diameter parameter [46] was used. The equivalent diameter corresponds to the diameter of a sphere with the same volume as an irregular pore. The average and median pore size in all samples ranges from 0.5 to 2.5 mm (Table 2). However, statistical distributions by pore size are quite complex. For a more detailed analysis of the pore size distributions, we used the approximation of experimental data using the probability density function with a non-parametric estimation method for kernel density estimation with Silverman bandwidth. In the frame of this approach, we can compare the calculated distributions from sample to sample. For most samples, there is an asymmetric distribution with a pronounced maximum (Figure 4). However, for samples No. 3, 5, and 6, there is also a distinct shoulder with a secondary peak in the distribution curve, indicating the formation of two different pore size distributions—small pores with an average size of up to 1.5 mm and larger ones with sizes above 2.2 mm. It is believed that the presence of larger pores may indicate a longer firing process at higher temperatures.
Figure 4 shows the pore size distributions for the studied samples in the form of a violin-type plot. This representation not only provides data on the average and median pore sizes, but also information about the probability density distribution of pore sizes within specific ranges. It can be seen that samples No. 2, 3, 5, and 6 have a bimodal distribution of pore sizes. The shift and anisotropy in the probability density curve relative to the interquartile range are due to the presence of a few large individual pores in the studied ceramic samples. We suggest that these large pores could be the result of gas release from impurities during high-temperature firing.
The morphological parameters of the pores were obtained from neutron tomography data. During the annealing process, small pores with a shape close to spherical are formed. Changes in the annealing temperature or firing duration can cause an increase in pore size as well as a change in their morphology towards more disordered, non-spherical elongated forms. The elongation of pores can be assessed using an elongation parameter [46]. In this case, the pore volume is approximated by an ellipsoid and the elongation of a three-dimensional object is judged by the ratio of the axes. The resulting probabilistic distributions of the pore elongation parameters are presented in the diagram (Figure 5).
It can be seen that the distributions are bimodal, with two broad maxima. The first maximum corresponds to a sphericity value of ~0.2, indicating flattened, highly elongated particles with an axis ratio of approximately 1:5. Based on the calculated data, we can assume that most of the pores have an elongated shape, strongly flattened along one of the ellipsoid axes [47]. The second maximum ~0.6 corresponds to more ideal symmetric particles with radius differences of no more than 1.5 times.
To systematize the structural data obtained from neutron tomography, we constructed contour plots of pore size-to-elongation parameter ratio (see Supplementary Materials). A generalized contour plot of all the studied ceramic objects is presented (Figure 6). It can be observed that most pores have a size in the range of approximately 1.2–1.5 mm, with elongation values ranging from 0.0 to 0.8, regardless of particle size. However, in the region with larger pores, approximately 3–5 mm in size, contours of low-symmetry formations with elongation values around 0.2 mm were observed. This suggests the presence of small number of large, irregular voids in some ceramic samples. Interestingly, samples No. 3, 5, and 6 exhibit wider distributions in both size and shape.

4. Conclusions

Neutron tomography methods were used to study the internal volumes of ancient ceramic vessels from the Akterek burial site, Zhambyl District, Almaty Region, Kazakhstan. After analyzing the 3D models reconstructed from neutron tomography data, internal pore volumes were segmented in the studied ceramics. The results of detailed analysis of 3D structural characteristics of internal pores in studied ceramic objects indicated a bimodal probability distribution, both in terms of pore size and elongation parameters. This was attributed to the presence of many relatively small pores with sizes below 1.5 mm, as well as larger cavities in ceramic structures. It was assumed that these features of the pores could be related to different firing procedures used for ceramic artifacts. Moreover, Raman spectroscopy data on the investigation of amorphous carbon in ceramic vessels indirectly supports variations in the firing temperature of some vessels within the studied series.

Supplementary Materials

The following supporting information can be downloaded at: https://www.mdpi.com/article/10.3390/heritage8060210/s1, Figure S1: Raman spectra and Contour plots of pore size to elongation parameter ratio.

Author Contributions

Conceptualization, K.N. and S.K.; methodology, K.N. and S.K.; software, V.S. and M.K.; validation, S.K.; formal analysis, V.S. and M.K.; investigation, A.Z. and R.N.; resources, E.M.; data curation, M.K.; writing—original draft preparation, S.K.; writing—review and editing, K.N.; visualization, N.T. and O.M.; supervision, B.M.; project administration, B.M.; funding acquisition, B.M. All authors have read and agreed to the published version of the manuscript.

Funding

This work was supported by the Committee of Science of the Ministry of Science and Higher Education of the Republic of Kazakhstan under Grant No. AP23490652.

Data Availability Statement

The original data presented in the study are openly available. All data can be requested from the authors.

Conflicts of Interest

The authors declare no conflicts of interest.

References

  1. Singh, P.; Mal, E.; Khare, A.; Sharma, S. A study of archaeological pottery of Northeast India using laser induced breakdown spectroscopy (LIBS). J. Cult. Herit. 2018, 33, 71–82. [Google Scholar] [CrossRef]
  2. Medeghini, L.; Lottici, P.P.; De Vito, C.; Mignardi, S.; Bersani, D. Micro-Raman spectroscopy and ancient ceramics: Applications and problems. J. Raman Spectrosc. 2014, 45, 1244–1250. [Google Scholar] [CrossRef]
  3. Colomban, P. Raman spectrometry, a unique tool to analyze and classify ancient ceramics and glasses. Appl. Phys. 2024, 79, 167–170. [Google Scholar] [CrossRef]
  4. Mommsen, H.; Kreuser, A.; Weber, J. A method for grouping pottery by chemical composition. Archaeometry 1988, 30, 47–57. [Google Scholar] [CrossRef]
  5. Kardjilov, N.; Fiori, F.; Giunta, G.; Hilger, A.; Rusticheli, F.; Strobl, M.; Banhart, J.; Triolo, R. Neutron tomography for archaeological investigations. J. Neutron. Res. 2006, 14, 29–36. [Google Scholar] [CrossRef]
  6. Kockelmann, W.; Kirfel, A.; Hähnel, E. Non-destructive Phase Analysis of Archaeological Ceramics using TOF Neutron Diffraction. J. Archaeol. Sci. 2001, 28, 213–222. [Google Scholar] [CrossRef]
  7. Stelzner, J.; Ebinger-Rist, N.; Peek, C.; Schillinger, B. The application of 3D computed tomography with X-rays and neutrons to visualize archaeological objects in blocks of soil. Stud. Conserv. 2010, 55, 95–106. [Google Scholar] [CrossRef]
  8. Teixeira, J.; Magli, R.; Loupiac, C. Neutron scattering and imaging: A tool for archaeological studies. Eur. J. Mineral. 2015, 27, 289–296. [Google Scholar] [CrossRef]
  9. Fedrigo, A.; Strobl, M.; Williams, A.R.; Lefmann, K.; Lindelof, P.E.; Jørgensen, L.; Pentz, P.; Bausenwein, D.; Schillinger, B.; Kovyakh, A. Neutron Imaging Study of ‘pattern-welded’ Swords from the Viking Age. Archaeol. Anthropol. Sci. 2018, 10, 1249–1263. [Google Scholar] [CrossRef]
  10. Grazzi, F.; Cantini, F.; Salvemini, F.; Scherillo, A.; Schillinger, B.; Kaestner, A.; Edge, D.; Williams, A. The Investigation of Indian and Central Asian Swords through Neutron Methods. J. Archaeol. Sci. Rep. 2018, 20, 834–842. [Google Scholar] [CrossRef]
  11. Mednikova, M.; Saprykina, I.; Kichanov, S.; Kozlenko, D. The Reconstruction of a Bronze Battle Axe and Comparison of Inflicted Damage Injuries Using Neutron Tomography, Manufacturing Modeling, and X-Ray Microtomography Data. J. Imaging 2020, 6, 45. [Google Scholar] [CrossRef] [PubMed]
  12. Bakirov, B.; Smirnova, V.; Kichanov, S.; Shaykhutdinova, E.; Murashev, M.; Kozlenko, D.; Sitdikov, A. Structural Features of the Fragments from Cast Iron Cauldrons of the Medieval Golden Horde: Neutron Tomography Data. J. Imaging 2023, 9, 97. [Google Scholar] [CrossRef] [PubMed]
  13. Gait, J.; Bajnok, K.; Szilágyi, V.; Szenti, I.; Kukovecz, A.; Kis, Z. Quantitative 3D orientation analysis of particles and voids to differentiate hand-built pottery forming techniques using X-ray microtomography and neutron tomography. Archaeol. Anthropol. Sci. 2022, 14, 223. [Google Scholar] [CrossRef]
  14. Salvemini, F.; Olsen, S.R.; Luzin, V.; Garbe, U.; Davis, J.; Knowles, T.; Sheedy, K. Neutron tomographic analysis: Material characterization of silver and electrum coins from the 6th and 5th centuries BCE. Mater. Charact. 2016, 118, 175–185. [Google Scholar] [CrossRef]
  15. Herringer, S.H.; Ryzewski, K.; Bilheux, H.Z.; Bilheux, J.C.; Sheldon, B.W. Evaluation of segregation in Roman sestertius coins. J. Mater. Sci. 2017, 53, 2161–2170. [Google Scholar] [CrossRef]
  16. Bakirov, B.; Saprykina, I.; Kichanov, S.; Mimokhod, R.; Sudarev, N.; Kozlenko, D. Phase Composition and Its Spatial Distribution in Antique Copper Coins: Neutron Tomography and Diffraction Studies. J. Imaging 2021, 7, 129. [Google Scholar] [CrossRef]
  17. Smirnova, V.; Kichanov, S.E.; Petrov, F.; Panteleeva, L.; Bakirov, B.; Kozlenko, D. Structural Studies of a Bronze Zoomorphic Pommel from the Pekunovsky Settlement Using Neutron Diffraction and Tomography Methods. Phys. Part. Nucl. Lett. 2022, 19, 434–439. [Google Scholar] [CrossRef]
  18. Kardjilov, N.; Giulia, F. Neutron Methods for Archaeology and Cultural Heritage; Springer: Berlin/Heidelberg, Germany, 2017; pp. 3–171. [Google Scholar]
  19. Rinaldi, R. The contribution of neutron scattering to cultural heritage research. Notiz. Neutron. Luce Sincrotr. 2002, 7, 30–37. [Google Scholar]
  20. Saprykina, I.A.; Khairedinova, E.A.; Kichanov, S.E.; Rutkauskas, A.V.; Belozerova, N.M.; Kozlenko, D.P. Golden Amulet-boxes and their Contents from the Excavations of the Roman Time Burial Ground Frontovoe 3. Stratum plus. Archaeol. Cult. Anthropol. 2022, 4, 167–181. [Google Scholar] [CrossRef]
  21. Andreani, C. A neutron study of sealed pottery from the grave-goods of Kha and Merit. J. Anal. At. Spectrom. 2017, 32, 1342–1347. [Google Scholar] [CrossRef]
  22. Kis, Z.; Sciarretta, F.; Szentmiklósi, L. Water uptake experiments of historic construction materials from Venice by neutron imaging and PGAI methods. Mater. Struct. 2017, 50, 159. [Google Scholar] [CrossRef]
  23. Aloupi-Siotis, E. Ceramic technology: How to characterise black Fe-based glass-ceramic coatings. Archaeol. Anthropol. Sci. 2020, 12, 191. [Google Scholar] [CrossRef]
  24. Gualtieri, S. Ceramic raw materials: How to establish the technological suitability of a raw material. Archaeol. Anthropol. Sci. 2020, 12, 183. [Google Scholar] [CrossRef]
  25. Hein, A.; Müller, N.S.; Day, P.M.; Kilikoglou, V. Thermal conductivity of archaeological ceramics: The effect of inclusions, porosity and firing temperature. Thermochim. Acta 2008, 480, 35–42. [Google Scholar] [CrossRef]
  26. Maltsev, A.; Pashkova, G.; Fernández-Ruiz, R.; Demonterova, E.; Shuliumova, A.; Umarova, N.; Shergin, D.; Mukhamedova, M.; Chubarov, V.; Mikheeva, E. Characterization of archaeological ceramics from eastern Siberia by total-reflection X-ray fluorescence spectrometry and principal component analysis. Spectrochim. Acta B Atom. Spectr. 2021, 175, 106012. [Google Scholar] [CrossRef]
  27. Abdurakhimov, B.A.; Kichanov, S.E.; Talmaţchi, C.; Kozlenko, D.P.; Talmaţchi, G.; Belozerova, N.M.; Bǎlǎșoiu, M.; Belc, M.C. Studies of ancient pottery fragments from Dobrudja region of Romania using neutron diffraction, tomography and Raman spectroscopy. J. Archaeol. Sci. Rep. 2021, 35, 102755. [Google Scholar] [CrossRef]
  28. Bakirov, B.; Zhomartova, A.; Kichanov, S.E.; Zhumatayev, R.; Toleubayev, A.T.; Nazarov, K.; Kozlenko, D.; Nazarova, A.M. Non-destructive neutron structural studies of ancient ceramic fragments of the cultural heritage of the Republic of Kazakhstan. Eur. J. Phys. Funct. Mater. 2022, 6, 56–70. [Google Scholar] [CrossRef]
  29. Gehres, B.; Querré, G. Analysis of mica inclusions using LA-ICP-MS: A new approach for sourcing raw material of ceramics. J. Archaeol. Sci. Rep. 2018, 21, 912–920. [Google Scholar] [CrossRef]
  30. Myakisheva, O.A.; Torezhanova, N.Z. Archaeological monuments of Akterek as an open-air museum. Bull. Hist. 2021, 103, 183–193. [Google Scholar] [CrossRef]
  31. Ageeva, E.I. On the question of the types of ancient burials in the Alma Ata region. New materials on archeology and ethnography of Kazakhstan. House Acad. Sci. Kazakh SSR 1961, 12, 21–40. [Google Scholar]
  32. Torezhanova, N.Z.; Myakisheva, O.A. The history of the study of archaeological monuments of the Akterek tract. Sci. Eur. 2021, 85, 181–189. [Google Scholar]
  33. Coccato, A. Raman spectroscopy for the investigation of carbon-based black pigments. J. Raman Spectrosc. 2015, 46, 1003–1015. [Google Scholar] [CrossRef]
  34. Nazarov, K.M.; Muhametuly, B.; Kenzhin, E.A.; Kichanov, S.E.; Kozlenko, D.P.; Lukin, E.V.; Shaimerdenov, A.A. New neutron radiography and tomography facility TITAN at the WWR-K reactor. Nucl. Instru. Methods Phys. Res. A 2020, 982, 164572. [Google Scholar] [CrossRef]
  35. Dyussambayev, D.S.; Aitkulov, M.T.; Shaimerdenov, A.A.; Mukhametuly, B.; Nazarov, K.; Kaestner, A.; Pessoa Barradas, N.; Sairanbayev, D.S.; Dikov, A.S.; Bazarbayev, E.M. TITAN neutron imaging facility performance. Nucl. Instru. Methods Phys. Res. A 2022, 1039, 167078. [Google Scholar] [CrossRef]
  36. Nazarov, K.M.; Mukhametuly, B.; Kichanov, S.E.; Zholdybayev, T.K.; Shaimerdenov, A.A.; Karakozov, K.B.; Dyussambayev, D.S.; Aitkulov, M.T.; Yerdauletov, M.; Napolskiy, P.; et al. Non-destructive analysis of materials by neutron imaging at the TITAN facility. Eur. J. Phys. Funct. Mater. 2021, 5, 6–14. [Google Scholar] [CrossRef]
  37. Schneider, C.A.; Rasband, W.S.; Eliceiri, K.W. NIH Image to ImageJ: 25 Years of Image Analysis. Nat. Meth. 2012, 9, 671–675. [Google Scholar] [CrossRef]
  38. Brun, F.; Massimi, L.; Fratini, M.; Dreossi, D.; Billé, F.; Accardo, A.; Pugliese, R.; Cedola, A. SYRMEP Tomo Project: A Graphical. User Interface for Customizing CT Reconstruction Workflows. Adv. Struct. Chem. Imaging. 2017, 3, 4. [Google Scholar] [CrossRef]
  39. Götze, J.; Pan, Y.; Müller, A. Mineralogy and mineral chemistry of quartz: A review. Mineral. Mag. 2021, 85, 639–664. [Google Scholar] [CrossRef]
  40. Wilcox, M. Blue and Yellow Don’t Make Green; North Light Books: Cleveland, OH, USA, 2009; pp. 60–70. [Google Scholar]
  41. Huang, S.; Xue, B.; Zhao, Y.; Yang, J. Characterization of primary silicate minerals in Earth-like bodies via Raman spectroscopy. J. Raman Spectrosc. 2024, 55, 625–636. [Google Scholar] [CrossRef]
  42. Eramo, G. Ceramic technology: How to recognize clay processing. Archaeol. Anthropol. Sci. 2020, 12, 164. [Google Scholar] [CrossRef]
  43. Kellog, L. Ceramics; The Art Amateur: New York, NY, USA, 1885; pp. 2–10. [Google Scholar]
  44. Deldicque, D.; Rouzaud, J.N.; Velde, B. A Raman—HRTEM study of the carbonization of wood: A new Raman-based paleothermometer dedicated to archaeometry. Carbon 2016, 102, 319–329. [Google Scholar] [CrossRef]
  45. Mouraux, C.; Delarue, F.; Bardin, J. Assessing the carbonisation temperatures recorded by ancient charcoals for δ13C-based palaeoclimate reconstruction. Sci. Rep. 2022, 12, 14662. [Google Scholar] [CrossRef] [PubMed]
  46. Zel, I.Y.; Kenessarin, M.; Kichanov, S.E.; Balasoiu, M.; Kozlenko, D.P.; Nazarov, K.; Nicu, M.; Ionascu, L.; Dragolici, A.C.; Dragolici, F. Spatial distribution of graphite in cement materials used for radioactive waste conditioning: An approach to analysis of neutron tomography data. Cem. Concr. Compos. 2021, 119, 103993. [Google Scholar] [CrossRef]
  47. Angelidakis, V.; Nadimi, S.; Utili, S. Elongation, flatness and compactness indices to characterise particle form. Powder Technol. 2022, 396, 689–695. [Google Scholar] [CrossRef]
Figure 1. Photographs of the studied ceramic samples from the Akterek burial site. Images of both sides of the studied vessels are presented. Scaling bars are provided for each object.
Heritage 08 00210 g001aHeritage 08 00210 g001b
Figure 2. (a) The enlarged part of the Raman spectra with the characteristic doublet of amorphous carbon. The intensity labels of the peak heights of the doublet are shown in accordance with the work [33]. (b) Diagram of the calculated firing temperatures for the studied ceramics based on the intensity ratio of the D and G from Raman spectroscopy data.
Heritage 08 00210 g002
Figure 3. Three-dimensional models of the studied ceramic vessels and their virtual cross-sections, reconstructed using neutron tomography data, are presented. (a) The color scheme shows the range of neutron beam attenuation coefficients in the object, from red regions corresponding to maximum neutron attenuation to green areas indicating low attenuation. (b) 3D pore volumes are also highlighted in the models.
Heritage 08 00210 g003aHeritage 08 00210 g003b
Figure 4. (a) Violin plot of the distribution of data and the probability density of equivalent pore diameter. Calculated values of average and median pore sizes are presented at top. (b) Probability density function of equivalent diameter distribution is shown on the right.
Heritage 08 00210 g004
Figure 5. The probability density function of the elongation distribution of pores in the studied ceramic vessels.
Heritage 08 00210 g005
Figure 6. (a) Contour plots of the pore size-to-elongation ratio for all the studied ceramic vessels and, for comparison, (b) separately for vessels No. 6 and No. 7.
Heritage 08 00210 g006
Table 1. Phase composition determined by Raman Spectroscopy.
Quartz
SiO2
Orthoclase
KAlSi3O8
Anatase
TiO2
Hematite
Fe2O3
Carbon
№ 1+ ++
№ 2++ ++
№ 3+ + +
№ 4++ +
№ 5++ ++
№ 6+ + +
№ 7++ ++
Table 2. Calculated vessels parameters from 3D models.
Total Volume, cm3Porosity, %Average Wall
Thickness, cm
1359.62 (1)0.39 (1)0.63 (1)
2491.83 (1)0.10 (1)0.67 (2)
3308.12 (2)0.29 (1)0.88 (2)
4416.53 (2)0.21 (1)0.61 (1)
5367.33 (1)0.08 (1)0.47 (1)
6276.33 (2)0.13 (1)0.57 (2)
7284.62 (1)0.21 (1)0.66 (1)
Disclaimer/Publisher’s Note: The statements, opinions and data contained in all publications are solely those of the individual author(s) and contributor(s) and not of MDPI and/or the editor(s). MDPI and/or the editor(s) disclaim responsibility for any injury to people or property resulting from any ideas, methods, instructions or products referred to in the content.

