Article

Quantitative Automatic Non-Invasive Assessment of Material Degradation in Historic Tapestries

by
Bárbara Sánchez-Cancela
1,*,
Antonio Álvarez Fernández-Balbuena
1,
Daniel Vázquez Molini
1,
Verónica García Blanco
2 and
Almudena López Sánchez
2
1
Department of Optics, University Complutense of Madrid, 28040 Madrid, Spain
2
Real Fábrica de Tapices de Madrid, 28014 Madrid, Spain
*
Author to whom correspondence should be addressed.
Heritage 2025, 8(5), 153; https://doi.org/10.3390/heritage8050153
Submission received: 13 March 2025 / Revised: 22 April 2025 / Accepted: 25 April 2025 / Published: 28 April 2025

Abstract

:
The conservation of historic tapestries is crucial due to the fragility of their materials and their cultural relevance. This paper reports on an investigation into the development of HeriTex, a non-invasive, innovative system for evaluating the structural integrity of historic tapestries, with a particular focus on measuring material loss. The research analyzed the relationship between transmitted infrared radiation and the weight loss per unit area (expressed in g/cm2) in the weakened areas of the tapestry. As a necessary first step, the system was calibrated using a limited range of wool thread weights before conducting experimental measurements on a historic tapestry fragment provided by the Royal Tapestry Factory in Madrid. The investigation demonstrated a strong correlation between the transmittance values and the loss of material weight per unit area. The results showed that the transmittance decreases exponentially as the weight per unit area increases. By applying a non-linear least squares (NLLS) fitting model, additional weight per unit area values in the tapestry were estimated based on their corresponding transmittance values. The HeriTex system enables the identification, quantification, and mapping of damage regions, demonstrating its potential as a valuable tool for more accurate assessment of the condition of historic tapestries by providing quantitative data on their structural integrity.

1. Introduction

Cultural heritage is regarded as a collection of diverse manifestations inherited from the past. These elements serve as invaluable records of societal development and, as such, must be preserved and passed on to future generations [1]. Technological advancements have significantly impacted the field of cultural heritage by introducing new approaches to its interpretation and analysis. This has resulted in providing new opportunities for its appreciation and dissemination [2].
Throughout history, tapestries have played a prominent role in demonstrating wealth and power for both religious and lay figures throughout Europe [3]. Tapestries were made primarily of organic fibers, typically silk and wool [4]. They were considered mobile possessions, often accompanying noble households on their travels through Europe. As a result, repairs were frequently needed shortly after weaving due to exposure to unfavorable environmental conditions, handling, wear and tear, and insect damage [5].
The evaluation of damage to historic tapestries has mainly been conducted through visual examination, relying on the experience of conservators [6]. While their degree of expertise is highly valuable, this method can be very time-consuming and can be considered subjective. Nowadays, non-invasive quantitative assessments, such as Fourier transform infrared spectroscopy (FTIR) or optical microscopy, offer potential to meet the necessity for objective evaluations of the condition of historic tapestries by predicting areas vulnerable to physical and chemical damage [4].
Among the non-invasive techniques, FTIR has become an essential tool in the analysis of historical objects, as it enables the identification of the chemical composition of sensitive surfaces without the need for sampling. A recent study has demonstrated the effectiveness of FTIR in detecting and monitoring mold biofilms on historical paper-based materials, achieving a level of sensitivity comparable to more invasive techniques. This method is particularly promising in the field of textile conservation, given that historical tapestries are made of organic fibers and are equally vulnerable to biodegradation processes [7,8].
Similarly, optical microscopy offers a valuable tool for non-destructive analysis of historical textile objects. In a recent study, it was applied to the investigation of biodeterioration at the Rožanec Mithraeum monument in Slovenia, an inorganic cultural heritage site. Optical microscopy proved effective in the identification of autochthonous biofilm, including algae and cyanobacteria, on stone surfaces. This highlights the potential of this technique for detecting biological deterioration agents that may also affect the organic fibers of historic tapestries [9].
The way light interacts with matter varies with different wavelengths. When light interacts with a material, a portion of its energy is reflected off the surface, while another portion is absorbed and transmitted as it penetrates and propagates through the material. These interactions are strongly influenced by the material’s characteristics. Changes in the wavelength of the incident light lead to variations in the fraction of energy that is reflected and transmitted. Generally, the transmittance of radiation through a material depends on several factors, including the material’s thickness, composition, and density [10].
A study conducted by Hui Zhang, Tieli Hu, and Jianchun Zhang involved measuring the transmittance of infrared radiation through polyester (PET) and cotton fabrics within the range of 8–14 µm. The results showed that fabric thickness had a considerable impact on infrared transmittance, with an exponential decrease in transmittance observed as thickness increased. The study also found a linear relationship between infrared transmittance and fabric weight: as the fabric’s weight increased, transmittance decreased [11].
Along the same line, Wilhem and Smith [12] analyzed the transmittance, reflectance, and absorption of near-infrared radiation in textile materials. In this study, it was emphasized that the transmittance is influenced by the composition and physical structure of the textile, the type of fibers, and their thickness. They demonstrated that near-infrared radiation transmission decreases significantly as fabric weight (g/m2) increases. Understanding how these properties affect transmission allows for the identification of damaged areas and the development of restoration strategies to preserve textile integrity.
The degradation of tapestries leads to material loss and structural weakening [6]. Therefore, it is essential to develop objective tools for their evaluation that do not cause further damage. Studies have shown that the transmission of infrared radiation is influenced by the density and composition of the textile [11,12]. However, its application to the evaluation of historic tapestries has not yet been explored.
The aim of this research is to develop a non–invasive, innovative system to evaluate the structural condition of historic tapestries, focusing on assessing material loss over time. This study includes the design and calibration of a system, its application to a historic tapestry fragment, and the analysis of the results.

2. System Design: HeriTex

A system, named HeriTex, was developed to measure the transmission of infrared (IR) radiation through fabric. Illustrated in Figure 1, the system consists of an eight-LED array infrared radiation source that emits at a wavelength of λ = 940   nm . Maintaining the stability of the radiation output was crucial for consistent and accurate measurements. Therefore, the stability of the radiant power was maintained through a manually regulated power supply, specifically by maintaining the LED array at a constant current of 0.040 A. A light diffuser sheet was placed between the source and the sample to ensure uniform illumination. The sample was held in a polymethyl methacrylate (PMMA) sample holder (Figure 2) with black surfaces to minimize reflections and the penetration of stray light. Shredded wool yarn buttons were pressed into the sample holder to ensure consistent sample positioning. Finally, a monochromatic camera without an IR filter, featuring a 1/2.5” MT9P031 CMOS sensor, captured images representing the intensity variations of the infrared radiation through the sample. These images were processed by a computer for further analysis.
For image capture, a custom MATLAB R2021a script was used to sequentially adjust the camera’s pre-defined exposure times to capture a wide range of light intensities. Due to the camera’s limited dynamic range, the initial captured images, known as low dynamic range (LDR) images, often contain saturated and/or underexposed pixels [13]. To reduce these limitations and improve the precision of the measurements, high dynamic range (HDR) imaging was employed. By combining multiple LDR images taken at different exposure times, HDR imaging allows a wider range of light intensities to be recorded in a single image [14], providing a more comprehensive representation of the transmission properties of the samples.

2.1. Calibration

The system was calibrated to ensure accurate transmittance measurements of wool, one of the most commonly used materials in tapestry weaving [4]. For this purpose, wool yarn was provided by the restorers of the Royal Tapestry Fabric in Madrid, which was spun and dyed from raw fleece for the weaving and restoration of tapestries. Since the yarn in its original spun form is not suitable for transmittance measurements, it was processed into shredded wool button samples.
To produce shredded wool yarn samples, the first step was to cut the yarn into lengths of 5 cm increments, ranging from 5 cm to 200 cm, to be weighed. For the study, yarn lengths between 20 cm and 90 cm were selected, as they represent a more realistic range in the context of analyzing historic tapestries. Lengths under 20 cm were excluded due to the insufficient amount of material for reliable analysis, indicating a severely worn area. On the other hand, lengths over 90 cm were discarded because they represent an excessive amount of thread that is unrepresentative of tapestries. The selected lengths, ranging from 20 cm to 90 cm in 10 cm increments, were individually weighed using a KERN ABJ 80-4NM analytical scale with a precision of ±0.0001 g. The weight of each sample, measured in grams, was recorded for the remainder of the experiment.
Each weighed shredded wool yarn sample was compacted into uniform buttons within the previously mentioned black-coated PMMA sample holder. As shown in Figure 2, the sample holder contained a 1 cm diameter cavity to standardize the measurement area. Although the cavity had a diameter of 1 cm, the effective area used for the measurements was 0.785 cm2, calculated based on the area of a circle. The shredded wool yarn samples were compacted using a manual press with a 1 cm diameter piece for compression. The weight of each button was verified using the scale before it was pressed into the cavity to ensure accuracy. After the weight was verified and the button pressed to secure uniformity, the sample holder was positioned in direct contact with the light diffuser to minimize the entry of stray light and ensure uniform illumination of the sample. This setup is crucial for reducing measurement errors caused by scattered light. To guarantee accurate data, the room was kept dark to exclude external light sources that could interfere with the measurements.
To determine the value of the incident intensity I 0 on the samples, images with different exposure times were taken of the light diffuser sheet—the same exposure times employed throughout the study—without any samples placed on it. These images were combined using HDR techniques, as described earlier, to obtain a single image with a wider range of incident intensity.
To ensure the reliability and precision of the results, five repeated measurements were performed for each shredded wool yarn button. Before the image acquisition, each sample was weighed again using the analytical scale to ensure that the same conditions prevailed throughout the process. The information needed to determine the transmittance (values between 0 and 1) of the samples was extracted from the intensity values obtained from the HDR images using a custom MATLAB script. Transmittance ( T ) is defined as:
T = I t I o ,
where I t represents the intensity of the radiation transmitted through the material, and I o corresponds to the intensity of the incident radiation. For each shredded wool button, five transmittance values were calculated, one from each set of images, and the average of these values was used.
When analyzing the results, the transmittance revealed an exponentially decreasing tendency as a function of wool weight per unit area (g/cm2). Figure 3 shows the mean transmittance values (blue points) and the error bars that represent the standard deviation of the measurements. The relationship between the sample weight per unit area (g/cm2) on the x-axis and the transmittance on the y-axis demonstrates the gradual decrease in radiation transmission as the sample weight per unit area increases.
A non-linear least squares fitting (NLLS) was performed to identify the function that best describes the obtained data, minimizing the discrepancies between the measured and predicted values [15]. The results of the NLLS analysis (red line in Figure 3) indicate that the relationship between the weight per unit area and the transmittance of the shredded wool buttons follows an exponential form. Therefore, the transmittance T(W) as a function of weight per unit area W is expressed by the equation:
T ( W ) = a e ( b W ) ,
where a and b are adjustable parameters determined using the NLLS. The values obtained for the exponential fitting parameters were: a = 0.5115 (0.4687, 0.5543), b = 24.18   ( 26 , 22.35 ) , and R 2 = 0.9966 . When the weight per unit area of the sample is zero, the parameter a equals 0.5115 , representing the maximum transmittance value for this system. The decay coefficient b , with a negative value, demonstrates that the transmittance decreases exponentially as the sample weight per unit area increases. This model facilitates the prediction of values not directly measured. This is particularly useful for understanding how transmittance may change in out-of-range situations and for extrapolating the data. The coefficient of determination, R 2 = 0.9966 , indicates a high level of precision and strong correlation between the observed and predicted values. Using parameters a and b , the relationship between the weight per unit area and the transmittance can be solved to calculate the weight per unit area from the measured transmittance. The relationship can be expressed as:
W = ln ( T a ) b
This allows the determination of the weight per unit area corresponding to a given transmittance measurement, facilitating estimations about the behavior of the system under conditions not directly measured. This approach allows the system to be applied to cases outside the dynamic range, increasing the system’s analytical capacity.

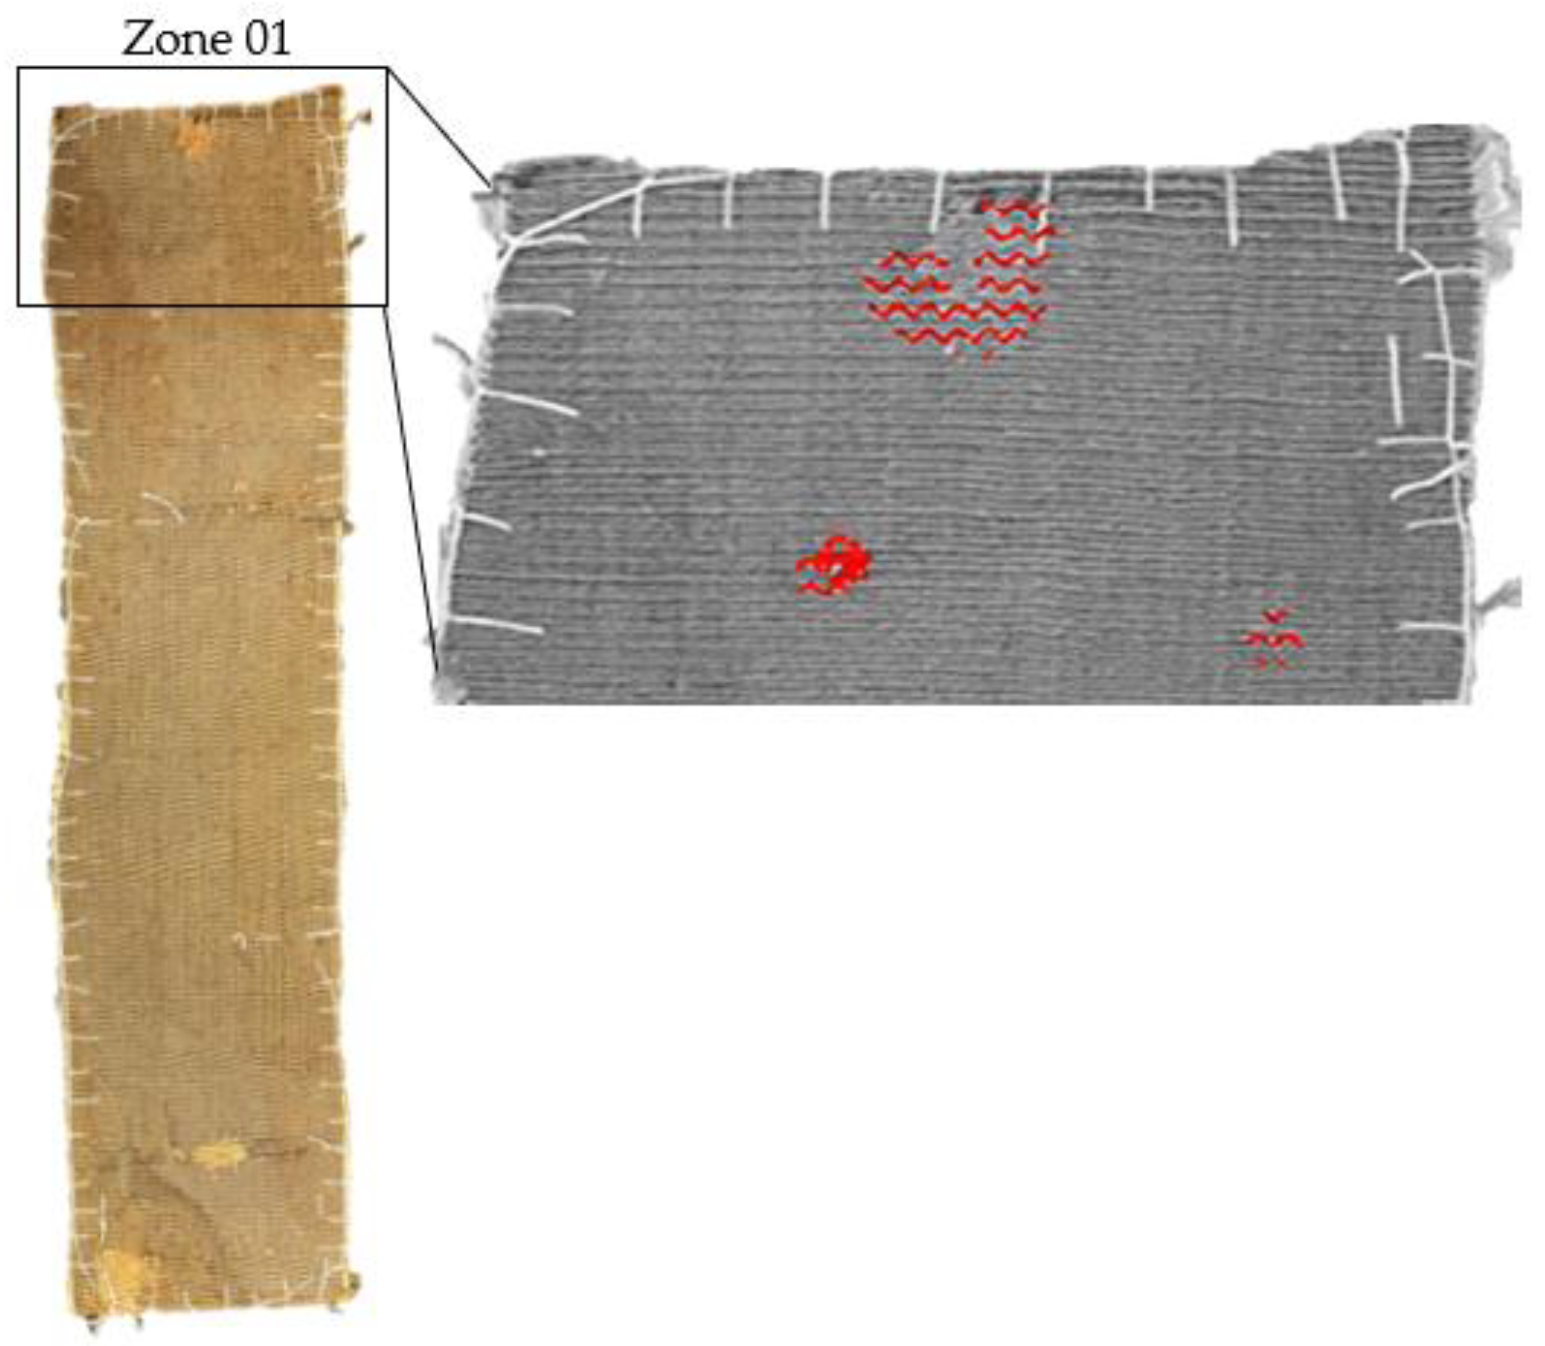
2.2. Experimental Measurements in a Historic Tapestry Fragment
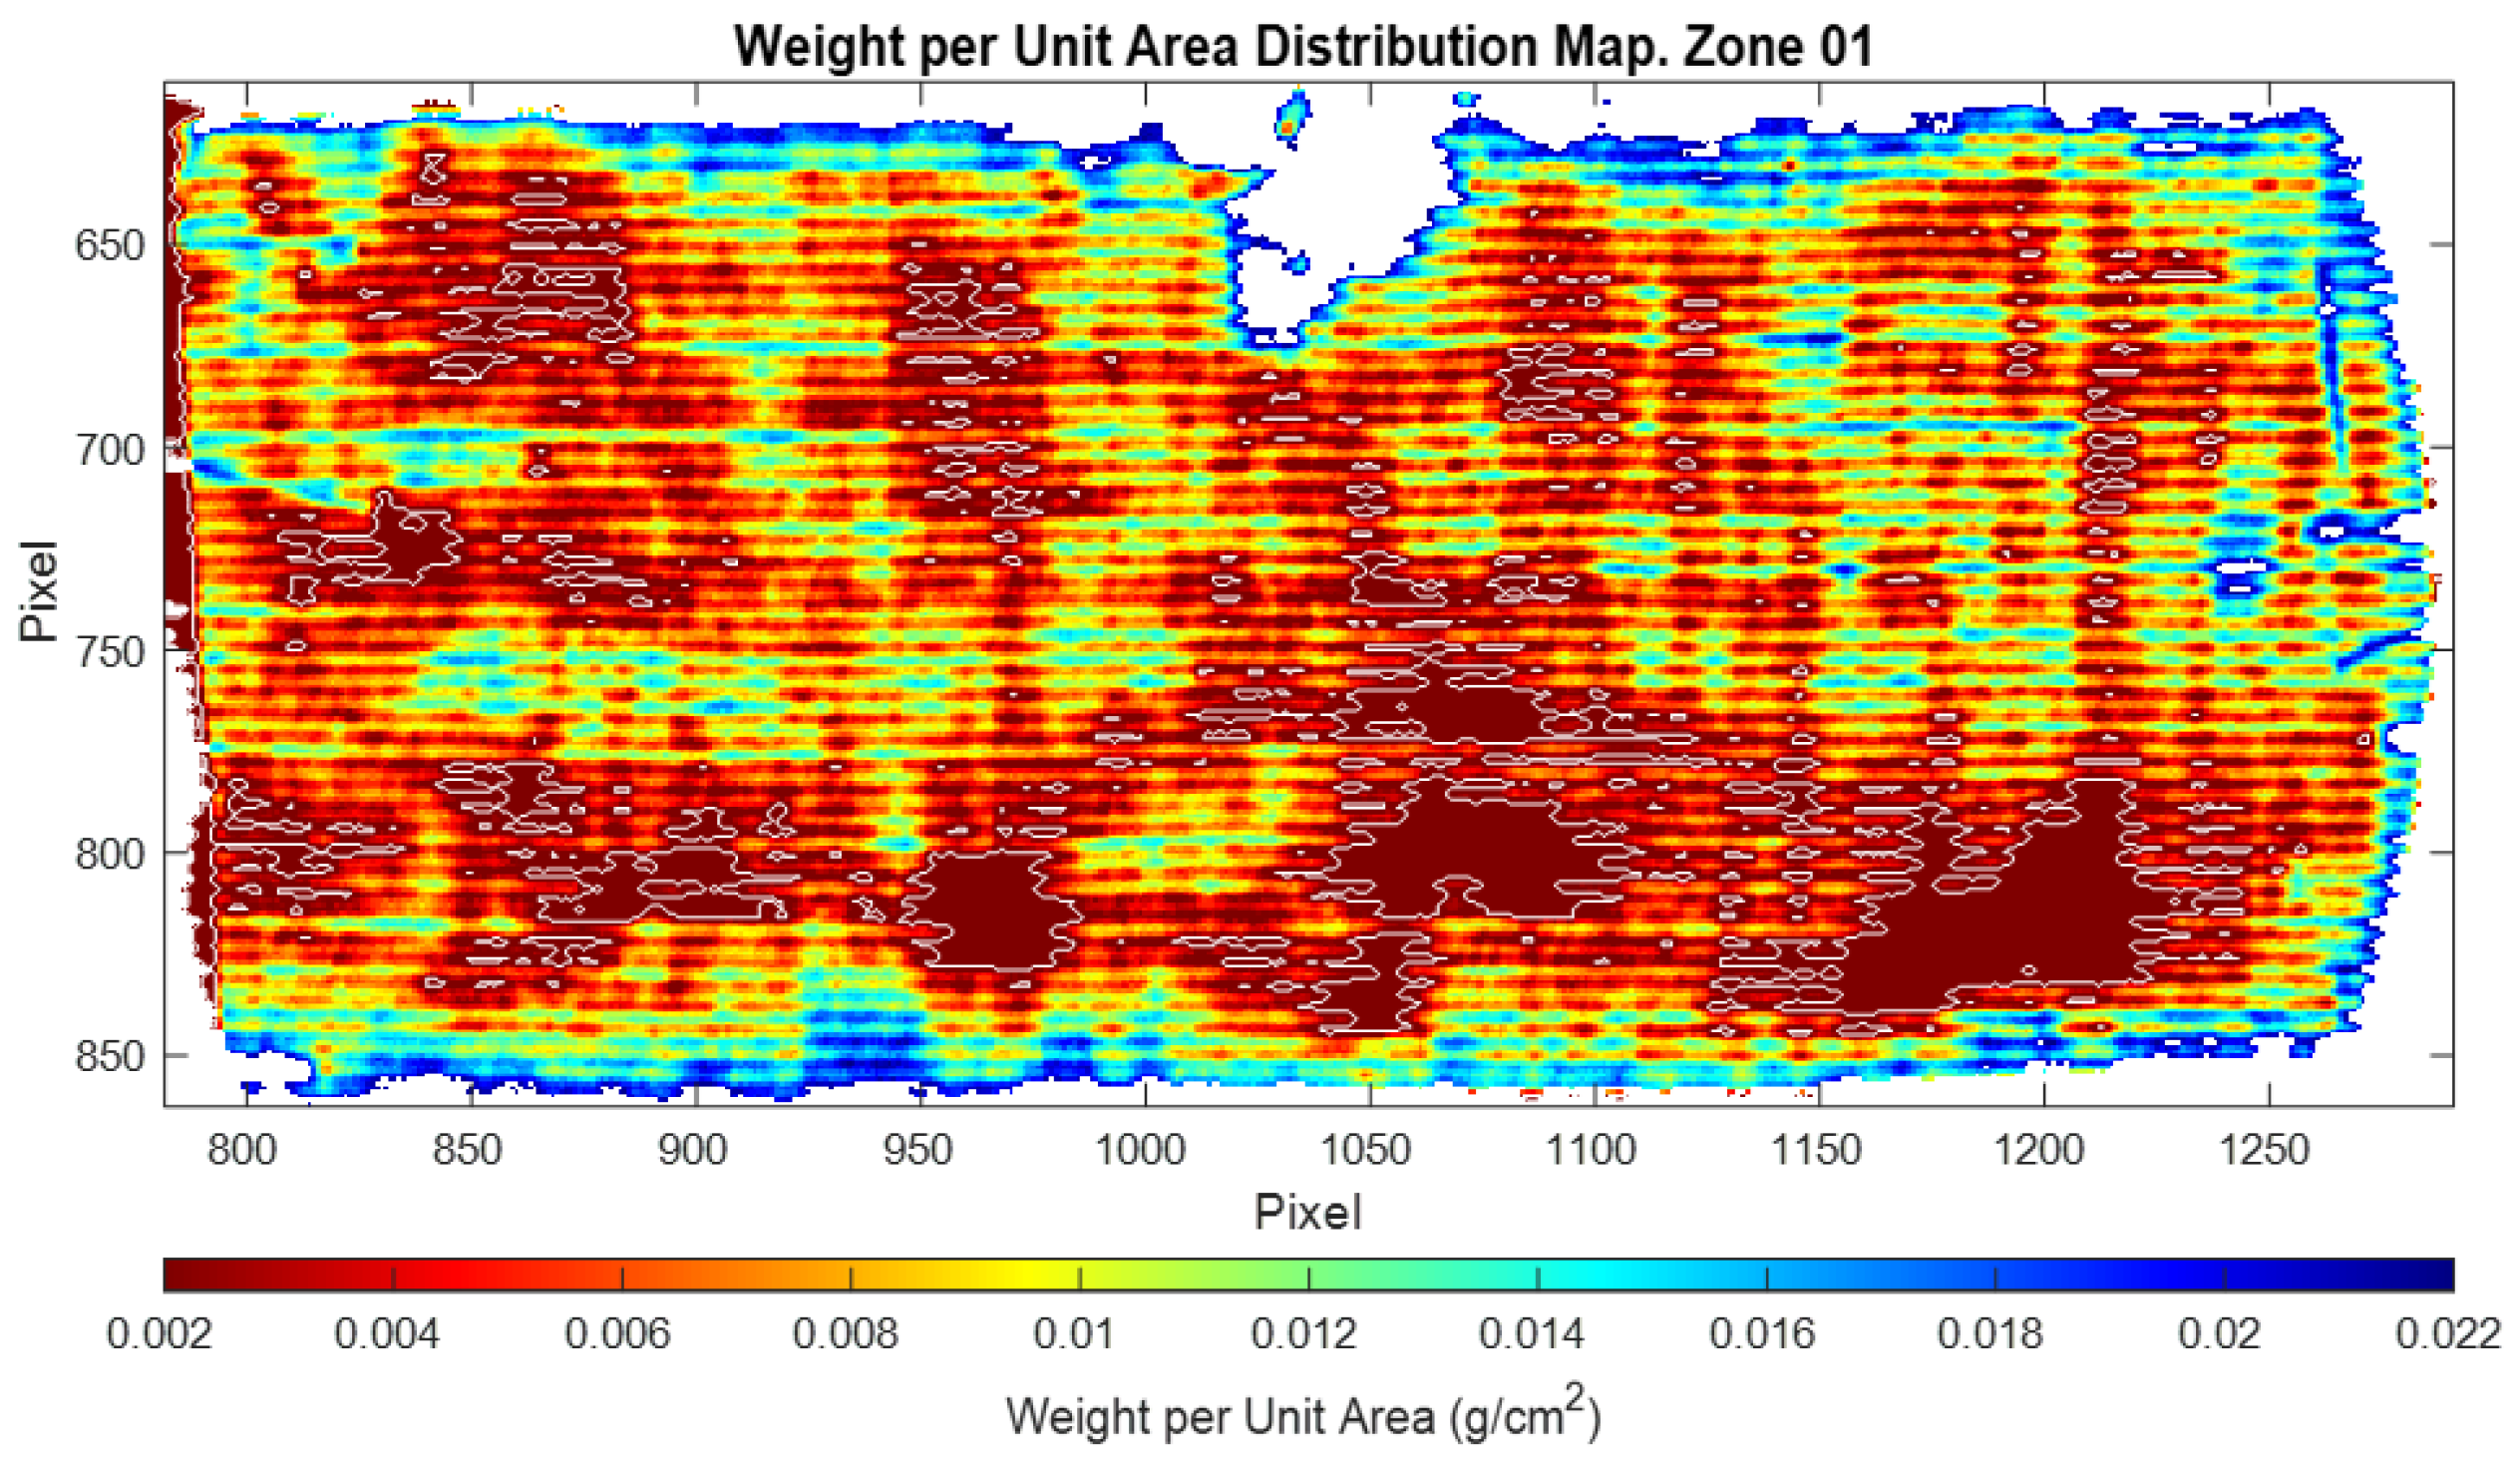
The developed methodology, validated through the analysis of the shredded wool yarn buttons, is now applied to the study of a fragment of a historic tapestry loaned by the Royal Tapestry Factory in Madrid. This tapestry, woven with warp and weft of wool, presented the appropriate characteristics for this study, serving as a basis for the application of the calibration. It exhibits technical characteristics typical of historic tapestries, such as its material composition, warp and weft density, structural deterioration, and evidence of previous interventions. The fragment of the tapestry, shown in Figure 4, is rectangular in shape with dimensions of 44 cm × 11 cm and shows worn edges reinforced with white thread. This manual temporary stitching was applied to prevent the threads from unravelling.
The fragment of the historic tapestry was displayed vertically, in direct contact with the light diffuser sheet, ensuring uniform illumination. The wavelength used was λ = 940   nm , consistent with the measurements of shredded wool yarn buttons. The experimental setup maintained a consistent distance of 70 cm between the light source and the light diffuser sheet. For the analysis, the tapestry was divided into seven distinct zones, labeled Zone 01 to Zone 07, allowing for a more detailed analysis of the variations in its fabric. Each zone was analysed separately. Infrared images ( λ = 940   nm ) represent the variations in infrared intensity transmission through the fabric. Each pixel in the image corresponds to a specific intensity value, which is directly proportional to the material density present in the tapestry. Higher intensity values indicate an increase in IR transmission associated with regions with less material, while lower intensity values correspond to areas with greater material density.
Intensity measurements were conducted on the historic tapestry fragment under the same experimental conditions as those used for the shredded wool yarn buttons. These references measurements of wool buttons were essential for establishing the calibration Equation (2), which correlates transmission values with material weight per unit area. By applying this equation to the tapestry images, pixel-by-pixel transmittance and weight per unit area distribution maps were generated, facilitating the identification of regions with lower weight per unit area and increased deterioration. The experimental results demonstrate a strong correlation between the elevated IR radiation transmission (higher intensity values) and material loss.

3. Results

A color-mapping technique was employed to represent both the transmittance of IR radiation and the weight per unit area of each pixel, improving the visual contrast between regions. This was particularly useful in overcoming the limitations of grayscale images, where slight differences can be challenging to detect. Warm colors (yellow, orange, and red) were assigned to regions expressing higher transmittance (70–100% of the radiation). In contrast, areas with lower and average transmittance were represented by cooler colors (blue and green).
A color-mapped representation of the transmittance (values between 0 to 1) of IR radiation through Zone 01 of the tapestry fragment is represented in Figure 5. Across Zone 01, cooler colors predominate, suggesting a general uniform transmittance across much of the tapestry. However, warmer colors (yellow, orange, and red) appear in specific localized regions, corresponding to higher radiation transmission and suggesting potential areas of deterioration. An enlarged view of an area of interest is included in Figure 5, revealing a concentrated presence of warm tones. To further support this analysis, a table containing the transmittance numerical values corresponding to Zone 01 has been provided, allowing a direct comparison with the color scale. This table is available for download in the Supplementary Materials section, enabling a more detailed quantitative examination of the data. While the numerical data provides an objective evaluation of fabric loss, the color scale simplifies the interpretation of the results.
Given that the calibration was performed for a specific range of weights, areas with values outside the calibration range fall beyond the dynamic range of the system. These areas, delineated by white isolines in Figure 6 to facilitate their identification, not only represent values outside the calibrated range but also highlight zones of particular interest from a conservation standpoint. Their exclusion from the dynamic range suggests a substantial loss in weight per unit area, indicating significant damage in these specific areas of Zone 01.

3.1. Analysis of Results

The weight per unit area distribution map (Figure 6), derived from the transmittance values in the transmission distribution map (Figure 5), shows that areas with higher radiation transmission, represented in warm tones, spatially correspond to areas of lower weight per unit area, outlined by white isolines. This correlation indicates that the increased transmittance is a direct consequence of the degradation of the tapestry’s fabric. This reinforces the usefulness of the proposed system for evaluating deterioration in historic tapestries. By automatically identifying the most vulnerable areas, restorers can prioritize their interventions and focus efforts where they are most needed.

Comparison with the Traditional Manual Method

A manual damage map of Zone 01 provided by the Royal Tapestry Fabric in Madrid restorers is shown in Figure 7. In this outline, the restorers have manually marked areas of weft thread loss and/or breakage, warp thread loss and/or breakage, and previous restoration using other materials. This manual damage map was used to compare the traditional manual evaluation with the results obtained using HeriTex system.
To compare the traditional manual analysis with the results obtained through our analysis, the manual damage map was overlapped with the transmittance distribution map. This alignment was performed using a geometric technique based on homonymous points, which ensured adequate alignment of the areas marked by the restorers with the high transmittance areas identified by the system.
A clear correlation can be observed between the areas manually marked by the restorers and the high transmittance areas detected by HeriTex, as shown in Figure 8. However, beyond the correlations, the system reveals additional areas not included in the manual evaluation. The marks made by the restorers appear in brown in Figure 8 and are overlaid on the transmittance distribution map. The areas of interest are labeled with a letter and a square. Areas a and c correspond to areas of loss and/or breakage of weft threads and loss and/or breakage of warp threads, respectively. These areas were manually identified by the restorers and were also detected by the system, as they coincide with regions with warm tones of higher radiation transmission. This overlap further validates the accuracy and reliability of the HeriTex system in identifying deteriorated areas. However, the most remarkable findings are areas b and d . These regions, detected by the system and represented in warm colors—indicating higher radiation transmission and, therefore, significant material degradation—were not identified by the restorers during manual assessment. Unlike areas a and c , which showed strong agreement between manual and system-based evaluation, areas b and d highlight the system’s ability to detect damage that may not be easily visible through conventional examination. This result demonstrates the higher sensitivity of our system, as it is capable of detecting subtle fabric alterations that may go unnoticed by the expert eye.

4. Discussion

The preservation of historic tapestries is essential to ensure their appreciation by future generations [4]. Given that tapestry conservation is often a long and costly process, there is a pressing need to explore innovative techniques to support and enhance conservation efforts. Therefore, the early detection of fabric alterations by the system is a key factor in ensuring their long-term stability. This early detection capability is crucial, as it allows the identification of fabric alterations before they become visible to the naked eye. This finding underscores the high sensitivity of the system in detecting early stage deterioration. The ability of HeriTex to detect and quantitatively assess structural alterations at such an early stage aligns with the growing importance of non-destructive techniques in cultural heritage conservation, which allow continuous monitoring and detection of subtle changes in materials [16]. Similar to the methods discussed in the review by Alaa Ababneh [16], the HeriTex system represents a valuable new tool for the accurate diagnosis of the conservation state of historical textiles.
The interpretation of the results obtained through the system provides valuable information on the state of preservation of this historic tapestry fragment. Areas represented by warm colors in Figure 5 indicate the presence of structural alterations, likely caused by physical or chemical damage [17]. This degradation is detected by the system as an increase in radiation transmission through the fabric. In addition to identifying pre-existing damage, the system shows great potential for ongoing monitoring of subtle material change over time. This allows for the early detection of new areas of wear. The process is highly efficient, as it involves image acquisition and processing, which can be repeated as frequently as necessary to track changes and assess deterioration trends.
To obtain more precise and exhaustive data regarding the conservation condition of historical tapestries, future research could explore the integration of the HeriTex system with other advanced optical technologies [18]. Techniques such as fiber optics reflectance spectroscopy (FORS), laser scanning, X-ray fluorescence (XRF), or Raman spectroscopy can provide valuable data on the chemical composition and material properties of heritage objects. These techniques were applied to analyze an 18th century painting, revealing information about the pigments and the manufacture of the painting [19]. This information from non-invasive methodologies could complement the structural information provided by HeriTex, which quantifies fabric wear through transmittance analysis. The combination of HeriTex with other analytical techniques would enhance the capacity to correlate material composition with the physical state of conservation.
Moreover, the use of portable, non-destructive equipment for in situ analysis represents a valuable opportunity for the continuous monitoring of tapestries within their display environments [20]. Techniques such as laser scanning microprofilometry and near-infrared spectroscopy can provide crucial information about the fabric composition and internal structure in situ, eliminating the need to transport the objects for analysis [20]. This is particularly relevant considering the conservation risks associated with the movement of artworks like tapestries. As emphasized by the United Nations Educational, Scientific, and Cultural Organization (UNESCO) [21], the relocation of movable cultural properties can lead to deterioration because of environmental changes, inadequate packaging, or improper handling.
In this context, it is important to underscore the added value of a system like HeriTex, which offers in situ quantitative analysis using portable equipment. This significantly reduces the risk of deterioration and allows the identification of the most vulnerable areas, providing essential information for planning the safe transport and display of historical tapestries.
Despite successfully identifying areas of significant wear, the system has some limitations. Future analysis could consider the implementation of alternative adjustment methods to widen the dynamic range, aiming to obtain more precise quantitative data in critical areas. Nonetheless, the current calibration range has proven effective in identifying key areas of deterioration—information that is fundamental to understanding the tapestry’s conservation state.

5. Conclusions

The HeriTex system has proven to be a valuable tool for assessing the condition of historic tapestries through infrared transmission analysis. It demonstrated high precision and reliability in measurements, as evidenced by the high value of the determination coefficient (R2) obtained in the non-linear least squares fitting. The calibration of the system established a quantitative relationship between the transmittance of infrared radiation and the wool weight per unit area. Compared to manual evaluation, the system exhibited superior sensitivity, successfully identifying areas of structural weakness that were not previously marked by restorers. This highlights its potential for early detection of deterioration. The system was able to measure the weight per unit area on a pixel-by-pixel basis within a historic wool tapestry fragment, in the range of 0.002–0.02 g/cm2, thus providing valuable quantitative data to inform conservation strategies.
Overall, HeriTex offers a reliable, non-invasive method for the early detection and monitoring of deterioration, supporting more effective and informed conservation of historic textiles.

Supplementary Materials

The supporting information can be downloaded at: https://www.mdpi.com/article/10.3390/heritage8050153/s1, which includes the transmittance data referenced in the main text.

Author Contributions

Conceptualization, B.S.-C., A.Á.F.-B. and D.V.M.; methodology, B.S.-C., A.Á.F.-B. and D.V.M.; software, B.S.-C.; validation, B.S.-C. and A.Á.F.-B.; formal analysis, B.S.-C. and A.Á.F.-B.; investigation, B.S.-C., A.Á.F.-B., D.V.M., V.G.B. and A.L.S.; resources, A.Á.F.-B., D.V.M. and V.G.B.; data curation, B.S.-C.; writing—original draft preparation, writing—review and editing, B.S.-C., A.Á.F.-B. and D.V.M.; visualization, A.Á.F.-B. and D.V.M.; supervision, A.Á.F.-B. and D.V.M.; project administration, A.Á.F.-B. and D.V.M.; funding acquisition, A.Á.F.-B. and D.V.M. All authors have read and agreed to the published version of the manuscript.

Funding

This research was funded by project number PID2022-138061OB-I00 of the Knowledge Generation Projects 2022 within the framework of Type B Oriented Research of the Ministry of Science, Innovation, and Universities.

Data Availability Statement

No new data were created or analyzed in this study. Data sharing is not applicable to this article.

Conflicts of Interest

The authors have no conflicts of interest to declare. Verónica García Blanco and Almudena López Sánchez are affiliated with the Royal Tapestry Fabric in Madrid. The authors declare that the study was independently designed and analyzed by the academic team. The findings and conclusions presented in this paper are based solely on the analyzed data and do not reflect the interests of the affiliated company.

Abbreviations

The following abbreviations are used in this manuscript:
IRInfrared
NLLSNon-Linear Least Squares
nmNanometers
cmCentimeters
gGrams
PMMAPolymethyl Methacrylate
LEDLight Emitting Diode
LDRLow Dynamic Range
HDRHigh Dynamic Range
CMOSComplementary Metal Oxide Semiconductor

References

  1. Díaz Cabeza, M.d.C. Criterios y Conceptos Sobre el Patrimonio Cultural en el Siglo XXI; Materiales de Enseñanza, año 1, Nº1; Universidad Blas Pascal: Córdoba, Argentina, 2010. [Google Scholar]
  2. Rogerio Candelera, M.A.; Saaiz Jiménez, C. (Eds.) Ciencia y Tecnología Para la Conservación del Patrimonio Cultural; Instituto de Recursos Naturales y Agrobiología de Sevilla (CSIC): Sevilla, Spain, 2011. [Google Scholar]
  3. Campbell, T.P. Tapestry in the Baroque: “Threads of Splendor”; O’ Neill, J.P., Rennolds, C.M., Aspinwall, M., Eds.; The Metropolitan Museum of Art: New York, NY, USA, 2007. [Google Scholar]
  4. Kissi, N.; Curran, K.; Vlachou-Mogire, C.; Fearn, T.; McCullough, L. Developing a non-invasive tool to assess the impact of oxidation on the structural integrity of historic wool in Tudor tapestries. Herit. Sci. 2017, 5, 1–13. [Google Scholar] [CrossRef]
  5. Holwell Duffus, P. Manufacture, Analysis and Conservation Strategies for Historic Tapestries; University of Manchester: Manchester, UK, 2013. [Google Scholar]
  6. Lennard, F.; Hayward, M. Tapestry Conservation. Principle and Practice; Oddy, A., Ed.; Butterworth-Heinemann: New York, NY, USA, 2011; 33p. [Google Scholar]
  7. Tripa, S.; Indrie, L.; Tripa, F.; Mare, M. A review on deterioration of textile cultural heritage objects and sustainable solutions to mitigate the degradation. Ind. Textila 2023, 74, 555–563. [Google Scholar] [CrossRef]
  8. Kosel, J.; Legan, L.; Bračič, M.; Ropret, P. Cationic silicone based paper impregnation agent for the protection of historical paper against fungal growth. Detection and quantification of fungi using micro-invasive fluorescence microscopy and non-invasive FTIR spectroscopy. J. Cult. Herit. 2024, 68, 195–204. [Google Scholar] [CrossRef]
  9. Ljaljević Grbić, M.; Dimkić, I.; Janakiev, T.; Kosel, J.; Tavzes, Č.; Popović, S.; Knežević, A.; Legan, L.; Retko, K.; Ropret, P.; et al. Uncovering the Role of Autochthonous Deteriogenic Biofilm Community: Rožanec Mithraeum Monument (Slovenia). Microb. Ecol. 2024, 87, 87. Available online: https://pubmed.ncbi.nlm.nih.gov/38940862/ (accessed on 21 April 2025). [CrossRef]
  10. Vargas, W.E. Light scattering and absorption by non homogeneous materials: The Kubelka-Munk model. Opt. Pura Apl. 2011, 44, 163–183. Available online: https://www.sedoptica.es (accessed on 19 July 2024).
  11. Zhang, H.; Hu, T.; Zhang, J. Transmittance of Infrared Radiation Through Fabric in the Range 8–14 μm. Text. Res. J. 2010, 80, 1516–1521. [Google Scholar] [CrossRef]
  12. Wilhelm, R.H.; Boyd Smith, J. Transmittance, Reflectance, and Absorptance of Near Infrared Radiation in Textile Materials. Text. Res. J. 2015, 19, 73–88. [Google Scholar] [CrossRef]
  13. Fernandez-Balbuena, A.A.; Gómez-Manzanares, A.; Martínez Antón, J.C.; Gómez-Tejedor, J.G.; Mayorga-Pinilla, S.; Durán Roque, H.; Vázquez Moliní, D. High-Dynamic-Range Spectral Reflectance for the Segmentation of Paint Pigment: Application to Dalí’s Oil Painting Dos Figuras (1926). Sensors 2023, 23, 4316. [Google Scholar] [CrossRef] [PubMed]
  14. Cabrera Sixto, J.M.; Vidaurri Aréchiga, M.; Pérez Luque, R.A.; Sosa Aquino, M.A.; Guerrero Agripino, L.F.; Aguilera Morales, J.M.; Rodríguez Argote, M.C.; Romero González, E.M.; Villagómez Oviedo, C.P.; Saldaña Hernández, J.C.; et al. Imagen Tecnológica, Proceso y Representación en el Arte y el Diseño, 1st ed.; Cuerpo Académico Representación y Procesos en el Arte y el Diseño R, Ed.; Universidad de Guanajuato: Guanajuato, Mexico, 2014. [Google Scholar]
  15. Chapra Steven, C.; Canale, R.P. Métodos Numéricos Para Ingenieros, 5th ed.; McGraw-Hill/Interamericana Editores SA: Mexico City, Mexico, 2007; Volume 5, pp. 495–497. [Google Scholar]
  16. Ababneh, A. Digital Solutions for Cultural Heritage: Preservation, Interpretation, and Engagement in Line with the Venice Charter Principles. CEUR Workshop Proceedings. 2024. Volume 3838. Available online: https://ceur-ws.org/Vol-3838/paper1.pdf (accessed on 21 April 2025).
  17. Costantini, R.; Lennard, F.; Alsayednoor, J.; Harrison, P. Investigating mechanical damage mechanisms of tapestries displayed at different angles using 2D DIC. Eur. Phys. J. Plus 2020, 135, 515. [Google Scholar] [CrossRef]
  18. Fernandez-Balbuena, A.; Vazquez-Molini, D. Optical Technologies Applied to Cultural Heritage. Heritage 2022, 5, 359–361. [Google Scholar] [CrossRef]
  19. Perez, M.; Cano, N.; Ruvalcaba-Sil, J.; Mitrani, A.; de Lucio, O. Technical Non-Invasive Study of an 18th Century Novo-Hispanic Panel Painting. Heritage 2021, 4, 3676–3696. [Google Scholar] [CrossRef]
  20. Dal Fovo, A.; Striova, J.; Pampaloni, E.; Fedele, A.; Morita, M.M.; Amaya, D.; Grazzi, F.; Cimò, M.; Cirrincione, C.; Fontana, R. Rubens’ painting as inspiration of a later tapestry: Non-invasive analyses provide insight into artworks’ history. Microchem. J. 2020, 153, 104472. [Google Scholar] [CrossRef]
  21. UNESCO. General Conference 20th, 1978. Actas de la Conferencia General, 20a reunión, París, 24 de Octubre-28 de Noviembre de 1978, v. 1: Resoluciones. Actas de la Conferencia General de la Organización de las Naciones Unidas Para la Educación, la Ciencia y la Cultura (20.a Reunión). 1979, pp. 62–68. Available online: https://unesdoc.unesco.org/ark:/48223/pf0000114032_spa.page=183 (accessed on 22 April 2025).
Figure 1. Schematic diagram of infrared transmittance measurement system: HeriTex.
Heritage 08 00153 g001
Figure 2. Black-coated PMMA sample holder with a 1 cm diameter cavity containing a shredded wool yarn button.
Heritage 08 00153 g002
Figure 3. Transmittance vs. weight per unit area (g/cm2): non-linear least squares fit and standard deviation.
Heritage 08 00153 g003
Figure 4. Photograph of the historic wool tapestry fragment provided by the Royal Tapestry Factory in Madrid. The area marked as Zone 01 corresponds to the region selected for analysis.
Heritage 08 00153 g004
Figure 5. Transmittance distribution map across Zone 01 of the fragment of historic tapestry showing the variation in transmittance using a color scale. Starting with the weight per unit area (g/cm2) analysis, Figure 6 presents the weight per unit area distribution map for Zone 01, obtained by transforming the grayscale image using the system’s previous calibration and Equation (3). This map visually represents variations in the weight per unit area of the fabric on a pixel-by-pixel basis across the analyzed zone. Warmer tones highlight areas with a reduction in weight per unit area, while areas in cooler tones correspond to regions with higher weight per unit area, mirroring the distribution observed in the transmission map.
Heritage 08 00153 g005
Figure 6. Weight per unit area (g/cm2) distribution map of Zone 01, with isolines indicating the areas outside the dynamic range.
Heritage 08 00153 g006
Figure 7. Enlargement of Zone 01 of the historic tapestry, with the manual damage map overlap in red.
Heritage 08 00153 g007
Figure 8. Alignment of the manual damage map with the transmittance distribution map of Zone 01. Regions a and c correspond to areas where both manual evaluation and the system identified deterioration, while regions b and d highlight degradation detected only by the system.
Heritage 08 00153 g008
Disclaimer/Publisher’s Note: The statements, opinions and data contained in all publications are solely those of the individual author(s) and contributor(s) and not of MDPI and/or the editor(s). MDPI and/or the editor(s) disclaim responsibility for any injury to people or property resulting from any ideas, methods, instructions or products referred to in the content.

