Article

Mapping an Information Model for Historic Built Heritage into the IndoorGML Standard: The Case of the Pitti Palace

1
Department. of Civil and Environmental Engineering, University of Florence, Via di Santa Marta, 3, 50139 Firenze, Italy
2
Department. of Science of Antiquities, La Sapienza University of Rome, Piazzale Aldo Moro, 5, 00185 Roma, Italy
3
LaMMA Consortium, Via Madonna del Piano, 10, 50019 Sesto Fiorentino, Italy
*
Author to whom correspondence should be addressed.
Heritage 2025, 8(4), 115; https://doi.org/10.3390/heritage8040115
Submission received: 24 January 2025 / Revised: 26 February 2025 / Accepted: 14 March 2025 / Published: 24 March 2025

Abstract

:
The paper explores the significance of digitalization and spatial modeling for the preservation and management of cultural heritage, addressing challenges posed by architectural complexity and extensive data volumes and developing a tailored data model to organize and integrate geometric, material, and historical information. The case study of Pitti Palace in Florence, Italy, is proposed, considering that its architectural complexity and cultural significance require innovative approaches to documentation and management. The “Pitti Data Model” is proposed as a tailored information system to organize and manage the data. It classifies spaces by adopting a hierarchical approach that supports detailed spatial analysis and reflects the historical and functional diversity of the site. The model links geometric data with thematic data such as material types, state of conservation, and historical names of spaces, providing a multi-dimensional understanding of the building. Based on Getty’s Art & Architecture Thesaurus (AAT), a controlled vocabulary was employed to ensure semantic consistency and interoperability. This semantic enrichment facilitates the integration of geometric data with broader heritage information systems. The paper presents, therefore, the integration in existing standards like INSPIRE, CityGML, and IndoorGML, thus providing a data model supporting efficient querying and visualization in a GeoDB that integrates spatial and non-spatial data, supporting collaborative and sustainable heritage management by enabling advanced analyses such as visitor flow optimization and conservation planning. This aligns with the concept of Heritage Digital Twins (HDT), which are interactive, evolving representations of cultural assets. HDTs support collaborative and sustainable heritage management by enabling stakeholders to access, analyze, and update information in real time.

1. Introduction

According to the Digital Decade policy program [1], data spaces and data governance play a key role in supporting democracy through digital tools. In this frame, Digital Twins (DTs) are listed among the cutting-edge technologies relevant to enhancing people’s lives, businesses, and the environment in the near future. Through the proposal of a common European data space for cultural heritage [2,3], the European Commission recommends accelerating the digitization of all cultural heritage monuments and sites, objects, and artefacts for future generations to protect and preserve those at risk and boost their reuse in domains such as education, sustainable tourism, and cultural creative sectors, also considering issues as data accessibility and digital preservation [4].

1.1. The Role of Geomatics in Digital Twinning

The concept of DT originated in manufacturing [5] to denote a collection of virtual data structures that comprehensively represent an actual physical product, spanning from the microscopic scale to the macroscopic geometric level. All information that could be gathered from examining the physical product can be obtained from its digital twin, mirroring (or twinning) systems between what exists in real space and what exists in virtual space and vice versa [6].
In the production sector, the DT was therefore created to develop and test a prototype in a virtual environment before its physical counterpart was realized; in the case of tangible digital heritage, on the other hand, the DT reflects an existing artefact, and therefore, the way to produce it passes through 3D digitization. In this case, the digital model derived from sampling the real object constitutes the virtual representation of the physical system. Geospatial science offers tools of choice in this sense [7], contemplating the use of active and passive sensors capable of first digitizing the geomatic consistency of the object and, in some cases, integrating information of another nature [8].
Thanks to the development of increasingly advanced techniques and sensors, the geomatic survey maintains and emphasizes its fundamental role as an initial tool in the Conservation Cycle [9]; it is, therefore, possible, on the one hand, to study the building as it is at the moment and, on the other hand, to refer all the documents that can be collected to the building (or to some of its parts) itself. The 3D survey can be understood as an ’Open System of Knowledge’ [10], and the DT thus becomes a powerful tool for analyzing and managing the original building because it consists of a reliable model from a geometric and dimensional point of view but also of the functioning of the artefact itself.
The 3D digitization process allows very high-resolution data to be recorded nowadays [11], a fundamental element for mirroring from the real to the virtual, as proposed by the DT definition. It is worth mentioning that, even in the face of ever-increasing productivity enabled by the most modern tools [12] and the possibility of introducing automatisms in on-the-field operations and in data processing as well, digitization remains a challenging process. This is the case of many architectural complexes, which combine significant dimensions with an articulated conformation of spaces, resulting from transformations and interventions over time, mixed uses, and specific requirements.
More recently, in the field of built heritage, attention has focused on the ability to record real-world data obtained from a variety of sensors and, above all, to update them at intervals that range from relatively short periods to near real-time. As sensors capture the changes over time, in the field of built heritage, data connection (or monitoring) is in general reserved for thematic (often related to diagnostic, as temperature, humidity, etc.) or structural aspects (i.e., structure micro-movements and deformations). In general, the spatial representation of the physical building is assumed to be stable [13]. On the other hand, when studying building transformation during the time, changes in the use of the whole building or of some parts, changes in the relationship with the surrounding, both urban and natural, the fourth dimensions expressed by time must also be taken into account for the built environment. Looking to the past, information can be retrieved from textual or iconic historical sources, while looking to the future, it is advisable to envisage how to manage the updating of the 3D survey, not only in terms of registering new geometrical data but in terms of integrating the new data into the model.

1.2. Knowledge Representation and Modeling

In the context of historic buildings, it is crucial to emphasize that the creation of a Heritage Digital Twin (HDT), as with Historic Building Information Modeling (HBIM), is not simply a matter of creating ’dumb’ parametric digital models. On the contrary, it is essential to integrate detailed information on the material consistency of the building into the geometric model, going beyond the mere digitization of form and appearance [14]. In this respect, it is important to note that the most recent guidelines [15] for the digitization of cultural heritage include, in the acquisition phase, typical diagnostic tools specific to the field of conservation and restoration, in order to provide a more complete and conscious representation of the structural and material characteristics of the asset.
The implementation of an HBIM and HDT is linked to an efficient management of the information resources of the “knowledge path” [16], thus overcoming the criticalities due to the fragmented or insufficient documentation available.
The added value lies in the greater accessibility of knowledge, made possible by the use of interoperable platforms, supported by the implementation of relational databases, where information is geo-referenced to the geometric model. This approach facilitates a more conscious and targeted management and maintenance of the built heritage, allowing systematic and integrated access to data to support the conservation, restoration, and efficient management of the built heritage [17].
The fragmentation of knowledge, together with information overload [18], has long been a major problem in science. This challenge affects not only the provenance and ownership of data, but also the different scientific communities working in the field of cultural heritage. This complexity can make it difficult to access and share information [19,20,21], thus hampering the ability to take informed action to protect and enhance cultural heritage.
New European and national projects dedicated to the design of platforms for sharing cultural heritage through HDT [22,23] promote a holistic approach to the issue. The focus is shifting from the simple production and use of digital resources to the creation of true digital ecosystems [24], where the network of relationships between objects is at the core. Such ecosystems allow users to collectively manipulate and enrich HDTs, contributing to the production of digital commons [25], a subset of digital commons that differs from other digital resources in that the community of people involved in its creation can actively participate in the management of interaction processes and shared resources [26].
The governance model proposed by De Rosnay et al. [25] for HDTs would therefore require that, in addition to being free from copyright, patent, and similar restrictions, the data meet a number of specific requirements, including the following:
  • Organization into machine-readable datasets;
  • Traceability and interoperability of digital data creation processes according to the FAIR principles [26], guaranteeing the quality, transparency, traceability, interoperability, and integrity of data in a formalized and standardized way, using metadata and paradata [27];
  • Enhance data by characterizing the content they represent, in particular through semantic segmentation and annotation methods;
  • Promoting the digital continuum, with the possibility of retrieving past data and encouraging the continuous updating and monitoring of information;
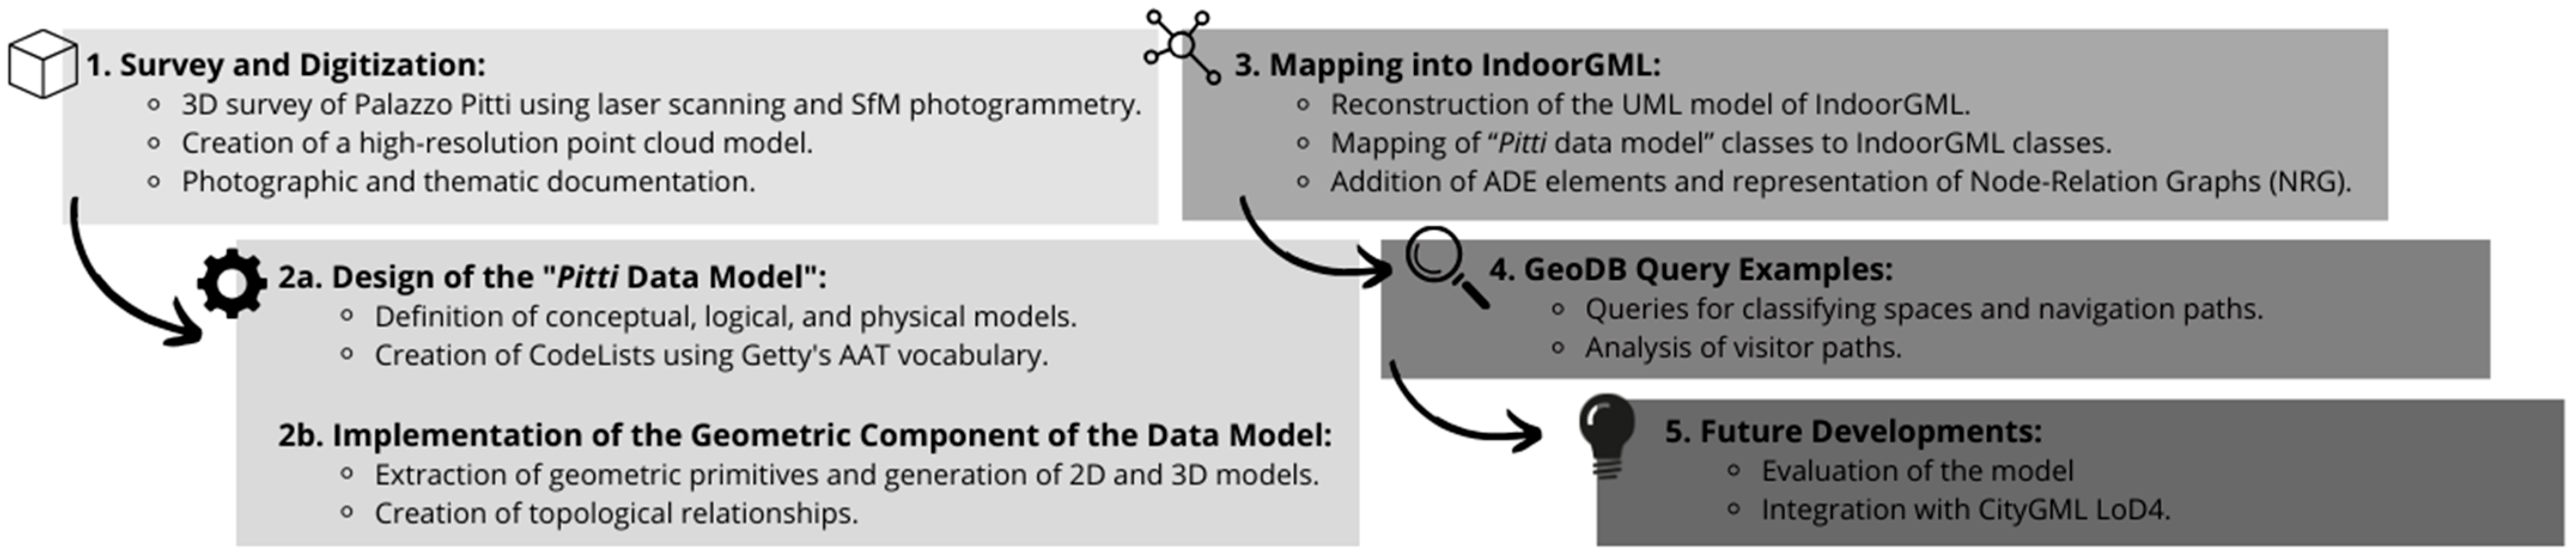
  • Implement the Heritage Digital Twin Concept Ontology (HDTO) [28], based on the reference standard for cultural heritage, the CIDOC CRM 2023 [29], together with its extensions.
In summary, new projects can no longer be limited to the digitization of heritage but must rise to the challenge of creating dynamic and shared systems in which users actively participate in the management and enhancement of heritage, with a view to collaborative and sustainable management of cultural resources.

2. Methodology

2.1. Building as a Complex System

Successive definitions of “architecture” over time reflect the value attached to it at the historical moment in which they are formulated. Architecture is a discipline akin to philosophy, as evidenced by the many philosophers who have debated its definition. It is characterized by a constant attempt to re-evaluate its own identity, role and distinctiveness in relation to the other fields of knowledge involved in its implementation [30]. If Vitruvius defined architecture as “the art of building” [31], over time this definition has become a humanistic discipline [32], born of man’s needs and his way of inhabiting the world [33].
Aldo Rossi wrote in 1968 [34]: “I understand architecture in a positive sense as a creation inseparable from the life and society in which it manifests itself; it is largely a collective fact […]. Architecture is thus rooted in the formation of civilisation and is a permanent, universal and necessary fact.”
Architecture is, therefore, more than the simple sum of its physical, formal, and functional components; it is a way of thinking expressed through a complex evolutionary process that produces new solutions, forms, materials, and a constant redefinition of the concept of architecture itself. At the same time, time, and history change buildings, both in the material aspects that define them and in the definition of architecture itself, i.e., architecture can adapt to change, but it can also anticipate and generate it [35,36].
The digitization of an architecture, its understanding, measurement, and representation have always been the main tools for the study of architecture, both in the didactics of the academies and in its current meaning as an anamnesis tool to ensure the conservation of a built asset. It is not simply a monthly activity, but the completion of a critical operation aimed at a general knowledge of the work [36,37].
Understanding architecture means dealing with the issue of complexity, a term that is often misused and is the subject of numerous definitions in different fields [38]. The philosopher Mauro Ceruti gives an instructive example: “For complex, perhaps the metaphorical word I like to use most is the Latin ‘unitas multiplex’, which is almost an oxymoron, that is, the idea of a unity in multiplicity and a multiplicity in unity, which by plectere, interweaving, continuously reconstitute themselves in time” [39].
Architecture can thus be understood as a complex system, i.e., composed of different and variously interrelated components:
  • Actors/people (designers, clients, users, managers, conservators, etc.).
  • Material (structures, installations, contents, state of conservation, documentation, literature, etc.).
  • Immaterial (spaces, functions, typologies, distribution, symbols, deficiencies, representativeness, resilience, etc.).
  • The evolution of these components over time.
  • The interactions generated by the components and their variations.
A complex system also has strong interactions with other systems or with external elements, with the environment, with the territorial or urban, social, and environmental context over time. This increases the difficulty in defining a boundary, an inside and an outside, of a system in which the components of the system itself can change.
In fact, a complex system can only be fully understood and analyzed if it is considered as a whole, with particular attention paid to the interactions between its elements. It is not possible to take a reductionist approach to the study of such systems: breaking down and analyzing the individual components does not allow us to understand the overall behaviour of the system, which cannot be deduced from the isolated properties of its elements. Only a holistic, transversal approach makes it possible to interpret the complex system as an expression of the dynamic relationships between its parts [40,41]. Furthermore, focusing on historical architecture increases the relevant aspects of the study and forces one to consider more articulated relationships, thus tending to increase the complexity of the approach needed. In tackling the study of Pitti Palace, indeed, it was necessary to consider the various components listed above, some of which were of direct interest (in particular those related to spatial aspects) and others that had an impact on the fieldwork (e.g., people working in the palace in various capacities) or on the output plotting (e.g., materials and state of preservation). The following Section highlights how the concept of complexity—and consequently the need to define appropriate data management strategies for their representation and management—applies not only to the historic building but also to the related study process.

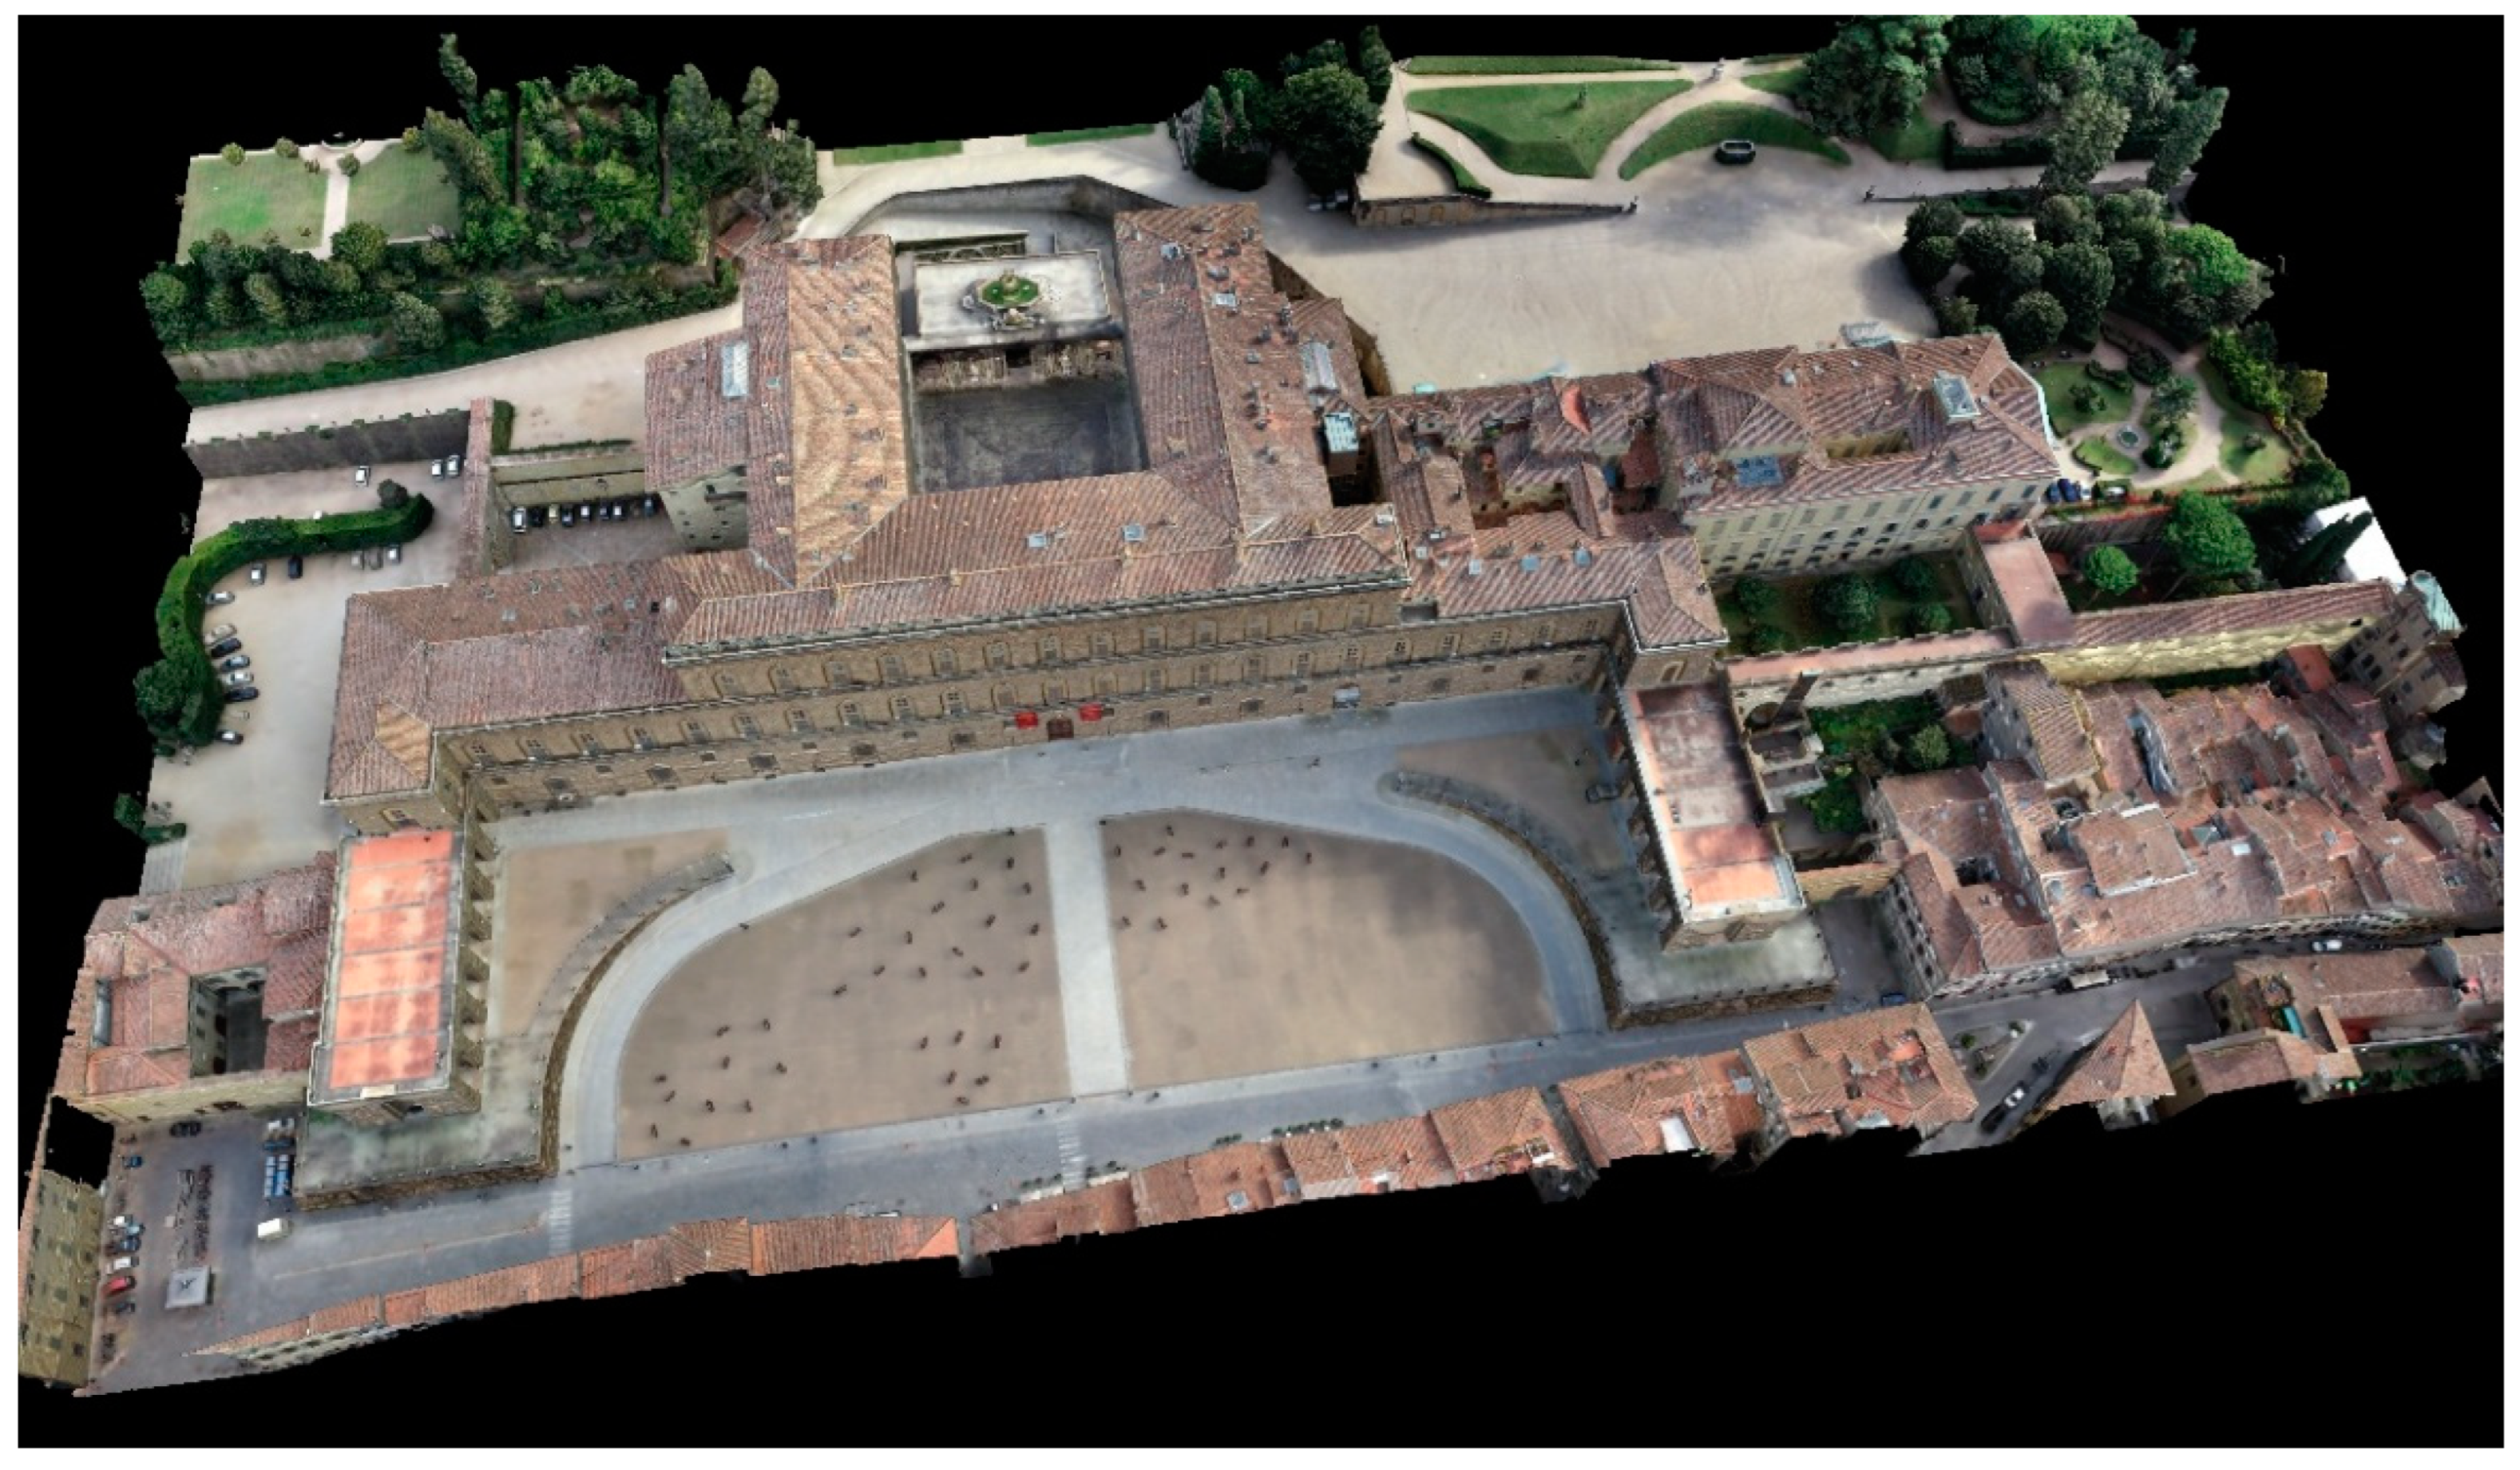
2.2. Surveying Process as a Complex System: The Case Study of Pitti Palace

Acquired in 1550 by Cosimo I de’ Medici and his wife Eleonora di Toledo to become the new grand-ducal residence, Pitti Palace quickly rose to prominence as a symbol of the Medici’s consolidated power over Florence and Tuscany. Following the fall of the Medici dynasty, the palace passed to the House of Habsburg-Lorraine, which ruled from 1737 until the unification of Italy, and later to the House of Savoy, which used it as their royal residence when Florence became the capital of the Kingdom of Italy in 1865. Despite these changes in ownership, the palace retains the name of its original commissioner, the Florentine banker Luca Pitti, who around the mid-15th century commissioned its construction—possibly designed by Filippo Brunelleschi—on a site across the Arno River, at the foot of the Boboli Hill.
The entire complex, organized around several interior courtyards and spanning multiple floors, with a total area of approximately 32,000 square meters, was the subject of an extensive 3D survey campaign conducted between 2020 and 2022 by the GeCo Lab at the University of Florence (under the direction of Prof. Grazia Tucci) as part of an agreement with the Uffizi Galleries, the institution responsible for the maintenance and management of the palace, as well as the museums within it. This was a complex documentation project, focused primarily (though not exclusively) on 3D digitization. It was carried out through an integrated survey, using Terrestrial Laser Scanning and SfM photogrammetry [42,43], covering all interior and exterior spaces (Figure 1).
The framework of the survey is based on a topographic control network, designed to align with the morphology of the site and consisting of 25 vertices measured with GNSS systems, then extended with 364 additional vertices measured with total station outside and inside the building. Such an extensive control network was obviously demanding, but made it possible to verify and validate the quality of the results obtained from a metric point of view, and it is the first milestone in making the project sustainable, considering model updates, monitoring, and other applications over time.
The detailed survey of the 43 facades and the palace’s roofs was conducted using UAV SfM photogrammetry. It required over 20 days of flights, each time planning a flight path tailored to balance the requirement to maintain constant image resolution and exposure with the constraints imposed by the building’s shape and size. A total of 54,411 photos were taken (approximately 380 GB of data), organized into 50 photogrammetric projects.
In parallel, more than 5000 scans were carried out with the Leica RTC360 Laser Scanner to capture the interiors, stairwells, and courtyards. These scans were processed using the proprietary Leica Cyclone Enterprise [44] software across 84 distinct sub-projects, organized into macro-areas so that different teams could proceed in parallel with the following:
  • The measurement of checkpoints, then removed as soon as possible (particularly in exhibition spaces);
  • Three-dimensional scans;
  • Data processing;
  • The drawing of 2D vector drawings, such as plans and elevations.
The comprehensive point cloud model amounts to 798,235,934,642 points, totaling over 7 TB of data.
As described in previous work [45], in addition to recording the building geometry, a photographic documentation consisting of 12,512 images was produced, along with thematic documentation for each surveyed area. This included material composition, the conservation state of walls, floors, and ceilings, as well as the past and present names of the spaces, among other information.
The volume of collected data underscores the scope and complexity of this endeavor, which documented 1673 spaces (1533 interior rooms, 73 stairwells, and 67 open spaces such as courtyards and terraces). It was a complex design challenge for a structure whose actual extent could not even be known in detail at the very beginning, as many spaces were not accessible during the preliminary inspection, and no one had any idea of the number of rooms it consists of. The design had to account for multiple components: fieldwork planning, relationships with property stakeholders, and data processing and management.
From the outset, the need arose to develop a data model to organize the information from the comprehensive 3D survey of Pitti Palace. This “Pitti Data Model” was designed at the start of the survey to address the urgency of organizing data recording and archiving, the fieldwork for the various operators involved, and enabling the effective post-processing of data by different teams. However, it soon became evident that the proper planning of representing information and relationships between them would allow us to handle future requirements. The following Section illustrates the innovativeness of the proposed contribution in the context of information models developed for the management, in various forms, of historical or archaeological buildings or architectural complexes.

2.3. Project’s Contribution to the Contemporary Scientific Paradigm

Several projects have been developed to support the maintenance of historical buildings by applying innovative technologies and digital twinning approaches. Considering those that have addressed the concept of building management with a particular focus on conservation purposes, we can mention the project SIALH (Sistema de Información de la Alhambra), an informative system aimed to improve the information used by the Patronato de la Alhambra y Generalife, providing a single repository of truthful and verified data, reinforcing collaborative work, and promoting administration digital transition [46]; the BIM3DSG project supporting the maintenance operations involving the Milan cathedral [47]; the Information System of the Great Pompeii Project, founded by the European union to enhance the effectiveness of the actions and interventions for protecting the archaeological area [48]; the Interreg MAIN10ANCE project between Italy and Switzerland, which combines GIS and HBIM for the scheduled maintenance of the Sacro Monte monasteries [49]; the digital platform for scholarly work at Notre Dame Cathedral after its fire destruction [50]; and the “Appia Regina Viarum” project, which will develop a multi-temporal DT integrated with historical documentation [51].
The above-mentioned international research projects focused on creating novel heritage management tools, each proposing effective solutions to case study-related needs. The project embraces certain scientific and methodological aspects but proposes an innovative approach simultaneously. The relevant features of the proposed work are as follows:
  • They emerge from a case study, but their development is designed for a more general application to the built heritage domain, particularly when characterized by complexity in the various declinations illustrated in Section 2.1;
  • They are found on rigorous and exhaustive geometric data coming from a survey with geomatic techniques;
  • They valorize the third dimension in describing spaces in order to fully exploit their topological relationships;
  • They “translate” the initial data model to lead the work to adopt widespread geospatial standards;
  • They adopt a controlled vocabulary to minimize uncertainty in feature identification, even in the presence of specialized terms that are sometimes related to local building traditions;
  • They consider the management of the survey process, understood as a set of activities that must be repeated over time so that the changes made to the building correspond to those made to its digital reference, in order to preserve the twinning process effectively.
Figure 2 summarizes the methodological framework adopted in the work, highlighting the sequence of the various operational steps.

3. State-of-the-Art and Reference Standards: INSPIRE, CityGML, and IndoorGML

The standards allow a multi-scale representation, usually addressing each specific level of detail from the territory, to the city, to the building, up to the description of the interior spaces (rooms, corridor, staircase, etc.) and its components (floors, ceilings, fittings, etc.). It is also possible to consider different levels of granularity, which include the territorial/landscape level, urban level, architectural level, and higher levels pertaining to architectural components or movable heritage. In this ideal representation that zooms from a vast area to a narrow and detailed one, Pitti Palace, in terms of size and cultural/architectural value, can be considered relevant at the same time at different scales and domains: from the descriptive level of the city and the architectural one, and from the latter to the one more related to cultural value, due to the considerable movable heritage it contains. Its impressive dimensions and the complex articulation of the buildings connote it as a large sector of the city center of Florence, with multiple and direct relations with the surrounding built space. At the same time, the labyrinthic articulation of the interior spaces, the complex functional stratifications, and the numerous specificities concerning an ordinary building make it an exemplary case study in the field of knowledge engineering of the domain of the historic built heritage.
Focusing briefly on the representation of the territorial scale, among the data models of the geographical domain, the INSPIRE standard is the fundamental and mandatory one in the field of geo-information.
Defined by the European Directive for an Infrastructure for Spatial Information in the European Community (published in 2007 and to be mandatorily adopted in every European country by 2020), the objective of its Data Specifications is to define, within the framework of an interoperable geospatial infrastructure, common technical specifications on 34 themes, including the Buildings theme (INSPIRE BU) [52] to support common environmental policies in Europe.
At the urban scale, CityGML [53], published by the Open Geospatial Consortium (OGC), is probably the most widely used international standard for multi-scale modeling of 3D information.
Both INSPIRE and CityGML refer to the ISO/TC 211 ’geomatics’ standards [54] for conceptual and formal modeling in UML (Unified Modeling Language) of geographic information. Both involve the use of GML (Geographic Markup Language) [55] as the definition formats for geographic XML datasets and the reference to the geometric spatial types of the spatial model (spatial schema ISO/TC211 19107) [56].
Although CityGML and INSPIRE BU are not fully compatible, the two standards still aim to represent a common frame of building data, regardless of any specific application for which they may be used [57]. On the INSPIRE side, some studies have proposed how to extend the data model to include Cultural Heritage sites in the Protected Sites class [58,59] and the same on the CityGML side [57,60].
The potential of a unified representation could be fully expressed in the framework of diffuse heritage. An example of research in this field is the Main.10.ance project [49] for the creation of a tool to support the planned maintenance of Sacri Monti, located in northern Italy and Switzerland. By overcoming the limitations that still persist between these data structures, between data formats, models, definitions, etc., geographic domain ontologies could support many operations, such as the recognition of historical monuments, the identification of parts of buildings and cities, the extraction of information of various kinds, and so on.
Moving to the architectural scale, data models commonly used to describe buildings were developed in the fields of BIM and GIS in early 2010. The Industry Foundation Classes (IFC) of Building SMART International (2013) for BIM and the Building LoD 4 module of CityGML for GIS are the most well-known on both sides, combining geometry, semantics, and topology.
It is worth mentioning, however, that while the IFC effort goes in the direction of integrating BIM into GIS, which is mainly referred to the integration of geo-localization in an almost unchanged BIM structure, CityGML goes in the opposite direction, aiming to integrate GIS into BIM by characterizing architectural and mobile detailed information of the building in a geographic scope [61].
A separate case is the IndoorGML standard [62] published by the OGC, which is explicitly dedicated to indoor 3D navigation. In this standard, the new cellular space concept is one of the main differences with respect to those cited before. Different from IFC and CityGML, which aim to represent the architectural elements of the building, IndoorGML focuses on the spaces, on the characterization of voids rather than solids, and can be considered a complementary model to existing models rather than an independent one, based on the assumption that their integration can give a synergistic effect.
Mapping experiences between these data models found in the literature, such as in [63,64] and further explored in the OGC Discussion Paper for the “Extensions of IndoorGML 1.1—Indoor Affordance Spaces” [65], define correspondences between various hierarchical representations of space proposed by different standards for building models, among which are CityGML LoD 4 and IFC. The terms defined are Building, BuildingPart, Storey, BuildingUnit, and Room. Moving on to the representative level of detail of the interior space, the CellSpace class defined in IndoorGML can be related to the Room class of CityGML or to the IfcSpace in IFC.

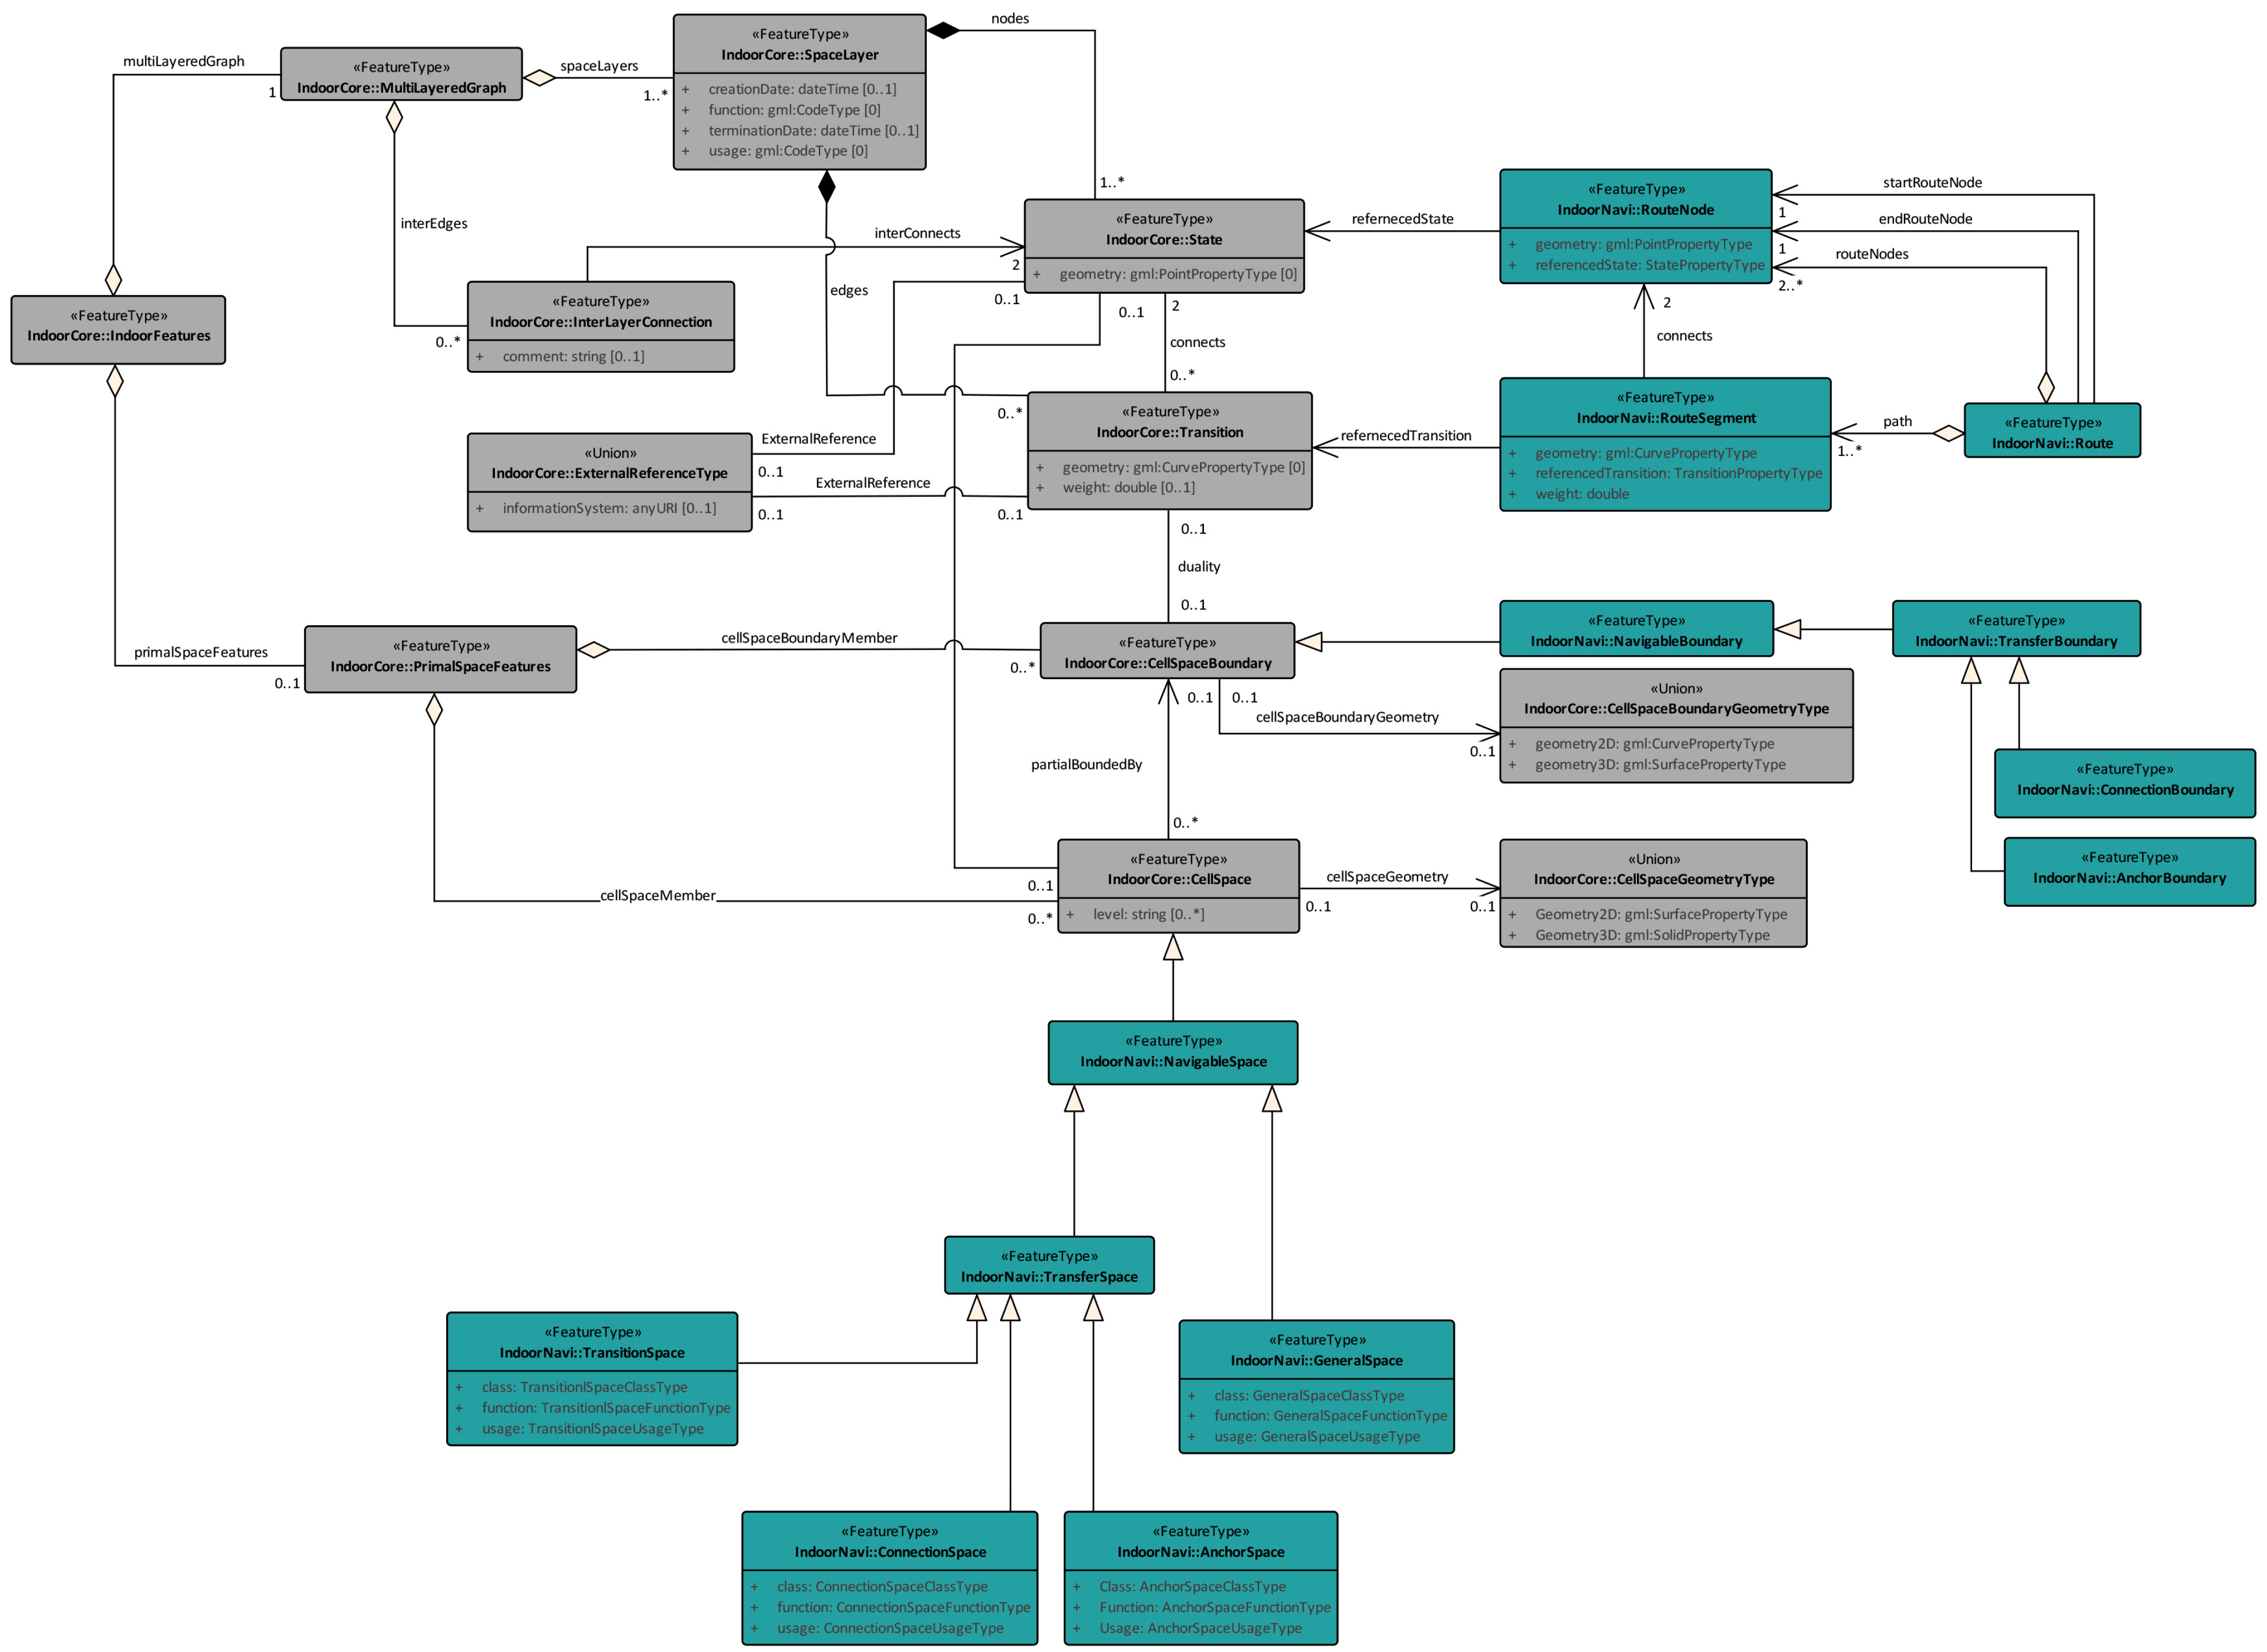
3.1. Semantic Representation in IndoorGML

As shown in the UML diagram presented in Section 6.1, there are two components of the IndoorGML standard. The first component is the Core Module, which is responsible for the description of geometry and topology connectivity. The second component is the data model used in the navigation process. The first-level semantics of the IndoorGML Navigation Module distinguishes between NavigableSpace (rooms, corridors, doors) and NonNavigableSpace (walls, obstacles). Navigable spaces are those used to define the navigation network and are additionally specialized into GeneralSpace (e.g., ordinary rooms), ConnectionSpace (e.g., openings), and TransitionSpace (e.g., corridors). GeneralSpaces are the spaces in which people stay, while TransitionSpaces are those that people use to move from one GeneralSpace to another. To map the characteristics of the interior space, each space class has defined attributes ClassType, FunctionType, and UsageType (the same applies to the Room class of CityGML):
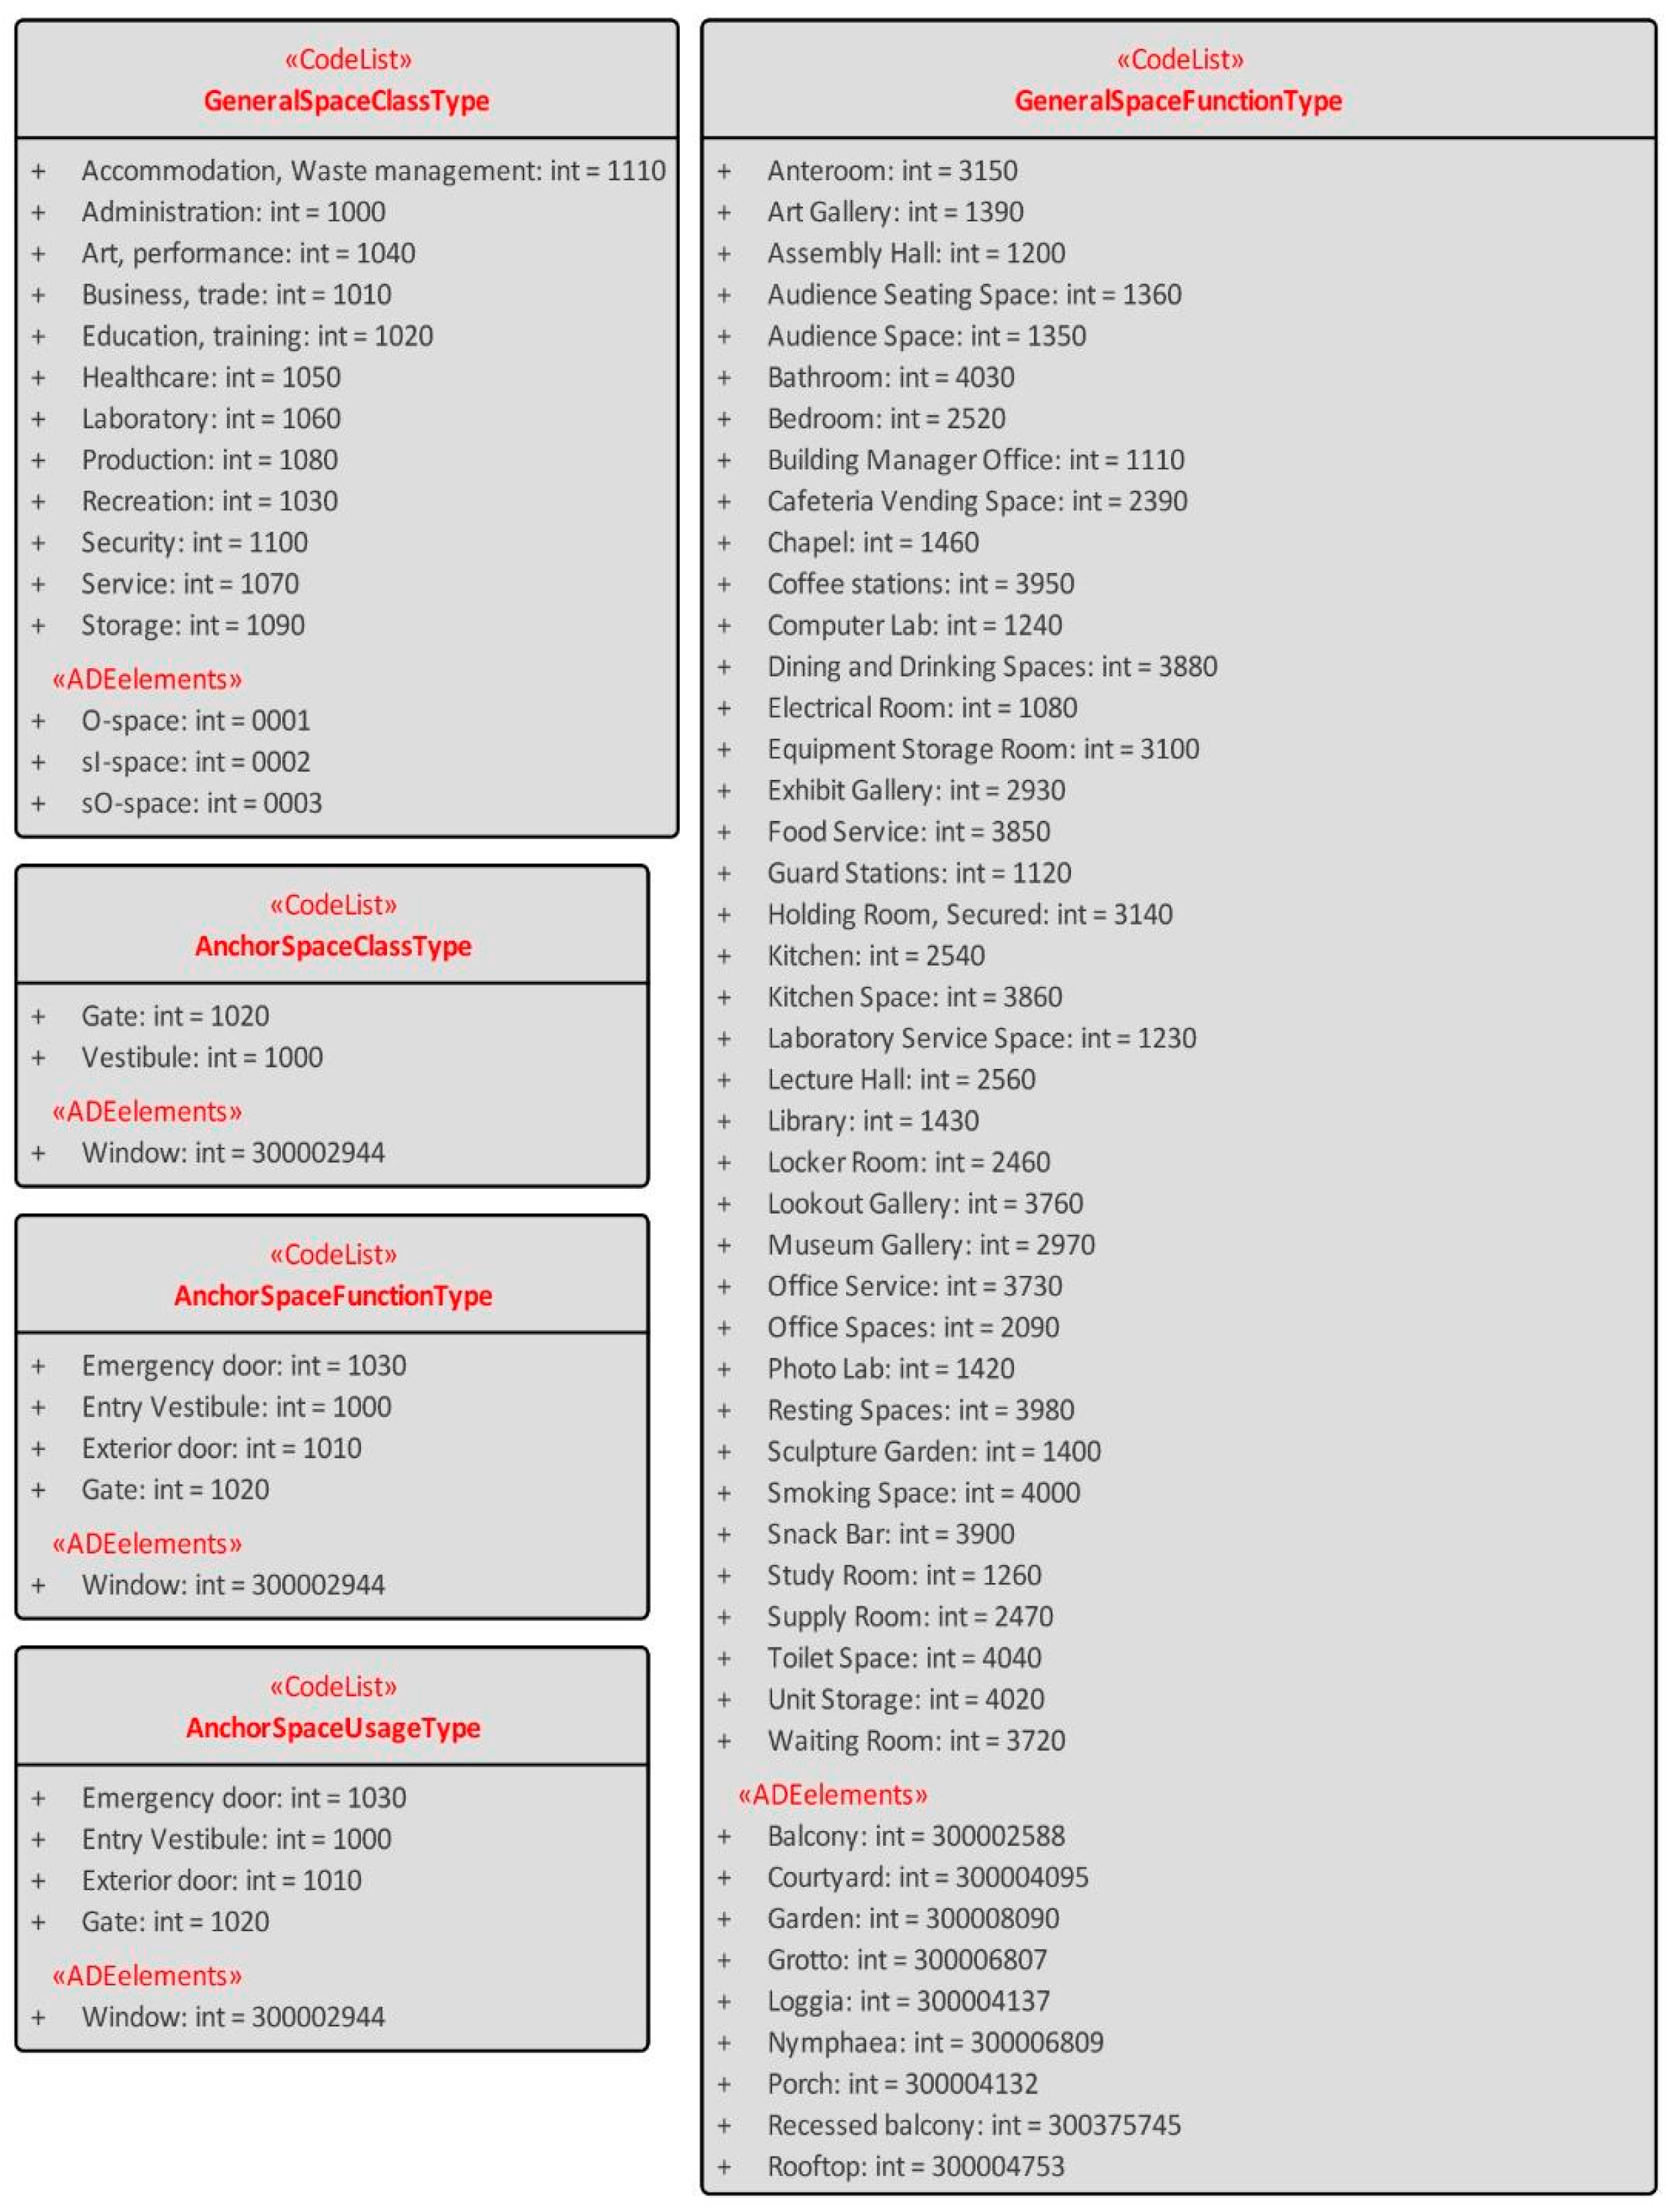
  • The ClassType attribute allows spaces to be classified according to their defined function, e.g., museum or administrative rooms;
  • The FunctionType attribute expresses the main purpose of the space, e.g., living room or kitchen;
  • The UsageType attribute may be used if the way the space is used differs from the function.
IndoorGML provides (see in Annex D, Informative, Example of CodeList) CodeLists for specifying the values of these attributes. The proposed CodeLists are derived from OmniClass Tables 13 tables ‘Spaces by Function’ and Table 14 ‘Space by Form’ [66].
Diakité et al. [67] presented the proposal for the second version of IndoorGML (IndoorGML 2.0), which is still being prepared. Some of the main changes include the redefinition of the notions of TransferSpace and GeneralSpace: the TransitionSpace, ConnectionSpace, and AnchorSpace classes are removed, and TransferSpace is thus simplified to just doors, but also windows, while everything else will be considered as GeneralSpace, as well as what was previously Horizontal and Vertical Transition; the introduction of the level attribute in the CellSpace class; and many other changes.

3.2. Geometric Representation in IndoorGML

Geometrical information can be included in IndoorGML in different ways. In particular, there are three options for representing the geometry of a cell in IndoorGML:
  • As an External Reference to objects defined in other datasets (e.g., to geometric information defined in CityGML, IFC, etc.);
  • As an explicit representation of the geometry in IndoorGML;
  • Or it is possible that no geometric information is included at all.
In the case of an explicit representation, the geometry can optionally be defined in IndoorGML as a 2D or 3D object, according to the data model defined by the standard ISO/TC211 19107) [56]. It is then possible to represent the geometry of a cell as GM_Solid in 3D or as GM_Surface in 2D.
Furthermore, the IndoorGML model provides two ways of subdividing an interior space into cells. The first is when cells are defined as coinciding with the interior space of rooms, walls are excluded and doors are also represented as cells, thus with a thickness and a relative vertex of the navigation graph; this representation is called the thick wall model. In the other option, called thin- or paper-wall model, cells are defined to coincide with a centerline in the middle of the walls themselves, the walls are ignored, and the cell contains part of the wall thickness; in this case, the navigation graph only connects the cells and there is no need for doors to be modeled explicitly [68]. Semi-automatic workflows for generating the thin- or paper-wall model from architectural plans have been presented in the literature [69], and, furthermore, the thin-wall model is closely related to other types of applications involving this representation [70], such as Indoor OSM, Google Maps Indoor, Apple, and OGC IMDF for which data interchange studies have already been proposed [71,72]. However, the thin wall/door concept is going to be excluded from the new version 2.0 of IndoorGML as proposed in [67].

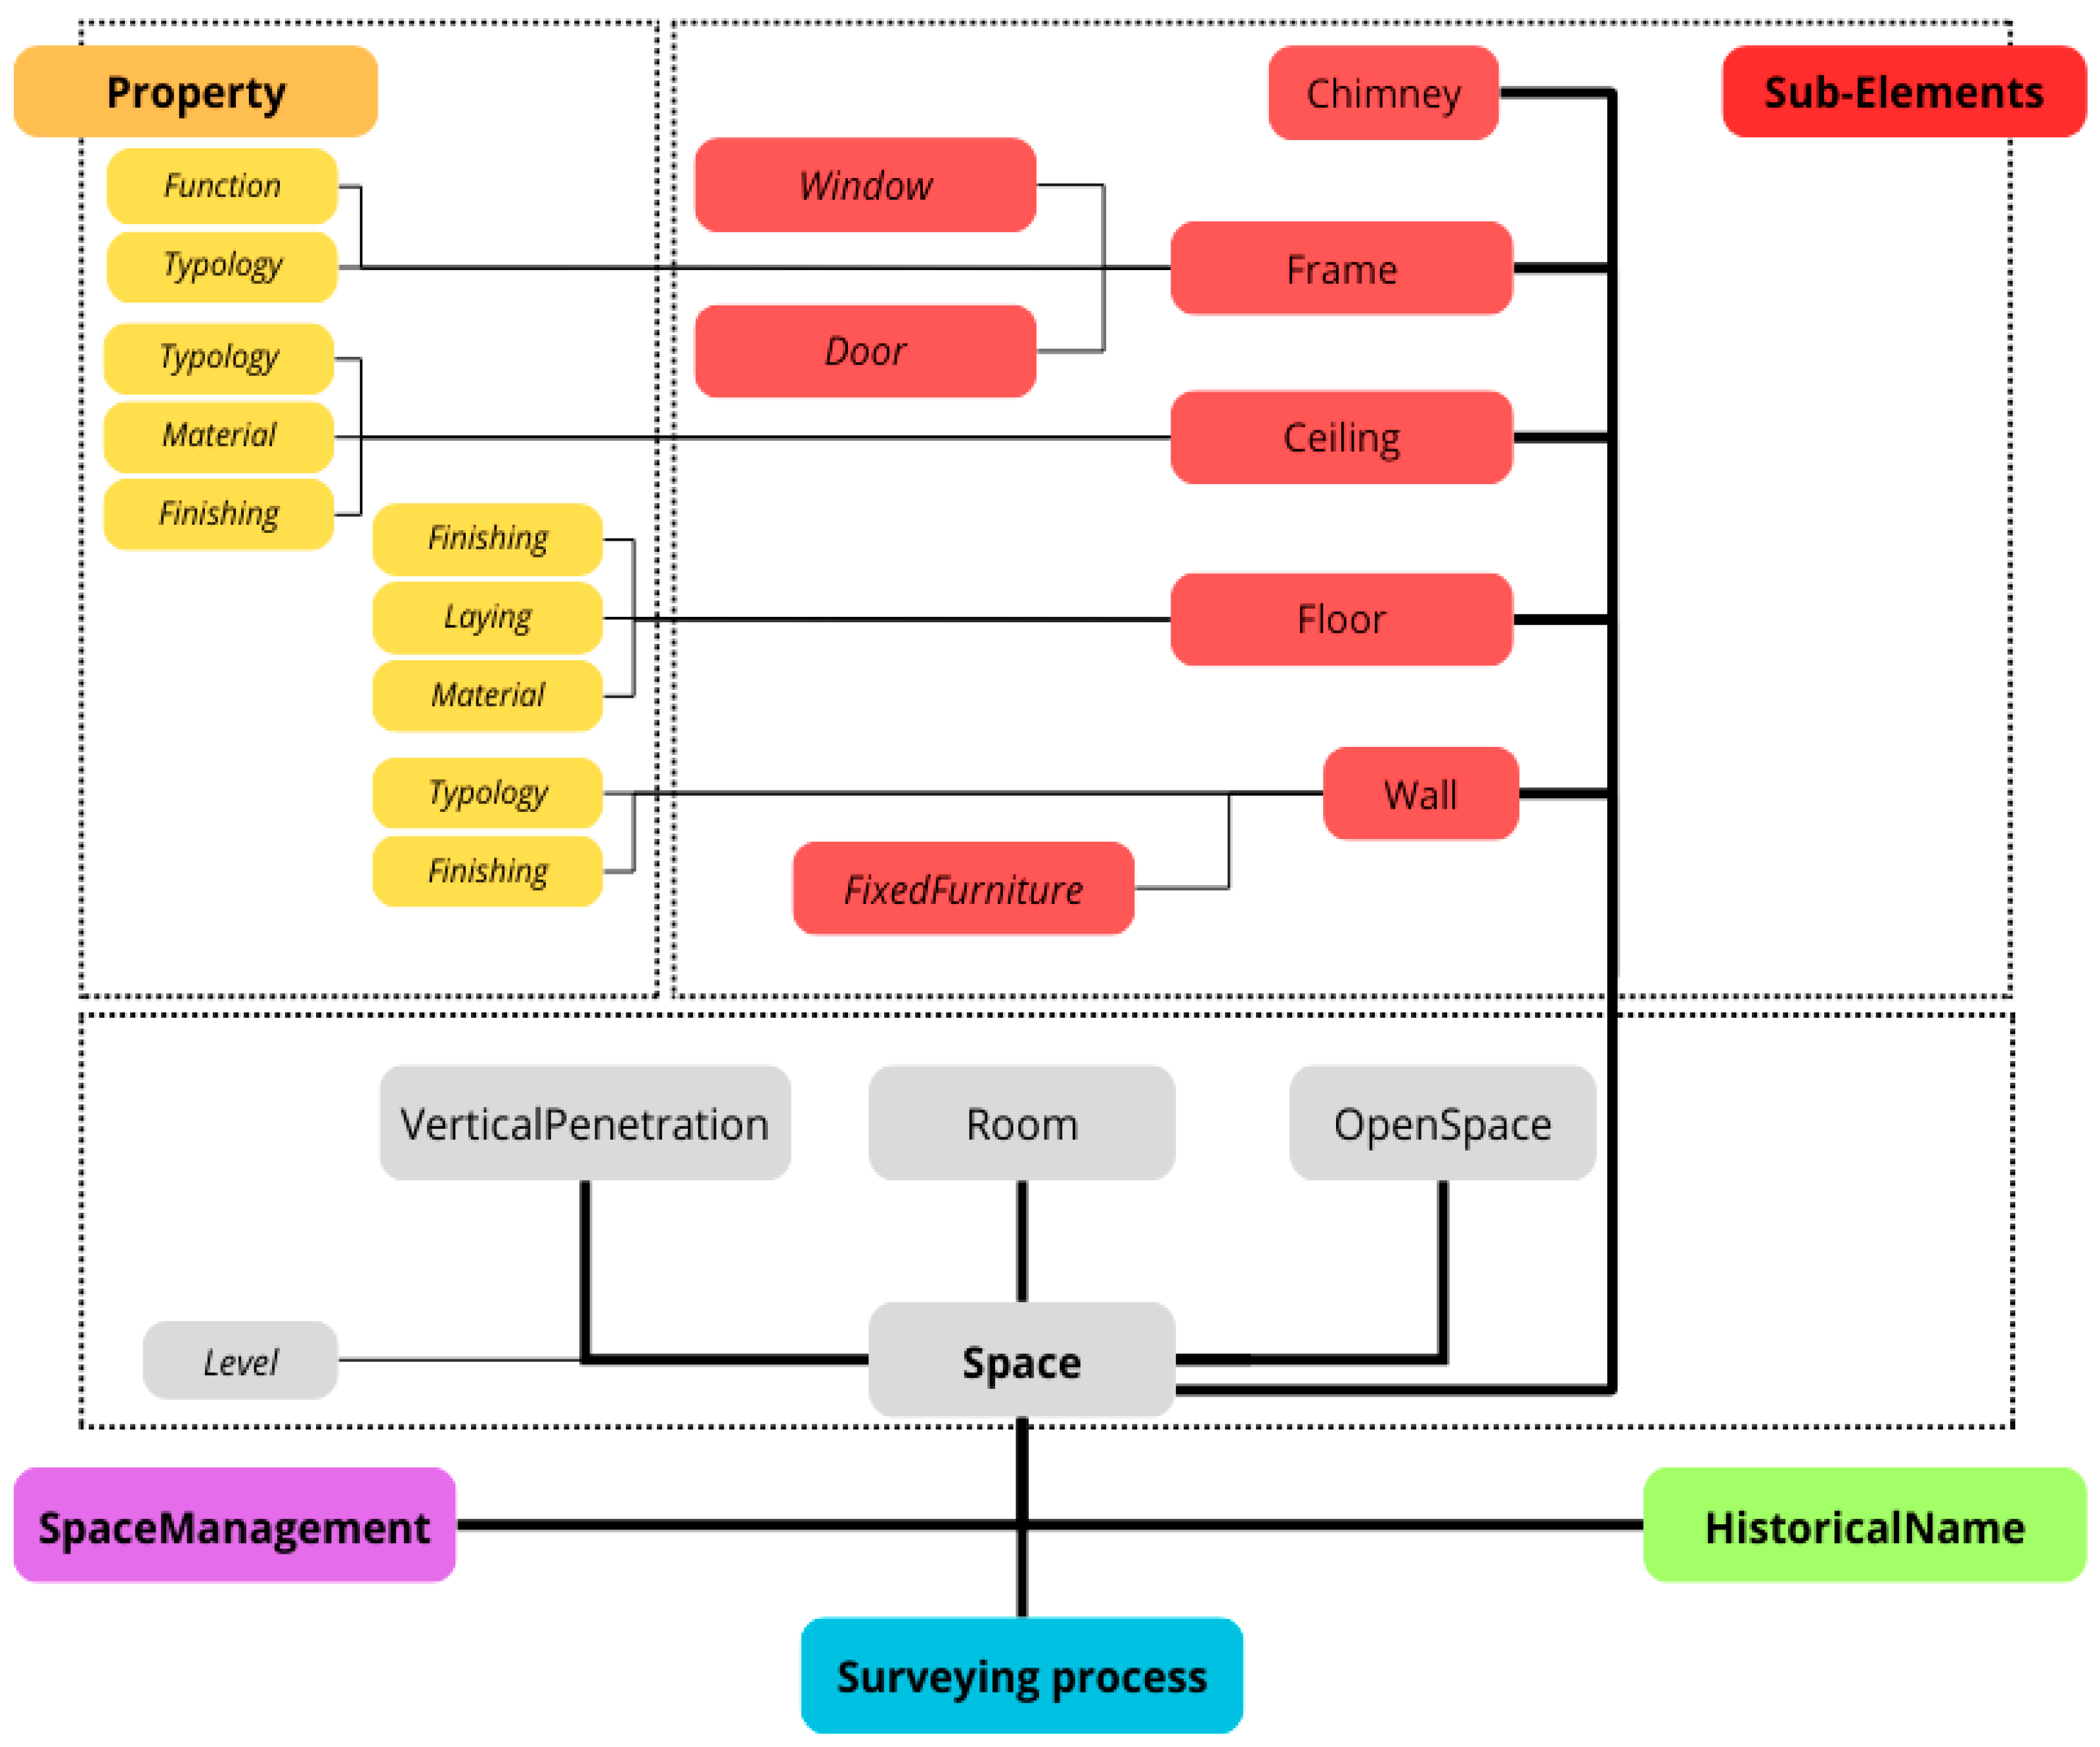
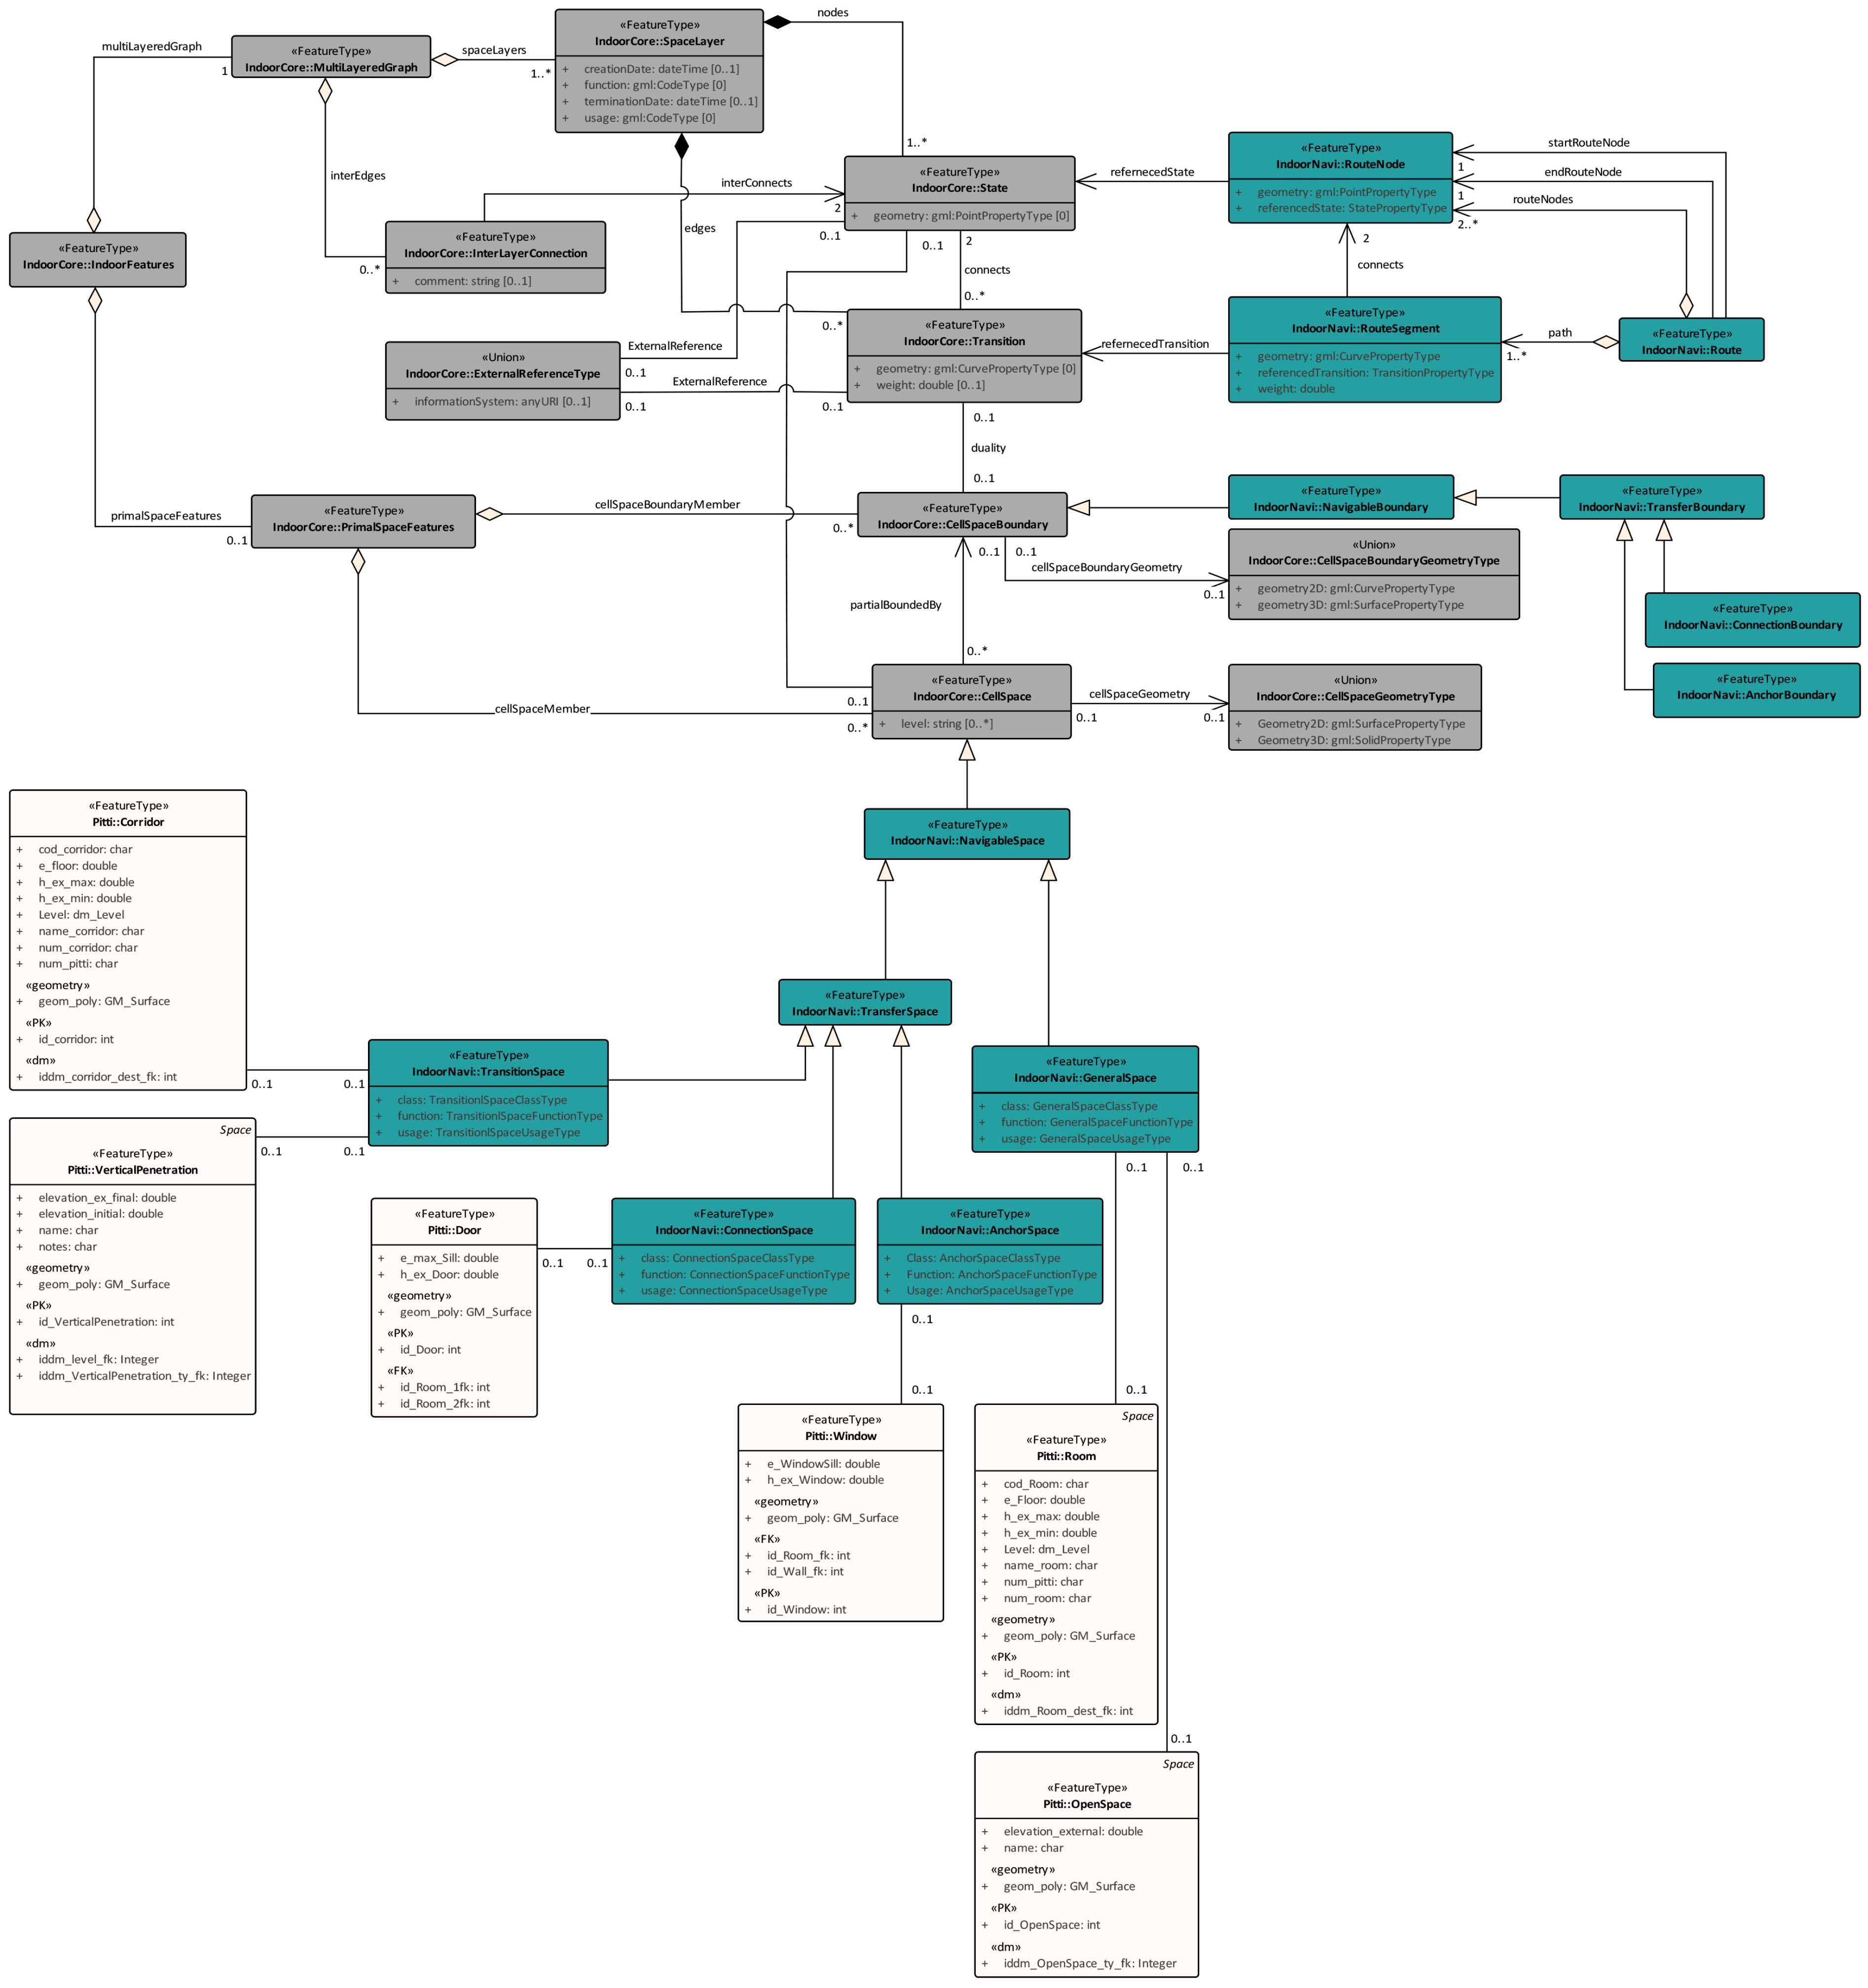
4. The “Pitti Data Model” Design

The initial approach was case-specific and focused on detection and documentation, without regard to existing information standards. Figure 3 shows the full UML diagram, and Figure 4 provides a summary graph of the same UML diagram. The geospatial elements are related to the following:
  • Management aspects, referred to past and contemporary uses,
  • Historical aspects, related to the naming of spaces over time,
  • Three-dimensional survey process related elements.
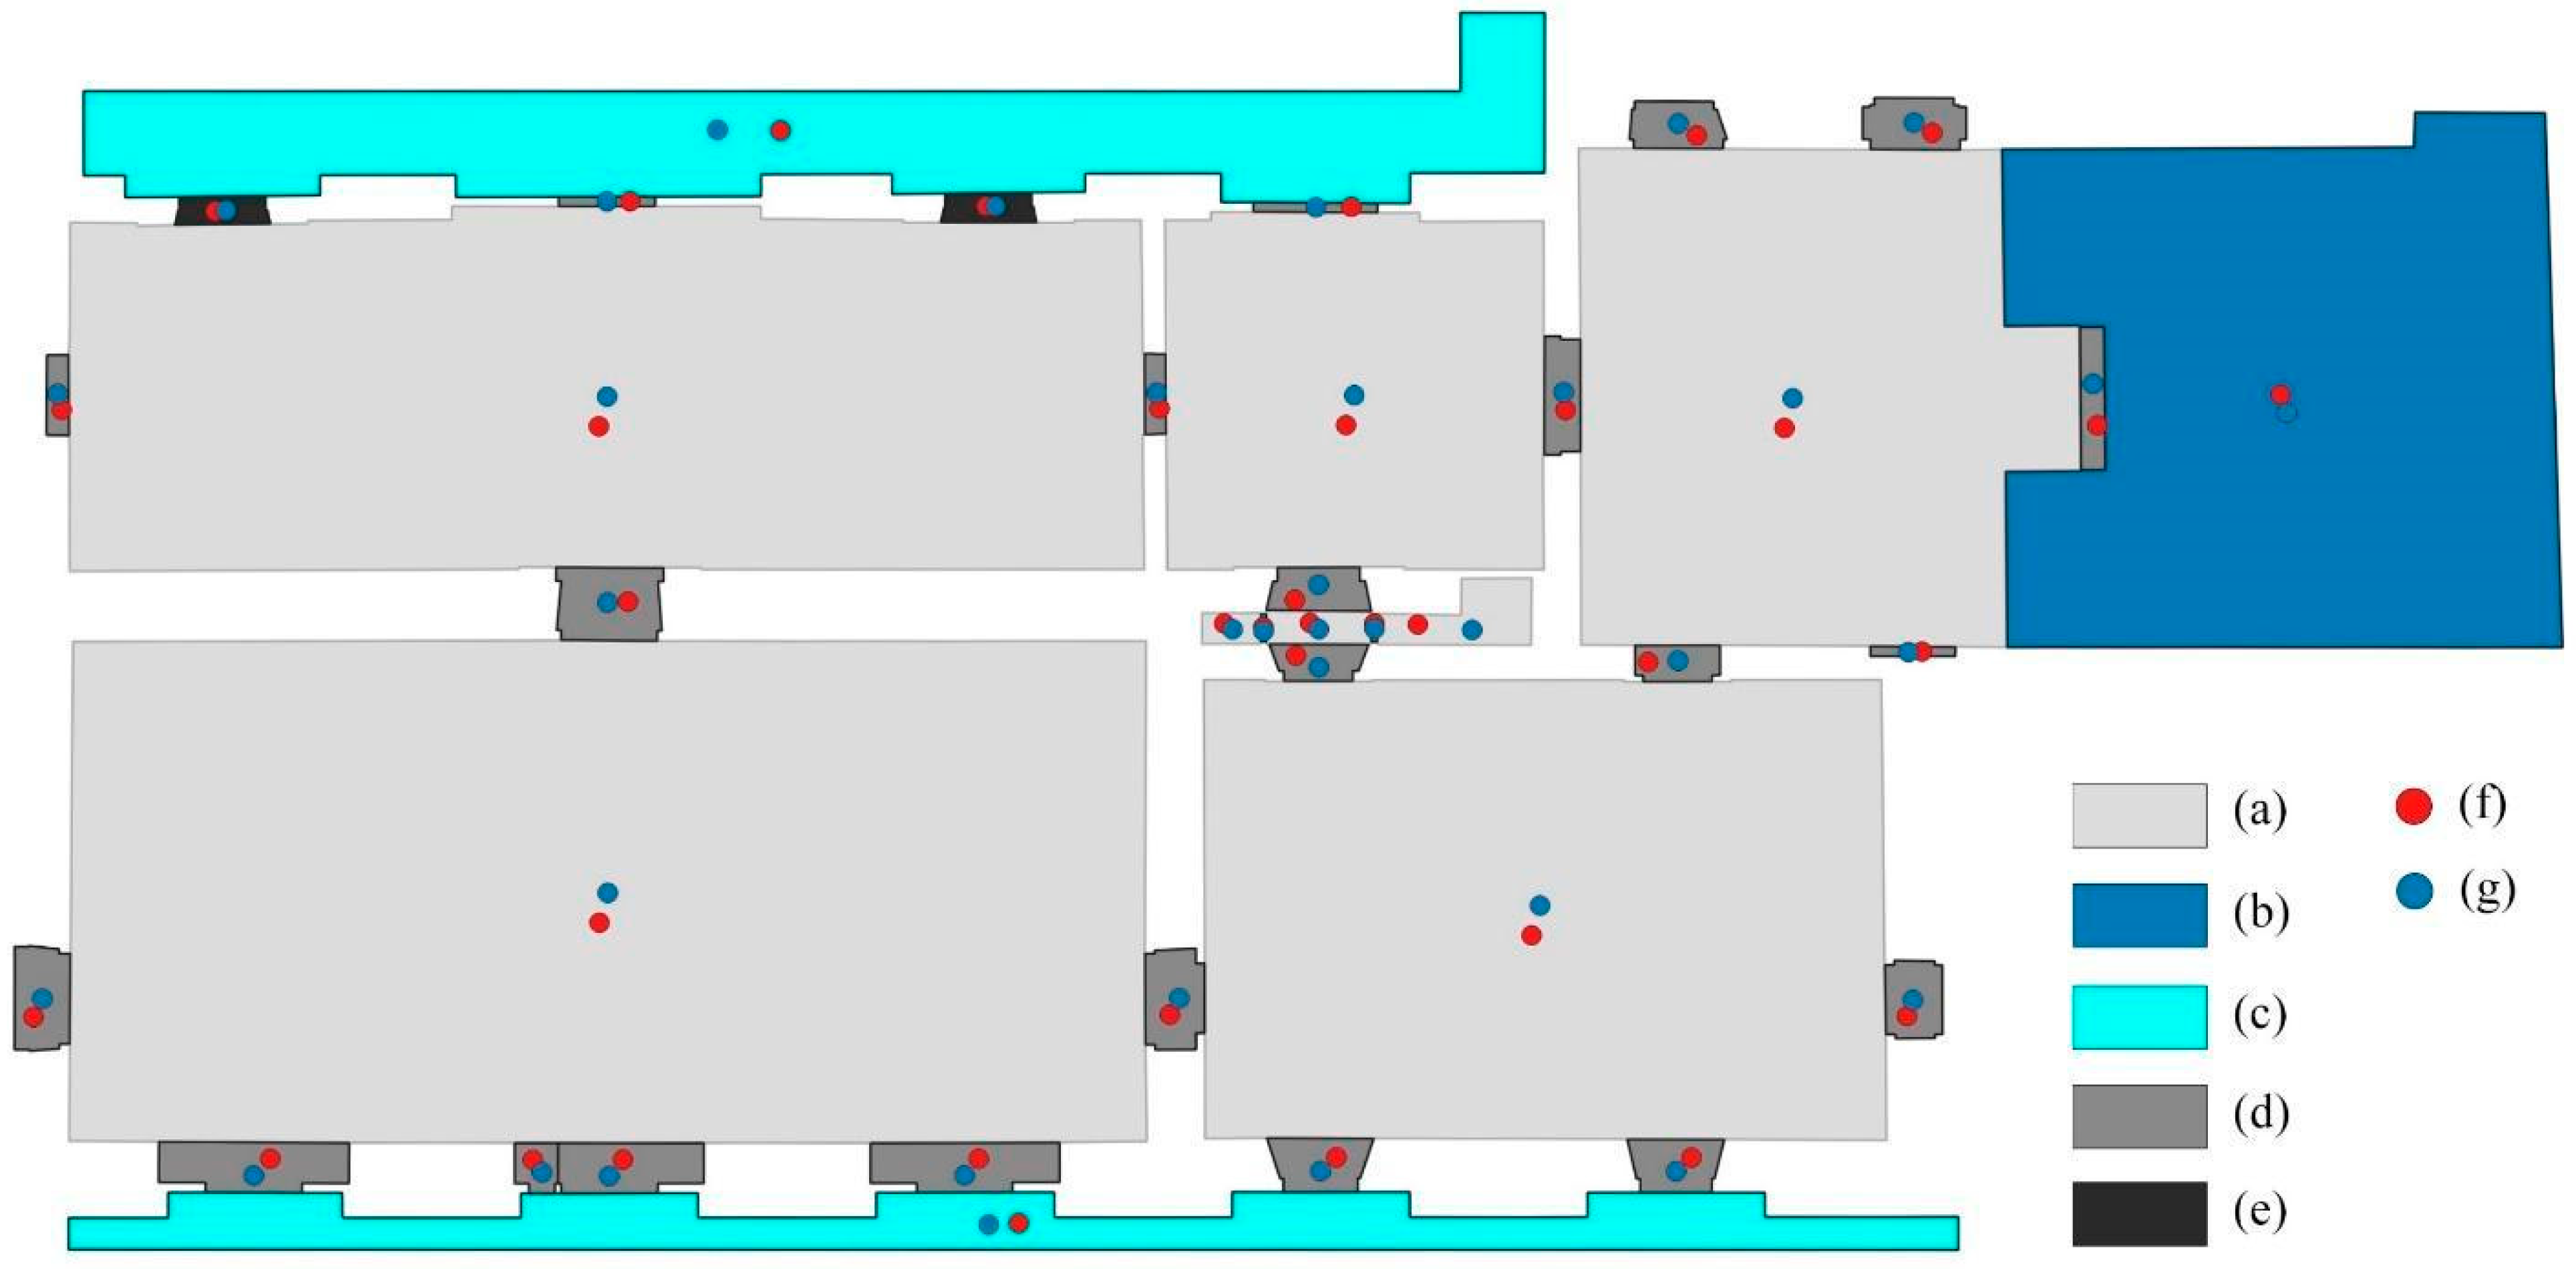
Pitti Palace is not a single administrative entity but rather a complex system that hosts various institutions with different functions. The museums within the complex—the Palatine Gallery with the Royal Apartments, the Gallery of Modern Art, the Museum of Fashion and Costume, the Treasury of the Grand Dukes, and the Museum of Russian Icons—all fall under the management of the Uffizi Galleries. While they shared spaces, visitor routes, and resources, they each operate according to specific logics of conservation, exhibition, and public engagement. In addition to these museums, the palace also houses other administrative authorities, such as the Superintendence of Archaeology, Fine Arts, and Landscape for the metropolitan city of Florence and the provinces of Pistoia and Prato, as well as a police station, highlighting the diversity of functions that coexist within the building. This layered management structure makes any intervention—whether restoration or digitalization—a complex operation that must take into account multiple stakeholders, constraints, and requirements.
In addition to managerial complexity, historical and architectural complexity also plays a crucial role. The long history of the palace and its many uses over time have led to continuous transformations, both in the distribution of spaces and in their nomenclature. Each era has left its mark, altering not only the physical structure of the complex but also the way its spaces have been perceived and named. The buildings, apartments, and rooms have been adapted over time to meet the needs of their inhabitants and users, making the clear and unambiguous identification of spaces a challenge.
The need to uniquely identify spaces, define their relationships, and enable the connection of progressively collected data emerged from the very beginning of the 3D digitalization project. Surveying such an extensive and complex site cannot be seen as merely the sum of a series of data collected over time but rather as a structured operational process that requires coherence and integration between its various components.
Given the scale of the building and the diversity of stakeholders involved in its management and current use, identifying a room solely based on traditional toponyms—now widely used in daily operations—has proven to be ineffective. Some names are derived from historical events or figures (e.g., “Queen’s Chamber”), others reflect more recent uses (e.g., “Superintendence Archive”), while others refer to decorative elements or objects present in the rooms (e.g., “Stove Room”).
The need for recording and managing large quantities of both structured and unstructured data led to the definition of an ad hoc data model supporting the development of an information system. Considering that the main focus of the project is on geo-spatial aspects, it is, to be precise, a spatial information system.
For the preliminary referencing of all information, both metric and thematic, being recorded, an element corresponding to the “minimum spatial unit” was identified and named “Space”. Given the variety of spaces present, a hierarchical approach was adopted, resulting in the identification of three sub-elements based on common geometric characteristics while neglecting dimensional and functional aspects:
  • Room: a generic internal space of the building;
  • VerticalPenetration”: volumes that intersect multiple levels of the building and serve a distribution function within the building or system;
  • OpenSpace”: open but defined spaces, not completely enclosed but still spatially defined.
Based on this classification, “Room” includes exhibition halls, technical rooms, and distribution spaces that develop on the same level (Corridor), as well as unused interstitial spaces that have developed due to the transformation operations that occurred in the building (Cavity). The sub-element “VerticalPenetration” includes all stairs (Stairway), both monumental and service stairs, elevator shafts (ElevatorShaft), and spaces occupied by various types of systems, as primarily heating, ventilation, and air conditioning (HVAC shafts). Finally, courtyards, balconies, and loggias are examples of “OpenSpace”.
The data model was implemented using Enterprise Architect software (by Sparx Systems) [73] and is illustrated in its entirety in Figure 3.
As addressed in more detail in the following paragraphs, Figure 4 summarizes the same data structure for greater clarity, grouping them into thematic macro-areas: the initial core of the data model (referring to spaces, in grey) enables the cataloguing and classification of spaces, similar to what was carried out in the past, for example, in [74] or, further back in time, in the eighteenth-century cabrei (inventories of the property of noble families, consisting of maps and other documents) that specify the name and coded numbering of each room. Connected to this are types of elements that describe functional and usage aspects, such as the historical names of spaces and the managing entities of the spaces (in green and purple). In blue are the entity types that describe the surveying process, while in red and yellow are all the sub-elements that compose the spaces and their properties.

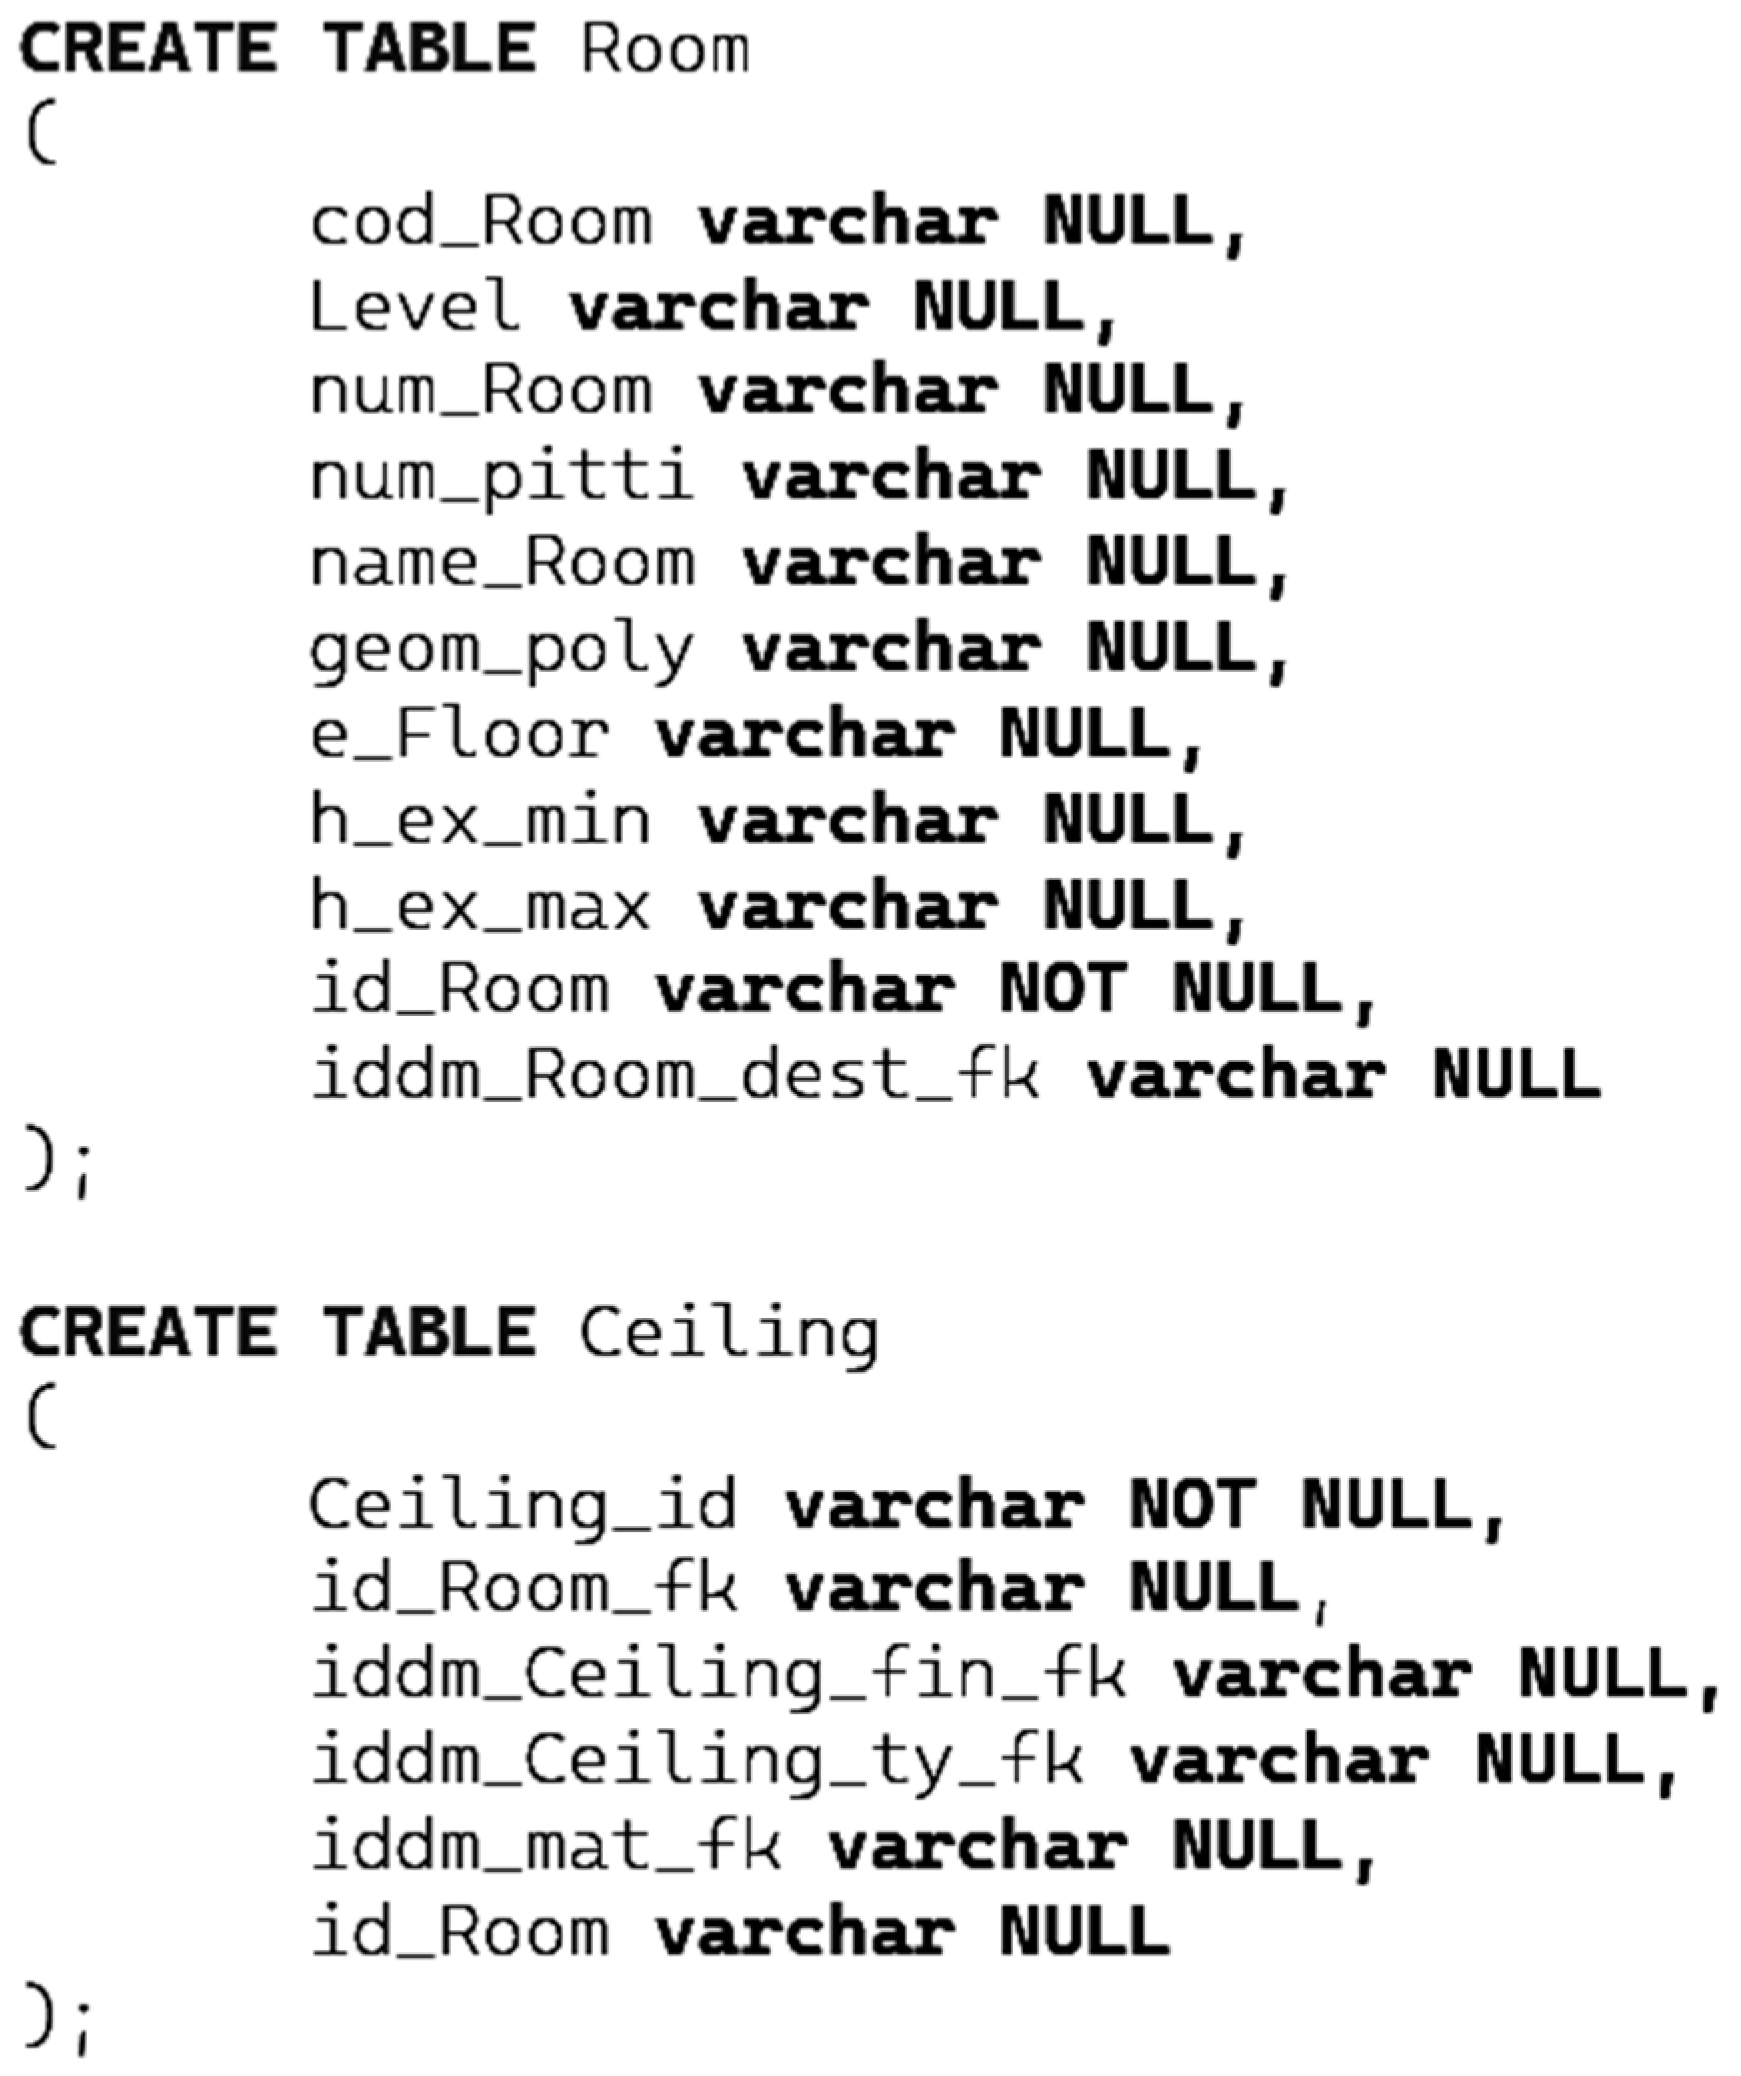
4.1. Data Structure: From the Conceptual to the Physical Model

Starting from contents coming from the survey phase, a specific design activity was set up to organize information in a Geospatial Information System. The identified requirements focus on analyzing what data need to be stored, how they will be organized, and what operations will be performed on them.
The first step was addressed to define a conceptual model of information.
The reference model has considered objects as a transposition of the real work we need to manage. This model is independent of any specific database management system (DBMS). Information is organized in UML Structural Diagrams depicting elements of a system that are independent of time and that convey the concepts of a system and how they relate to each other. The elements in these diagrams resemble the nouns in a natural language and the relationships that connect them always show structural or semantic relationships. Contents are organized in Class of Objects and their Attributes. The class is the basic logical entity in the UML. As a structural unit of the model, it is defined by attributes.
Attributes represent the properties or characteristics of the entities. Attributes provide detailed class information and are essential for data storage and retrieval. The model approach was aimed at normalizing our data model to reduce redundancy and improve data integrity. This involves organizing the data into multiple tables and establishing relationships to eliminate data duplication. Homogeneous objects are then collected in classes and described by common properties organized in attributes. A specific property of a class of objects is a geospatial component that defines information about the geometrical or topological attribute of this class. As a result, each object class can be characterized either by geospatial or non-geospatial information. The different classes can be related or aggregated to each other through relationship classes. Among geospatial components belonging to different classes, specific geospatial constraints can be defined, according to the adopted spatial schema (ISO/TC211 19107) [56]. The conceptual model refers to the ISO/TC211 19101-1 reference model [75]. The application schema derived from the previous approach was formalized thanks to UML and, using the Enterprise Architect software with the foundation schemas, made available in the consolidated INSPIRE model [76].
A GML (Geography Markup Language) [55] Application Schema was defined as the model-based engineering of spatial data and geodatabase designs to aid in the development of a GIS. It is an interoperable spatial data model using Open Geospatial Consortium’s Geography Markup Language according to INSPIRE data specifications. Contents are described through FeatureTypes, DataTypes, CodeLists, and other geographic information. The GML Application Schema can be used in other third-party applications. Structural objects are here represented by FeatureType, in turn, defined by attributes whereby Type could be a default data type (String, Integer, Boolean, etc.), DataType (with prefix “dt_”, aggregation of one or more properties in turn detailed), or CodeList (with prefix “dm_”, list of encoded domain values).
The next phase was addressed toward a model transformation as a user-initiated function that transforms one or more Platform Independent Model (PIM) elements into their corresponding Platform Specific Model (PSM) elements. The logical model integrates our application schema with information that considers how to decline contents in case they are implemented in an object-relational database. To be more specific, in this process, the implementation of class identifiers and the primary-foreign keys were defined, the code lists were detailed, and the relationship class was specified through cardinalities and behaviors. The DDL (Database Definition Language) transformation was selected considering the PostgreSQL database [77]. The Code Engineering DDL was generated considering a variety of objects including database Tables, Views, Functions, Sequences, and Procedures. Figure 5 shows an example of the SQL code for the “Room” and “Ceiling” classes. This is a time-saving mechanism that reduces errors that can be introduced by operating manually.
The translation of conceptual and logical models into physical implementations was performed in Enterprise Architect through customized templates that define how UML constructs are converted into the objects in the targeted PostgreSQL DBMS. The creation of the physical database thus outlines how the data are implemented by defining data types, constraints, indexes, and other database-specific details. A Database Schema Generation was therefore created thanks to Enterprise Architect’s features that generated the SQL code for creating the database schema based on our physical data model. This code can then be executed on PostgreSQL to create the actual database. Some other specific triggers were then defined, as well as all the topological constraints between classes, because the Object Constraint Language (OCL) adopted for UML model could not be translated from the logical phase.
The database was physically implemented in PostgreSQL/PostGIS; however, this choice is not binding, as the conceptual model focuses on content modeling independently of the technological platform and the IT infrastructure adopted. The physical modeling, while derived from the conceptual one, must instead be adapted to the specific characteristics of the software that will host the data, taking into account the features of the specific database in which they will be stored.

4.2. Element Types That Describe Functional and Usage Aspects

An identification code is assigned to every “Space” data element and, if available, the name currently in use is indicated (e.g., Sala Verde, Sala delle Nicchie, Sala di Venere, etc.). Moreover, the level of the space’s affiliation is specified (in the case of “VerticalPenetration” the codes for the starting and landing levels of the vertical system are provided). The floor elevation and the ceiling height of the space are reported as well in all the spaces: where not uniform, both the minimum and maximum heights are reported, corresponding, in the case of vaulted spaces, to the heights at the spring line and the keystone.
Considering that some of the spaces in the palace have been referred to over time by different names (for example, Sala Bianca, or Sala degli Stucchi, formerly known as Sala dei Forestieri), a class called “HistoricalName” has been defined. This class also establishes the time limits for the use of each historical name, so that the multiple names attributed to spaces over time can be recorded.
The introduction of temporal concepts within the data structures related to the built heritage context raises several design and implementation issues. For example, many data models are developed as current state models; that is, when a change occurs, the knowledge of the previous state is discarded and replaced by data on the new current state [78]. To develop a data structure that can adequately represent and manage the multiple transformations that have affected and will continue to affect the asset over time, it is necessary to consider how to handle information versioning, the traceability of changes over time, and the consistency of historical data, both in terms of semantic aspects and physical/geometrical transformations. These are all aspects related to the fourth dimension, which will be explored in more detail in future developments.
Pitti Palace houses several museums (Palatine Gallery and Royal Apartments, Gallery of Modern Art, Fashion and Costume Museum, Grand Dukes’ Treasure Museum, Museum of Russian Icons) and other entities, such as the headquarters of the Superintendence of Archaeology, Fine Arts and Landscape for the metropolitan city of Florence and the provinces of Pistoia and Prato, as well as a police station. To describe who is responsible for the management of a specific “Space”, a class called “SpaceManagement” is defined, with a CodeList that lists the entities currently utilizing various parts of the palace.

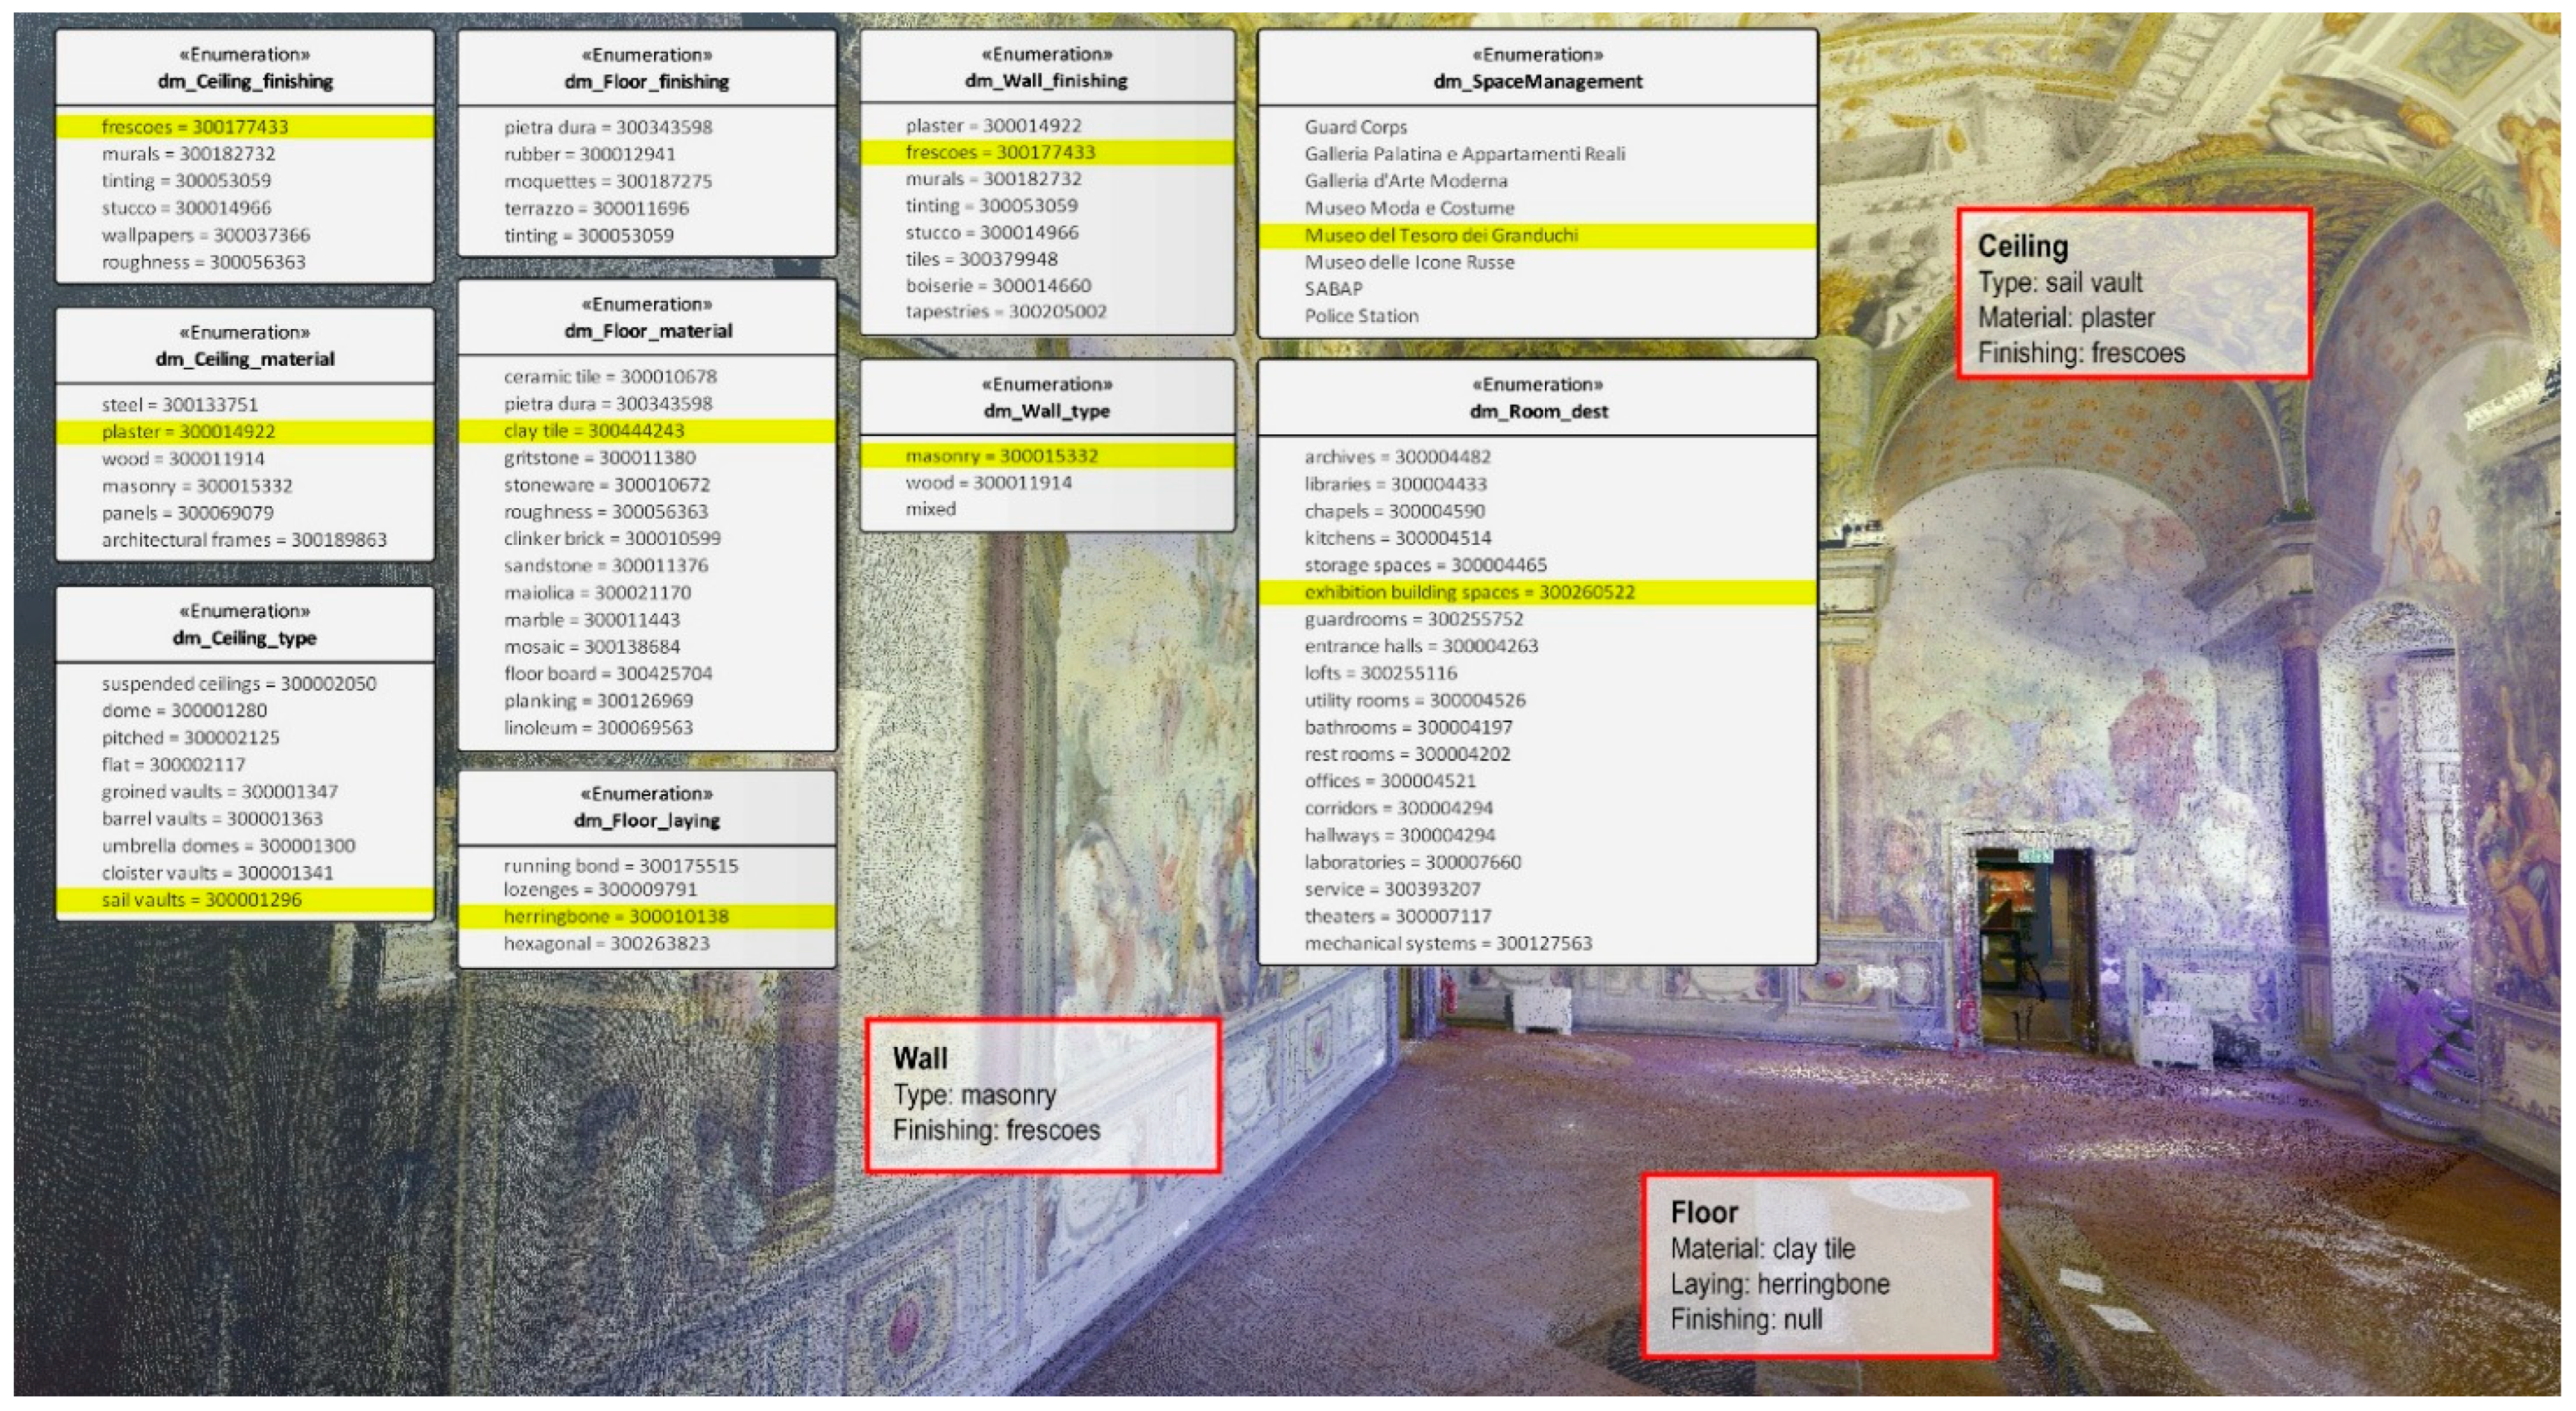
4.3. Element Type That Describes the Geometric and Material Consistency of Objects and Surfaces

Regarding the description of the architectural consistency of the spaces, the geometric information is derived from the CAD drawings, as described in Section 5.1, starting from the class related to internal walls (“RoomBoundary”), which is linked to the classes of openings (Windows” and “Doors”). As explained further in the next paragraph, the number and type of frames were coded, recorded, and archived under the class “Frames”. Each frame is also connected to the codes of historical records that have been catalogued over time.
In addition to the geometric aspects derived from the 3D survey, information regarding materials and their state of conservation was recorded, creating a sort of “data mart” to structure the data in the most complete and comprehensive way possible. In fact, thematic data are characterized by a significant heterogeneity both on the technical (in terms of file structure, file format, data typology, and data sampling rate) and on the informative (e.g., historical data, material properties, diagnostic analysis, etc.) point of view.
For the floors (managed by the “Floor” class), the type of material (ceramic tiles, clay tiles, marble, etc.) was recorded (“dm_Floor_mat”), along with the laying pattern (straight, herringbone, diagonal, etc.) (dm_Floor_lay) and the type of finish, if present (carpet, etc.) (“dm_Floor_fin”).
Similarly, for the “Ceiling” class, the type of covering was indicated (“dm_Ceiling_ty”) (flat vaults, barrel vaults, cross vaults, etc.), along with the material (“dm_Ceiling_mat”) and the type of finish (“dm_Ceiling_fin”). The same approach was applied to the “Wall” class, relating it to descriptive classes of structural typology (dm_Wall_ty”) (masonry, wood, etc.) and the type of wall finish (“dm_Wall_fin”) (frescos, wainscoting, tapestries, etc.).
Additionally, classes were defined for other types of secondary elements, such as “FixedFurniture”, which includes all the furniture integrated permanently into an environment, specifically designed to fit the space in which they are located and not intended to be easily moved (for example, large wooden winches used for lifting and moving chandeliers). Another class is “Chimneys”, which refers to the chimneys identified at the roof level and related to the respective fireplaces, stoves, and ovens present on the lower floors.

4.3.1. Frames

For each opening in the palace, whether external or internal, a unique identification code was assigned, consisting of the code for the level to which the opening belongs and a sequential number, enabling the collection of various information. Specifically, for internal openings, the two spaces connected by the opening were recorded, while for external openings, only the space the opening faces was noted. Given the variety of situations within the palace, the type of each opening was also specified, indicating whether it is pass-through, walled up, or non-operable. In some cases, even without actual walling, various obstacles prevent passage through certain doors, such as the placement of large paintings in exhibition rooms or other barriers blocking doors that were once accessible.
It is common for an opening, whether a door or window, to have multiple frames. To catalogue these comprehensively, an additional code was introduced to the opening’s identification code. For example, code “330111a” identifies the shutter of window “330111,” code “330111b” the first frame, “330111c” the second frame, and “330111d” the blind. Finally, where available, each element is associated with the identification code listed in historical frame records, some of which are engraved on metal tags affixed directly to the frames.

4.4. Element Types That Describe the Surveying Process

To address the practical needs of managing the survey, several descriptive classes were defined for the data acquisition phase and their related storage (scans, target positions, folders of photos captured by drones, etc.), in order to link the acquisition phases with the modeled functional spaces. It should be emphasized that the structure of this section of the data model is influenced by the techniques and instrumentation used for the digitization of the specific case study. The widespread use of mobile scanning systems (wearable or hand-held systems) for surveying the interiors of buildings, the frequent need to integrate data from different sources, and the almost inevitable use of proprietary software, at least in the early stages of data processing, would require generalizing what is proposed here to enhance flexibility and, consequently, the possibility of application in different contexts.

4.5. Adopted Vocabulary

Developing content and data standards for use in the heritage sector is a research topic that has grown in parallel with the technological evolution and the spread of information technology in cultural heritage documentation projects. It becomes then essential to adopt a controlled terminology and to make data machine-readable by indexing data with a unique identifier.
Since the late 1990s, vocabularies and thesauri have been proposed, generically referring to cultural heritage and defined in specific domains [79], and since then they have been integrated and updated, implementing candidate terms and improving data structure, and therefore increasing their widespread use.
At the beginning of the project, all the notes taken in the field were in Italian, but in a short time, the need to define controlled terminology became evident. We therefore defined lists, such as the CodeLists created specifically for the case study, to record all the information related to places, materials, and conservation status. Subsequently, the Italian terms were translated into English and mapped to the entries in Getty’s AAT—The Art & Architecture Thesaurus [80]. In this way, where possible, the terms in the CodeLists of the “Pitti Data Model” were enumerated using the identifiers from the Getty Vocabulary, as shown in Figure 6 [81].

5. The “Pitti Data Model” Implementation

For an initial evaluation of the proposed data model, a section of the Pitti Palace was selected that is limited in size but includes a variety of room types, making it significantly representative. Additionally, the test area is located in the 15th-century part of the palace, thereby presenting a high degree of stratification, both in terms of historical space names and changes in spatial configuration over time—elements that will be further developed in future work.
The spaces in the test area are located on the first and second floors, in rooms directly adjacent to the Ammannati Staircase. Selected areas include the museum entrances to the Palatine Gallery on the first floor and the Museum of Modern Art (GAM) on the second floor. Terraces overlooking the Courtyard of Ammannati on one side and Pitti Square on the other were also included in the test area. This way, all three types of spaces used in the Pitti Data Model (“Room”, “VerticalPenetration”, and “OpenSpace”) are represented in the test area, along with spaces that have particular characteristics specific to this case study, such as cavities (interstitial spaces) and outermost surfaces.
To facilitate the sharing of the point cloud model with all project partners, the point cloud of the test area was uploaded to Potree viewer on a local server [82,83], as shown in Figure 7.

5.1. Geometry Component

The result of the digitization of Pitti Palace was organized, for ease of management, into sub-models (thus, it was possible to manage the total amount of data, equal to 798,235,934,642 points), as previously described in Section 2.2, and uniformly referenced throughout. A primary goal of the project was the creation of vector drawings of plans and sections. Various systems are now available for visualizing point cloud models in popular CAD software [84,85,86], generally allowing simultaneous access by multiple users, various display and shading modes, model portioning, and section plane definitions. In addition to this, the semantic richness of the point cloud model allows it to serve not only as a geometric and dimensional reference of the architecture but also as a detailed record of thematic aspects, furnishings, systems, and movable works [87] contained within it.
In this project, AutoCAD Map 3D 2023 [88] was used coupled with CloudWorx plugin [86] to access the point cloud models managed in Leica Cyclone Enterprise [44]. Prior to the operational drawing phase, the technical specifications to be adopted were defined in order to standardize the work of the various operators and optimize the transfer of necessary information from the CAD to the GIS. This aspect, which was crucial for steering the project toward a GeoDB capable of organizing the information to be queried and analyzed organically, required more effort than necessary for the traditional drawing of plans and sections alone but proved worthwhile for the subsequent work.
In two-dimensional CAD drawings, spatial divisions are represented by flat geometries, while the three-dimensionality of the depicted spaces is conveyed through annotations, such as floor and roof structure elevations or dimensions of openings. Texts and symbols are also used to add semantic information (such as the name and function of a specific space). In this way, CAD drawings record a considerable amount of information about a building, albeit with a simplified graphical representation, using a standardized format composed of primitive geometric elements like points, lines, and arcs. However, these elements are stored in a way that is not necessarily “object-normalized,” as is the case with 3D modeling [89] and, even more so, with BIM [90,91].
We can state that we adopted a representation register [92] that permits a transformation from a semiotic representation (one commonly used in CAD, which refers to the traditional architectural drawing rules) to another (one necessary in GIS, object-oriented).
In particular, for the representation of the survey, an object-oriented data structure was defined to meet the database requirements. For instance, in the case of floor plans, each element of the “Space” class was drawn as a closed polyline, in addition to the traditional graphic representation of the space, which generally includes lines organized in different layers to represent sectioned walls, door, and window thresholds, as well as projections of relevant roof elements. Thus, each room has a polygon suitable for analysis by topological operators, along with lines structured according to traditional architectural drawing conventions (Figure 8).
Having GIS-Oriented Spatial Components created within the CAD reproduction process allows the association of geometric primitives with the object classes they represent, enabling their interrogation with GIS functionalities. From an information digitization perspective, the ability to represent drawing primitives in vector mode makes it possible to incorporate the spatial components of a building’s Geo-Relational Database right from the acquisition phases. Moreover, these vector primitives serve as a source of geometric information that can be utilized for any subsequent processing and reconstruction.
Similarly to what has been carried out in previous research focused on the extraction of relevant geometric entities from CAD drawings, such as [69,71], rules/technical specifications were adopted during the CAD restitution phase. These rules primarily focus on reorganizing the information contained in the floor plans, leveraging the advantages of layer stratification and the block instance functions supported by CAD applications. In other words, the definition of a CAD structure a priori, capable of transitioning into a GeoDB data structure, constitutes the primary input for an organized archive of a complex database, as well as for maintaining its spatial storage.

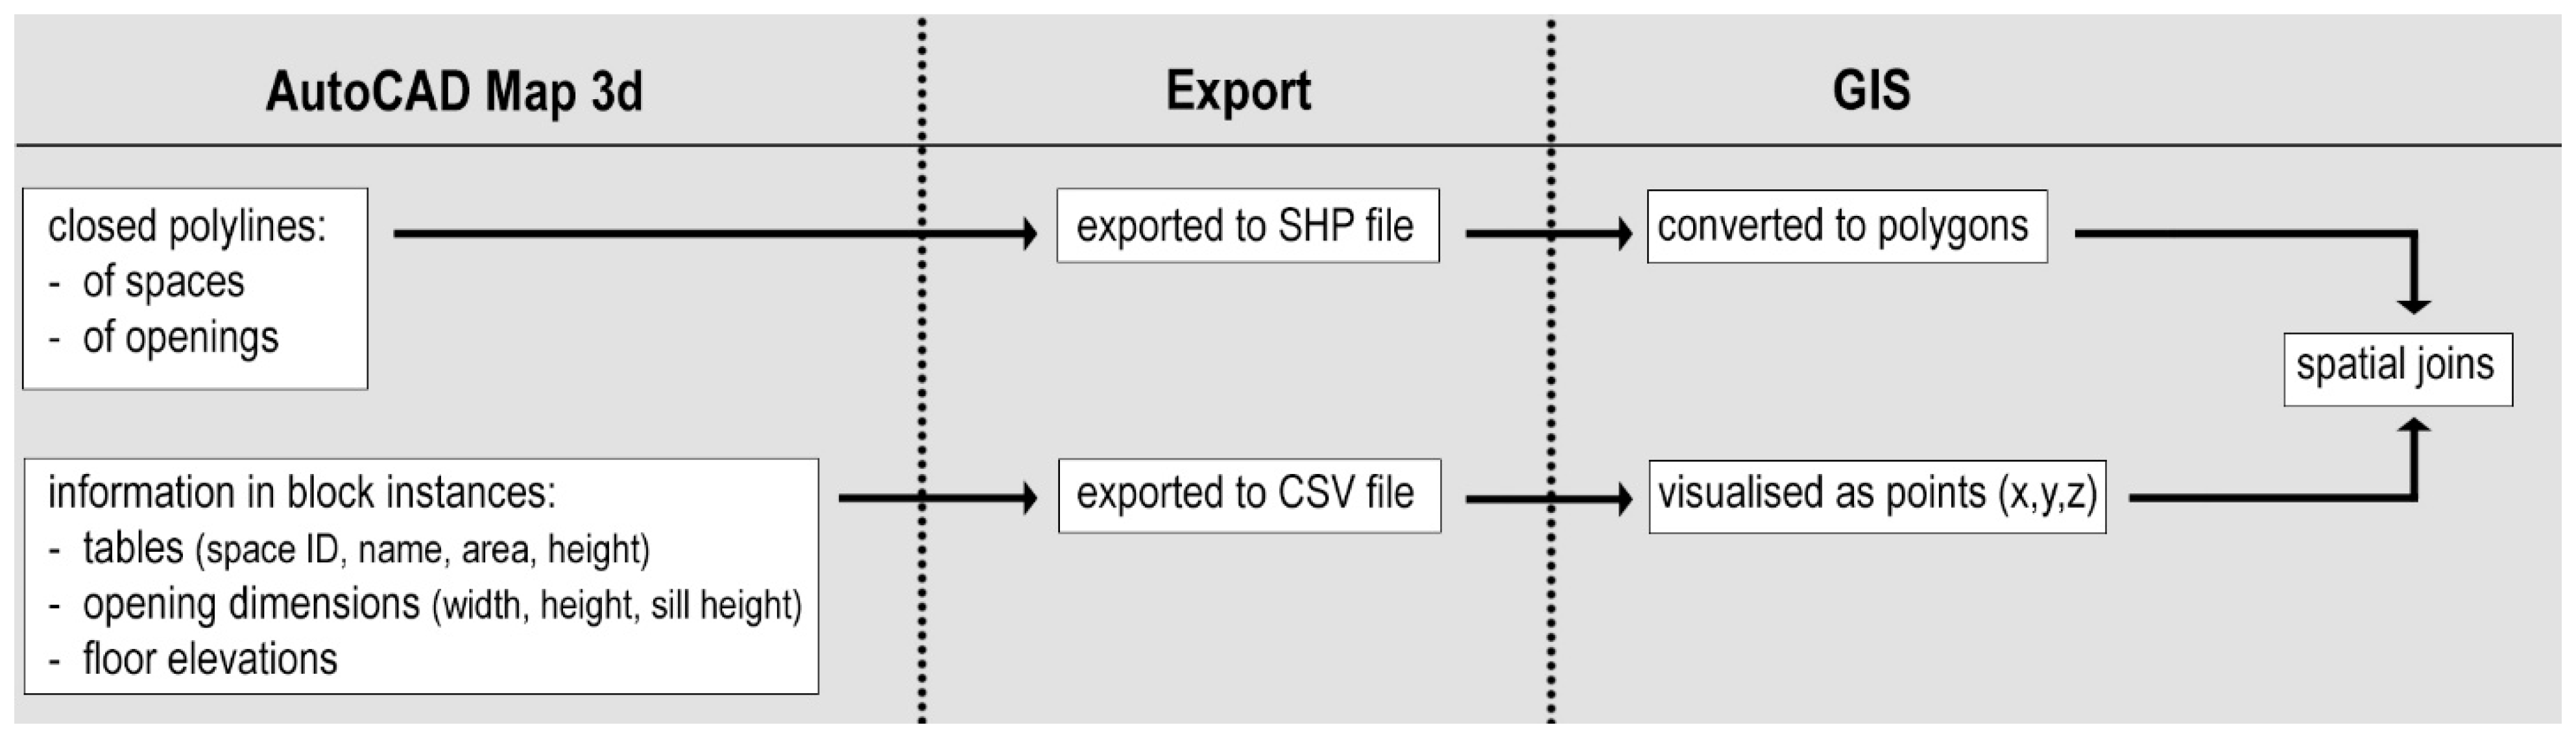
5.1.1. Primitive Element Extraction

The following describes the geometric and non-geometric primitives created in CAD and used as a source of geometric information for building the geo-relational database (in red in Figure 8). Specifically, for the geometries of the “Room”, “VerticalPenetration”, and “OpenSpace” classes, closed polylines were represented in the CAD drawings, matching the exact perimeter of each space. These polylines proved useful for the automatic calculation of room area during the vector drawing and to automatically write its value in every room. Additionally, each room includes a table containing other relevant information:
  • The identifying code of the space (e.g., 11,060);
  • The current name in use (e.g., Sala delle Nicchie);
  • The height value, expressed for rooms with vaulted ceilings by the height at the crown (maximum height, in meters) and the height at the spring line (minimum height, in meters).
A similar approach was applied to openings, namely, doors and windows: closed polylines matching the perimeter of each opening were drawn solely to capture the geometric primitives required by the GeoDB. In the database, these represent relational elements between adjacent rooms, between interior and exterior, and allow for routing calculations. For doors, CAD block instances were used (coded as described in Section 4.3.1) to represent the centerline of the opening, with attributes for the width and height of the doorway. For windows, the descriptive block also includes the measurement of the sill height from the interior floor level. Moreover, each opening is associated with an identifying code for the door or window, as well as one for each frame, if present. The modeling of openings in the GeoDB furthermore required associating each opening with the reference floor elevation in order to determine the relative elevation of the openings with respect to the space they face.

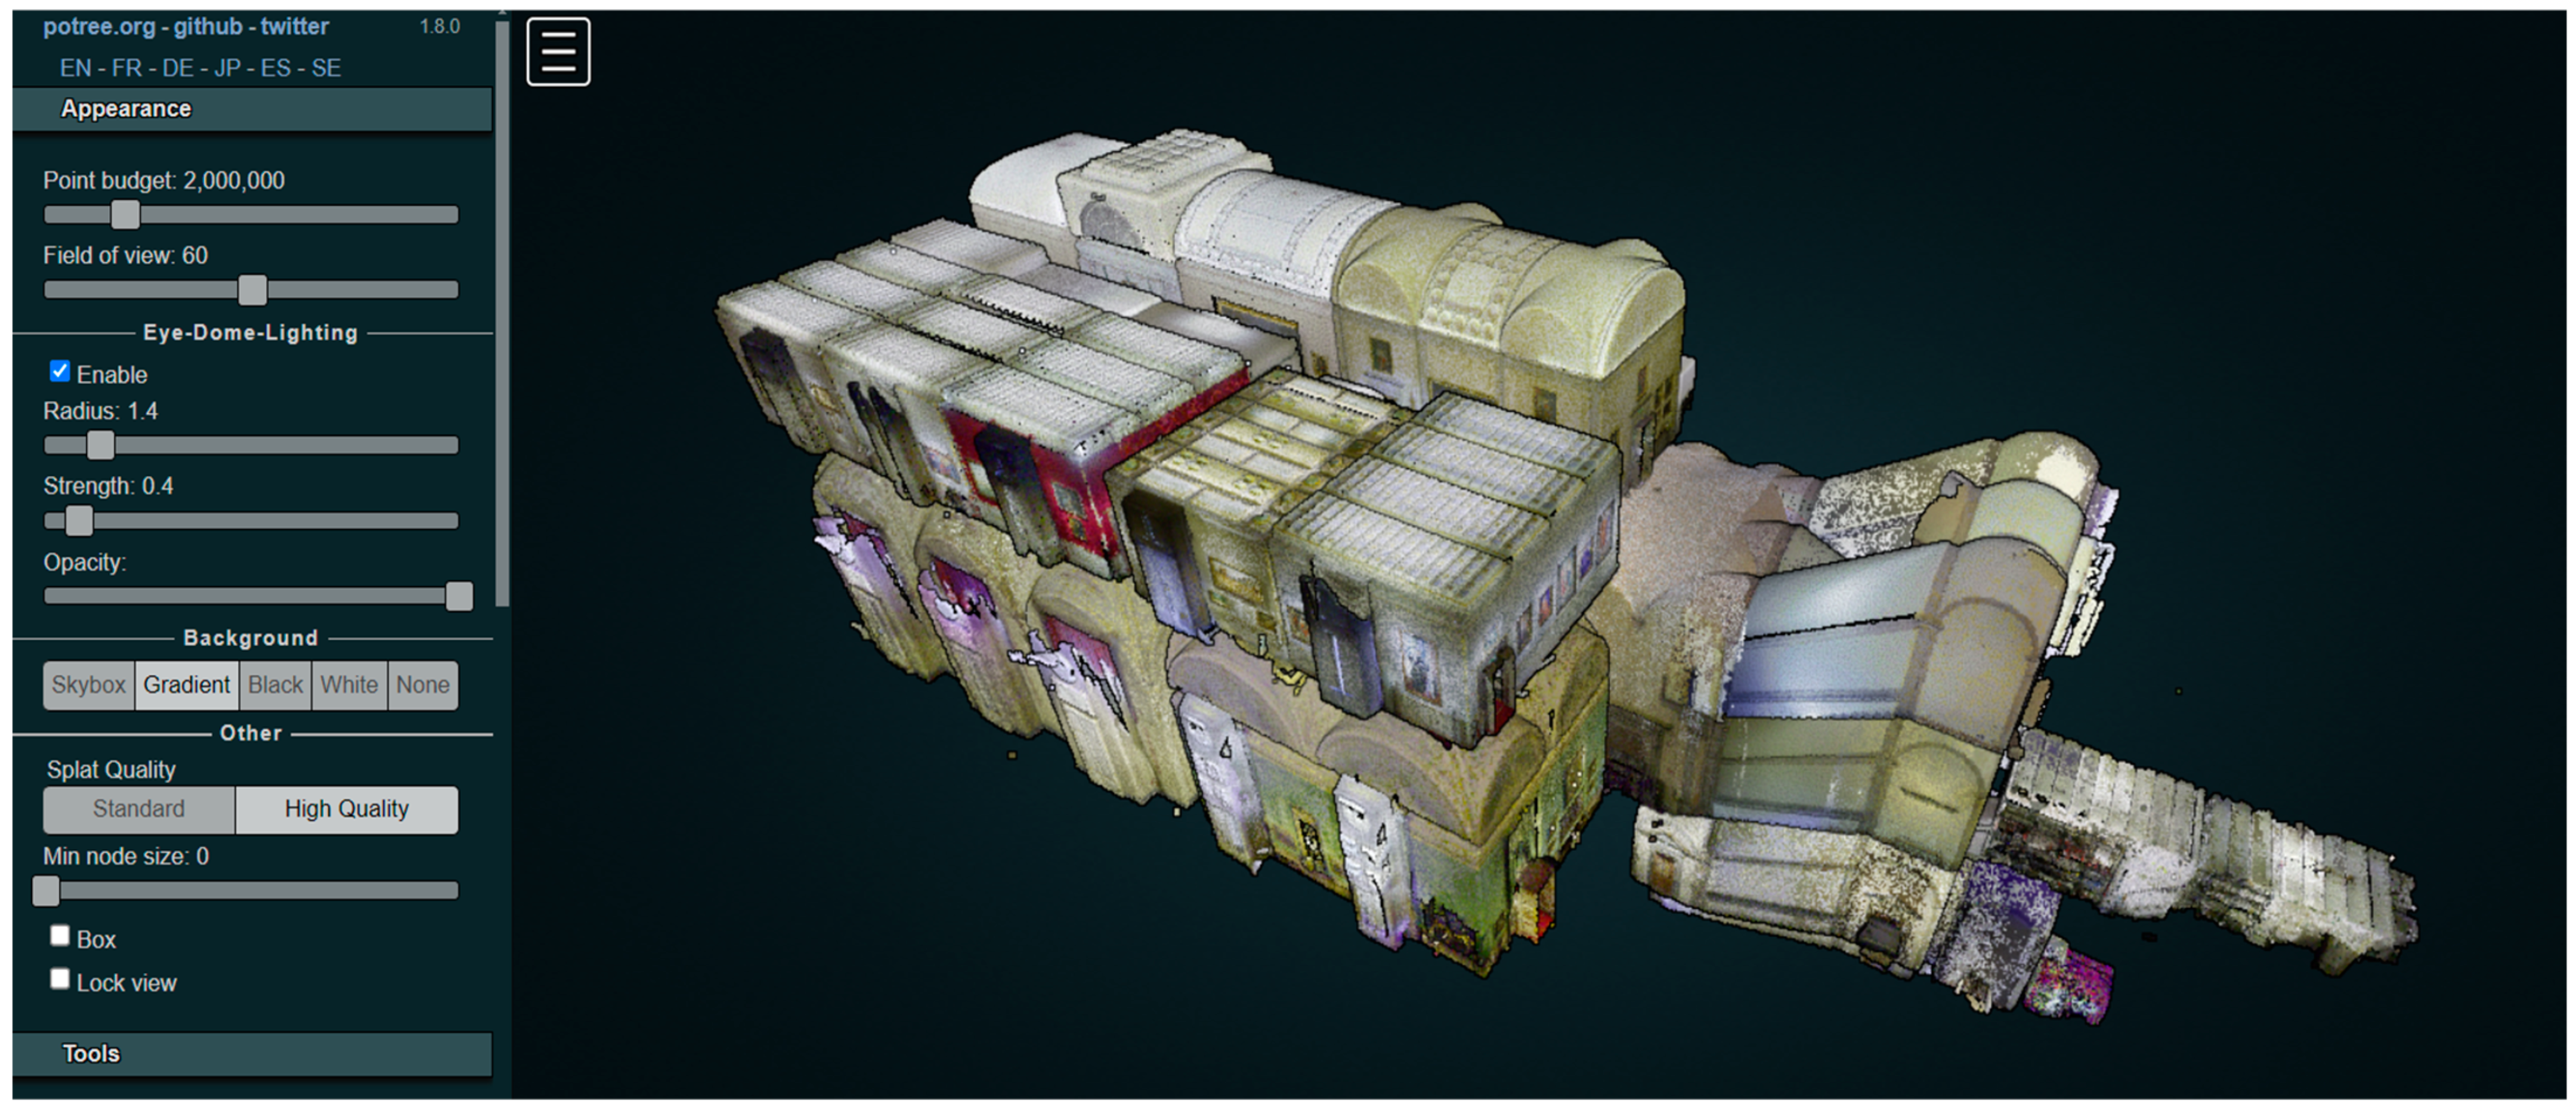
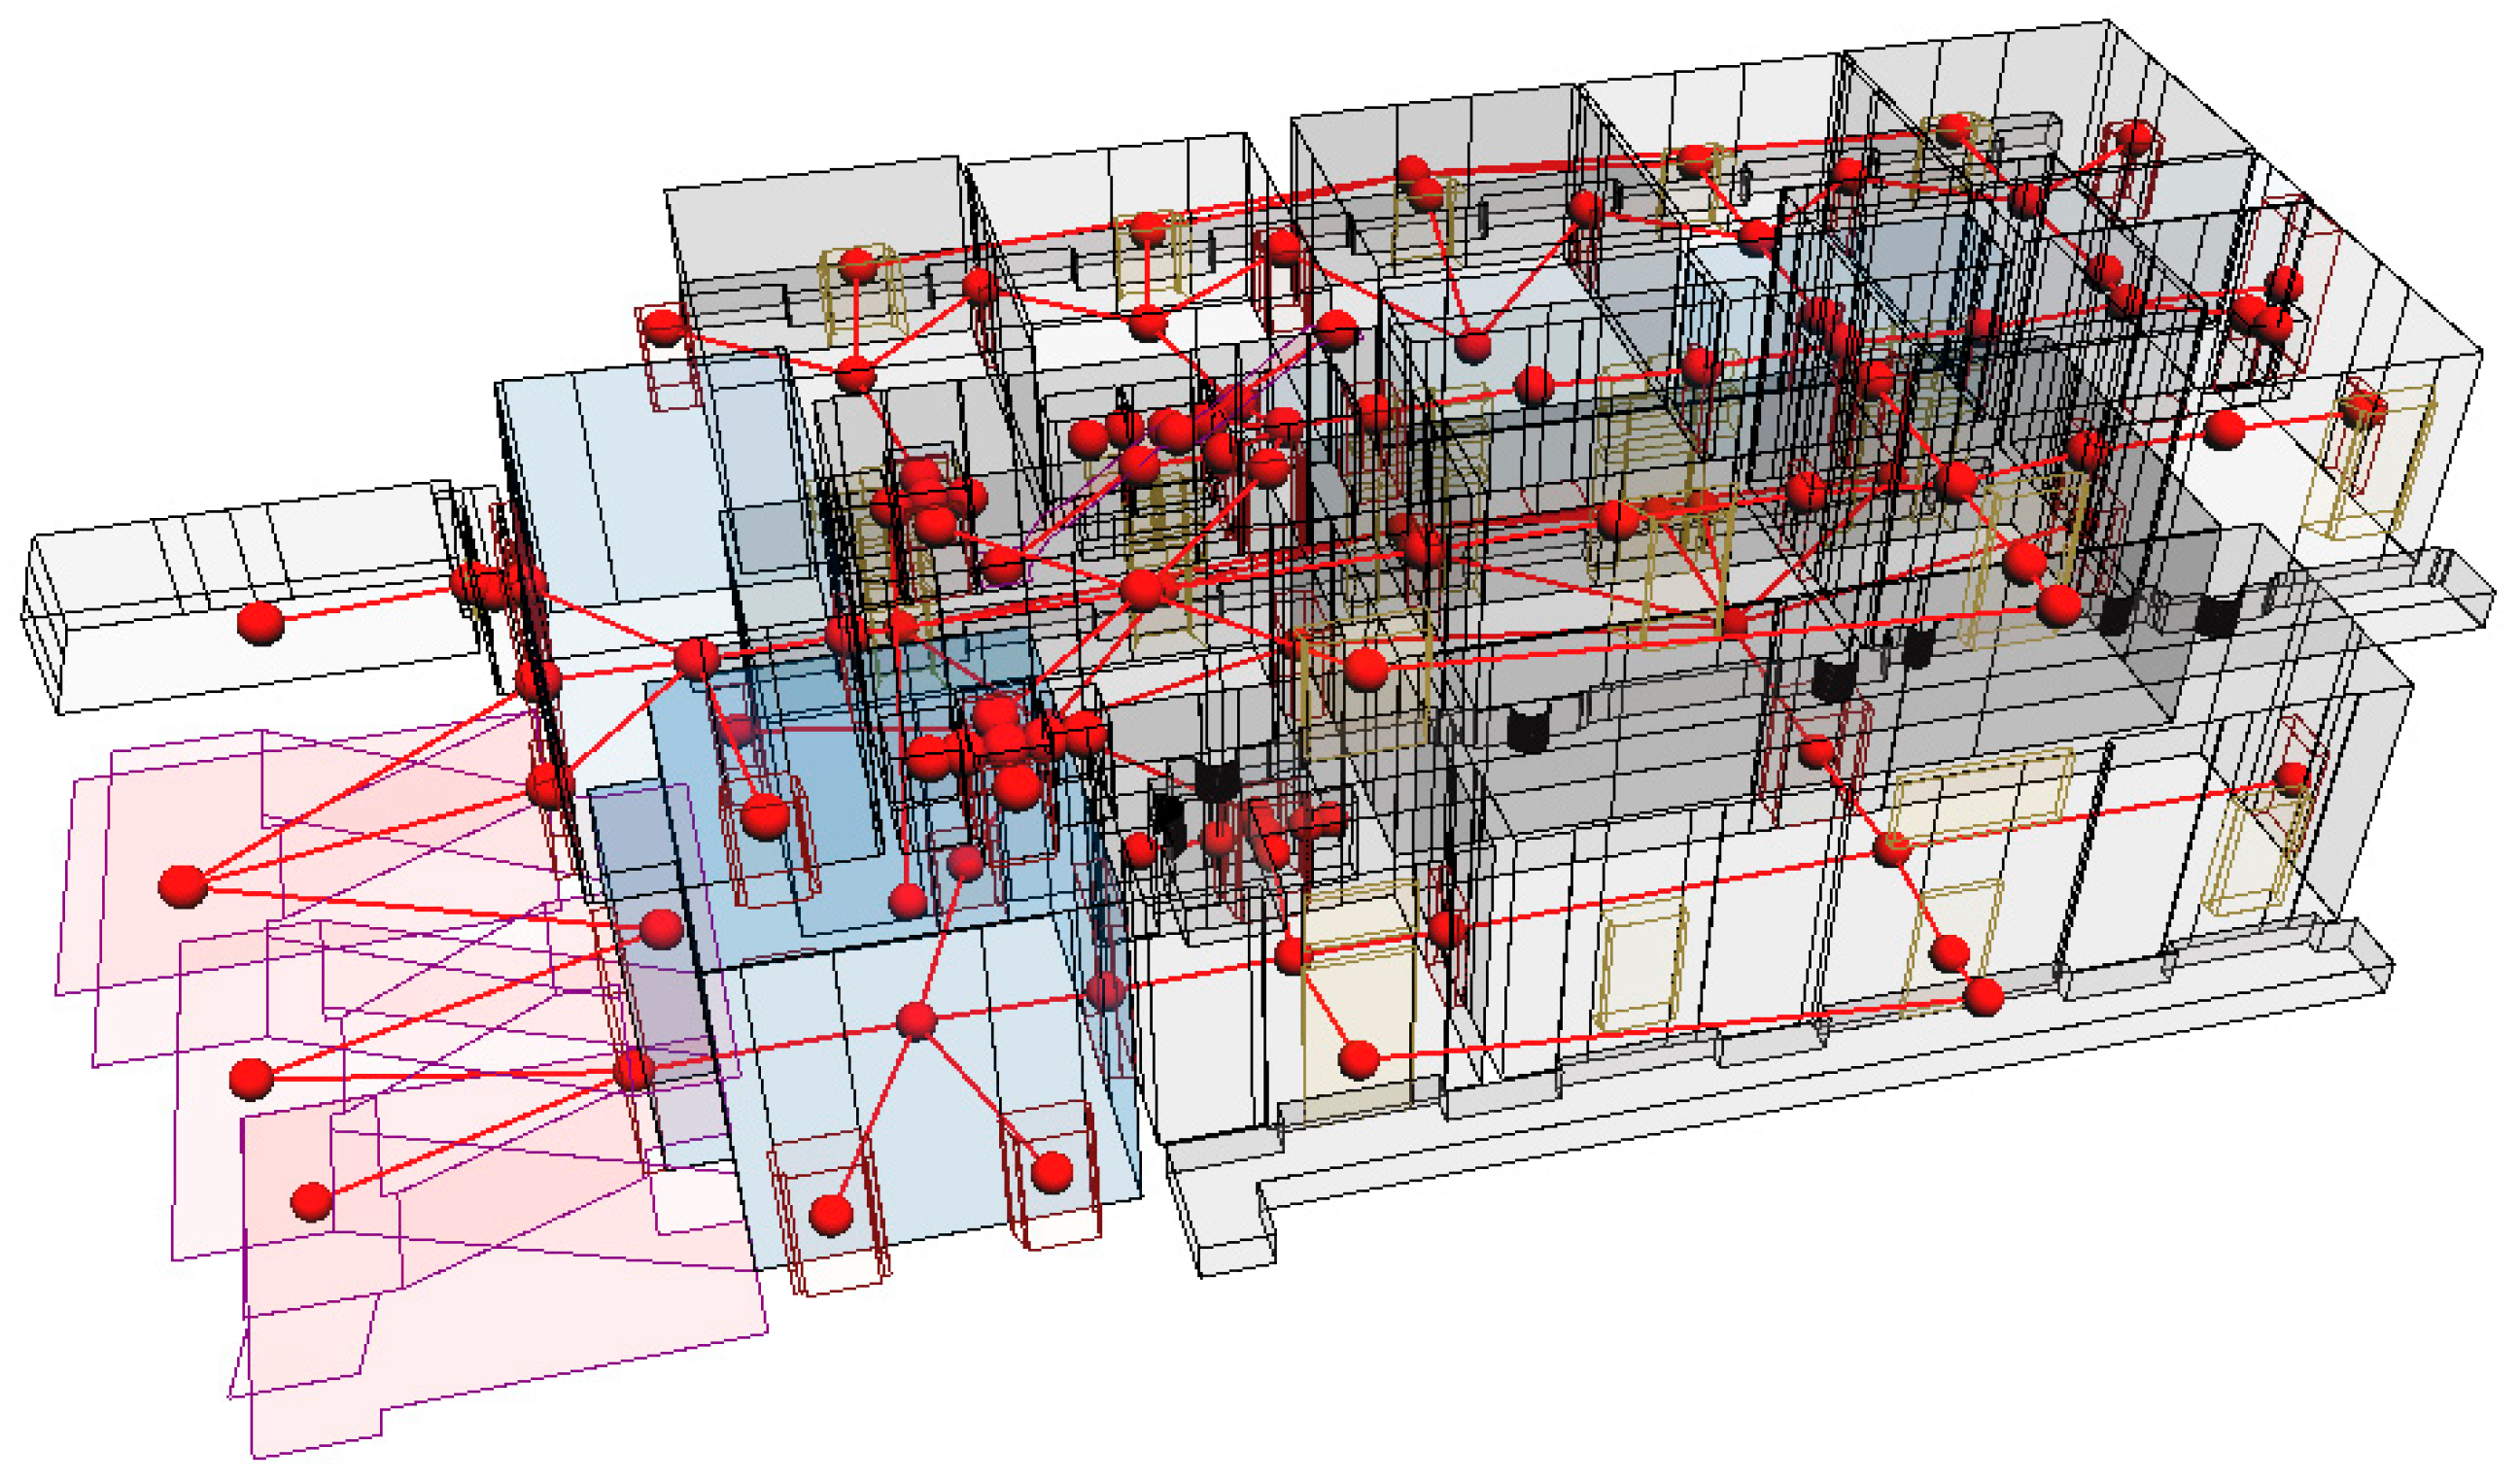
5.1.2. Generation of 2D and 3D Space Geometries and Creation of Topological Relationships

The adopted workflow is summarized in Figure 9: the geometric entities are extracted from the CAD drawings, and the attributes are retrieved from the space description tables and the block instances used to dimension the openings and express the floor elevation. The closed polylines of the spaces and openings were exported from AutoCAD Map 3D directly into SHP files, imported into QGIS [93], and then converted into polygons. On the other hand, the information extracted from the block instances was recorded in CSV files, imported into QGIS, and visualized as points, whose associated coordinates are used for referencing their attributes. Table 1 shows an example of data extracted from the space description tables, and Table 2 shows an example of data extracted from the block instances used to show the openings dimension.
The preliminary phase to import data from CAD into QGIS was addressed to the Coordinate Reference System (CRS) setup. The topographic survey network was based on the standard Italian Geodetic Reference System, materialized by the Rete Dinamica Nazionale (RDN) [94]. An ad hoc projection plane was then designed to preserve coordinate isometry as much as possible: as a consequence, the difference between real and projected distances is negligible, as is necessary for a large-scale and high-accuracy survey. In QGIS, a customized CRS was therefore set up by adopting a Transverse Mercator projection, with the tangent meridian latitude corresponding to that of the barycentric point of the survey area (longitude = 11.25°), imposing False_Easting = 4000 m, False_Northing = 4,840,000 m, and Scale_Factor = 1.000017 [95].
For the subsequent processing, QGIS was used: through spatial joins, the attributes of the points SHP files, containing information derived from the block instances, were transferred to the corresponding polygonal SHP files (Figure 10). In the GIS, a special effort was made to preserve, albeit with reduced detail, the information related to the three-dimensionality of the studied spaces. The complex relationships between adjacent rooms, often with varying heights, are immediately visible in a 3D volume visualization, whereas they require more careful interpretation in the comprehensive 2D drawings (plans and sections).
The “height” field (extracted from the descriptive tables, as described in Section 5.1.1) was used as the elevation offset for the polygons. In the case of vaulted spaces, it was decided to use only the “Hmax” field (corresponding to the maximum height of the space at the keystone of the vault) as the extrusion of the polygon for the space [96]. The result is a “no-wall category” model, focused on the representation of the space, according to the classification based on the difference in wall modeling proposed in [97]. In this way, a 3D volumetric model is visualized starting from 2D geometric primitives, even without acquiring all the geometries required by the Boundary-Representation of the spaces [98]. Obviously, this is a simplification of the modeling that does not cover the detail of special cases (such as rooms with different types of vaulted ceilings: dome, barrel, ribbed, etc.), but it allows for quick and easy visualization of 3D volumes, while ensuring consistency with the simpler geometries of the 2D information system.

5.1.3. Geoprocessing of Imported Files

Through the spatial join of attributes by position, the data exported from block instances, including the values of floor elevations, were merged with the polygons of spaces and openings. This allowed for a three-dimensional visualization of the model through the properties of the 3D view (Figure 11). Each space polygon was assigned the height read from the block instance elevations and given an extrusion based on the maximum height field, exported from the space description tables. The same process was applied to openings, which were extruded based on the height of doors and windows obtained from the data exported from block instances used for sizing. Additionally, the height of the windows was determined by adding the floor elevation to the windowsill height.
The noble floors of the Pitti Palace are alternated with levels that originally housed service spaces, known as mezzanines. The characterization spaces pertaining to these levels is a distinctive feature in the definition of transfer files from CAD to QGIS. Although there are no spaces located on mezzanine floors within the test area, some elements associated with these intermediate floors were still imported to achieve a complete representation of openings: due to the different heights of the openings from the section plan adopted in the plans of the various levels, sometimes the existing openings in a room are represented in the levels higher or lower than the one describing its main volume.
Regarding staircases, these were represented as individual volumes, floor by floor, containing the 3D development of individual ramps and internal landings. This approach allows for the modeling of potential changes in the staircase block volume and the inclusion of additional spaces, such as under-stair rooms or extradossed areas. An example is the Ammannati Staircase (ID: A0033) in the test area (Figure 12), which reduces its volume from three ramps to two as it ascends from the first to the second floor.

6. The “Pitti Data Model” Mapping into IndoorGML Standard

Section 3 considered the main standards for structuring geospatial and thematic information in the context of this study. As mentioned, Pitti Palace can be regarded as a relevant element at different scales, from the territorial to the urban level, up to the architectural level, and even the individual activities taking place within it could be considered (e.g., the various museums) to the scale of the individual works of art contained in the building. Considering that the project originated on the occasion of the 3D survey of the entire building and that the objectives identified are primarily to support the different management processes of the historic building itself rather than the activities currently taking place within it, the CityGML and the IndoorGML standard were recognized as appropriate to explore. A previously published work [45] proposes some considerations regarding mapping our data model versus CityGML; the following Section describes instead the mapping on IndoorGML, starting from its UML reconstruction.

6.1. Reconstruction of IndoorGML UML Model

The IndoorGML standard does not yet provide a complete UML diagram (class diagram). Therefore, the UML model was built based on the XML/GML schemas of the Core Module and Navigation Module provided by the OGC. The Code Engineering tool in Enterprise Architect was used to generate the UML classes from the XML/GML schemas (via reverse engineering), as similarly undertaken in [99] and shown in Figure 13. In addition, CodeLists (as proposed in Annex D) were generated to specify the values of the ClassType, FunctionType, and UsageType attributes of the GeneralSpace, TransitionSpace, ConnectionSpace, and AnchorSpace classes. A UML diagram conforming to IndoorGML version 1.1 was then generated.

6.2. Mapping of the Pitti Data Model to IndoorGML

As already proposed in a previous preliminary work [45], for the most part, cells classified as “Room” in the “Pitti Data Model” can be mapped to the GeneralSpace class. Exceptions are corridors and vestibules, which are considered to belong to the TransitionSpace class, with the ClassType attribute defined as HorizontalTransition. For this reason, a new Corridors class was created within the “Pitti Data Model”, and related to the TransitionSpace class, together with the “VerticalPenetration” class (for the latter, the ClassType attribute is defined as VerticalTransition). It should be specified that in the case of the Pitti Palace, as with other museums, the distinction between GeneralSpace and TransitionSpace, where the former refers to spaces where people stay and the latter to spaces where they pass through, is not straightforward. In fact, in the vast majority of cases the rooms themselves function as corridors, as the museum route moves from one GeneralSpace to another.
The “Door” class of the “Pitti Data Model” was related to the ConnectionSpace class of IndoorGML.
Exceptions to the conformity to the standard IndoorGML model are the “Window” class and the “OpenSpace” class. In fact, the conceptual model of IndoorGML does not provide a class for windows, as it is focused on navigational purposes, and naturally does not provide a class for outdoor spaces. In the “Pitti Data Model”, the “OpenSpace” class was used to classify spaces that are not completely enclosed but spatially defined, such as courtyards, balconies, or loggias. Therefore, in this first test phase, the “OpenSpace” class was mapped directly to the GeneralSpace class, together with the interior spaces. Moreover, attributes were added in the CodeList to define outdoor spaces (O-spaces), semi-interior spaces (sI-space), such as loggias, and semi-outdoor spaces (sO-space), such as courtyards, thus aligning with the spatial definition structure proposed in [100].
The Windows class was instead mapped to the AnchorSpace class, thus bringing all openings facing to the outside into it. In addition, the window description field was added to the CodeList referring to AnchorSpaces. The resulting UML model is shown in Figure 14.
All terms—and their identification codes—added for these types of space, not included in the IndoorGML data structure and proposed CodeLists, were selected from terms proposed by the Getty’s AAT—The Art & Architecture Thesaurus [81] and added as ADEelements (Figure 15).
In parallel, the Node-Relation Graphs (NRG) (Figure 16) was represented, in line with the IndoorGML specifications, where the centroids of each cell were associated with the State class, and the connections between nodes, represented by curves, were linked to the Transition class. This approach accurately models the navigation network within the spaces, defining both accessible areas and the connections between them.
Additionally, pgRouting [101] was implemented to enhance the analysis and customization of the paths. This extension for PostgreSQL/PostGIS allows for the assignment of dynamic weights to the transitions in the navigation graph. These weights, derived from properties such as distance, travel time, or accessibility, enable the differentiation of paths for various user groups.
For instance, within the NRG:
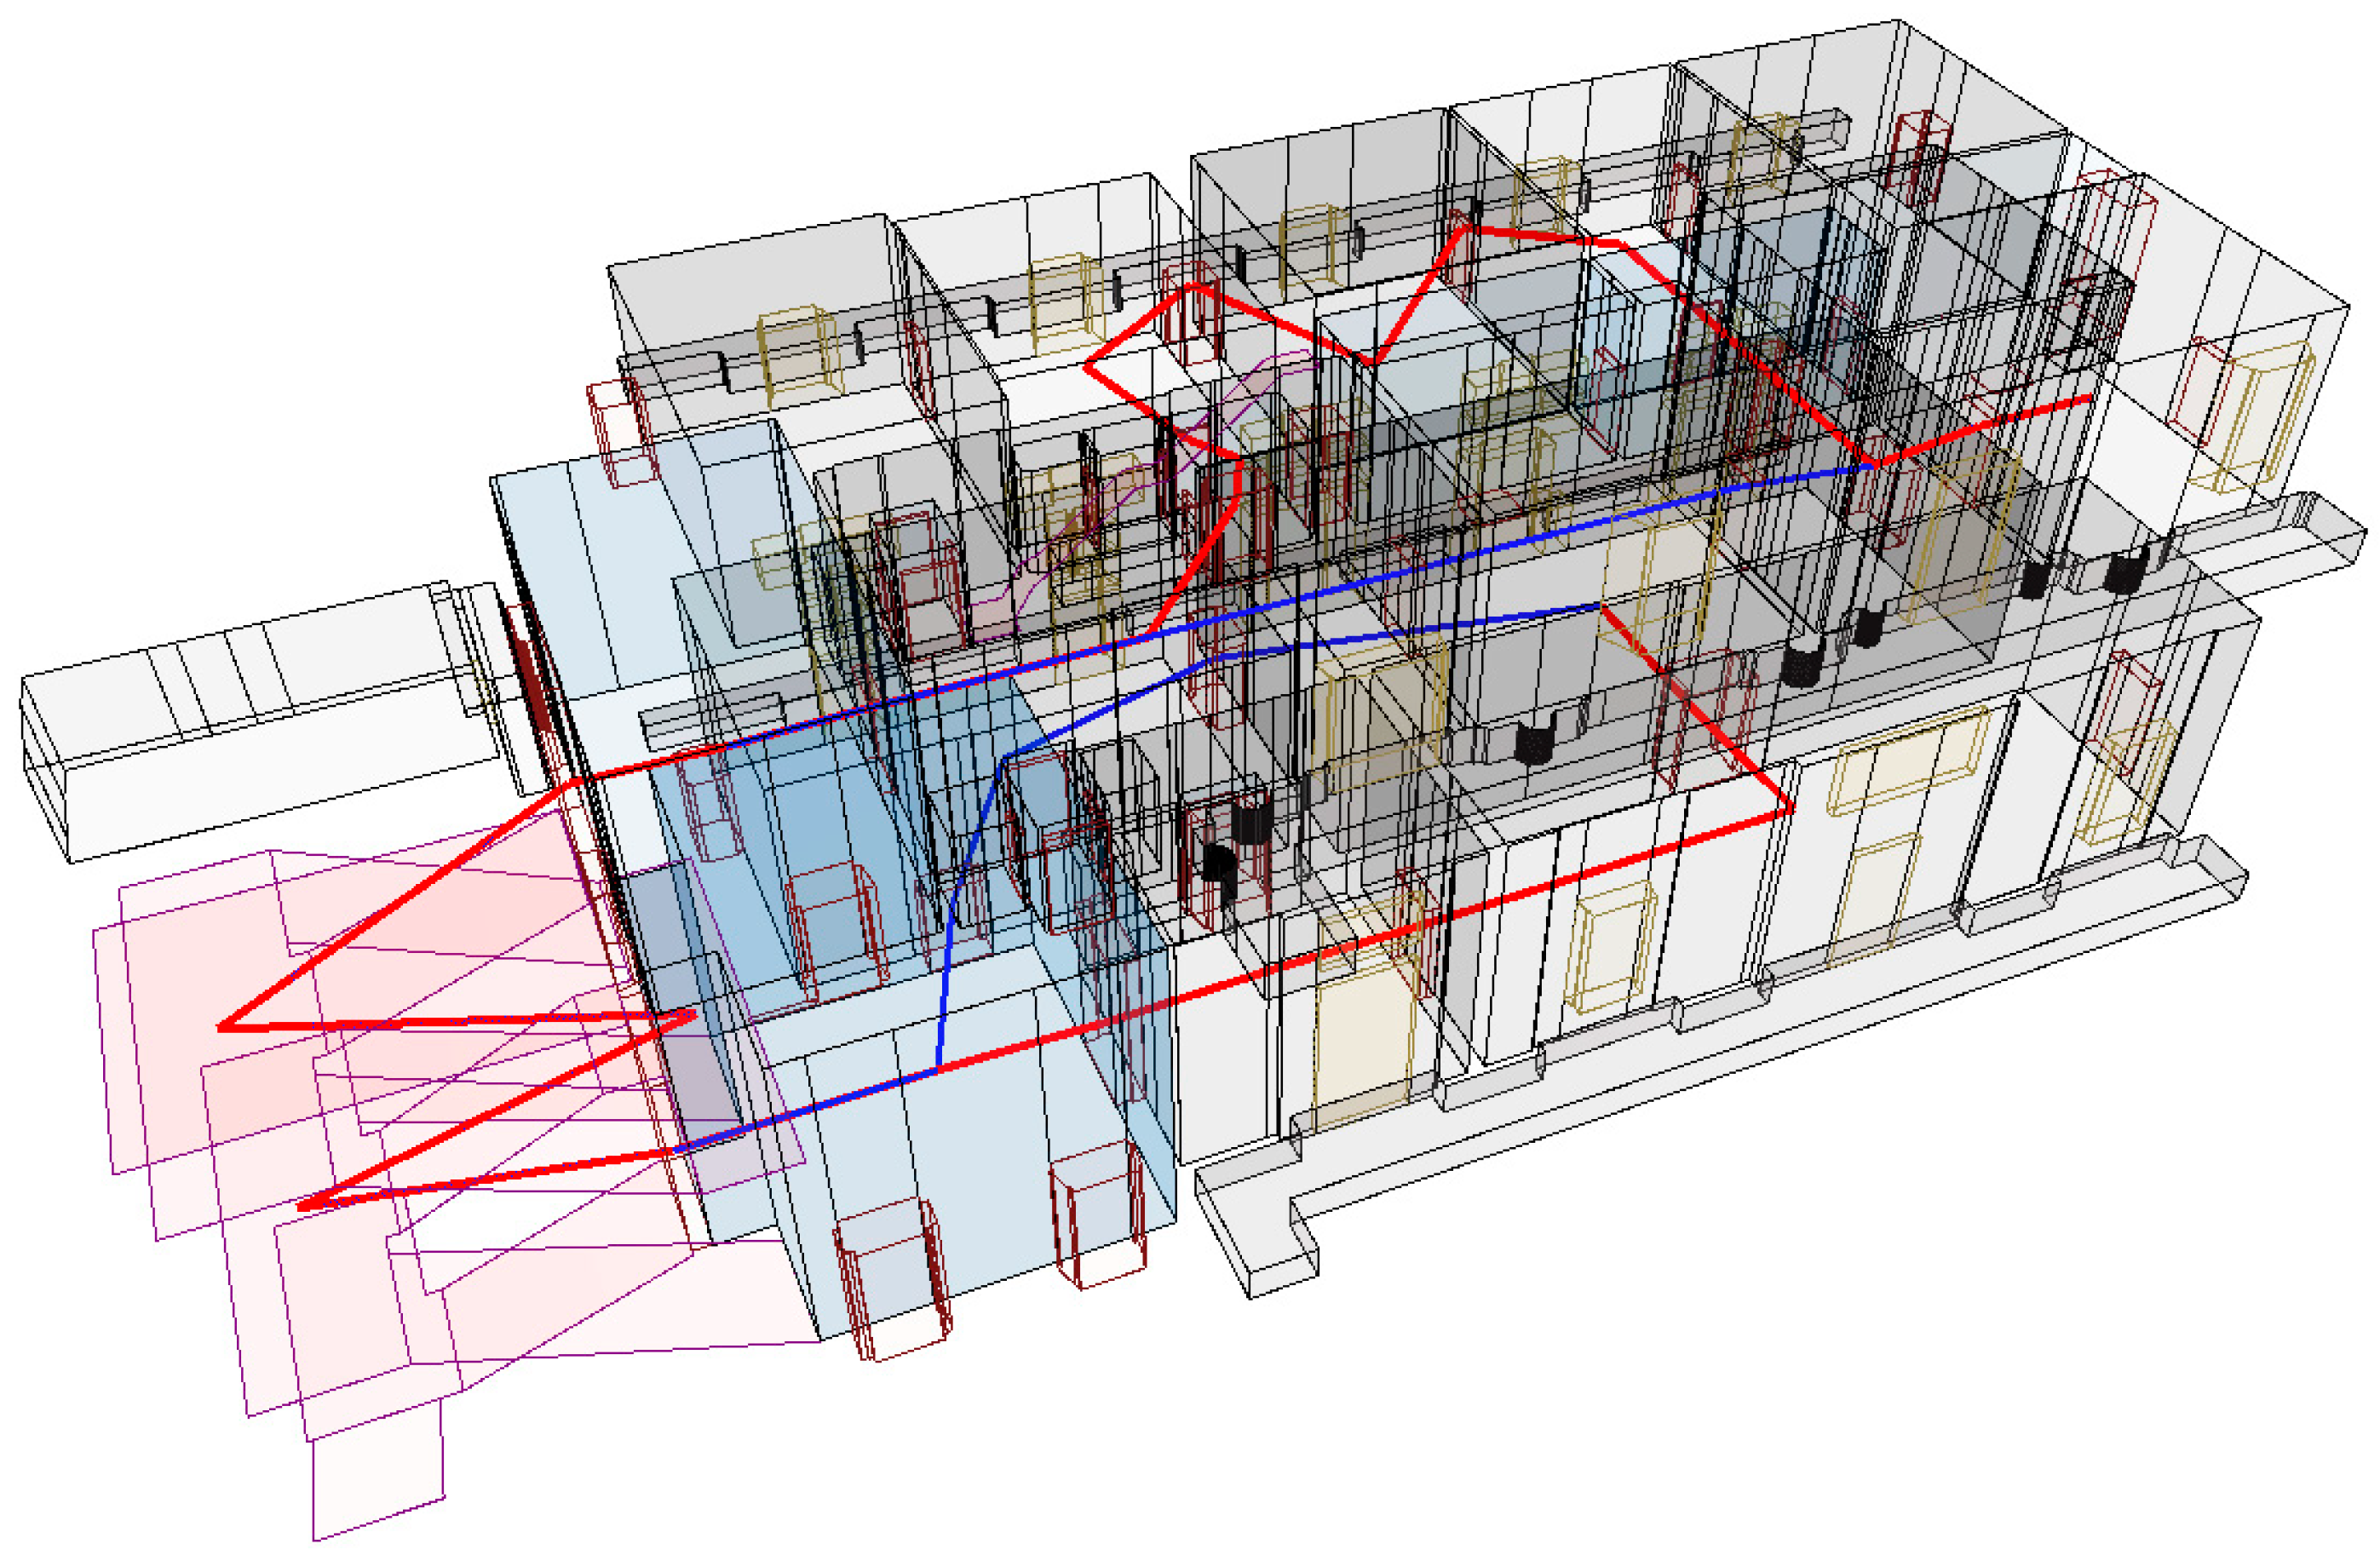
  • Visitors can be assigned routes optimized for accessing exhibitions, with lower weights assigned to transitions leading to main galleries;
  • Staff members may follow routes prioritizing technical areas, storage rooms, or service zones, avoiding interference with public areas.
This integrated approach, combining the flexibility of IndoorGML models with the analytical power of pgRouting, allows for the creation of a navigation network adaptable to operational needs while improving indoor space management and user experience.

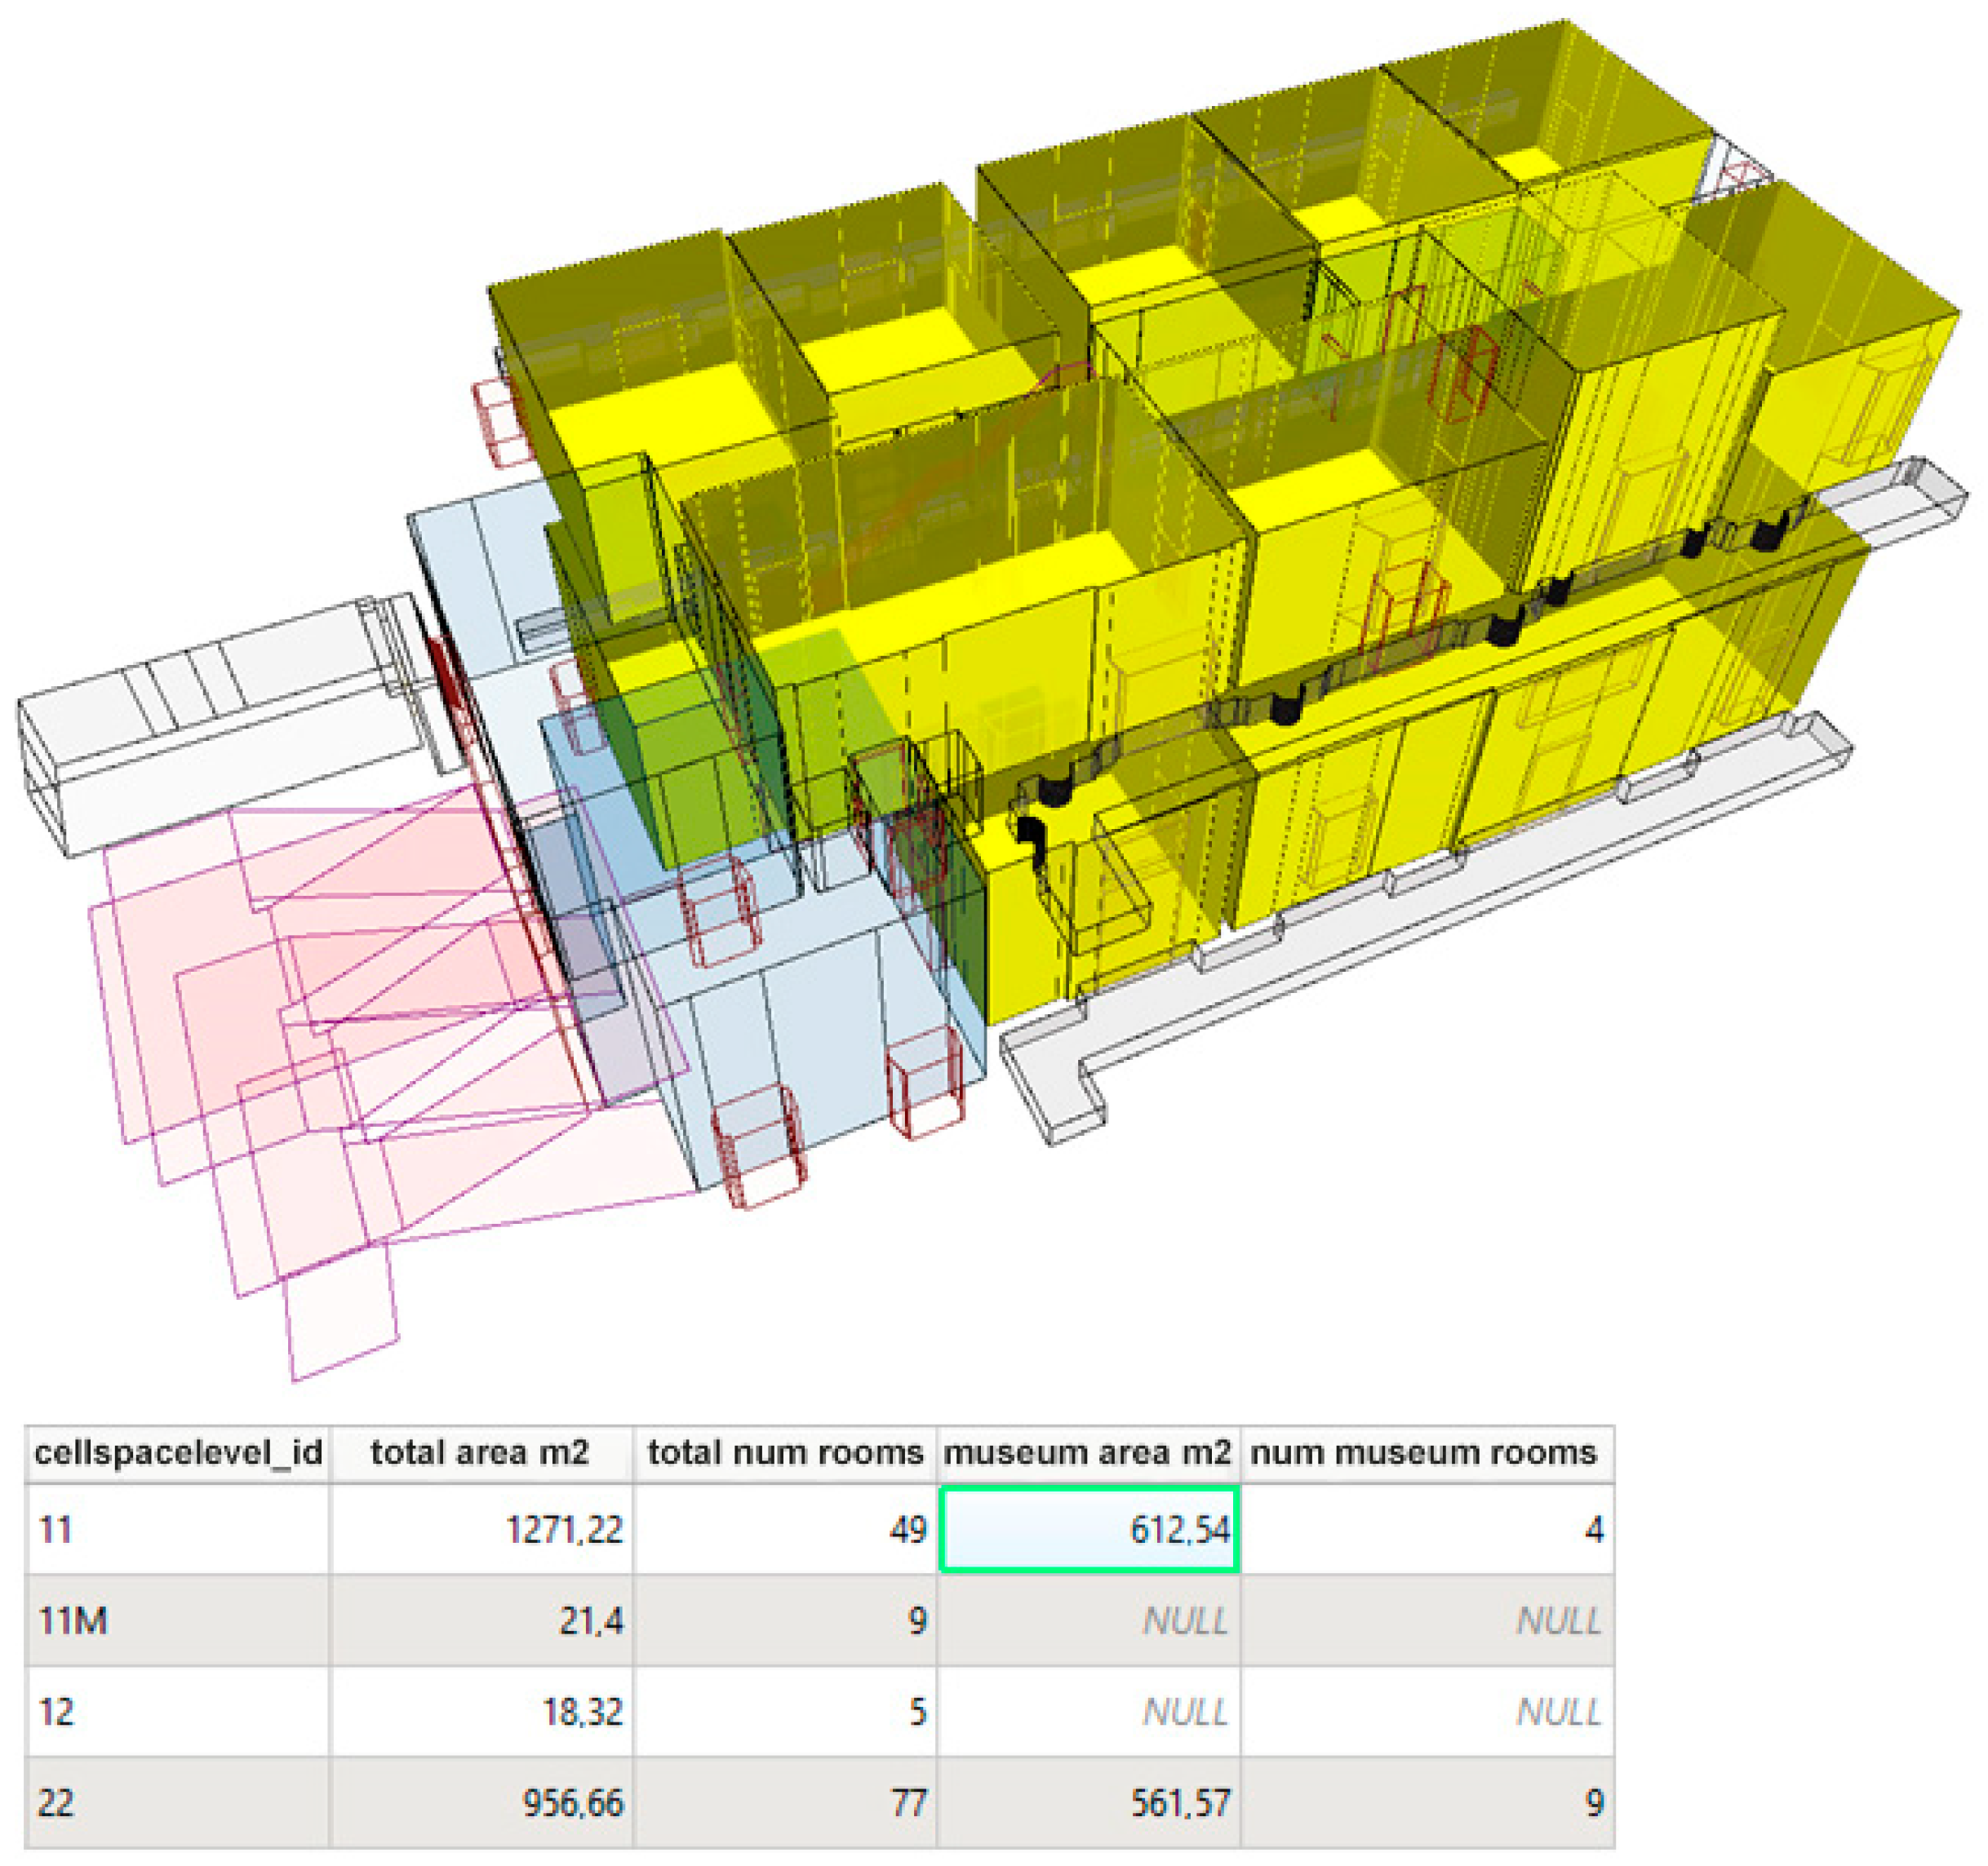
7. Examples of GeoDB Use and Query

As a result of the queries, in addition to the possibility of identifying a space from its ID or name, it is possible to categorize by ClassType, FunctionType, and UsageType. For example, it is possible to identify rooms used as Museum Gallery (then in the Class GeneralSpace; ClassType: Art, Performance; FunctionType: Museum Gallery) and then calculate the area (classifying according to different levels or not) (Figure 17).
The same is possible for the other types of space, i.e., TransitionSpaces and “OpenSpaces”. For the first, it is possible to identify the spaces by classifying them according to the ClassType in VerticalTransition (stair, lift, etc.) and HorizontalTransition (corridor, vestibule, etc.). For the second, it is possible to identify the different types of “OpenSpace” according to the ClassType in O-spaces (i.e., garden), sI-space (loggia, porch, etc.) and sO-space (courtyard, balcony, rooftop, etc.) (Figure 18 and Figure 19).
Navigation path queries allow the identification of the shortest route to move from one space to another, taking into account obstacles (such as blocked doors or temporarily inaccessible rooms) and thus identifying routes that can be used by museum visitors and the general public, or routes that can be used by museum staff and employees (Figure 20). Of course, the data structure of IndoorGML is also applicable to analyses of visitor trajectories in the museum, as similarly undertaken for the Louvre Museum [102], and potentially developable in future work.

8. Conclusions and Future Work

The project presented here exploits 3D surveying data and methods and proposes the ad hoc “Pitti Data Model,” overcoming challenges associated with the site’s architectural complexity and extensive data requirements. The result is a comprehensive and interoperable system that integrates geometric, material, historical, and functional data to enable multidimensional analysis. The more relevant existing standards were considered (INSPIRE, CityGML, and IndoorGML), and the data model tailored on the case study was therefore transformed as IndoorGML compliant.
Implementing standards to the particular case of a complex built heritage asset highlights the importance of standardization and interoperability in ensuring the long-term usability and accessibility of heritage data. Furthermore, the use of semantic tools, such as controlled vocabularies mapped to Getty’s Art & Architecture Thesaurus, enriches the data model and enhances its potential for integration with broader information systems. Interoperability presents critical aspects, particularly when multiple disciplines and experts have to interact, also considering the specific lexicons relevant to their respective scientific fields, as in the case of the built heritage. In this paper, we have considered mainly standards relating to conceptual modeling, but OGC also takes care of the development and dissemination of coding and interface standards: OGC standards are internationally recognized specifications and thus allow the development of promising solutions in terms of interoperability.
Considering the richness and exhaustiveness, both geometric and thematic, of the source data, it should be noted that, unavoidably, a large amount of data recorded during the survey campaign and integrated into the “Pitti Data Model” did not find correspondence in the mapping toward IndoorGML. This is the case for information characterizing walls, floors, ceilings, and vaults, intended as a solid space separating rooms: the modeling adopted (no-wall models) neglects their thickness, which prevents data on materials, finishes, and state of preservation being referenced on these elements. However, this was preferred so as to provide an easy and light visualization of the three-dimensional spaces, considering their spatial relations to be of prevailing interest.
Furthermore, window and open space data were included in a specific IndoorGML application domain extension, as they are not considered in this standard data model. Therefore, future research developments are directed toward integrating the data model by also considering CityGML LoD 4 since, as already mentioned, their integration can give a synergetic effect.
The project underscores the value of Heritage Digital Twins (HDTs) as dynamic, interactive tools for cultural heritage. HDTs are expected to facilitate collaboration, improve decision making, and enable ongoing updates to reflect changes in conservation status, spatial configuration, or functional use. Albeit with the limits of a prototype project, the GeoDB developed demonstrates how digital models can enhance site management and visitor experiences, as in the case of (spatial and non-spatial) query results and the implementation of navigation graphs and dynamic routing. In both cases, the possibility of considering the spatial relationships between spaces in their full three-dimensionality constitutes a qualifying and indispensable element.
By combining cutting-edge technology with a holistic approach to data organization, the Pitti Palace project sets a precedent for future heritage initiatives, related to conservation and restoration, also providing opportunities in education, dissemination, and tourism, thus ensuring the sustainable preservation of cultural heritage for generations to come.

Author Contributions

Conceptualization, V.B., G.T., A.M. and M.C.; methodology, V.B., A.M. and M.C.; software, M.C., S.R. and A.M.; validation, L.F., A.C. and S.R.; investigation, L.F. and A.C.; resources, L.F. and A.C.; data curation, L.F., V.B. and A.C.; writing—original draft preparation, A.M., V.B., M.C. and L.F.; writing—review and editing, V.B., L.F. and M.C; visualization, A.M.; supervision, G.T. and V.B.; project administration, V.B., G.T. and L.F; funding acquisition, G.T. All authors have read and agreed to the published version of the manuscript.

Funding

This research was co-funded by the Regione Toscana under the “Advanced training projects through the activation of research grants” (Research Grants Call 2021), financed with resources from the POR FSE 2014/20 program (dd. 16954/2019 and subsequent amendments) for the DHEMSY—4D Digital Heritage Management System project, FSE ID: 291430.

Data Availability Statement

The EAP (Enterprise Architect) files of the project can be downloaded from https://github.com/AdeleM-source/DHEMSY/tree/main (accessed on 26 February 2025).

Acknowledgments

The Geomatics for the Environment and Conservation of the Cultural Heritage Laboratory (UNIFI), headed by Grazia Tucci, was in charge of the 3D digitization project of Pitti Palace (2020–2022) in the frame of a research agreement with Uffizi Galleries, directed at that time by Heike Schmidt. The authors gratefully thank Elena Pozzi for the valuable insights and the fruitful dialogue. Donatello Donatelli, Alessio Ferroni, Renzo Maseroli, Rosanna Massaro, Giulia Pagliaricci, and Camilla Santoni participated in the on-the-field data acquisition and the CAD drawing.

Conflicts of Interest

The authors declare no conflicts of interest.

Abbreviations

The following abbreviations are used in this manuscript:
AATArt & Architecture Thesaurus
ADEApplication Domain Extension
BIMBuilding Information Modeling/HBIM = Historic Building Information Modeling
CAD Computer-Aided Design
CIDOC CRMConceptual Reference Model by ICOM (International Council of Museums)
CRSCoordinate Reference System
DBMSDatabase Management System
DDLDatabase Definition Language
DTDigital Twin
FAIRFindable, Accessible, Interoperable, and Reusable
GeoDBGeospatial Database
GISGeographic Information System
GMLGeography Markup Language
GNSSGlobal Navigation Satellite System
HDTHeritage Digital Twin
HDTOHeritage Digital Twin Concept Ontology
HVACHeating, Ventilation, and Air Conditioning
IFCIndustry Foundation Classes
IMDFIndoor Mapping Data Format
INSPIREInfrastructure for Spatial Information in Europe/BU = Buildings (INSPIRE theme)
ISO/TC211International Organization for Standardization, Technical Committee 211 (Geomatics)
NRGNode-Relation Graphs
OCLObject Constraint Language
OGCOpen Geospatial Consortium
PIMPlatform Independent Model
PSMPlatform Specific Model
RDNRete Dinamica Nazionale
SfMStructure from Motion
SQLStructured Query Language
UAVUnmanned Aerial Vehicle
UMLUnified Modeling Language
XMLExtensible Markup Language

References

  1. European Parliament and Council of the European Union. Decision (EU) 2022/2481 of the European Parliament and of the Council of 14 December 2022. Available online: https://eur-lex.europa.eu/eli/dec/2022/2481/oj (accessed on 30 October 2024).
  2. European Commission. Recommendation (EU) 2021/1970 of the Commission of 6 October 2021. Official Journal of the European Union. 2021. Available online: https://eur-lex.europa.eu/legal-content/EN/TXT/?uri=CELEX%3A32021H1970 (accessed on 30 October 2024).
  3. European Union. Declaration of Cooperation of the European States on the Digitization of Cultural Heritage, 9 April 2019. Available online: https://ec.europa.eu/newsroom/repository/document/2019-15/scanned_signed_declaration_090419_A4EA8EC1-E348-62E7-2257B0139A47C785_58564.pdf (accessed on 13 March 2025).
  4. European Commission, Directorate-General for Research and Innovation. Stakeholders’ Survey on a European Collaborative Cloud for Cultural Heritage—Report on the Online Survey Results. Publications Office of the European Union. 2022. Available online: https://data.europa.eu/doi/10.2777/691331 (accessed on 30 October 2024).
  5. Grieves, M. Completing the cycle: Using PLM information in the sales and service functions [slides]. In Proceedings of the SME Management Forum, Troy, MI, USA, 31 October 2002. [Google Scholar]
  6. Grieves, M.; Vickers, J. Origins of the digital twin concept. Fla. Inst. Technol. 2016, 8, 3–20. [Google Scholar]
  7. Metcalfe, J.; Ellul, C.; Morley, J.; Stoter, J. Characterizing the Role of Geospatial Science in Digital Twins. ISPRS Int. J. Geo-Inf. 2024, 13, 320. [Google Scholar] [CrossRef]
  8. Patrucco, G.; Gómez, A.; Adineh, A.; Rahrig, M.; Lerma, J.L. 3D Data Fusion for Historical Analyses of Heritage Buildings Using Thermal Images: The Palacio de Colomina as a Case Study. Remote Sens. 2022, 14, 5699. [Google Scholar] [CrossRef]
  9. International Council on Monuments and Sites (ICOMOS). ICOMOS Charter—Principles for the Analysis, Conservation and Structural Restoration of Architectural Heritage. 2023. Available online: https://www.icomos.org/en/about-the-centre/179-articles-en-francais/ressources/charters-and-standards/165-icomos-charter-principles-for-the-analysis-conservation-and-structural-restoration-of-architectural-heritage (accessed on 30 October 2024).
  10. Almagro, A.; Carbonara, G.; Casiello, S.; Coppo, D.; Cundari, C.; De Fiore, G.; Docci, M.; Fondelli, M.; Kirova, T.; Mandelli, M.; et al. Verso la “Carta del Rilievo Architettonico”. In Il Rilievo dei Beni Architettonici per la Conservazione. Atti del Convegno di Napoli, 15/17 Aprile 1999; Cundari, C., Carnevali, L., Eds.; Edizioni Kappa: Roma, Italy, 2000. [Google Scholar]
  11. Tucci, G.; Conti, A.; Bonora, V.; Fiorini, L.; Pagliaricci, G. Recording Michelangelo’s David: Ultra-high resolution 3d scanning and modeling for digital and physical reproduction. Int. Arch. Photogramm. Remote Sens. Spat. Inf. Sci. 2023, XLVIII-M-2-2023, 1581–1588. [Google Scholar] [CrossRef]
  12. Leon, I.; Pérez, J.J.; Senderos, M. Advanced Techniques for Fast and Accurate Heritage Digitisation in Multiple Case Studies. Sustainability 2020, 12, 6068. [Google Scholar] [CrossRef]
  13. Niccolucci, F.; Felicetti, A. Digital Twin Sensors in Cultural Heritage Ontology Applications. Sensors 2024, 24, 3978. [Google Scholar] [CrossRef]
  14. Yang, X.; Grussenmeyer, P.; Koehl, M.; Macher, H.; Murtiyoso, A.; Landes, T. Review of built heritage modelling: Integration of HBIM and other information techniques. J. Cult. Herit. 2020, 46, 350–360. [Google Scholar] [CrossRef]
  15. European Commission, Directorate-General for Communications Networks, Content and Technology. Study on Quality in 3D Digitisation of Tangible Cultural Heritage—Mapping Parameters, Formats, Standards, Benchmarks, Methodologies, and Guidelines—Executive Summary; Publications Office of the European Union: Luxembourg, 2022. [Google Scholar]
  16. Tucci, G.; Conti, A.; Fiorini, L. Geomatics for structural assessment and surface diagnostic of CH. Procedia Struct. Integr. 2018, 11, 2–11. [Google Scholar] [CrossRef]
  17. Counsell, J.; Taylor, T. What are the goals of HBIM? In Heritage Building Information Modelling; Routledge: London, UK, 2017; pp. 15–31. [Google Scholar]
  18. Greco, G.M.; Floridi, L. The tragedy of the digital commons. Ethics Inf. Technol. 2004, 6, 73–81. [Google Scholar] [CrossRef]
  19. Goodchild, M.F. Geographical information science. Int. J. Geogr. Inf. Syst. 1992, 6, 31–45. [Google Scholar] [CrossRef]
  20. Korro Bañuelos, J.; Rodríguez Miranda, Á.; Valle-Melón, J.M.; Zornoza-Indart, A.; Castellano-Román, M.; Angulo-Fornos, R.; Pinto-Puerto, F.; Acosta Ibáñez, P.; Ferreira-Lopes, P. The Role of Information Management for the Sustainable Conservation of Cultural Heritage. Sustainability 2021, 13, 4325. [Google Scholar] [CrossRef]
  21. Wijesundara, C.; Sugimoto, S. Metadata model for organizing digital archives of tangible and intangible cultural heritage, and linking cultural heritage information in digital space. Libr. Inf. Sci. Res. E-J. 2018, 28, 58–80. [Google Scholar]
  22. ECHOES-ECCCH. The Cultural Heritage Cloud. Available online: https://www.echoes-eccch.eu (accessed on 9 December 2024).
  23. ESPADON. Available online: https://espadon.net/a-propos/ (accessed on 30 October 2024).
  24. De Luca, L. A digital ecosystem for the multidisciplinary study of Notre-Dame de Paris. J. Cult. Herit. 2024, 65, 206–209. [Google Scholar] [CrossRef]
  25. De Rosnay, M.D.; Stalder, F. Digital commons. Internet Policy Rev. 2020, 9, 15-p. [Google Scholar]
  26. Di Giorgio, S. Cultural Commons, la sfida dei beni. DigItalia 2013, 7, 151–155. Available online: https://digitalia.cultura.gov.it/article/view/580 (accessed on 9 December 2024).
  27. Pamart, A.; Abergel, V.; de Luca, L.; Veron, P. Toward a Data Fusion Index for the Assessment and Enhancement of 3D Multimodal Reconstruction of Built Cultural Heritage. Remote Sens. 2023, 15, 2408. [Google Scholar] [CrossRef]
  28. Niccolucci, F.; Markhoff, B.; Theodoridou, M.; Felicetti, A.; Hermon, S. The Heritage Digital Twin: A bicycle made for two. The integration of digital methodologies into cultural heritage research [version 1; peer review: 2 approved with reservations]. Open Res. Europe 2023, 3, 64. [Google Scholar] [CrossRef]
  29. CIDOC-CRM. Available online: https://cidoc-crm.org/Event/iso-211272023-has-been-released (accessed on 10 December 2024).
  30. Čeko, A.; De Walsche, J.; Vannucchi, F. What is Architecture? A Contested History of the Discipline and its Embedded Meanings. In Architecture’s Afterlife; Routledge: London, UK, 2024; pp. 22–33. [Google Scholar]
  31. Pollio, M.V. L’Architettura colla Traduzione Italiana e Comento del Marchese Berardo Galiani; Stamperia Simoniana: London, UK, 1758. [Google Scholar]
  32. Vesely, D.; Stara, A.; Carl, P. Architecture as a humanistic discipline. In The Latent World of Architecture; Routledge: London, UK, 2022; pp. 151–164. [Google Scholar]
  33. Leach, N. Rethinking Architecture: A Reader in Cultural Theory, 1st ed.; Routledge: London, UK, 1997. [Google Scholar] [CrossRef]
  34. Rossi, A. Architettura per i musei. In Teoria della Progettazione Architettonica; Samonà, G., Ed.; Dedalo: Bari, Italy, 1968; pp. 122–137. [Google Scholar]
  35. Brand, S. How Buildings Learn: What Happens after They’re Built; Penguin: London, UK, 1995. [Google Scholar]
  36. Fusco Girard, L. The Circular “Human-Centred” Adaptive Reuse of Cultural Heritage: Theoretical Foundations. In Adaptive Reuse of Cultural Heritage; Fusco Girard, L., Gravagnuolo, A., Eds.; Springer: Cham, Switzerland, 2024. [Google Scholar] [CrossRef]
  37. Sanpaolesi, P. Discorso sulla Metodologia del Restauro dei Monumenti; EDAM: Firenze, Italy, 1973; p. 63. [Google Scholar]
  38. Morin, E. La Sfida Della Complessità, Le Lettere. 2011. Available online: https://www.indiscreto.org/dobbiamo-riscoprire-la-complessita/ (accessed on 10 December 2024).
  39. Ceruti, M.; Parisi, G. Cosa Significa Complessità: Un Dialogo tra Giorgio Parisi e Mauro Ceruti. 2013. Available online: https://www.complexityinstitute.it/cosa-significa-complessita-un-dialogo-tra-parisi-e-ceruti/ (accessed on 10 December 2024).
  40. Allen, P.M. The importance of complexity for the research agenda in the built environment. Archit. Eng. Des. Manag. 2008, 4, 5–14. [Google Scholar] [CrossRef]
  41. Sigahi, T.F.; Sznelwar, L.I. Which complexity? A review of typologies and a framework proposal for characterizing complexity-based approaches. Kybernetes 2023, 53, 1374–1394. [Google Scholar] [CrossRef]
  42. Özyeşil, O.; Voroninski, V.; Basri, R.; Singer, A. A survey of structure from motion. Acta Numer. 2017, 26, 305–364. [Google Scholar] [CrossRef]
  43. Grussenmeyer, P.; Alby, E.; Assali, P.; Poitevin, V.; Hullo, J.F.; Smigiel, E. Accurate documentation in cultural heritage by merging TLS and high-resolution photogrammetric data. In Proceedings of the Videometrics, Range Imaging, and Applications XI, Munich, Germany, 23–26 May 2011; Remondino, F., Shortis, M.R., Eds.; Society of Photo-Optical Instrumentation Engineers (SPIE) Conference Series. Volume 8085, p. 808508. [Google Scholar] [CrossRef]
  44. Leica-Geosystems. Leica Cyclone ENTERPRISE. Available online: https://leica-geosystems.com/it-it/products/laser-scanners/software/leica-cyclone/leica-cyclone-enterprise (accessed on 30 October 2024).
  45. Bonora, V.; Meucci, A.; Conti, A.; Fiorini, L.; Tucci, G. Knowledge Representation of Built Heritage Mapping an Ad Hoc Data Model in OGC Standards: The Case Study of Pitti Palace in Florence, Italy. Int. Arch. Photogramm. Remote Sens. Spatial Inf. Sci. 2023, XLVIII-M-2-2023, 281–288. [Google Scholar] [CrossRef]
  46. Villafranca, M.d.M.; Lamolda, F.; Montufo, A.M.; Pérez, L.; Prados, B. El Sistema de Información de la Alhambra SIALH. Nuevas tecnologías en la tutela del Conjunto Monumental de la Alhambra y el Generalife. Virtual Archaeol. Rev. 2012, 3, 13–17. [Google Scholar] [CrossRef]
  47. Fassi, F.; Achille, C.; Mandelli, A.; Rechichi, F.; Parri, S. A New Idea of BIM System for Visualization, Web Sharing, and Using Huge Complex 3D Models for Facility Management. Int. Arch. Photogramm. Remote Sens. Spatial Inf. Sci. 2015, XL-5/W4, 359–366. [Google Scholar] [CrossRef]
  48. Mauro, A. From the Extraordinary Nature of the Great Pompeii Project to Planned Conservation. Int. Arch. Photogramm. Remote Sens. Spatial Inf. Sci. 2019, XLII-2/W11, 867–871. [Google Scholar] [CrossRef]
  49. Matrone, F.; Colucci, E.; Iacono, E.; Ventura, G.M. The HBIM-GIS Main10ance Platform to Enhance the Maintenance and Conservation of Historical Built Heritage. Sensors 2023, 23, 8112. [Google Scholar] [CrossRef]
  50. Néroulidis, A.; Pouyet, T.; Tournon, S.; Rousset, M.; Callieri, M.; Manuel, A.; Abergel, V.; Malavergne, O.; Cao, I.; Roussel, R.; et al. A Digital Platform for the Centralization and Long-Term Preservation of Multidisciplinary Scientific Data Belonging to the Notre Dame de Paris Scientific Action. J. Cult. Herit. 2024, 65, 210–220. [Google Scholar] [CrossRef]
  51. Brumana, R.; Quilici, S.; Oliva, L.; Previtali, M.; Gabriele, M.; Stanga, C. Multi-Sensor HR Mass Data Models Toward Multi-Temporal-Layered Digital Twins: Maintenance, Design and XR Informed Tour of the Multi-Stratified Appian Way (PAAA). Sensors 2023, 23, 8556. [Google Scholar] [CrossRef]
  52. INSPIRE BU. Data Specification on Buildings—Technical Guidelines, Version 3.0, European Commission Joint Research Centre. 2014. Available online: http://inspire.ec.europa.eu/id/document/tg/bu (accessed on 7 September 2023).
  53. Kolbe, T.H.; Kutzner, T.; Smyth, S.T.; Nagel, C.; Roensdorf, C.; Heazel, C. OGC City Geography Markup Language (CityGML): Conceptual Model Standard. 2021. Available online: http://www.opengis.net/doc/IS/CityGML-1/3.0 (accessed on 31 January 2023).
  54. ISO/TC 211; Technical Committees, Geographic Information/Geomatics. ISO: Geneva, Switzerland, 1994. Available online: https://www.iso.org/committee/54904.html (accessed on 12 December 2024).
  55. Geography Markup Language (GML). Available online: https://www.ogc.org/it/publications/standard/gml/ (accessed on 12 December 2024).
  56. ISO 19107:2019; Geographic Information—Spatial Schema. ISO: Geneva, Switzerland, 2019. Available online: https://www.iso.org/standard/66175.html (accessed on 12 December 2024).
  57. Noardo, F. Architectural heritage semantic 3D documentation in multi-scale standard maps. J. Cult. Herit. 2018, 32, 156–165. [Google Scholar] [CrossRef]
  58. Fernández-Freire, C.; Del Bosque González, I.; Vicent, J.; Pérez Asensio, E.; Fraguas-Bravo, A.; González, A.; Fábrega-Álvarez, P.; Parcero-Oubiña, C. A Cultural Heritage Application Schema: Achieving Interoperability of Cultural Heritage Data in INSPIRE. Int. J. Spat. Data Infrastruct. Res. 2013, 8, 74–97. [Google Scholar] [CrossRef]
  59. Chiabrando, F.; Colucci, E.; Lingua, A.; Matrone, F.; Noardo, F.; Spanò, A. A European interoperable database (EID) to increase resilience of cultural heritage. Int. Arch. Photogramm. Remote Sens. Spat. Inf. Sci. 2018, XLII-3-W4, 151–158. [Google Scholar] [CrossRef]
  60. Gkadolou, E.; Prastacos, P.; Loupas, T. Documentation of cultural heritage monuments with CityGML: An application for ancient theatres. AGILE GIScience Ser. 2020, 1, 4. [Google Scholar] [CrossRef]
  61. Corongiu, M. Modelling Railways in the Context of Interoperable Geospatial Data. Ph.D. Thesis, Technische Universität Braunschweig and University of Florence, Florence, Italy, 2021. Available online: https://hdl.handle.net/2158/1240386 (accessed on 30 March 2024).
  62. Lee, J.; Li, K.-J.; Zlatanova, S.; Kolbe, T.H.; Nagel, C.; Becker, T.; Kang, H.-Y. OGC® IndoorGML 1.1. 2020. Available online: http://www.opengis.net/doc/IS/indoorgml/1.1 (accessed on 31 January 2023).
  63. Kim, M.; Choi, H.-S.; Lee, J. Comparative Analysis of Building Models to Develop a Generic Indoor Feature Model. J. Korean Soc. Surv. Geod. Photogramm. Cartogr. 2021, 39, 297–311. [Google Scholar] [CrossRef]
  64. Claridades, A.R.C.; Choi, H.-S.; Lee, J. An Indoor Space Subspacing Framework for Implementing a 3D Hierarchical Network-Based Topological Data Model. ISPRS Int. J. Geo-Inf. 2022, 11, 76. [Google Scholar] [CrossRef]
  65. Kim, T.; Kim, K.-S.; Lee, J.; Li, K.-J. Extensions of IndoorGML 1.1—Indoor Affordance Spaces, OGC. 2022. Available online: http://www.opengis.net/doc/DP/IndoorGML1.1-IndoorAffordanceSpaces (accessed on 30 March 2024).
  66. CSI, OmniClass Construction Classification System (OCCS), Table 13: Spaces by Function, Table 14: Spaces by Form. 2014. Available online: http://www.omniclass.org (accessed on 7 September 2023).
  67. Diakite’, A.A.; Zlatanova, S.; Alattas, A.F.M.; Li, K.J. Towards Indoorgml 2.0: Updates and Case Study Illustrations. Int. Arch. Photogramm. Remote Sens. Spat. Inf. Sci. 2020, XLIII-B4-2020, 337–344. [Google Scholar] [CrossRef]
  68. Ledoux, H. Are your IndoorGML files valid? ISPRS Ann. Photogramm. Remote Sens. Spatial Inf. Sci. 2020, VI-4/W1-2020, 109–118. [Google Scholar] [CrossRef]
  69. Srivastava, S.; Maheshwari, N.; Rajan, K.S. Towards generating semantically-rich IndoorGML data from architectural plans. Int. Arch. Photogramm. Remote Sens. Spatial Inf. Sci. 2018, XLII-4, 591–595. [Google Scholar] [CrossRef]
  70. Li, K.-J.; Zlatanova, S.; Torres-Sospedra, J.; Perez-Navarro, A.; Laoudias, C.; Moreira, A. Survey on Indoor Map Standards and Formats. In Proceedings of the 2019 International Conference on Indoor Positioning and Indoor Navigation (IPIN), Pisa, Italy, 30 September–3 October 2019; pp. 1–8. [Google Scholar] [CrossRef]
  71. Wu, H. Integration of 2D Architectural Floor Plans into Indoor OpenStreetMap for Reconstructing 3D Building Models. Master’s Thesis, TU Delft, Delft University of Technology, Delft, The Netherlands, 2015. [Google Scholar]
  72. Mouratidis, G. Context Dependent Multimodal Routing in Indoor/Outdoor Environments Based on IndoorGML and OpenStreetMap. Master’s Thesis, Technische Universität München, Ingenieurfakultät Bau Geo Umwelt (BGU), Lehstuhl für Geoinformatik, Munich, Germany, 2015. Available online: https://mediatum.ub.tum.de/node?id=1291310&change_language=en (accessed on 30 March 2024).
  73. Sparx Systems. Enterprise Architect. Available online: https://sparxsystems.com/products/ea/ (accessed on 30 October 2024).
  74. Forlani Conti, M.; Facchinetti Bottai, F.; Baldini Giusti, L. Le mille stanze del Re. Firenze, Palazzo Pitti. Un organismo architettonico e le schede di catalogo. Boll. D’arte Minist. Per I Beni Attività Cult. 1979, 64, 79–82. [Google Scholar]
  75. ISO 19101-1:2014; Geographic Information—Reference Model—Part 1: Fundamentals. ISO: Geneva, Switzerland, 2014. Available online: https://www.iso.org/obp/ui/#iso:std:iso:19101:-1:ed-1:v1:en (accessed on 12 December 2024).
  76. INSPIRE Directive, Infrastructure for Spatial Information in Europe. Available online: https://inspire-geoportal.ec.europa.eu/srv/ita/catalog.search#/home (accessed on 12 December 2024).
  77. PostgreSQL. Available online: https://www.postgresql.org/ (accessed on 12 December 2024).
  78. West, M. Developing High Quality Data Models; Elsevier Science & Technology: Amsterdam, The Netherlands, 2011; ISBN 9780123751072. [Google Scholar]
  79. Forum on Information Standards in Heritage (FISH). Available online: https://heritage-standards.org.uk/ (accessed on 30 October 2024).
  80. Getty Vocabulary. Art and Architecture Thesaurus (AAT). Available online: https://www.getty.edu/research/tools/vocabularies/aat/ (accessed on 30 October 2024).
  81. Bonora, V.; Meucci, A.; Fiorini, L. Analysis of the Spatial-Semantic Coherence in the Getty AAT Vocabulary Data Structure—An Educational Experience. Int. Arch. Photogramm. Remote Sens. Spatial Inf. Sci. 2024, XLVIII-2/W4-2024, 79–85. [Google Scholar] [CrossRef]
  82. Schütz, M. Potree: Rendering Large Point Clouds in Web Browsers. Master’s Thesis, TU Wien, Wien, Austria, 2016. [Google Scholar]
  83. Schütz, M.; Ohrhallinger, S.; Wimmer, M. Fast Out-of-Core Octree Generation for Massive Point Clouds. Comput. Graph. Forum 2020, 39, 155–167. [Google Scholar] [CrossRef]
  84. Autodesk. ReCap Pro. Available online: https://www.autodesk.com/it/products/recap/free-trial (accessed on 30 October 2024).
  85. Veesus. Veesus Cad Plugins. Available online: https://www.veesus.com/software/ (accessed on 30 October 2024).
  86. Leica-Geosystems. Leica CloudWorx Plugin CAD. Available online: https://leica-geosystems.com/it-it/products/laser-scanners/software/leica-cloudworx (accessed on 30 October 2024).
  87. Tucci, G.; Conti, A.; Fiorini, L.; Corongiu, M.; Valdambrini, N.; Matta, C. M-BIM: A new tool for the Galleria dell’Accademia di Firenze. Virtual Archaeol. Rev. 2019, 10, 40–55. [Google Scholar] [CrossRef]
  88. Autodesk. AutoCAD Map 3D. Available online: https://www.autodesk.com/products/autocad/included-toolsets/autocad-map-3d (accessed on 30 October 2024).
  89. De Luca, L.; Busayarat, C.; Stefani, C.; Véron, P.; Florenzano, M. A semantic-based platform for the digital analysis of architectural heritage. Comput. Graph. 2011, 35, 227–241. [Google Scholar] [CrossRef]
  90. Puerto, A.; Castañeda, K.; Sánchez, O.; Peña, C.A.; Gutiérrez, L.; Sáenz, P. Building information modeling and complementary technologies in heritage buildings: A bibliometric analysis. Results Eng. 2024, 22, 102192. [Google Scholar] [CrossRef]
  91. Pocobelli, D.; Boehm, J.; Bryan, P.; Still, J.; Grau-Bové, J. BIM for heritage science: A review. Herit. Sci. 2018, 6, 30. [Google Scholar] [CrossRef]
  92. Duval, R. A Cognitive Analysis of Problems of Comprehension in a Learning of Mathematics. Educ. Stud. Math. 2006, 61, 103–131. [Google Scholar] [CrossRef]
  93. QGIS Development Team. Open Source Geospatial Foundation. QGIS Geographic Information System. Available online: https://qgis.org/ (accessed on 30 October 2024).
  94. Maseroli, R. Il nuovo sistema di riferimento geodetico nazionale: Stato attuale e prospettive future. Boll. Della Soc. Ital. Fotogramm. Topogr. 2013, 1, 67–83. [Google Scholar]
  95. Bonora, V.; Maseroli, R.; Mugnai, F.; Tucci, G. GNNS Control Network Supporting Large Historical Building Architectural Survey. Int. Arch. Photogramm. Remote Sens. Spat. Inf. Sci. 2021, XLVI-M-1-2021, 87–91. [Google Scholar] [CrossRef]
  96. Donkers, S. Automatic Generation of CityGML LoD3 Building Models from IFC Models. Ph.D. Thesis, Delft University of Technology, Delft, The Netherlands, 2013. [Google Scholar]
  97. Nikoohemat, S.; Diakité, A.; Lehtola, V.; Zlatanova, S.; Vosselman, G. Consistency grammar for 3D indoor model checking. Trans. GIS 2021, 25, 189–212. [Google Scholar] [CrossRef]
  98. Kolbe, T.H.; Plümer, L. Bridging the gap between GIS and CAAD: Geometry, referencing, representations, standards and semantic modelling. GIM Int. 2004, 18, 12–15. [Google Scholar]
  99. Alattas, A.; Oosterom, P.; Zlatanova, S.; Diakité, A.; Yan, J.; Netherlands, T. Developing a database for the LADM-IndoorGML model. In Proceedings of the 6th International FIG 3D Cadastre Workshop, Delft, The Netherlands, 2–4 October 2018; Available online: http://resolver.tudelft.nl/uuid:978df943-9c14-4389-8c8e-f0d14c94e72c (accessed on 30 March 2024).
  100. Yan, J.; Diakité, A.A.; Zlatanova, S. A generic space definition framework to support seamless indoor/outdoor navigation systems. Trans. GIS 2019, 23, 1273–1295. [Google Scholar] [CrossRef]
  101. pgRouting—Extends the PostGIS/PostgreSQL Geospatial Database. Available online: https://pgrouting.org/index.html (accessed on 13 December 2024).
  102. Kontarinis, A.; Zeitouni, K.; Marinica, C.; Vodislav, D.; Kotzinos, D. Towards a semantic indoor trajectory model: Application to museum visits. Geoinformatica 2021, 25, 311–352. [Google Scholar] [CrossRef]
Figure 1. Surface model of Pitti Palace.
Heritage 08 00115 g001
Figure 2. Schema of the adopted workflow.
Heritage 08 00115 g002
Figure 3. UML of the “Pitti Data Model”: geospatial elements are highlighted in gray; management aspects in purple; historical aspects related to the naming of spaces over time in green; elements describing the 3D survey process in blue; and finally, sub-elements related to spaces and their properties are indicated in red and yellow.
Heritage 08 00115 g003
Figure 4. Summary of the data structure of the “Pitti Data Model”: geospatial elements are highlighted in gray; management aspects in purple; historical aspects related to the naming of spaces over time in green; elements describing the 3D survey process in blue; and finally, sub-elements related to spaces and their properties are indicated in red and yellow.
Heritage 08 00115 g004
Figure 5. SQL code for creating Room and Ceiling tables.
Heritage 08 00115 g005
Figure 6. Example of CodeLists used in the “Pitti data model” to characterize the “Room” type, as well as the “Wall”, “Floor”, and “Ceiling” types, materials, and finishes. For these lists, the corresponding Getty identification code has been specified, while for others, such as “SpaceManagement”, the proper names of the responsible institutions have been provided. The image shows the point model of the Sala di Giovanni da San Giovanni in the Museo del Tesoro dei Granduchi with the relevant terms highlighted in yellow in the related CodeLists. In the red boxes, a summary view of the same information is provided.
Heritage 08 00115 g006
Figure 7. Point cloud of the test area uploaded to a local server and visualized in Potree viewer.
Heritage 08 00115 g007
Figure 8. CAD drawing, highlighted in red are the exported elements of the first-floor test area (polylines of spaces and openings, room description tables, blocks for dimensioning openings, and floor elevations).
Heritage 08 00115 g008
Figure 9. Schematic summary of the workflow adopted for the export (from CAD) and import (into GIS) of primitives and the association of non-geometric information to their respective geometries through spatial joins.
Heritage 08 00115 g009
Figure 10. Imported elements in QGIS (first floor of the test area): (a) polygons rooms; (b) polygons stairs; (c) polygons open spaces; (d) polygons doors; (e) polygons windows; (f) points corresponding to the coordinates of the insertion point of the block instances of the space description tables and blocks used for dimensioning openings; (g) points corresponding to the coordinates of the floor elevation point.
Heritage 08 00115 g010
Figure 11. Three-dimensional visualization of the test area.
Heritage 08 00115 g011
Figure 12. Three-dimensional view of the Ammannati Staircase in QGIS—ramps are highlighted in yellow.
Heritage 08 00115 g012
Figure 13. UML IndoorGML: the classes of the Core Module are in grey, and the classes of the Navigation Module are in blue. The UML diagram can be downloaded in EAP format from https://github.com/AdeleM-source/DHEMSY/tree/main (accessed on 13 March 2025).
Heritage 08 00115 g013
Figure 14. UML model of IndoorGML related to the “Pitti Data Model”. The classes of the IndoorGML Core Module are in grey, in blue the classes of the IndoorGML Navigation Module and in white the classes of the “Pitti Data Model”. The UML diagram can be downloaded in EAP format from https://github.com/AdeleM-source/DHEMSY/tree/main (accessed on 13 March 2025).
Heritage 08 00115 g014
Figure 15. Codelist examples for GeneralSpaces (ClassType and FunctionType) conform to the terms and enumeration proposed in the IndoorGML technical specifications. Below, the terms have been added as ADEelements for the characterization of OpenSpaces, and the AnchorSpace codelists with the addition of the Windows as ADEelements. All terms added as ADEelements have been enumerated using the codes proposed by Getty’s AAT vocabulary.
Heritage 08 00115 g015
Figure 16. Model of the test area with the navigation graph.
Heritage 08 00115 g016
Figure 17. Query result: identification of spaces used as Museum Gallery (spaces divided by level, filtered by type, and calculation of total surface): the cell highlighted in green in the table shows the result of the query that identifies the total area of the rooms that, on level 11, are intended for a museum (highlighted in yellow).
Heritage 08 00115 g017
Figure 18. Query result: identification of Corridors (in the Class TransitionSpace; ClassType: HorizontalTransition; FunctionType: Corridor).
Heritage 08 00115 g018
Figure 19. Query result: identification of OpenSpaces (in the Class GeneralSpace; ClassType: sO-space; FunctionType: Balcony).
Heritage 08 00115 g019
Figure 20. Query results on navigation paths: public access/restricted access rooms and possible routes (blue = employee path, red = visitors path).
Heritage 08 00115 g020
Table 1. Example of data extracted from the descriptive tables of spaces in CAD drawings.
Block IDNameArea (m2)Height Min (m)Height Max (m)XYZ
Room11060Sala delle Nicchie242.396.7010.903999.697817.6671.56
11080Sala Verde140.167.1510.903982.727807.5071.56
11063-1.58-3.953989.797804.9871.56
VerticalPenetrationA0033Ammannati---3971.407787.8471.56
OpenSpaceC23Terrazza su Piazza---3989.787819.2471.56
Table 2. Example of data extracted from block instances used for opening dimensions in CAD drawings.
Block IDWindowsill Height (m)Window Height (m)Window Width (m) Door Height (m)Door Width (m) XYZ
Door110178---4.402.053990.107818.7871.56
110184---5.102.373988.017797.9871.56
Window1101720.973.501.83--4014.897809.3471.56
Disclaimer/Publisher’s Note: The statements, opinions and data contained in all publications are solely those of the individual author(s) and contributor(s) and not of MDPI and/or the editor(s). MDPI and/or the editor(s) disclaim responsibility for any injury to people or property resulting from any ideas, methods, instructions or products referred to in the content.

