Communication

Open-Access Infrared Spectra Depository for the Damage Assessment of Parchment

by
Charis Theodorakopoulos
1,* and
Marianne Odlyha
2
1
School of Design, Arts and Creative Industries, Science in Conservation of Fine Art, Northumbria University, Newcastle Upon Tyne NE1 8ST, UK
2
School of Natural Sciences, Birkbeck, University of London, Malet St., London WC1E 7HX, UK
*
Author to whom correspondence should be addressed.
Heritage 2025, 8(3), 110; https://doi.org/10.3390/heritage8030110
Submission received: 22 January 2025 / Revised: 6 March 2025 / Accepted: 13 March 2025 / Published: 19 March 2025
(This article belongs to the Section Cultural Heritage)

Abstract

:
An open-access infrared spectroscopy database of reference and historical parchments has been developed at Northumbria University in collaboration with Birkbeck, University of London. The resource includes the spectra acquired with attenuated total reflectance/Fourier transform infrared (ATR/FTIR) spectroscopy for a wide range of parchments, which were studied in the EU 5th Framework project “Improved Damage Assessment of Parchment” (IDAP). The parchment samples include reference samples, samples exposed to dry and humid heat, light, and inorganic gaseous pollutants, as well as parchments from three archives: Archivio di Stato di Firenze; the National Archives, Scotland; and the Royal Library and Royal Danish Academy—Architecture, Design, Conservation, Copenhagen. The database is invaluable for scholars, including archivists, conservation scientists, conservators, librarians, curators, and the general public, as to the best of our knowledge such a resource has not previously existed.

1. Introduction

Parchment is a complex material that is obtained from animal skins, commonly of sheep, goat, camel, and calf, and has been used as a support for writing documents and as a covering material for bookbinding for at least five millennia. Although, according to Pliny the Elder, the production and use of parchment for writing was established by the Library of Pergamon in the Hellenistic period (323–30 BC), early evidence of writing on processed skins comes earlier than 2750 BC in Egypt, and later by the Assyrians and the Babylonians at least since the sixth century BC [1]. The heyday of parchment use was during the Medieval period in Europe, although it is still used in some countries for certain governmental documents and diplomas. The millennia-long use of parchment has resulted in the development of major collections of significant documents, scrolls, books, and bookbindings across the world.
The preservation of parchment artefacts represents an important challenge for conservators and scientists due to its sensitivity to environmental changes, including fluctuations in temperature and humidity, concentration of air pollutants, and light exposure, leading to complex deterioration procedures [2,3,4]. Protocols of damage assessment for parchment [3,4] have been established to assist in the development of preventive and remedial conservation strategies given the complexity of deterioration, which cannot always be empirically or visually appreciated. Accordingly, specific environmental conditions for each damage category for historical parchment have recently been established [5].
When manufacturing parchment from animal hides, the epidermis and subcutaneous layers of the processed skin are removed, and parchment consists mainly of the dermis layer, which is composed of 95% collagen type 1 [2]. Often, parts contained in the hide ground substance made of mucopolysaccharides, mucoproteins, and other non-fibrous proteins are found, along with lipids, but the predominant polymer of parchment, on which its condition is dependent, is collagen. Thus, in order to thoroughly study the condition of parchment, advanced analytical studies on the macro-, meso-, micro-, and nanoscales of its main constituent, collagen, are required [3,4]. The impact of the manufacturing procedures and the residues of chemicals employed in manufacturing, or introduced upon ageing and conservation, must be also taken into consideration. For example, after liming baths, processed skins are hung and stretched to dry under the sun, receiving a considerable dose of ultraviolet (UV) light, under which the lime reacts with carbon dioxide from the air and produces calcium carbonate in the parchment. This may also contain sodium sulphide, which was often added to lime baths from the nineteenth century to speed up the process [2]. Other manufacturing procedures include rubbing the flesh side with pumice powder and adding chalk powder to prevent inks from running upon writing [2]. The state of preservation of the parchment is almost exclusively assessed from the chemical and physical properties of the protein collagen, as the main component of parchment [2,3,4,6].
As a result of manufacturing methods, the collagen-based polymer network of freshly made parchment is partially damaged by partial hydrolysis, oxidation, and localised gelatinisation when compared to collagen molecules of original animal skin [6]. Mounting, stretching, and air drying parchment also align collagen molecules, so their arrangement is different from that in the original hide. Drying-induced dehydration of the skin results in a reduced D-spacing from 65.5 nm to 64 nm between collagen fibrils [6]. Also, the liming procedure reduces the denaturation or shrinkage temperature of collagen from 63 °C in fresh hide down to 50.6 °C [6]. Moreover, the increased alkalinity in liming baths (pH 10–12) affects the isoelectric point of collagen, neutralising the positively charged lysine amino acid (AA) residues, which actively participate in proteoglycan–collagen interactions.
Evaluation of Ageing of Parchment
The main reasons for post-manufacturing deterioration, excluding mechanical fatigue, are oxidation, hydrolysis, light irradiation, and fluctuations in relative humidity (RH) and temperature. Oxidation that is initiated by free radicals, which are generated by UV light, heating, and the action of gas pollutants (SO2 and NO2) [7], eventually result in the breakdown of collagen molecules and changes in the ion charge balance and cross-linking capabilities of the AA side chains [8]. Hydrolysis is commonly caused by exposure to atmospheric gas pollutants, such as sulphur dioxide (SO2) and nitric dioxide (NO2), which in combination with water, are converted into sulfuric and nitric acids [6], leading to the scission of the main peptide chains between two adjacent AA residues. Thus, heavily damaged parchments consist of many, short polypeptide chains when compared to less degraded parchment [6]. UV and visible light irradiation can result in photolysis of water into ·H and ·OH radicals and radicals generated from the side chains of the AA residues, which result in partial fragmentation of collagen molecules and cross-linking [9]. Fluctuations in RH result in fluctuations in stretching and shrinking of the parchment, leading to mechanical deformation [10]. Long-term exposure to high RH levels (>70%) may cause bacterial and fungal growth, whereas prolonged exposure to low RH levels (<25%) promotes the formation of cross-links between adjacent collagen molecules via the condensation of carboxyl and amino groups on neighbouring AA side chains [10], resulting in a stiffer collagen. Elevated temperatures lead to the cleavage of the hydrogen bonds that stabilise the triple-helical structure of collagen, the main component of parchment, resulting in its local unfolding [11] and in denaturation, which eventually leads to complete gelatinisation. Prolonged heating can result in random uncoiling of the native triple-helical structure, which then results in shrinkage [12].
Several empirical and analytical techniques have been employed for the characterisation of collagen in parchment. The former include visual observations of collagen fibres and the determination of the hydrothermal stability using a micro-hot table [13], and the latter include advanced scientific techniques, including scanning electron microscopy (SEM) [3], atomic force microscopy (AFM) [4,14], amino acid analysis (AA) [3], dynamic mechanical thermal analysis (DMA) [4], differential scanning calorimetry (DSC) [3,4], as well as vibrational spectroscopic techniques such as Raman spectroscopy [15] and Fourier transform infrared (FTIR) spectroscopy [16,17,18,19]. Among these techniques, FTIR spectroscopy has significant potential in the damage assessment of collagen in parchment, as in other collagen-based materials, due to its prompt, non-destructive, affordable, and reliable results. FTIR spectroscopy provides information at the molecular level regarding the presence of functional groups, interactions with inorganic components, and conformations of bonds, which reflect the condition of the molecular structure of collagen [20,21].
By monitoring the condition of materials like parchment at the molecular level, damage assessment of the backbone collagen polymer is performed, which is more reliable compared to the often-misleading evaluation of the physical appearance. For example, FTIR spectrometry has been used successfully to differentiate between parchments that appear very deteriorated but are not as degraded as parchment samples that appear in a better condition [4,16].
The reliability of FTIR spectroscopy for the damage assessment of parchment was demonstrated in the IDAP project [13,16], in which the results were validated against other analytical techniques. A systematic study of over 300 samples was performed and included newly produced parchments, accelerated aged parchments after exposure to controlled doses of light, heat, humidity, and NO2 and SO2 gases in various combinations, as well as historical parchments from three archives: Archivio di Stato di Firenze, Italy; the National Archives, Scotland; and the Royal Library and Royal Danish Academy—Architecture, Design, Conservation, Copenhagen, Denmark. This paper presents the compilation of these data in an open-access database–depository [22], which has recently been made available to support ongoing investigations for the damage assessment of parchment.

2. Materials and Methods

2.1. Parchment Samples

The new and accelerated aged parchments that were analysed were mostly processed from calf skin for the purposes of the IDAP project. The samples were named according to the organisation they were processed that was School of Conservation (SC), the hide code, e.g., SCxx, and the location on the hide with a sub-code, e.g., SCxx:1. Detailed information about the codes can be found elsewhere [13]. New parchment samples were given names such as SC69:1–SC69:5, SC70:1–SC70:5, SC81:1–SC81:5, SC82:1–SC82:5, etc. Some of these samples were aged under controlled conditions using (1) relative humidity, heat, and light irradiation at the School of Conservation, Copenhagen (Denmark) and (2) SO2 and/or NO2 gas pollutants at the Centre de Recherche sur la Conservation des Documents Graphics, Paris (France) [13]. The exact conditions of accelerated ageing as well as a description of the historical parchments used are summarised below.

2.2. Instrumentation

Attenuated total refection/Fourier transform IR (ATR/FTIR) spectra were recorded using a PE 2000 FTIR spectrometer, Perkin Elmer, Seer Green UK, with a triglycine sulfate (TGS) detector and a “SensIR Technologies” Durascope, Smith’s Detection; Danbury, CT, USA, placed in the sample compartment. This was fitted with a ZnSe internal reflectance element (IRE) held at 45° to the incident beam. Samples were kept firmly on the IRE by the built-in tip at 80% of the maximum adjustable force, as indicated by the readout system of the Durascope. The depth of penetration into samples at 1050 cm−1 was 2.01 μm. Spectra were recorded with both the flesh and grain sides of the parchment in contact with the IRE in the range 4000 to 800 cm−1 at a resolution of 4 cm−1. The data were processed using GRAMS32 AI software v.6.0 by Galactic®. All spectra resulted from 16 scans, and reproducibility was ensured by keeping the force between the samples and the ZnSe crystal constant. The data were organised in the categories of the treatment received in a downloadable database depository collection [22] using the Figshare repository platform.

3. Results and Discussion

The content of the database [22] is presented in the following sections. The spectra acquired are discussed in groups of the accelerated treatment received or the damage category of the historical parchments. The FTIR bands identified in the spectra are summarised in Table 1 below.

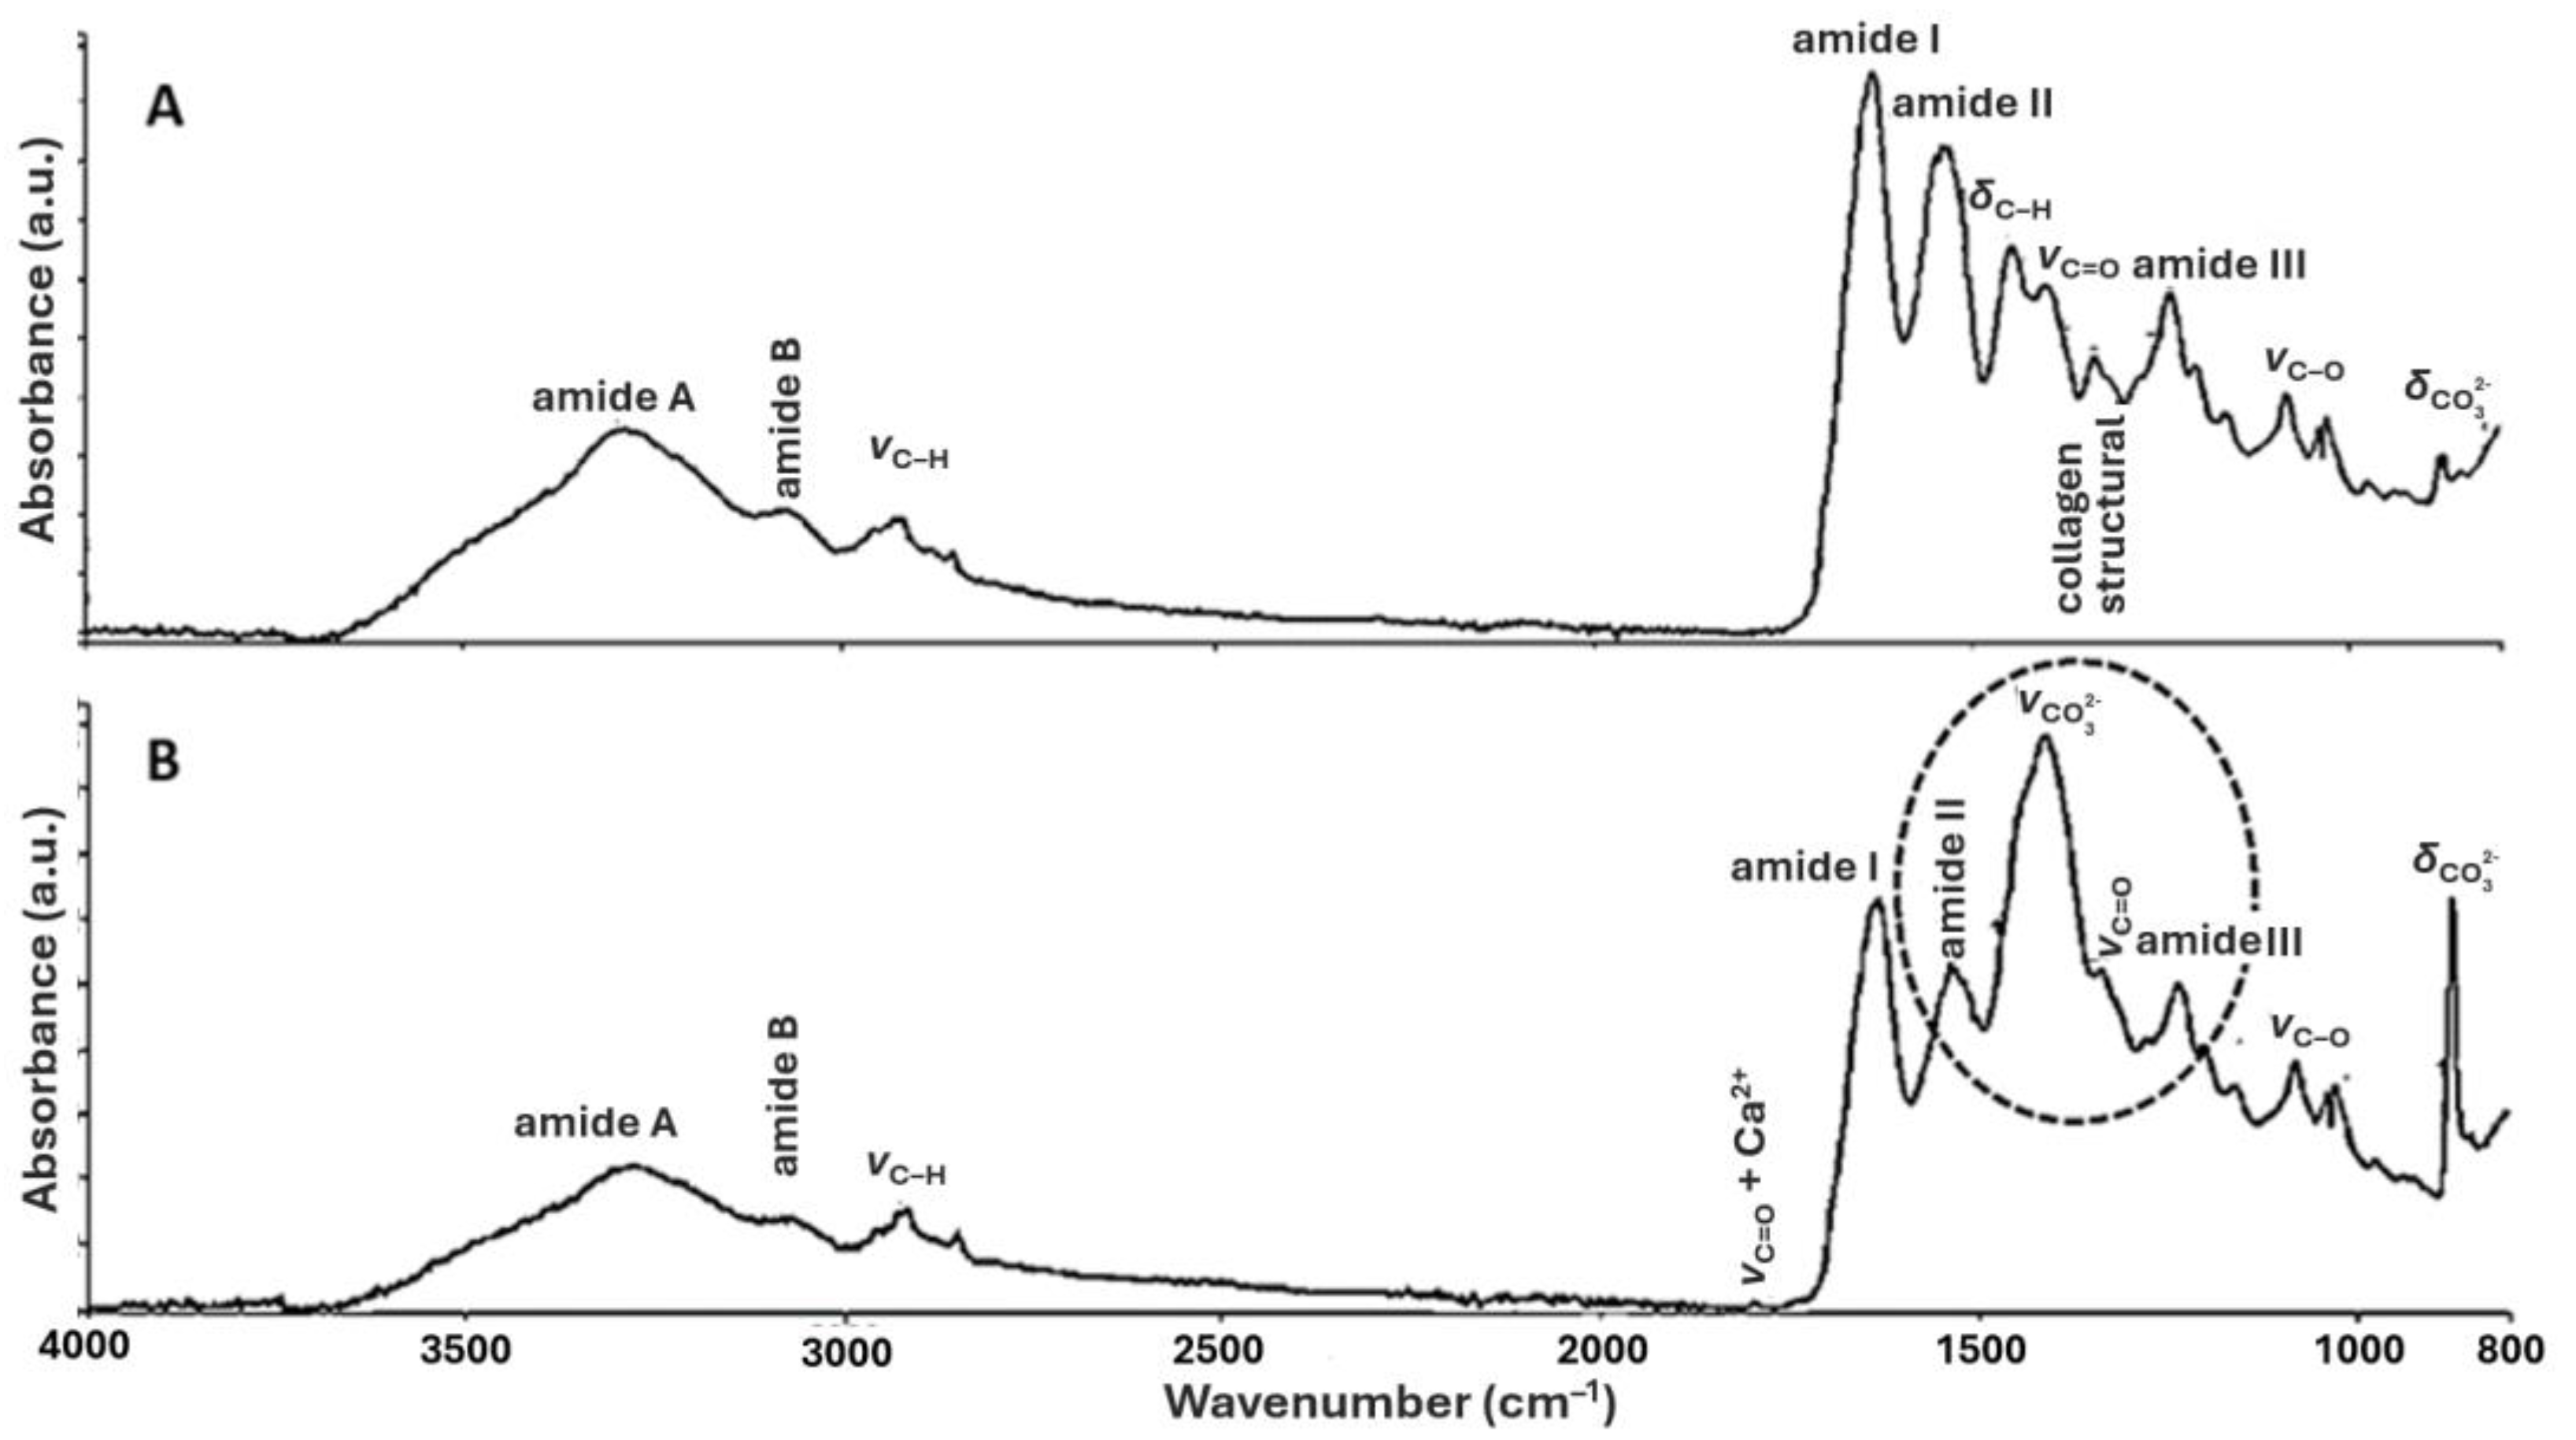
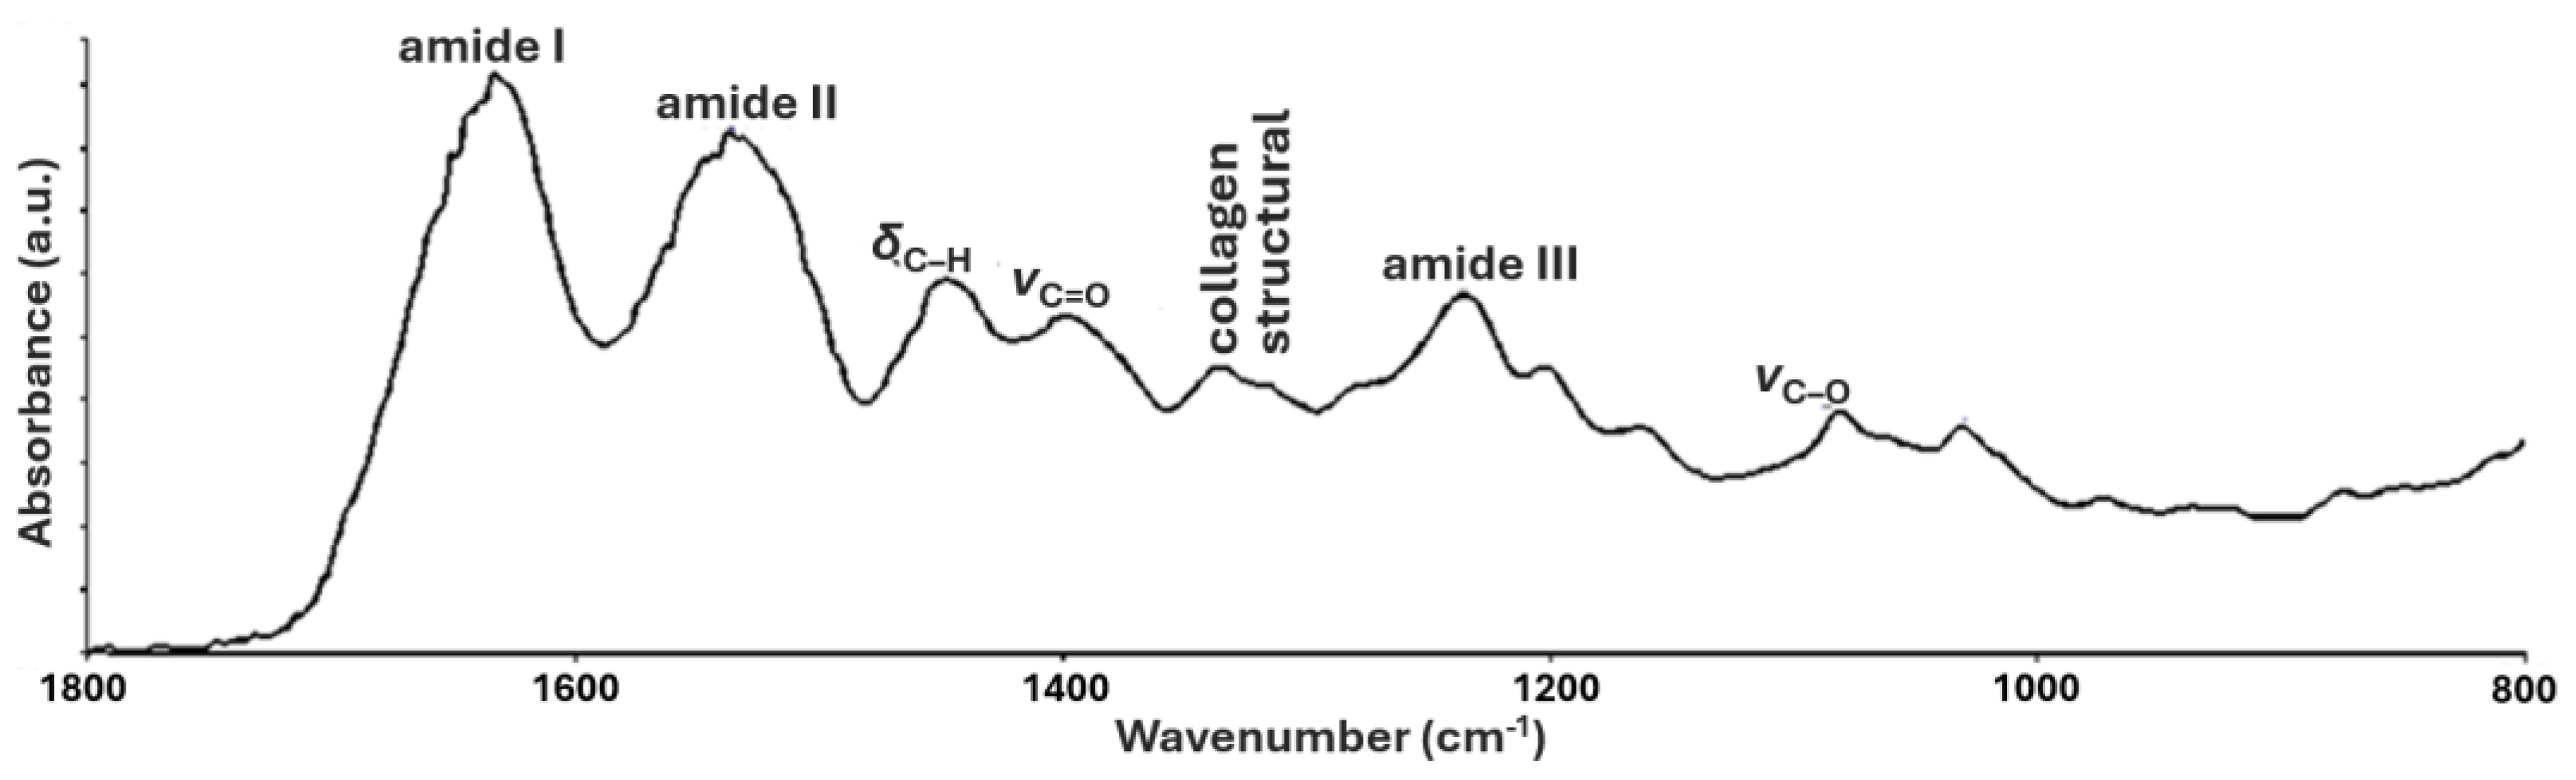
3.1. FTIR of New Parchments

Parchments with codes SC69, SC70, SC81, and SC82 were generated from calf skin and produced in Z.H. De Groot, the Netherlands in 2002. These parchments were cut into pieces for various experiments. The ATR/FTIR spectra of the control samples of these parchments not exposed to accelerated ageing via light, humid heat, or gas pollutants are included in the New Parchments FTIR group [23] of the database. The FTIR spectra of these control parchments were measured in 2004 both on the flesh and grain sides. The main features of the FTIR spectra were the following bands, peaking at 3283 cm−1 of amide A, which is associated with the hydrogen bonding of the N-H and the carbonyl groups of the peptide chain, 3073 cm−1 of amide B, 1630 cm−1 of amide I, 1536 cm−1 of amide II, and 1236 cm−1 of amide III, which are the typical bands for collagen type I. Detection of these bands confirmed the existence of the helical structure in the parchment collagen and changes in them provided evidence of damage [4,16].
The flesh side often included the dominant absorbance band at 1447 cm−1 due to carbonate asymmetric stretches of calcite, which interfered with the characteristic amide II band at 1536 cm−1 (Figure 1).
Therefore, the ATR/FTIR readings on the grain side of the parchments were considered more reliable than those on the flesh side for damage assessment, as the former allowed the examination of all the characteristic bands that monitored the state of the helical structure of collagen. As evidence of the systematic FTIR analysis of these parchments, the database includes both the flesh and grain sides of all samples, and in order to facilitate a thorough examination, it also includes the narrower wavenumber range of the fingerprint region (1800–800 cm−1), as shown in Figure 2.

3.2. FTIR of Accelerated Aged Parchments

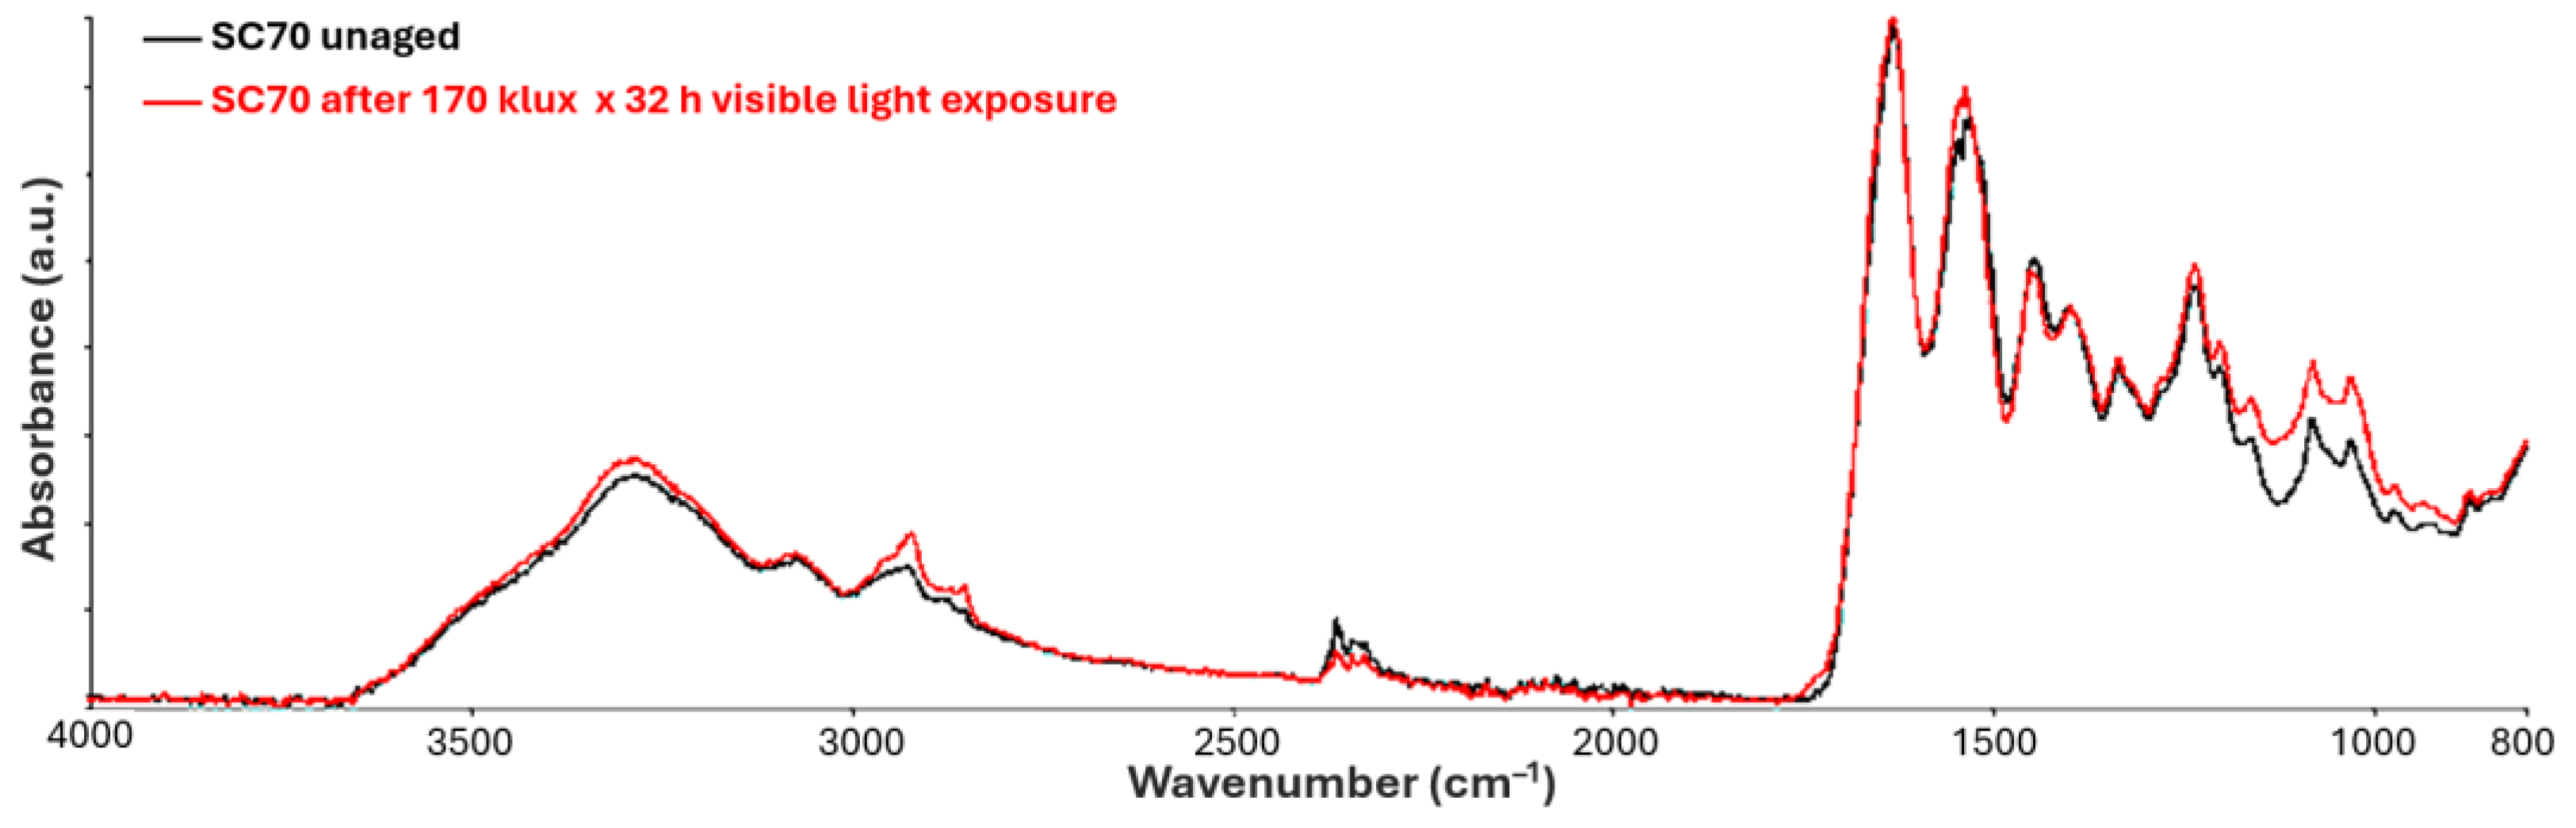
3.2.1. Visible Light Exposure

The database includes the spectra of the parchment samples taken from hide SC70 and exposed to visible light of 170 ± 1 klux at a constant 25 °C and 50% RH, for 4, 8, 16, and 32 h. Changes in absorbance were determined after normalising the spectra on the highest peak, amide I (~1630 cm−1), and in case of small differences, three measurements were taken, providing confidence in the assessment. The most characteristic spectra are included in the database [24]. Figure 3 demonstrates that, despite the difference in the light dose received spanning from 680 klux.hrs to 54.4 Mlux.hrs, ATR/FTIR detected subtle changes, including a slight increase in absorbance of amide A, which is related to the impact of light on the structural conformation of collagen and amide II, as well as an increase in the absorbance of the spectral line at wavelengths lower than 1160 cm−1, which includes bands attributed to ester bonds in carbohydrates [20].

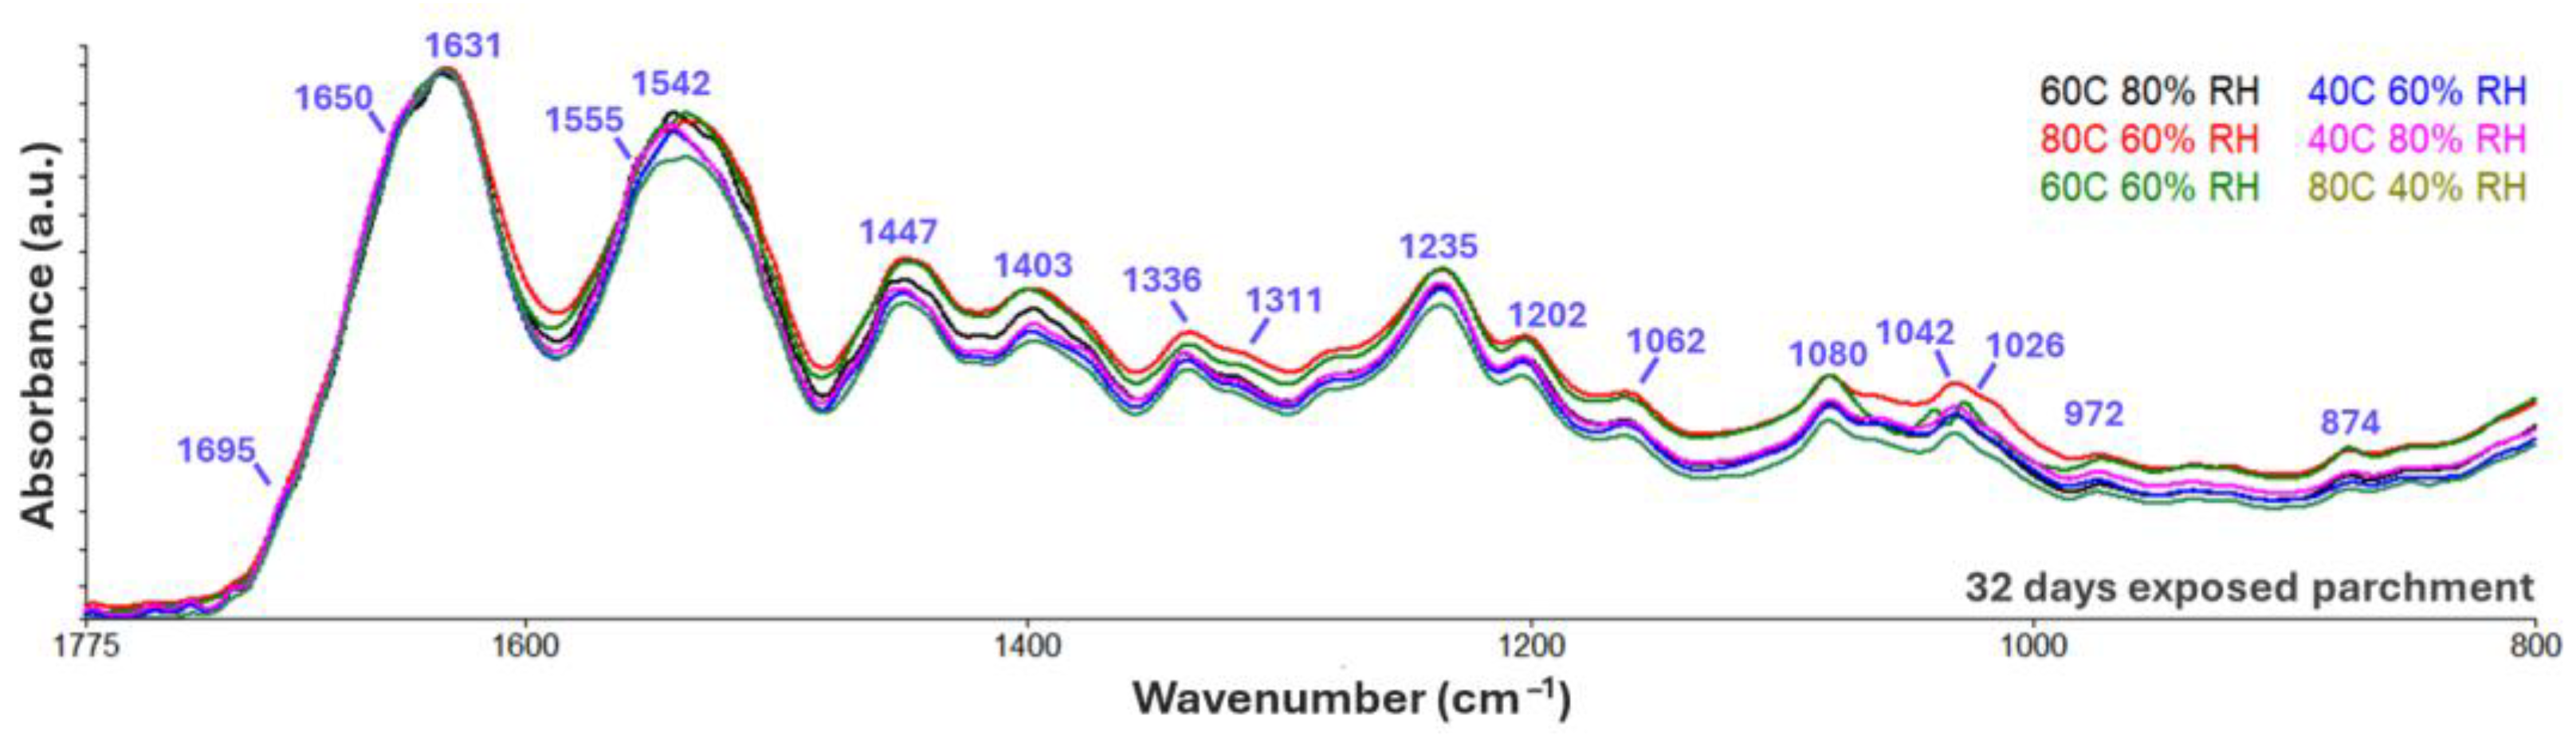
3.2.2. Humid Heat Exposure

Samples collected from hides SC69, SC81, and SC82 were heated (40–80 °C) under controlled relative humidity (40–80%) [15]. Samples were treated for up to 32 days under the conditions summarised in Table 2. A close examination of the spectra showed a subtle broadening of the amide I peak (Figure 4), which denotes the peptide secondary structure and hydrogen bonding between N–H and C=O in collagen [25]. The subtle broadening of amide I has been associated with a helix-coil transformation of collagen and decomposition of aggregated collagen fibrils [26].
The control (unexposed/unaged) parchment sample for the humid-heated accelerated aged samples was hide SC81 except for the 80 °C/80% RH series (SC102–SC107) [25], which was sampled from hide SC69, and the second 80 °C/40% RH series [30], which was sampled from hide SC70. These data contain useful information for the damage assessment of collagen in parchment, such as the subtle but quantifiable distance between amide I (1700–1625 cm−1) and amide II (1590–1480 cm−1) bands, and the gradual reduction of the 1660 cm−1 sub-band compared to the 1630 cm−1 sub-band within amide I, which are related to the helical- and random-coil collagen components, respectively [4,16], as shown in the example of Figure 4 on the 80 °C/40% RH series (SC151–SC155) [33] and samples SC70 exposed to the same conditions up to 16 days [34]. The ratio of these sub-bands at 1660 cm−1, due to the carbonyls of proline and hydroxyproline residues that are directed inwards in the triple helix and are capable of intramolecular hydrogen bonding, and 1630 cm−1, due to the amide carbonyls that are directed outwards in the triple helix and form relatively strong intermolecular hydrogen bonds with water molecules, has been crucial in the damage assessment of the IDAP parchments [16]. The ratio of sub-bands 1660 and 1690 cm−1 within amide I has been also considered as it represents cross-links in collagen type I, which has been studied in bone [35].
The accelerated ageing humid-heat conditions affected the degradation of collagen, as shown in the spectra of the 32-day-exposed parchments in the various conditions tested (Figure 5). The ATR/FTIR data of the accelerated aged parchments that are presented in the database are further supported with complementary data from microscopic observations, shrinkage temperature readings, and thermoanalytical techniques [13,16]. Furthermore, micro-differential scanning calorimetry is in line with these data, showing that parchment withstands exposure to 40 °C when there is an RH ≤ 60%, but at an RH of 60–80%, both stability and the energy distribution between various collagen populations are affected, leading to denaturation when combined with higher temperatures, e.g., for 80% RH and 60–80 °C [36].

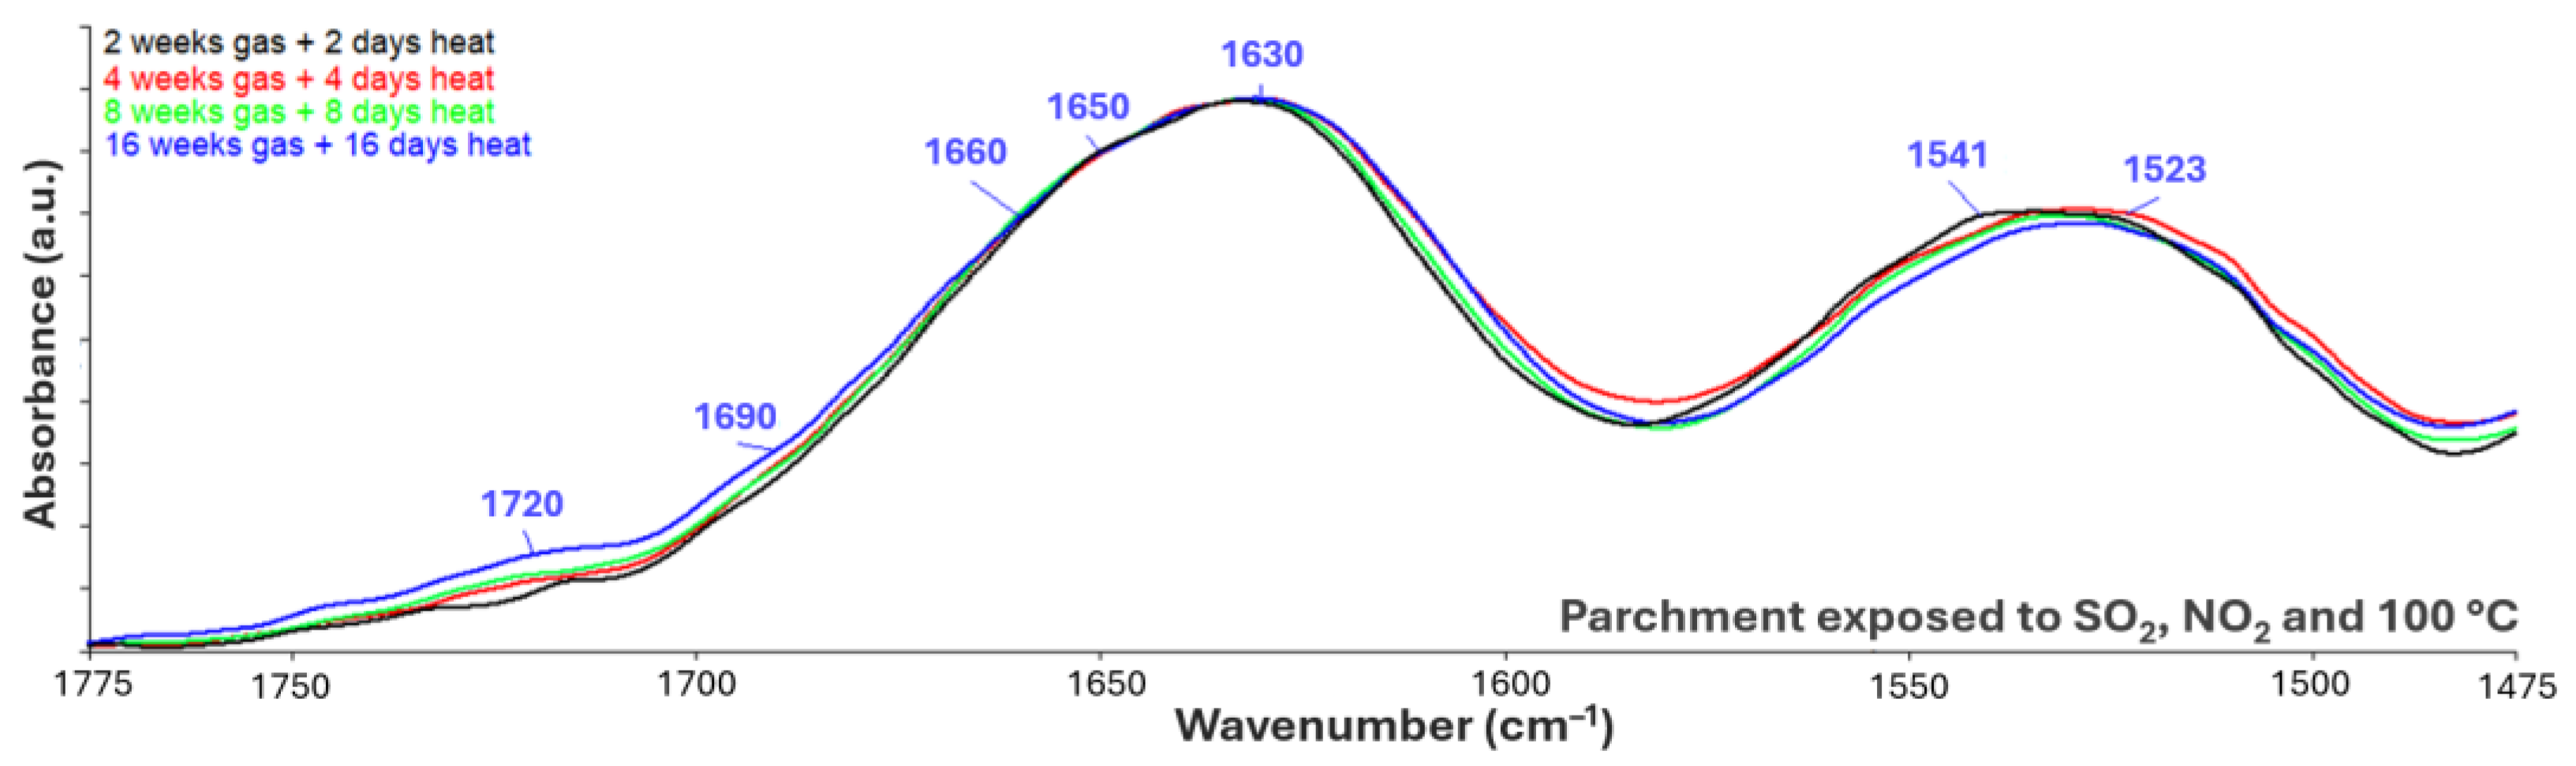
3.2.3. Exposure to Inorganic Gases, and Combinations of Light and Heat Ageing

These groups of parchment samples were processed from hide SC70 and were exposed to 50 ppm NO2 and/or SO2 at 25 °C and 50% RH for up to 16 weeks at the Centre de Recherche sur la Conservation des Documents Graphics, Paris (France), and some groups were further exposed to 170 klux visible light for up to 32 h and to 100 °C for up to 16 days, as shown in Table 3.
These series of samples targeted the hydrolytic degradation of collagen and the synergistic action of light and heat to enable the study of the gradual denaturation of collagen. Figure 6 shows an example of the observations monitored by ATR/FTIR of the parchments exposed to SO2 and NO2 pollutants for 2 to 4 weeks and 100 °C for 2–16 days (CR54–CR57). There were apparent changes in the amide I and amide II bands. Namely, there was a broadening of the amide I peak towards the higher wavenumber side, where the increase in 1660 and 1690 cm−1 compared to 1630 cm−1 represented the gradual degradation of the helical structure and the formation of cross-links of random coils in collagen, respectively. Moreover, the gradual shifts of the amide II peak to lower wavenumbers than 1540 cm−1 indicated the eventual denaturation of collagen [16], which, in this case, is related to the synergy of heat exposure and the hydrolysis-induced scission of the main peptide chains between AA residues along the helical backbone of collagen.

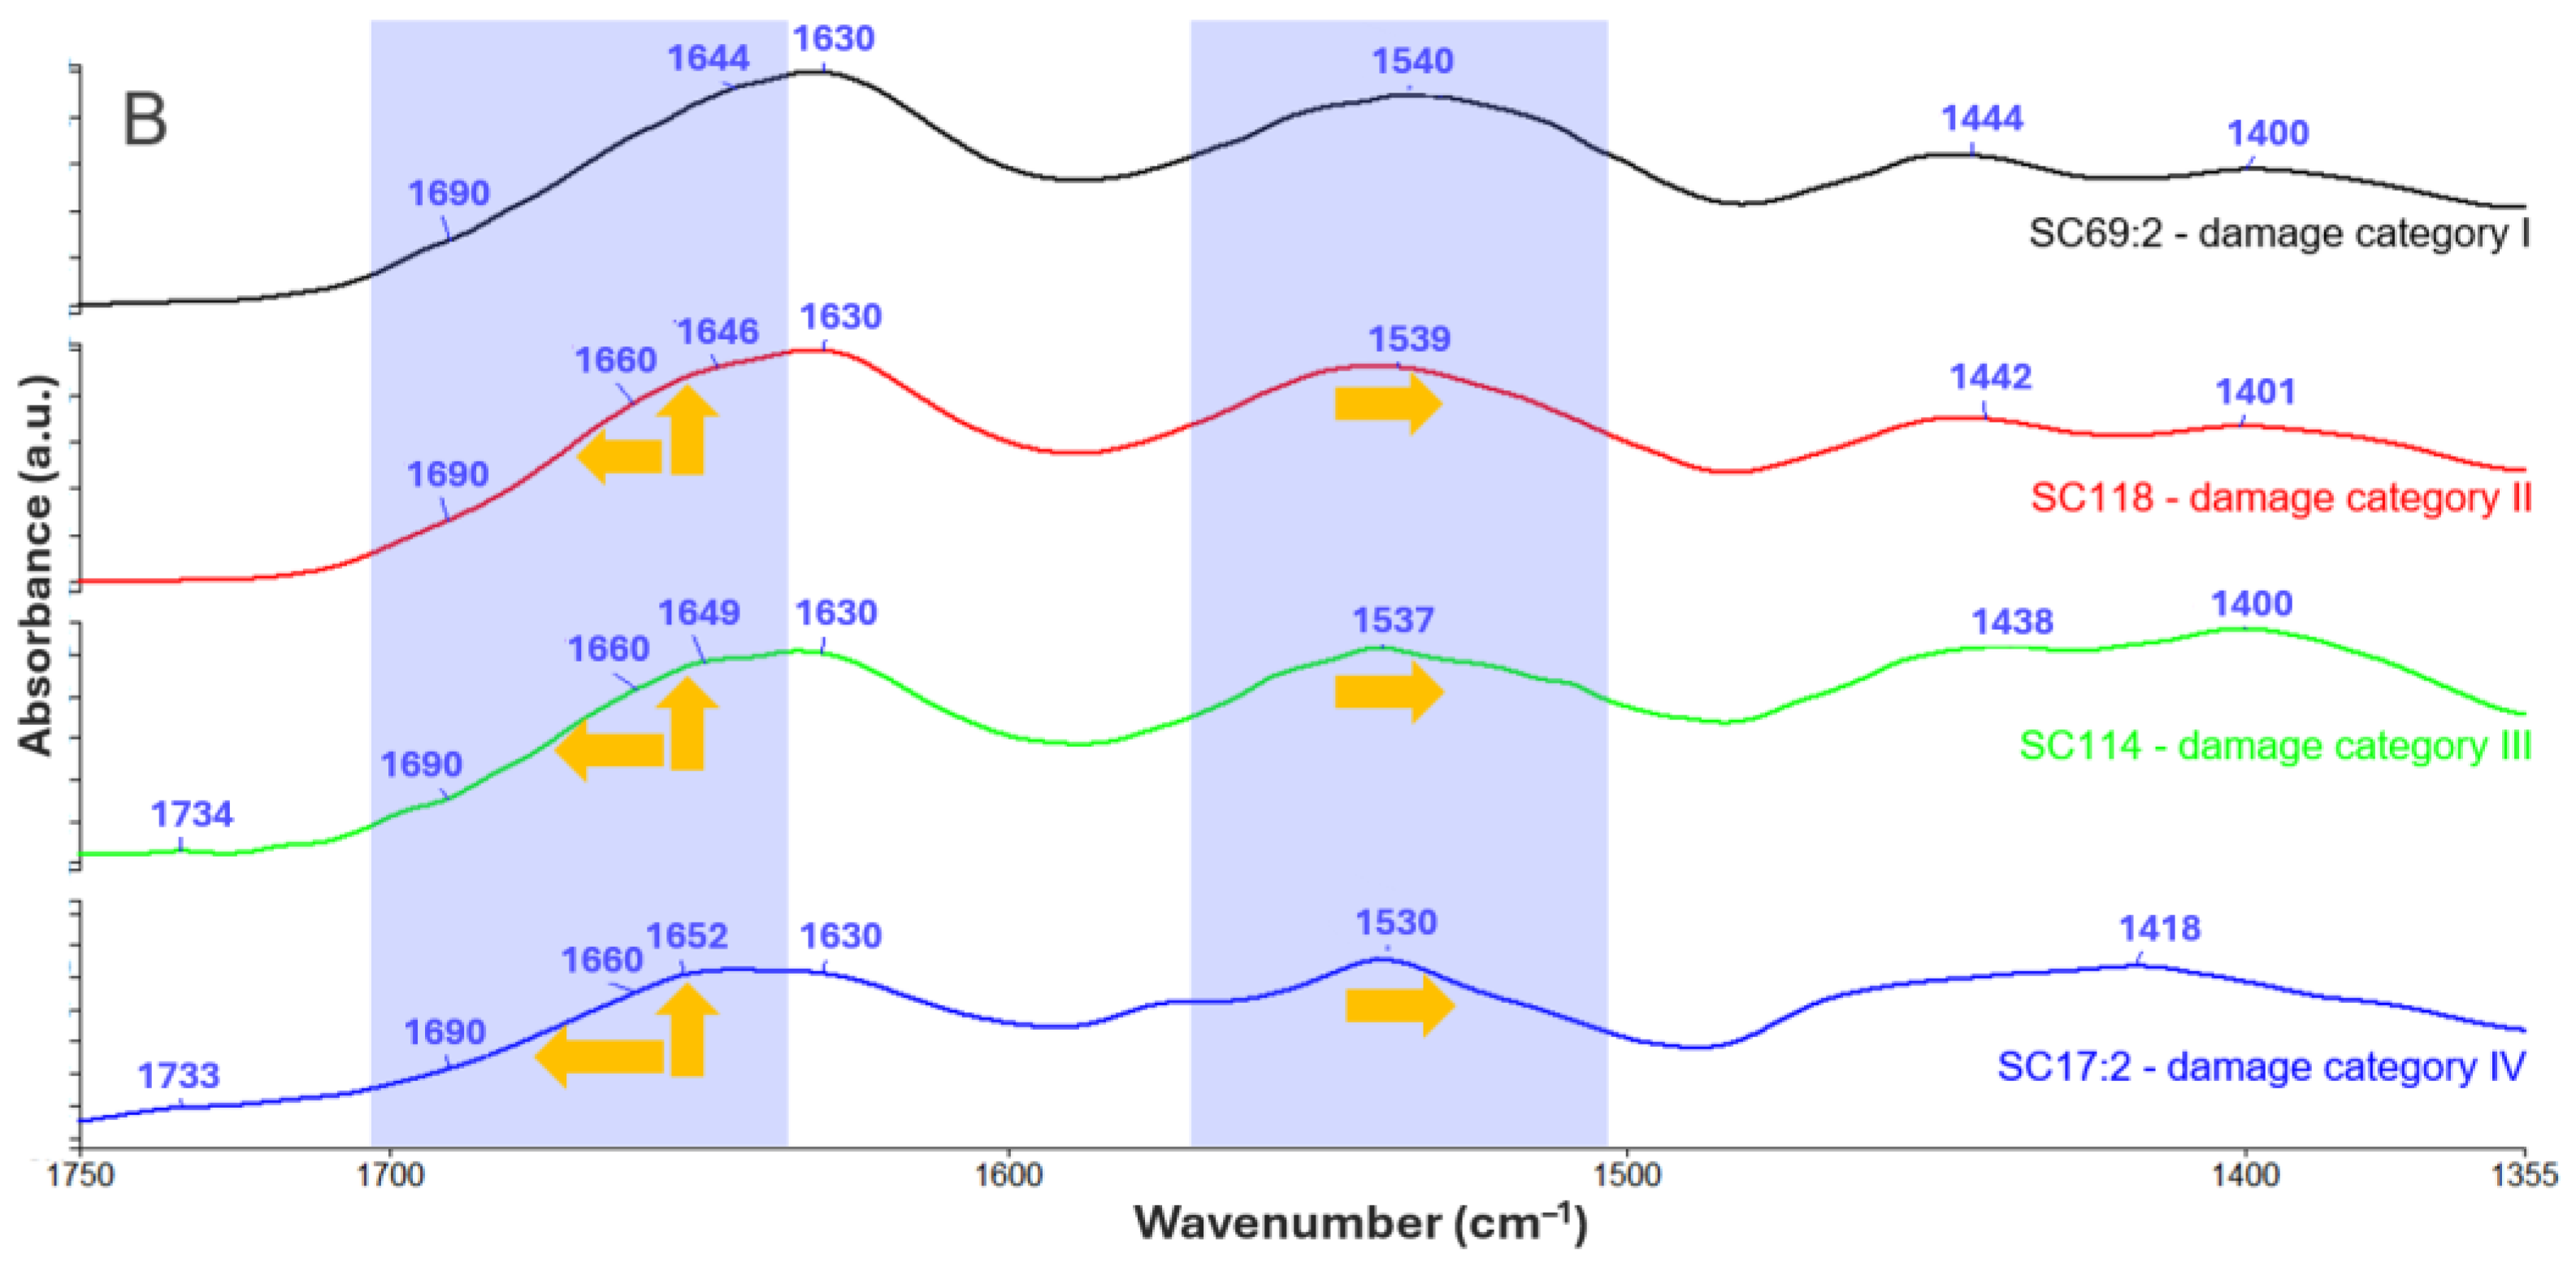
3.3. Historical Parchments

The unaged and historical parchment samples from the Archivio di Stato, Florence (ASF), Italy (including parchments damaged in the flood in Florence in 1966 [13]); the National Archives of Scotland (NAS), Stirling, UK; and the Royal Library and School of Conservation Copenhagen (SCC), Denmark that were analysed by ATR/FTIR for the IDAP project are listed below. In Table 4, the parchments are grouped as presented in the database [48,49,50,51], which is according to the damage categories that were identified upon further quantification of the FTIR spectral features.
The samples are fully described elsewhere [4,13], as is the detailed comparison of damage ranking. The more damaged samples were frequently those with higher mineral and/or lipid contents as determined by other techniques [3]. The majority of the archival parchments have lipids, as monitored by the carbonyl stretches at 1720–1730 cm−1; calcite, as indicated by the strong absorbance at about 1440 cm−1 due to asymmetric stretches of carbonate; and sharp peak at 874 cm−1, due to C–O bending in calcite, and some present a strong band at c.1060 cm−1 due to sulphate stretching [16]. For most archival parchments, these bands were mostly on the flesh side, but some samples exhibited those peaks on both sides, which complicated the assessment of the spectra. Therefore, damage assessment was strictly based on the grain side, in particular, for the samples where the dominant 1440 cm−1 band of carbonates did not overlap with the low wavenumber side of the amide II band. The spectra deposited in the database clearly demonstrate that regardless of the extent of damage, the parchments studied (spanning from the thirteenth century to contemporary archival bookbindings and single-sheet parchments) retained all the characteristic features, including amide A, B, I, II, and III bands of collagen type I, which indicates the existence of the helical structure in the parchment collagen.
The main features that differentiated the spectra of the grain side of those parchments were mostly concentrated in amide I and amide II bands. The spectral characteristics of the historic parchments, from the least to the most damaged states, were the broadening of the amide I band towards the higher wavenumbers, the increased absorbance of the sub-band at 1660 cm−1, leading to increased 1660:1630 ratios with deterioration, the elevated absorbance of the sub-band peaking at 1690 cm−1, which is indicative of cross-linking, and the shift of the amide II band peak towards lower wavenumbers from 1540 to 1530 cm−1 with denaturation [16]. The ratios of the amide I sub-bands at 1660 and 1630 cm−1 were determined by employing quantification procedures of FTIR spectra, as established on diverse heritage materials [52,53,54,55,56,57], and provided sufficient variation, which supported the ranking of damage [4,17]. This damage assessment corresponded with the gradual reduction in shrinkage temperatures and the evaluation by atomic force microscopy (AFM) observations of a reduction in the periodicity of D-banding in collagen fibrils as well as changes observed with micro-thermal analysis [14,15]. Figure 7 shows an example of FTIR data from historical samples from the four damage categories.

4. Conclusions

The open-access database that is discussed in this paper contains the attenuated total reflectance/Fourier transform infrared (ATR/FTIR) spectra of over 300 samples, including reference, accelerated aged, and archival parchments spanning from the thirteenth century to more recent years, which have been studied in the IDAP project with a wide range of spectroscopic, microscopic, and thermoanalytical techniques. The archival parchments were provided by the Archivio di Stato, Florence, Italy; the National Archives of Scotland, Stirling, UK; and the Royal Library and Royal Danish Academy—Architecture, Design, Conservation, Copenhagen, Denmark. The accelerated aged samples were produced during the IDAP project. The database is envisaged to be a useful tool for researchers in the field of heritage science, cultural heritage conservation, librarians, curators, and the general public, as to the best of our knowledge, such a resource has not previously existed. The FTIR spectra can be inspected and freely downloaded to further support scholars to study and assess the degradation states of historical parchments. The database has been left open to updates, including datasets with state-of-the-art IR spectroscopic techniques and data from newly analysed parchments.

Author Contributions

Conceptualisation, validation, formal analysis, resources, review and editing: C.T. and M.O.; methodology, data curation, writing, funding acquisition: C.T. All authors have read and agreed to the published version of the manuscript.

Funding

The open-access infrared spectra database of the IDAP parchments that is presented in this manuscript was internally funded by the Research and Innovation Services at the Department of Arts, Northumbria University. Data were generated and processed by the authors in the European project IDAP, EVK4-CT-2001-00061, which was funded by the EC under the 5th Framework Programme: Energy, Environment and Sustainable Development, Key action 4: The City of Tomorrow and Cultural Heritage, Section 4 Improved damage assessment of cultural heritage. More information on the project can be found on https://op.europa.eu/en/publication-detail/-/publication/0edae146-fe1f-4060-a0b1-b506b19de9c8 (accessed on 12 March 2025).

Data Availability Statement

The depository of the FTIR spectra of the IDAP parchments is available online, URL: https://doi.org/10.25398/rd.northumbria.c.6742791 (accessed on 12 March 2025).

Conflicts of Interest

The authors declare no conflicts of interest.

References

  1. Meir, B.I. Parchment. 1995. Available online: https://web.archive.org/web/20050422080330/http://faculty.biu.ac.il/~barilm/parchmen.html (accessed on 12 March 2025).
  2. Reed, R. The Making and Nature of Parchment; Elmete Press: Leeds, UK, 1975. [Google Scholar]
  3. Larsen, R.; Poulsen, D.V.; Juchauld, F.; Jerosch, H.; Odlyha, M.; de Groot, J.; Wang, Q.; Theodorakopoulos, C.; Wess, T.; Hiller, J.; et al. Damage assessment of parchment: Complexity and relations at different structural levels. 14th ICOM-CC Prepr. 2005, 1, 199–208. Available online: https://www.researchgate.net/profile/Elena-Badea/publication/230766446_Damage_assessment_of_parchment_complexity_and_relations_at_different_structural_levels/links/0deec5214c8a389d6a000000/Damage-assessment-of-parchment-complexity-and-relations-at-different-structural-levels.pdf (accessed on 12 March 2025).
  4. Odlyha, M.; Theodorakopoulos, C.; de Groot, J.; Bozec, L.; Horton, M. Thermoanalytical (macro to nano-scale) techniques and non-invasive spectroscopic analysis for damage assessment of parchment. In Improved Damage Assessment of Parchment (IDAP), Assessment, Data Collection and Sharing of Knowledge European Commission, Research Report no 18; Larsen, R., Ed.; Office for Official Publications of the European Communities: Luxembourg, 2007; pp. 73–85. Available online: https://www.researchgate.net/profile/Charis-Theodorakopoulos/publication/288527466_Thermoanalytical_macro_to_nano-scale_techniques_and_non-invasive_spectroscopic_analysis_for_damage_assessment_of_parchment/links/642307d9a1b72772e4319058/Thermoanalytical-macro-to-nano-scale-techniques-and-non-invasive-spectroscopic-analysis-for-damage-assessment-of-parchment.pdf (accessed on 12 March 2025).
  5. Thickett, D.; Emmerson, N.; Larsen, R.; Odlyha, M.; Watkinson, D. Analysing Objects to Tailor Environmental Preventive Conservation. Heritage 2022, 6, 212–235. [Google Scholar] [CrossRef]
  6. Kennedy, C.J.; Wess, T.J. The Structure of Collagen within Parchment—A review. Restaurator 2003, 24, 61–80. [Google Scholar] [CrossRef]
  7. Bechmann Hansen, D.; Nielsen, K.; Rasmussen, S.B. Detection of Radicals in Collagen and Parchment. In Microanalysis of Parchment; Archetype Publications Ltd.: London, UK, 2002; pp. 117–121. [Google Scholar]
  8. Larsen, R.; Poulsen, D.V.; Vest, M.; Jensen, A. Amino Acid Analysis of New and Historical Parchment. In Microanalysis of Parchment; Archetype Publications Ltd.: London, UK, 2002; pp. 93–98. Available online: https://adk.elsevierpure.com/da/publications/amino-acid-analysis-of-new-and-historical-parchments (accessed on 12 March 2025).
  9. Sakura, S.; Fujimoto, D.; Sakamoto, K.; Mizuno, A.; Motegi, K. Photolysis of Pyridinoline, a Cross-linking Amino Acid of Collagen, by ultraviolet light. Can. J. Biochem. 1982, 60, 525–529. [Google Scholar] [CrossRef]
  10. Hansen, E.F.; Lee, S.N.; Sobel, H. The Effects of Relative Humidity on Some Physical Properties of Modern Vellum. J. Am. Inst. Conserv. 1992, 31, 325–342. [Google Scholar] [CrossRef]
  11. Miles, C.A.; Burjanadze, T.V.; Bailey, J.A. The Kinetics of the Thermal Denaturation of Collagen. J. Mol. Biol. 1995, 245, 437–446. [Google Scholar] [CrossRef]
  12. Wright, N.T.; Humphrey, J.D. Denaturation of Collagen by Heating. Annu. Rev. Biomed. Eng. 2002, 4, 109–128. [Google Scholar] [CrossRef]
  13. Larsen, R. (Ed.) Introduction to damage and damage assessment of parchment. In Improved Damage Assessment of Parchment (IDAP) Assessment, Data Collection and Sharing of Knowledge; European Commission, Research Report no. 18; Office for Official Publications of the European Communities: Luxembourg, 2007; pp. 17–21. Available online: https://op.europa.eu/en/publication-detail/-/publication/0edae146-fe1f-4060-a0b1-b506b19de9c8 (accessed on 12 March 2025).
  14. de Groot, J. Damage Assessment of Collagen in Historical Parchment with Microscopy Techniques. Ph.D. Thesis, Birkbeck College, University of London, London, UK, 2007. [Google Scholar]
  15. Garp, T.; Nielsen, K.; Boghosian, S. Study of the chemical breakdown of collagen and parchment by Raman spectroscopy. In Microanalysis of Parchment; Larsen, R., Ed.; Archetype Publications Ltd.: London, UK, 2002; pp. 109–116. [Google Scholar]
  16. Odlyha, M.; Theodorakopoulos, C.; de Groot, J.; Bozec, L.; Horton, M. Fourier Transform Infra-Red Spectroscopy (ATR/FTIR) and Scanning Probe Microscopy of parchment. ePS 2009, 6, 138–144. Available online: https://www.researchgate.net/profile/Laurent-Bozec/publication/49584102_Fourier_transform_infra-red_spectroscopy_ATRFTIR_and_scanning_probe_microscopy_of_parchment/links/00b7d52d685c56f8eb000000/Fourier-transform-infra-red-spectroscopy-ATR-FTIR-and-scanning-probe-microscopy-of-parchment.pdf (accessed on 12 March 2025).
  17. Boyatzis, S.C.; Velivasaki, G.; Malea, E. A study of the deterioration of aged parchment marked with laboratory iron gall inks using FTIR-ATR spectroscopy and micro hot table. Herit. Sci. 2016, 4, 13. [Google Scholar] [CrossRef]
  18. Malea, E.; Boyatzis, S.C.; Karlis, D.; Palles, D.; Boghosian, S.; Zervos, S. The Complementary Use of Raman, ATR-FTIR Spectroscopy, and Chemometrics for Investigating the Deterioration of Artificially Aged Parchment. J. Raman Spectrosc. 2024, 55, 1266–1280. [Google Scholar] [CrossRef]
  19. Malissa, A.; Cappa, F.; Schreiner, M.; Marchetti-Deschmann, M. Spectral Features Differentiate Aging- Induced Changes in Parchment—A Combined Approach of UV/VIS, μ-ATR/FTIR and μ-Raman Spectroscopy With Multivariate Data Analysis. Molecules 2023, 28, 4584. [Google Scholar] [CrossRef]
  20. Cappa, F.; Paganoni, I.; Carsote, C.; Schreiner, M.; Badea, E. Studies on the effect of dry-heat ageing on parchment deterioration by vibrational spectroscopy and micro hot table method. Polym. Degrad. Stab. 2020, 182, 109375. [Google Scholar] [CrossRef]
  21. Cappa, F.; Paganoni, I.; Carsote, C.; Badea, E.; Schreiner, M. Studies on the effects of mixed light-thermal ageing on parchment by vibrational spectroscopy and micro hot table method. Herit. Sci. 2020, 8, 15. [Google Scholar] [CrossRef]
  22. Infrared Spectra Database—Depository of FTIR Spectra of IDAP Parchments. 2023. Available online: https://figshare.northumbria.ac.uk/collections/Infrared_spectra_database_-_Depository_of_FTIR_spectra_of_IDAP_parchments/6742791 (accessed on 12 March 2025).
  23. New Parchments FTIR: Measured Prior to Deterioration. 2023. Available online: https://figshare.northumbria.ac.uk/articles/figure/New_Parchments_FTIR_measured_prior_to_deterioration/23695608/1 (accessed on 12 March 2025).
  24. Accelerated Aged Parchment FTIR: Light Aged 170 klux ×4–32 Hours. 2023. Available online: https://figshare.northumbria.ac.uk/articles/figure/Accelerated_Aged_Parchment_FTIR_Light_Aged_170_klux_x_4-32_hours/23696043/1 (accessed on 12 March 2025).
  25. Accelerated Aged Parchment FTIR: 40%RH—80 °C ×2–16 Days and Visible Light 170 klux ×4–32 Hours. 2023. Available online: https://figshare.northumbria.ac.uk/articles/figure/Accelerated_Aged_Parchment_FTIR_40_RH_-_80_C_x2-16_days_and_Visible_Light_170_klux_x_4-32_hours/23696277/1 (accessed on 12 March 2025).
  26. Barth, A. Infrared spectroscopy of proteins. Biochim. Biophys. Acta (BBA)-Bioenerg. 2007, 1767, 1073–1101. [Google Scholar] [CrossRef]
  27. Accelerated Aged Parchment FTIR: 80%RH and 60 °C ×1–32 Days. 2023. Available online: https://figshare.northumbria.ac.uk/articles/figure/Accelerated_Aged_Parchment_FTIR_80_RH_and_60_C_x1-32_days/23704272/1 (accessed on 12 March 2025).
  28. Accelerated Aged Parchment FTIR: 60%RH and 80 °C ×1–32 Days. 2023. Available online: https://figshare.northumbria.ac.uk/articles/figure/Accelerated_Aged_Parchment_FTIR_60_RH_and_80_C_x1-32_days/23704401/1 (accessed on 12 March 2025).
  29. Accelerated Aged Parchment FTIR: 80%RH and 80 °C ×1–32 Days. 2023. Available online: https://figshare.northumbria.ac.uk/articles/figure/Accelerated_Aged_Parchment_FTIR_80_RH_and_80_C_x1-32_days/23704410/1 (accessed on 12 March 2025).
  30. Accelerated Aged Parchment FTIR: 60%RH and 60 °C ×1–32 Days. 2023. Available online: https://figshare.northumbria.ac.uk/articles/figure/Accelerated_Aged_Parchment_FTIR_60_RH_and_60_C_x1-32_days/23704194/1 (accessed on 12 March 2025).
  31. Accelerated Aged Parchment FTIR: 60%RH and 40 °C ×1–16 Days. 2023. Available online: https://figshare.northumbria.ac.uk/articles/figure/Accelerated_Aged_Parchment_FTIR_60_RH_and_40_C_x1-16_days/23696535/1 (accessed on 12 March 2025).
  32. Accelerated Aged Parchment FTIR: 80%RH and 40 °C ×1–32 Days. 2023. Available online: https://figshare.northumbria.ac.uk/articles/figure/Accelerated_Aged_Parchment_FTIR_80_RH_and_40_C_x1-32_days/23703882/1 (accessed on 12 March 2025).
  33. Accelerated Aged Parchment FTIR: 40%RH and 80 °C ×1–32 Days. 2023. Available online: https://figshare.northumbria.ac.uk/articles/figure/Accelerated_Aged_Parchment_FTIR_40_RH_and_80_C_x1-32_days/23704341/1 (accessed on 12 March 2025).
  34. Accelerated Aged Parchment FTIR: 40%RH and 80 °C ×2–16 Days. 2023. Available online: https://figshare.northumbria.ac.uk/articles/figure/Accelerated_Aged_Parchment_FTIR_40_RH_and_80_C_x2-16_days/23695842/1 (accessed on 12 March 2025).
  35. Paschalis, E.P.; Verdelis, K.; Doty, S.B.; Boskey, A.L.; Mendelsohn, R.; Yamauchi, M. Spectroscopic characterization of collagen crosslinks in bone. J. Bone Miner. Res. 2001, 16, 1821–1826. [Google Scholar] [CrossRef] [PubMed]
  36. Badea, E.; Della Gatta, G.; Usacheva, T. Effects of temperature and relative humidity on fibrillar collagen in parchment: A micro differential scanning calorimetry (micro DSC) study. Polym. Degrad. Stab. 2012, 97, 346–353. [Google Scholar] [CrossRef]
  37. Accelerated Aged Parchment FTIR: NO2 Gas 50 ppm ×2–16 Weeks. 2023. Available online: https://figshare.northumbria.ac.uk/articles/figure/Accelerated_Aged_Parchment_FTIR_NO2_sub_sub_gas_50ppm_x2-16_weeks/23685183/1 (accessed on 12 March 2025).
  38. Accelerated Aged Parchment FTIR: NO2 Gas 50 ppm ×2–16 Weeks & Light: 170 klux ×4–32 Hours. 2023. Available online: https://figshare.northumbria.ac.uk/articles/figure/Accelerated_Aged_Parchment_FTIR_NO2_gas_50ppm_x2-16_weeks_light_170klux_x4-32_hours/23685522/1 (accessed on 12 March 2025).
  39. Accelerated Aged Parchment FTIR: NO2 Gas: 50 ppm ×2–16 Weeks & Heat: 100 °C ×2–16 Days. 2023. Available online: https://figshare.northumbria.ac.uk/articles/figure/Accelerated_Aged_Parchment_FTIR_NO2_gas_50ppm_x2-16_weeks_heat_100_C_x2-16_days/23686110/1 (accessed on 12 March 2025).
  40. Accelerated Aged Parchment FTIR: NO2 Gas ×2–16 Weeks, Light:170 klux ×4–32 Hours, Heat: 100 °C ×2–16 Days. 2023. Available online: https://figshare.northumbria.ac.uk/articles/figure/Accelerated_Aged_Parchment_FTIR_NO2_gas_x2-16_weeks_light_170klux_x4-32_hours_heat_100_strong_strong_C_x2-16_days/23686680/1 (accessed on 12 March 2025).
  41. Accelerated Aged Parchment FTIR: SO2 Gas 50 ppm ×2–16 Weeks. 2023. Available online: https://figshare.northumbria.ac.uk/articles/figure/Accelerated_Aged_Parchment_FTIR_SO2_gas_50ppm_x2-16_weeks/23688753/1 (accessed on 12 March 2025).
  42. Accelerated Aged Parchment FTIR: SO2 Gas 50 ppm ×2–16 Weeks & Light: 170 klux ×4–32 Hours. 2023. Available online: https://figshare.northumbria.ac.uk/articles/figure/Accelerated_Aged_Parchment_FTIR_SO2_gas_50ppm_x2-16_weeks_light_170klux_x4-32_hours/23691924/1 (accessed on 12 March 2025).
  43. Accelerated Aged Parchment FTIR: SO2 Gas: 50 ppm ×2–16 Weeks & Heat: 100 °C ×2–16 Days. 2023. Available online: https://figshare.northumbria.ac.uk/articles/figure/Accelerated_Aged_Parchment_FTIR_SO2_gas_50ppm_x2-16_weeks_heat_100_C_x2-16_days/23691945/1 (accessed on 12 March 2025).
  44. Accelerated Aged Parchment FTIR: SO2 Gas ×2–16 Weeks, Light:170 klux ×4–32 Hours, Heat: 100 °C ×2–16 Days. 2023. Available online: https://figshare.northumbria.ac.uk/articles/figure/Accelerated_Aged_Parchment_FTIR_SO2_gas_x2-16_weeks_light_170klux_x4-32_hours_heat_100_strong_strong_C_x2-16_days/23691951/1 (accessed on 12 March 2025).
  45. Accelerated Aged Parchment FTIR: SO2 and NO2 Gas 50 ppm ×2–16 Weeks. 2023. Available online: https://figshare.northumbria.ac.uk/articles/figure/Accelerated_Aged_Parchment_FTIR_SO2_NO2_gas_50ppm_x2-16_weeks/23691984/1 (accessed on 12 March 2025).
  46. Accelerated Aged Parchment FTIR: SO2 and NO2 Gas 50 ppm ×2–16 Weeks & Light: 170 klux ×2–16 Hours. 2023. Available online: https://figshare.northumbria.ac.uk/articles/figure/Accelerated_Aged_Parchment_FTIR_SO2_and_NO2_gas_50ppm_x2-16_weeks_light_170klux_x2-16_hours/23691996/1 (accessed on 12 March 2025).
  47. Accelerated Aged Parchment FTIR: SO2 and NO2 Gas: 50 ppm ×2–16 Weeks & Heat: 100 °C ×2–16 Days. 2023. Available online: https://figshare.northumbria.ac.uk/articles/figure/Accelerated_Aged_Parchment_FTIR_SO2_NO2_gas_50ppm_x2-16_weeks_heat_100_C_x2-16_days/23691999/1 (accessed on 12 March 2025).
  48. ATR/FTIR Spectra of Historical Parchments—Damage Category I. 2023. Available online: https://figshare.northumbria.ac.uk/articles/figure/ATR_FTIR_spectra_of_historical_parchments_-_damage_category_I/23904270/1 (accessed on 12 March 2025).
  49. ATR/FTIR Spectra of Historical Parchments—Damage Category II. 2023. Available online: https://figshare.northumbria.ac.uk/articles/figure/ATR_FTIR_spectra_of_historical_parchments_-_damage_category_II/23904528/1 (accessed on 12 March 2025).
  50. ATR/FTIR Spectra of Historical Parchments—Damage Category III. 2023. Available online: https://figshare.northumbria.ac.uk/articles/figure/ATR_FTIR_spectra_of_historical_parchments_-_damage_category_III/23904534/1 (accessed on 12 March 2025).
  51. ATR/FTIR Spectra of Historical Parchments—Damage Category IV. 2023. Available online: https://figshare.northumbria.ac.uk/articles/figure/ATR_FTIR_spectra_of_historical_parchments_-_damage_category_IV/23904567/1 (accessed on 12 March 2025).
  52. Galatis, P.; Boyatzis, S.; Theodorakopoulos, C. Removal of a synthetic soiling mixture on mastic, shellac & Laropal® K80 coatings using two hydrogels. ePS 2012, 9, 72–83. Available online: https://d1wqtxts1xzle7.cloudfront.net/31876413/Galatis-22-07-2012-libre.pdf?1391584876=&response-content-disposition=inline%3B+filename%3DAn_Investigation_of_the_Selective_Remova.pdf&Expires=1737632375&Signature=V5I4ox0iKkbrzISxH-8aIt2S5Wip1Ku9C5Y7k6-2gf6LUz7xHcIZ3D0EJtoEPWdSBjN9pJA4Nup2H1UoD7~rsVGDS0672Vuoie4EEXq~D1ttYskmGQudIG12GusTXXTTNrMljWuw6IEKe~5WEijbaMSwMgAcf-pMUhSfnlWK0T7O1TZiHK6NE8enpY~~E7TLsUzk-vQMKcDPH0kKv~PBHA22fx-cW5W1i4k-vCbln3pFe0eRt~nCYQip6zFuhv0sDJC2MjQTS4uNfSnWy-JUBkt1MjIZOpMbLMUCIQyFt0v0B-HoiRHAkVDX-LN4at9ANALEoWYEtqMp5a1mLSnS2g__&Key-Pair-Id=APKAJLOHF5GGSLRBV4ZA (accessed on 12 March 2025).
  53. Chillè, C.; Papadakis, V.M.; Theodorakopoulos, C. An analytical evaluation of Er:YAG laser cleaning tests on a nineteenth century varnished painting. Microchem. J. 2020, 158, 105086. [Google Scholar] [CrossRef]
  54. Chillè, C.; Sala, F.; Wu, Q.; Theodorakopoulos, C. A study on the heat distribution and oxidative modification of aged dammar films upon Er:YAG laser irradiation. J. Inst. Conserv. 2020, 43, 59–78. [Google Scholar] [CrossRef]
  55. Odlyha, M.; Theodorakopoulos, C.; Campana, R. Studies on Woolen Threads from Historical Tapestries. AUTEX Res. J. 2007, 7, 9–18. [Google Scholar] [CrossRef]
  56. Theodorakopoulos, C.; Zafiropulos, V.; Boon, J.J.; Boyatzis, S.C. Spectroscopic Investigations on the Depth-Dependent Degradation Gradients of Aged Triterpenoid Varnishes. Appl. Spectrosc. 2007, 61, 1045–1051. [Google Scholar] [CrossRef] [PubMed]
  57. Theodorakopoulos, C.; Risdonne, V.; Freese, S.; Diraoui, S.; Jonas, U. Cleaning testing of nineteenth-century plaster surface models with thin polyacrylamide-based gel layers attached to flexible polyethylene films. Herit. Sci. 2023, 11, 95. [Google Scholar] [CrossRef]
Figure 1. Grain (A) and flesh (B) sides of the unaged parchment sample SC69:3. Note the spectral differences, including the minimal peak at 1800 cm−1 due to overtones of CO32− stretches and Ca2+, the dominant peak at 1400 cm−1 due to the asymmetric stretching of the CO32− band of calcite, which interfere with the collagen molecule vibration peak at 1338 cm−1, the amide II and III peaks, as well as the increase in the sharp peak at 875 cm−1 due to CO32− bending of calcite.
Heritage 08 00110 g001
Figure 2. The fingerprint regions (1800-800 cm−1) of all spectra, such as in this detail of the ATR/FTIR spectrum of the grain side of unaged parchment sample SC69:3, are included in the database.
Heritage 08 00110 g002
Figure 3. The ATR/FTIR spectra of unaged parchment sample SC70 and the same sample after 32 h of visible light exposure at 170 ± 1 klux, 25 °C/50% RH. The spectra are normalised on amide I.
Heritage 08 00110 g003
Figure 4. ATR/FTIR spectra of the grain side of parchment samples exposed to 80 °C/40% RH for 1 to 32 days (SC151–SC155) showing subtle changes in the amide I and amide II peaks, including a broadening of amide I at 1652 and 1660 cm−1 and a quantifiable shift of amide II that is associated with denaturation of collagen [5]. The spectra are normalised on amide I.
Heritage 08 00110 g004
Figure 5. ATR/FTIR spectra of parchment exposed to the humid heat conditions that are listed in Table 2 for 32 days, showing differences in amide I and II peaks. The spectra were generated on the grain side of samples SC95, SC101, SC113, SC137, SC143, and SC151 in the corresponding order starting from the black line and are normalised to the highest peak, amide I.
Heritage 08 00110 g005
Figure 6. ATR/FTIR spectra of parchment exposed to SO2 and NO2 pollutants for 2 to 4 weeks and 100 °C for 2–16 days (CR54–CR57) showing the broadening of the amide I peak and in particular the increase in 1660 and 1690 cm−1 compared to 1630 cm−1, and the gradual shifts of the amide II peak to lower wavenumbers than 1540 cm−1, indicating the eventual denaturation of collagen. The spectra are normalised to the highest peak, amide I.
Heritage 08 00110 g006
Figure 7. ATR/FTIR spectra of single sheet parchments SC69:2 (School of Conservation Copenhagen, Denmark, 2002, damage category I), SC118 (1824, National Archives of Scotland, Stirling, UK), SC114 (1765, National Archives of Scotland), and SC17:2 (School of Conservation Copenhagen, Denmark), representing the four damage categories that were identified in the IDAP project. The spectra are presented as overlaid (A) and stacked (B) to highlight the differences, in particular, within amide I and amide II bands.
Heritage 08 00110 g007aHeritage 08 00110 g007b
Table 1. FTIR bands and relevant assignments of the spectra acquired from the unaged, accelerated aged, and archival parchments [16,17,22].
Frequencies (cm−1)Assignments
3283Amide A: >95% ν 1(NH) in Fermi resonance with first overtone of amide II/overlaps with ν(OH) and νas(OH) of the water matrix in collagen
3073Amide B: ν(NH) in Fermi resonance with amide II overtone
2948, 2878νas(CH3) and ν(CH3), respectively
2928, 2865νas(CH2) and ν(CH2), respectively
1795overtone of ν(CO32−) and Ca2+ of CaCO3
1720ν(C=O) in –COOH
1630Amide I: 80% ν(C=O) and 20% [ν(CN), δ(NH)]
1580νas(C=O) in –COO in aspartic and glutamic acids
1536Amide II: 40–60% δ(NH), and ν(CN)
1451δ(CH2) and δ(CH3)—overlaps with the νas(CO32−) band
1447νas(CO32−) in CaCO3
1401ν(C=O) in –COO—overlaps with the νas(CO32−) band
1338Sidechain vibration of collagen molecules
1286, 1202Amide III with δ(CH2) from glycine backbone and proline sidechain
1236Amide III: 30% ν(CN), 30% δ(NH), ~20% ν(C–C), ~10% δ(CH)
1163ν(C–O) in carbohydrates
1084, 1031ν(C–O) in carbohydrates and proteoglycans
1062ν(C–O) in carbohydrates and ν(SO3−) of sulphated glycosaminoglycans
874δ(C–O) in calcite
1 Symbols: ν = stretching vibration, νas = asymmetric stretching, δ = bending.
Table 2. Overview of the humid-heated accelerated aged parchment samples of the database [27,28,29,30,31,32,33].
TreatmentDuration (Days)Sample CodeDatabase
Reference
TemperatureRH (%)
60801SC90[27]
2SC91
4SC92
8SC93
16SC94
32SC95
80601SC96[28]
2CS97
4SC98
8SC99
16SC100
32SC101
80801SC102[29]
2SC103
4SC104
8SC105
16SC106
32SC107
60601SC108[30]
2SC109
4SC110
8SC111
16SC112
32SC113
40601SC132[31]
2SC133
4SC134
8SC135
16SC136
32SC137
40801SC138[32]
2SC139
4SC140
8SC141
16SC142
32SC143
80401SC150[33]
2SC151
4SC152
8SC153
16SC154
32SC155
Table 3. Overview of the gas-exposed parchment samples of the database [37,38,39,40,41,42,43,44,45,46,47].
TreatmentSample CodeDatabase
Reference
Gas
(50 ppm)
Exposure to Gas
(Weeks)
Heat
(100 °C)
Exposure to Heat
(Days)
Visible Light
(170 klux)
Exposure to Light
(Hours)
NO22n/an/aCR14[37]
4CR15
8CR16
16CR17
2n/ayes4CR18[38]
48CR19
816CR20
1632CR21
2yes2n/aCR22[39]
44CR23
88CR24
1616CR25
2yes2yes4CR26[40]
448CR27
8816CR28
161632CR29
SO22n/an/aCR30[41]
4CR31
8CR32
16CR33
2n/ayes4CR34[42]
48CR35
816CR36
1632CR37
2yes2n/aCR38[43]
44CR39
88CR40
1616CR41
2yes2yes4CR42[44]
448CR43
8816CR44
161632CR45
NO2 + SO22n/an/aCR46[45]
4CR47
8CR48
16CR49
2n/ayes4CR50[46]
48CR51
816CR52
1632CR53
2yes2n/aCR54[47]
44CR55
88CR56
1616CR57
Table 4. The archival parchments classified according to the FTIR damage assessment, as presented in the database [48,49,50,51].
FTIR Damage
Category
Sample CodeTypeDateAnimalOriginDatabase
Reference
Damage
Category I
SC59:2singe sheet1985unknownRLC 1[48]
SC69:2single sheet2002calfSCC
SC70:2single sheet2002calf
SC76:1single sheetunknownunknown
SC115single sheet1769unknownNAS
SC117single sheet1827unknown
SC123single sheet1765unknown
SC163unknownUnknownunknownASF
SC165unknownUnknownunknown
Damage
Category II
SC16bookbindingunknownunknownSCC[49]
SC17:1unknownunknownunknown
SC31:1unknownunknownunknown
SC32unknownunknownunknown
SC35bookbindingunknowncalf
SC38:2unknownunknownUnknown
SC58:1unknownunknownUnknown
SC58:2unknownunknownunknown
SC59:1singe sheet1985unknown
SC70:1single sheet2002calf
SC76:1unknownunknownunknown
SC77:1unknownunknownunknown
SC116unknownunknownunknownNAS
SC118single sheet1824unknown
SC119single sheet1832unknown
SC164unknownunknownunknownASF
SC165:1unknownunknownunknown
SC166unknownunknownunknown
SC168unknownunknownunknown
SC173:2unknownunknownunknown
SC175:1unknownunknownunknown
Damage
Category III
SC18bookbindingunknownsheepSCC[50]
SC24unknownunknownunknown
SC38:1unknownunknownunknown
SC56:1unknownunknownunknown
SC72:1unknownunknownunknown
SC72:2unknownunknownunknown
SC73:2bookbindingunknownunknown
SC75:1unknownunknownunknown
SC114single sheet1765unknownNAS
SC124unknownunknownunknown
SC125unknownunknownunknown
Damage
Category IV
SC17:2unknownunknownunknownSCC[51]
SC75:2unknownunknownunknown
SC120unknownunknownunknownNAS
SC122bookbindingunknownunknown
SC169unknownunknownunknownASF
SC172unknownunknownunknown
SC173:1unknownunknownunknown
SC175:2unknownunknownunknown
1 ASF: Archivio di Stato, Florence, Italy; NAS: National Archives of Scotland, Stirling, UK; RLC: Royal Library, Copenhagen, Denmark; SCC: School of Conservation Copenhagen, Denmark.
Disclaimer/Publisher’s Note: The statements, opinions and data contained in all publications are solely those of the individual author(s) and contributor(s) and not of MDPI and/or the editor(s). MDPI and/or the editor(s) disclaim responsibility for any injury to people or property resulting from any ideas, methods, instructions or products referred to in the content.

