
Article

Millennia of Mitochondrial Change: Tracing Haplogroup Variation in Lithuania
by
Ingrida Domarkienė
1,2,
Indrė Krastinaitė
1,*,
Justina Kozakaitė
1,
Ingrida Kavaliauskienė
2,
Henryk W. Witas
3,
Vaidutis Kučinskas
1,2 and
Rimantas Jankauskas
1
1
Faculty of Medicine, Translational Health Research Institute, Vilnius University, Žaliųjų ežerų St 2, LT-08406 Vilnius, Lithuania
2
Faculty of Medicine, Institute of Biomedical Sciences, Department of Human and Medical Genetics, Vilnius University, Santariškių St 2, LT-08406 Vilnius, Lithuania
3
Independent Researcher, Poland
*
Author to whom correspondence should be addressed.
Heritage 2025, 8(12), 531; https://doi.org/10.3390/heritage8120531
Submission received: 29 September 2025 / Revised: 5 December 2025 / Accepted: 7 December 2025 / Published: 12 December 2025

Abstract

Background: A comprehensive temporal analysis of mtDNA haplogroup variation across Lithuanian history remains limited. This study investigates the mtDNA variation landscape during the Iron Age by comparing newly reported Iron Age individual mtDNA data with the new data from present-day Lithuanians. Methods: Remains of individuals from the Iron Age Lithuania (n = 101) were processed using standard protocols for ancient DNA processing. For the present-day Lithuanians (n = 279), whole mitogenomes were sequenced. Thirty-six polymorphic sites within the Hypervariable Region I were used for haplogroup assignment, phylogenetic and population genetic analyses. Results: Fifteen distinct haplogroups in the Iron Age and the present-day Lithuanians were identified. Haplogroup R0/H remained the most frequent across time. Haplogroups U, T, and N were prominent in the Iron Age. Haplogroups M and D were introduced after the Iron Age. Phylogenetic and population genetic analyses revealed greater mtDNA diversity in the present-day Lithuanians. Significant difference in molecular variance was observed during the Iron Age. Barring the Viking period, the Iron Age mtDNA variation matched the present-day Lithuanian and European populations. Conclusions: Our study showed that mtDNA variation over time remained stable with some random fluctuations and gained more diversity in the present-day Lithuanians.

1. Introduction

The current Lithuanian territory was a crossroad during the ages [1] and experienced many changes since the arrival of the first hunter–gatherers after the last glacial period. It witnessed many sociodemographic processes that are reflected in contemporary populations today [2]. Population migration before and after the last glacial maximum, both to and from refuges in Central, Southwestern, and Southern Europe, has influenced the current European gene pool [3]. According to a recent study on ancient individuals from the Central and Eastern Europe, the most significant sociocultural and political shifts occurred over the second half of the first century CE [4].
Iron Age in Lithuania is generally considered to have lasted from the 1st to the 11th or 12th century CE. It is divided into three phases: the Old Iron Age or Roman period [5], the Middle Iron Age or Migration period [6], and the Late Iron Age or Viking period [7]. The chronology differs from the rest of Europe as the territory of Lithuania was geographically distant from the major political and cultural developments. Consequently, many processes, innovations, and ideas (visible in the archaeological context, such as settlements, hill forts, and burial sites) reached the region at a considerably later stage.
During the Roman period (1st–4th c. CE), the Balts maintained trade with the Roman world via the Amber Road, while goods from the Roman world (coins, glassware, etc.) flowed northward, marking the early development of long-distance exchange and social differentiation. This period can also be characterised by a decline in the use of hillforts and inhumation as the dominant burial practice, although cremation began to spread in the 3rd–4th c. CE [5,8,9].
Later, the Migration period (5th–8th c. CE) brought major cultural shifts, such as warfare, new artefact types, and richly furnished graves with the rise of warriors suggesting external influences. This period is also marked by the emergence of regional cultures, such as the East Lithuanian Barrow Culture [10,11,12,13].
By the Viking period (9th–12/13th c. CE), regional differences in burial traditions persisted, but cremation became increasingly prevalent. This period can be marked as a turning point in the foundation of the Grand Duchy of Lithuania, as indicators of social stratification became more visible, particularly as local elites consolidated their power while trying to counter the Teutonic Order [7]. In addition, contacts (or trades) with Scandinavians can be traced primarily in the western part of Lithuania, particularly in Curonian settlements and cemeteries [14].
Mitochondrial DNA (mtDNA) is important not only for cellular organismal functions and metabolic diseases [15], and forensic analysis [16], but also as evidence for maternal ancestry and population history [2]. Mitochondrial DNA is present at much higher copy numbers than nuclear DNA, which makes it particularly valuable in ancient DNA (aDNA) research where endogenous DNA is often highly degraded and scarce [17]. The high copy number and relative stability of mtDNA increase the likelihood of successful recovery and sequencing from archaeological remains.
Variation within mtDNA sequences defines haplotypes, which represent individual genetic profiles as well as broader haplogroups, which are groups of related haplotypes that share common maternal ancestry [18]. Haplogroup distributions provide insights into population history, migration, and genetic continuity or turnover across temporal and geographic contexts. Population studies using mtDNA have expanded from Hypervariable Region I (HVRI) and/or II (HVRII) to the determination of the entire mtDNA sequence [2] in the analysis of population genetic structure and assessment of population affinities [2,19]. Tracing mtDNA variation change across time and space can help in recreating some of the migration, admixture, and/or social practices.
There have been previous attempts to characterise the contemporary Lithuanian population using mtDNA diversity. Previous research [20] examined the mtDNA HVRI region of 180 Lithuanian individuals and detected 95 different haplotypes. The genetic diversity and average pairwise differences for them were close to the estimates for other European populations. The Lithuanian population itself was found to be homogeneous, genetically close to Slavic (Russia, Poland) populations, and aligned between the Finno-Ugric populations of Northern Europe (Estonia, Finland) and the Indo-European populations of Western Europe. Most common haplogroups characteristic of European populations accounted for 97% of the Lithuanian mtDNAs [20].
Based on the distribution of mtDNA haplogroups, previous research showed that the Lithuanian population falls within the same cluster as the Polish, Ukrainian, Russian, and Belarusian populations, whereas Estonian, Czech, Slovak, and Balkan populations remained distant from the Eastern European population group [21]. Another study confirmed Lithuanians clustering between Slavs and Middle/Near East populations [22]. In addition, interpopulation genetic differences between West and East ethnolinguistic groups in Lithuania were found and explained by the distributions of the two main (H and U) and the other (A, HV, I, J, K, M, N, T, V, W) mtDNA lineages. Haplogroup U was suggested to be dominant in the first inhabitants of the present-day territory of Lithuania and then replaced by newcomers who carried the haplogroup H [22].
Compared to present-day Lithuanian mtDNA studies, ancient DNA analyses from the territory of present-day Lithuania are sparse. Initial findings [23] from a study of mtDNA diversity in four Baltic Mesolithic and Neolithic individuals confirmed previous suggestions about the first people in the territory of Lithuania having haplogroup U: one individual belonged to U4 (haplogroup typical to Eastern hunter–gatherers) and three individuals to U5 [24,25]. Subsequent analyses that included additional Mesolithic/Neolithic and Bronze Age individuals revealed the presence of haplogroup H (H4a1a1a3, H5, H11a), together with haplogroups K (K1b2a), I (I2, I4a), W (W6a), and T (T2b) [26]. Haplogroup H is typically associated with the Neolithic expansion into Europe, yet there was no evidence of Neolithic farmer ancestry in their autosomal DNA [26]. This suggested that the haplogroup H may have already been present among local Western hunter–gatherer groups.
The limited number of analysed individuals is indicative of the rarity and poor preservation state of the Mesolithic/Neolithic materials from the territory of present-day Lithuania. Due to cremation practices in the region, the preservation of material suitable for genetic analysis is no better in the Bronze Age. Thus, we reinitiated further mtDNA study on 132 Baltic Iron Age (IA) samples to fill the knowledge gap regarding the structure and spatial–temporal variation in maternal ancestry in present-day Lithuania.

2. Materials and Methods

2.1. Iron Age Sample Group

A total of 132 IA individuals, originating from the territory of present-day Lithuania, were selected for the study. The authors of this paper are the curators of the human osteological collection at Vilnius University with full permission and authorization to study the material. All the procedures followed recognised professional standards for the care and study of human remains.
The selection of individuals for the study was carried out to cover all three regions of Lithuania—Western (Žemaitija), Central (Western and Southern Aukštaitija), and Eastern (Eastern Aukštaitija). This allowed a balanced geographic distribution to compare with the data from the present-day Lithuanians (described in Section 2.2).
IA individuals representing the three key historical phases—the Roman, Migration, and Viking Ages—were selected as each contributed in distinctive ways to the developing social organisation, technological innovation, and cultural exchange processes whose impact remains evident in today’s European history [5]. Although burial traditions and social organisation differed across the three time periods, the individuals selected for this study appear typical for their respective archaeological contexts (references to archaeological sites are provided in Table S1 in Supplementary Materials).
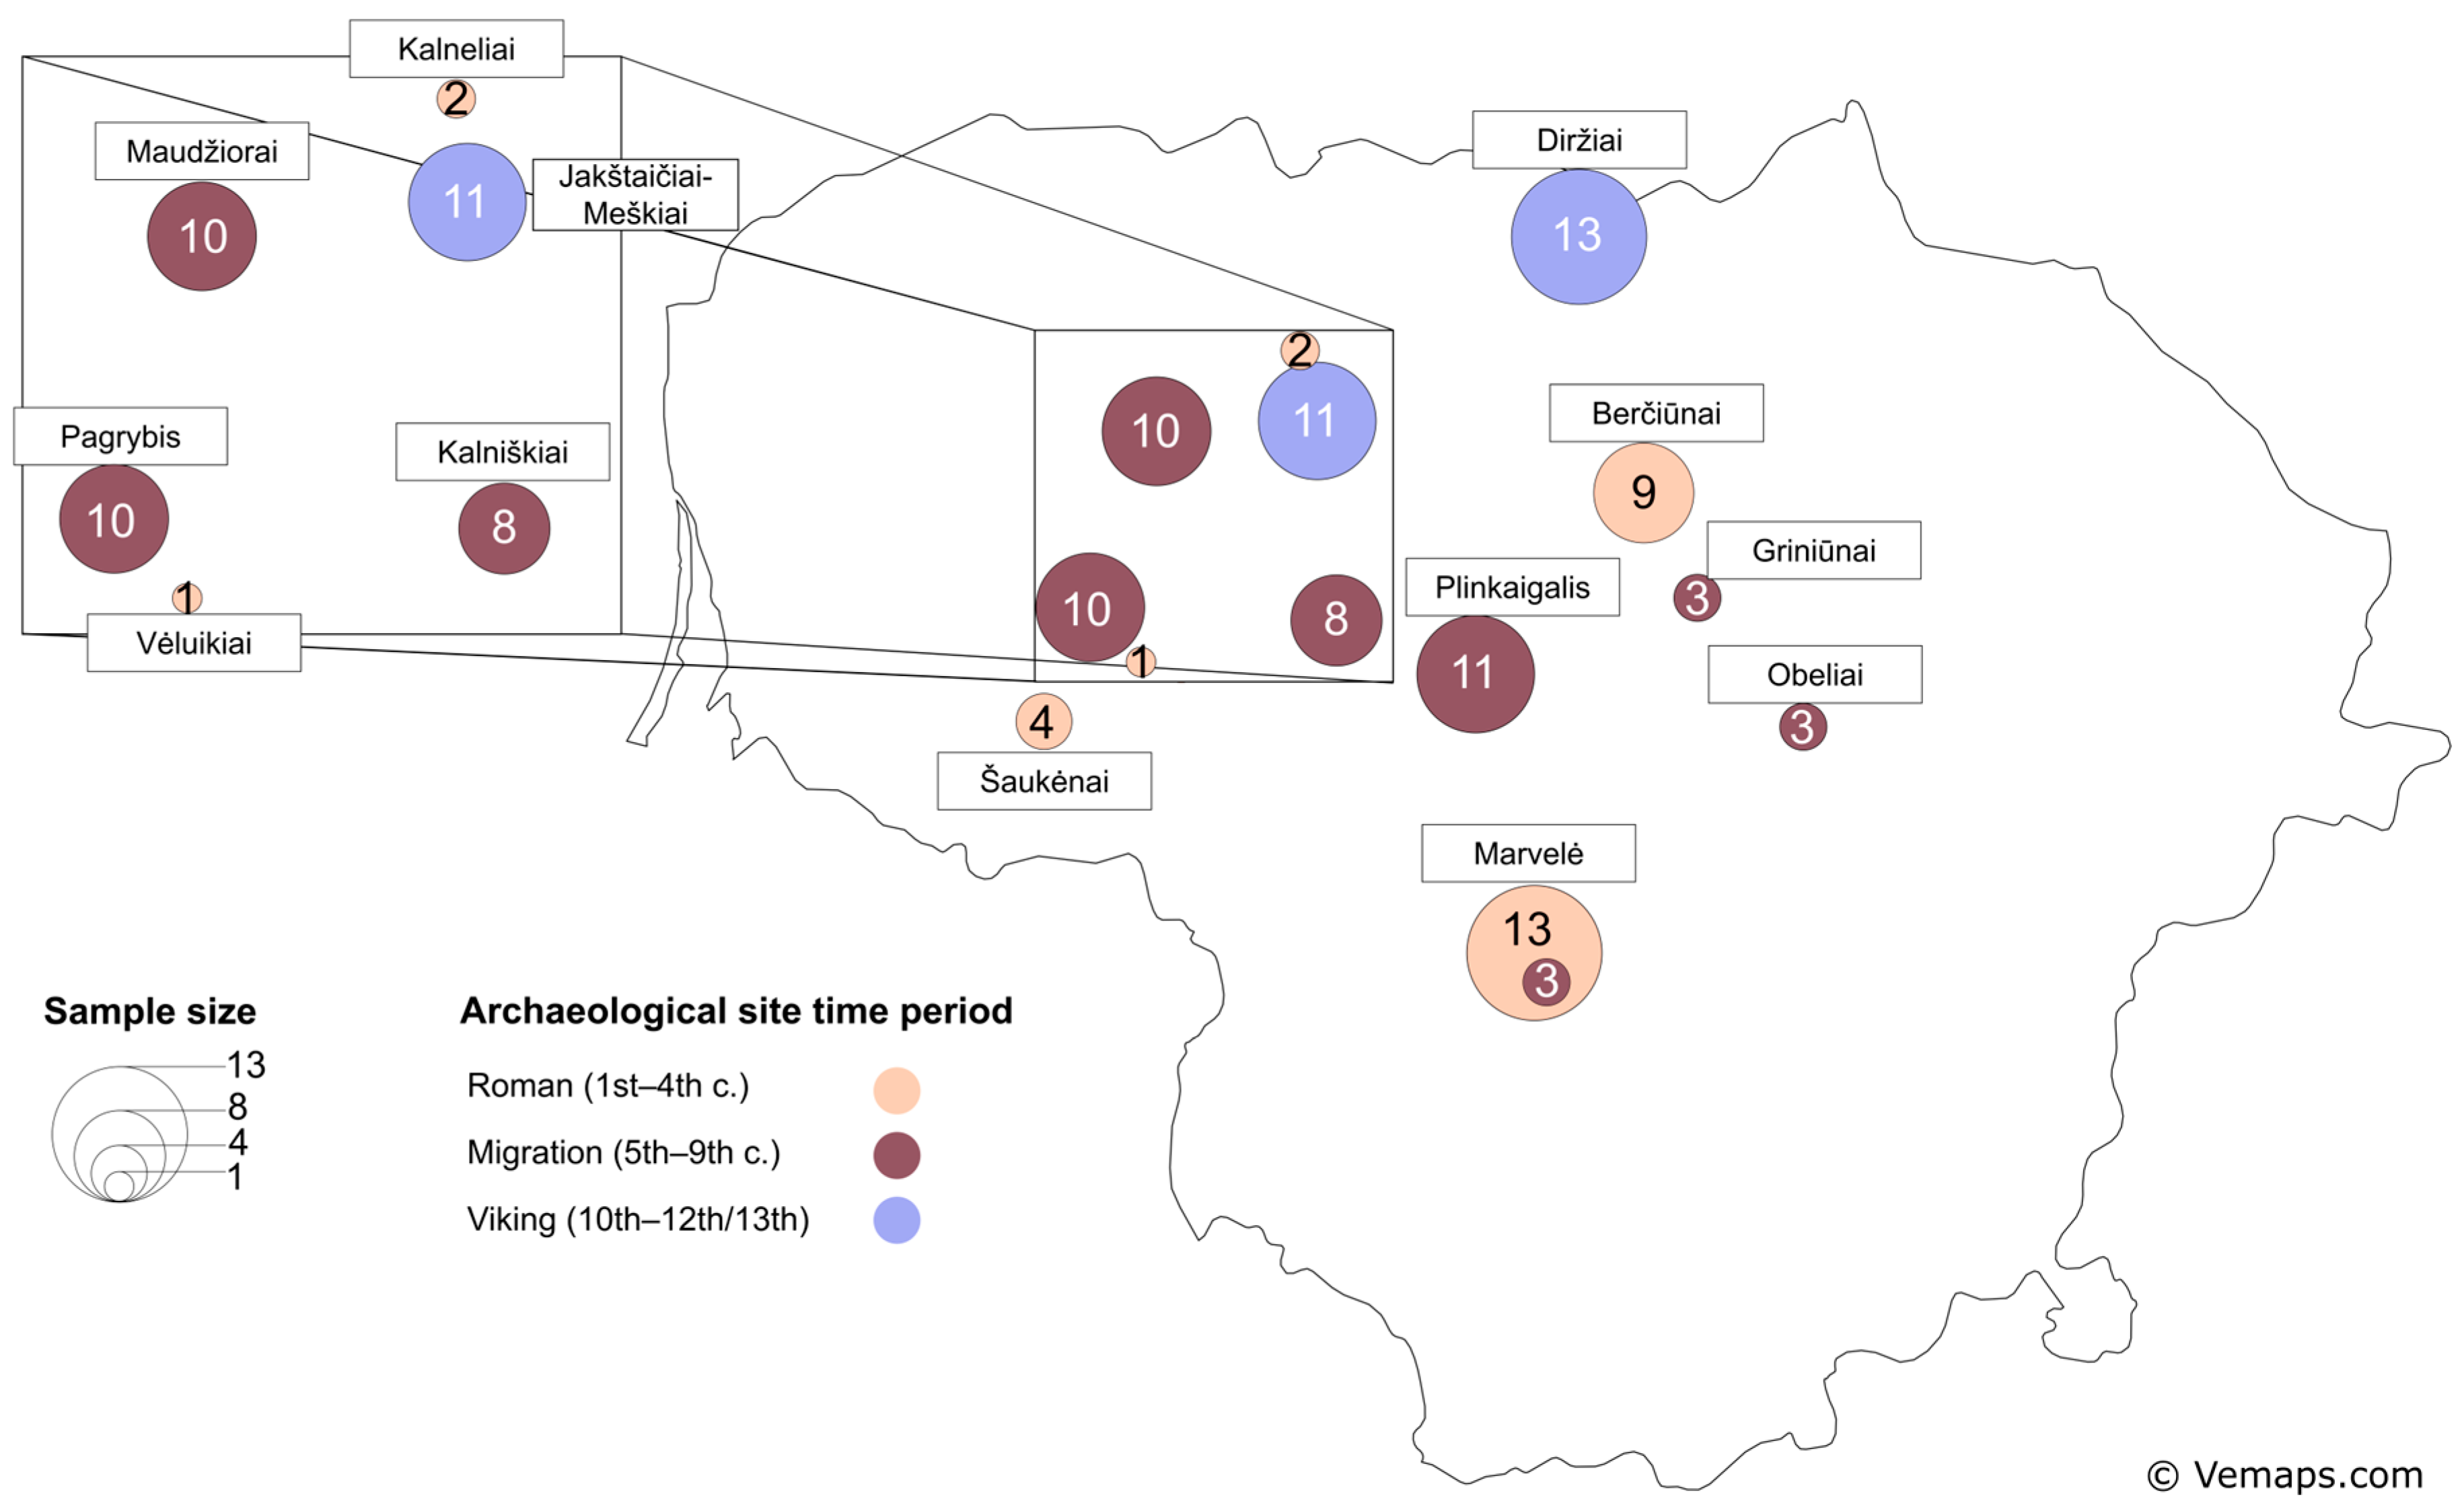
In addition to creating a uniform spatial and temporal representation, the selection of individuals was also determined by the state of osteological material preservation. At least two teeth from each individual were selected for analysis. The chosen teeth showed minimal to no dental wear and did not have any carious lesions that could potentially impact the results. Out of the selected 132 individuals, 29 from Roman, 48 from Migration, and 24 from Viking periods (101 in total) yielded sufficient data for genetic analysis (their geographic and time period distribution is represented in Figure 1).
The sex and age at death of the individuals were determined using standard methods outlined by Buikstra and Ubelaker (1994) [27]. Sex was assessed based on the morphology of the skull and pelvis. For non-adults, age was evaluated based on dental and overall skeletal development, while for adults, the primary method used was the examination of the pubic symphysis, when available [28,29]. Other skeletal indicators for ageing included the changes in the sternal end of the ribs, the auricular surface of the pelvic bone, general degenerative changes in the skeleton, including the closure of skull sutures, and dental wear [30,31,32]. The individuals were grouped into three age categories: young adults (18–34 years), middle adults (35–49 years), and older adults (≥50 years). Some overlaps between age groups and age categories were noted, i.e., individuals who fell within the 30–39 years age range were interpreted as “middle adult”, for skeletal maturity was already reached [33] (Table S1 in Supplementary Materials).
Teeth from IA individuals were delivered to the ancient DNA (aDNA) laboratory at the Department of Molecular Biology, Medical University of Lodz, Poland. Sample preparation and molecular genetic analyses were performed in a facility dedicated exclusively to ancient DNA work and free from any prior handling of modern DNA. All protocol steps (excluding sequencing) were conducted by personnel wearing disposable protective clothing. All procedures were performed under a laminar-flow hood (Heraeus Biohazard II, Heraeus Group, Hanau, Germany) using DNA-free, filter-equipped consumables. Routine decontamination included treating all instruments and surfaces with DNA-ExitusPlus (AppliChem, Darmstadt, Germany) after each experiment, followed by UV irradiation of the clean room until the next session. Multiple negative controls were incorporated at every stage of the workflow. To exclude potential contamination from laboratory staff, a Personal Genetic Identification Database (PGID) containing their genetic profiles was established.
Mitochondrial DNA was extracted and sequenced according to the protocols described previously in Witas et al. [34]. Primer pairs, L16112 (5′-CGTACATTACTGCCAGCC-3′) and H16262 (5′-TGGTATCCTAGTGGGTGAG-3′) as well as L16251 (5′-CACACATCAACTGCAACTCC-3′) and H16380 (5′-TCAAGGGACCCCTATCTGAG-3′) were used to amplify the HVRI between 16,112 and 16,380 bp. PCR products were usually readable between 16,115 and 16,340 bp as two overlapping PCR products of 186 and 171 bp. PCR products were sequenced using BigDye 3.1 Terminator Pre-Mix Kit (Applied Biosystems, Foster City, CA, USA) on ABI Prism 3130 Genetic Analyzer (Applied Biosystems). The resulting sequences were edited and analysed using BioEdit (v7.2) and MEGA 4 software [35].

2.2. Present-Day Lithuanian Sample Group

The present-day Lithuanian group consisted of 279 unrelated individuals from Western (Žemaitija), Central (Western and Southern Aukštaitija), and Eastern (Eastern Aukštaitija) Lithuania. Individuals reported at least three generations of Lithuanian descent.
Venous blood samples (and DNA extracts) were collected in 1994–1995 and during the LITGEN project (VP1-3.1-ŠMM-07-K-01-013) in 2011–2013. Ethical approval from the Vilnius Regional Research Ethics Committee was obtained for this study (No. 158200-05-329-79, date: 3 May 2011). Samples were collected with informed consent from participants. As this study is itself a population genetic investigation, the formulation in the informed consent form allows the use of the samples for this study and similar population genetic studies. There were no follow-up engagements with participants of the study.
Genomic DNA was extracted from blood using either a phenol–chloroform extraction method or an automated nucleic acid purification protocol following manufacturers’ guidelines (Freedom EVO® Nucleic Acid Purification Workstation, Tecan Group Männedorf, Switzerland; PROMEGA kit “MagneSil® Genomic, Large Volume System”, Madison, WI, USA). The quality and quantity of purified genomic DNA were evaluated spectrophotometrically (NanoDrop® ND-1000 Spectrophotometer, Waltham, MA, USA).
Multiplex sequencing on the Illumina GAII platform (San Diego, CA, USA) after in-solution capture enrichment was used to obtain complete mtDNA genome sequences with an average of 352-fold coverage depth at the Department of Evolutionary Genetics, Max Planck Institute for Evolutionary Anthropology (Leipzig, Germany).
The dataset of complete mtDNA sequences from the present-day Lithuanian population has been deposited in the NCBI SRA database, project PRJNA1378471, accession numbers SAMN53838778–SAMN53839056.

2.3. Mitochondrial DNA Data Analysis Methods

For the IA sample groups, due to the technical limitations, this study used 36 sites in the mtDNA HVRI (np 16,112–16,380 bp). The analysed polymorphic sites are diagnostic variants of haplogroups. mtDNA HVRI positions were aligned relative to the revised Cambridge Reference Sequence (rCRS) (NC_012920) [36] (Table S2 in Supplementary Materials).
For present-day Lithuanians, complete mtDNA sequences were generated with the nf-core/eager pipeline (v2.5.2) [37]. FASTQ files were pre-processed by removing adapters and bases with quality lower than 20 and reads shorter than 30 bp using AdapterRemoval (v2.3.2). DNA sequences were aligned to rCRS using the BWA-MEM algorithm (v0.7.17-r1188). Duplicated sequences were removed using DeDup (v0.12.8). The variants were called using GATK UnifiedGenotyper (v3.5-0-g36282e4), and consensus FASTA sequences were generated via VCF2Genome (v0.91). For haplogroup classification and further phylogenetic and population genetic analyses, present-day Lithuanian mtDNA data were filtered down to the aforementioned 36 polymorphic sites in HVRI for adequate comparison with the IA mtDNA data.

2.3.1. Haplogroup Classification

Haplogroups were assigned using HaploGrep 2 with the PhyloTree v17 Forensic Update 1.0 [18]. HaploGrep 2 uses Kulczynski distance metric to calculate the distance to each haplogroup and assigns the best hit [38]. mtDNA HVRI sequences were used for haplogroup classification of ancient and present-day Lithuanian samples. Haplogroups of IA samples are provided in Tables S2 and S3 and haplogroups of present-day samples in Table S4 in Supplementary Materials.
For validation purposes, we also assigned haplogroups using HaploGrep 3 (Kulczynski distance metric) [39] with the PhyloTree v17 Forensic Update 1.2 [40]. To further validate our results, we performed EMPOP haplogrouping (v4/R14) [40] with SAM 2 query engine [41] based on phylogenetic build PhyloTree v17 [18]. EMPOP identified neighbours by cost, and patterns were matched between the query and the database. The following haplogroup distribution and phylogenetic analyses were performed using samples that met either of the criteria: (1) the HaploGrep haplogroup assignment corresponded with EMPOP, or (2) more than one variant differing from the rCRS was found among the analysed mtDNA positions. Except for the samples with no variants differing from the rCRS, they were assigned to macrohaplogroup R0/H (Supplementary Materials Table S2). After criteria application, 79 IA samples (Roman, n = 23, Migration, n = 37, and Viking, n = 19) and 206 present-day Lithuanian samples remained.

2.3.2. Statistical Analysis

The following statistical and population genetic analyses, described in Section 2.3.2 and Section 2.3.3, were performed using R software (v4.4.2) [42]. A p-value less than 0.05 indicates a statistically significant result.
Haplogroup distribution pie charts were created using the R package ggplot2 (v3.5.1). Fisher’s exact test with 10,000 replicates from the R package stats (v4.4.2) was used to compare haplogroup distribution spatially and temporally.

2.3.3. Phylogenetic and Population Genetic Analyses

The temporal change in Lithuanian population mtDNA diversity across the three IA periods and the present-day population was further explored through phylogenetic and genetic variation analysis.
Median-joining networks [43] of mtDNA haplotypes of haplogroups H and U were generated and visualised using PopART (v1.7) with default parameters (ε = 0) [44]. Median-joining networks were reconstructed as phylogenies based on sequence similarities, rather than evolutionary history, by calculating median vectors, and allowed for the visual comparison of haplotype distribution among different sample groups [43,45].
For genetic differentiation between the IA and present-day groups, we estimated pairwise Fixation index (FST) [46] (bootstrap 1000, 95% CI) using the StAMPP R package (v1.6.3). For further population analyses, we used pairwise Hamming distances between samples and mtDNA variation calculated with R package ape (v5.8.1). Hamming distances were chosen for a comparison between haplotypes across different time periods, that is direct and without assumptions. Analysis of Molecular Variance (AMOVA) was used to assess inter- and intra-population genetic diversity [47]. AMOVA with 10,000 permutations was performed using the pegas R package (v1.3). Classical Multidimensional-scaling (MDS) [48] was conducted using R packages stats and ggplot2. MDS reduces dimensions while preserving distances between samples to assess their genetic relationships.
A comparative analysis with other European populations was performed by assembling a dataset from publicly available data [49,50], the NCBI database [51,52,53,54,55,56,57,58], and the 1000 Genomes Project [59]. The data and the references are described in Table 1 and in Table S10 in the Supplementary Materials. These data were filtered down to the HVRI sequence for adequate comparison with the IA mtDNA data. The comparative dataset was used for FST and MDS analyses.

3. Results

After data quality control, 101 out of 132 sampled IA individuals from archaeological sites in the territory of present-day Lithuania were used.

3.1. Haplogroup Distribution

Haplogroups were determined using HaploGrep 2 and validated with HaploGrep 3 and EMPOP (v4/R14). Over the third of the assignments corresponded (40% of IA samples and 43% of the present-day Lithuanians) (Supplementary Table S5 of HaploGrep 2 vs. HaploGrep 3 vs. EMPOP results). Based on this, for the haplogroup distribution analysis, we omitted samples that had only one variant differing from the rCRS and for which haplogroup assignment did not match between HaploGrep and EMPOP (22% of IA samples and 27% of the present-day Lithuanians).
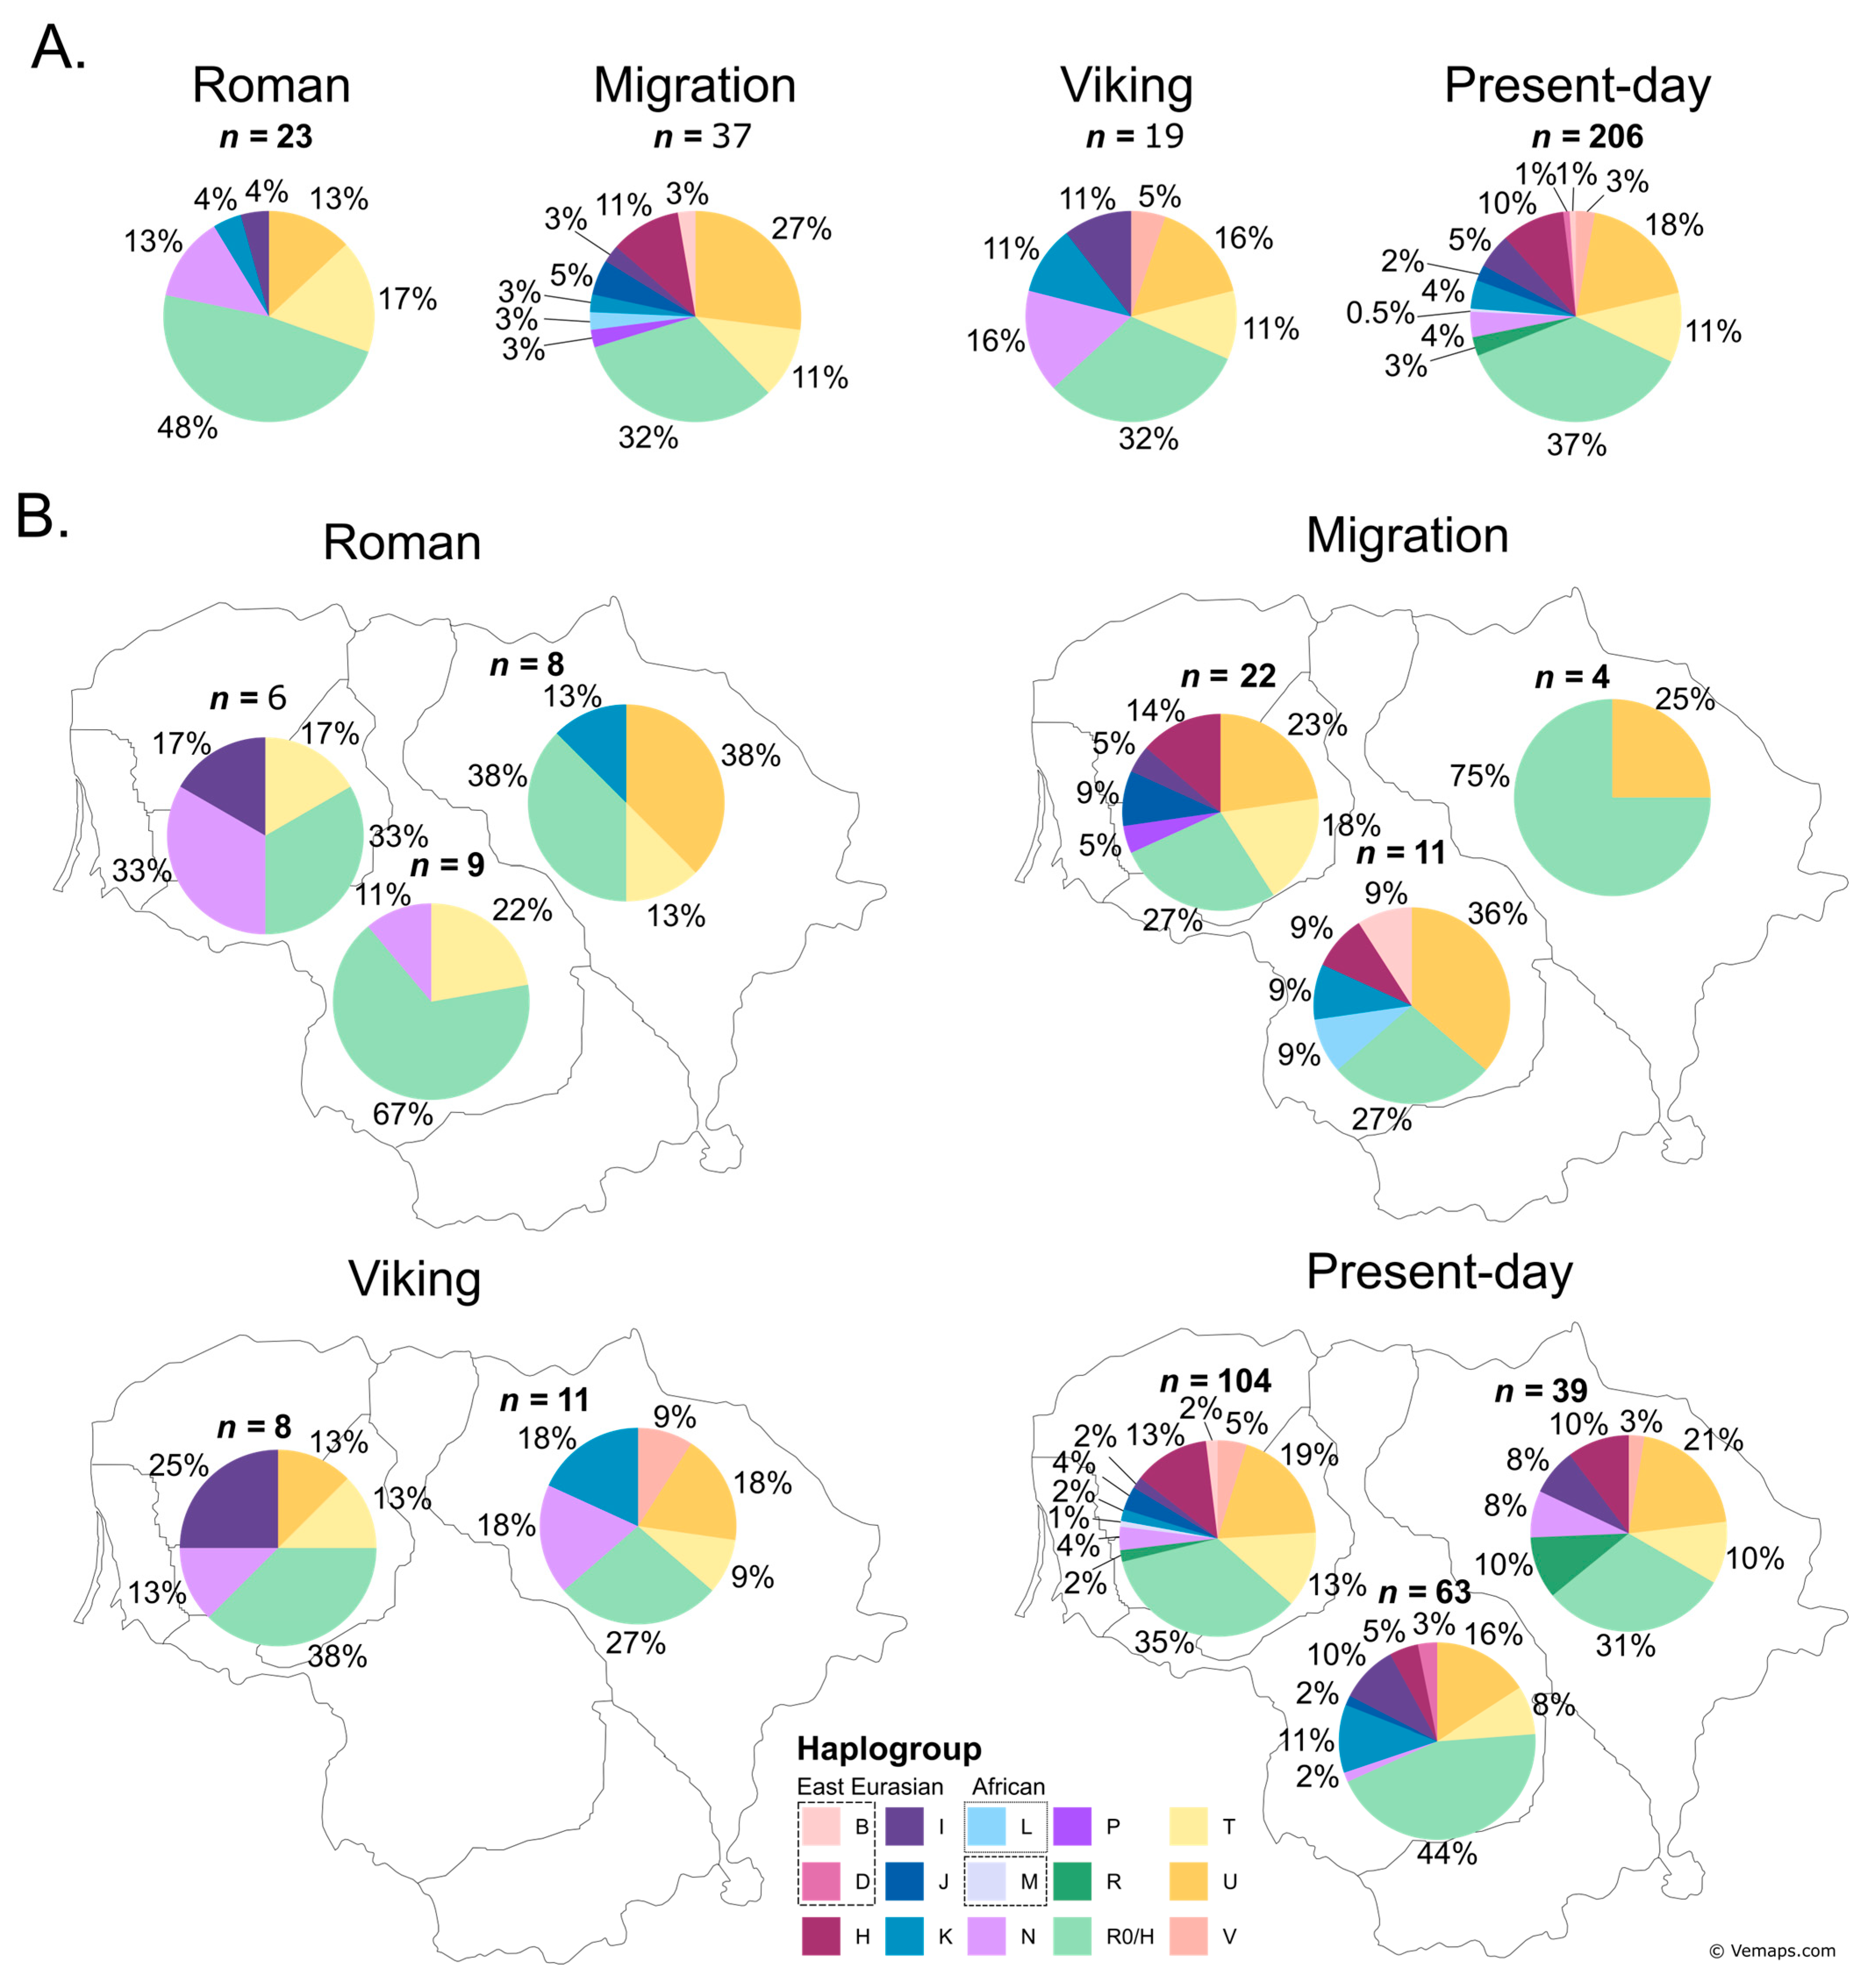
The 79 out of 101 mtDNA samples from IA were classified into 12 haplogroups and 18 sub-haplogroups (Figure 2A). For the present-day Lithuanians, 206 out of 279 samples were classified into 13 haplogroups and 36 sub-haplogroups. A total of 15 distinct haplogroups and 39 sub-haplogroups in total were identified in the IA groups and the present-day Lithuanians. Majority of the samples in all groups did not differ from the rCRS and were assigned to haplogroup R0/H (Roman 48%, Migration and Viking groups 32%, and present-day Lithuanians 37%) (Figure 2). Haplogroup U was the second most frequent lineage in the Migration, Viking, and present-day Lithuanian groups (16–27%). Haplogroup T was the second most frequent in the Roman period (18%), and third most frequent in the Migration period and present-day (11%). Haplogroup N was also frequent in the Roman (13%) and Viking groups (16%); however, its frequency was lower in the present-day Lithuanians (4%). Interestingly, despite ambiguous results from different tools (see Supplementary Materials Table S5), sub-haplogroups L4b2 (HaploGrep) or M (EMPOP) and B4 popped out in two individuals (accordingly PLI044 and PLI043) from the Plinkaigalis archaeological site, dated to the Migration period. Differences in 15 haplogroup frequencies between all four time periods were statistically insignificant (Fisher’s exact test with 10,000 replicates, p > 0.05).
To see if the temporal mtDNA haplogroup variation was associated with geography, we divided the IA period and present-day Lithuanian samples by their geographic location into Western (Žemaitija), Central (Western and Southern Aukštaitija), and Eastern (Eastern Aukštaitija) regions (Figure 2B, Figure S2 in Supplementary Materials). Haplogroup R0/H remained consistently the most frequent haplogroup in all regions across time. However, samples assigned to R0/H may include lineages belonging to haplogroup H, as the available mtDNA variants do not provide sufficient resolution to distinguish between basal R0 and derived H haplogroups. Conversely, haplogroup U was the second major haplogroup in all time periods and geographic regions, although it was not found in the Roman period individuals from Western and Central Lithuania.
Present-day samples from the Western region had the highest diversity of haplogroups overall (12 vs. 9 in the Central and 8 in the Eastern regions). Significant regional differences (p = 0.04; Fisher’s exact test, 10,000 replicates) were observed in the haplogroup distributions of IA samples (as one group) and present-day Lithuanians as well. Fisher’s exact test (10,000 replicates) revealed no significant differences in haplogroup distributions across geographic regions during the Roman, Migration, or Viking periods (p > 0.05).

3.2. Phylogenetic Analysis

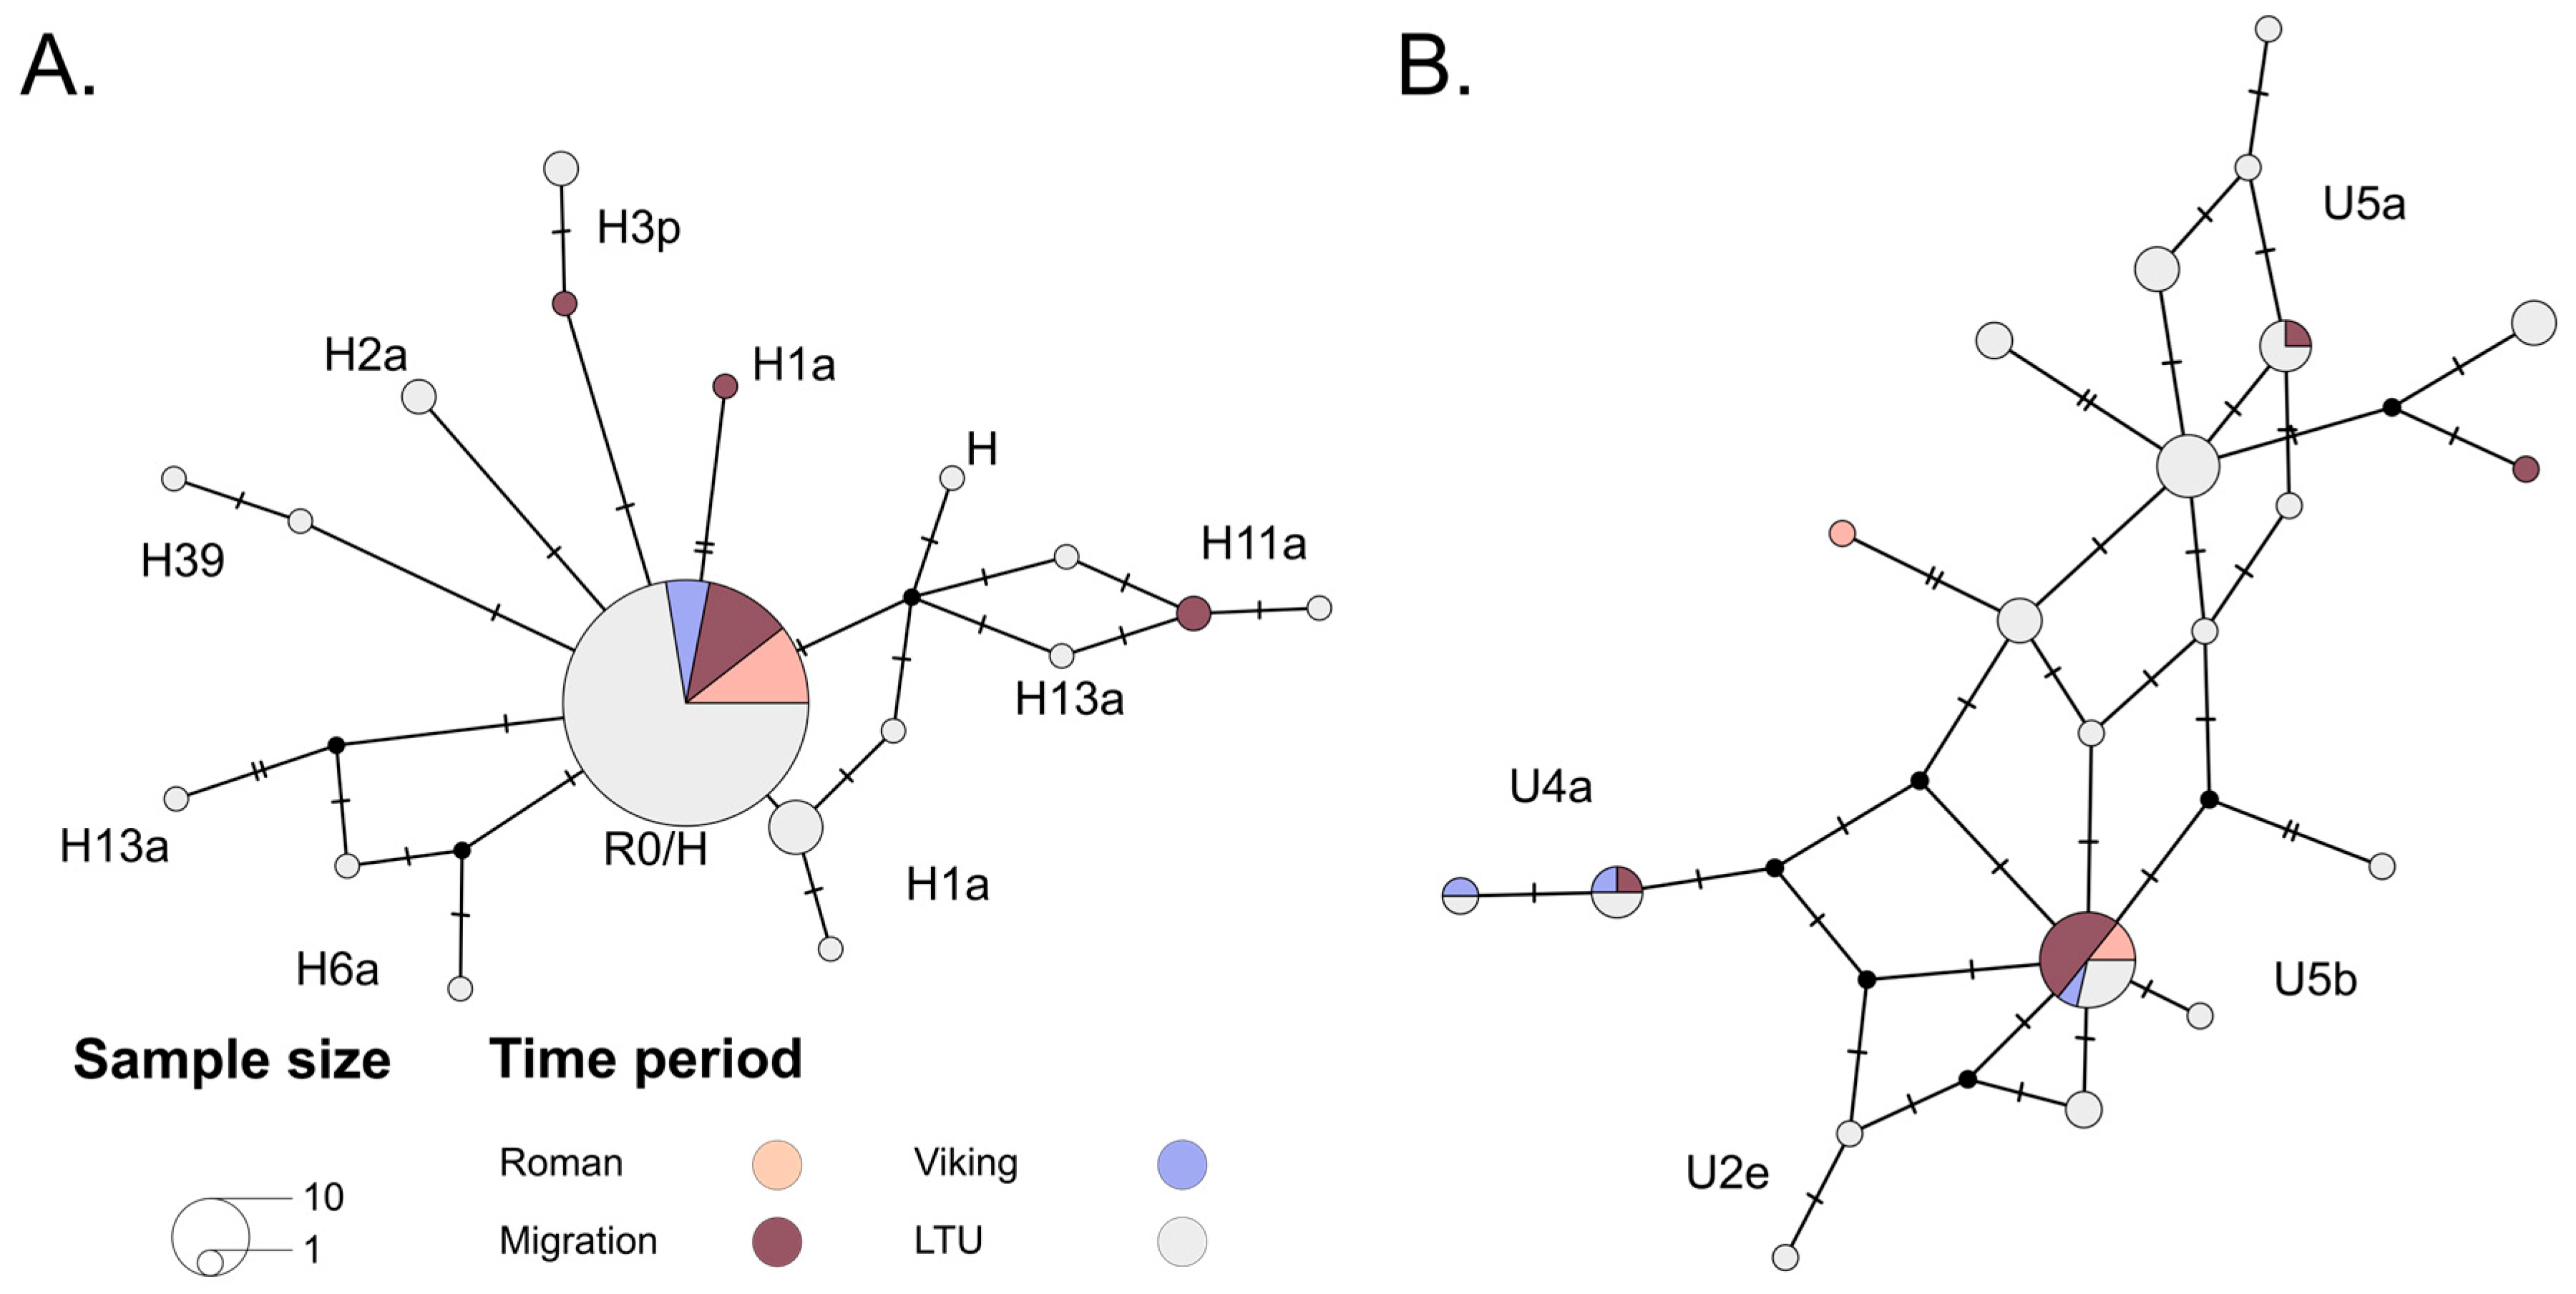
Phylogenetic analysis was conducted to investigate the evolution and haplotype diversity of the most frequent haplogroups R0/H and U over time. The constructed median-joining haplotype network of haplogroup R0/H (Figure 3A) featured a mostly star-like network, revealing greater diversity in present-day mtDNA with a few haplotypes found only in the IA groups. Greater diversity might be uncovered due to the larger sample size of the present-day Lithuanians. Most of the samples were assigned to the haplogroup R0/H (82% out of all the samples in the R0/H network), plotted as the largest circle in the network, and did not differ from the rCRS in the analysed range (Table S2 in Supplementary Materials).
Haplogroup U haplotypes appeared more dispersed in the median-joining network compared to the network of haplogroup R0/H (Figure 3B). The network of haplogroup U exhibited more diverse mtDNA haplotypes in the present-day Lithuanians and a few distinctive IA mtDNA haplotypes.

3.3. Population Genetic Analysis

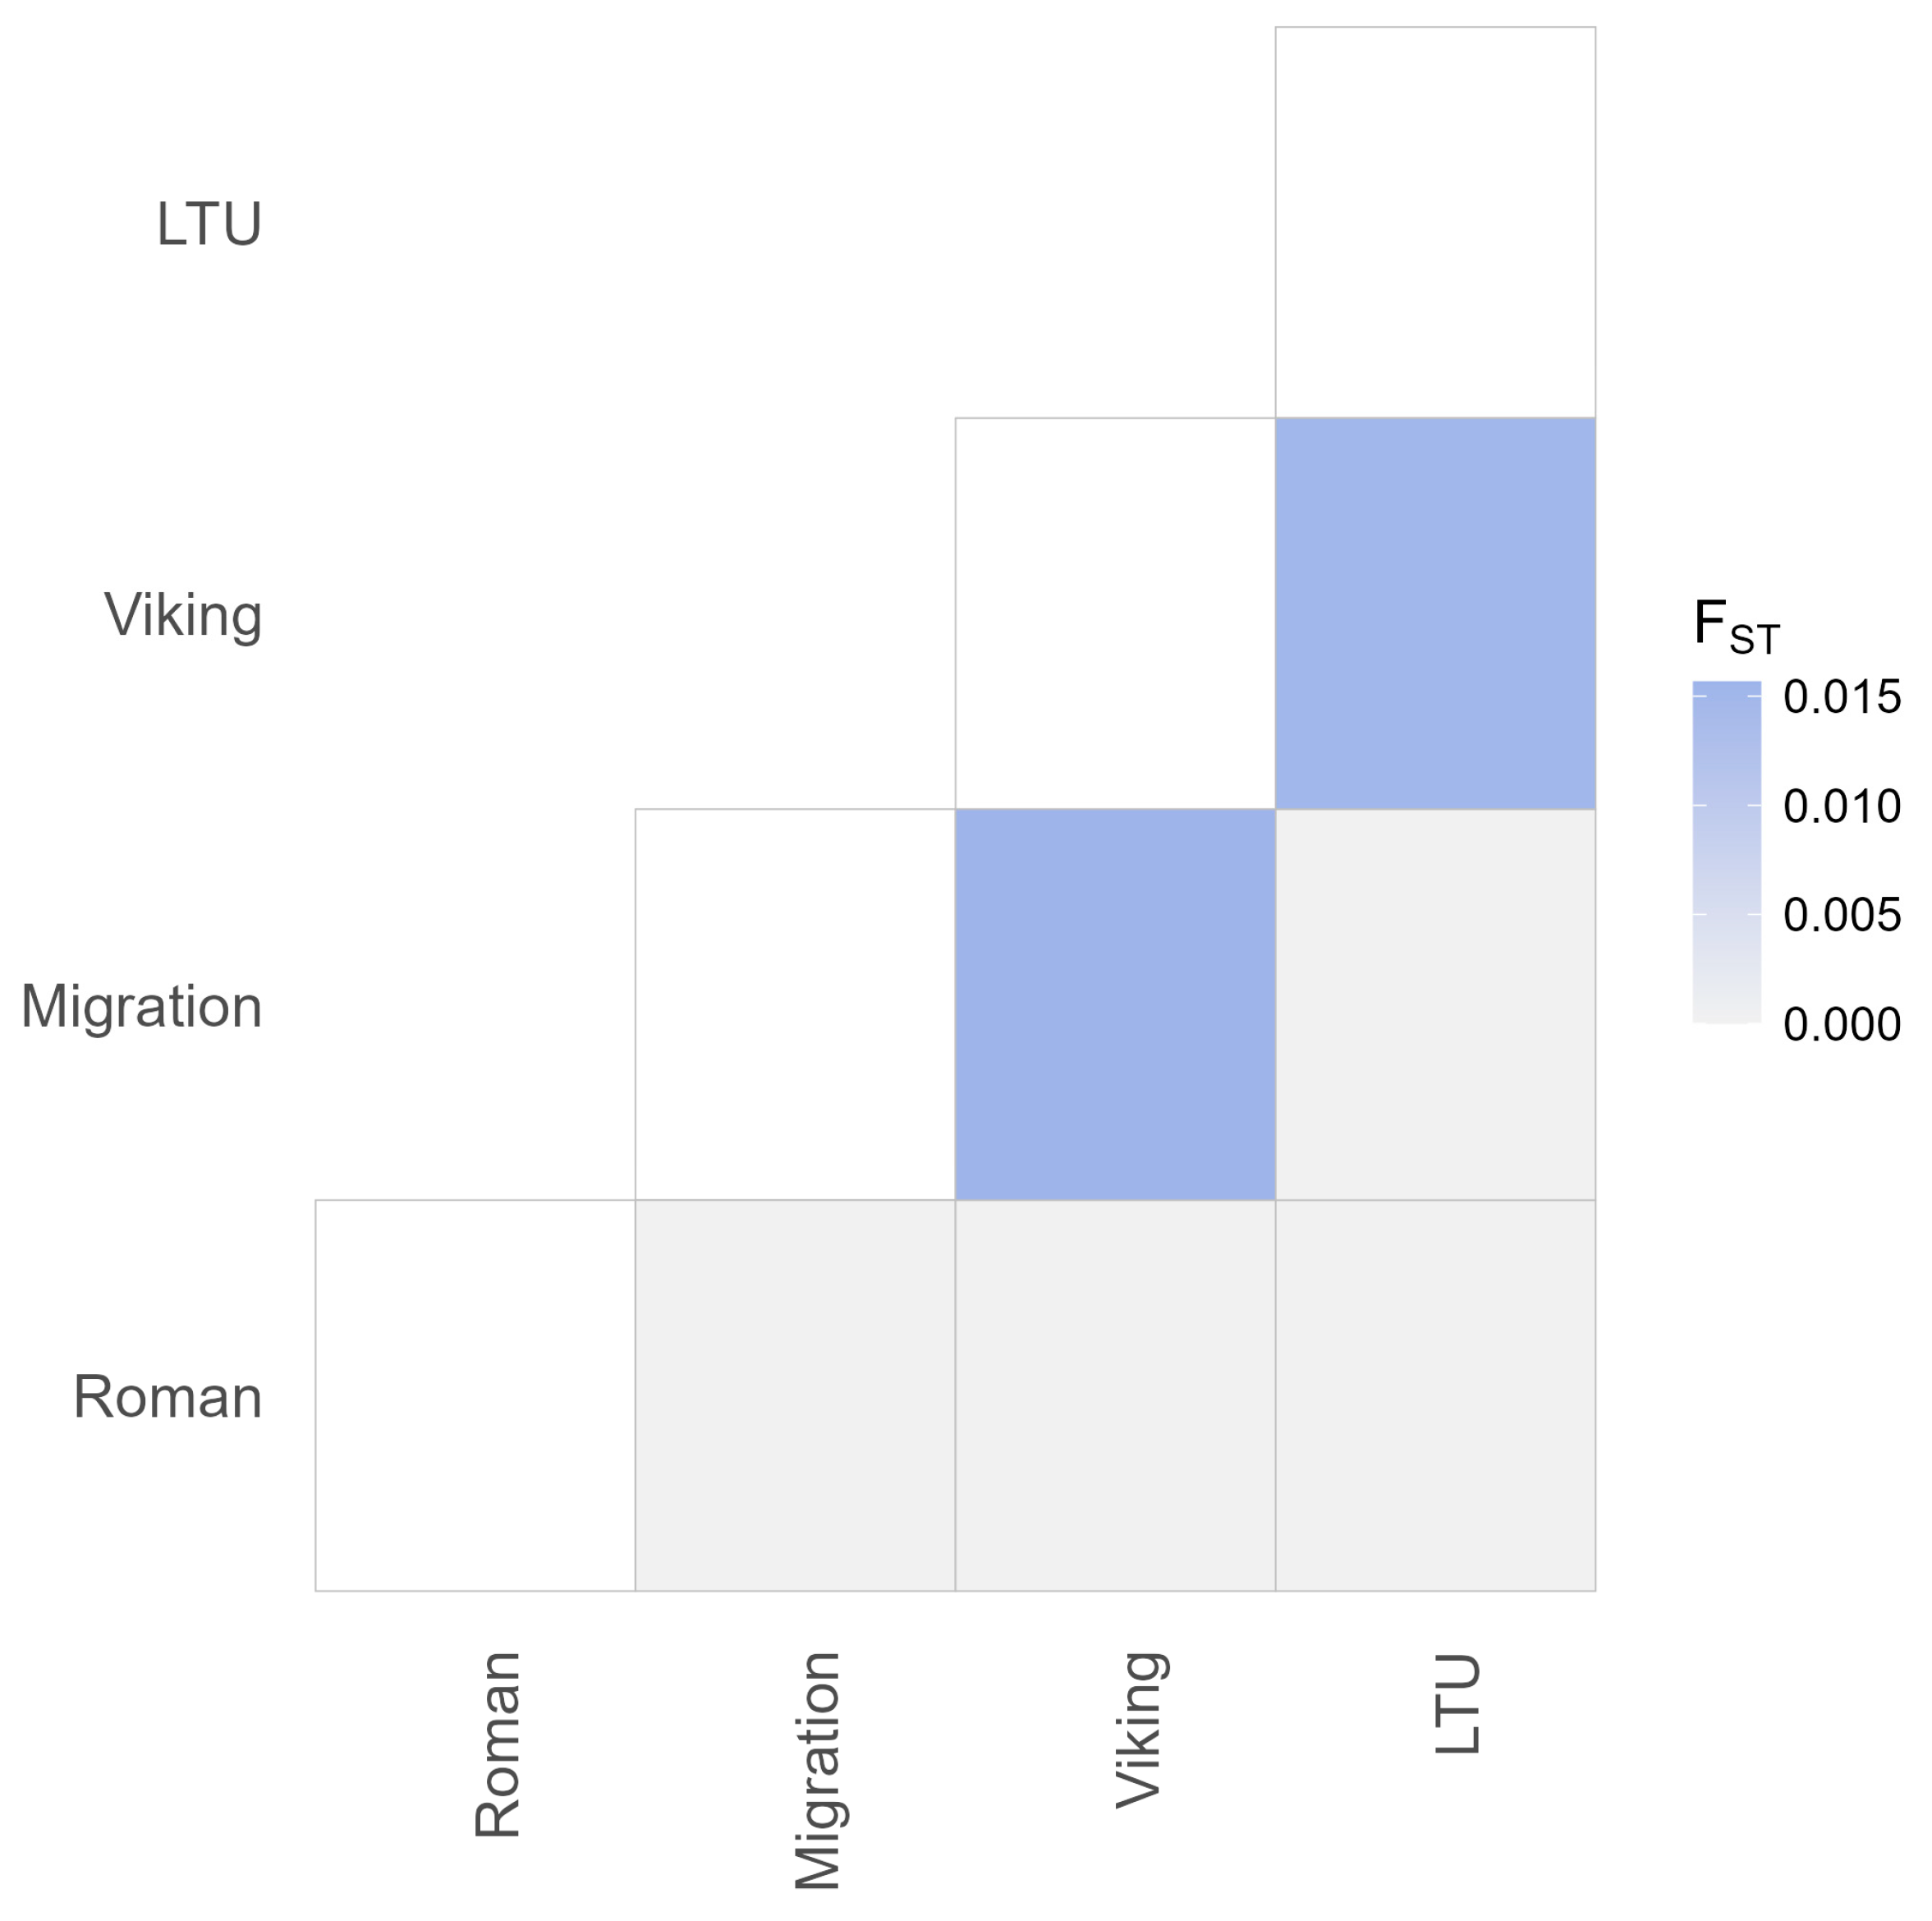
The pairwise FST between the Roman, Migration, Viking, and present-day Lithuanian population groups revealed no significant differentiation in between different time periods (p > 0.05 between all pairs). We observed low genetic differentiation between the Migration and Viking sample groups (FST = 0.016) and between the Viking and present-day Lithuanian populations (FST = 0.015) and no genetic differentiation between the Roman group and the other groups, as well as between the Migration group and the present-day Lithuanian population (FST < 0) (Figure 4). Higher FST values between the Viking and the Migration period groups or present-day Lithuanians were possibly affected by the small sample size of the Viking period group, with additional samples possibly revealing higher genetic affinities between these periods. Similarly, low differentiation was detected by including the present-day European population data, with FST values remaining below 0.1 (Table S8 in Supplementary Materials). However, haplotypes were able to differentiate an outgroup African population (Yoruba, Nigeria) from European populations, including the Lithuanian IA, with FST values ranging from 0.26 (Roman group) to 0.36 (Bosnia and Herzegovina), and the differences were statistically significant (p < 0.05 for all populations).
For the following genetic analyses, we calculated Hamming/pairwise distances using 36 sites from the HVRI region of mtDNA. We used these distances to carry out AMOVA to assess the genetic variation proportion (Table 2). Most of the genetic variation was determined within populations (96–99%). When comparing the proportion of total variance among different combinations of groups, the highest variance (3.7%) was between the three IA groups. The variance between the three IA groups and present-day Lithuanians was lower (2.2%). The lowest genetic variance (<1%) between groups was estimated when we analysed IA as one group and present-day Lithuanians as another. There were statistically significant differences found between IA groups and between IA groups and present-day Lithuanians (p < 0.05).
The AMOVA results could indicate changes in genetic population structure among different IA time periods and the overall genetic continuity from the IA to the present day. It is important to note that unequal sizes of our sample groups could also have affected results, as larger groups, such as present-day Lithuanians, might increase statistical power. Additionally, in our case, there was a limited number of populations, which decreased the number of unique permutations affecting p-values [60].
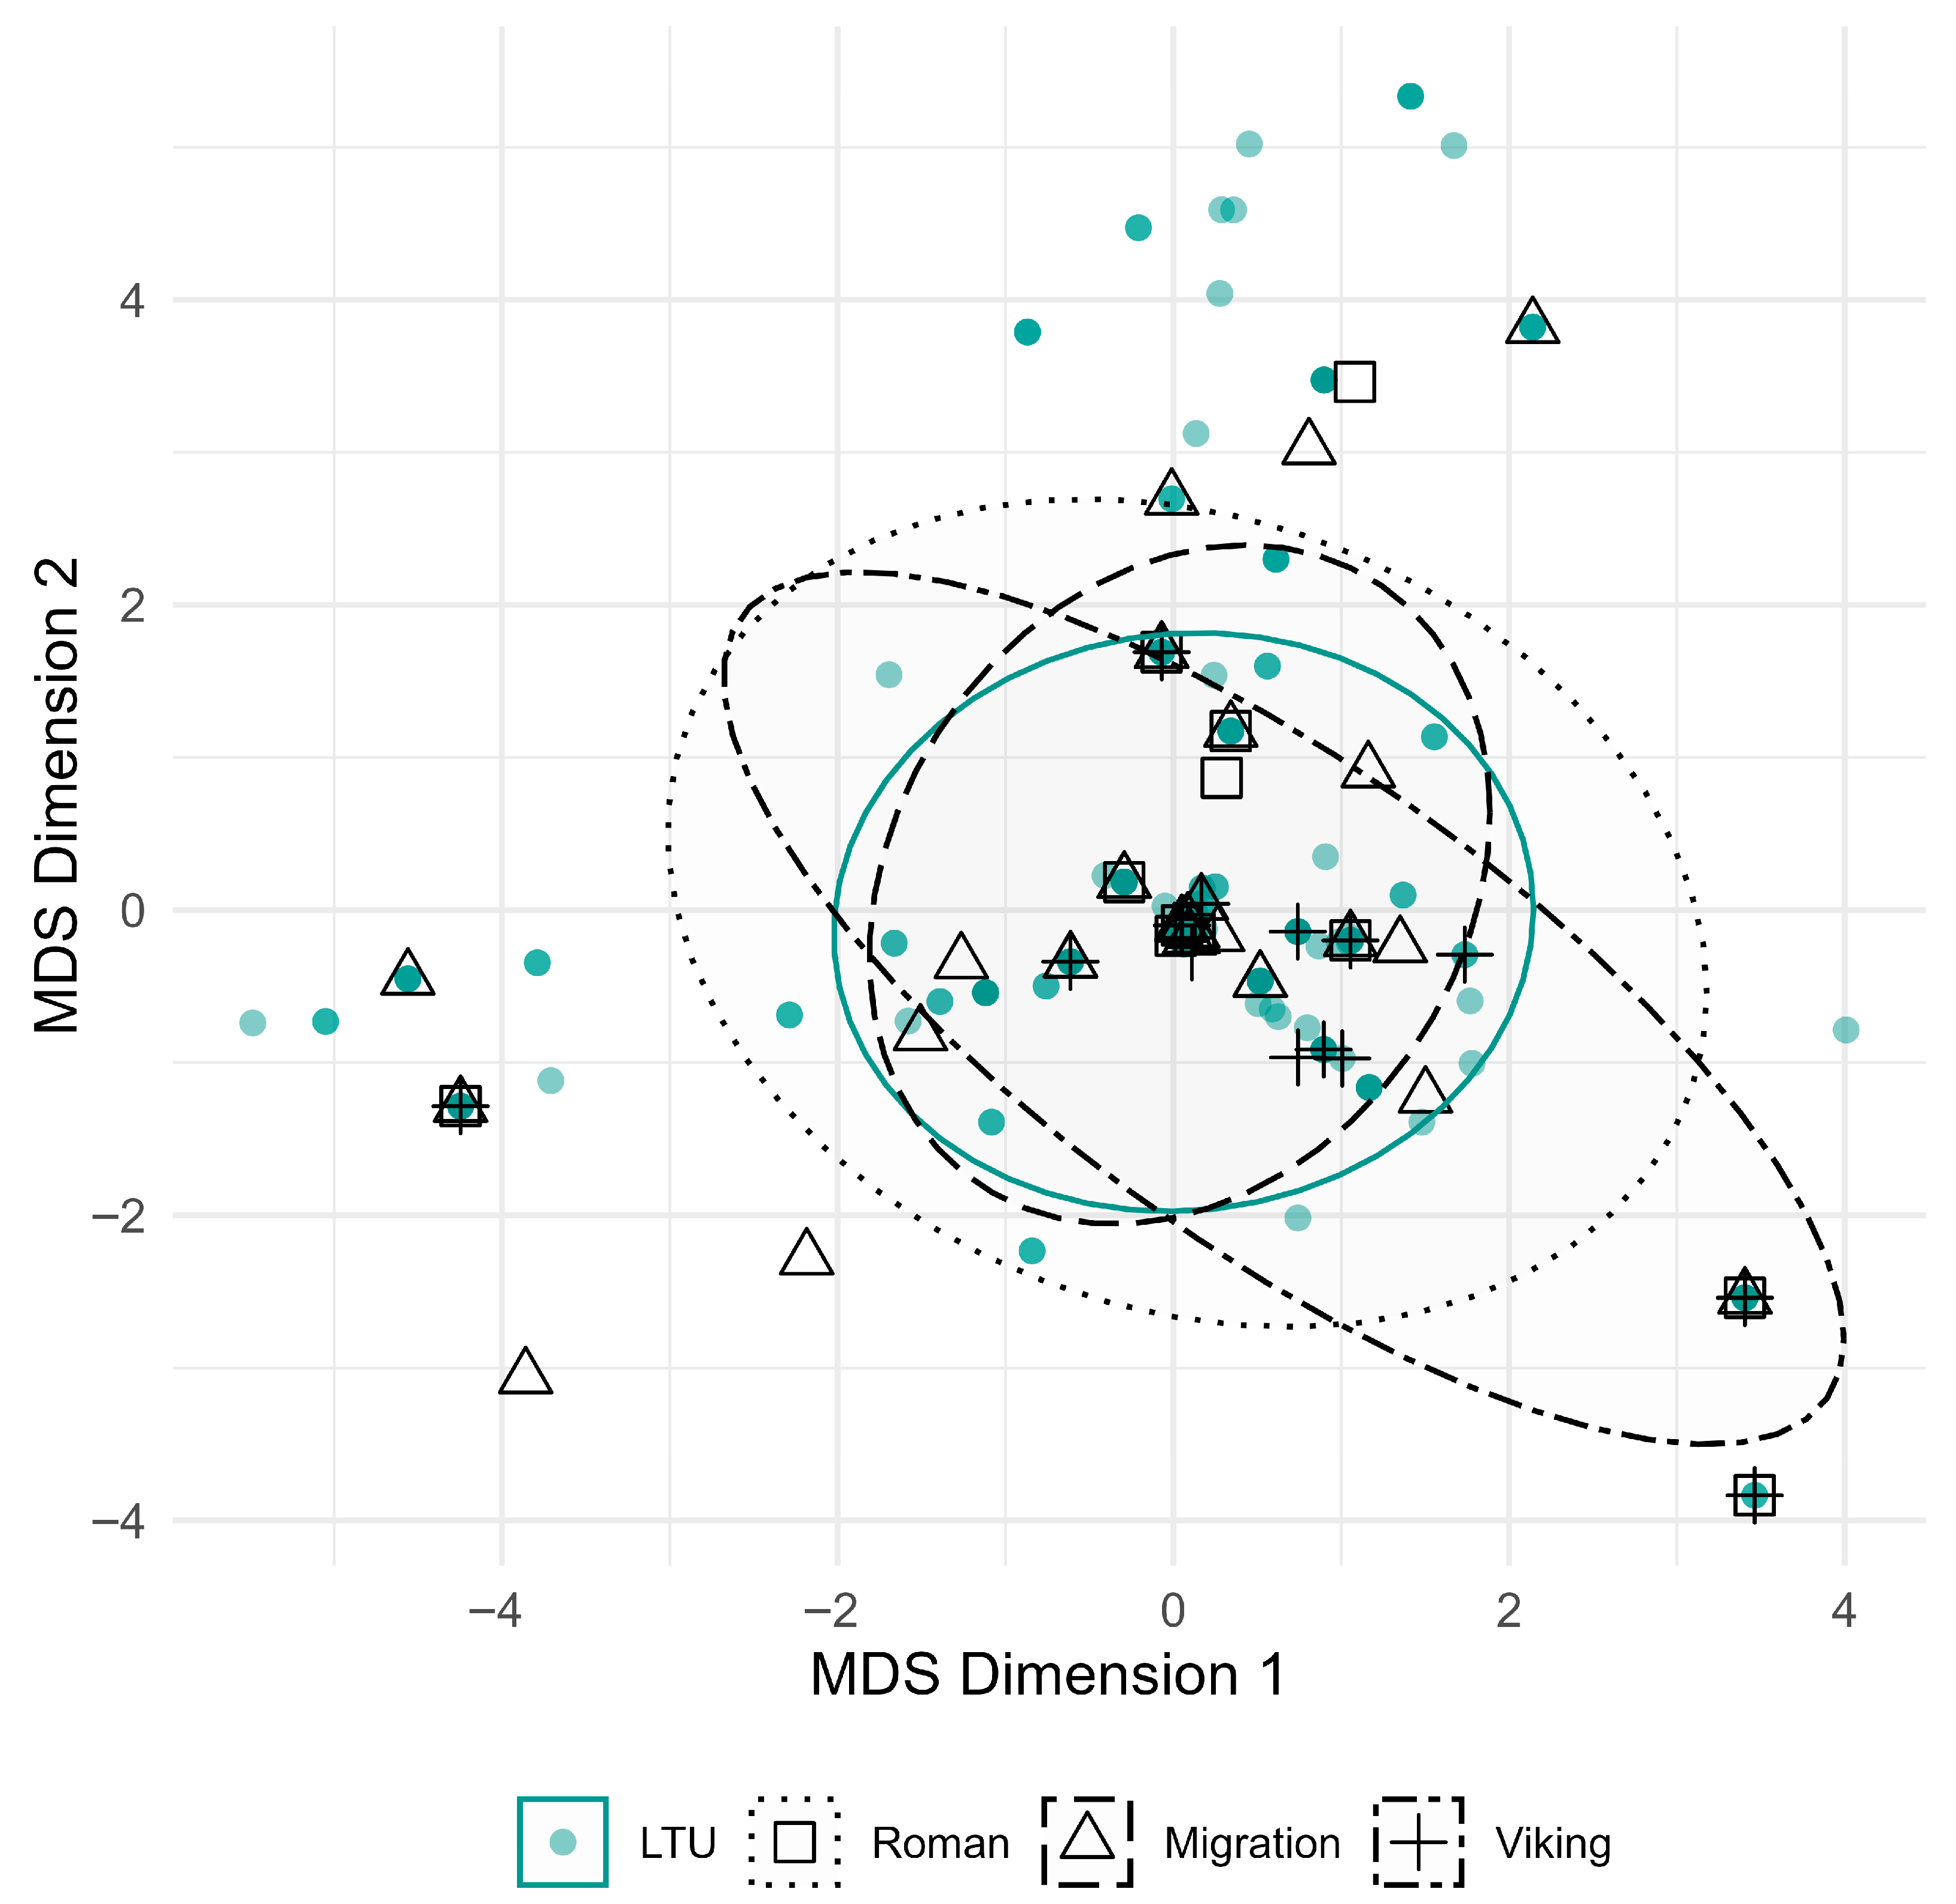
We used MDS to compare mtDNA diversity in the Lithuanian sample groups during the IA and the present-day. We generated an MDS plot based on Hamming distances with 95% confidence ellipses to visualise the dispersion of the mtDNA variation data of each individual representing the IA group (Figure 5). The overlap of confidence ellipses and sample projection along the first dimension implied similar patterns of mtDNA diversity during the Migration period and today. The Roman and Viking group data dispersion differed from those of the other two groups. The confidence ellipse of the Viking group notably extended along both first and second dimensions, while the majority of the Migration and present-day data clustered around zero.
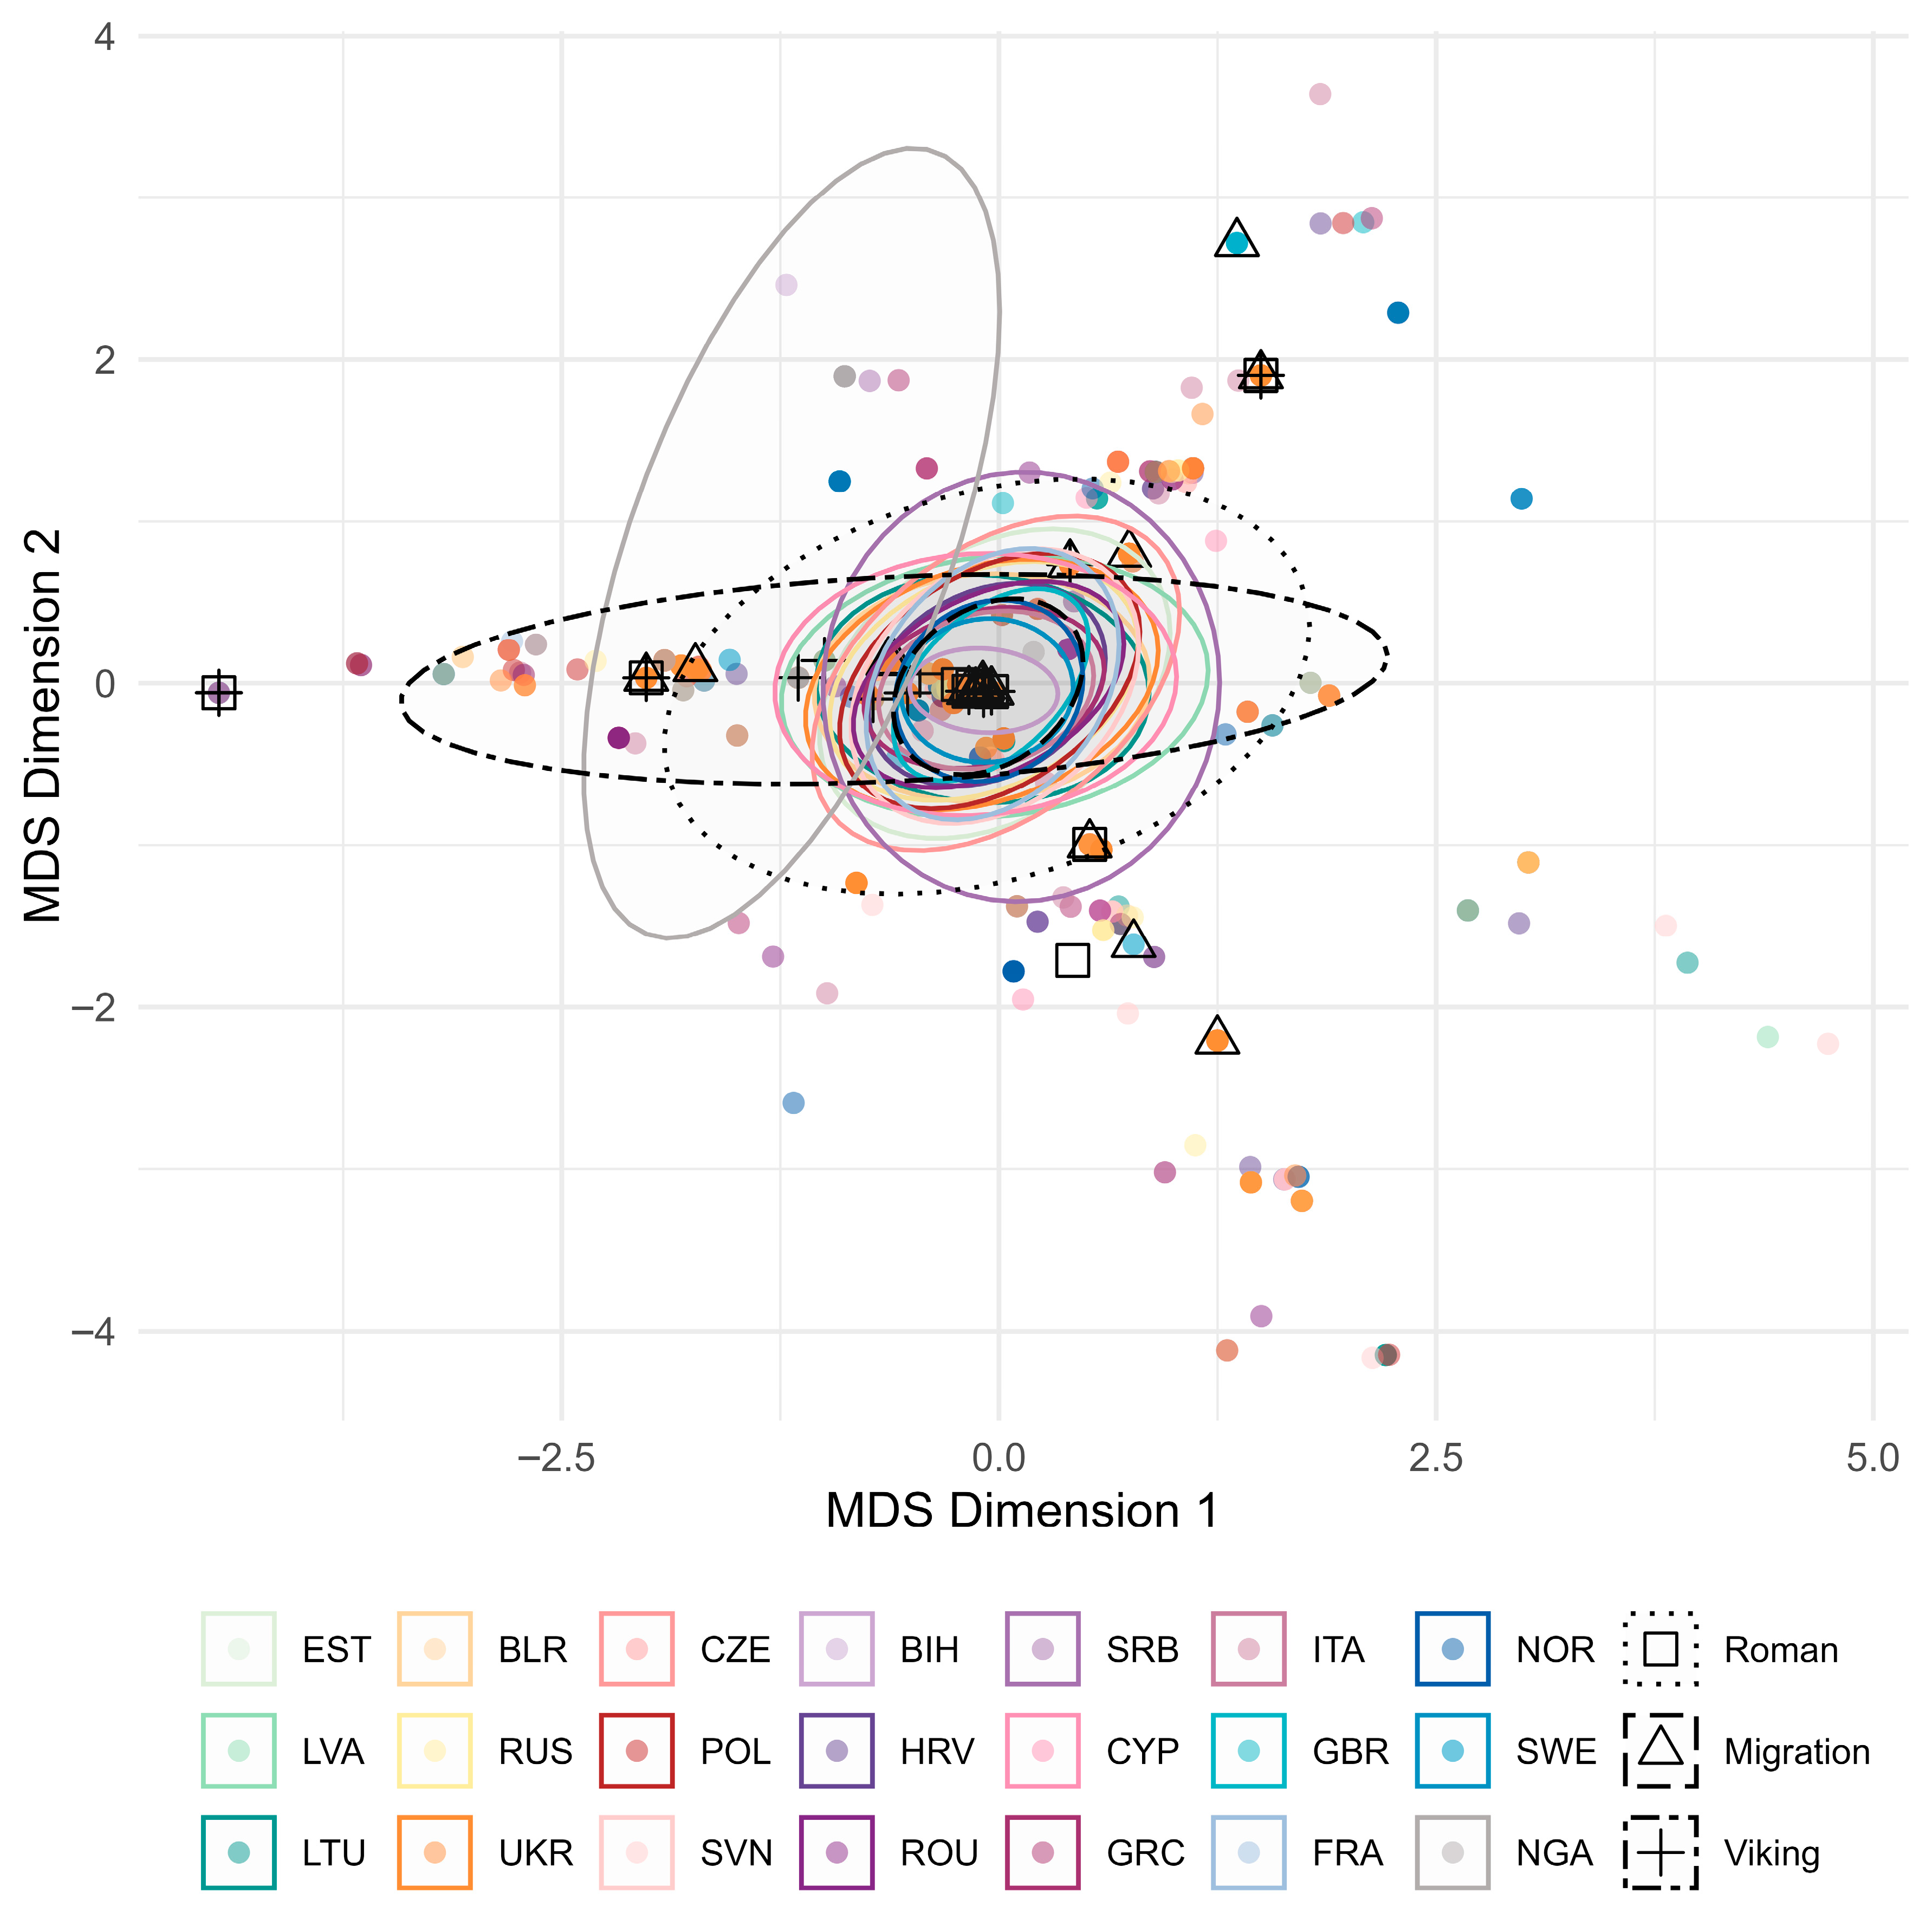
To compare differences and/or similarities, we projected the same mtDNA sites of other present-day European populations on a second MDS plot (Figure 6). The Migration period individuals fell into the range of present-day European populations’ mtDNA diversity, whereas the Roman and Viking period mtDNA variation was more dispersed. Moreover, the Viking group exhibited higher genetic diversity than the other Lithuanian IA groups or present-day European populations. It should be emphasised that such differences in data dispersion might have resulted from the small sample size of the Viking group, rather than its genetic differentiation per se.

4. Discussion

In this study, we compared the diversity of mtDNA in the IA (represented as Roman, Migration, and Viking periods) and the present-day Lithuanian samples. We analysed previously unpublished 279 mtDNA complete sequences of present-day Lithuanians, as well as 36 mtDNA HVRI variants of 101 IA individuals. Our analysis showed a variation in the diversity of haplogroups over time (with the presence of the non-European L4b2 or M and B4 haplotypes in the IA and a wide spectrum of European haplogroups in the present-day Lithuanian population), with a stable prevalence of R0/H and U as major haplogroups through the IA and current times.
The present-day Lithuanian population’s mtDNA was extensively studied using different techniques and methods. However, ancient material mtDNA studies from present-day Lithuanian territory were fragmented and started with the oldest material from the Mesolithic and Neolithic periods [24]. We show that the major mtDNA haplogroup was U (individuals Spiginas4, Kretuonas1, Kretuonas2, and Kretuonas3). By contrast, another study conducted using the Neolithic and Bronze Age individual mtDNA data from the territory of present-day Lithuania showed the presence of H haplogroup (H11a, H, H4a, H5), in addition to K, I, W, and T [26]. Our results show that the majority of all the samples were assigned to haplogroup R0/H (32–48%). We cannot be sure of their haplogroup assignment without a broader set of mtDNA SNPs, although it is possible that many of these individuals belong to haplogroup H. Future whole mitogenome analyses are required to confirm whether the influx of haplogroup H possibly occurred during the Late Bronze Age and the Early IA. These findings might align with the results of previous studies of recent admixture of Western hunter–gatherers and Eastern hunter–gatherers with the presence of haplogroup H before arrival of the Neolithic farmers [26].
Haplogroup U was the second most common in all groups, except for the Roman period, with its highest frequency occurring in the Migration period (27%). During the Roman and subsequent periods, haplogroups T, U, and N were among the most common maternal lineages, though their relative frequencies varied across time. Haplogroup U is dominated by haplogroup U4 during the Viking period, whereas haplogroup U5 is more prevalent in both the Migration and later Viking periods. Haplogroups U4 [61] and U5 [62] have distinct evolutionary and geographic trajectories within western Eurasia, and this temporal shift may correspond to different population processes or demographic expansions in Lithuania across these historical stages.
Notably, the sample of Migration period was assigned the old African origin [63] sub-haplogroup L4b2 by HaploGrep tool, while the EMPOP suggested better value for haplogroup M. The presence of haplogroup L, which is of African origin, in our IA samples would be a unique finding, as it was not reported, to our knowledge, elsewhere in the Baltic region. In other regions of Europe, haplogroup L has been present before the Bronze Age. There are cases of haplogroup L appearing in ancient individuals dated to 3000 BCE and ~1800 BCE (excavated in Czech Republic) [64] and an ancient individual from the Corded Ware culture (excavated in Poland) [65]. Interestingly, in the samples dated to the Migration period, we observed sub-haplogroup B4, which is not typical for the analysed region and indicates East Asian ancestry [66]. HaploGrep and EMPOP quality values for this haplogroup were moderate; thus, more mtDNA sequence data might change the result. Despite the possible presence of atypical haplogroups, either L4b2, or M and B4, the burial customs of these individuals were not exceptional, but rather analogous to those of other individuals from the same archaeological sites. Present-day Lithuanians also carry haplogroups of Asian (B, D, M) ancestry at low frequencies, indicating some continuity of these lineages. Populations with Asian mtDNA ancestry reached the central part of Europe during the Migration period [67], although there is no evidence of such movements extending into the southeastern part of the Baltic region [68]. The unexpected findings of haplogroups L and B could be showing a random movement of people during the Migration period through the territory of present-day Lithuania. Given knowledge of the ancient trade of Baltic amber through the Amber Road during the Roman period, the appearance of those haplogroups with people over the Migration period is plausible. The amber trade even reached North Africa as indicated by the Baltic amber found in the chest of Tutankhamun [69]. It was also proposed that the Amber Road could have connections to the Near East, Central, and East Asia [70]. Haplogroups K (3–4%) and I (3–5%) appeared at similar frequency and remained stable from the IA till today, except for the increase during the Viking period (11%). J haplogroup was found only in the Migration period (5%) and at low frequency (2%) in the present-day Lithuanian population. Similarly, haplogroup V was found only in the Viking period (5%) and in the present-day Lithuanian population (3%). Haplogroup V was found at significant frequencies in Fennoscandian present-day populations [71] but also at lower frequencies in other European populations [72] present. Haplogroups D (1%), R (3%), and M (0.5%) were at low frequencies in the present-day Lithuanians and were unidentified in the IA samples.
The mtDNA haplogroup distribution pattern in different regions of the present-day Lithuania revealed a consistent increase in diversity since the Migration period (except for the Eastern region, regarding a small sample size), showing constant gene flow over time. Since the IA, the mtDNA structure of the population in the territory of the present-day Lithuania marginally changed, as indicated by 3.7% of genetic variation between the Roman, Migration, and Viking periods (p = 0.04).
Dimension reduction into two dimensions showed no sample clustering, indicating continuity of mtDNA diversity in the IA Lithuania. Nevertheless, MDS revealed a slightly distinct distribution of the Roman and Viking groups in contrast to the Migration period and present-day Lithuanian samples. Tighter confidence ellipses representing the Migration group are possibly attributed to the larger sample size (48 vs. 24 and 29). MDS revealed that the Roman, Migration, and Viking periods’ mtDNA diversity in the territory of present-day Lithuania followed a similar pattern to today’s European population mtDNA diversity, which corresponds with other studies [73,74].
Despite the universal problem regarding the sparse (and in a way accidental/opportunistic/random) ancient samples and insufficient representation of the periods and populations [75,76], there might be some other limitations regarding this study. First of all, 28% out of all the samples, including those not used for the haplogroup distribution analysis (38% in the Roman group, 25%—Migration and Viking, and 27% in present-day Lithuanians), were assigned to sub-haplogroup H2a2a1 by HaploGrep 2. The classification into H2a2a1 sub-haplogroup might be affected by rCRS reference bias and the limited range of polymorphic sites included in the study. We have assigned the samples that do not differ from rCRS within the analysed range to haplogroup R0/H [77].We performed haplogroup assignment based on the 36 SNPs within the HVRI (16,112–16,380), and we cannot exclude the possibility that genotyping of additional sites would allow for a more precise haplotype assignment. Due to low resolution, 53% of the IA and 57% of the present-day Lithuanian samples differed from the rCRS by a single variant. To minimise uncertainty, these samples were excluded from the haplogroup distribution analysis if their haplogroup assignment could not be validated using EMPOP. Furthermore, the Viking period sample group does not include samples representing the central Lithuanian territory, which might have affected the result of the haplogroup diversity and distribution of the period. Additionally, each sub-haplogroup has its own coalescent time and demographic history. However, this study is limited by the low-resolution haplogroup assignment; therefore, we do not discuss mtDNA diversity at a sub-haplogroup level.
To obtain finer-scale genetic data for further analysis, considering new technologies and possibilities, additionally, we will perform next-generation sequencing to retrieve as much data as possible from the same amount of the sample. Moreover, we will continue studying temporal genetic structure change in the Lithuanian region by expanding the sample size and including further time periods.
Overall, our study showed that mtDNA variation over time remained stable with some random fluctuations and gained more diversity in the present-day Lithuanians. While future studies will enable the analysis of maternal phylogeny, coalescent ages, and history in greater detail, the current resolution has uncovered insights into the population dynamics at the haplogroup level. The study revealed stable dominance of haplogroups R0/H and U phylogenetic maternal lineages, which falls into the context of the European landscape.

Supplementary Materials

The following supporting information can be downloaded at: https://www.mdpi.com/article/10.3390/heritage8120531/s1, Figure S1: Haplogroup distribution of the Iron Age and present-day Lithuanian samples. Figure S2: Haplogroup geographic distribution of the IA and present-day Lithuanian samples. Figure S3: MDS of the IA and present-day Lithuanian samples. Figure S4: MDS of the IA, present-day Lithuanian and European samples. Table S1: Information and archaeological context of the Iron Age individuals and references to the reports of archaeological sites [78,79,80,81,82,83,84,85,86,87,88,89,90,91,92,93,94,95,96,97]. Table S2: The Iron Age individual mtDNA HVR1 differences relative to the revised Cambridge Reference Sequence (rCRS). Table S3: HaploGrep 2 report of mtDNA data from Iron Age Lithuanian samples. Table S4: HaploGrep 2 report of mtDNA data from present-day Lithuanian samples. Table S5: The comparison of haplogroup assignments between HaploGrep 2, HaploGrep 3 and EMPOP v4/R14 tools for each individual in the Iron Age and present-day Lithuanian groups. MtDNA haplogroups were assigned based on the HVR1. Table S6: Temporal distribution of the Iron Age and Modern Lithuanian sample mtDNA haplogroup frequencies. Table S7: Temporal and spatial distribution of the Iron Age and Modern Lithuanian sample mtDNA haplogroup frequencies. Table S8: Fixation index (FST) distances between the Iron Age and present-day Lithuanian and other European population sample groups. Table S9: Analysis of Molecular Variance (AMOVA) with 10,000 permutations between the Iron Age and present-day Lithuanian groups. Table S10: Data and sources used in this study.

Author Contributions

Conceptualization, I.D.; methodology, I.D., I.K. (Indrė Krastinaitė), I.K. (Ingrida Kavaliauskienė) and H.W.W.; formal analysis, I.D. and I.K. (Indrė Krastinaitė); investigation, H.W.W., I.K. (Ingrida Kavaliauskienė) and I.K. (Indrė Krastinaitė); resources, H.W.W., I.K. (Ingrida Kavaliauskienė) and V.K.; data curation, J.K., R.J., I.K. (Ingrida Kavaliauskienė) and V.K.; writing—original draft preparation, I.D., I.K. (Indrė Krastinaitė) and J.K.; writing—review and editing, I.D., I.K. (Indrė Krastinaitė), J.K., I.K. (Ingrida Kavaliauskienė), V.K. and R.J.; visualization, I.K. (Indrė Krastinaitė); supervision, V.K. and R.J.; project administration, I.K. (Ingrida Kavaliauskienė), V.K. and R.J. All authors have read and agreed to the published version of the manuscript.

Funding

This research received no external funding.

Data Availability Statement

In addition to the Supplementary Materials (including the dataset of the Iron Age individuals from present-day Lithuania mtDNA HVRI genotypes of 36 sites), here we provide a new complete mtDNA sequences dataset of 279 individuals from the present-day Lithuanian population (project PRJNA1378471; accession numbers SAMN53838778–SAMN53839056).

Acknowledgments

Authors are grateful to the staff at the Department of Evolutionary Genetics, Max Planck Institute for Evolutionary Anthropology (Leipzig, Germany) for providing infrastructure and guidance during the sequencing of mtDNA of the present-day Lithuanian population.

Conflicts of Interest

The authors declare no conflicts of interest.

Abbreviations

The following abbreviations are used in this manuscript:
BIHPresent-day Bosnia and Herzegovina
BLRPresent-day Belarus
CYPPresent-day Cyprus
CZEPresent-day Czech
ESTPresent-day Estonia
FRAPresent-day France
FSTFixation index
GBRPresent-day England
GRCPresent-day Greece
HRVPresent-day Croatia
HVRIHypervariable Region I of mtDNA
HVRIIHypervariable Region II of mtDNA
IAIron Age
ITAPresent-day Italy
LTUPresent-day Lithuania
LVAPresent-day Latvia
MDSMulti-dimensional scaling
mtDNAMitochondrial DNA
NGAPresent-day Nigeria
NORPresent-day Norway
POLPresent-day Poland
rCRSRevised Cambridge Reference Sequence
ROUPresent-day Romania
RUSPresent-day Russia
SRBPresent-day Serbia
SVNPresent-day Slovenia
SWEPresent-day Sweden
UKRPresent-day Ukraine

References

  1. Kudirka, J. The Lithuanians: An Ethnic Portrait; Lithuanian Folk Culture Center: Vilnius, Lithuania, 1991; Available online: http://lnkc.lt/eknygos/thelt/node1.html (accessed on 4 August 2025).
  2. Kivisild, T. Maternal Ancestry and Population History from Whole Mitochondrial Genomes. Investig. Genet. 2015, 6, 3. [Google Scholar] [CrossRef] [Scilit] [PubMed]
  3. Pala, M.; Olivieri, A.; Achilli, A.; Accetturo, M.; Metspalu, E.; Reidla, M.; Tamm, E.; Karmin, M.; Reisberg, T.; Kashani, B.H.; et al. Mitochondrial DNA Signals of Late Glacial Recolonization of Europe from Near Eastern Refugia. Am. J. Hum. Genet. 2012, 90, 915–924. [Google Scholar] [CrossRef] [Scilit] [PubMed]
  4. Gretzinger, J.; Biermann, F.; Mager, H.; King, B.; Zlámalová, D.; Traverso, L.; Gnecchi Ruscone, G.A.; Peltola, S.; Salmela, E.; Neumann, G.U.; et al. Ancient DNA Connects Large-Scale Migration with the Spread of Slavs. Nature 2025, 646, 384–393. [Google Scholar] [CrossRef] [Scilit]
  5. Michelbertas, M. Senasis Geležies Amžius Lietuvoje, (I–IV a.); Mokslas: Vilnius, Lithuania, 1986. [Google Scholar]
  6. Tautavičius, A. Vidurinis Geležies Amžius Lietuvoje (V–IX a.); Pilių Tyrimų Centras “Lietuvos Pilys”: Vilnius, Lithuania, 1996. [Google Scholar]
  7. Baronas, D. Lietuvos Didžiojo Kunigaikščio Valdžia Prie Nemuno 1283–1410 m.: Karinis Aspektas. Acta Hist. Univ. Klaiped. 2019, 39, 143–165. [Google Scholar] [CrossRef] [Scilit]
  8. Banytė-Rowell, R.; Bitner-Wróblewska, A.; Reich, C. Did They Exist? The Question of Elites in Western Lithuania the Roman and Early Migration Periods, and Their Interregional Contacts. Archaeol. Balt. 2012, 18, 192–220. [Google Scholar] [CrossRef] [Scilit]
  9. Bliujienė, A. Lithuanian Amber Artifacts in the Middle of the First Millennium and Rheir Provenance within the Limits of the Eastern Baltic Region. Acta Acad. Artium Vilnensis 2001, 22, 171–186. [Google Scholar]
  10. Kurila, L.; Piličiauskienė, G.; Ežerinskis, Ž.; Šapolaitė, J.; Garbaras, A. Vestiges of the Huns? The Radiocarbon-Based Chronology of the Trilobate Arrowheads from Plinkaigalis Cemetery, Central Lithuania. Acta Archaeol. 2021, 92, 52–72. [Google Scholar] [CrossRef] [Scilit]
  11. Kurila, L.; Piličiauskienė, G.; Simčenka, E.; Miliauskienė, Ž.; Ežerinskis, Ž.; Šapolaitė, J.; Garbaras, A. New Human Bone Radiocarbon Dates from the Roman Period—Migration Period Lithuanian Cemeteries. Radiocarbon 2023, 65, 411–429. [Google Scholar] [CrossRef] [Scilit]
  12. Simčenka, E.; Kurila, L.; Kozakaitė, J.; Piličiauskienė, G. Human Diet in Lithuania during the Late Roman and Migration Periods (ca. 200–700 AD) Based on Stable Carbon and Nitrogen Isotope Data. Archaeol. Balt. 2023, 30, 80–115. [Google Scholar] [CrossRef] [Scilit]
  13. Kurila, L.; Piličiauskienė, G.; Simčenka, E.; Lidén, K.; Kooijman, E.; Miliauskienė, Ž. Late Roman and Migration Period Elites from Lithuania—Locals or Migrants? Reinterpretation of the Current Concept Based on 87Sr/86Sr Stable Isotope Analysis. Archaeol. Anthropol. Sci. 2025, 17, 35. [Google Scholar] [CrossRef] [Scilit]
  14. Bliujienė, A. The Curonians of the Lithuanian Coast. A Hundred Years of Archaeological Discoveries in Lithuania; Society of the Lithuanian Archaeology: Vilnius, Lithuania, 2016; pp. 268–285. [Google Scholar]
  15. Shokolenko, I.; Alexeyev, M. Mitochondrial DNA: Consensuses and Controversies. DNA 2022, 2, 131–148. [Google Scholar] [CrossRef] [Scilit]
  16. Syndercombe Court, D. Mitochondrial DNA in Forensic Use. Emerg. Top. Life Sci. 2021, 5, 415–426. [Google Scholar] [CrossRef] [Scilit]
  17. Stoneking, M.; Krause, J. Learning about Human Population History from Ancient and Modern Genomes. Nat. Rev. Genet. 2011, 12, 603–614. [Google Scholar] [CrossRef] [Scilit]
  18. Van Oven, M.; Kayser, M. Updated Comprehensive Phylogenetic Tree of Global Human Mitochondrial DNA Variation. Hum. Mutat. 2009, 30, E386–E394. [Google Scholar] [CrossRef] [Scilit]
  19. Schönberg, A.; Theunert, C.; Li, M.; Stoneking, M.; Nasidze, I. High-Throughput Sequencing of Complete Human mtDNA Genomes from the Caucasus and West Asia: High Diversity and Demographic Inferences. Eur. J. Hum. Genet. 2011, 19, 988–994. [Google Scholar] [CrossRef] [Scilit]
  20. Kasperavičiūtė, D.; Kučinskas, V.; Stoneking, M. Y Chromosome and Mitochondrial DNA Variation in Lithuanians. Ann. Hum. Genet. 2004, 68, 438–452. [Google Scholar] [CrossRef] [Scilit]
  21. Kushniarevich, A.; Sivitskaya, L.; Danilenko, N.; Novogrodskii, T.; Tsybovsky, I.; Kiseleva, A.; Kotova, S.; Chaubey, G.; Metspalu, E.; Sahakyan, H.; et al. Uniparental Genetic Heritage of Belarusians: Encounter of Rare Middle Eastern Matrilineages with a Central European Mitochondrial DNA Pool. PLoS ONE 2013, 8, e66499. [Google Scholar] [CrossRef] [Scilit] [PubMed]
  22. Uktverytė, I. Analysis of Genetic Structure of Lithuanian Ethno-Linguistic Groups Using Informative Genomic Markers: Summary of Doctoral Dissertation: Biomedical Sciences, Medicine (06 B); Vilnius University: Vilnius, Lithuania, 2014. [Google Scholar]
  23. Bramanti, B.; Thomas, M.G.; Haak, W.; Unterlaender, M.; Jores, P.; Tambets, K.; Antanaitis-Jacobs, I.; Haidle, M.N.; Jankauskas, R.; Kind, C.-J.; et al. Genetic Discontinuity Between Local Hunter-Gatherers and Central Europe’s First Farmers. Science 2009, 326, 137–140. [Google Scholar] [CrossRef] [Scilit]
  24. Jankauskas, R. Ancient Mitochondrial DNA from Stone Age Lithuania and the Possible Origins of the First Inhabitants. Orig. Cult. Balts 2011, 13, 32–36. [Google Scholar]
  25. Posth, C.; Yu, H.; Ghalichi, A.; Rougier, H.; Crevecoeur, I.; Huang, Y.; Ringbauer, H.; Rohrlach, A.B.; Nägele, K.; Villalba-Mouco, V.; et al. Palaeogenomics of Upper Palaeolithic to Neolithic European Hunter-Gatherers. Nature 2023, 615, 117–126. [Google Scholar] [CrossRef] [Scilit] [PubMed]
  26. Mittnik, A.; Wang, C.-C.; Pfrengle, S.; Daubaras, M.; Zariņa, G.; Hallgren, F.; Allmäe, R.; Khartanovich, V.; Moiseyev, V.; Tõrv, M.; et al. The Genetic Prehistory of the Baltic Sea Region. Nat. Commun. 2018, 9, 442. [Google Scholar] [CrossRef] [Scilit] [PubMed]
  27. Buikstra, J.E.; Ubelaker, D.H. Standards for Data Collection from Human Skeletal Remains. Fayettev. Ark. Archeol. Surv. Res. 1994, 44, 672. [Google Scholar] [CrossRef] [Scilit]
  28. Schaefer, M.; Scheuer, L.; Black, S.M. Juvenile Osteology: A Laboratory and Field Manual; Elsevier: Amsterdam, The Netherlands; Academic Press: Burlington, MA, USA, 2009; ISBN 978-0-12-374635-1. [Google Scholar]
  29. Brooks, S.; Suchey, J.M. Skeletal Age Determination Based on the Os Pubis: A Comparison of the Acsádi-Nemeskéri and Suchey-Brooks Methods. Hum. Evol. 1990, 5, 227–238. [Google Scholar] [CrossRef] [Scilit]
  30. Lovejoy, C.O.; Meindl, R.S.; Pryzbeck, T.R.; Mensforth, R.P. Chronological Metamorphosis of the Auricular Surface of the Ilium: A New Method for the Determination of Adult Skeletal Age at Death. Am. J. Phys. Anthropol. 1985, 68, 15–28. [Google Scholar] [CrossRef] [Scilit]
  31. Meindl, R.S.; Lovejoy, C.O. Ectocranial Suture Closure: A Revised Method for the Determination of Skeletal Age at Death Based on the Lateral–Anterior Sutures. Am. J. Phys. Anthropol. 1985, 68, 57–66. [Google Scholar] [CrossRef] [Scilit]
  32. White, T.D.; Folkens, P.A. Human Osteology, 2nd ed.; Academic Press: London, UK, 2000. [Google Scholar]
  33. Buckberry, J. The (Mis)Use of Adult Age Estimates in Osteology. Ann. Hum. Biol. 2015, 42, 323–331. [Google Scholar] [CrossRef] [Scilit]
  34. Witas, H.W.; Płoszaj, T.; Jędrychowska-Dańska, K.; Witas, P.J.; Masłowska, A.; Jerszyńska, B.; Kozłowski, T.; Osipowicz, G. Hunting for the LCT-13910*T Allele between the Middle Neolithic and the Middle Ages Suggests Its Absence in Dairying LBK People Entering the Kuyavia Region in the 8th Millennium BP. PLoS ONE 2015, 10, e0122384. [Google Scholar] [CrossRef] [Scilit] [PubMed]
  35. Tamura, K.; Dudley, J.; Nei, M.; Kumar, S. MEGA4: Molecular Evolutionary Genetics Analysis (MEGA) Software Version 4.0. Mol. Biol. Evol. 2007, 24, 1596–1599. [Google Scholar] [CrossRef] [Scilit]
  36. Andrews, R.M.; Kubacka, I.; Chinnery, P.F.; Lightowlers, R.N.; Turnbull, D.M.; Howell, N. Reanalysis and Revision of the Cambridge Reference Sequence for Human Mitochondrial DNA. Nat. Genet. 1999, 23, 147. [Google Scholar] [CrossRef] [Scilit] [PubMed]
  37. Fellows Yates, J.A.; Lamnidis, T.C.; Borry, M.; Andrades Valtueña, A.; Fagernäs, Z.; Clayton, S.; Garcia, M.U.; Neukamm, J.; Peltzer, A. Reproducible, Portable, and Efficient Ancient Genome Reconstruction with Nf-Core/Eager. PeerJ 2021, 9, e10947. [Google Scholar] [CrossRef] [Scilit]
  38. Weissensteiner, H.; Pacher, D.; Kloss-Brandstätter, A.; Forer, L.; Specht, G.; Bandelt, H.-J.; Kronenberg, F.; Salas, A.; Schönherr, S. HaploGrep 2: Mitochondrial Haplogroup Classification in the Era of High-Throughput Sequencing. Nucleic Acids Res. 2016, 44, W58–W63. [Google Scholar] [CrossRef] [Scilit] [PubMed]
  39. Schönherr, S.; Weissensteiner, H.; Kronenberg, F.; Forer, L. Haplogrep 3—An Interactive Haplogroup Classification and Analysis Platform. Nucleic Acids Res. 2023, 51, W263–W268. [Google Scholar] [CrossRef] [Scilit]
  40. Dür, A.; Huber, N.; Parson, W. Fine-Tuning Phylogenetic Alignment and Haplogrouping of mtDNA Sequences. Int. J. Mol. Sci. 2021, 22, 5747. [Google Scholar] [CrossRef] [Scilit] [PubMed]
  41. Huber, N.; Parson, W.; Dür, A. Next Generation Database Search Algorithm for Forensic Mitogenome Analyses. Forensic Sci. Int. Genet. 2018, 37, 204–214. [Google Scholar] [CrossRef] [Scilit] [PubMed]
  42. R Core Team R: A Language and Environment for Statistical Computing, version 4.4.2; R Foundation for Statistical Computing: Vienna, Austria, 2024.
  43. Bandelt, H.J.; Forster, P.; Röhl, A. Median-Joining Networks for Inferring Intraspecific Phylogenies. Mol. Biol. Evol. 1999, 16, 37–48. [Google Scholar] [CrossRef] [Scilit]
  44. Leigh, J.W.; Bryant, D. Popart: Full-Feature Software for Haplotype Network Construction. Methods Ecol. Evol. 2015, 6, 1110–1116. [Google Scholar] [CrossRef] [Scilit]
  45. Kong, S.; Sánchez-Pacheco, S.J.; Murphy, R.W. On the Use of Median-joining Networks in Evolutionary Biology. Cladistics 2016, 32, 691–699. [Google Scholar] [CrossRef] [Scilit]
  46. Weir, B.S.; Cockerham, C.C. Estimating F-Statistics for the Analysis of Population Structure. Evolution 1984, 38, 1358. [Google Scholar] [CrossRef] [Scilit]
  47. Excoffier, L.; Smouse, P.E.; Quattro, J.M. Analysis of Molecular Variance Inferred from Metric Distances among DNA Haplotypes: Application to Human Mitochondrial DNA Restriction Data. Genetics 1992, 131, 479–491. [Google Scholar] [CrossRef] [Scilit]
  48. Gower, J.C. Some Distance Properties of Latent Root and Vector Methods Used in Multivariate Analysis. Biometrika 1966, 53, 325–338. [Google Scholar] [CrossRef] [Scilit]
  49. Lappalainen, T.; Laitinen, V.; Salmela, E.; Andersen, P.; Huoponen, K.; Savontaus, M.-L.; Lahermo, P. Migration Waves to the Baltic Sea Region. Ann. Hum. Genet. 2008, 72, 337–348. [Google Scholar] [CrossRef] [Scilit]
  50. Šarac, J.; Šarić, T.; Auguštin, D.H.; Jeran, N.; Kovačević, L.; Cvjetan, S.; Lewis, A.P.; Metspalu, E.; Reidla, M.; Novokmet, N.; et al. Maternal Genetic Heritage of Southeastern Europe Reveals a New Croatian Isolate and a Novel, Local Sub-Branching in the X2 Haplogroup. Ann. Hum. Genet. 2014, 78, 178–194. [Google Scholar] [CrossRef] [Scilit] [PubMed]
  51. Kushniarevich, A.; Utevska, O.; Chuhryaeva, M.; Agdzhoyan, A.; Dibirova, K.; Uktveryte, I.; Möls, M.; Mulahasanovic, L.; Pshenichnov, A.; Frolova, S.; et al. Genetic Heritage of the Balto-Slavic Speaking Populations: A Synthesis of Autosomal, Mitochondrial and Y-Chromosomal Data. PLoS ONE 2015, 10, e0135820. [Google Scholar] [CrossRef] [Scilit] [PubMed]
  52. Pshenichnov, A.; Balanovsky, O.; Utevska, O.; Metspalu, E.; Zaporozhchenko, V.; Agdzhoyan, A.; Churnosov, M.; Atramentova, L.; Balanovska, E. Genetic Affinities of Ukrainians from the Maternal Perspective. Am. J. Phys. Anthropol. 2013, 152, 543–550. [Google Scholar] [CrossRef] [Scilit]
  53. Helgason, A.; Hickey, E.; Goodacre, S.; Bosnes, V.; Stefánsson, K.; Ward, R.; Sykes, B. mtDNA and the Islands of the North Atlantic: Estimating the Proportions of Norse and Gaelic Ancestry. Am. J. Hum. Genet. 2001, 68, 723–737. [Google Scholar] [CrossRef] [Scilit]
  54. Cocoş, R.; Schipor, S.; Hervella, M.; Cianga, P.; Popescu, R.; Bănescu, C.; Constantinescu, M.; Martinescu, A.; Raicu, F. Genetic Affinities among the Historical Provinces of Romania and Central Europe as Revealed by an mtDNA Analysis. BMC Genet. 2017, 18, 20. [Google Scholar] [CrossRef] [Scilit] [PubMed]
  55. Piotrowska-Nowak, A.; Safranow, K.; Adamczyk, J.G.; Sołtyszewski, I.; Cięszczyk, P.; Tońska, K.; Żekanowski, C.; Borzemska, B. Mitochondrial Genome Variation in Polish Elite Athletes. Int. J. Mol. Sci. 2023, 24, 12992. [Google Scholar] [CrossRef] [Scilit] [PubMed]
  56. Irwin, J.; Saunier, J.; Strouss, K.; Paintner, C.; Diegoli, T.; Sturk, K.; Kovatsi, L.; Brandstätter, A.; Cariolou, M.A.; Parson, W.; et al. Mitochondrial Control Region Sequences from Northern Greece and Greek Cypriots. Int. J. Legal Med. 2008, 122, 87–89. [Google Scholar] [CrossRef] [Scilit] [PubMed]
  57. Modi, A.; Lancioni, H.; Cardinali, I.; Capodiferro, M.R.; Rambaldi Migliore, N.; Hussein, A.; Strobl, C.; Bodner, M.; Schnaller, L.; Xavier, C.; et al. The Mitogenome Portrait of Umbria in Central Italy as Depicted by Contemporary Inhabitants and Pre-Roman Remains. Sci. Rep. 2020, 10, 10700. [Google Scholar] [CrossRef] [Scilit]
  58. Sayers, E.W.; Beck, J.; Bolton, E.E.; Brister, J.R.; Chan, J.; Connor, R.; Feldgarden, M.; Fine, A.M.; Funk, K.; Hoffman, J.; et al. Database Resources of the National Center for Biotechnology Information in 2025. Nucleic Acids Res. 2024, 53, D20–D29. [Google Scholar] [CrossRef] [Scilit] [PubMed]
  59. Auton, A.; Abecasis, G.R.; Altshuler, D.M.; Durbin, R.M.; Abecasis, G.R.; Bentley, D.R.; Chakravarti, A.; Clark, A.G.; Donnelly, P.; Eichler, E.E.; et al. A Global Reference for Human Genetic Variation. Nature 2015, 526, 68–74. [Google Scholar] [CrossRef] [Scilit]
  60. Fitzpatrick, B.M. Power and Sample Size for Nested Analysis of Molecular Variance. Mol. Ecol. 2009, 18, 3961–3966. [Google Scholar] [CrossRef] [Scilit]
  61. Hay, M. Origins & History of Haplogroup U4 (mtDNA). 2016. Available online: https://www.researchgate.net/publication/309733589_Origins_History_of_Haplogroup_H_mtDNA (accessed on 4 December 2025).
  62. Malyarchuk, B.; Derenko, M.; Grzybowski, T.; Perkova, M.; Rogalla, U.; Vanecek, T.; Tsybovsky, I. The Peopling of Europe from the Mitochondrial Haplogroup U5 Perspective. PLoS ONE 2010, 5, e10285. [Google Scholar] [CrossRef] [Scilit]
  63. Tishkoff, S.A.; Gonder, M.K.; Henn, B.M.; Mortensen, H.; Knight, A.; Gignoux, C.; Fernandopulle, N.; Lema, G.; Nyambo, T.B.; Ramakrishnan, U.; et al. History of Click-Speaking Populations of Africa Inferred from mtDNA and Y Chromosome Genetic Variation. Mol. Biol. Evol. 2007, 24, 2180–2195. [Google Scholar] [CrossRef] [Scilit] [PubMed]
  64. Papac, L.; Ernée, M.; Dobeš, M.; Langová, M.; Rohrlach, A.B.; Aron, F.; Neumann, G.U.; Spyrou, M.A.; Rohland, N.; Velemínský, P.; et al. Dynamic Changes in Genomic and Social Structures in Third Millennium BCE Central Europe. Sci. Adv. 2021, 7, eabi6941. [Google Scholar] [CrossRef] [Scilit] [PubMed]
  65. Linderholm, A.; Kılınç, G.M.; Szczepanek, A.; Włodarczak, P.; Jarosz, P.; Belka, Z.; Dopieralska, J.; Werens, K.; Górski, J.; Mazurek, M.; et al. Corded Ware Cultural Complexity Uncovered Using Genomic and Isotopic Analysis from South-Eastern Poland. Sci. Rep. 2020, 10, 6885. [Google Scholar] [CrossRef] [Scilit]
  66. Wood, M.R.; Sturk-Andreaggi, K.; Ring, J.D.; Huber, N.; Bodner, M.; Crawford, M.H.; Parson, W.; Marshall, C. Resolving Mitochondrial Haplogroups B2 and B4 with Next-Generation Mitogenome Sequencing to Distinguish Native American from Asian Haplotypes. Forensic Sci. Int. Genet. 2019, 43, 102143. [Google Scholar] [CrossRef] [Scilit] [PubMed]
  67. Gnecchi-Ruscone, G.A.; Rácz, Z.; Liccardo, S.; Lee, J.; Huang, Y.; Traverso, L.; Radzevičiūtė, R.; Hajnal, Z.; Szécsényi-Nagy, A.; Gyuris, B.; et al. Ancient Genomes Reveal Trans-Eurasian Connections between the European Huns and the Xiongnu Empire. Proc. Natl. Acad. Sci. USA 2025, 122, e2418485122. [Google Scholar] [CrossRef] [Scilit]
  68. Kurila, L.; Piličiauskienė, G. Humans and Horses in the Late Roman Period—Late Migration Period (3rd–7th Centuries) in Lithuania: Origins and Social Context. Archaeol. Litu. 2025, 25, 100–155. [Google Scholar] [CrossRef] [Scilit]
  69. Nicholson, P.T.; Shaw, I. Resins, Amber, and Bitumen. In Ancient Egyptian Materials and Technology; Cambridge University Press: Cambridge, UK, 2000; pp. 430–457. ISBN 978-0-521-45257-1. [Google Scholar]
  70. Raunig, W. Great Trade Routes: Forever Amber. UNESCO Cour. Window Open World 1984, 6, 13–15. Available online: https://unesdoc.unesco.org/ark:/48223/pf0000074681 (accessed on 1 December 2025).
  71. Tambets, K.; Rootsi, S.; Kivisild, T.; Help, H.; Serk, P.; Loogväli, E.-L.; Tolk, H.-V.; Reidla, M.; Metspalu, E.; Pliss, L.; et al. The Western and Eastern Roots of the Saami—The Story of Genetic “Outliers” Told by Mitochondrial DNA and Y Chromosomes. Am. J. Hum. Genet. 2004, 74, 661–682. [Google Scholar] [CrossRef] [Scilit] [PubMed]
  72. Brook, K. The Maternal Genetic Lineages of Ashkenazic Jews; Academic Studies Press: Brookline, MA, USA, 2022; pp. 118–119. [Google Scholar]
  73. Vidrová, V.; Tesařová, M.; Trefilová, E.; Honzík, T.; Magner, M.; Zeman, J. Mitochondrial DNA Haplogroups in the Czech Population Compared to Other European Countries. Hum. Biol. 2008, 80, 669–674. [Google Scholar] [CrossRef] [Scilit] [PubMed]
  74. Loogväli, E.-L.; Roostalu, U.; Malyarchuk, B.A.; Derenko, M.V.; Kivisild, T.; Metspalu, E.; Tambets, K.; Reidla, M.; Tolk, H.-V.; Parik, J.; et al. Disuniting Uniformity: A Pied Cladistic Canvas of mtDNA Haplogroup H in Eurasia. Mol. Biol. Evol. 2004, 21, 2012–2021. [Google Scholar] [CrossRef] [Scilit]
  75. Orlando, L.; Allaby, R.; Skoglund, P.; Der Sarkissian, C.; Stockhammer, P.W.; Ávila-Arcos, M.C.; Fu, Q.; Krause, J.; Willerslev, E.; Stone, A.C.; et al. Ancient DNA Analysis. Nat. Rev. Methods Primers 2021, 1, 14. [Google Scholar] [CrossRef] [Scilit]
  76. Williams, M.P.; Huber, C.D. The Genomic Footprints of Migration: How Ancient DNA Reveals Our History of Mobility. Genome Biol. 2025, 26, 206. [Google Scholar] [CrossRef] [Scilit]
  77. Bodner, M.; Iuvaro, A.; Strobl, C.; Nagl, S.; Huber, G.; Pelotti, S.; Pettener, D.; Luiselli, D.; Parson, W. Helena, the Hidden Beauty: Resolving the Most Common West Eurasian mtDNA Control Region Haplotype by Massively Parallel Sequencing an Italian Population Sample. Forensic Sci. Int. Genet. 2015, 15, 21–26. [Google Scholar] [CrossRef] [Scilit] [PubMed]
  78. Bertašius, M. Vidurio Lietuva VII-XII a.; Vytauto Didžiojo universiteto leidykla: Kaunas, Lithuania, 2002; ISBN 9955-530-15-4. [Google Scholar]
  79. Bertašius, M. Marvelė. Ein Graberfeld Mittellitauens (Marvelė. Vidurio Lietuvos Aukštaičių I–XII a. Kapinynas); Kauno Technologijos Universitetas: Kaunas, Lithuania, 2005. [Google Scholar]
  80. Salatkienė, B. Kalnelių (Šiaulių Raj.) Pilkapių Ir Gyvenvietės Tyrinėjimų Ataskaita. 1982–1983 m. Report No. 1231; Department of Cultural Heritage Under the Ministry of Culture of the Republic of Lithuania: Vilnius, Lithuania, 1983. [Google Scholar]
  81. Tebelškis, P. Berčiūnų Pilkapių (Panevėžio Raj.) 1989 m. Archeologinių Tyrinėjimų Ataskaita. Report No. 1638; Department of Cultural Heritage Under the Ministry of Culture of the Republic of Lithuania: Vilnius, Lithuania, 1989. [Google Scholar]
  82. Urbanavičienė, S. Berčiūnų Pilkapių (Panevėžio Raj.) 1993 m. Tyrinėjimų Ataskaita. Report No. 2107; Department of Cultural Heritage Under the Ministry of Culture of the Republic of Lithuania: Vilnius, Lithuania, 1993. [Google Scholar]
  83. Urbanavičienė, S. Berčiūnų Pilkapyno (Panevėžio Raj.) 1994 m. Tyrinėjimų Ataskaita. Report No. 2373; Department of Cultural Heritage Under the Ministry of Culture of the Republic of Lithuania: Vilnius, Lithuania, 1994. [Google Scholar]
  84. Stankus, J. Šaukėnų Senkapio, Sungailiškių Apyl., Tauragės Raj., 1981 m. Tyrinėjimų Ataskaita. Report No. 934; Department of Cultural Heritage Under the Ministry of Culture of the Republic of Lithuania: Vilnius, Lithuania, 1981. [Google Scholar]
  85. Jovaiša, E. Šaukėnų Plokštinio Kapinyno 1981 Metais Tyrinėtų Kapų Aprašymai Ir Radinių Sąrašas. Report No. 934; Department of Cultural Heritage Under the Ministry of Culture of the Republic of Lithuania: Vilnius, Lithuania, 1981. [Google Scholar]
  86. Kazakevičius, V. Metų Kalniškių, Raseinių Raj., Verėduvos Apyl. Kapinyno Tyrinėjimų Ataskaita. Report No. 1615; Department of Cultural Heritage Under the Ministry of Culture of the Republic of Lithuania: Vilnius, Lithuania, 1989. [Google Scholar]
  87. Kazakevičius, V. Kalniškių, Raseinių Raj., Ariogalos Apyl. Kapinyno 1990 Metų Tyrinėjimų Ataskaita. Report No. 1768; Department of Cultural Heritage Under the Ministry of Culture of the Republic of Lithuania: Vilnius, Lithuania, 1990. [Google Scholar]
  88. Kazakevičius, V. Kalniškių, Raseinių Raj., Ariogalos Apyl. Kapinyno 1994 Metų Tyrinėjimų Ataskaita. Report No. 2251; Department of Cultural Heritage Under the Ministry of Culture of the Republic of Lithuania: Vilnius, Lithuania, 1994. [Google Scholar]
  89. Kazakevičius, V. Lietuvos Archeologija 10: Plinkaigalio Kapinynas; Mokslo ir Enciklopedijų Leidykla: Vilnius, Lithuania, 1993; ISBN 5-420-01148-4. [Google Scholar]
  90. Lietuvos Istorijos Institutas (Ed.) Lietuvos Archeologija 6: Obelių Kapinynas: Monografija; M. Šumausko Spaustuvė: Vilnius, Lithuania, 1988; Volume 6, ISBN 978-5-420-00407-4. [Google Scholar]
  91. Tautavičius, A. Griniūnų, Panevėžio Raj., Senkapio 1977 m. Kasinėjimų Ataskaita. Report No. 491; Department of Cultural Heritage Under the Ministry of Culture of the Republic of Lithuania: Vilnius, Lithuania, 1977. [Google Scholar]
  92. Vaitkunskienė, L. Lietuvos Archeologija 13: Pagrybio Kapinynas; Diemedžio Leidykla: Vilnius, Lithuania, 1995; ISSN 02-07-08694, 9986-23-019-5. [Google Scholar]
  93. Valatka, V. Maudžiorių Senkapis/Kelmės Raj./(1964 m. Tyrinėjimų Duomenys). Report No. 205; Paminklų Konservavimo Institutas: Vilnius, Lithuania, 1965. [Google Scholar]
  94. Valatka, V. Maudžiorių Senkapis/Kelmės Raj./1964 Ir 1966 m. Report No. 440; Paminklų Konservavimo Institutas: Vilnius, Lithuania, 1966. [Google Scholar]
  95. Striškienė, Ė. Diržių Senkapių (Pakruojo Rajonas) Žvalgomieji Archeologiniai Tyrinėjimai 1996 m. Report No. 2615; Lietuvos Istorijos Institutas: Vilnius, Lithuania, 1996. [Google Scholar]
  96. Striškienė, Ė. Diržių Senkapių (Pakruojo Rajonas) Archeologiniai Tyrimai 1997 m. Report No. 2846; Lietuvos Istorijos Institutas: Vilnius, Lithuania, 1997. [Google Scholar]
  97. Urbanavičius, V. Jakštaičių-Meškių (Šiaulių Raj.) Senkapio Kasinėjimai 1973 ir 1974 m. Report No. 416; Paminklų Konservavimo Institutas: Vilnius, Lithuania, 1974. [Google Scholar]
Figure 1. Map with the Iron Age (IA) sample sites from the territory of present-day Lithuania, sample group sizes, and archaeological dating. Circle sizes denote sample group size and circle colours denote the IA time periods.
Heritage 08 00531 g001
Figure 2. Diversity and distribution of determined mitochondrial DNA (mtDNA) haplogroups in the IA group and present-day Lithuanians. (A) mtDNA haplogroup distribution across the three IA periods—Roman, Migration, and Viking—and the present day. (B) mtDNA haplogroup temporal and spatial distribution across the Western, Central, and Eastern regions. IA samples were divided into the Roman, Migration, and Viking groups based on archaeological dating. Percentages around the pie charts represent haplogroup frequencies in each group, n—sample group size.
Heritage 08 00531 g002
Figure 3. Median-joining haplotype networks of samples assigned to haplogroup R0/H (A) and haplogroup U (B). Median-joining networks were generated using PopART (v1.7). Colours represent IA groups—Roman, Migration, Viking—and present-day Lithuanians (LTU). Coloured circles represent discrete haplotypes, and black circles represent missing haplotypes. Circle sizes denote the number of samples assigned to each haplotype. Black strikes on branches represent the number of nucleotide differences between samples.
Heritage 08 00531 g003
Figure 4. Fixation index (FST) values for pairwise comparison between the IA groups and present-day Lithuanians (LTU).
Heritage 08 00531 g004
Figure 5. Multi-dimensional scaling (MDS) of Hamming distances between the IA samples from Lithuania and present-day Lithuanians (LTU) by mtDNA variation. Each data point represents an individual sample. Ellipses denote the 95% confidence interval.
Heritage 08 00531 g005
Figure 6. MDS of Hamming distances between the IA samples from Lithuania, present-day Lithuanians (LTU), and other present-day European populations. Data from present-day European populations: Bosnia and Herzegovina (BIH), Belarus (BLR), Cyprus (CYP), Czech (CZE), Estonia (EST), France (FRA), England (GBR), Greece (GRC), Croatia (HRV), Italy (ITA), Latvia (LVA), Norway (NOR), Poland (POL), Romania (ROU), Russia (RUS), Serbia (SRB), Slovenia (SVN), Sweden (SWE), Ukraine (UKR). Nigeria (NGA) as an outgroup. Each data point represents an individual sample. Ellipses denote the 95% confidence interval.
Heritage 08 00531 g006
Table 1. Abbreviations and sources of the data used in this study. n—sample size.
AbbreviationCountrynReference
RomanLithuania29This study
MigrationLithuania48
VikingLithuania24
LTULithuania279
LVALatvia114Lappalainen et al., 2008 [49]
ESTEstonia117
SWESweden307
UKRUkraine566Pshenichnov et al., 2013 [52]
CZECzech94Kushniarevich et al., 2015 [51]
BLRBelarus260
RUSRussia518
GBREngland142Helgason et al., 2001 [53]
NORNorway323
ROURomania433Cocoş et al., 2017 [54]
POLPoland196Piotrowska-Nowak et al., 2023 [55]
HRVCroatia488Šarač et al., 2014 [50]
BIHBosnia and Herzegovina369
SVNSlovenia97
SRBSerbia81
GRCGreece319Irwin et al., 2008 [56]
CYPCyprus91
ITAItaly191Modi et al., 2020 [57]
ITAItaly501000 Genomes Project (Auton et al., 2015) [59]
FRAFrance53
NGANigeria25
Table 2. Comparison of Analysis of Molecular Variance (AMOVA) results between (a) the samples of three IA periods based on archaeological dating, (b) the IA samples as one group and the present-day Lithuanian group, and (c) the IA samples of the three periods and present-day Lithuanian group. Statistical significance p-value < 0.05; statistically significant values are denoted in bold.
Sources of VariationEstimated
Variance (σ2)
Proportion of Total VariancePhi-Statisticp-Value
(a) Roman, Migration, and Viking groups
Between groups0.2903.7%0.0370.039
Within groups7.61296.3%
Total7.902100%
(b) IA and present-day Lithuanians
Between groups0.0490.7%0.0070.102
Within groups7.14799.3%
Total7.196100%
(c) Roman, Migration, Viking groups and present-day Lithuanians
Between groups0.1632.2%0.0220.015
Within groups7.09597.8%
Total7.258100%
Disclaimer/Publisher’s Note: The statements, opinions and data contained in all publications are solely those of the individual author(s) and contributor(s) and not of MDPI and/or the editor(s). MDPI and/or the editor(s) disclaim responsibility for any injury to people or property resulting from any ideas, methods, instructions or products referred to in the content.