Article

Statistical Learning Improves Classification of Limestone Provenance

1
Geological Survey of Slovenia, Dimičeva Ulica 14, SI-1000 Ljubljana, Slovenia
2
Biobit s.p., Kobdilj 25, SI-6222 Štanjel, Slovenia
3
SubBio Lab, Department of Biology, Biotechnical Faculty, University of Ljubljana, Jamnikarjeva 101, SI-1000 Ljubljana, Slovenia
*
Authors to whom correspondence should be addressed.
Heritage 2025, 8(11), 464; https://doi.org/10.3390/heritage8110464
Submission received: 29 August 2025 / Revised: 15 October 2025 / Accepted: 17 October 2025 / Published: 6 November 2025

Abstract

Determining the lithostratigraphic provenance of limestone artefacts is challenging. We addressed the issue by analysing Roman stone artefacts, where previously traditionalpetrological methods failed to identify the provenance of 72% of the products due to the predominance of micrite limestone. We applied statistical classification methods to 15 artefacts using linear discriminant analysis, decision trees, random forest, and support vector machines. The latter achieved the highest accuracy, with 73% of the samples classified to the same stratigraphic member as determined by the expert. We improved classification reliability and evaluated it by aggregating the results of different classifiers for each stone product. Combining aggregated results with additional evidence from paleontological data or precise optical microscopy leads to successful provenance determination. After a few samples were reassigned in this procedure, a support vector machine correctly classified 87% of the samples. Strontium isotope ratios (87Sr/86Sr) proved particularly effective as provenance indicators. We successfully assigned all stone products to local sources across four lithostratigraphic members, thereby confirming local patterns of stone use by Romans. We provide guidance for future use of statistical learning in provenance determination. Our integrated approach, combining geological and statistical expertise, provides a robust framework for challenging provenance determination.

1. Introduction

Determining the provenance of limestone products in geoarchaeology poses a persistent methodological challenge, especially when dealing with micritic limestones. As micrites (carbonate mudstones) lack diagnostic features, such as fossils, grains, or sedimentary structures, these limitations are particularly pronounced [1,2,3,4]. Additionally, other fine-grained limestone types (e.g., peloid or stromatolite) commonly present this challenge.
The challenge of identifying the provenance of shallow marine limestones is complicated by their mineralogical and geochemical homogeneity [5], which, in the absence of indicative sedimentological features, increases the difficulty of determining their provenance [6,7]. Consequently, a multi-method approach to data is essential. This involves combining different analytical techniques with comparative studies of geological provenance assessments by identifying key variables that are relevant to the analysis. However, because several variables are measured, the data for provenance determination is multivariate. A human determinator will not be able to detect patterns hidden in interactions of many variables, and classical univariate statistical methods will likewise fail at this task. Hence, methods for analysing multivariate data have been developed. Classical multivariate methods such as principal component analysis (PCA) and linear discriminant analysis (LDA) are commonly used to reduce data complexity and classify lithologies, respectively [8]. However, advances in multivariate methods have been limited by the weak performance of computers. With the advancement in computational statistics, powerful methods of statistical learning have emerged [9] to tackle problems as diverse as predicting relapse in cancer patients, stock market predictions, and weather forecasts. Recently, some of these methods, such as support vector machines (SVMs) and random forests (RFs), have also been applied to classifying the provenance of stone products [10,11].
This study aims to improve lithostratigraphic provenance determination of limestone products by utilising statistical learning methods. We compare the accuracy of provenance classification using LDA, decision trees (DTs), RFs and SVMs. We show how to improve the accuracy by reducing the number of variables and fine-tuning the hyperparameters. The results of different classifications were summarised by looking at how many classifiers assigned each artefact to any of the possible stratigraphic members. If the majority of classifiers agreed on classification, which differed from that by a human expert, then the original provenance determination was reevaluated. This greatly improved overall determination success. We further demonstrate how the ranking of variable importance by statistical classifiers can be used to identify the most useful variables for provenance determination (87Sr/86Sr in our dataset). We provide guidance on applying statistical learning to provenance classification. We emphasise that the approach is not limited to the classification of limestone provenance but can be adapted to other rock types (e.g., dolomite, chert, gypsum, and marble), as well as other archaeological materials (including tesserae, ceramics, and mortars). Additionally, quantitative variables other than those in our dataset can easily be used or added (e.g., fossil records). While statistical learning is not limited to a subject area, we demonstrate that geological and archaeological studies would greatly profit from its wider application.

2. Materials and Methods

The data used in this study refers to Roman stone products from the Ig area near Colonia Iulia Emona (Ljubljana, Slovenia), specifically Venetia et Histria (regio X) [12]. While the local use of limestone is well documented [13,14], the exact lithostratigraphic origin remains unclear [15,16,17,18]. Since petrological methods could identify the stratigraphic origin of only 28% of the Ig samples due to the predominance of micritic limestone [17,19], additional methodological approaches are necessary to strengthen the provenance determination.
The use of the Lower Jurassic Podbukovje Formation [20] has been previously recognised [18]. This succession was subdivided into Formations 1–3 [12] (Figure 1). Formation 1 (Hettangian–Sinemurian) comprises micritic and ooidal limestones [21,22,23]. The Roman-period quarry at Podutik (stratigraphic extent: Members 1.1–1.2) and the Staje quarry (stratigraphic extent: Member 1.2) are situated in this formation. Formation 2 (Late Sinemurian–Early Toarcian) comprises bioclastic and lithiotide-rich limestones [19,24] with a quarry at Podpeč (stratigraphic extent: Members 2.1–2.2). Formation 3 consists of peloid–ooid packstones and nodular mudstones [25]. A smaller quarry (stratigraphic extent: Member 3.3) in the Podpeč area is situated in this formation [19,26].
Expert provenance identification (Table 1), based on the full dataset published in [12], followed the classification protocol established for Emona stone products [26]. It integrated stratigraphic, petrographic, and geochemical analyses, including 87Sr/86Sr isotope ratios, biostratigraphy, cathodoluminescence, and foraminiferal assemblage studies.

2.1. Geological Samples

A total of 742 geological samples were taken from 28 sedimentological profiles at a scale of 1:100, representing approximately 400 metres of cumulative stratigraphy. These profiles were located at key Roman-period quarry sites in central Slovenia, including Podutik (P1, P3, P4), Staje (D), and Podpeč (POD Arheo, POD1–POD5). Sampling followed a systematic protocol using sedimentological logs. At least one sample was taken from each limestone bed and from thicker beds at intervals of 50 cm or less. For the statistical testing of the expert model, 25 samples with complete geochemical and isotopic results were used.

2.2. Archaeological Samples

Permission was granted to sample 53 Roman-period stone products from the Ig area—47 from the lapidarium of Iška vas and 6 from the archaeological Ig roundabout site. The archaeological materials included architectural, votive, and sepulchral elements. All stone products were subjected to the same analytical procedures as the geological samples. Of the 53 sampled, 15 were fully analysed due to budgetary constraints and used for statistical validation of the expert model. Additionally, the provenance of five stone products (IV 1, IV 4, IV 13, IV 31, IV 38) was previously uniquely attributed to specific lithostratigraphic members through optical analysis, including macroscopic grains, foraminiferal assemblages, microfacies, and cathodoluminescence, supported by geochemical and isotopic data.

2.3. Expert Identification Procedure and Input Data for Statistical Classification

Fieldwork was conducted using high-resolution topographic maps and LIDAR surface models [28], which enabled detailed geological mapping at a scale of 1:2.500, with regional maps for Podutik, Ig, and Podpeč at a scale of 1:5.000. The mapping employed boundary tracing and full outcrop documentation [29]. Macroscopic descriptions included lithology, texture, structure, and colour [30]. Petrographic and sedimentological analysis was performed on 47 × 28 mm thin sections stained with Alizarin Red S and examined under a digital microscope. Microfacies were named according to references [31,32], while biostratigraphy was based on benthic foraminifera [33,34,35]. Cathodoluminescence microscopy was conducted at ZRC SAZU using a Nikon Eclipse E 600 (Tokyo, Japan) with a CITL CL8200/MK4 (Hatfield, England, UK). Mineralogical composition was determined via XRD and Rietveld refinement at the Department of Geology, University of Ljubljana. Geochemical analyses (Fusion–ICP–MS) were performed at Actlabs (Canada); δ13C and δ18O measurements were carried out at GeoZentrum Nordbayern and the University of Erlangen; and 87Sr/86Sr ratios were determined at the University of Oxford, Department for Earth Sciences, using MC-ICP-MS, in accordance with laboratory protocol [36,37]. For the expert provenance determination [12], the 87Sr/86Sr ratio was plotted using LOWESS smoothing and correlated with the global SIS reference curves [38,39]. The 95% confidence intervals were calculated from the combined uncertainties of both analytical and reference data. All gathered data were used to classify the stone products in the expert model [12], whereas only numerical data (geochemical data, stable isotope ratios (δ13C, δ18O), and strontium isotope ratios (87Sr/86Sr)) were used for statistical analysis.

2.4. Data Processing and Statistical Methods

All statistical analyses and data processing were conducted in R version 4.2.2. [40]. The R code is provided in Supplementary S1 and is accessible to future users. The training and test dataset comprised measurements of 19 variables (“features” in the language of machine learning): proportions of ten major oxides (given in percentages) that included LOI, proportions of six trace elements (measured in parts per million), and three isotope ratios (δ13C, δ18O, and 87Sr/86Sr). The training dataset used to build the classification models consisted of 25 sampling units, five for each of the five members (1.1, 1.2, 2.1, 2.2, and 3.3). All these samples originated from known stratigraphic positions in quarry sites near the Ig area. Thus, the number of sampling units only slightly exceeded the number of variables.
The test dataset, utilised for classification with the trained models, comprised measurements of the same 19 variables on 15 Roman-period stone products.
Before the analysis, these were categorised by the human expert (see above) into four of the five possible members (1.2, 2.1, 2.2, and 3.3).

2.4.1. Data Processing

Major oxides (in percentages) and trace elements (in mg·kg−1) were treated as two separate compositions, since they had been measured on such different scales. This is an acceptable procedure in compositional analysis [41] because it follows from subcompositional invariance. A composition is a type of data where the elements of the composition are non-negative and sum to unity [42]. Compositional data analysis (also known as CoDa) deals with proportions of elements of composition, whereas their absolute amounts are ignored, because they only depend on the amount of the sampled material. If we consider only a subcomposition (i.e., ignore some components), the proportions among the remaining components do not change (subcompositional invariance). Compositional data analysis was conducted using the “compositions” package [41,43].
Most classification methods suffer from “the curse of high dimensionality” [9]; i.e., they do not perform well when the number of variables substantially exceeds the number of sampling units in the training set. To avoid it, we built three datasets with a reduced number of variables. The first used the first nine principal components (PCs), the second was obtained by removing correlated variables and those that were not so strongly different among the members in a Kruskal–Wallis test, and the third only included the values of three stable isotopes.
Because a composition can be treated as a Euclidean vector space [41], we can use transformations to map the composition to the real vector space, where it is treated as multivariate normally distributed data. We used two such isometric transformations: the centred log-ratio transformation (clr) to compute PCs and the isometric log-ratio transformation (ilr) for LDA. We also used a pairwise log-ratio transformation (pwlr) to preprocess the data for classification with SVMs, DTs and RFs, because it has previously led to the best classification performance with tree-based methods [44]. Stable isotope values were not transformed other than the values of 87Sr/86Sr, which were standardised as they previously varied in the range of 10−4. After that, all the variables had similar variances.

2.4.2. Statistical Learning Methods

We used four types of statistical learning methods for provenance classification: linear discriminant analysis (LDA) (package “MASS”, version 7.3-58.2) [45], decision trees (DTs) (package “rpart”, version 4.1.23) [46], random forest (RF) (package “randomForest”, version 4.7-1.1) [47] and support vector machines (SVMs) (package “e1071”, version 1.7-13) [48].
LDA finds a linear combination of variables in the training data that maximises the differences among groups of samples (in our case, groups were members), while minimising variation within the groups [46,49]. Simplified, we take a viewpoint of the multivariate data cloud, from which the predetermined groups differ most. The linear boundaries that separate the groups are referred to as linear discriminant functions. Data from the test dataset is projected onto the space determined by the linear combination and classified into groups, depending on which side of these boundaries they fall.
SVMs are related to LDA. They fit a decision boundary between group clouds of points to maximise their distance to the neighbouring data points, which are known as support vectors [9,50]. Other data points that lie further from the boundary and closer to the centroid are ignored. This decision boundary is not limited to a linear shape. Using kernel mapping, one can also use different shapes. We used linear (SVMl) and radial basis kernels. The latter produces curved boundaries. After computing the decision boundaries, the test data (in our case, data from stone products) was classified based on which side of the boundaries they fell. SVMs compute the class membership separately for each possible pair of groups. The algorithm in the package “e1071” then uses a voting mechanism to determine the final class [48]. It is necessary to tune the SVM model’s hyperparameters by testing many possible values to find those that yield the best classification performance. In the SMV model, we tuned “gamma”, a hyperparameter that controls the radius of the boundary (only for radial basis kernels), and “cost”, which controls the proportion of data points that can be on the boundary or on its wrong side.
The DT that we used was not a multivariate method. The method iteratively splits the predictor space by selecting a boundary that consists of a single value of a single variable [9]. Such a split can be visualised as a forking of two branches. Samples that match the partitioning criterion remain in the left branch, while others fall on the right branch. Decision boundaries in the tree model are referred to as nodes, and the final branches are referred to as leaves. The partitions are computed in a way that maximises the decrease in branch impurity (avoiding branches that contain data from different groups). The impurity can be measured as a decrease in entropy, or as a decrease in the Gini index (the sum of products of the proportions of each group member in a branch with the proportions of the other data points). The iterative procedure yields a model that is overfitted to the training data (with too many nodes and too few data points in each leaf) and is not general enough to robustly classify different test sets. Therefore, the second stage of model construction simplifies it by pruning off branches in a cross-validation procedure. We used tenfold cross-validation; i.e., the training data was split into ten equal groups, each of which was used once as test data while the model was calculated using the remaining nine-tenths. Only the most stable branches across the ten folds were kept in the final model.
The weaknesses of DTs are their high variability, bias, and correlation. To remove these issues, several methods of tree averaging have been developed. “Bagging” (or bootstrap aggregation) reduces variance and bias by fitting a large number of trees to bootstrap-sampled versions of training data and averaging the resulting trees. This procedure is improved by RF, which additionally reduces correlation. Decorrelated trees are built by limiting the number of variables used for the construction of each tree from a bootstrapped sample [9]. We tuned the total number of trees in the ensemble and the maximum number of variables used per tree to obtain the best classification performance by RF. The side effect of this procedure is that variables can be ranked by their importance, measured as the largest mean decrease in classification error or Gini index per node. We generated bootstrap samples in a stratified manner; i.e., each tree was built from a sample comprising two sampling points from each of the five possible members in a training dataset.

2.5. Evaluating Model Performance

The classification performance of the statistical models was evaluated in terms of accuracy, i.e., the proportion of stone products that were assigned to the same class by both the model and the expert. Confusion matrices (contingency tables comparing the numbers of assignments to different members by an expert to the numbers of assignments to different members by a model) were used to inspect which members were correctly classified (the same as by the expert) and to which member any misclassified stone products were assigned (different to the expert).
Finally, for each stone product, we computed the proportion of classifications aseach of the possible members and compared the highest proportion to the expert’s identification. If more than 60% of the statistical models assigned a stone product to the same member that differed from the expert’s assignment, the latter was reevaluated. This shows how statistical learning methods can improve classical provenance determination.

3. Results

3.1. Univariate Analysis

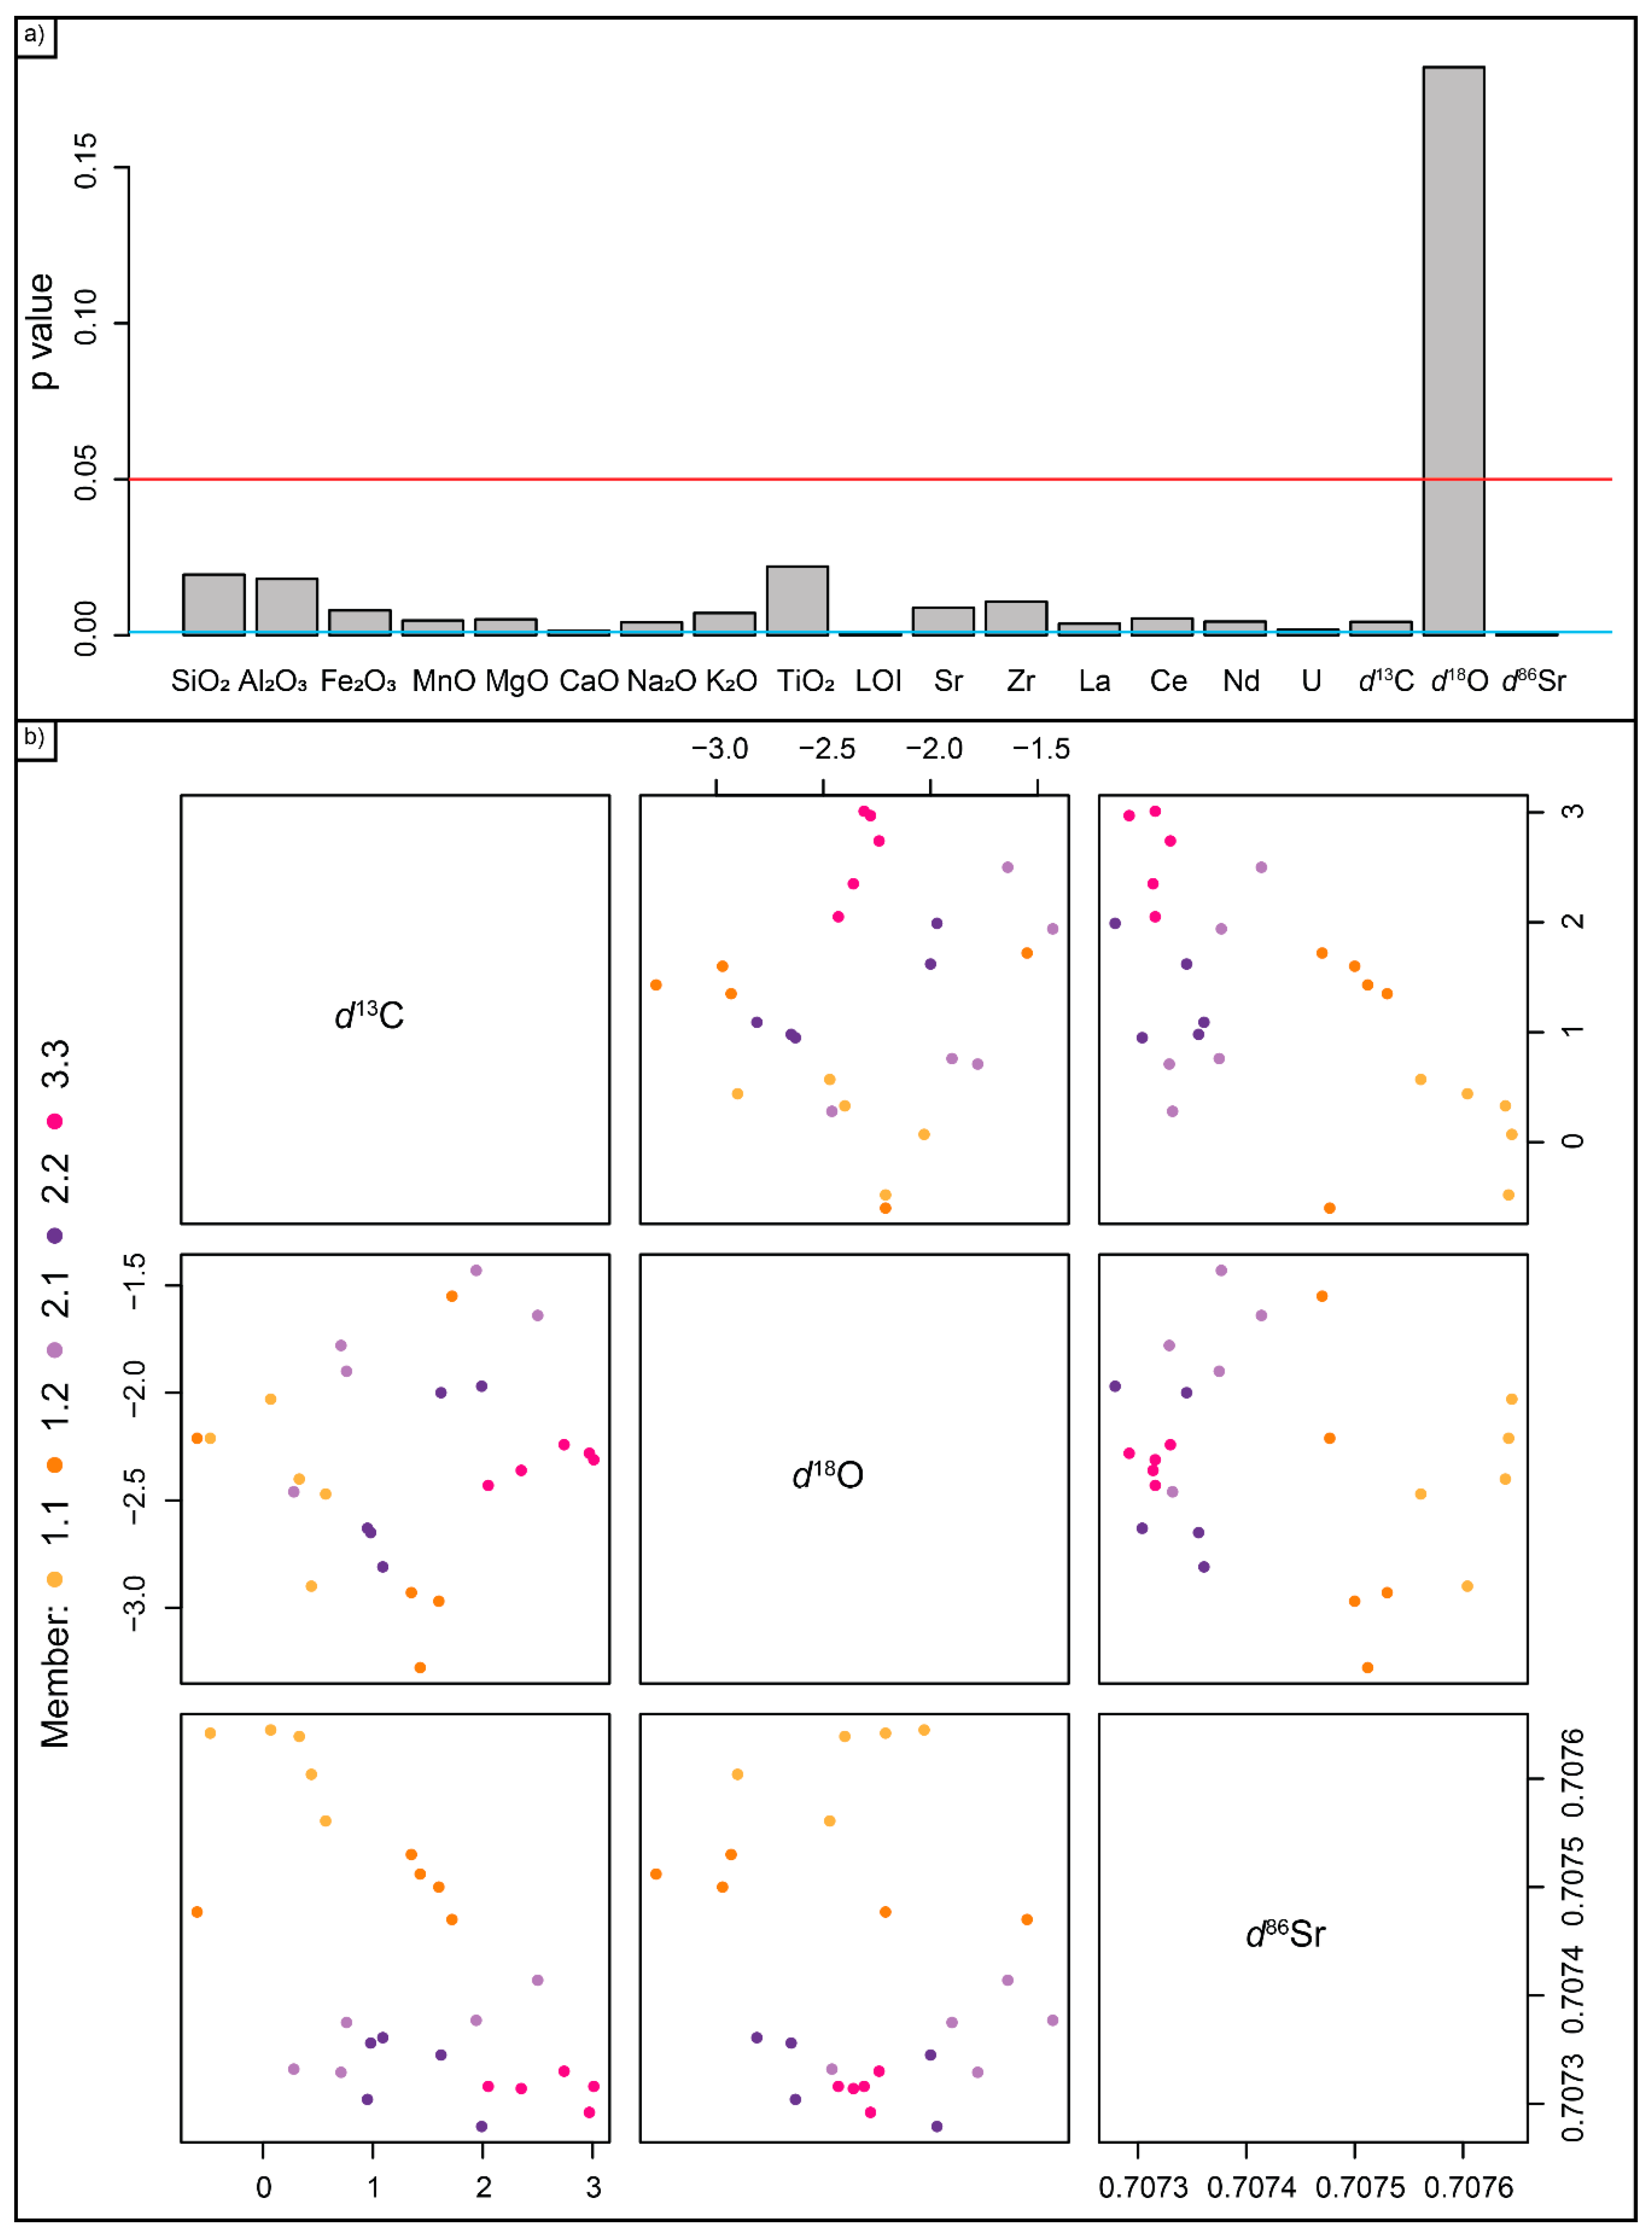
The members of geological samples (training dataset) differed significantly in major oxides (SiO2, Al2O3, Fe2O3, MnO, MgO, CaO, Na2O, K2O, and TiO2), LOI, trace elements (Sr, Zr, La, Ce, Nd, and U) and two isotopes (δ13C, 87Sr/86Sr), with p-values of the Kruskal–Wallis test below 0.05 (Figure 2a; Supplementary File S2, Table S2.1), except in δ18O. Such a variable in which classes (geological members) seem to overlap and do not differ in a univariate test can still have a crucial contribution to the multivariate differences, particularly if the differences in such a variable are uncorrelated to the differences in other variables.
Scatter plots showed systematic geochemical variations among the five member groups (1.1–3.3). The major oxide relationships (Supplementary File S2, Figure S2.1) defined distinct compositional fields, with Members 1.1–1.2 clustering together in the SiO2–Al2O3–Fe2O3 compositional space. Members 2.1–2.2 were enriched in Fe2O3 and TiO2 and showed MgO depletion, while Member 3.3 was marked by elevated K2O, Na2O, and TiO2 concentrations.
Scatter plots of minor and trace elements (Supplementary File S2, Figure S2.2) showed strong Sr–Zr–La coupling and low U and Nd values in Members 1.1–1.2. Member 3.3 displays U enrichment and high La and Ce levels.
Isotopic analysis (Figure 2b) revealed distinct groupings, with Member 1.1 showing the lightest and Member 3.3 the heaviest isotopic signatures. δ13C and δ18O in Members 1.1–2.2 indicated a coupled C–O trend, while Member 3.3 deviated with low δ18O despite high δ13C, reflecting decoupled isotopic behaviour. Strontium isotope ratios (87Sr/86Sr) cluster between 0.7073 and 0.7076, with member-specific distributions. Nevertheless, different members overlapped in all the variables of the geological samples (training dataset), demonstrating the necessity of using multivariate analysis for accurate provenance classification (e.g., Supplementary File S2, Figure S2.3).

3.2. Statistical Classification Was More Accurate with a Reduced Number of Variables

The “curse of high dimensionality” was observed in all statistical learning methods, as datasets with fewer variables produced more accurate classifications than those with either the full set (19 variables) or 63 predictors, including the dataset containing pwlr-transformed pairs among the geochemical variables.

3.2.1. Linear Discriminant Analysis

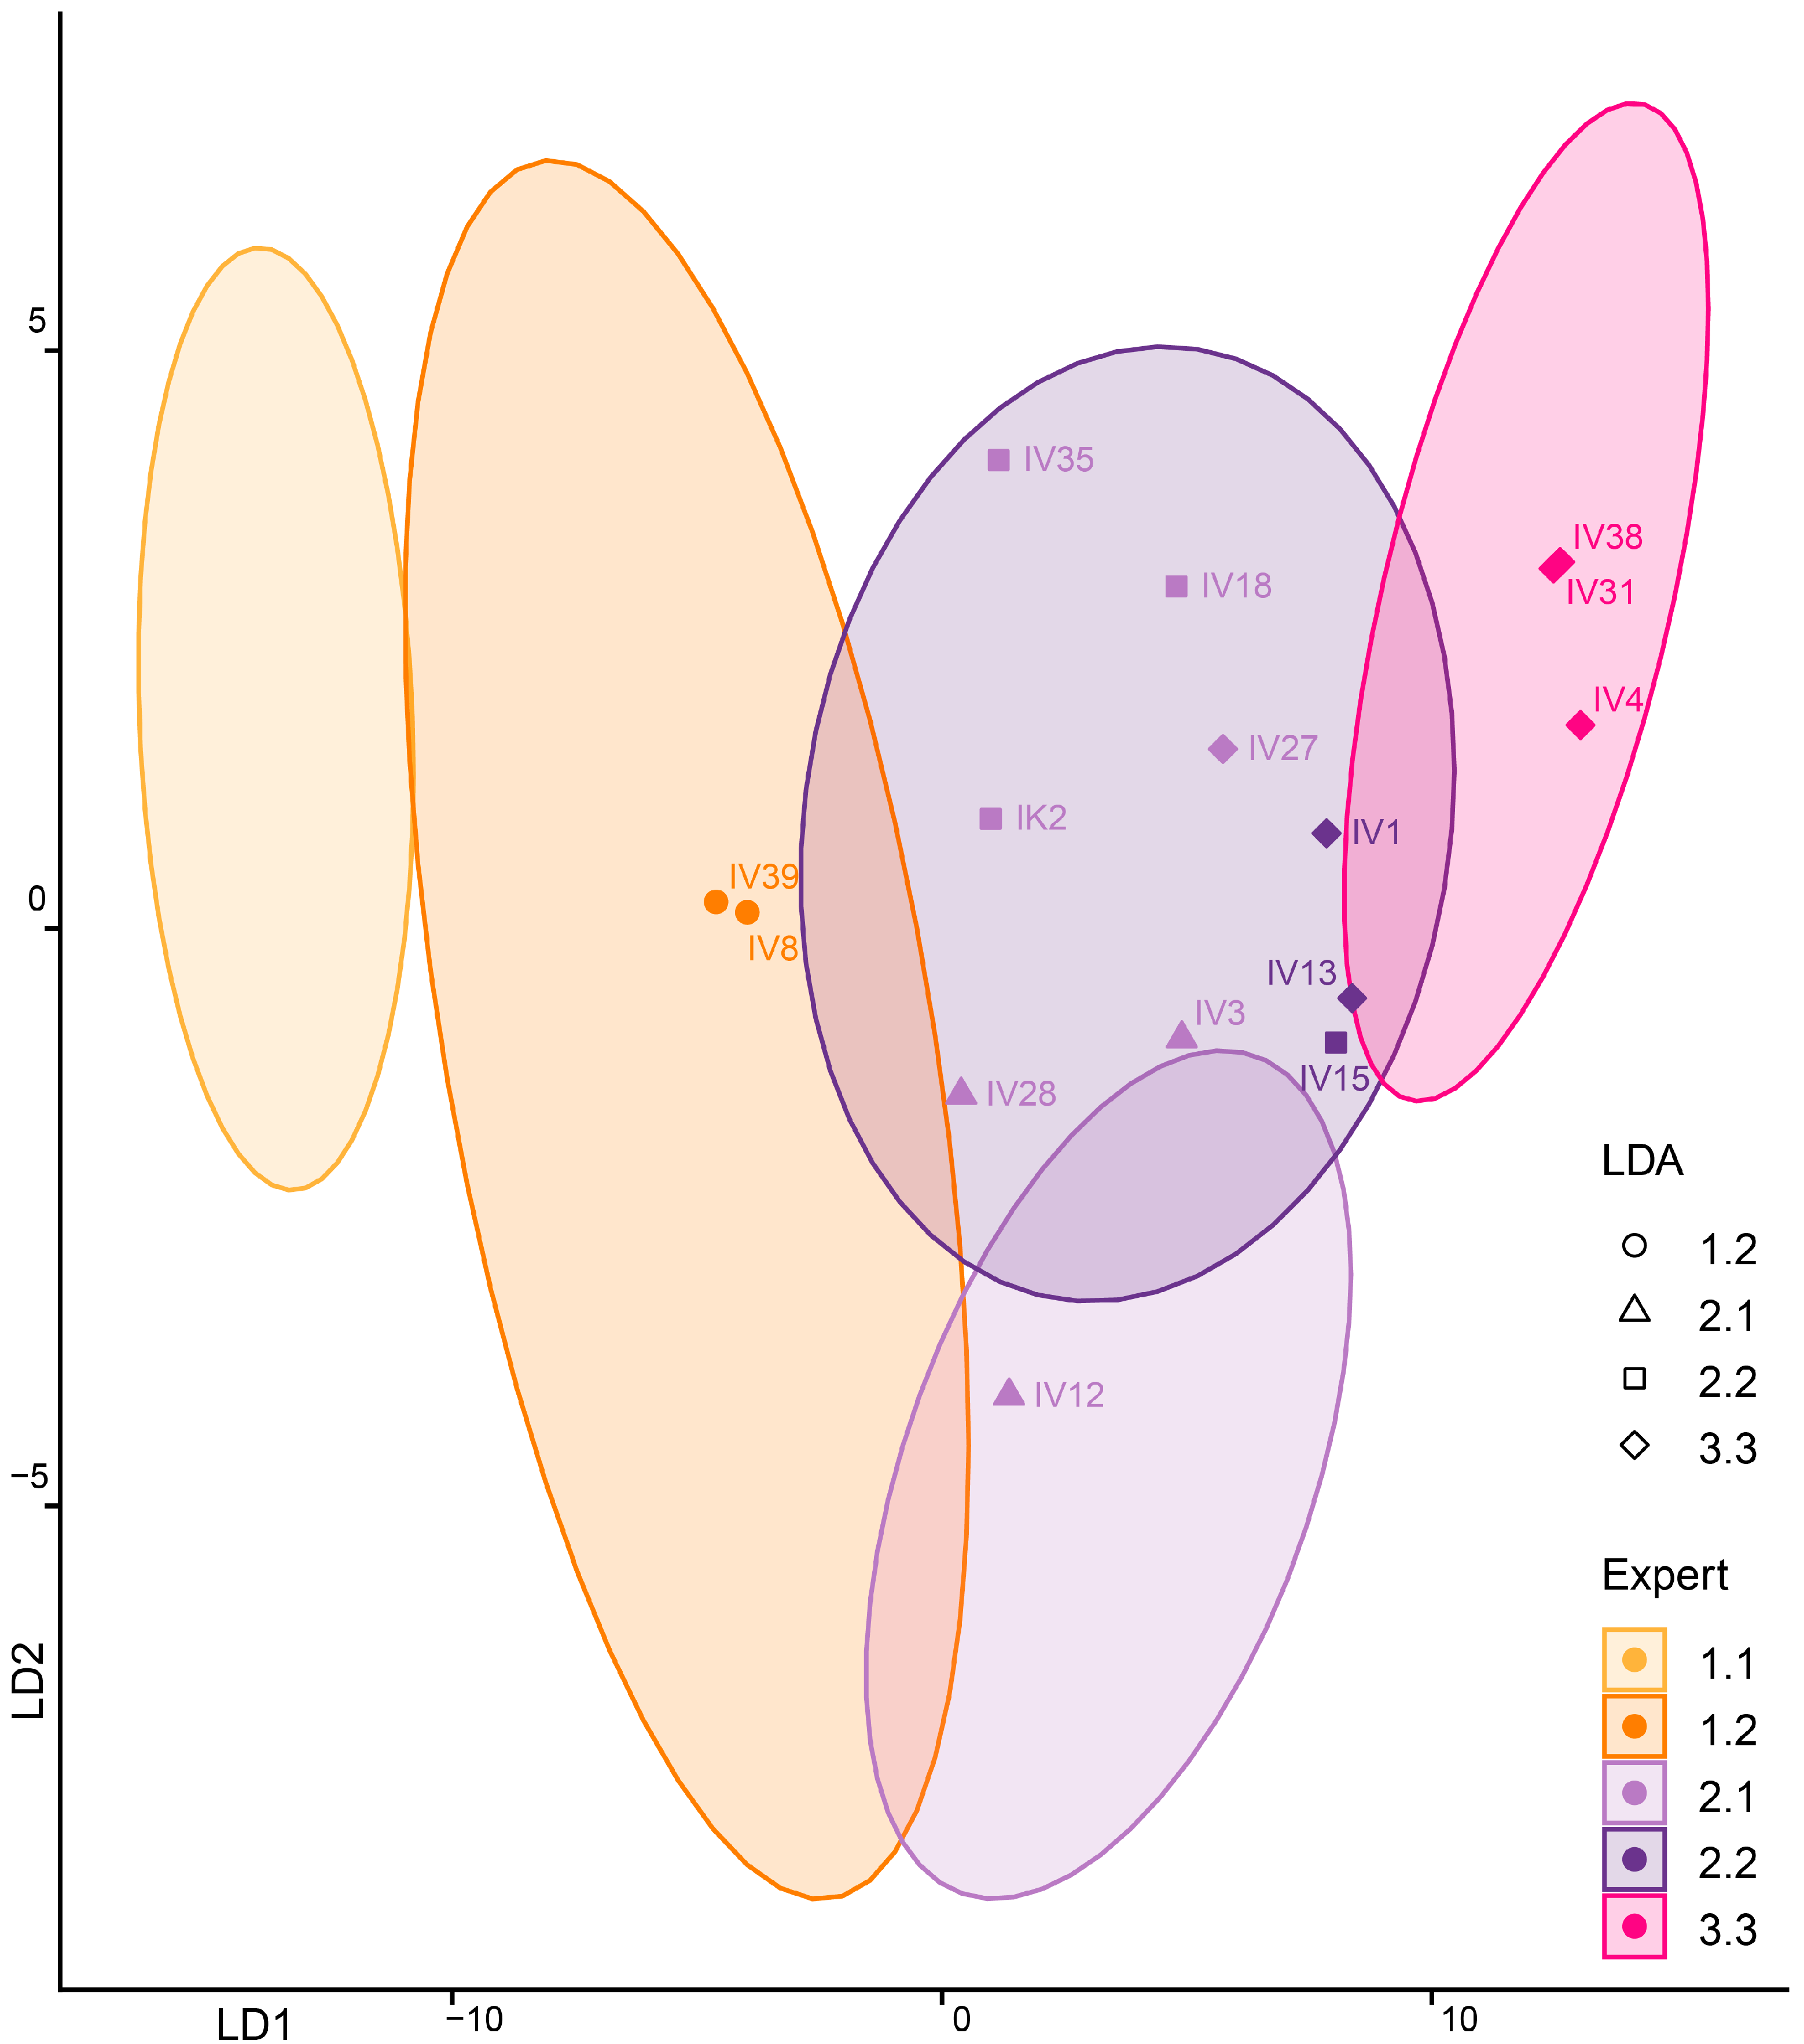
LDA models built with a reduced number of variables outperformed those that included all variables (accuracy 0.6 with PCs and selected variables, accuracy 0.53 with isotopes only, versus accuracy 0.47 with all variables, Supplementary File S2, Table S2.2). In the LDA models using all the variables and selected variables, the highest absolute values of coefficients of the first linear discriminant were achieved by CaO, LOI, and 87Sr/86Sr, which shows their high contribution to the among-member differences in the training dataset (quarry samples), though not necessarily in the test dataset, where CaO may be partially depleted due to weathering. If the model was computed using the PCs, the second, first, and sixth PCs contributed most to the first linear discriminant. In contrast, when the model was computed only using isotopes, 87Sr/86Sr made a one magnitude greater contribution than δ13C and δ18O. All the LDAs assigned all the stone products from Member 3.3 correctly. Stone products from 1.2 were classified correctly by the LDAs computed using PCs and stable isotopes, whereas they were sometimes confused with Member 1.1 by LDAs computed on all or selected variables. Stone products from 2.2 were often erroneously classified as 3.3, and those that were determined as 2.1 by the expert were often erroneously classified as 2.2 and occasionally as 1.1 or 3.3. Training and test data in LDA computed on PCs are shown superimposed on Figure 3.

3.2.2. Decision Trees

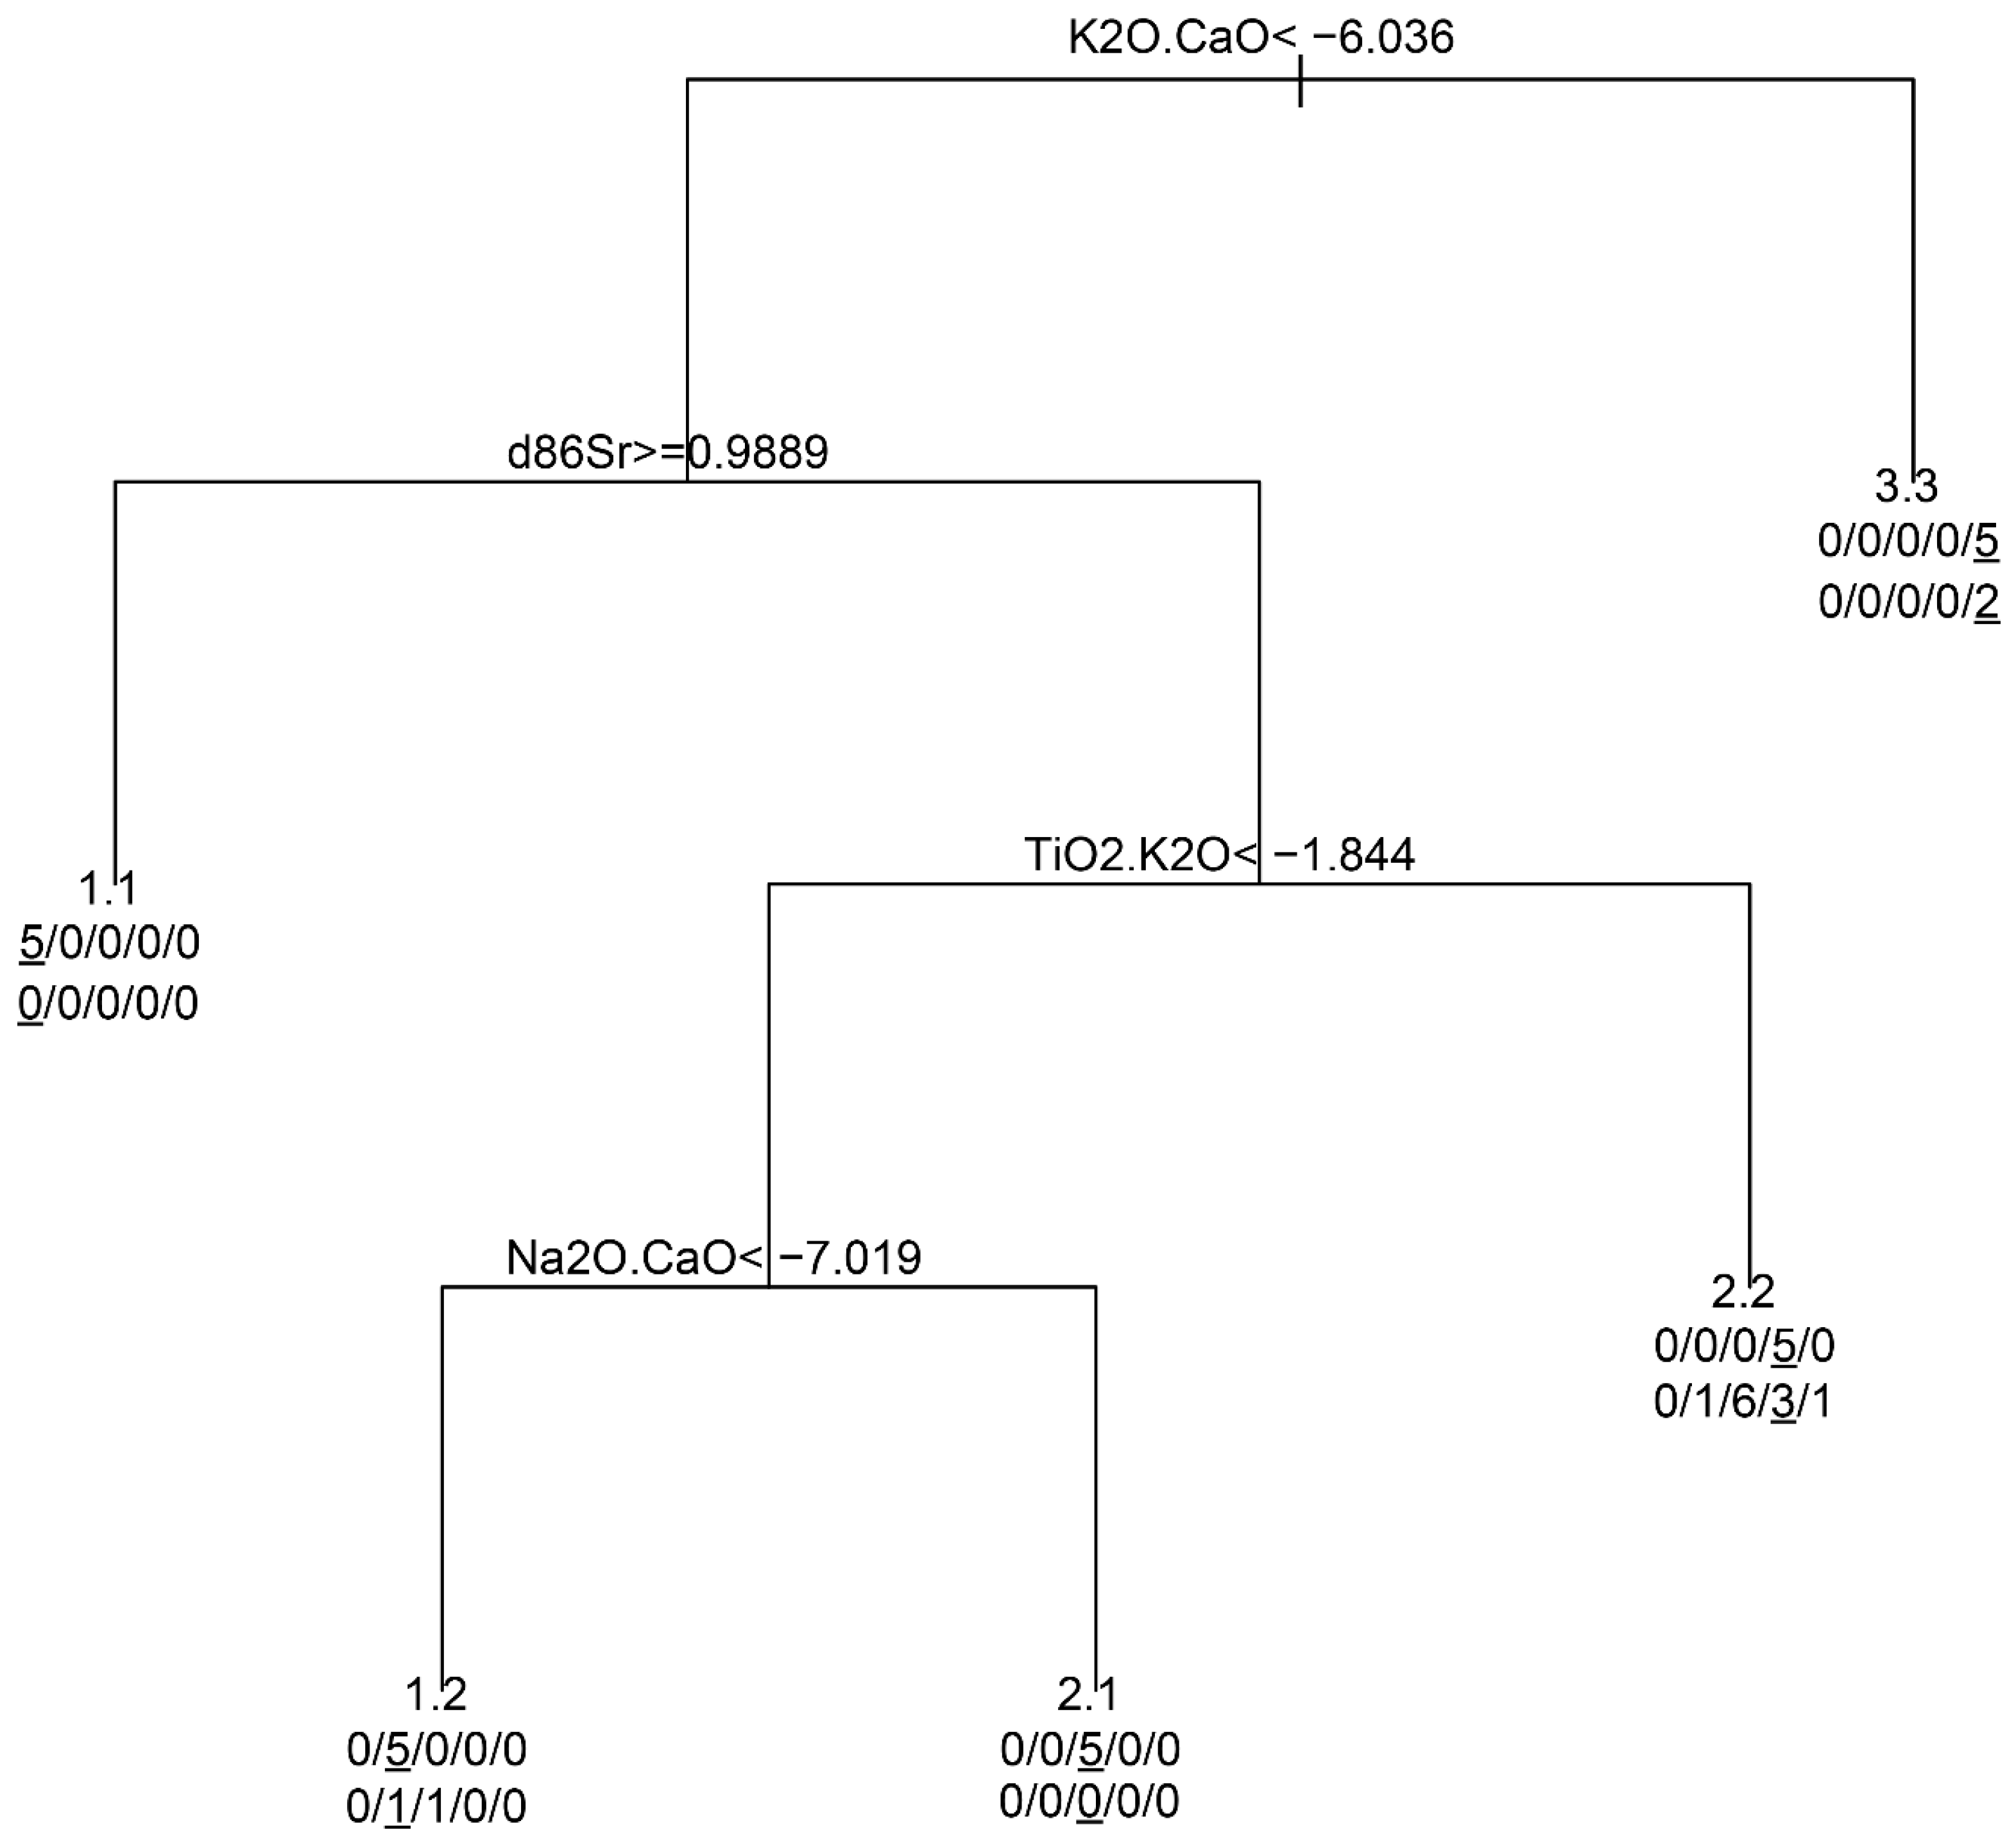
DTs are not a multivariate method and perform worse than other methods that leverage a multivariate data structure for classification. Many variables were ranked as useful for classifying the training dataset by the model algorithm (100% accurately); however, the trees built with some of those (e.g., LOI/CaO log-ratio) were not successful in determining the provenance of stone products (accuracy: 0.13), being below the chance rate (0.2). However, when preventing the use of the LOI/CaO log-ratio by weighting it, the model was built using 87Sr/86Sr (Figure 4). This tree classified the test set significantly better (accuracy: 0.4). Its performance was comparable to that of the tree built using PCs, whereas the tree built with only stable isotopes was slightly less successful (accuracy: 0.33).

3.2.3. Random Forest

Forests of trees performed better in classification than single decision tree models. Both RF models, computed using pairwise log-ratio transformed geochemical data, classified the provenance of up to 0.47 of the stone products in the same way as the expert did, on PCs. The RF that used only measurements of the three isotopes as variables matched as much as 0.6 stone product classifications with those of the expert.
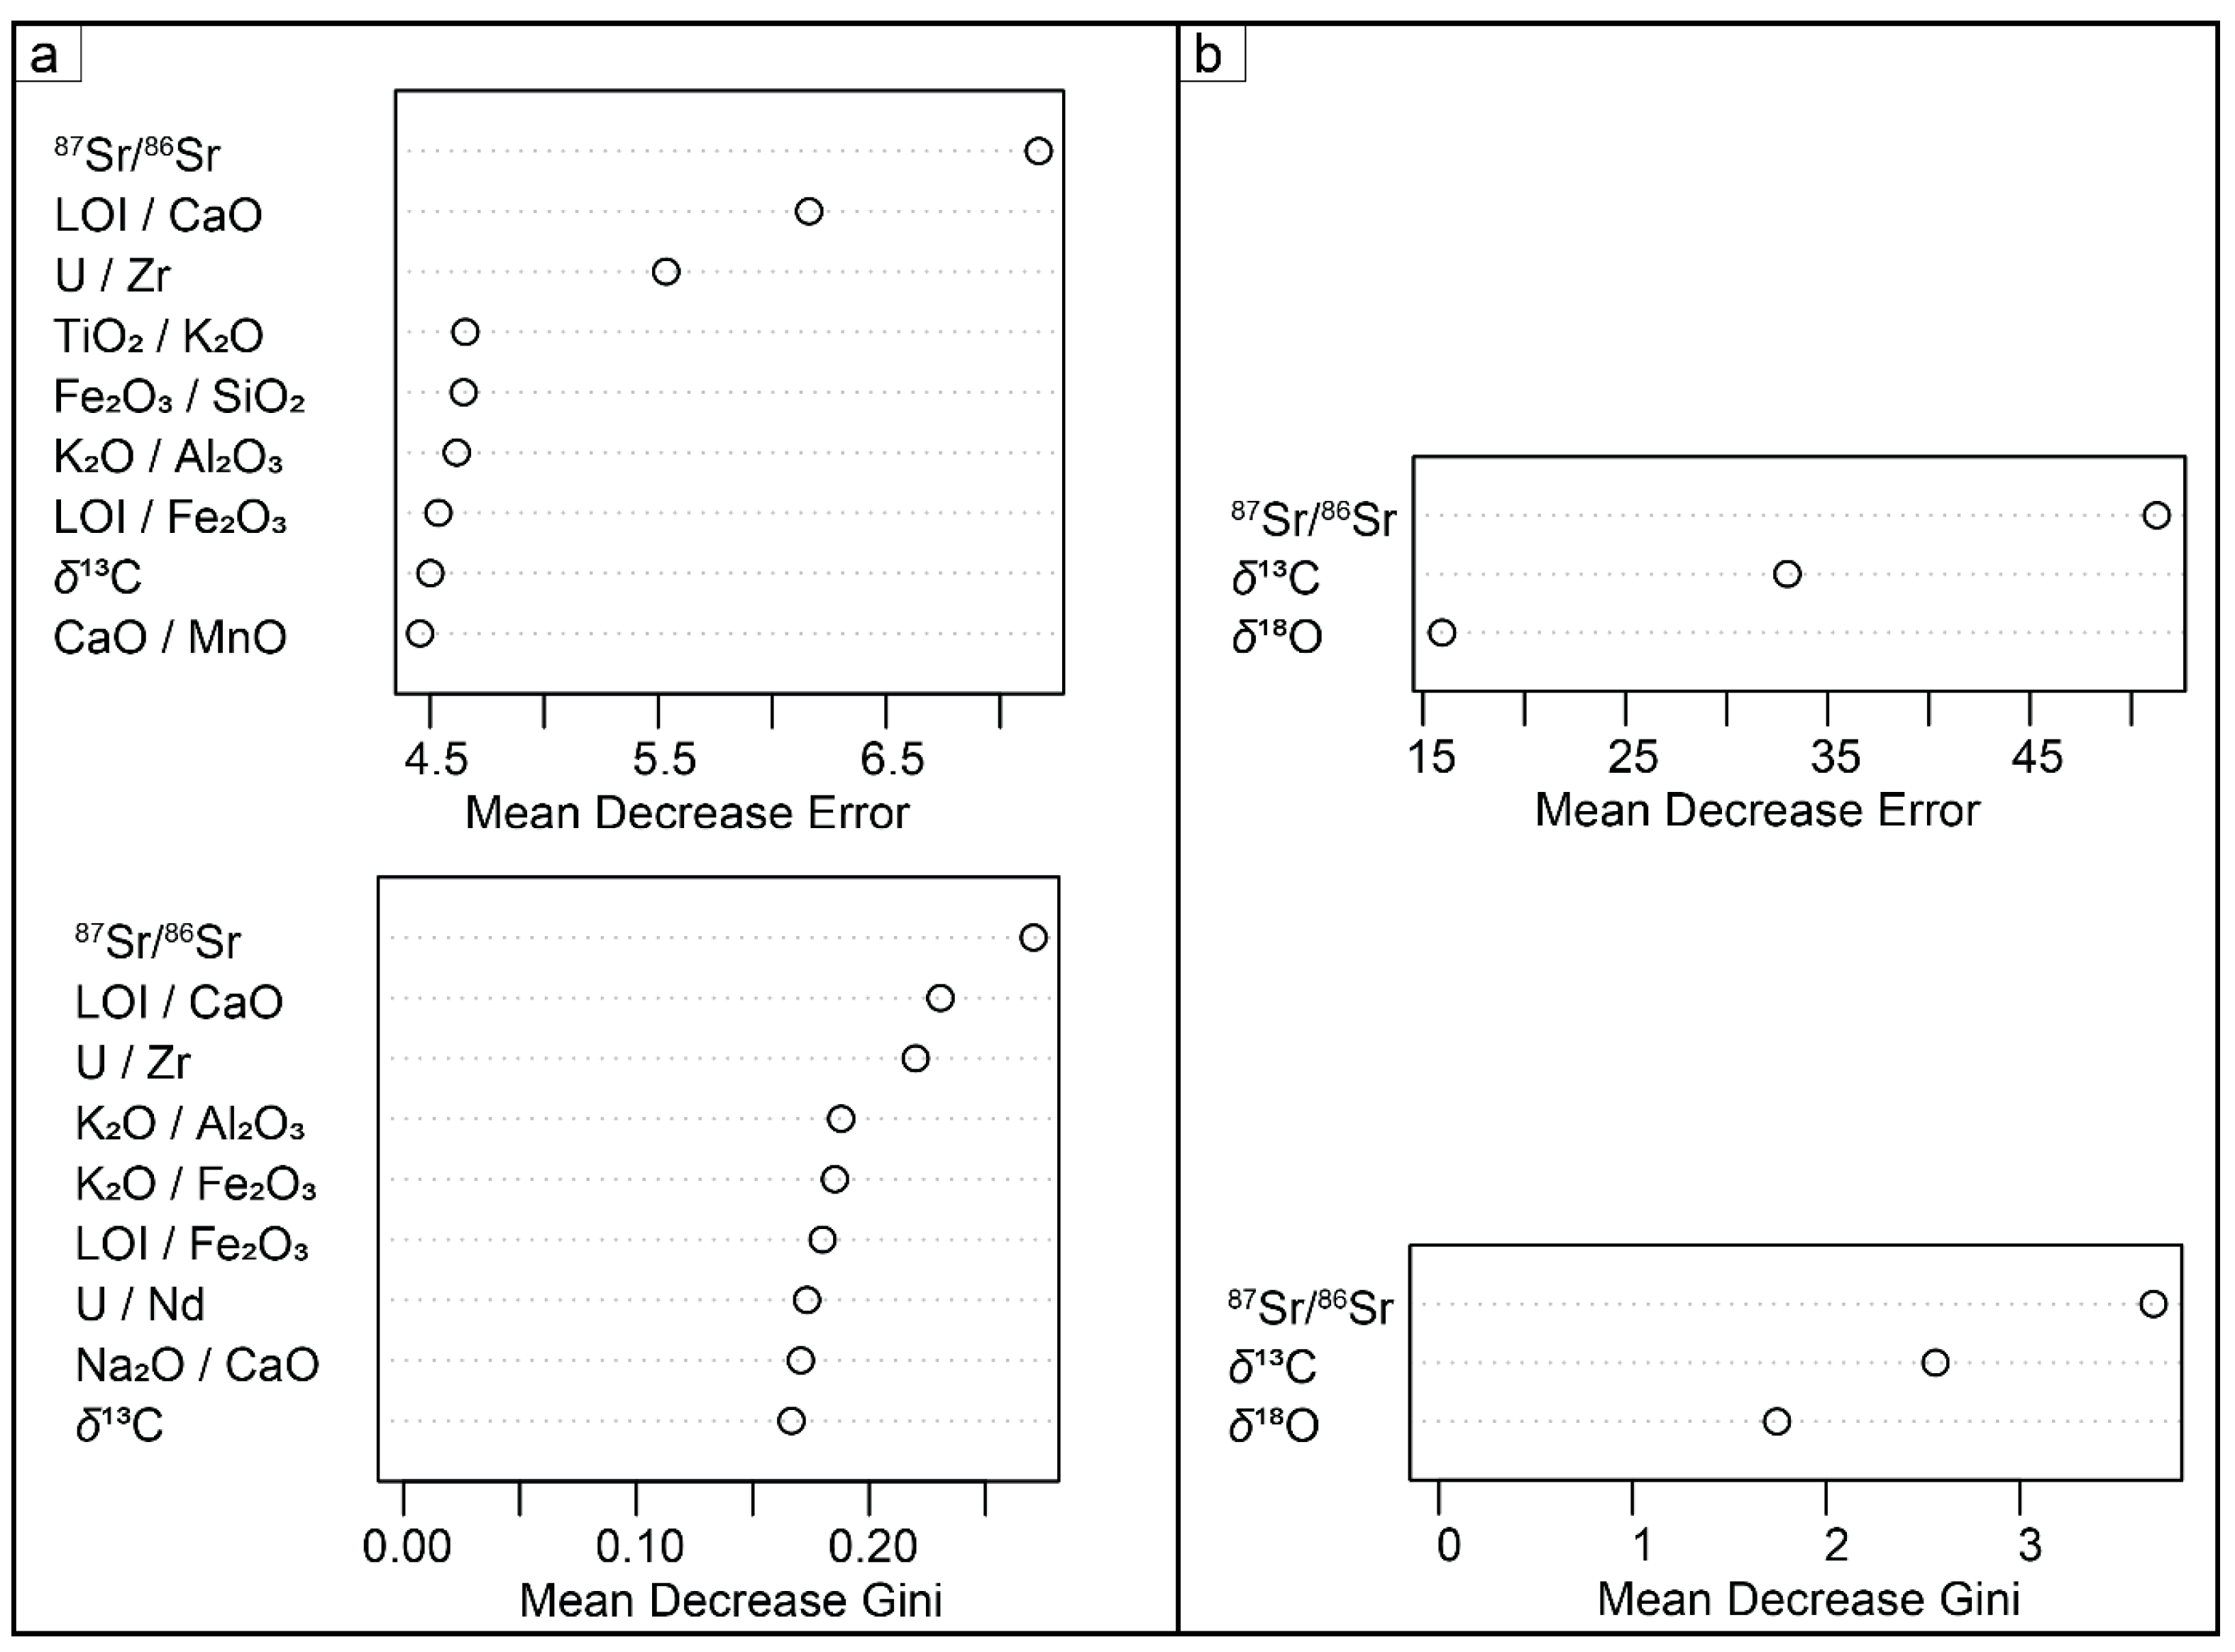
The analysis of variable importance identified several important predictors (variables or log-ratios of their pairs), with the strontium isotope ratio (87Sr/86Sr) ranking first in the models using both geochemical and isotopic data, as well as the isotopic data alone (Figure 5).

3.2.4. Support Vector Machines

The SVM with a radial basis kernel achieved the best classification performances of all the methods, with the model computed using a dataset with pwlr-transformed geochemical compositions achieving up to 0.53, the model using PCs two-thirds, and the model solely using stable isotopes as much as 0.73 classifications of stone product provenance matched with the experts. If “gamma” and “cost” were tuned to optimise classifications of training data with leave-one-out cross-validation instead of taking classification accuracy of test data as a tuning criterion, accuracies were lower. In contrast, classifications with SVMl (linear basis kernel) consistently achieved an accuracy of 0.6, both using PCs and isotope data only, and irrespective of whether the cost was optimised for test data or training data classification using leave-one-out cross-validation.
The SVM with a radial basis kernel, using PCs and isotopes, classified all the stone products in the same way as the expert (1.2, 2.2, and 3.3), except for 5/7 and 4/7 of those that the expert determined as 2.1, respectively.

3.3. Comparison of Statistical Classifiers

The SVMs were the most successful in terms of classification accuracy (proportion of classifications matching those of the expert), followed by the similarly successful LDA and RF classifiers. The lowest classification accuracy was achieved by the DTs, which was still above the chance rate, except in the model that used log-ratio among LOI and CaO rather than 87Sr/86Sr.

3.4. Aggregating and Summarising Classifications Across Methods

When combining the results, we see that the methods had the easiest job classifying stone products from Member 3.3, matching the expert in 91.7% of cases (Table 2), followed by 1.2 (66.7%) and 2.2 (44.4%). Stone products classified by the expert as 2.1 posed the toughest challenge for classification. They were still most often classified as 2.1 (31.5%), though they were labelled as 2.2 (28.0%) or 3.3 (26.2%) almost as often.
The rows in Table 3 are sorted so that the stone products with the proportion of statistical methods agreeing on their classification decrease from top to bottom of the table. One can immediately notice how assignments that were agreed upon by higher proportions of statistical methods were more likely matched by the expert identification (upper part of the table) than those on which different statistical methods disagreed (bottom of the table). This result demonstrates how the aggregation of classification results yields more reliable conclusions for unanimous results, while also highlighting less reliable classifications. Classifications of samples, which were classified differently by different methods (bottom of Table 3), were considered less trustworthy.

3.5. Accuracies of Statistical Methods After Class Revisions

If the majority of statistical methods and expert disagreed in classification, the latter was reevaluated (see Section 4 for details). In three stone products (IK2, IV27, and IV3), the classification by an expert was revised to reflect the classification by the majority of statistical methods. This improved the accuracy of all statistical methods except LDA conducted on a subset of variables, with all models except some DTs correctly classifying more than half of the stone products. The highest accuracies were achieved by SVMs, with SVM on PCs correctly classifying 0.87 of the stone products and SVMl on PCs correctly classifying 0.8 of the products (irrespective of whether the model was optimised for test data or training data classification with leave-one-out cross-validation). The classification of the SVM model on stable isotopes kept an accuracy of 0.73 after class revision.

4. Discussion

4.1. Statistical Learning Methods Outperformed Traditional Methods in Provenance Classification

Statistical learning methods successfully classified the provenance of Roman stone products. All classifiers except one version of DTs achieved much higher accuracy than the chance level (0.2). The best classifiers identified 0.73 samples correctly (SVM on isotope data), and after correction of three classifications (discussed below), 0.87 (SVM on PCs) and 0.8 samples were correctly identified (SVMl on PCs). This is substantially higher than traditional petrological methods, which could only identify the stratigraphic origin of 0.573 of Emona samples and 0.28 of Ig samples, due to the predominance of micritic limestone [18,19].
However, the accuracy of statistical methods can be further improved. Namely, our training dataset contained one member more (1.1) than the test dataset. Consequently, all models had a non-zero probability of classifying any product as member 1.1 (Table 2, Figure 3 and Figure 4). This is not common in statistical learning studies, where the number of classes in the training and test sets is usually the same. Hence, if we were to train the models without the member 1.1, their classification performance would improve. However, in realistic situations, it will be common for the model to be trained on a higher number of classes than are present in the test set. In most cases, it will be impossible to know in advance, which classes will be included in the test set. That is why we decided to keep this handicap in model development.
The best provenance classification performance was achieved by SVMs, which we also recommend the most for geoarchaeological applications. LDAs and RFs performed slightly worse. The worst performance was by DTs, which does not suggest that these types of models are unsuitable for the application. They might be less powerful; however, their advantage is that they are the easiest to interpret. Furthermore, there are two big advantages to using many and diverse classifiers.

4.2. Aggregating the Classifications by Many Diverse Models Shown Very Useful for Provenance Analysis

We demonstrated that aggregating the classification results of multiple models of different types for each sample unit provided two key benefits: enhanced robustness of joint classifications and the ability to estimate classification reliability based on the unanimity of different methods. It is clear that if all the 24 models classified a stone artefact as belonging to class 3.3, this result is much more reliable than if the artefact was classified as many different classes in equal numbers by different methods. Hence, if we use a diverse set of methods, the reliability of results can be evaluated. However, for this to work, it is essential to ensure that the aggregated results are not merely from repeated training of more or less the same model, but that there is sufficient variation in the types and applications of models.
Once we have a measure of reliability for each classification, we can proceed to reevaluate original class assignments (see below). A high reliability, i.e., a large majority of methods agreeing on a classification that differs from the original one, means that a change in class is well-supported. If reliability is weaker, additional evidence that was not considered in the statistical analysis must be incorporated into the decision process. For this procedure, demonstrated below, geological expertise is crucial. This shows the importance of combining different expertise (geological, statistical, and archaeological) in determining the provenance of stone products. The challenges encountered with samples of similar composition underline the limitations of purely statistical approaches in complex geological contexts or with less informative litho- and microfacies types such as micritic limestone.

4.3. Tackling the Curse of High Dimensionality

We show that the classification performance of statistical learning is sensitive to the “curse of high dimensionality”; i.e., it will be worse if there are more variables than samples, compared to if the number of samples largely surpasses the number of variables (e.g., [9,51]). Many classification methods perform poorly on high-dimensional datasets due to data sparsity, resulting in a loss of effectiveness. Ideally, this can be mitigated by largely increasing the number of samples in the training dataset. However, the budget often prohibits this mitigation because chemical analyses are expensive. So, a possibility remains to reduce the number of variables. This does not mean that less information about the samples should be input in the analyses, e.g., that the content of a smaller number of elements should be analysed. It is always better to input more information. If variables are correlated, which is typical for compositional data [41], the number of variables can be reduced. We demonstrate that three different approaches lead to improvements in classification performance: replacing variables with principal components, selecting a lower number of variables that were proven useful in the exploratory analysis, and using only isotopic data for the analysis. There was geological evidence suggesting that isotopes vary systematically across sedimentological strata [12,38,39], which supported the last choice. However, in the lack of such information, we strongly recommend reducing the number of variables by replacing them with their PCs. This will transform a large number of correlated variables into a small number of orthogonal variables, which are more suitable for training the model, while retaining almost all the variation in the data. Another approach to addressing the problem would be to increase the sample size by utilising additional publicly available data. Data sharing in public repositories in the future will largely improve the possibility of this mitigation.
Statistical models can also give false results. For example, if there are low sample sizes for each class, variations in certain variables for some classes may not be well represented in the training dataset. If the variation is consequently too small, a false appearance of separation of classes in these variables will be created. This will lead to a model that classifies based on differences that do not exist in reality and produces false provenance assignments. This is why statistical learning requires large sample sizes for training the models [9,50].

4.4. Strontium Isotope Ratio Is Important for Provenance Classification

Several statistical learning methods can quantify the importance of different variables for classification. In our dataset, the Sr isotope ratio, CaO, LOI, ratio of U to other rare elements, and redox indicators played the most important role in training the model from geological samples. However, this does not mean that they were all also useful in the classification of stone products. Stone products have undergone different processes since their manufacture and have been exposed to different conditions compared to geological samples. The analysis of decision trees showed that Sr isotopes were both useful in model training and subsequent classification, whereas the log CaO/LOI ratio was only useful in the former. This underpins the growing recognition of strontium isotopes as powerful indicators of provenance [26,52,53,54]. The effectiveness of strontium isotopes demonstrates their resistance to alteration during weathering and diagenetic processes [1,55], which makes them particularly valuable for identifying the provenance of limestone in an archaeological setting. We recommend integrating Sr isotope data with traditional geochemical parameters in archaeological studies of limestone provenance, as it provides improved discriminatory power. In other geological settings, such as different carbonate platforms [54], the Sr isotope ratio is expected to remain one of the most important classifiers because it has proven to be an accurate global geochronological correlation tool [38]. However, if multiple quarries are located at the same stratigraphic level, or if the oscillating global strontium curves have similar values, the usefulness of the 87Sr/86Sr may decrease.

4.5. The Impact of Sedimentary Environment on the Classifications of Provenance

The general stratigraphic succession from the Triassic–Jurassic boundary to the Middle Jurassic indicates a gradual deepening of the sedimentary environment driven by synsedimentary tectonics and a relative rise in sea levels [56,57,58,59,60,61]. This results in three general environments, which were also apparent in our statistical classification results (both correct and incorrect). In 7 out of 15 stone products examined, expert provenance identification was not possible, and the majority of statistical classifications did not match (Table 4). We will take a closer look at these data below and revise provenance identification by an expert, if additional evidence supports such a revision.
Formation 1 (Members 1.1: Podutik Quarry and 1.2: Staje Quarry) represents the lowermost part of the Lower Jurassic succession. Sedimentation in the intertidal zone, with frequent short-term subaerial exposures, is presumed based on sedimentological analysis [12]. As Members 1.1 and 1.2 statistically cluster together in SiO2, Al2O3, and Fe2O3, this indicates the influence of subaerial exposure [62,63]. Both members exhibit geochemical conditions consistent with those of mineralogically pure limestones [62]. Their distinction is based on isotopic analyses (mainly strontium isotopes), which show globally distinctive values from the Hettangian to the middle Pliensbachian [38,39,64]. The confusion between Member 1.2 and 1.1 was greatest for stone products categorised by the expert as Member 1.2. This shows their geochemical similarity. However, it is important to note that, according to our results, none of the stone products originated from Member 1.1, despite our training of the classifiers for this possibility. Furthermore, no stone products from 1.2 were classified as 1.1 by the majority of methods (Table 2 and Table 3). This demonstrates that aggregating the results of multiple models yields more robust classifications than any single model.
Gale and Rožič [65] described breccias indicative of a diffuse rifting phase associated with the opening of the Alpine Tethys Ocean [66], which subsequently led to a gradual change in the sedimentary environment. Formation 2 (fossiliferous limestone) is characterised by frequent subaerial exposure horizons, marked with red clay, darker limestone colouration, and increased bioclastic content. Gale and Kelemen [23] interpret this as a transition from peritidal to subtidal lagoonal settings, bordered by ooid shoals. This transition is attributed to a tectonically driven transgression [65], with a minor contribution from global sea level rise [67]. Subaerially exposed surfaces are widespread in the Pliensbachian. Discontinuity surfaces, which are abundant in Formation 2, reflect breaks in sedimentation. These promote the formation of clay minerals [68]. This can be observed in Members 2.1 and especially 2.2. Isotopic (e.g., elevated δ13C) and geochemical data from 2.2 indicate short-lived redox conditions supported by elevated cerium values indicative of redox environments during sedimentation or early diagenesis [69]. Among all possible members, statistical learning methods had the most problems classifying samples that were originally identified as 2.1. They were assigned to 2.2 and 3.3 almost as often as to 2.1. This may be due to the unnecessary division of Members 2.1 and 2.2, which is based solely on evolutionary changes in the biota (Foraminifera) and the presence of lithiotide bivalves in Member 2.2. However, these confusions are not of great importance, as Members 2.1 and 2.2 frequently occur together, as is also known for a Roman-period quarry in Podpeč [19,70]. Therefore, the stone products classified as 2.1 by an expert were reclassified into the category proposed by the majority of statistical models (see Table 4). Specifically, the stone products IK2, IV27, and IV3 were reclassified. The misclassification of stone product IV35 as Member 1.2 by the majority of models contrasts with the results obtained through strontium isotope stratigraphy (see Supplement S3), as previously demonstrated [12], which clearly indicate provenance from Member 2.1.
During the Late Pliensbachian to Early Toarcian, the main rifting phase of the Alpine Tethys reactivated extensional normal faults on the Adriatic Carbonate Platform [61], likely altering the depositional environment. This is reflected regionally in the deposition of breccias [65] and the formation of small depressions (interplatform basins) with an open marine influence [26]. Strata corresponding to Formation 3 of crinoidal limestone record regional [26,58,66,70] and global [70,71,72,73,74,75,76,77] carbon cycle excursions associated with the Toarcian Oceanic Anoxic Event (T-OAE). This event is globally associated with laminated, organic-rich black shales and a pronounced negative carbon isotope excursion (CIE) in the early Toarcian. The CIE is less pronounced in shallower areas [77]. The dark colouration in Member 3.3 is due to framboidal pyrite, which is indicative of low-oxygen conditions [26,78]. Elevated cerium values, on the other hand, are indicative of prolonged redox conditions. Together with systematically high δ13C values, these features form a unique geochemical fingerprint for provenance determination, indicating sedimentation in a redox environment [69,71,79]. The most common error was the classification of the three stone products (IV1, IV13, and IV18) as Member 3.3 by the majority of models. Examining the geochemical data (see Supplement S1.2 and S1.3), it appears that the statistical methods considered redox conditions as indicative of Member 3.3. However, short-term redox conditions can also be recognised in Members 2.1–2.2. Thus, based on the paleontological data, the expert-provenance identification is maintained. In addition, it is worth noting that Member 3.3 was recognised as such by 91.7% of models, demonstrating its distinct geochemical signature.
For stone products IK2, IV27, and IV3, a high majority of statistical models agreed on classification, which provided strong support for these provenance assignments. For stone products IV1, IV35, IV13, and IV18, the models were less unanimous, and the sedimentological and isotopic data contradicted their weak majority. By aggregating classifications of statistical methods and evaluating their agreement, as well as comparing them to additional data, we were able to improve the classification of the provenance of the investigated stone products (Table 5).
Although not explored in detail in this study, the results also offer valuable insights for reconstructing ancient quarrying practices and distribution networks during the Roman period in the area. The statistical confirmation of stone products provenance from known local quarries—such as Member 1.2 from the Staje quarry, Member 3.3 from the Podpeč quarries, and Members 2.1 and 2.2 from Ig or Podpeč quarries—is consistent with broader Roman stone use patterns where local supply is predominant due to high transport costs [27].
The integration of geological and analytical expertise demonstrated in this study provides a model for future interdisciplinary approaches to studying limestone provenance in archaeological settings.

5. Conclusions

This study demonstrated that applying statistical learning methods improves provenance determination of stone products. The support vector machine (SVM) computed on principal components achieved a provenance classification accuracy of 87% after correction and SVM on isotopic data achieved 73% accuracy. These results significantly outperform both traditional petrological and statistical methods for identifying the origin of micritic limestone. Aggregating results from multiple statistical models and assessing their agreement proved more reliable than relying on single-model outputs. This aggregation also served as a quality control mechanism, highlighting discrepancies between expert and statistical classifications and enabling targeted re-evaluation of ambiguous samples. Notably, the 87Sr/86Sr isotope ratio emerged as a powerful indicator, with geochemical data providing valuable differentiation for classification. This study established a robust methodological framework that integrates geological and analytical expertise, offering a reliable interdisciplinary approach for determining limestone provenance in archaeological contexts.

Supplementary Materials

The following supporting information can be downloaded at: https://www.mdpi.com/article/10.3390/heritage8110464/s1, Supplement S1.1: R code for the data analysis. Supplement S1.2: Training dataset. Supplement S1.3: Clasification dataset. Supplement S2: Additional results of statistical analysis: Table S2.1: Results of Kruskal–Wallis rank sum test for geochemical and isotopic variables.; Table S2.2: Expert determinations and classifications by all statistical learning models for each stone product; Figure S2.1: Ternary scatter plots of major oxide composition of the training data—geochemical samples (CaO and LOI were excluded due to their high values, which would have caused data points to accumulate on the edges); Figure S2.2: Scatter plots of rare earths and trace elements above detection limit in the training data—geochemical samples; Figure S2.3: Ternary scatter plot of subcomposition of three oxides (K2O, Fe2O3 and Na2O) illustrates a large overlap among stratigraphic members as present in many variables. Supplement S3: Strontium isotope stratigraphy analysis: Table S3.1: Locations of studied Lower Jurassic succession, their lithostratigraphic positioning and biostratigraphic age; Table S3.2: Calculated age of stone products based on 86Sr/87Sr measurement; Figure S3.1: δ13Ccarb and δ18Ocarb measurements of studied stone products plotted on a scatter plot. The samples are arranged according to lithofacies type (Figure S3.2). The global LOWESS curve from McArthur et al. (2012, 2016) [38,39] is shown, with placements of the analysed Lower Jurassic stone products indicated according to strontium isotope measurements. Each Sr measurement shows the standard deviation of the measurement on the x-axis and the calculated confidence in the measurement on the y-axis; Figure S3.3: Graphical representation of 87Sr/86Sr measurements using SIS methodology with a comparison of global and local LOWESS curves for section P1 with placement of the analysed stone products with 87Sr/86Sr in the LOWESS local curves of the Podutik 1 sedimentological profile. The crosses show the individual measurement (on the x-axis, the calculated confidence in the mean of the measurement, and on the y-axis, the standard deviation); Figure S3.4: Graphical representation of 87Sr/86Sr measurements using SIS methodology with a comparison of global and local LOWESS curves for section Staje quarry. The crosses show the individual measurement (on the x-axis, the calculated confidence in the mean of the measurement, and on the y-axis the standard deviation) with placement of the analysed stone products with 87Sr/86Sr in the LOWESS local curves of the Staje quarry sedimentological section; Figure S3.5: Comparison of global and local LOWESS Strontium curves for units 2.1 and 2.2. Each 87Sr/86Sr measurement shows the standard deviation of the measurement on the x-axis and the calculated confidence in the measurement on the y-axis. The figure is supplemented with the placement of the analysed stone products with 87Sr/86Sr in the LOWESS local curves of the Ig sedimentological section, Podpeč Roman time quarry, and Podpeč modern quarry.

Author Contributions

Both authors contributed equally to this study. Conceptualisation, R.B. and K.K.; methodology, R.B. and K.K.; software, K.K.; validation, R.B. and K.K.; formal Analysis, R.B. and K.K.; investigation, R.B. and K.K.; resources, R.B. and K.K.; data curation, R.B. and K.K.; writing—original draft preparation, R.B. and K.K.; writing—review and editing, R.B. and K.K.; visualisation, R.B. and K.K.; project administration, R.B. and K.K.; funding acquisition, R.B. All authors have read and agreed to the published version of the manuscript.

Funding

This study was co-financed by the Slovenian Research and Innovation Agency (project no. P1-0025), the Slovenian National Commission for UNESCO (SNUK), and the IGCP/IGGG projects IGCP 637—Heritage Stone Designation and IGCP 710—Western Tethys meets Eastern Tethys—geodynamical, palaeoceanographical and palaeobiogeographical events.

Data Availability Statement

The original data presented in this study is openly available in the Digital Repository of Slovenian Research Organisations at http://hdl.handle.net/20.500.12556/DiRROS-22946 (accessed on 14 August 2025) and described in the data article https://doi.org/10.5474/geologija.2025.005 (accessed on 14 August 2025).

Acknowledgments

For granting permission to sample stone products kept in the church of St. Mihael, we thank Boris Vičič (Institute for the Protection of Cultural Heritage—Ljubljana Regional Office), curator Bernarda Županek (Museum and Galleries of Ljubljana) and parish priest Janez Avsenik (Parish of Ig). For granting permission to sample stone products from the archaeological site Ig roundabout, we thank Ana Kovačič.

Conflicts of Interest

Author Klemen Koselj was employed by the company Biobit s.p. The remaining author declares that the research was conducted in the absence of any commercial or financial relationships that could be construed as a potential conflict of interest.

References

  1. Flügel, E. Microfacies of Carbonate Rocks: Analysis, Interpretation and Application; Springer: Berlin, Germany, 2004. [Google Scholar]
  2. Brilli, M.; Antonelli, F.; Giustini, F.; Lazzarini, L.; Pensabene, P. Black limestones used in antiquity: The petrographic, isotopic and EPR database for provenance determination. J. Archaeol. Sci. 2010, 37, 994–1005. [Google Scholar] [CrossRef]
  3. Dilaria, S.; Bonetto, J.; Germinario, L.; Previato, C.; Girotto, C.; Mazzoli, C. The Stone Artifacts of the National Archaeological Museum of Adria (Rovigo, Italy): A Noteworthy Example of Heterogeneity. Archaeol. Anthropol. Sci. 2024, 16, 14. [Google Scholar] [CrossRef]
  4. Boulvain, F.; Poulain, G.; Tourneur, F.; Yans, J. Potential discrimination of Belgian black marbles using petrography, magnetic susceptibility and geochemistry. Archaeometry 2020, 62, 469–492. [Google Scholar] [CrossRef]
  5. Higgins, J.A.; Blättler, C.L.; Lundstrom, E.A.; Santiago-Ramos, D.P.; Akhtar, A.A.; Crüger Ahm, A.-S.; Bialik, O.; Holmden, C.; Bradbury, H.; Murray, S.T.; et al. Mineralogy, early marine diagenesis, and the chemistry of shallow-water carbonate sediments. Geochim. Cosmochim. Acta 2018, 220, 512–534. [Google Scholar] [CrossRef]
  6. Flügel, E.; Flügel, C. Applied microfacies analysis: Provenance studies of Roman mosaic stones. Facies 1997, 37, 1–48. [Google Scholar] [CrossRef]
  7. Flügel, E. Microfacies-based provenance analysis of Roman imperial mosaic and sculpture materials from Bavaria (Southern Germany). Facies 1999, 41, 197–208. [Google Scholar] [CrossRef]
  8. Miletić, S.; Šmuc, A.; Dolenec, M.; Miler, M.; Mladenovič, A.; Gutman Levstik, M.; Dolenec, S. Identification and provenance determination of stone tesserae used in mosaics from Roman Celeia, Slovenia. Archaeometry 2022, 64, 561–577. [Google Scholar] [CrossRef]
  9. Hastie, T.; Tibshirani, R.; Friedman, J. The Elements of Statistical Learning: Data Mining, Inference, and Prediction, 2nd ed.; Springer: New York, NY, USA, 2017; Available online: https://hastie.su.domains/ElemStatLearn (accessed on 14 August 2025).
  10. Dornan, T.; O’Sullivan, G.; O’Riain, N.; Stueeken, E.; Goodhue, R. The application of machine learning methods to aggregate geochemistry predicts quarry source location: An example from Ireland. Comput. Geosci. 2020, 140, 104495. [Google Scholar] [CrossRef]
  11. Hänsel, P.; Oehrl, S.; Ideström, L.; Widerström, P.; Reddin, C.J.; Munnecke, A. Stable carbon and oxygen isotope geochemistry as provenance indicator for the picture stones on Gotland (Sweden). GFF 2023, 144, 220–239. [Google Scholar] [CrossRef]
  12. Brajkovič, R.; Žvab Rožič, P.; Gale, L. Database for provenance determination of Roman-time stone products from Ig area. Geologija 2025, 68. [Google Scholar] [CrossRef]
  13. Šašel, J. Prispevki za zgodovino rimskega Iga. Kronika 1959, 7, 117–123. [Google Scholar]
  14. Grahek, L.; Ragolič, A. Ig. In Manjša Rimska Naselja na Slovenskem Prostoru; Horvat, J., Lazar, I., Gaspari, A., Eds.; Založba ZRC: Ljubljana, Slovenia, 2020; pp. 173–186. Available online: https://omp.zrc-sazu.si/zalozba/catalog/view/1890/7848/1025-2 (accessed on 14 August 2025).
  15. Lozić, E. Rimski Lapidarij v Iški Vasi v Kontekstu Krajinskega Parka Barje. Ph.D. Thesis, Univerza v Ljubljani, Filozofska Fakulteta, Oddelek za Arheologijo, Ljubljana, Slovenia, 2008. [Google Scholar]
  16. Lozić, E. Roman stonemasonry workshops in the Ig area. Arheol. Vestn. 2009, 60, 207–221. Available online: http://www.dlib.si/details/URN:NBN:SI:DOC-DYJSFIKD (accessed on 14 August 2025).
  17. Žvab Rožič, P.; Gale, L.; Rožič, B. Analiza kamnin rimskih nagrobnih stel iz Podkraja in z Iga = Rock analysis of Roman tombstones from Podkraj and Ig near Ljubljana. Arheol. Vestn. 2016, 67, 359–369. Available online: http://www.dlib.si/details/URN:NBN:SI:doc-FQSHAUMU (accessed on 14 August 2025).
  18. Žvab Rožič, P.; Rožič, B.; Gale, L.; Brajkovič, R. Provenance analysis of Roman limestone artefacts from Colonia Iulia Emona (Marof archaeological site, Slovenia). Archaeometry 2022, 64, 1057–1078. [Google Scholar] [CrossRef]
  19. Djurić, B.; Gale, L.; Brajkovič, R. Kamnolom apnenca v Podpeči pri Ljubljani in njegovi izdelki = Limestone quarry at Podpeč near Ljubljana (Slovenia) and its products. Arheol. Vestn. 2022, 73, 155–198. [Google Scholar] [CrossRef]
  20. Dozet, S.; Strohmenger, C. Podbukovška formacija, osrednja Slovenija = Podbukovje Formation, Central Slovenia. Geologija 2000, 43, 197–212. Available online: http://www.dlib.si/details/URN:NBN:SI:DOC-P4PUQFDH (accessed on 14 August 2025). [CrossRef]
  21. Novak, M. Upper Triassic and Lower Jurassic beds in the Podutik area near Ljubljana (Slovenia). Geologija 2003, 46, 65–74. [Google Scholar] [CrossRef]
  22. Ramovš, A. Gliničan od Emone do Danes; Odsek za Geologijo, Fakulteta za Naravoslovje in Tehnologijo, Inštitut za Geologijo, VTOZD Montanistika: Ljubljana, Slovenia, 1990. [Google Scholar]
  23. Gale, L.; Kelemen, M. Early Jurassic foraminiferal assemblages in platform carbonates of Mt. Krim, central Slovenia. Geologija 2017, 60, 99–115. [Google Scholar] [CrossRef]
  24. Buser, S.; Debeljak, I. Lithiotid Bivalves in Slovenia and Their Mode of Life. Geologija 1997, 40, 11–64. [Google Scholar] [CrossRef]
  25. Gale, L.; Brajkovič, R.; Košir, A. Foraminiferal assemblages from the Toarcian (Lower Jurassic) ‘Spotted limestone’ of the northern Adriatic Carbonate Platform. Palaeogeogr. Palaeoclimatol. Palaeoecol. 2025, 667, 112841. [Google Scholar] [CrossRef]
  26. Brajkovič, R.; Žvab Rožič, P.; Djurić, B.; Luka Gale, L. Stratigraphic Database for Determination of the Provenance of Limestone Used in Colonia Iulia Emona (Regio X, Italia). In Proceedings of the ASMOSIA XIII: 13th International Conference of the Association for the Study of Marble and Other Stones in Antiquity, Vienna, Austria, 19–24 September 2022; Ladstätter, S., Prochaska, W., Anevlavi, V., Eds.; Holzhausen Verlag: Vienna, Austria, 2025; pp. 27–41. [Google Scholar]
  27. Russell, B. Gazetteer of Stone Quarries in the Roman World. Available online: http://oxrep.classics.ox.ac.uk/docs/Stone_Quarries_Database.pdf (accessed on 14 August 2025).
  28. Tarolli, P. High-resolution topography for understanding Earth surface processes: Opportunities and challenges. Geomorphology 2014, 216, 295–312. [Google Scholar] [CrossRef]
  29. Compton, R.R. Geology in the Field; Wiley: New York, NY, USA, 1985. [Google Scholar]
  30. Munsell Color. Geological Rock-Color Charts with Genuine Munsell Color Chips; Munsell Color: Baltimore, MD, USA, 2011. [Google Scholar]
  31. Lokier, S.W.; Al Junaibi, M. The petrographic description of carbonate facies: Are we all speaking the same language? Sedimentology 2016, 63, 1843–1885. [Google Scholar] [CrossRef]
  32. Sibley, D.F.; Gregg, J.M. Classification of dolomite rock textures. J. Sediment. Petrol. 1987, 57, 967–975. [Google Scholar] [CrossRef]
  33. Fugagnoli, A.; Loriga Broglio, C. Revised biostratigraphy of Lower Jurassic shallow water carbonates from the Venetian Prealps (Calcari Grigi, Trento Platform, Northern Italy). Stud. Trent. Sci. Nat. Acta Geol. 1998, 73, 35–73. [Google Scholar]
  34. Fugagnoli, A. Trophic regimes of benthic foraminiferal assemblages in Lower Jurassic shallow water carbonates from northeastern Italy (Calcari Grigi, Trento Platform, Venetian Prealps). Palaeogeogr. Palaeoclimatol. Palaeoecol. 2004, 205, 111–130. [Google Scholar] [CrossRef]
  35. Gale, L.; Barattolo, F.; Rettori, R. Morphometric approach to determination of lower Jurassic siphovalvulinid foraminifera. Riv. Ital. Paleontol. Stratigr. 2018, 124, 265–282. [Google Scholar] [CrossRef]
  36. Romaniello, S.J.; Field, M.P.; Smith, H.B.; Gordon, G.W.; Kim, M.H.; Anbar, A.D. Fully automated chromatographic purification of Sr and Ca for isotopic analysis. J. Anal. At. Spectrom. 2015, 30, 1906–1912. [Google Scholar] [CrossRef]
  37. Weis, D.; Kieffer, B.; Maerschalk, C.; Barling, J.; de Jong, J.; Williams, G.A.; Hanano, D.; Pretorius, W.; Mattielli, N.; Scoates, J.S.; et al. High-precision isotopic characterization of USGS reference materials by TIMS and MC-ICP-MS. Geochem. Geophys. Geosyst. 2006, 7, 1–30. [Google Scholar] [CrossRef]
  38. McArthur, J.M.; Howarth, R.J.; Shields, G.A. Strontium isotope stratigraphy. In A Geologic Time Scale; Gradstein, F.M., Ogg, J.G., Schmitz, M.D., Ogg, G.M., Eds.; Elsevier: Amsterdam, The Netherlands, 2012; pp. 127–144. [Google Scholar] [CrossRef]
  39. McArthur, J.M.; Steuber, T.; Page, K.N.; Landman, N.H. Sr-Isotope Stratigraphy: Assigning Time in the Campanian, Pliensbachian, Toarcian, and Valanginian. J. Geol. 2016, 124, 569–586. [Google Scholar] [CrossRef]
  40. R Core Team. R: A Language and Environment for Statistical Computing; R Foundation for Statistical Computing: Vienna, Austria, 2024; Available online: https://www.R-project.org/ (accessed on 14 August 2025).
  41. van den Boogaart, K.G.; Tolosana-Delgado, R. Analyzing Compositional Data with R, 1st ed.; Springer: Berlin, Germany, 2013. [Google Scholar] [CrossRef]
  42. Bacon-Shone, J. A short history of compositional data analysis. In Compositional Data Analysis: Theory and Applications; Pawlowsky-Glahn, V., Buccianti, A., Eds.; John Wiley & Sons: Chichester, UK, 2011; pp. 3–11. [Google Scholar] [CrossRef]
  43. van den Boogaart, K.G.; Tolosana-Delgado, R.; Bren, M. Compositions: Compositional Data Analysis (Version 2.0-8) [R package]; CRAN: Chicago, IL, USA, 2025; Available online: https://CRAN.R-project.org/package=compositions (accessed on 14 August 2025).
  44. Tolosana-Delgado, R.; Talebi, H.; Khodadadzadeh, M.; van den Boogaart, K.G. On machine learning algorithms and compositional data. In Proceedings of the 8th International Workshop on Compositional Data Analysis (CoDaWork2019), Terrassa, Spain, 3–8 June 2019; Egozcue, J.J., Graffelman, J., Ortego Martínez, M.I., Eds.; Universitat Politècnica de Catalunya: Barcelona, Spain, 2019; pp. 172–175. Available online: https://hdl.handle.net/2117/167357 (accessed on 14 August 2025).
  45. Venables, W.N.; Ripley, B.D. Modern Applied Statistics with S, 4th ed.; Springer: New York, NY, USA, 2002. [Google Scholar]
  46. Therneau, T.; Atkinson, B. Rpart: Recursive Partitioning and Regression Trees (Version 4.1-23) [R Package]. Available online: https://CRAN.R-project.org/package=rpart (accessed on 14 August 2025).
  47. Liaw, A.; Wiener, M. Classification and regression by randomForest. R News 2002, 2, 18–22. [Google Scholar]
  48. Meyer, D.; Dimitriadou, E.; Hornik, K.; Weingessel, A.; Leisch, F.; Chang, C.-C.; Lin, C.-C. e1071: Misc Functions of the Department of Statistics, Probability Theory Group (Formerly: E1071), TU Wien (Version 1.7-16) [R Package]. Available online: https://CRAN.R-project.org/package=e1071 (accessed on 14 August 2025).
  49. Legendre, P.; Legendre, L. Numerical Ecology, 3rd ed.; Elsevier: Amsterdam, The Netherlands, 2012. [Google Scholar] [CrossRef]
  50. James, G.; Witten, D.; Hastie, T.; Tibshirani, R. An Introduction to Statistical Learning: With Applications in R, 2nd ed.; Springer: New York, NY, USA, 2021. [Google Scholar] [CrossRef]
  51. Guilhaumon, C.; Hascoët, N.; Chinesta, F.; Lavarde, M.; Daim, F. Data augmentation for regression machine learning problems in high dimensions. Computation 2024, 12, 24. [Google Scholar] [CrossRef]
  52. Galán, E.; Carretero, M.I.; Mayoral, E. A methodology for locating the original quarries used for constructing historical buildings: Application to Málaga Cathedral, Spain. Eng. Geol. 1999, 54, 287–298. [Google Scholar] [CrossRef]
  53. Maritan, L.; Mazzoli, C.; Melis, E. A multidisciplinary approach to the characterization of Roman gravestones from Aquileia (Udine, Italy). Archaeometry 2003, 45, 363–374. [Google Scholar] [CrossRef]
  54. Gilli, A.; Hodell, D.A.; Kamenov, G.D.; Brenner, M. Geological and archaeological implications of strontium isotope analysis of exposed bedrock in the Chicxulub crater basin, northwestern Yucatán, Mexico. Geology 2009, 37, 723–726. [Google Scholar] [CrossRef]
  55. Marshall, J.D. Climatic and oceanographic isotopic signals from the carbonate rock record and their preservation. Geol. Mag. 1992, 129, 143–160. [Google Scholar] [CrossRef]
  56. Črne, A.E.; Goričan, Š. The Dinaric Carbonate Platform margin in the Early Jurassic: A comparison between successions in Slovenia and Montenegro. Boll. Soc. Geol. Ital. 2008, 127, 389–405. [Google Scholar]
  57. Dragičević, I.; Velić, I. The northeastern margin of the Adriatic carbonate platform. Geol. Croat. 2002, 55, 185–232. [Google Scholar] [CrossRef]
  58. Ettinger, N.P.; Larson, T.E.; Kerans, C.; Thibodeau, A.M.; Hattori, K.E.; Kacur, S.M.; Martindale, R.C. Oceanic acidification and photic-zone anoxia at the Toarcian Oceanic Anoxic Event: Insights from the Adriatic Carbonate Platform. Sedimentology 2021, 68, 63–107. [Google Scholar] [CrossRef]
  59. Martinuš, M.; Bucković, D. Lithofacies, biostratigraphy and discontinuity surfaces recorded in deposits across the Pliensbachian–Toarcian transition (Lower Jurassic) in southern Lika and Velebit Mt. (Croatia). In Abstract Book, Proceedings of the 5th Croatian Geological Congress, Osijek, Croatia, 23–25 September 2015; Horvat, M., Wacha, L., Eds.; Croatian Geological Survey: Zagreb, Croatia, 2015; pp. 162–163. [Google Scholar]
  60. Rožič, B.; Gerčar, D.; Oprčkal, P.; Švara, A.; Turnšek, D.; Kolar-Jurkovšek, T.; Udovč, J.; Kunst, L.; Fabjan, T.; Popit, T.; et al. Middle Jurassic limestone megabreccia from the southern margin of the Slovenian Basin. Swiss J. Geosci. 2019, 112, 163–180. [Google Scholar] [CrossRef]
  61. Vlahović, I.; Tišljar, T.; Velić, I.; Matičec, D. Evolution of the Adriatic Carbonate Platform: Palaeogeography, main events and depositional dynamics. Palaeogeogr. Palaeoclimatol. Palaeoecol. 2005, 220, 333–360. [Google Scholar] [CrossRef]
  62. Theiling, B.P.; Railsback, L.B.; Holland, S.M.; Crowe, D.E. Heterogeneity in geochemical expression of subaerial exposure in limestones, and its implications for sampling to detect exposure surfaces. J. Sediment. Res. 2007, 77, 159–169. [Google Scholar] [CrossRef]
  63. Scholle, P.A.; Bebout, D.G.; Moore, C.H. (Eds.) Carbonate Depositional Environments; American Association of Petroleum Geologists: Tulsa, OK, USA, 1983; Volume 33. [Google Scholar] [CrossRef]
  64. Allan, J.R.; Matthews, R.K. Isotope signatures associated with early meteoric diagenesis. In Carbonate Diagenesis; Tucker, M.E., Bathurst, R.G.C., Eds.; Wiley: Chichester, UK, 1990; Chapter 16. [Google Scholar] [CrossRef]
  65. Gale, L.; Rožič, B. Signs of crustal extension in Lower Jurassic carbonates from central Slovenia. Geologija 2024, 67, 25–40. [Google Scholar] [CrossRef]
  66. Sabatino, N.; Vlahović, I.; Jenkyns, H.C.; Scopelliti, G.; Neri, R.; Prtoljan, B.; Velić, I. Carbon-isotope record and palaeoenvironmental changes during the early Toarcian oceanic anoxic event in shallow-marine carbonates of the Adriatic Carbonate Platform in Croatia. Geol. Mag. 2013, 150, 1085–1102. [Google Scholar] [CrossRef]
  67. Hallam, A. A review of the broad pattern of Jurassic sea-level changes and their possible causes in the light of current knowledge. Palaeogeogr. Palaeoclimatol. Palaeoecol. 2001, 167, 23–37. [Google Scholar] [CrossRef]
  68. Martinuš, M.; Bucković, D.; Kukoč, D. Discontinuity surfaces recorded in shallow-marine platform carbonates: An example from the Early Jurassic of the Velebit Mt. (Croatia). Facies 2012, 58, 649–669. [Google Scholar] [CrossRef]
  69. Pattan, J.N.; Pearce, N.J.G.; Mislankar, P.G. Constraints in using Cerium-anomaly of bulk sediments as an indicator of paleo bottom water redox environment: A case study from the Central Indian Ocean Basin. Chem. Geol. 2005, 221, 260–278. [Google Scholar] [CrossRef]
  70. Woodfine, R.G.; Jenkyns, H.C.; Sarti, M.; Baroncini, F.; Violante, C. The response of two Tethyan carbonate platforms to the early Toarcian (Jurassic) oceanic anoxic event: Environmental change and differential subsidence. Sedimentology 2008, 55, 1011–1028. [Google Scholar] [CrossRef]
  71. Jenkyns, H.C. The early Toarcian (Jurassic) anoxic event; stratigraphic, sedimentary and geochemical evidence. Am. J. Sci. 1988, 288, 101–151. [Google Scholar] [CrossRef]
  72. Jenkyns, H.C.; Jones, C.E.; Gröcke, D.R.; Hesselbo, S.P.; Parkinson, D.N. Chemostratigraphy of the Jurassic system; applications, limitations and implications for palaeoceanography. J. Geol. Soc. 2002, 159, 351–378. [Google Scholar] [CrossRef]
  73. Suan, G.; Mattioli, E.; Pittet, B.; Lécuyer, C.; Suchéras-Marx, B.; Duarte, L.V.; Philippe, M.; Reggiani, L.; Martineau, F. Secular environmental precursors to Early Toarcian (Jurassic) extreme climate changes. Earth Planet. Sci. Lett. 2010, 290, 448–458. [Google Scholar] [CrossRef]
  74. Hamon, Y.; Merzeraud, G. C and O isotope stratigraphy in shallow-marine carbonate: A tool for sequence stratigraphy (example from the Lodève region, peritethian domain). Swiss J. Geosci. 2007, 100, 71–84. [Google Scholar] [CrossRef]
  75. Brčić, V.; Baranyi, V.; Glumac, B.; Špelić, M.; Fuček, L.; Kukoč, D.; Petrinjak, K.; Mišur, I.; Budić, M.; Palenik, D.; et al. Impact of the Jenkyns Event on Shallow-Marine Carbonates and Coeval Emerged Paleoenvironments: The Plitvice Lakes Region, Croatia. Palaeogeogr. Palaeoclimatol. Palaeoecol. 2024, 655, 112519. [Google Scholar] [CrossRef]
  76. Veizer, J.; Ala, D.; Azmy, K.; Bruckschen, P.; Buhl, D.; Bruhn, F.; Carden, G.A.F.; Diener, A.; Ebneth, S.; Godderis, Y.; et al. 87Sr/86Sr, δ13C and δ18O evolution of Phanerozoic seawater. Chem. Geol. 1999, 161, 59–88. [Google Scholar] [CrossRef]
  77. Gambacorta, G.; Brumsack, H.-J.; Jenkyns, H.C.; Erba, E. The early Toarcian Oceanic Anoxic Event (Jenkyns Event) in the Alpine-Mediterranean Tethys, North African margin, and North European epicontinental seaway. Earth-Sci. Rev. 2024, 248, 104636. [Google Scholar] [CrossRef]
  78. Wignall, P.B.; Newton, R. Pyrite framboid diameter as a measure of oxygen deficiency in ancient mudrocks. Am. J. Sci. 1998, 298, 537–552. [Google Scholar] [CrossRef]
  79. Tostevin, R.; Shields, G.A.; Tarbuck, G.M.; He, T.; Clarkson, M.O.; Wood, R.A. Effective use of cerium anomalies as a redox proxy in carbonate-dominated marine settings. Chem. Geol. 2016, 438, 146–162. [Google Scholar] [CrossRef]
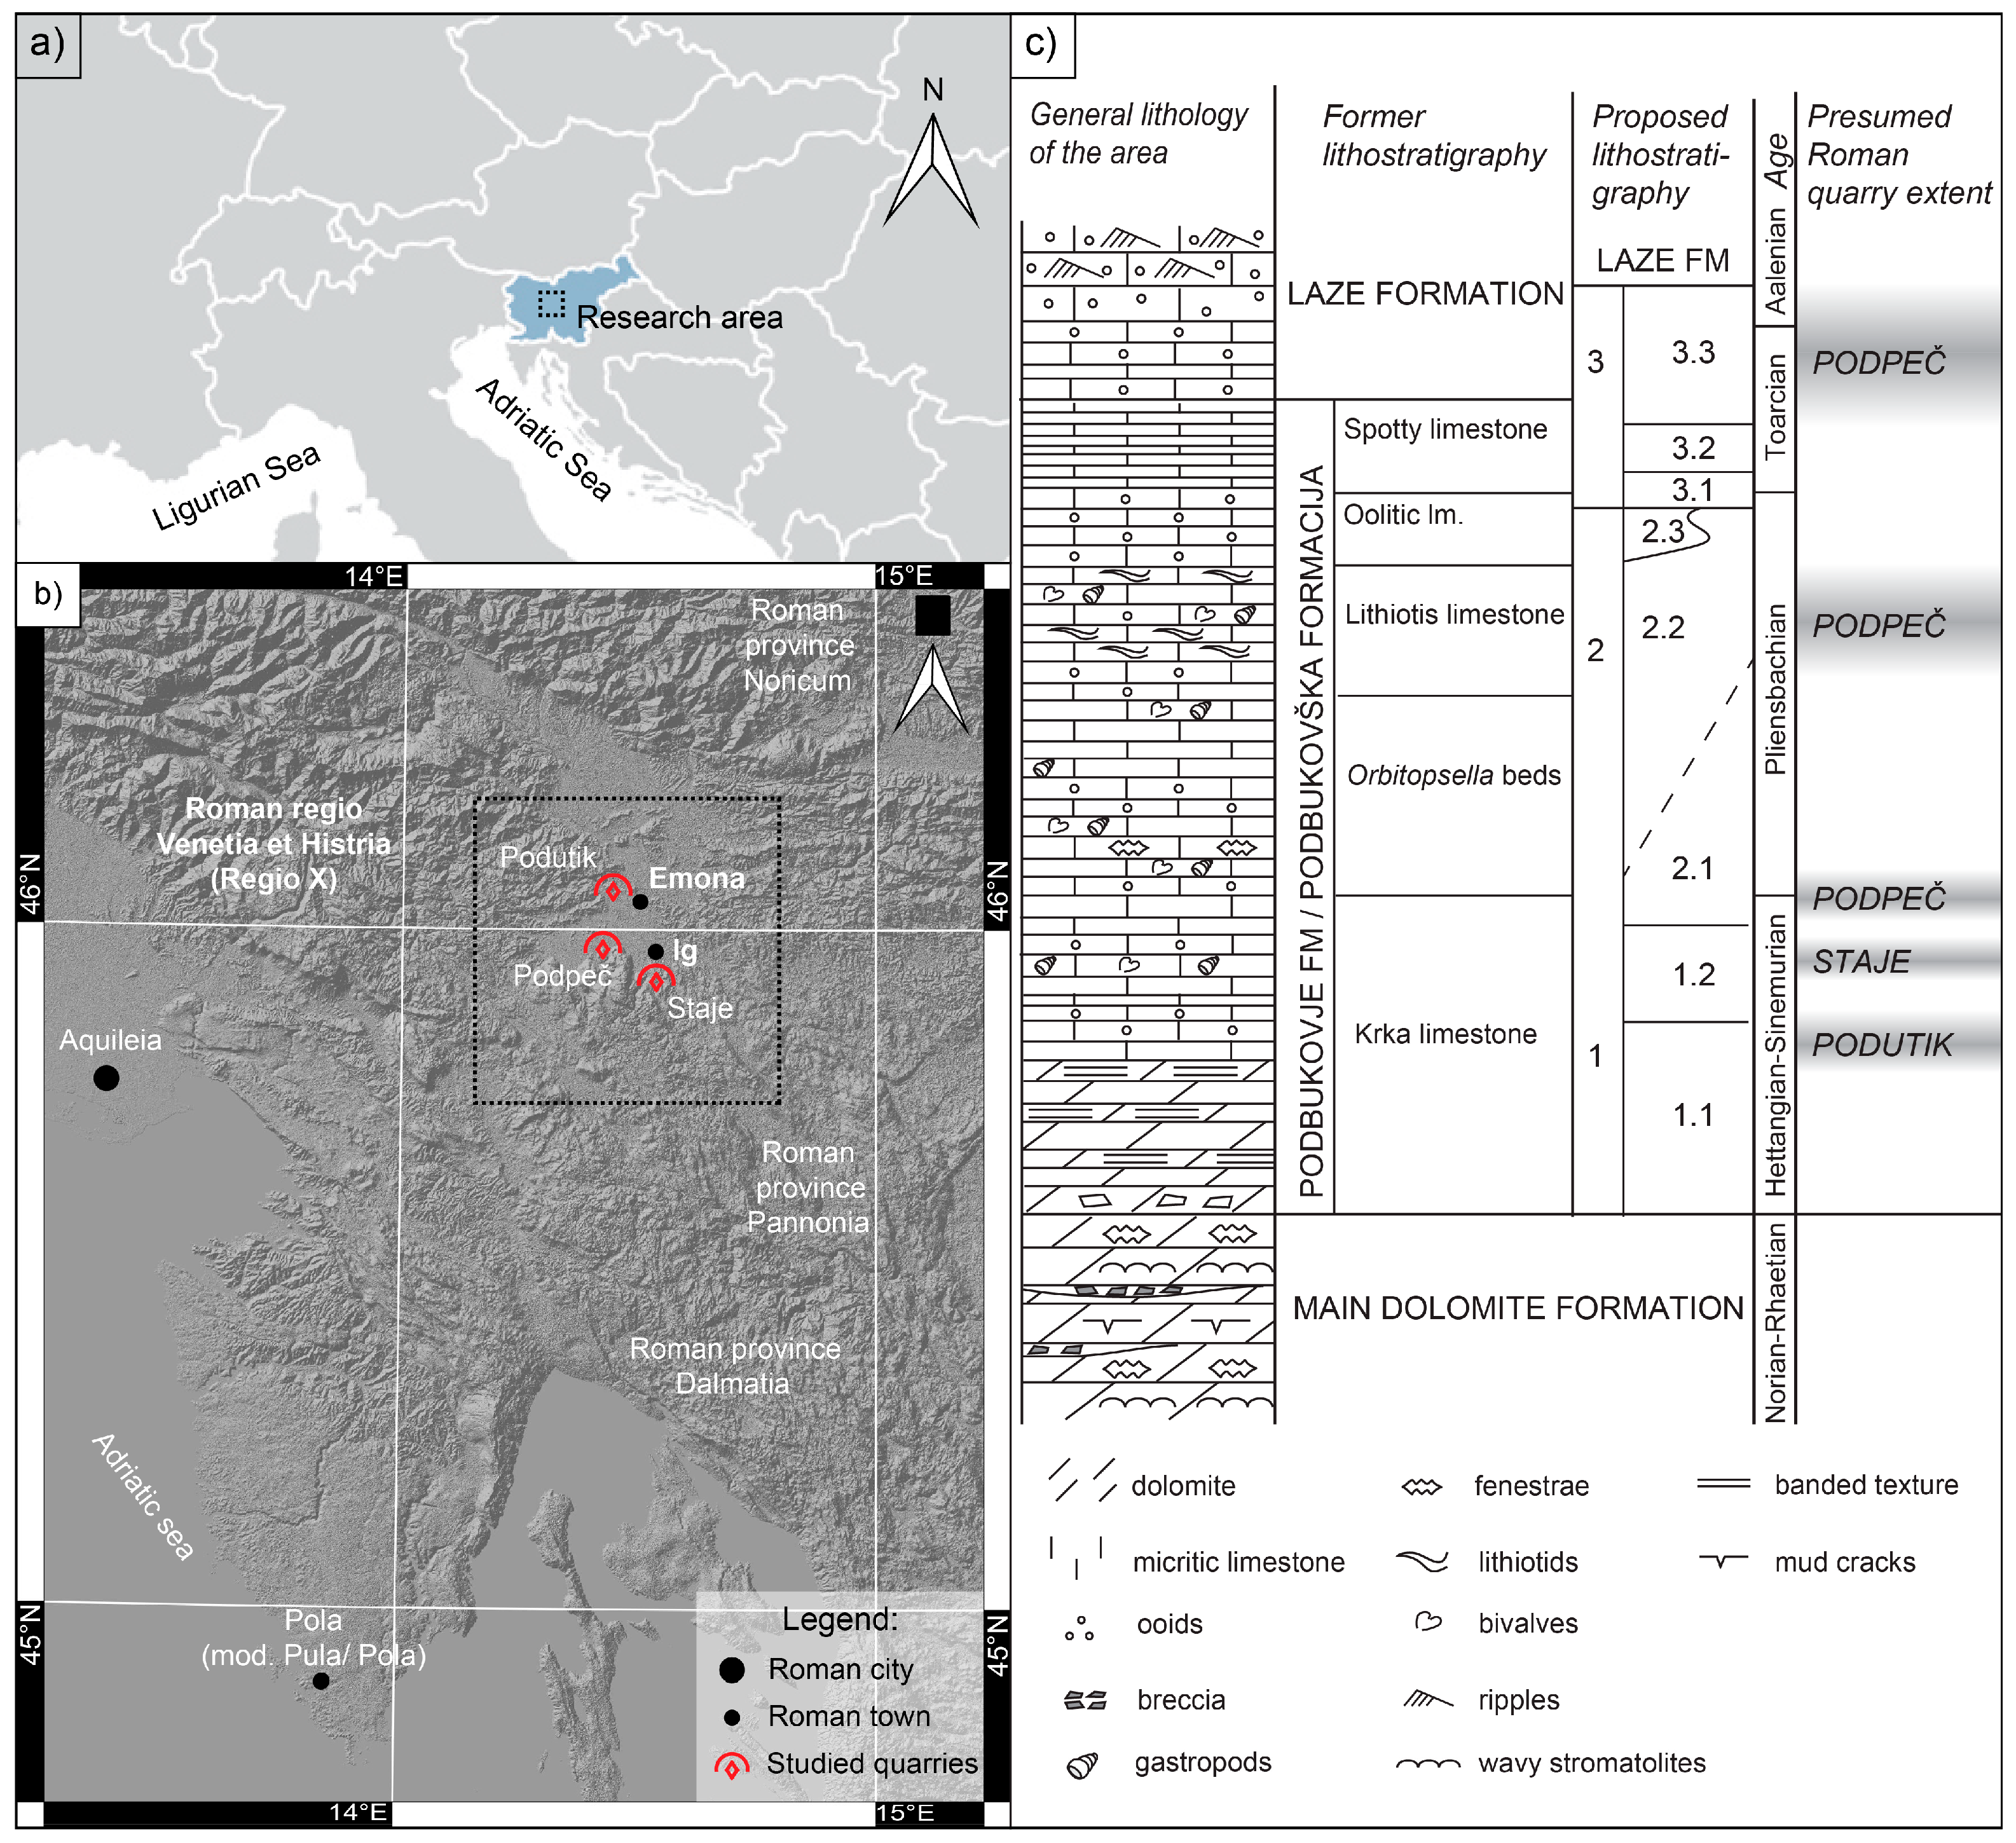
Figure 1. Study area. (a) Geographical position in Europe; (b) study area with the locations of Roman quarries [27] in the surroundings of Ig; and (c) lithostratigraphic division of the area after [12,20,23], with the presumed stratigraphic extent of the known Roman quarries of the after [19].
Heritage 08 00464 g001
Figure 2. Univariate analysis of the geochemical data. (a) p-values of Kruskal–Wallis tests. Red line: p = 0.05; light blue line: p = 0.001; (b) scatter plots of δ18O, δ13C, 87Sr/86Sr. Note that panels on the opposite sides of the main diagonal are mirrored.
Heritage 08 00464 g002
Figure 3. Results of LDA classification of PCs. Test data (stone product samples) and their classification by LDA (shape) and expert (colour) are depicted as symbols. In contrast, the clusters of training data (geological samples) on the first two linear discriminants (LD1 and LD2) are depicted as ellipses that enclose 99% of the data points predicted for each member. Note that LD3 and LD4 are not depicted. Nevertheless, one can see that the position of test data points relative to training data ellipses determines classification by LDA.
Heritage 08 00464 g003
Figure 4. Decision tree computed from the training dataset with pairwise log-ratios of geochemical data and exclusion of log(LOI/CaO) from the model by weighing it. e.g., K2O.CaO denotes log(K2O/CaO). Samples that match the partitioning criterion (written on the nodes) remain in the left branch; others fall on the right branch. Each leaf (final branch) is annotated with the member (class) value that was assigned during training (e.g., 2.1). The numbers below the member annotations represent the counts of samples from training data (upper rows) and test data (lower rows) that were classified as Members 1.1/1.2/2.1/2.2/3.3. The number of samples assigned to the class that is appropriate according to the trained model is underlined. The values of 87Sr/86Sr are z-transformed.
Heritage 08 00464 g004
Figure 5. Most important predictors (variables or their pairs) in the training data (quarry samples) for the RF model computed on pairwise log ratios of geochemical composition data (a) or only on isotope data (b). The variables are ranked according to two metrics of importance for classification. The Mean Decrease Error reflects the impact of each variable on model accuracy, while the Gini index measures its contribution to node purity. Agreement between these two metrics enhances confidence in the importance ranking. LOI/CaO denotes log(LOI/CaO).
Heritage 08 00464 g005
Table 1. Provenance of the studied stone products from the Ig area determined in source lithostratigraphic units. The consecutive numbers of the stone products (IV) are based on the published catalogue [15].
Lithostratigraphic Unit (Age)Possible or Known Roman-Period QuarryInventory Numbers
1.1—Micrite and ooid limestone (J1 1,2)Podutik/
1.2—Peloid limestone (J1 2)StajeIV 39; IV 8
2.1—Bioclastic limestone (J1 2,3)PodpečIV 27; IV 28; IV 12; IV 35; IV 18; IK-2; IV 3
2.2—Lithiotide limestone (J1 3)PodpečIV 13; IV 15; IV 1
3.3—Crinoid limestone (J1 4)PodpečIV 31; IV 38; IV 4
Table 2. Proportions of stone products from each member (determined by an expert) that were classified as each member by the statistical learning methods.
Expert provenance identification as 1.2
Statistical classificationas 1.1as 1.2as 2.1as 2.2as 3.3
0.2290.6670.0420.0630.000
Expert provenance identification 2.1
Statistical classificationas 1.1as 1.2as 2.1as 2.2as 3.3
0.0770.0650.3150.2800.262
Expert provenance identification 2.2
Statistical classificationas 1.1as 1.2as 2.1as 2.2as 3.3
0.0690.0420.1250.4440.319
Expert provenance identification 3.3
Statistical classificationas 1.1as 1.2as 2.1as 2.2as 3.3
0.0140.0000.0000.0690.917
The highest proportions are marked in green.
Table 3. Proportions of classifications to different members by statistical learning models compared to expert identifications for each stone product.
Stone
Product ID
As
Member 1.1
As
Member 1.2
As
Member 2.1
As
Member 2.2
As
Member
3.3
Expert
Identification
Statistical MajorityAgreement
Expert vs.
Statistics
IV38000013.33.3TRUE
IV31000013.33.3TRUE
IV120.040.040.880.0402.12.1TRUE
IV150.0400.040.830.082.22.2TRUE
IV280.0400.790.080.082.12.1TRUE
IV40.04000.210.753.33.3TRUE
IK20.0400.250.7102.12.2FALSE
IV390.290.6700.0401.21.2TRUE
IV80.170.670.080.0801.21.2TRUE
IV270.1300.080.170.632.13.3FALSE
IV30.0400.080.540.332.12.2FALSE
IV130.1300.210.210.462.23.3FALSE
IV180.130.040.040.330.462.13.3FALSE
IV10.040.130.130.290.422.23.3FALSE
IV350.130.380.080.080.332.11.2FALSE
Accepted identifications by the majority of statistical methods are marked in light green, and the maximal proportions of classification for each sample are in green.
Table 4. Revisions of provenance identification after the results of statistical classification.
Stone ProductExpert
Provenance Identification
Classification by Majority of Statistical MethodsKey Evidence Supporting
Classification by
Majority of Statistical Methods
orExpert
Provenance
Identification
IK22.12.2 (73%)Zr and Fe2O3 align with Member 2.2.
IV272.13.3 (64%)Indicative sedimentary grains found upon further examination (e.g., lithoclasts), additionally, δ13C is in the Member 3.3 field (−2.43‰)
IV32.12.2 (59%)δ13C is in Member 2.2 field (–2.13‰);
IV12.23.3 (41%)Foraminiferal assemblage (Meandrovoluta
asiagoensis, Amijiella amiji, Lituosepta recoarensis).
IV352.11.2 (36%)87Sr/86Sr ratio (0.707450) is indicative of member 2.1.
IV132.23.3 (50%)Lithiotide bivalves.
IV182.13.3 (45%)Foraminifera Siphovalvulina variabilis
(Septfontaine).
Light grey rows were revised after statistical classification was considered, whereas for dark grey rows, provenance assignment by classical methods was kept.
Table 5. Final provenance of the studied stone products assigned by classical geological methods [12] and aggregation of statistical models.
Lithostratigraphic Unit (Age)Possible or Known Roman-Period QuarryInventory Numbers
1.1—Micrite and ooid limestone (J1 1,2)Podutik/
1.2—Peloid limestone (J1 2)StajeIV 39; IV 8
2.1—Bioclastic limestone (J1 2,3)PodpečIV 28; IV 12; IV 35; IV 18
2.2—Lithiotide limestone (J1 3)PodpečIV 13; IV 15; IV 1; IV 3; IK-2
3.3—Crinoid limestone (J1 4)PodpečIV 31; IV 38; IV 4; IV 27
Disclaimer/Publisher’s Note: The statements, opinions and data contained in all publications are solely those of the individual author(s) and contributor(s) and not of MDPI and/or the editor(s). MDPI and/or the editor(s) disclaim responsibility for any injury to people or property resulting from any ideas, methods, instructions or products referred to in the content.