1. Introduction
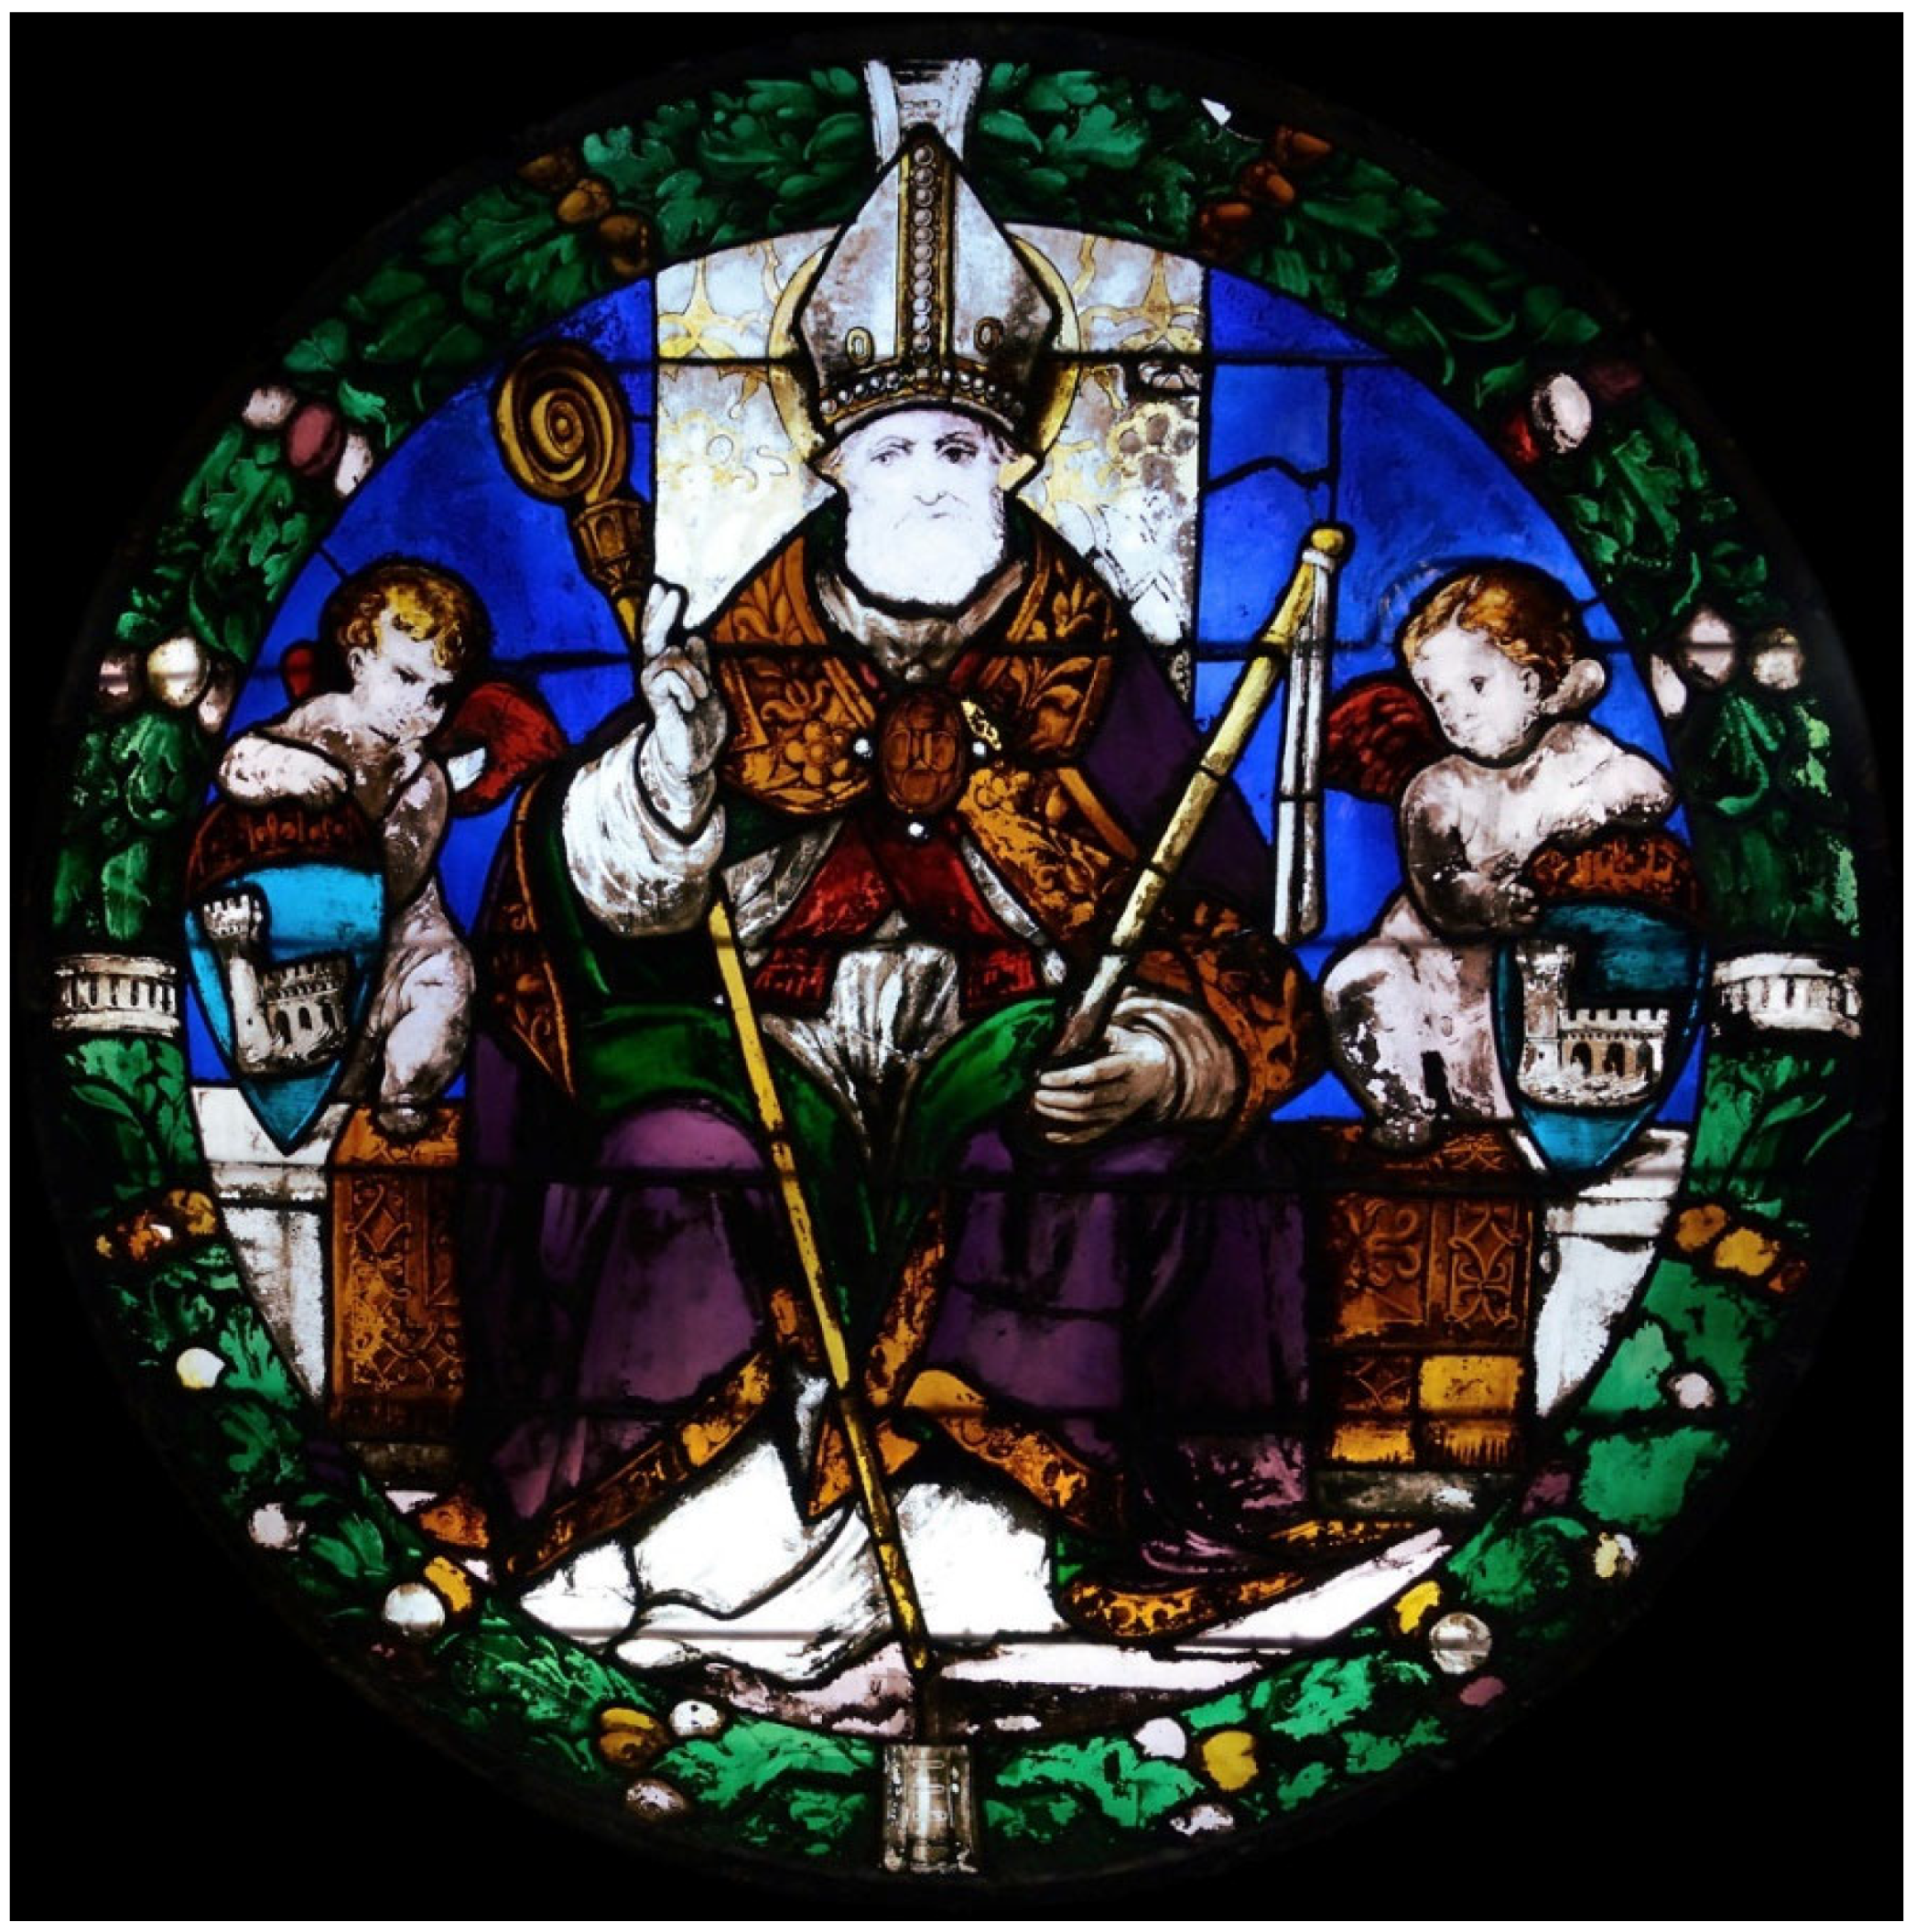
The Sant’Ambrogio rose window is located in the Sant’Ambrogio chapel—owned by the Marsili family—in the Basilica of San Petronio in Bologna. It is probably dated at the beginning of the sixteenth century, and it was made by an unknown master glassmaker on a cartoon recently attributed to Biagio Pupini, a Bolognese painter active in San Petronio from 1519 [
1] (
Figure 1).
The rose window depicts the seated blessing saint holding the pastoral staff and the scourge, his traditional iconographic attributes, and at his sides two angels holding the coats of arms of the Marsili family [
2]. The glass is characterized by intense and vivid colors and refined tonal variations.
Following previous restoration works carried out at the Studio Fenice in Bologna, the window was found to be well preserved, both in terms of the lead cames and the glass fragments, with no evidence of corrosion [
3]. Nevertheless, the original
grisaille—applied as a varnish typically prepared from iron or copper oxides dispersed in a liquid, sometimes wine, subsequently fixed to the glass surface through firing [
4]—exhibited significant conservation issues, appearing thinned and incomplete, even in important areas of the representation. The poor state of conservation has been attributed to the low-quality of the original
grisaille mixtures, improper firing, or aggressive conservation interventions.
Moreover, at least three interventions involving cold integrations of the
grisaille, using different materials, were identified. The first repainting consists of a thin and brownish veiling resembling a
grisaille. The second appears to be a veiling, likely made with the so known “
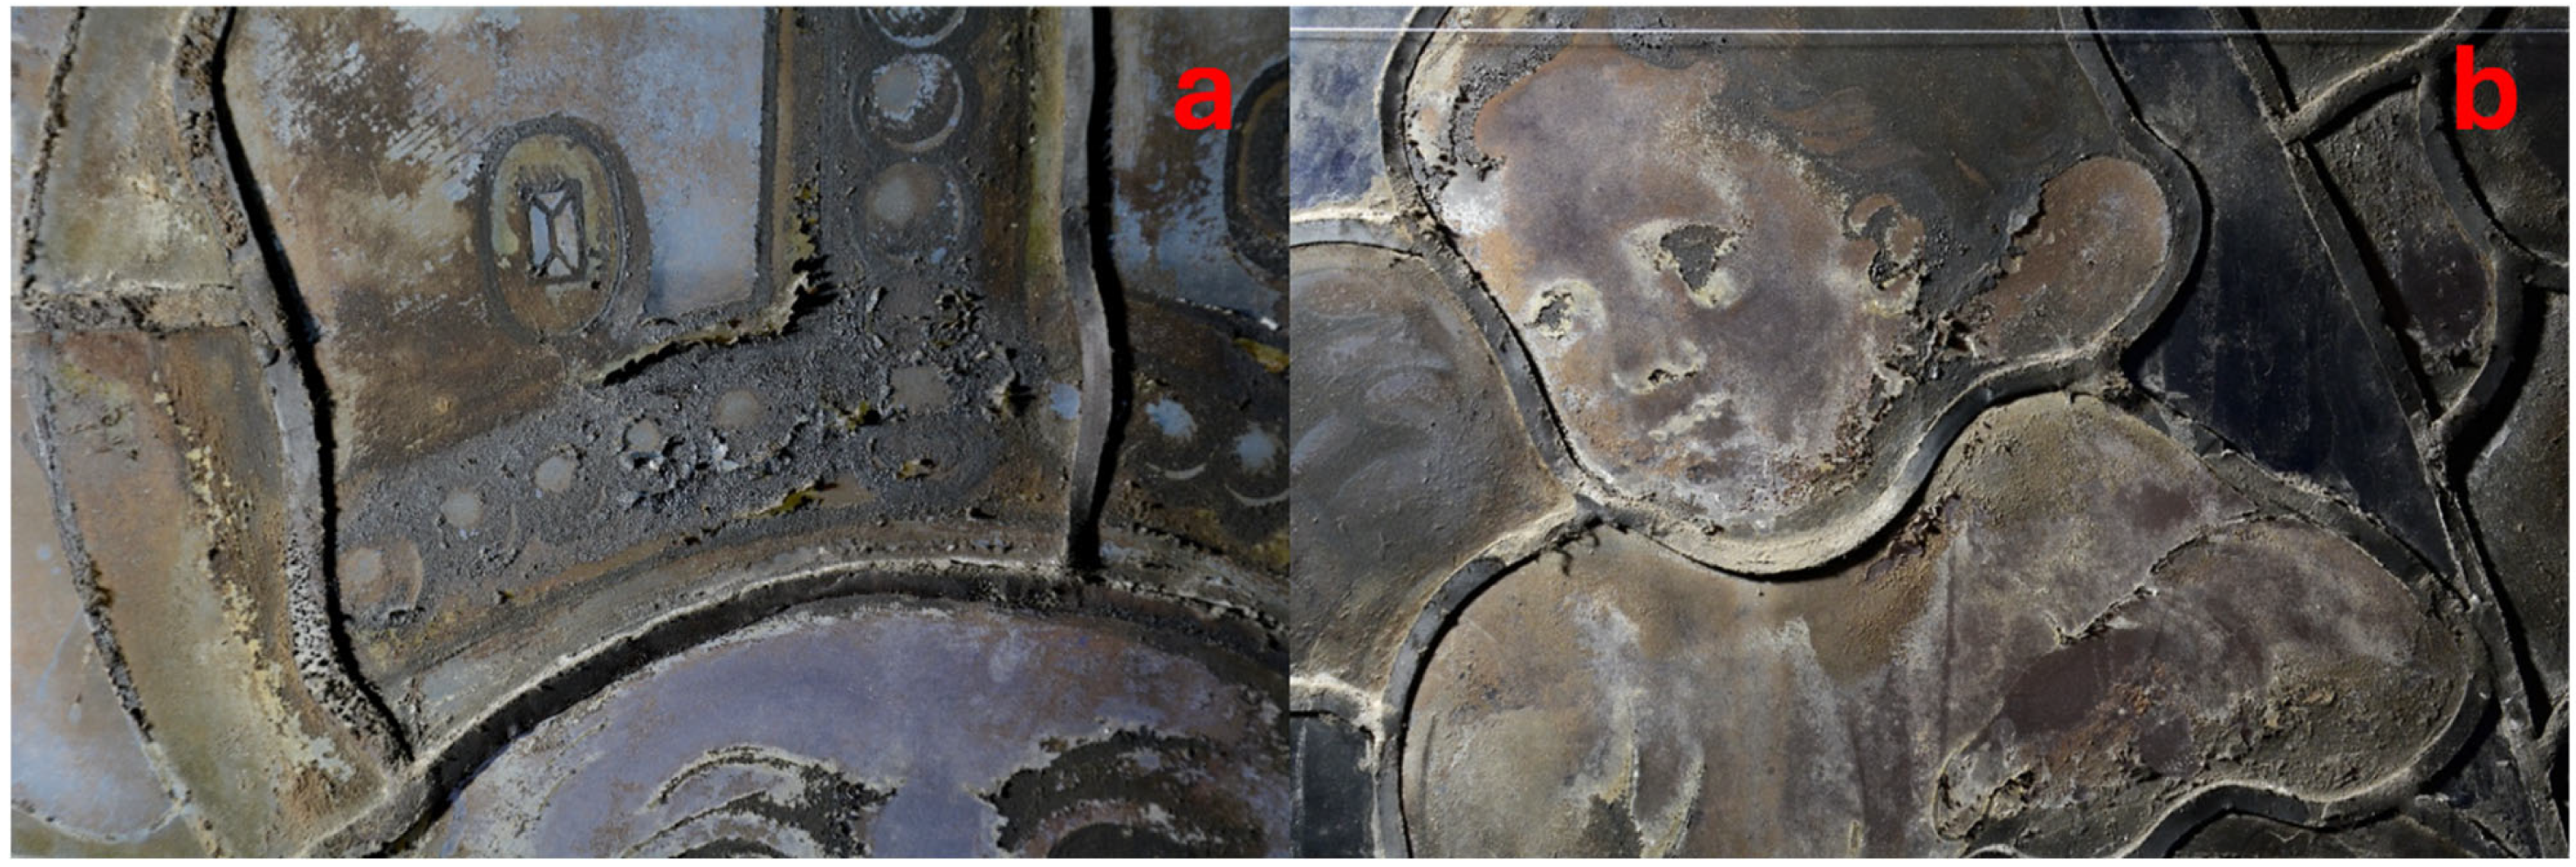
beverone”—a historical product used, based on various organic substances such as proteins or resins—which darkened over time but remained well adhered to the glass. The third intervention involves a blackened substance, likely a varnish, applied to restore the lines of the original grisaille drawing (
Figure 2).
In the context of the restoration works, a diagnostic campaign was planned to study the glass support and investigate the nature of previous integration works, with the aim of assisting conservators in selecting appropriate restoration strategies and materials.
The analytical campaign focused on the characterization of materials—including the glass, past integrations of the original grisaille, alterations and surface deposits—as well as on the reconstruction of the lost grisaille drawings in certain areas of the rose windows. The investigation of the glass support was carried out using non-invasive and portable spectroscopic techniques, such as Fiber Optic Spectroscopy (FOS) in transmission mode, X-ray Fluorescence (XRF) and Hyperspectral Imaging (HSI), the latter being a relatively recent development for the analysis of large glass surface [
5,
6,
7,
8,
9,
10,
11,
12]. Both FOS and HSI were applied in transmission mode because, although the glass was relatively thick and not highly transparent, the signal obtained in reflectance was too weak.
Portable XRF was primarily applied to detect the elements responsible for the color of the glass. While FOS does not always allow the unequivocal identification of chromophores, the combined results of these two techniques generally provide a reliable determination of the materials responsible for the glass coloration.
For a more detailed characterization of the glass, four samples were also collected from beneath the lead cames. The samples were analyzed using XRF and Scanning Electron Microscope with Energy-Dispersive Spectroscopy (SEM-EDS).
Fourier Transform Infrared Spectroscopy (FT-IR) was employed to investigate the composition of deposits and alterations, as well as materials used in previous reintegration works. Each sample was examined under an Optical Microscope (OM) and photographed using the integrated camera. Finally, a photographic processing method was applied to recover the image of the lost
grisaille, providing guidance for re-integration in various areas of the representation. For this purpose, the
ghost image was used. The ghost image is defined as the faint trace or imprint, resembling a satin finish, left by the original grisaille on the glass during firing. Although the paint may detach over time, its slight imprint generally remains on the glass surface. This imprint is visible only when observed up close, from a certain angle, and under specific lighting conditions, allowing the original lines of the drawing and the shading to be discerned. By acquiring high-definition images in the visible range and processing them to produce a black and white negative of the image [
13] the lines of the original drawing can be enhanced, providing conservators with guidance for the accurate recovery of the original painted design.
2. Materials and Methods
In order to preserve the integrity of the glass, the analytical investigation was carried out mainly via non-invasive and portable techniques. Nevertheless, due to the limits of p-XRF in the detection of light elements, SEM-EDS was also used on selected samples.
2.1. Fourier Transform Infrared Spectroscopy (FT-IR)
FT-IR measurements were performed with a Nicolet Nexus spectrometer (Madison WI 53711, USA) in transmission mode. The 4000–400 cm−1 range spectra were acquired as the average of 64 scans and with a resolution of 4 cm−1. The samples in powder were grinded with potassium bromide salt (KBr) as matrix. For only one sample, an extraction in organic solvent was also needed to separate the organic fraction. An aliquot of the sample was dispersed in 5 mL of ethyl acetate (EtOAc) under magnetic stirring at room temperature for 2 h. After filtration on paper, the solution was evaporated. The obtained oily residue was dropped on a KBr pellet for the FT-IR analysis. The data acquisition and processing were performed using OMNIC 7.3 software and the spectra were compared with those in public or in-house reference databases.
2.2. Fiber Optic Spectroscopy (FOS) in Transmission Mode
FOS measurements in the 350–2200 nm range were performed using the Zeiss portable spectrophotometer (Carl Zeiss AG, Oberkochen, Germany) equipped with two single-beam spectroanalyzers, the MCS601 UV-NIR (190–1015 nm range) and MCS611 NIR 2.2WR (910–2200 nm range). The data acquisition step for the MCS601 silicon photodiode array detector is 0.8 nm/pixel and 6.0 nm/pixel for the MCS611 InGaAs diode array detector. The radiation source was a 500 W photographic tungsten–halogen lamp illuminating the recto of the rose window while the transmitted radiation was collected on the verso by means of quartz optical fibers bundle with a spot of about 2 mm diameter. Calibration was performed using a 99% Labsphere Spectralon (North Sutton, NH 03260, USA) diffuse reflectance standard. The acquisition and data processing were performed using Aspect Plus® 1.80 software.
2.3. X-Ray Fluorescence (XRF)
XRF measurements were acquired mainly on the recto of the rose window. Spectra were acquired with the Bruker XRF portable spectrometer TRACeR III-SD (Bruker™, Berlin, Germany). The source is a rhodium X-ray tube, and the detector is a 10 mm2 energy dispersive SDD (Silicon Drift Detector). The measurement spot is 0.4 × 0.7 cm. The chosen acquisition parameters were 40 kV voltage and 12 µA current with an acquisition time of 60 s without filters. Data were acquired and processed with the software Artax Best 7.4.
2.4. Hyperspectral Imaging (HSI)
The portable pushbroom hyperspectral camera Specim IQ (from SPECIM Spectral Imaging Ltd., FI-90590 Oulu, Finland) was used to acquire data in the 400–1000 nm range. The camera has a spectral resolution of 7 nm and an acquisition step of 3.5 nm for a total of 204 spectral bands. It uses a silicon CMOS sensor with 512 × 512 pixels. The data acquisition was performed indoor with the camera facing the recto of the rose window and using two 50 W halogen lamps, with correlated color temperature of approximately 3000 K, placed symmetrically at 80 cm distance from the verso surface. A diffuser panel, interposed between the light source and the window surface, was used to obtain diffused homogeneous illumination to avoid signal saturation. The chosen acquisition time was 300 ms. White reference calibration was performed at the beginning of every measurement using the internal predefined reference for a halogen lamp. The data were processed using the Specim IQ Studio software 2019.05.29.2 and applying the Spectral Angle Mapper (SAM) algorithm.
2.5. Scanning Electron Microscope (SEM-EDS)
SEM analyses were performed using a TESCAN Gaia 3 FIB/SEM (KEYENCE ITALIA S.p.A. Milano, Italy). The microscope is equipped with an electronic column Triglav of 30 kV and an ionic column Gallio Cobra Focused. The detector is EDAX HI-OCTANE (EDAX, Berwyn, PA, USA) which enables electronic microanalysis.
2.6. RGB Imaging and Photoshop Processing
The RGB images of the rose window were acquired using a Nikon D7100. It is a reflex camera with an APS-C sensor of 23.5 × 15.7 mm and 24.1 megapixels. It has a 100-25600 ISO sensibility and shutter speed from 30 s to 1/8000 of a second. The camera was equipped with an autofocus objective Nikon AF-S DX 18–105 mm f/3.5–5.6 G ED VR with 15 lenses in 11 groups, a field of angle from 77.3° to 15.6° and a minimal distance of focus of 45 cm. The images were acquired just for some details of the rose window, such as the face of the Sant’Ambrogio and the angel on his right, that showed an almost total loss of the grisaille. The images were processed using the Photoshop PS5 software to recover the ghost image of the lost grisaille: the acquired RGB images were adjusted as contrast value, converted to black and white, inverted as a negative and the remainings of original grisaille—that now appear white—retouched with black color. The two 50 W halogen lamps were used as light sources, positioned on the verso side, at about 50 cm from the rear surface, providing oblique illumination in order to evenly illuminate the faces. The angles of illumination were progressively varied to achieve the highest possible contrast: the optimum angle was about 45 degrees from the perpendicular to the glass. The camera-to-object shooting angle was also adjusted to obtain the best conditions to highlight the ghost image, but it was quite near 90 degrees. It is not possible to give an exact angle both for the lights and the camera because the shooting conditions can depend on various factors related not only to the lights and the camera used, but mainly to the conditions in which the grisaille imprint is preserved.
2.7. Optical Microscope (OM)
Deposit and glass samples were photographed with 1× and 4× magnification, in visible light, using a Nikon Eclipse E 600 microscope (Nikon Corporation, Tokyo, Japan) equipped with a Nikon camera.
3. Results and Discussion
3.1. Characterization of the Deposit Materials
To investigate the composition of the previous conservation works, four samples of deposit/alteration materials were collected from the rose window (SA_R_D01–SA_R_D04). These samples represented three different integrations carried out in previous restorations to reintegrate the lost grisaille. The samples consisted of powder and/or small fragments, taken from areas where the integration material was partially detached.
The analysis was performed by means of FT-IR spectroscopy, in transmittance mode. Three samples (SA_R_D02, SA_R_D03, SA_R_D04) resulted with similar composition. Gypsum, calcium oxalates and nitrates were detected [
14,
15], the latter two resulting from the decomposition of organic materials, consistent with the possible use of a mixture similar to the so-called “
beverone” as already found in a previous study of the stained-glass windows of the Bardi Chapel of Santa Croce church in Florence [
16]
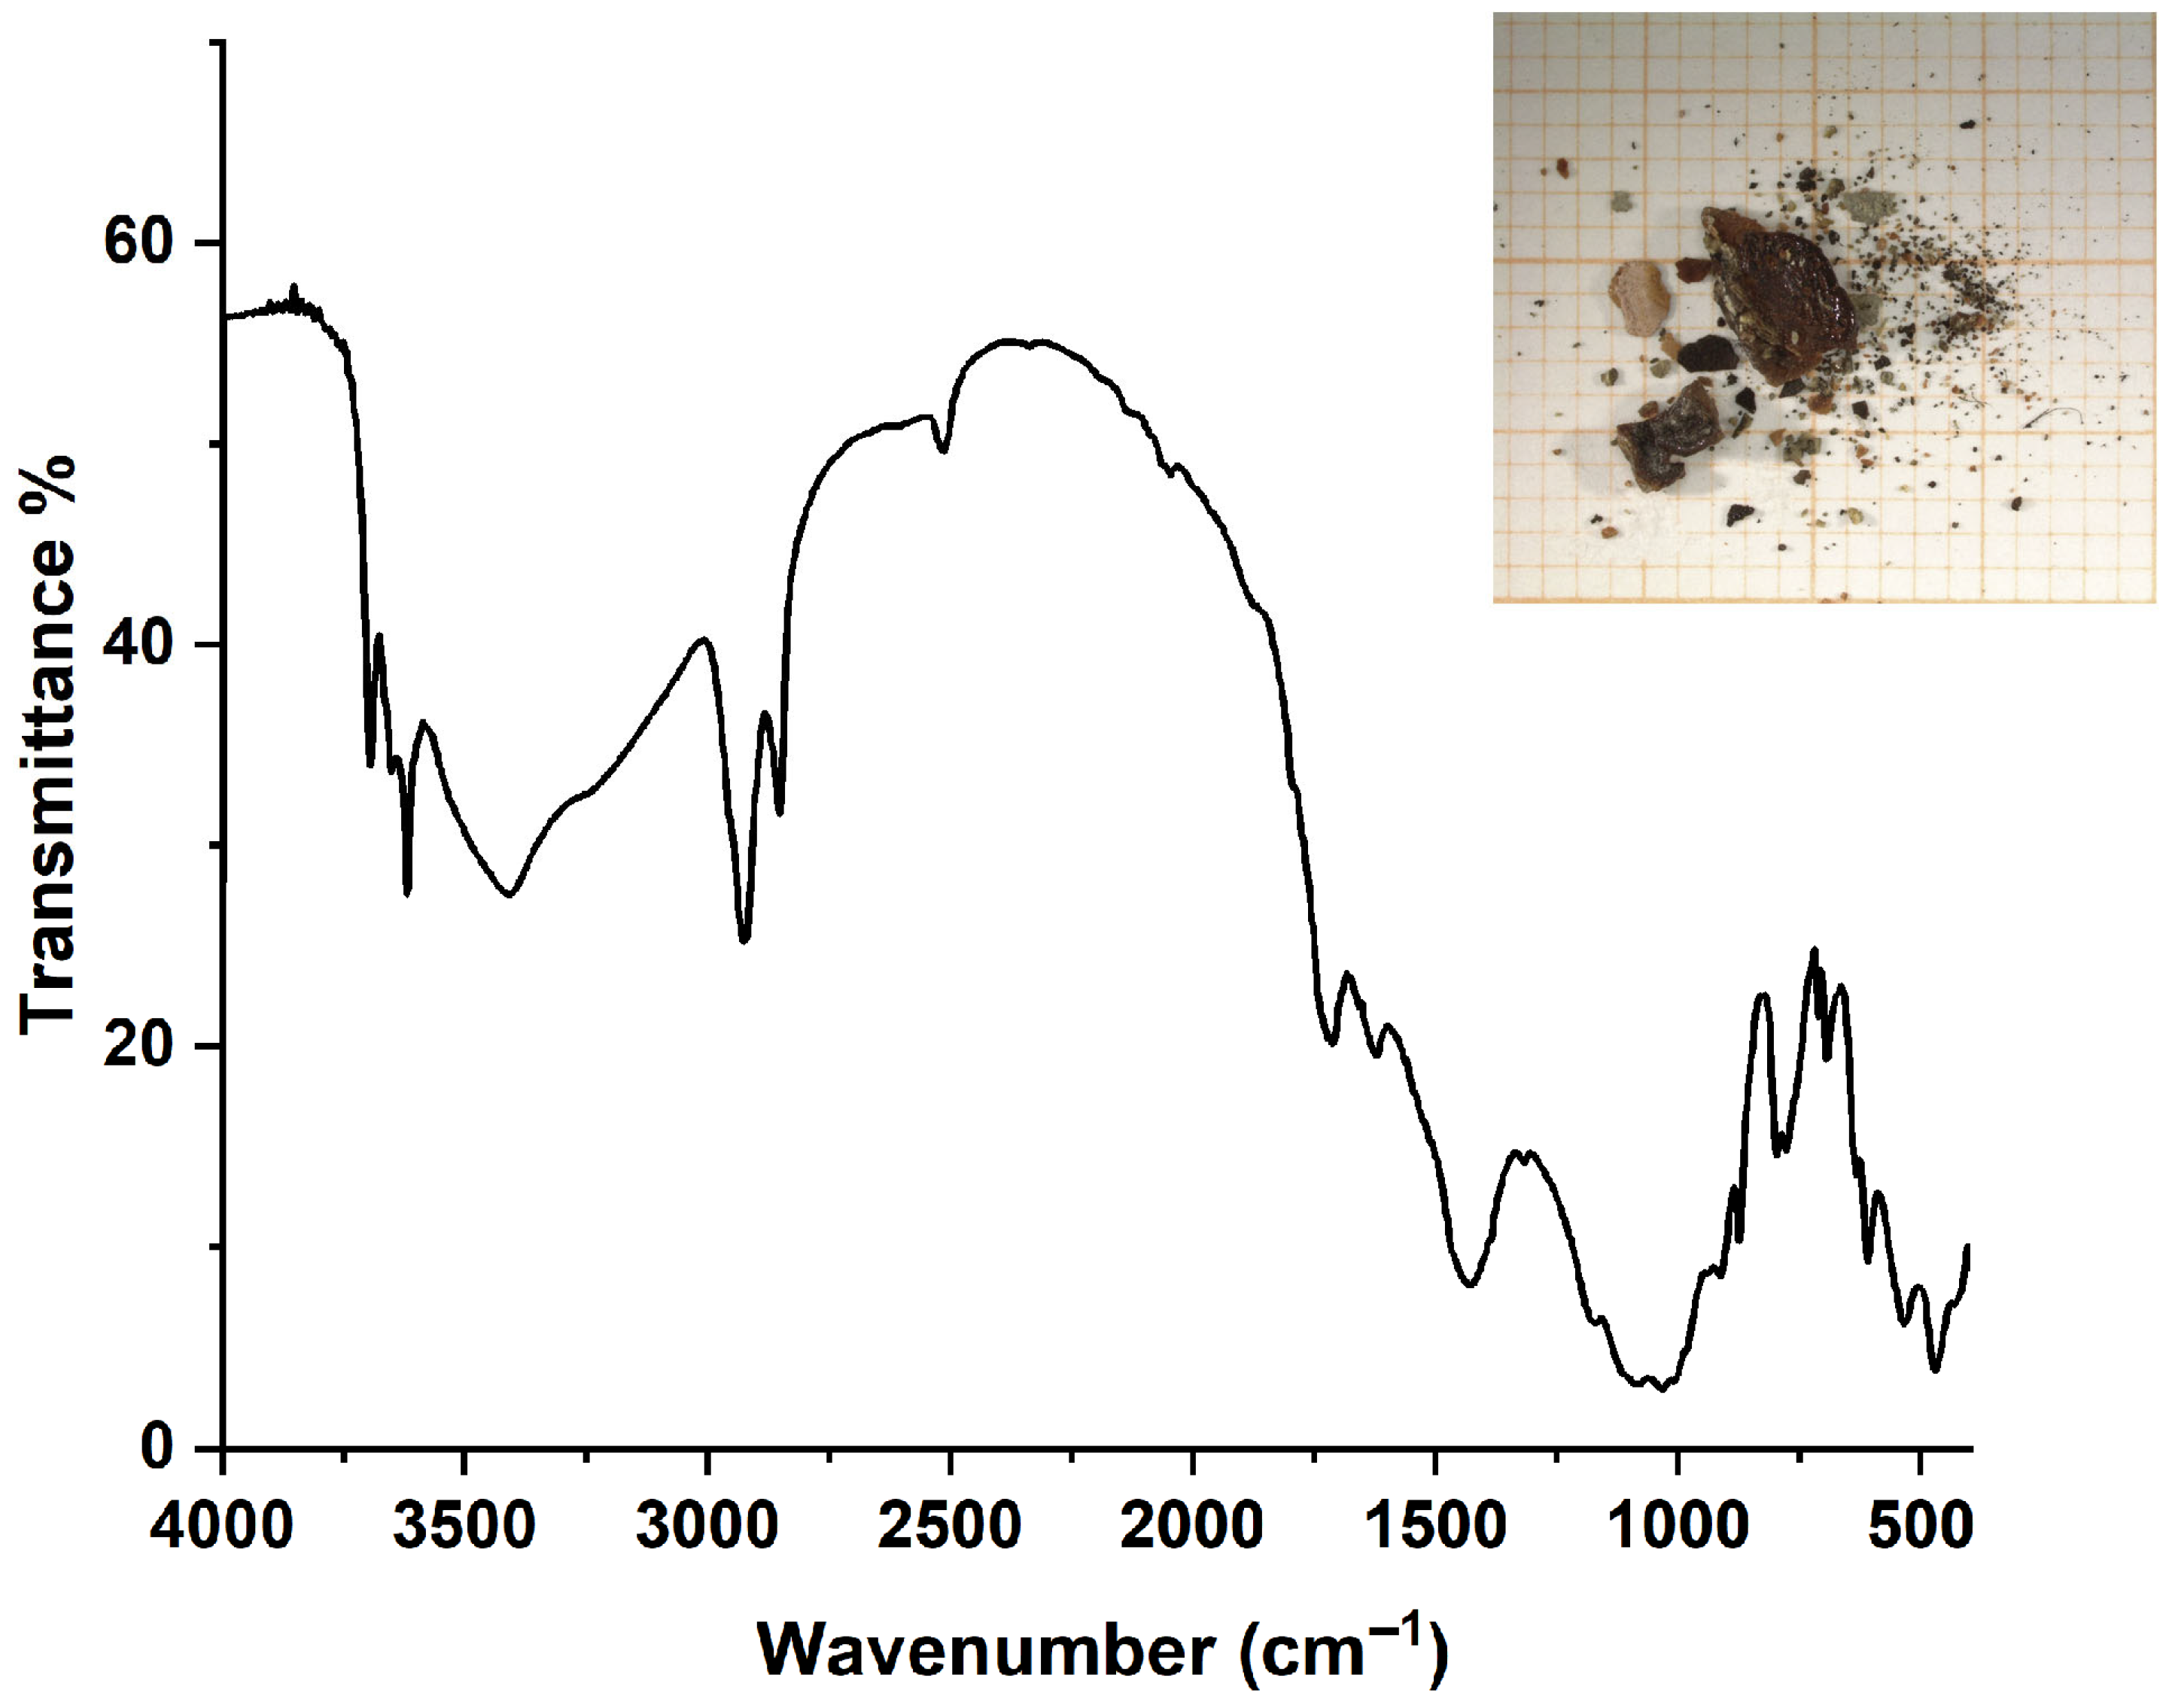
Sample SA_R_D01, related to a black repainting, showed a more complex composition (
Figure 3). Kaolinite [
17], calcite [
18], goethite [
19], barium sulphate [
20], calcium oxalates, nitrates [
14], quartz [
21] and a small amount of gypsum were found [
15].
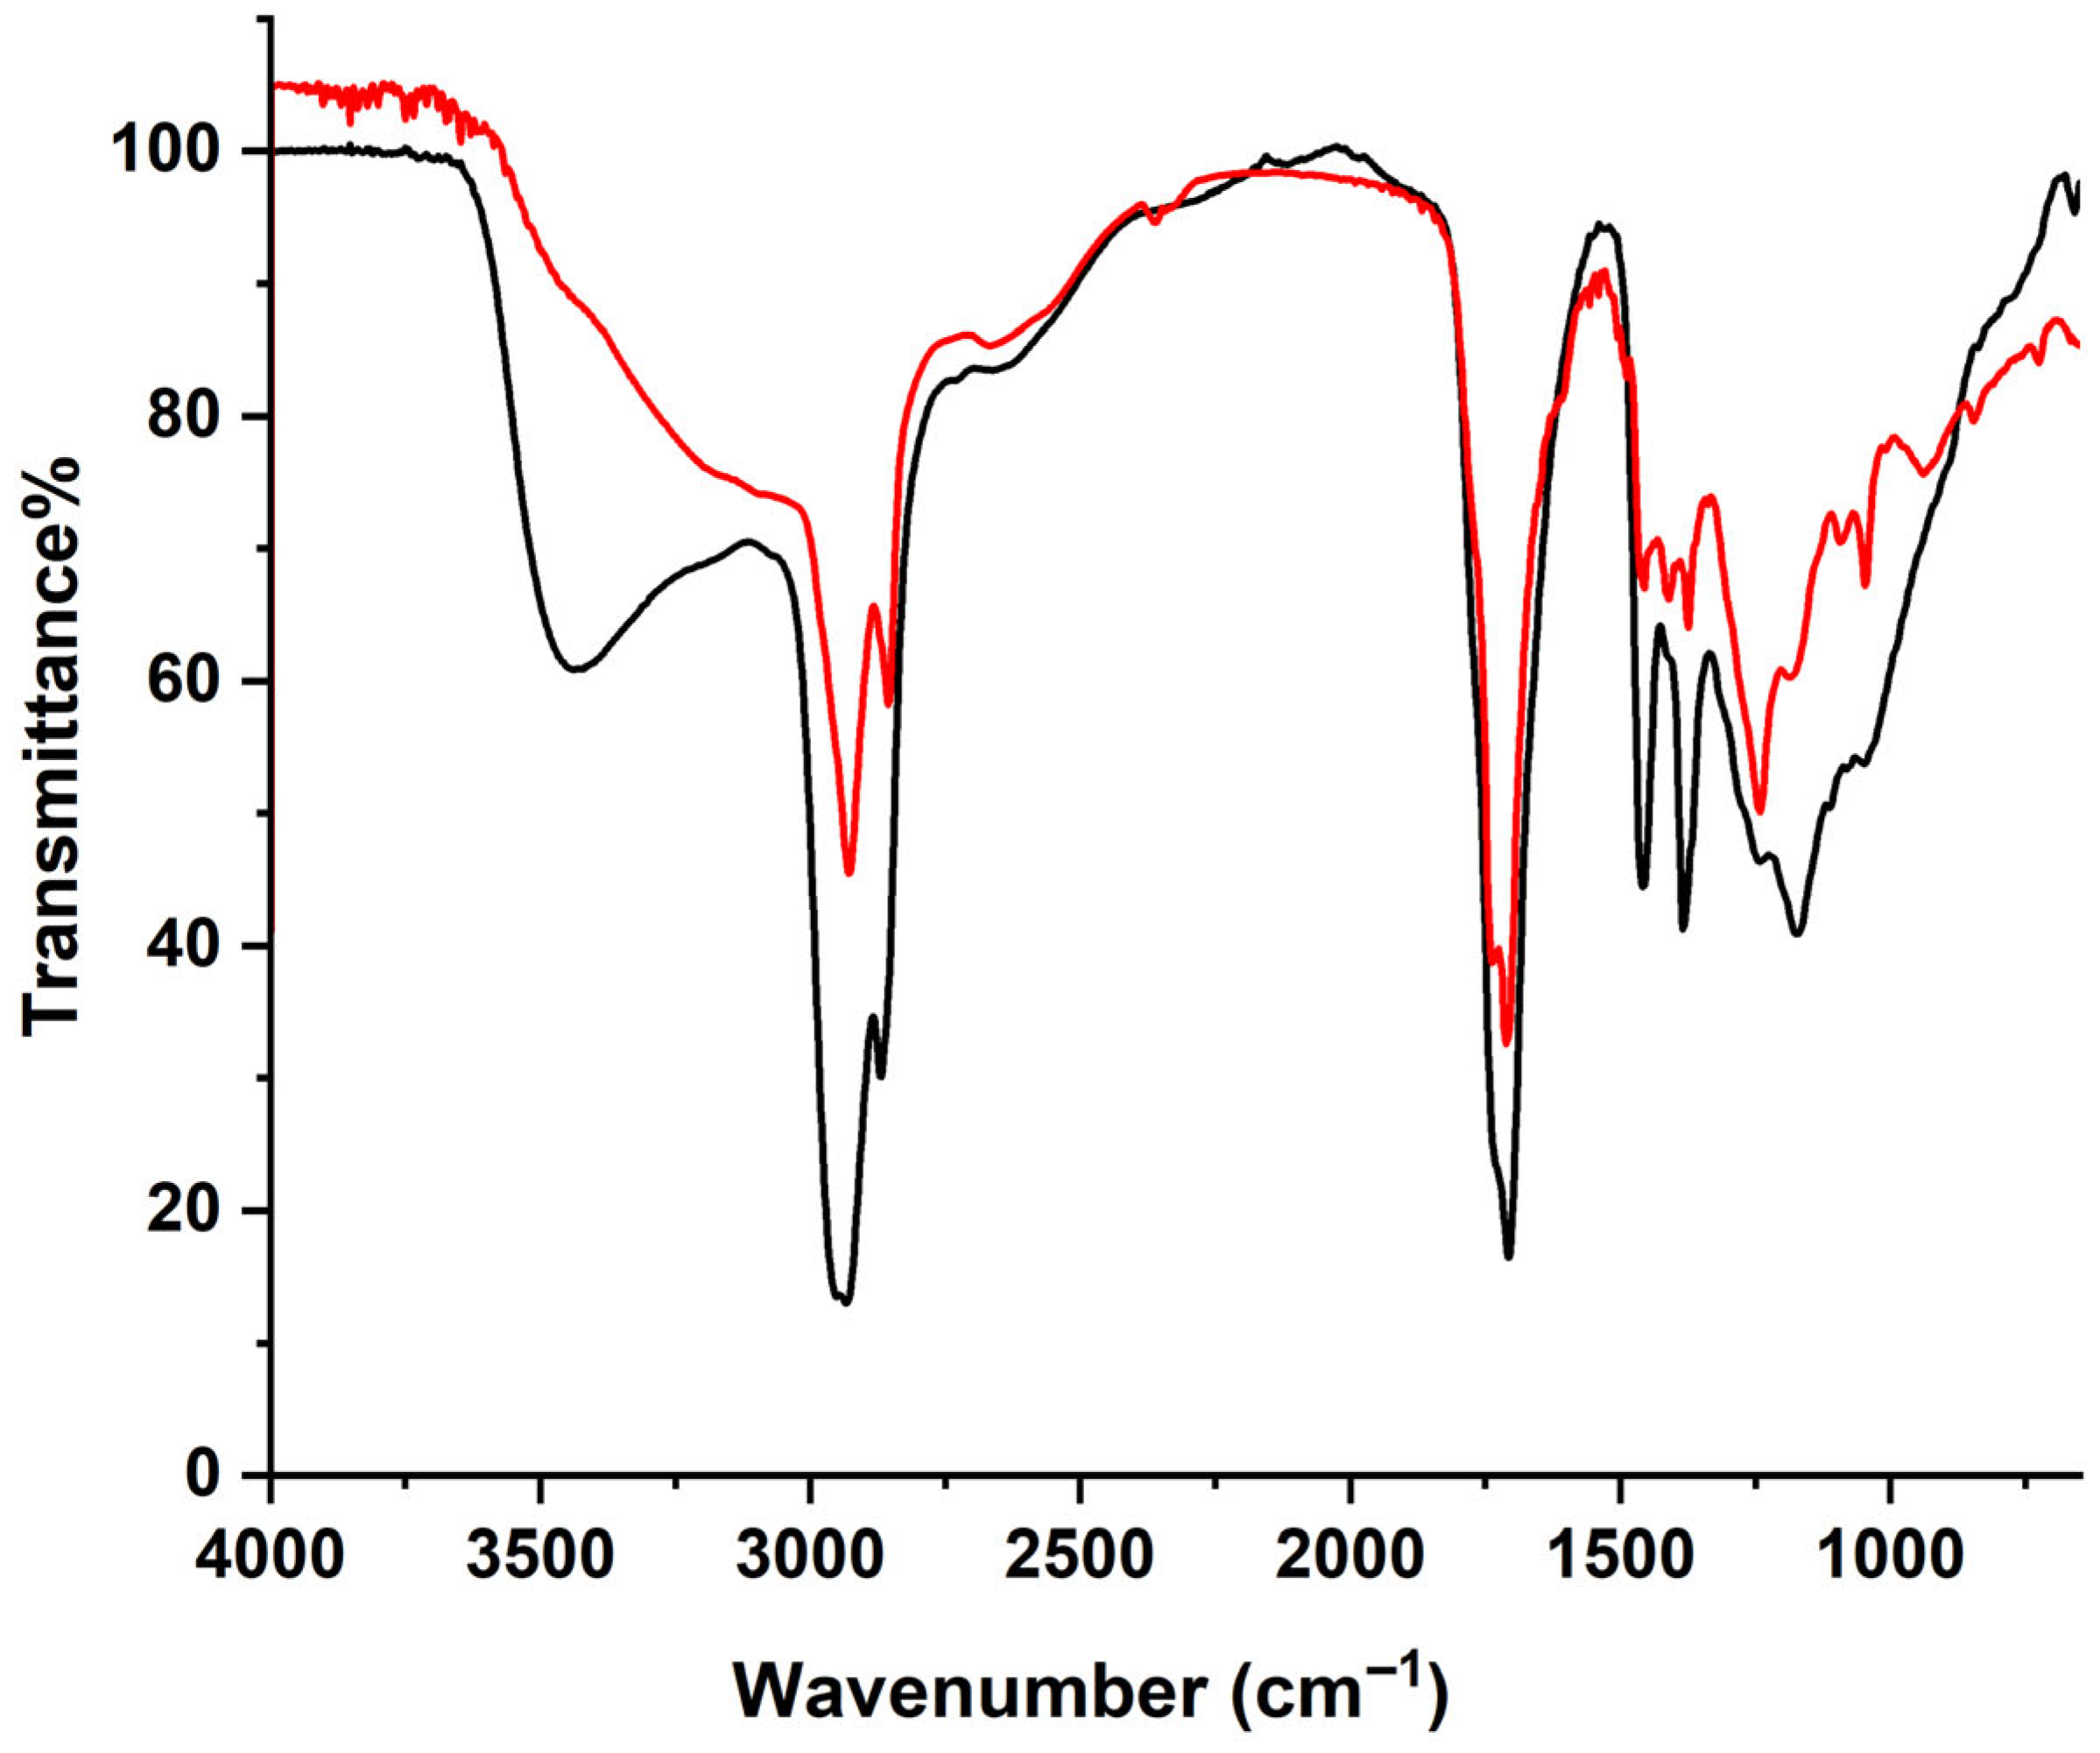
In this sample, the detection of absorption bands, assigned to νCH and νC=O vibrations, suggested the presence of organic material, even though its identification was unclear. For this reason, it was decided to extract from a portion of the sample the organic fraction in ethyl acetate. The comparison between the resulting spectrum and a reference one (
Figure 4) allowed to identify the organic material as an aged natural Dammar resin.
The results of the FT-IR analyses are summarized in
Table 1.
3.2. Glass Characterization
3.2.1. In Situ Non-Invasive Spectroscopic Analysis
The in situ analysis of the glass pieces constituting Sant’Ambrogio rose window were performed using FOS and XRF techniques. The FOS transmittance spectra enabled the identification of glass chromophores. However, the quality of the spectra was not always satisfactory due to the considerable thickness of the glass, its low transparency and the widespread presence of surface deposits and restoration retouches, which in some cases hindered the clear identification of certain chromophores.
The XRF spectra gave information about the elemental composition of the glass. Calcium (Ca) was found in high abundance in all glasses investigated, while potassium (K) was always present in very low amounts. Although the portable XRF technique cannot be considered a priori as a quantitative analytical method and most of these devices (including the one used in this study) are unable to detect light elements with Z < 14, this result supported the conservator’s hypothesis that the rose window was obtained with sodium–calcium glass. Because of these detection limitations, quantitative assessment of the presence of silicon (Si) and sodium (Na) in glass will be discussed based on SEM-EDS analysis of glass samples.
- -
Blue glass—The chromophore in the glass was found to be cobalt (Co) in its bivalent ionic form Co
2+ with tetrahedral coordination due to Ligand Field (LF)
d-d electronic transitions (absorption bands 500–650 nm) [
23]. This chromophore was used since ancient times to reach deep blue coloration [
24].
The XRF analysis showed a consistent abundance of lead (Pb), likely related to contaminations from cobalt ore. Indeed, in the period corresponding to the production of this rose window, cobalt ores were largely extracted from the Freiberg (Germany) mines, where Pb, in high concentrations, and zinc (Zn) have been documented. This mine was exploited from the 13th century to the end of the 15th century [
25].
XRF also showed the presence of copper (Cu) and tin (Sn), but no absorption bands attributable to both elements were detected in the FOS spectra.
- -
Light blue glass—FOS and XRF analysis showed that the glass chromophore is Cu
2+, which gives the glass the characteristic turquoise color due to LF
d-d electronic transitions [
26].
- -
Green glass—Green color was obtained with the contribution of two chromophores: copper in its bivalent ionic form Cu
2+ (d-d type LF transition), giving turquoise color, and iron in its trivalent ionic form Fe
3+, due to a d-d type LF transition as well, that gives a weak yellow color. The sum of these two contributes results in the final green color; the hue depends on the varying Cu
2+/Fe
3+ ratio [
27].
- -
Purple glass—The purple color resulted from the combined presence of two chromophores: manganese (Mn
3+) and Co
2+, the latter presumably added in different amount to achieve a deeper and more intense shade [
28,
29,
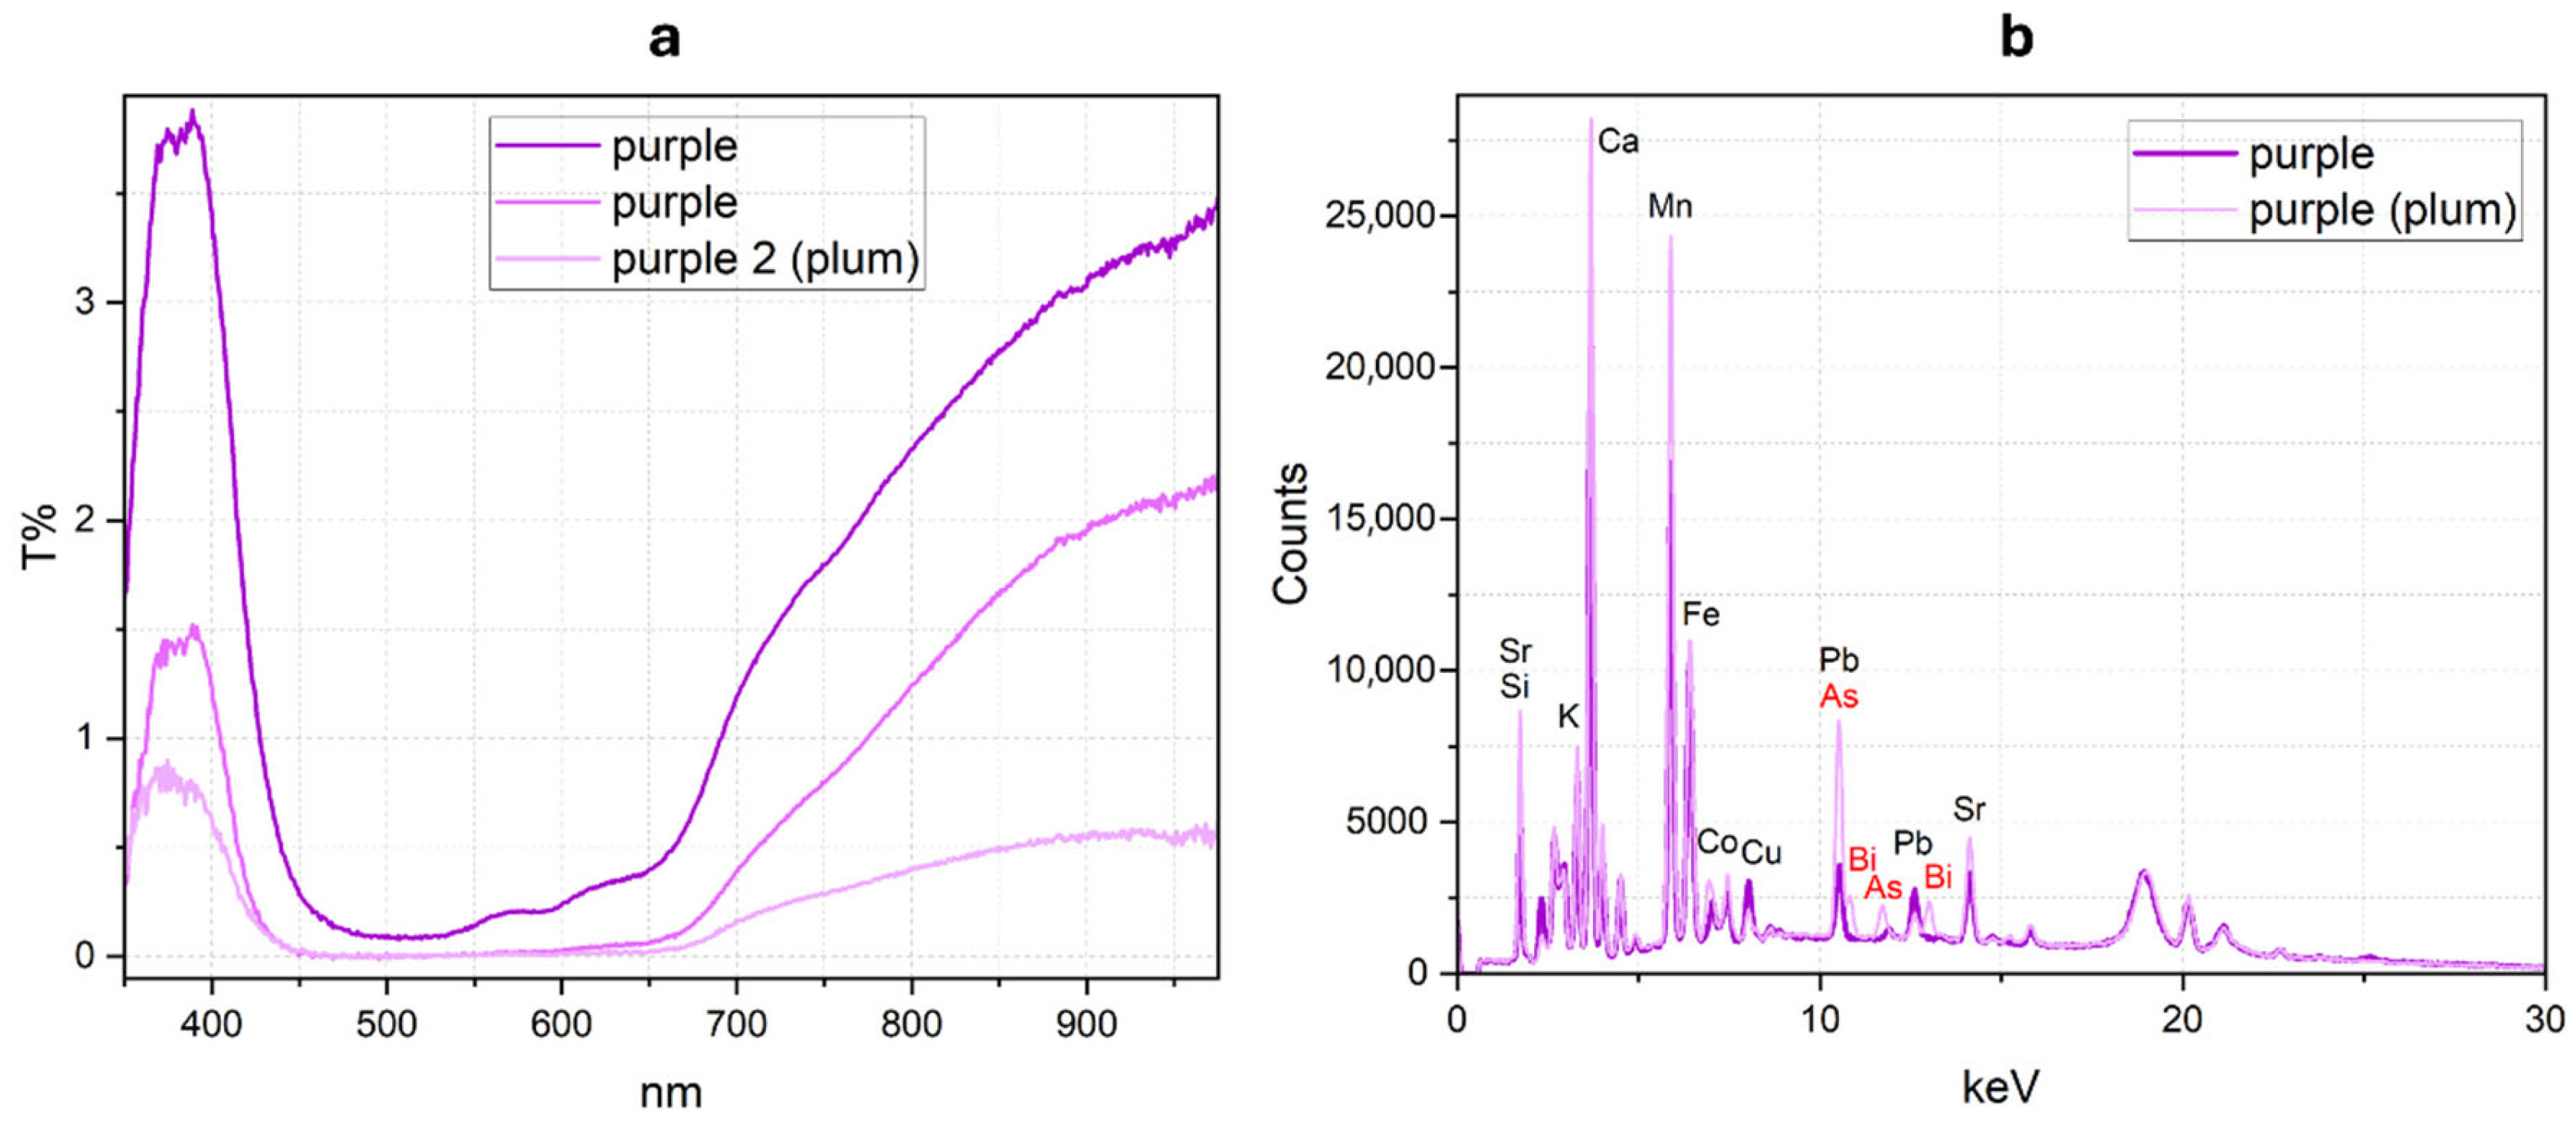
30]. Both chromophores are interested by Ligand Field d-d electronic transitions. FOS and XRF spectra of purple glass showed similar signatures (
Figure 5a,b). An exception was represented by a plum (purple 2 (plum) in
Table 1) in the garland surrounding the depiction of Sant’Ambrogio. In this case, medium-low counts of arsenic (As) and bismuth (Bi) were found by XRF analysis (
Figure 5b). This difference could be attributed to the use of a diverse cobalt source. Arsenic (As) and bismuth (Bi) are accessory elements found in cobalt mineralization from the Schneeberg mines in Germany, which were exploited as early as the sixteenth century but predominantly in the seventeenth and eighteenth centuries [
25]. This evidence suggests that the analyzed purple tessera was not original and was likely replaced during a past restoration, possibly in the late nineteenth century, which affected the rose window.
- -
Red glass—Since ancient times, red color in glass was obtained only using copper metal nanoparticles dispersed in the glass matrix, resulting in a deep red color due to the Superficial Plasmonic Resonance (SPR) [
31,
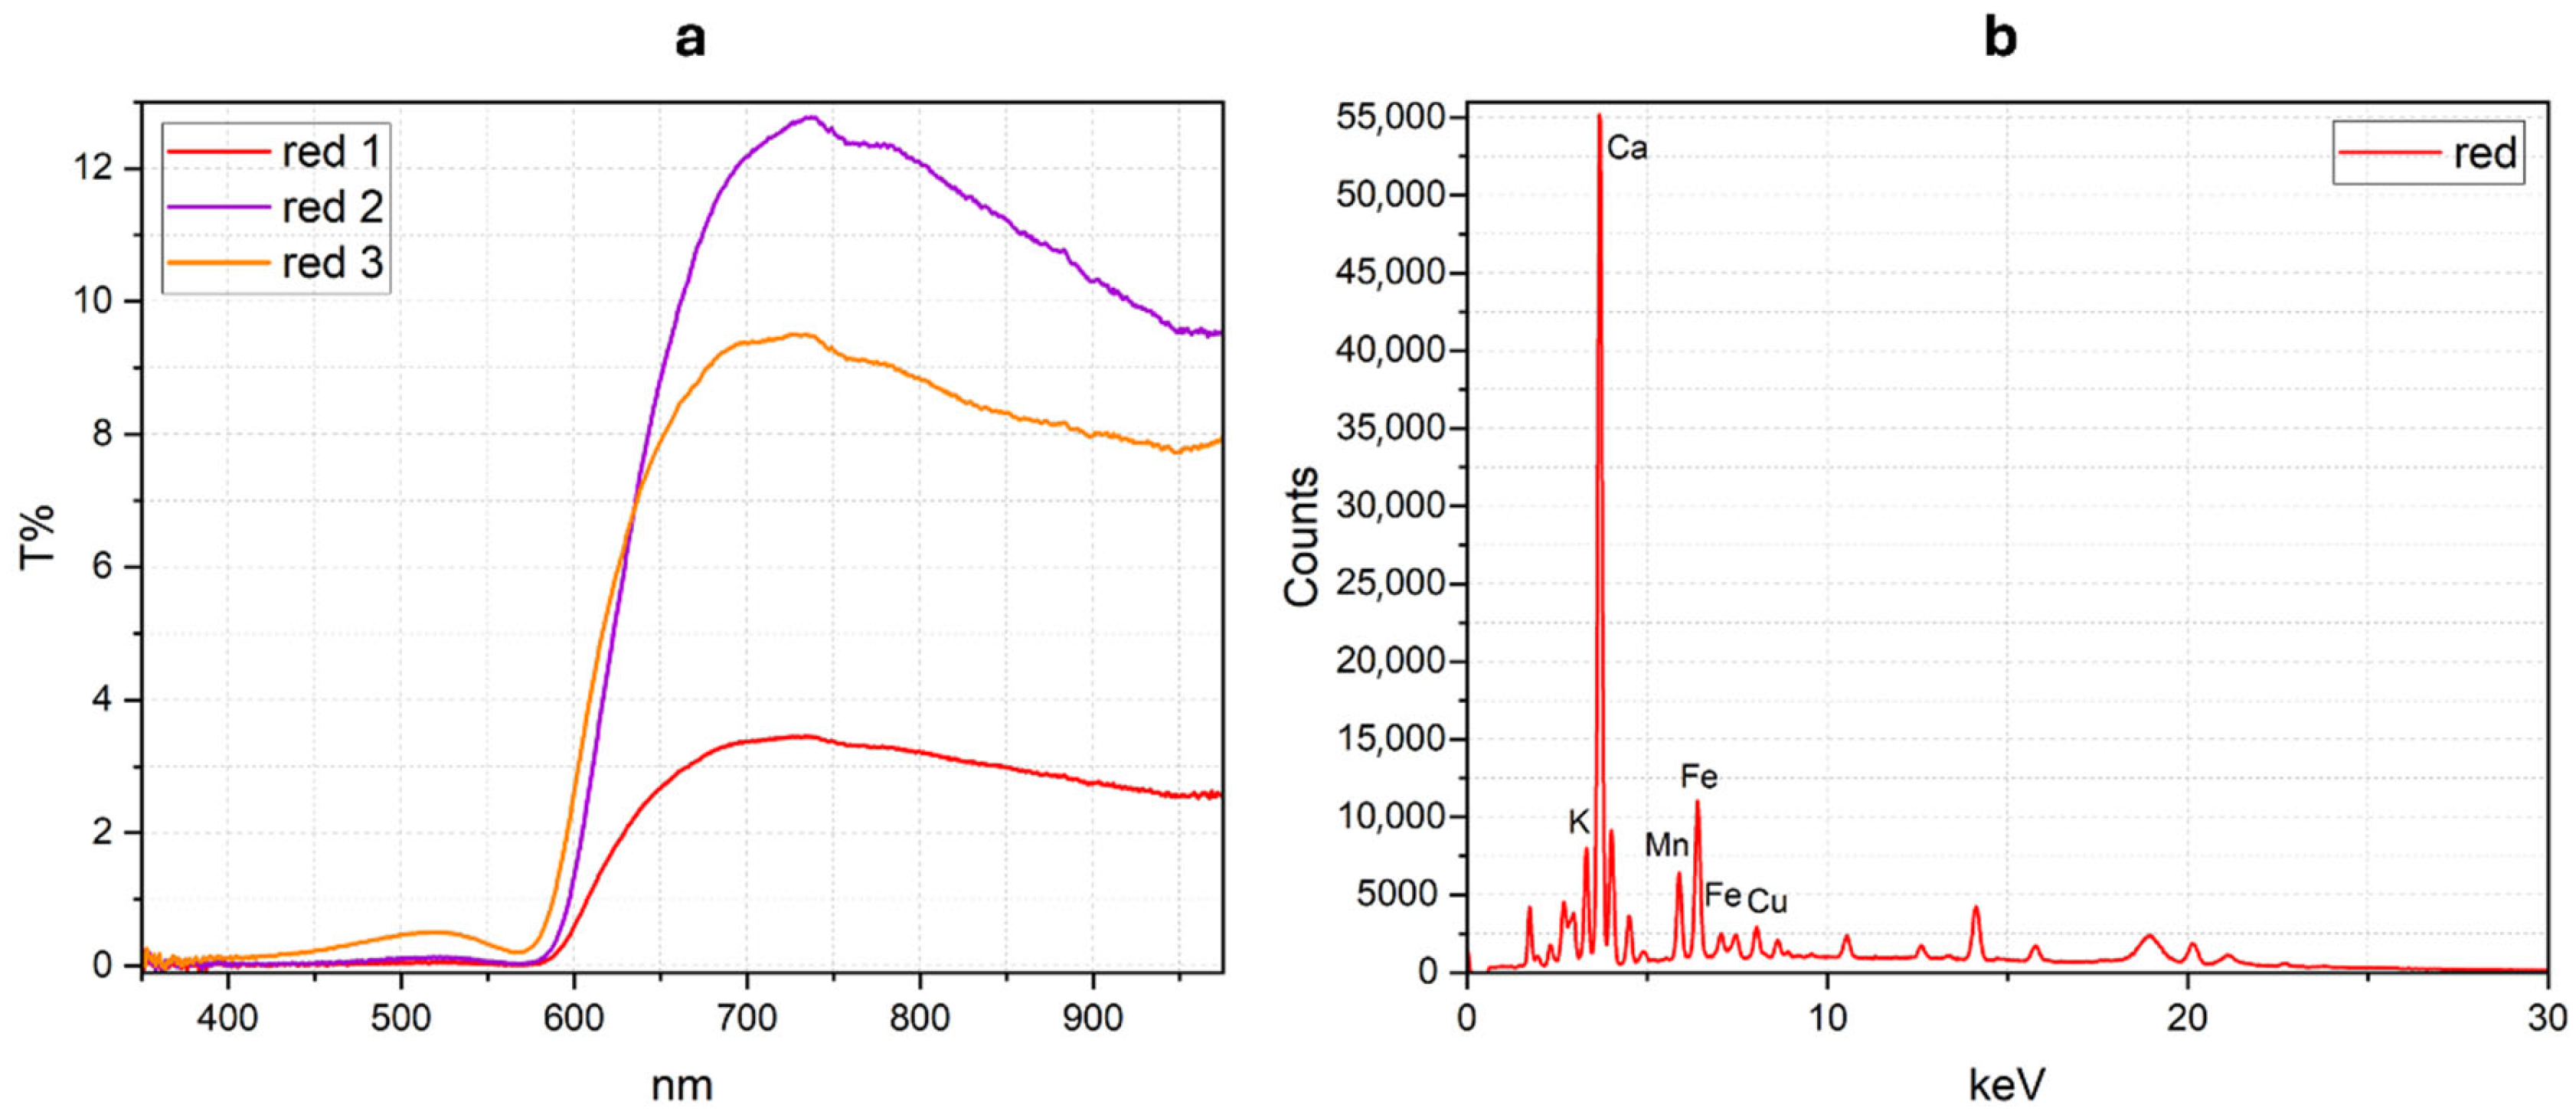
32]. FOS spectra show the typical S shape curve of this kind of red glass with inflection points ranging from 604 to 614 nm.
The fact that this type of glass is rather opaque implies that it was generally not possible to obtain rosy red glass tesserae (or tiles) by this method, since they would have prevented good light transmission. To overcome this drawback, master glassmakers generally used to interpose one or more thin layers of coppery red glass to layers of colorless glass [
33]. The manufacturing technique justifies the XRF low Cu counts, as it is possible that the red copper glass layer could have been placed in depth in the glass preventing a good response of the analysis (
Figure 6b).
As regards the Mn and Fe presence, they can be attributed to the colorless glass layers and/or to the manufacturing processes (Fe
2+ could have been added as reducing agent to obtain metal Cu) [
34].
Pink glass—The chromophore seems again Mn3+, which normally gives the glass a purple color. Although XRF spectra showed a medium abundance of manganese, in this case Mn3+ is probably present in very low quantities, giving a pink color to the glass. In fact, in the FOS spectra, the characteristic absorption band of Mn3+ at around 490 nm is not clearly visible. This suggests that part of the Mn was added as a decoloring agent as well. So, it is partially reduced to Mn2+ (colorless) by oxidation of Fe2+ to Fe3+. The formed Fe3+ contributes to the attenuation of the purple color given by Mn3+. Both the ionic species are interested by LF d-d electronic transitions.
Yellow glass—It was obtained, since ancient times, using dispersed silver (Ag) metal nanoparticles on the glass surface (SPR).
The silver’s yellow glass was mainly obtained using Ag salts applied on a preformed glass tessera and fired in the furnace, at variable temperature and time. They were always applied on the verso (external side) of the glass tesserae, as this chromophore was well resistant to weathering. This manufacturing technique justifies the XRF results that showed high Ag counts only when the measure was performed on the verso side.
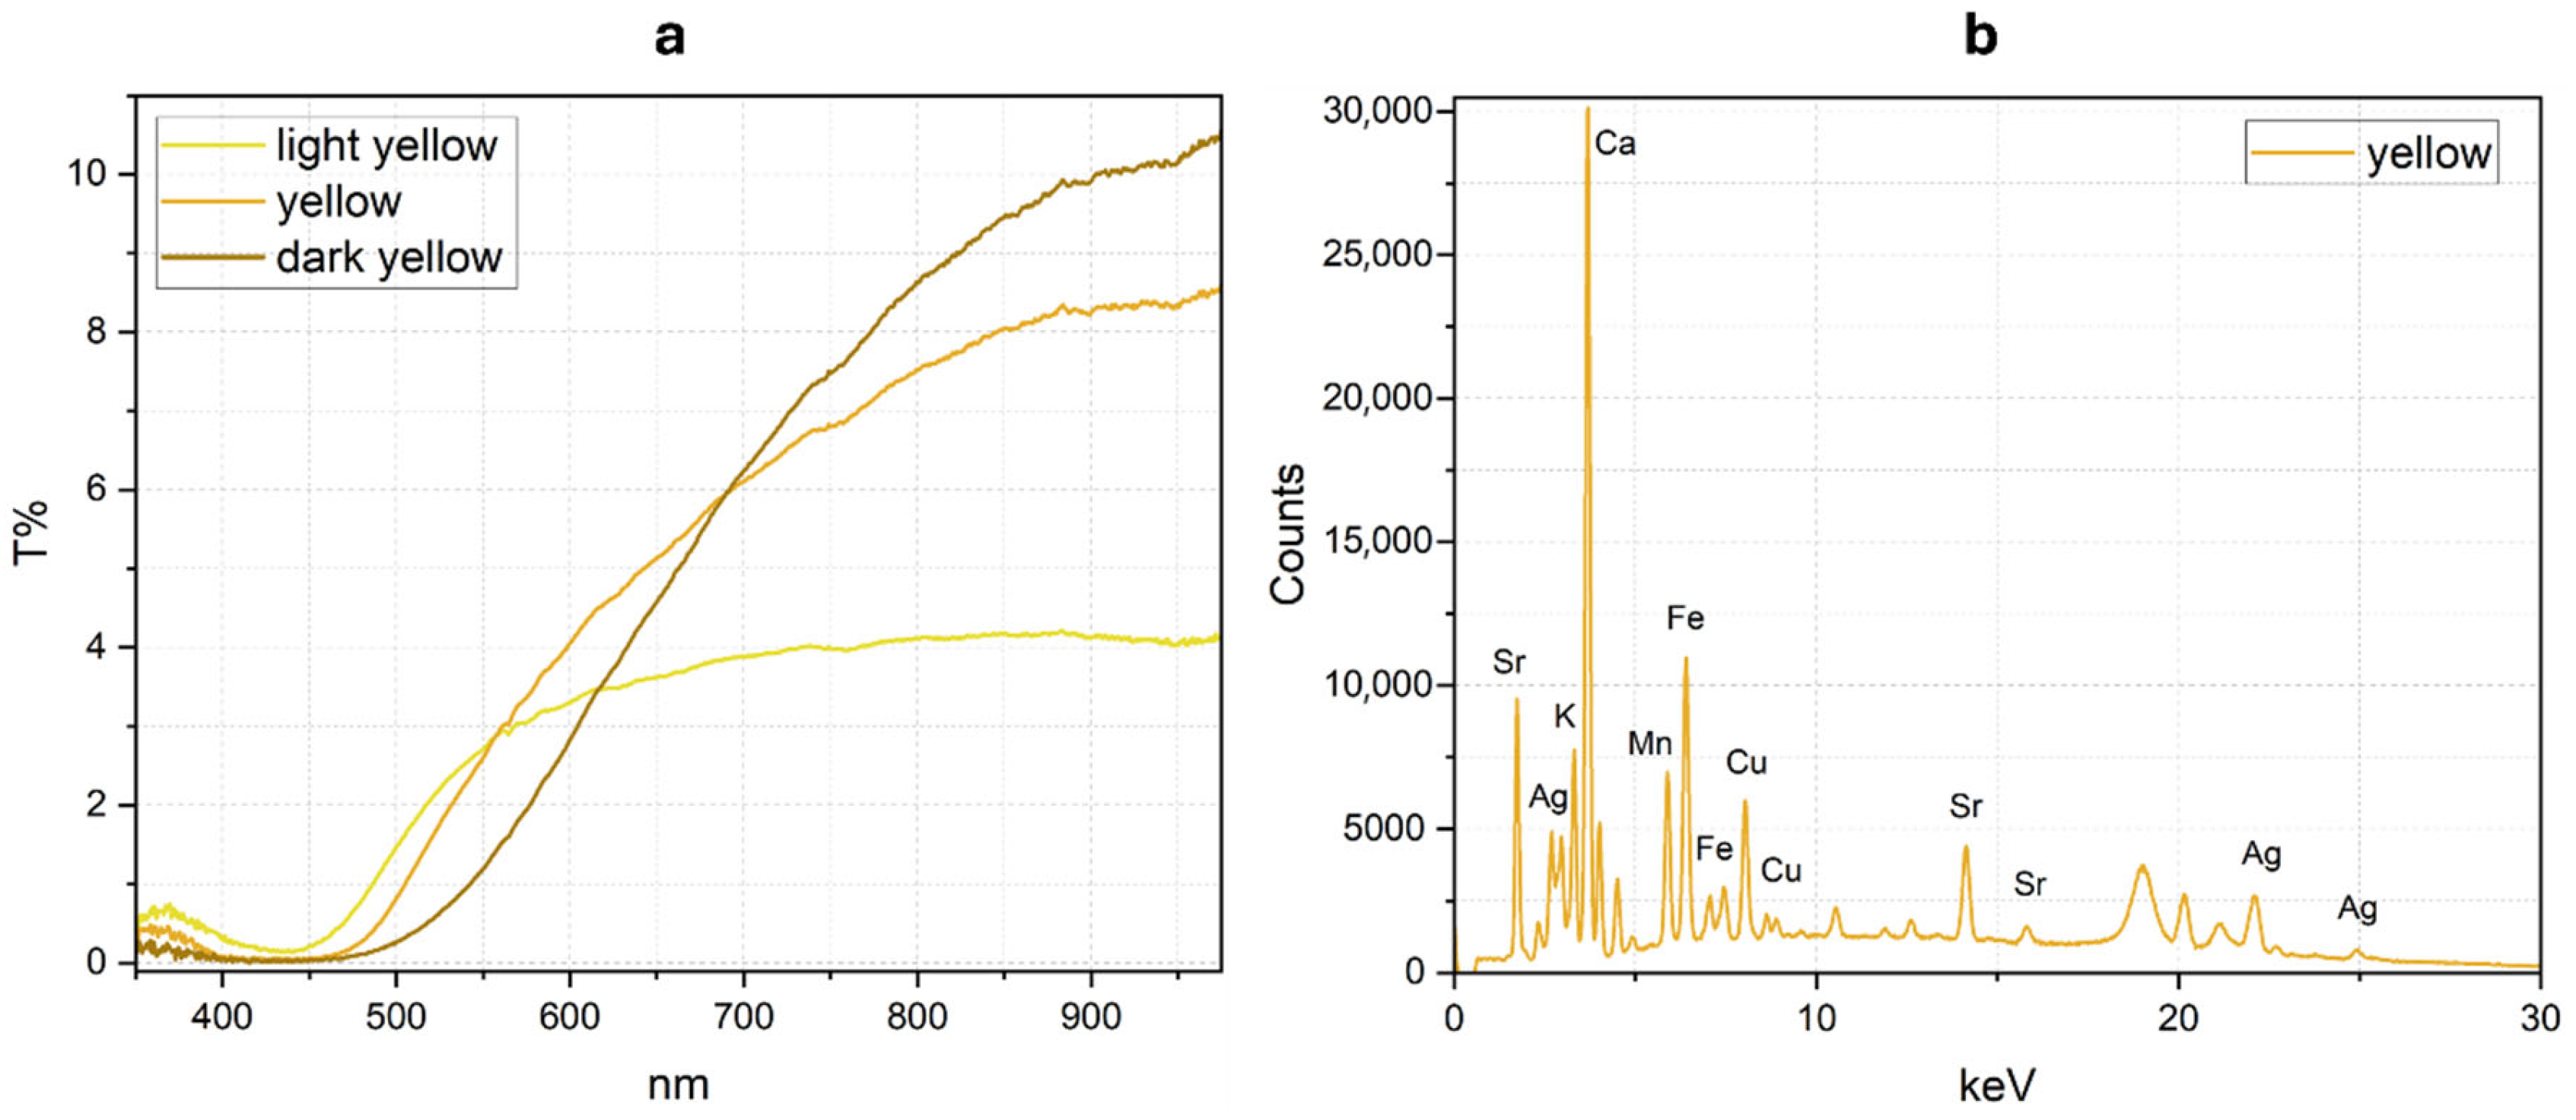
Different yellow hues were analyzed, and the FOS spectra resulted different mainly for what concerns the shifting of the absorption band towards longer wavelengths, around 450 nm the lighter yellow, around 480 nm the darker ones (
Figure 7a). This effect is due to different number and size of Ag colloidal nanoparticles formed during the firing of the glass in the furnace depending on the temperature and time at which the silver salts applied on the preformed glass were heated. The higher the temperature, and the longer the heating, the greater the number and size of the silver nanoparticles, the greater the thickness of the yellow glass and the more intense and darker the color [
35,
36,
37].
The XRF analysis showed the presence of Cu that can be explained by two hypotheses, already encountered in the literature: the use of Ag characterize coins (generally in Ag-Cu alloy) as raw material to produce the chromophore, or alternatively, the hypothesis of the use of Cu mortars to reduce the Ag to powder and produce the salts (cupellation) (
Figure 7b) [
36].
Amber glass—This glass was probably obtained by the formation of the Fe
3+-S
2− coordination complex, whose chromophore properties are due to Charge Transfer (CT) electronic transitions. This complex gives the glass an amber like color. Additionally, XRF analysis showed medium abundance of Mn probably added to the fused glass as bleaching to obtain a colorless glass, if the raw materials were impure or recycled [
38,
39,
40,
41].
The results of FOS and XRF for each type of colored glass are resumed in
Table 2.
3.2.2. Hyperspectral Imaging
Additionally, to the FOS and XRF analyses, selected areas of the rose window were investigated using the Specim IQ hyperspectral camera. Although this technique is well established in reflectance mode for the study of paintings and other non-transparent surfaces, it can also be effectively applied to glass by operating in transmittance mode [
6,
10]. Specim IQ Studio software was used to process the data cubes. The Spectral Angle Mapper (SAM) algorithm was successfully applied to map the variability of the transmittance spectra. SAM is a non-automated classification algorithm that operates by considering the acquired spectra as vectors in a space with dimensions equal to the number of acquired bands, i.e., 204. The similarity between two spectra is defined by calculating the angle between the two vectors that represent them. One of the vectors represents a reference spectrum (which can belong to the data of the artifact being analyzed or can be imported from an external spectral archive), while the second is a spectrum of the analyzed artifact. Particularly, smaller angles represent a major correlation with the reference spectra [
42,
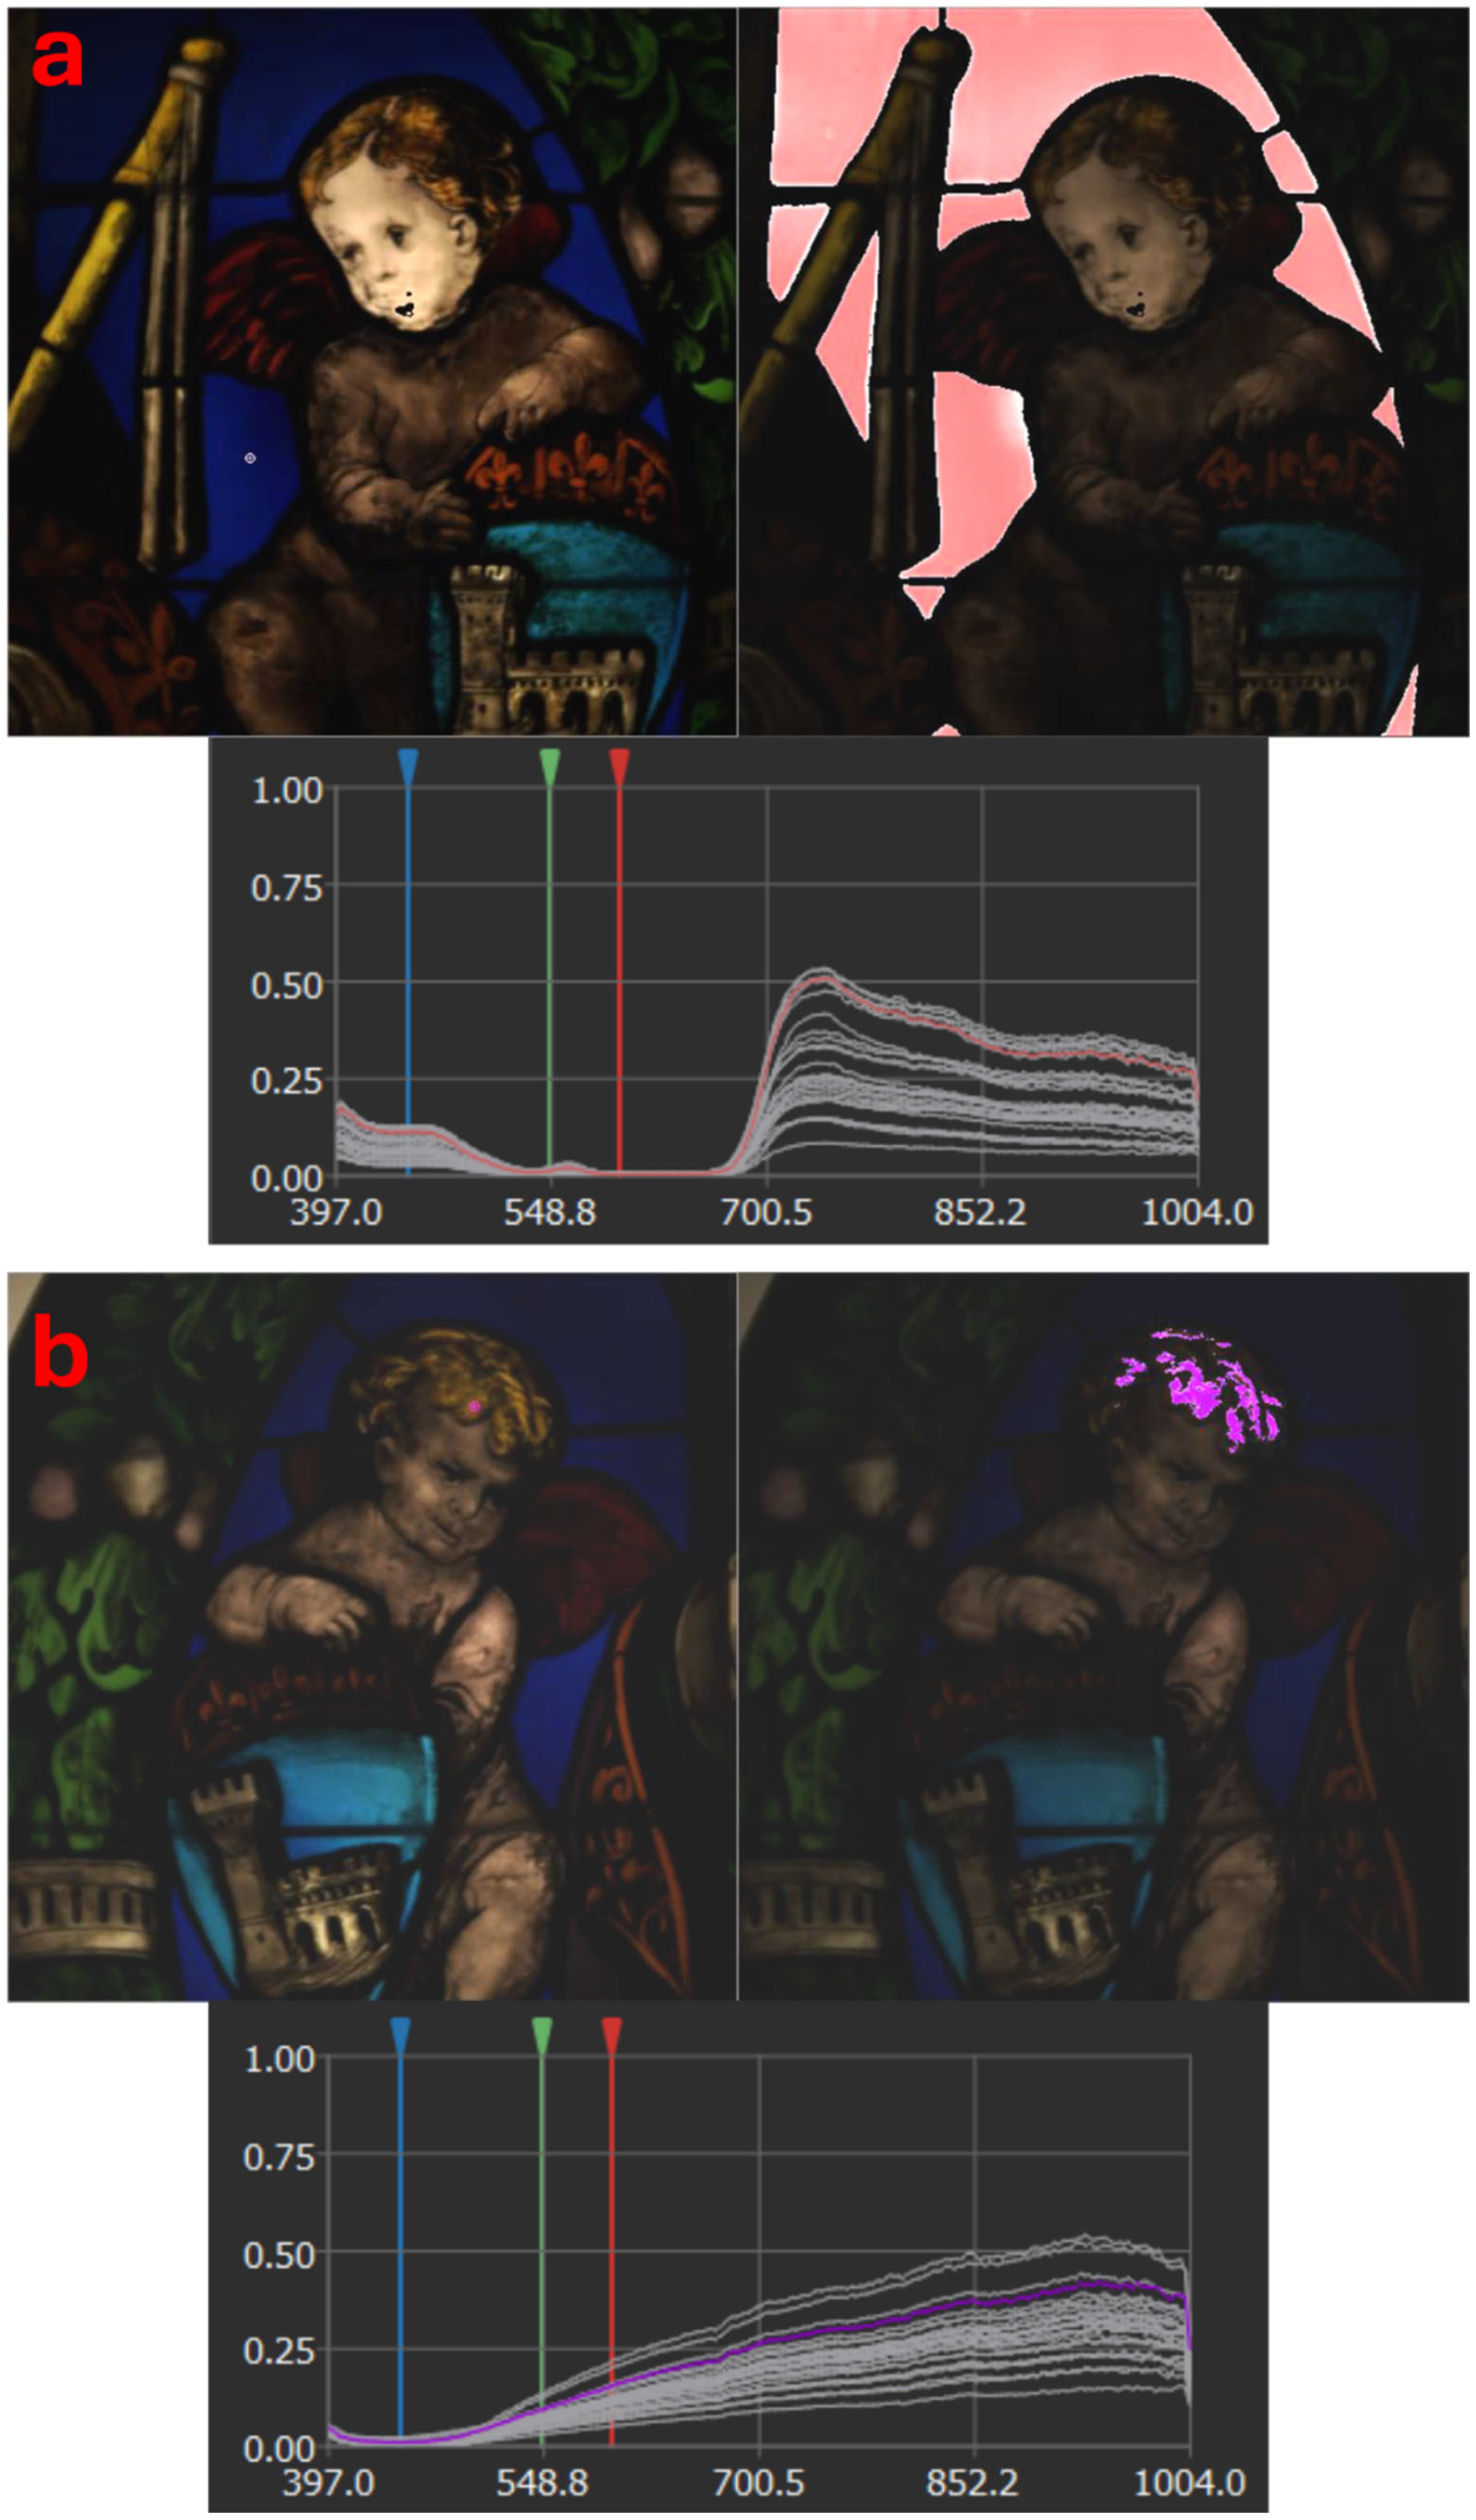
43]. The result of SAM classification is an image mapping the areas with the same spectroscopic features and therefore with the same composition, in this case the glass tesserae characterized by the same chromophore. In
Figure 8 some examples of maps obtained using the SAM algorithm are shown.
3.2.3. Glass Samples Characterization
Four small fragments of glass (SA R M01–SA R M04) were collected along the edges of the rose window in some areas corresponding to the section depicting the garland of leaves and fruit encircling the figure of Saint. Sampling was limited to areas hidden by the lead strip and especially where the glass was already fragmented due to long-term weathering damage, in order to ensure the preservation of the artwork’s integrity. The SEM-EDS analyses of these four samples were performed mainly to detect the elements “invisible” for the pXRF and, given the absence of glass corrosion, to confirm the hypothesis, made by the conservator, that the rose window was obtained using Na-Ca glasses. A polished section of the glass samples, embedded in epoxy resin, was made and subsequently metallized to carry out the SEM-EDS measurements.
In
Table 3, the average results of the elemental analysis of two different areas analyzed for each sample, are shown.
The colorless glass sample (SA R M03) can be considered as the base glass. The high percentage of Na (11.30%) and Ca (4.51%) along with the low content of K (1.61%) confirm the hypothesis that a sodium–calcium glass was used for the rose window. The presence of abundant silicon (24.13%) confirms that the lattice former of the window glasses is silica (SiO2), while the small quantities of Al (0.54%), Fe (0.13%) and Mn (0.15%) suggest the use of a very pure silica source, quartz pebbles, or refined silica sand, characterized by a low content of impurities [
44].
For the two green samples, SA_R M01 e SA_R M02, the SEM EDS analyses, as shown by the XRF data, confirm that the green coloration results from the combined presence of Cu (0.70–0.78%) and Fe (1.92–1.94%) (Cu2+ turquoise and Fe3+ pale-yellow).
For the amber sample SA R M04, it was not simple to identify the nature of the coloring agents. However, despite the low percentages of Fe (0.16%) and S (0.03%), it can be assumed that the color is due to the coordination compound Fe3+-S2−, which gives the glass an intense amber yellow color even in small quantities.
4. The Ghost Image Recovery
As already explained, the rose window suffered from an extensive loss of the original
grisaille, which frequently appeared thinned and incomplete. Severe loss affected particularly Sant’Ambrogio and the angels at his sides faces. In such cases, recovering the legibility of the lost grisaille is essential to restore the visual comprehension of the main figures in the composition (
Figure 9).
From this perspective, being able to highlight the features that originally defined a certain area is fundamental to reconstruct the original representation.
As an example, the process used to recover the
ghost image of the face of Sant’Ambrogio is reported. The same procedure was used for all the other parts where the
grisaille was seriously damaged. This method is inspired by a similar approach applied in the 1990s, which relied on analog photography rather than digital imaging [
13].
The first step was represented by the acquisition of high-resolution RGB images in transmitted light mode from the recto side.
The final images highlight the ghost image, which appears as a satin surface. This is caused by micro-irregularities on the glass surface, where the original grisaille layer was present, that scatter the light through diffusion. This procedure yields a positive image representing both the opaque lines of the drawing, which appear in high contrast, and the areas of shading.
The images were subsequently post-processed using Adobe Photoshop software, applying a series of adjustments in the following steps:
- -
Brightness and contrast were adjusted appropriately.
- -
Using the ‘Mode’ function, the image was converted to black and white.
- -
Color levels were slightly modified, particularly increasing the red and yellow channels to further optimize contrast.
- -
The image was then inverted from positive to negative using the ‘Image’, ‘Adjustments’ and ‘Invert’ commands. In this way, areas that retained the original or retouched grisaille appear white, while the losses appear dark or black. As for the shading, the light areas appear bright and the shadowed areas dark.
- -
To complete the image, the remnants of grisaille and the lead sealings were colored in black.
- -
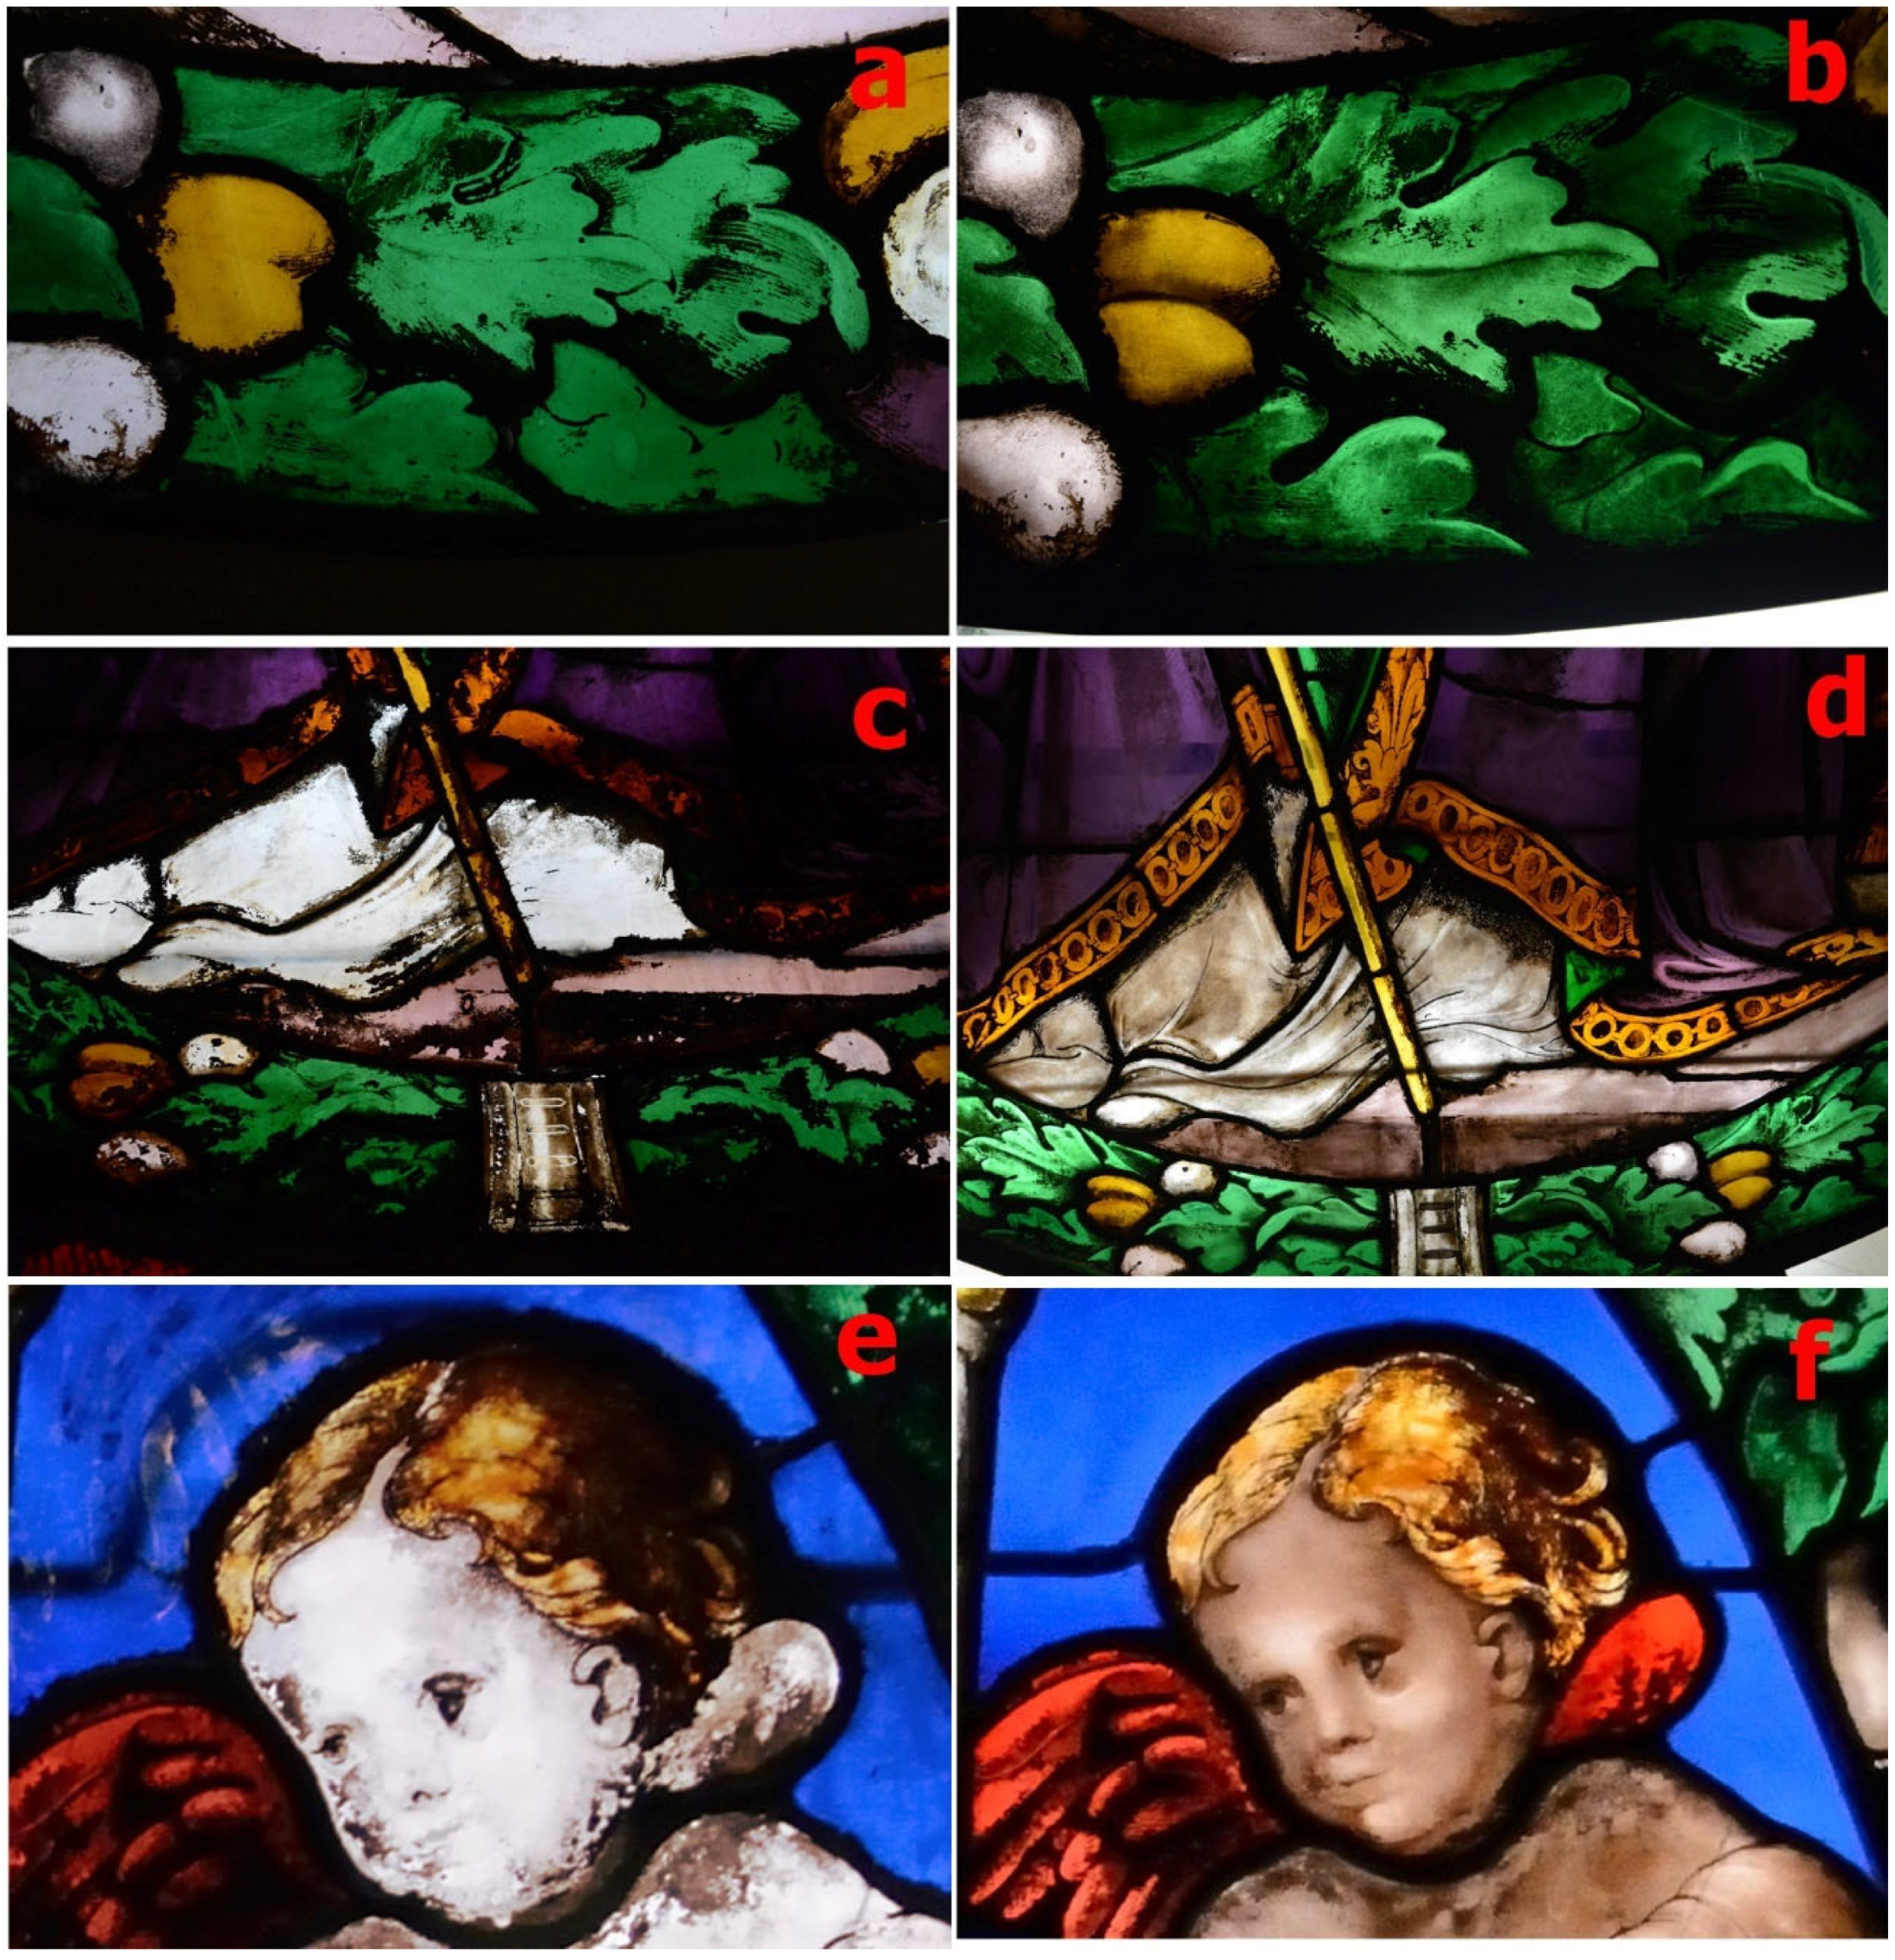
The final images thus obtained give the effect of seeing the lost painting appear, with the lines of the drawing well contrasted and the lights and shadows enhanced and easily interpretable. These images were instrumental in supporting the pictorial reintegration work that restored the original representation (
Figure 10a–c and
Figure 11a–f).
The images obtained through the photographic process guided the conservators in reconstructing the lost drawing and details applying by brushing an extremely fine powder of grisaille suspended in turpentine essence. The use of this solvent ensures that these integrations are fully reversible.
Moreover, the documentation and reconstruction of the lost drawings could provide valuable support to art historians in confirming or reconsidering the attribution of the artwork to Biagio Pupini.
5. Conclusions
The multi-analytical approach used in the study of the rose window of Sant’Ambrogio allowed investigating glass composition and provided initial insights into the raw materials employed, particularly with regard to coloring agents. It allowed the identification of materials used in past restoration interventions. Additionally, it also allowed the identification of some materials used during past restorations.
SEM-EDS confirmed that the historical glass used in the rose window was soda-lime-silicate glass, obtained using pure raw materials (e.g., quartz pebbles or pure silica sand). According to the high contents of Ca, K and Mg (Ca = 4.51%; K = 1.61%; Mg = 0.15%), the use of ashes obtained by the combustion of halophytic plant ashes was assumed. This is consistent with the use of glass related to the Islamic glassmaking tradition
FOS analysis, supported by XRF measurements, allowed the identification of the glass chromophores. With few exceptions, the results were consistent with materials commonly used in medieval stained-glass manufacture.
The blue glass was obtained by adding Co2+, probably originating from mineral deposits extracted from the Freiberg mines in Germany, which were active from the 13th century to the end of the 15th century. The presence of Sn-Cu-based red glass suggested the use of bronze scraps as a source for copper. The purple glasses investigated were colored by adding Mn3+ with a slight contribution of Co2+, added to deepen the purple color. All the analyzed purple glass resulted similar in composition, except from the purple plum on the garland surrounding Sant’Ambrogio. In this case, the presence of arsenic and bismuth allowed hypothesizing the use of a different cobalt mineralization, specifically from the Schneeberg mines in Germany mainly exploited in the 17th and 18th centuries. These findings led to the assumption that this glass tessera is not original. Finally, some yellow glass tesserae were obtained with metallic silver nanoparticles, as traditionally. However, the presence of significant amounts of copper has led to the hypothesis that silver coins (generally in Ag-Cu alloy) were used to produce this glass.
Regarding the retouching of the grisaille carried out in past restoration, FT-IR analyses revealed the presence of organic substances decomposition products, consistent with the possible use of so-called “beverone”. In addition, the sample relating to the possible black varnish used to fill in the drawing was found to be a complex mixture of substances simulating a grisaille and probably applied using a dammar-type resin.
Hyperspectral imaging was successfully applied to provide compositional maps based on the variability of the coloring agents.
Finally, the photographic reconstruction of the ghost image resulted fundamental in detecting lost details. This proved valuable for restorers during conservation interventions, particularly in documenting the grisaille painting, thus contributing to both the preservation of the artwork and its historical documentation.
Author Contributions
G.B.—conceptualization, data curation, formal analysis, investigation, methodology, supervision, writing—original draft, writing—review and editing; A.C.—conceptualization, methodology, supervision, writing—re-view and editing; C.F.—data curation, methodology, writing—original draft, writing—review and editing; E.G.—conceptualization, methodology, data curation, formal analysis, writing—original draft, writing—review and editing; M.P.—formal analysis, investigation, methodology, writing—review and editing; B.S.—formal analysis, investigation, methodology, writing—review and editing. All authors have read and agreed to the published version of the manuscript.
Funding
No financial support for the conducting of the research and preparation of the article.
Data Availability Statement
The original contributions presented in this study are included in the article. Further inquiries can be directed to the corresponding author.
Acknowledgments
The authors thank the Italian National Research Council (CNR) microscopy facility “Ce.M.E.–Centro Microscopie Elettroniche Laura Bonzi” for providing the facilities for the Gaia 3 (Tescan s.r.o, Brno, Czech Republic).
Conflicts of Interest
The authors declare that they have no known competing financial interests or personal relationships that could have appeared to influence the work reported in this paper.
References
- Medica, M. Su alcune vetrate rinascimentali del Museo Civico Medievale di Bologna. In Arti a Confronto, Studi in Onore Di Anna Maria Matteucci; Editrice Compositori: Bologna, Italy, 2004. [Google Scholar]
- Origine Bologna. Marsili. Available online: https://www.originebologna.com/torri/marsili/ (accessed on 13 April 2025).
- Corallini, A.; Bertuzzi, V. Il Restauro delle Vetrate; Nardini Edit: Fiesole, Italy, 1994. [Google Scholar]
- Vilarigues, M.; Machado, C.; Machado, A.; Costa, M.; Alves, L.C.; Cardoso, I.P.; Ruivo, A. Grisailles: Reconstruction and characterization of historical recipes. Int. J. Appl. Glass Sci. 2020, 11, 756–773. [Google Scholar] [CrossRef]
- Babini, A.; Lombardo, T.; Schmidt-Ott, K.; George, S.; Hardeberg, J.Y. Acquisition strategies for in-situ hyperspectral imaging of stained-glass windows: Case studies from the Swiss National Museum. Herit. Sci. 2023, 11, 74. [Google Scholar] [CrossRef]
- Babini, A.; Green, P.; George, S.; Hardeberg, J.Y. Comparison of Hyperspectral Imaging and Fiber-Optic Reflectance Spectroscopy for Reflectance and Transmittance Measurements of Colored Glass. Heritage 2022, 5, 1401–1418. [Google Scholar] [CrossRef]
- Babini, A.; George, S.; Lombardo, T.; Hardeberg, J.Y. Potential and challenges of spectral imaging for documentation and analysis of stained-glass windows. In Proceedings of the London Imaging Meeting 2020: Future Colour Imaging, Online, 30 September–1 October 2020; Society for Imaging Science and Technology: Springfield, VA, USA, 2020; Volume 1, pp. 109–113. [Google Scholar]
- Babini, A.; George, S.; Hardeberg, J.Y. Hyperspectral imaging workflow for the acquisition and analysis of stained-glass panels. In Proceedings of the Optics for Arts, Architecture, and Archaeology VIII, Virtual Event, 21–25 June 2021; SPIE: Bellingham, WA, USA, 2021; Volume 11784, pp. 198–207. [Google Scholar]
- Babini, A.; George, S.; Lombardo, T.; Hardeberg, J.Y. A Portable Set up for Hyperspectral Imaging of Stained-Glass Panels. In Proceedings of the International Conference Florence Heri-Tech: The Future of Heritage Science and Technologies, Florence, Italy, 16–18 May 2022; Springer: Cham, Switzerland, 2022; pp. 57–70. [Google Scholar]
- Palomar, T.; Grazia, C.; Cardoso, I.P.; Vilarigues, M.; Miliani, C.; Romani, A. Analysis of chromophores in stained-glass windows using Visible Hyperspectral Imaging in-situ. Spectrochim. Acta Part A Mol. Biomol. Spectrosc. 2019, 223, 117378. [Google Scholar] [CrossRef]
- Perri, A.; de Faria, B.N.; Ferreira, D.T.; Comelli, D.; Valenitni, G.; Preda, F.; Polli, D.; De Paula, A.; Cerullo, G.; Manzoni, C. Hyperspectral imaging with a TWINS birefringent interferometer. Opt. Express 2019, 27, 15956–15967. [Google Scholar] [CrossRef] [PubMed]
- Kessy, S.J.; Funatomi, T.; Kitano, K.; Fujimura, Y.; Caron, G.; Mouaddib, E.M.; Mukaigawa, Y. Hyperspectral Imaging of In-Site Stained Glasses: Illumination Variation Compensation Using Two Perpendicular Scans. In Proceedings of the IEEE/CVF International Conference on Computer Vision, Paris, France, 2–6 October 2023; pp. 1662–1670. [Google Scholar]
- Casini, A.; Corallini, A.; Lotti, F.; Stefani, L. Un metodo di rilevazione e di ricostruzione del dipinto a grisaglia perduto, applicato ad un manufatto di arte vetraria del XVI secolo. Kermes 1995, 8, 3–10. [Google Scholar]
- Farmer, V.C. The Infrared Spectra of Minerals; Mineralogical society London: London, UK, 1974; Volume 4, pp. 51–67. [Google Scholar]
- Gadsden, J.A. Infrared Spectra of Minerals and Related Inorganic Compounds; Butterworth: London, UK, 1975; p. 66. [Google Scholar]
- Bracci, S.; Burnam, R.; Corallini, A.; Picollo, M.; Vervat, M. The conservation of stained-glass windows attributed to the Master of Figline in Florence. Kermes-La Riv. Del Restauro 2017, 100, 133–148. [Google Scholar]
- Genestar, C.; Pons, C. Earth pigments in painting: Characterisation and differentiation by means of FTIR spectroscopy and SEM-EDS microanalysis. Anal. Bioanal. Chem. 2005, 382, 269–274. [Google Scholar] [CrossRef] [PubMed]
- Müller, C.M.; Pejcic, B.; Esteban, L.; Piane, C.D.; Raven, M.; Mizaikoff, B. Infrared attenuated total reflectance spectroscopy: An innovative strategy for analyzing mineral components in energy relevant systems. Sci. Rep. 2014, 4, 6764. [Google Scholar] [CrossRef] [PubMed]
- Ruan, H.D.; Frost, R.L.; Kloprogge, J.T.; Duong, L. Infrared spectroscopy of goethite dehydroxylation: III. FT-IR microscopy of in situ study of the thermal transformation of goethite to hematite. Spectrochim. Acta Part A Mol. Biomol. Spectrosc. 2002, 58, 967–981. [Google Scholar] [CrossRef]
- Ramaswamy, V.; Vimalathithan, R.M.; Ponnusamy, V. Synthesis and characterization of BaSO4 nano particles using micro emulsion technique. Adv. Appl. Sci. Res. 2010, 1, 197–204. [Google Scholar]
- Saikia, B.J. Spectroscopic estimation of geometrical structure elucidation in natural SiO2 crystal. J. Mater. Phys. Chem. 2014, 2, 28–33. [Google Scholar] [CrossRef]
- Price, B.; The Philadelphia Museum of Art, Philadelphia. INR00234, Dammar Varnish, Toch, 65+ Yrs. In Infrared and Raman Users Group Spectral Database; Price, B.A., Pretzel, B., Lomax, S.Q., Eds.; Infrared and Raman Users Group: Philadelphia, PA, USA, 2007; Available online: www.irug.org (accessed on 28 October 2025).
- Bacci, M.; Picollo, M. Non-destructive spectroscopic detection of cobalt (II) in paintings and glass. Stud. Conserv. 1996, 41, 136–144. [Google Scholar] [CrossRef]
- Roy, A.; National Gallery of Art. Artists’ Pigments: A Handbook of Their History and Characteristics; National Gallery of Art: Washington, DC, USA, 1993; Volume 2. [Google Scholar]
- Molera, J.; Climent-Font, A.; Garcia, G.; Pradell, T.; Vallcorba, O.; Zucchiatti, A. Experimental study of historical processing of cobalt arsenide ore for colouring glazes (15–16th century Europe). J. Archaeol. Sci. Rep. 2021, 36, 102797. [Google Scholar] [CrossRef]
- Van Wersch, L.; Loisel, C.; Mathis, F.; Strivay, D.; Bully, S. Analyses of early medieval stained window glass from the monastery of Baume-Les-Messieurs (Jura, France). Archaeometry 2016, 58, 930–946. [Google Scholar] [CrossRef]
- Mirti, P.; Davit, P.; Gulmini, M. Colourants and opacifiers in seventh and eighth century glass investigated by spectroscopic techniques. Anal. Bioanal. Chem. 2002, 372, 221–229. [Google Scholar] [CrossRef]
- Fornacelli, C.; Ceglia, A.; Bracci, S.; Vilarigues, M. The role of different network modifying cations on the speciation of the Co2+ complex in silicates and implication in the investigation of historical glasses. Spectrochim. Acta Part A Mol. Biomol. Spectrosc. 2018, 188, 507–515. [Google Scholar] [CrossRef] [PubMed]
- Gratuze, B.; Soulier, I.; Barrandon, J.N.; Foy, D. The origin of cobalt blue pigments in French glass from the thirteenth to the eighteenth centuries. In Trade and Discovery: The Scientific Study of Artefacts from Post-Medieval Europe and Beyond; British Museum: London, UK, 1995; Volume 109, pp. 123–132. [Google Scholar]
- Verità, M.; Paola, S.; Conventi, A. Studio dei materiali costitutivi di vetrate medievali dal complesso basilicale di San Francesco in Assisi. Boll. ICR 2010, 20, 17–45. [Google Scholar]
- Colomban, P.; Tournie, A.; Ricciardi, P. Raman spectroscopy of copper nanoparticle-containing glass matrices: Ancient red stained-glass windows. J. Raman Spectrosc. 2009, 40, 1949–1955. [Google Scholar] [CrossRef]
- Nakai, I.; Numako, C.; Hosono, H.; Yamasaki, K. Origin of the red color of Satsuma copper-ruby glass as determined by EXAFS and optical absorption spectroscopy. J. Am. Ceram. Soc. 1999, 82, 689–695. [Google Scholar] [CrossRef]
- Bracci, S.; Bartolozzi, G.; Burnam, R.; Corallini, A. Integration of both non-invasive and micro-invasive techniques for the archaeometric study of the stained-glass window Apparizione degli Angeli in the basilica of Santa Croce in Florence, Italy. J. Cult. Herit. 2020, 44, 307–316. [Google Scholar] [CrossRef]
- Brun, N.; Mazerolles, L.; Pernot, M. Microstructure of opaque red glass containing copper. J. Mater. Sci. Lett. 1991, 10, 1418–1420. [Google Scholar] [CrossRef]
- Picollo, M.; Aceto, M.; Vitorino, T. UV-Vis spectroscopy. In Chemical Analysis in Cultural Heritage; De Gruyter: Berlin, Germany, 2019; pp. 99–120. [Google Scholar]
- Delgado, J.; Vilarigues, M.; Ruivo, A.; Corregidor, V.; Da Silva, R.C.; Alves, L.C. Characterisation of medieval yellow silver stained glass from Convento de Cristo in Tomar, Portugal. Nucl. Instrum. Methods Phys. Res. Sect. B. 2011, 269, 2383–2388. [Google Scholar] [CrossRef]
- Jembrih-Simbuerger, D.; Schalm, O.; Fredrickx, P.; Schreiner, M.; De Vis, K.; Mäder, M.; Schryvers, D.; Caen, J. The colour of silver stained glass—Analytical investigations carried out with XRF, SEM/EDX, TEM, and IBA. J. Anal. At. Spectrom. 2002, 17, 321–328. [Google Scholar] [CrossRef]
- Biron, I.; Chopinet, M.H. Colouring, decolouring and opacifying of glass. In Modern Methods for Analysing Archaeological and Historical Glass; Wiley: Chichester, UK, 2013; Volume 1, pp. 49–65. [Google Scholar]
- Möncke, D.; Papageorgiou, M.; Winterstein-Beckmann, A.; Zacharias, N. Roman glasses coloured by dissolved transition metal ions: Redox-reactions, optical spectroscopy and ligand field theory. J. Archaeol. Sci. 2014, 46, 23–36. [Google Scholar] [CrossRef]
- Schreurs, J.W.; Brill, R.H. Iron and sulfur related colors in ancient glasses. Archaeometry 1984, 26, 199–209. [Google Scholar] [CrossRef]
- Van der Linden, V.; Cosyns, P.; Schalm, O.; Cagno, S.; Nys, K.; Janssens, K.; Nowak, A.; Wagner, B.; Bulska, E. Deeply coloured and black glass in the northern provinces of the Roman Empire: Differences and similarities in chemical composition before and after AD 150. Archaeometry 2009, 51, 822–844. [Google Scholar] [CrossRef]
- Pelagotti, A.; Del Maisto, A.; De Rosa, A.; Piva, A. Multispectral Imaging of Paintings. IEEE Signal Process. Mag. 2008, 25, 27–36. [Google Scholar] [CrossRef]
- Cucci, C.; Delaney, J.; Picollo, M. Reflectance Hyperspectral Imaging for Investigation of Works of Art: Old Master Paintings and Illuminated Manuscripts. Acc. Chem. Res. 2016, 49, 2070–2079. [Google Scholar] [CrossRef]
- Coutinho, I.; Medici, T.; Gratuze, B.; Ruivo, A.; Dinis, P.; Lima, A.; Vilarigues, M. Sand and Pebbles: The Study of Portuguese Raw Materials for Provenance Archaeological Glass. Minerals 2022, 12, 193. [Google Scholar] [CrossRef]
Figure 1.
Image of the rose window after restoration.
Figure 1.
Image of the rose window after restoration.
Figure 2.
Detail images of the Saint (a) and the left angel (b) highlighting the interventions of cold integrations of the grisaille.
Figure 2.
Detail images of the Saint (a) and the left angel (b) highlighting the interventions of cold integrations of the grisaille.
Figure 3.
FT-IR spectrum and OM image of sample SA_R_D01.
Figure 3.
FT-IR spectrum and OM image of sample SA_R_D01.
Figure 4.
Comparison of FT-IR spectrum of the organic fraction of sample SA_R_D01 (red line) and the IRUG database (Edition 2007) reference spectrum (INR00234) [
22] of an aged Dammar resin (black line).
Figure 4.
Comparison of FT-IR spectrum of the organic fraction of sample SA_R_D01 (red line) and the IRUG database (Edition 2007) reference spectrum (INR00234) [
22] of an aged Dammar resin (black line).
Figure 5.
FOS (a) and XRF (b) spectra of purple glass.
Figure 5.
FOS (a) and XRF (b) spectra of purple glass.
Figure 6.
FOS (a) and XRF (b) spectra of red glass.
Figure 6.
FOS (a) and XRF (b) spectra of red glass.
Figure 7.
FOS (a) and XRF (b) spectra of yellow glass.
Figure 7.
FOS (a) and XRF (b) spectra of yellow glass.
Figure 8.
(a) On the left, the RGB image of the investigated area (acquired by the IQ camera), the white dot corresponds to the pixel taken as reference of the blue glass; on the right, the SAM map result for the blue glass (Co2+ with tetrahedral coordination) behind the angel (the pink area corresponds to the portion of glass where similar spectra are collected); below, spectra (x axis in nm, y axis transmittance) collected on the pink area, the red one is the reference corresponding to the white dot in the RGB image. (b) On the left, the RGB image of the investigated area (acquired by the IQ camera), the red dot corresponds to the pixel taken as reference of the yellow glass; on the right, the SAM map result for the yellow glass (Ag (0) colloidal particles) of the hairs of the angel on the left; below, spectra (x axis in nm, y axis transmittance) collected on the magenta area, the violet one is the reference corresponding to the red dot in the RGB image.
Figure 9.
Image of the rose window before restoration showing the evident loss of the grisaille in many areas: the faces of the Saint and the angels, the white dress of the Saint, the green crown of leaves.
Figure 9.
Image of the rose window before restoration showing the evident loss of the grisaille in many areas: the faces of the Saint and the angels, the white dress of the Saint, the green crown of leaves.
Figure 10.
Sant’Ambrogio’s face before restoration (a), ghost image recovered by means of photographic elaboration (b), result after restoration (c).
Figure 10.
Sant’Ambrogio’s face before restoration (a), ghost image recovered by means of photographic elaboration (b), result after restoration (c).
Figure 11.
Details of the green crown of leaves (a) before and (b) after restoration; white dress of Sant’Ambrogio (c) before and (d) after restoration; face of the angel on the right (e) before and (f) after restoration.
Figure 11.
Details of the green crown of leaves (a) before and (b) after restoration; white dress of Sant’Ambrogio (c) before and (d) after restoration; face of the angel on the right (e) before and (f) after restoration.
Table 1.
FT-IR analysis of the materials identified in the deposit and alteration samples.
Table 1.
FT-IR analysis of the materials identified in the deposit and alteration samples.
| Sample ID | Absorption Band (cm−1) | Identified Materials | Identified Material
After Extraction |
|---|
| SA_R_D01 | 3695, 3652, 3620, 1033, 1010, 914, 540, 471 | Kaolinite (Al2Si2O5(OH)4), | --- |
| SA_R_D01 | 2518, 1431, 878, 715 | Calcite (CaCO3) | --- |
| SA_R_D01 | 3225, 912, 799, 612 | Goethite (α-FeO(OH)) | --- |
| SA_R_D01 | 1200–1050, 635, 610 | Barium sulphate (BaSO4) | --- |
| SA_R_D01 | 1100, 800, 780 | Quartz (SiO2) | --- |
| SA_R_D01, SA_R_D02, SA_R_D03, SA_R_D04 | 3540, 3405, 1118, 637, 602 | Gypsum (CaSO4·2(H2O)) | --- |
| SA_R_D01, SA_R_D02, SA_R_D03, SA_R_D04 | 1620, 1323 | Calcium oxalate (CaC2O4) | --- |
| SA_R_D01, SA_R_D02, SA_R_D03, SA_R_D04 | 1384 | Nitrates (Na(or K)NO3) | --- |
| SA_R_D01 | 2928, 2852, 1715 | Organic material (νCH and νC=O vibrations) | Dammar resin |
Table 2.
Results of FOS and XRF analyses for the different glass samples are reported. In the third column, the detected elements are listed according to their relative abundance, based on spectral counts normalized to the Rhodium signal. The fourth column reports the glass chromophore and the associated electronic transition (LF = Ligand Field, SPR = Surface Plasmon Resonance, CT = Charge Transfer).
| Glass Color | FOS Spectral Features/Absorption Bands (nm) | XRF Elements | Glass Chromophore and Associated Electronic Transition |
|---|
| Blue | 378 nm and 445 nm attributed to Fe3+.
533 nm, 594 nm and 648 nm attributed to Co2+. | High abundance: Fe
Medium abundance: Ca, Co, Mn, Cu, Pb, Sn
Low abundance: Si, K, Ti, Ni, Sr
Traces: S | Co2+ (d-d, LF) |
| Light blue | 700–900 nm (maximum absorbance around 800 nm) attributed to Cu2+. | High abundance: Cu
Medium abundance: Ca
Low abundance: Fe, K, Pb, Ti, Sr
Traces: Si, Mn, S, Ni | Cu2+ (d-d, LF) |
| Green | Absorption till 400–450 nm depending on the Fe3+ abundance.
700–900 nm (maximum absorbance around 800 nm) attributed to Cu2+ and probable contribute of Fe2+. | High abundance: Cu, Fe
Medium abundance: Ca
Low abundance: K, Pb, Sr, S, Ti
Traces: Si, Mn, Ni | Cu2+ (d-d, LF) and
Fe3+ (d-d, LF) |
| Purple | 380 nm attributed to Fe3+.
500 nm attributed to Mn3+.
533 nm, 593 nm and 650 nm attributed to Co2+. | High abundance: Mn
Medium abundance: Fe, Ca
Low abundance: Co, K, Si, Ti, Sr
Traces: Cu, Pb, S, Ni | Mn3+ (d-d, LF) and
Co2+ (d-d, LF) |
| Purple 2 (plum) | 380 nm attributed to Fe3+.
500 nm attributed to Mn3+.
533 nm, 594 nm and 650 nm attributed to Co2+. | High abundance: Mn
Medium abundance: Fe, Ca, As
Low abundance: Co, K, Si, Bi, Ti, Sr, Ni
Traces: Cu, Pb, S | Mn3+ (d-d, LF) and
Co2+ (d-d, LF) |
| Red | 450 nm with reflectance maximum around 570 attributed to Cu (0).
900–1200 nm (maximum absorbance around 970 nm) attributed to Fe2+. | High abundance: Ca
Medium abundance: Fe
Low abundance: Mn, Cu, K, Ti, Ni, Sr
Traces: Si, S, Pb | Cu(0) (SPR) |
| Pink | 380 nm attributed to Fe3+.
515 nm attributed to Mn3+.
970 nm attributed to Fe2+. | Medium abundance: Ca, Fe, Mn, Sr
Low abundance: K, Si, Cu, Ni, Ti
Traces: S, Pb | Mn3+ (d-d, LF) |
| Yellow | 450 nm, 465 nm and 485 nm for the three different measurement points. | Medium abundance: Ca, Ag, Fe, Mn
Low abundance: K, Cu, Si, Ti, Ni, Sr
Traces: S, Pb | Ag(0) (SPR) |
| Amber | 410 nm attributed to Fe3+-S2− complex.
900–1200 nm attributed to Fe2+. | Medium abundance: Ca, Fe, K
Low abundance: Mn, Cu, Si, Ti, Ni, Sr, Pb, S | Fe3+-S2− (CT) |
| Colorless | 380 nm attributed to Fe3+. | -- | None |
Table 3.
SEM-EDS analysis average results of the elemental analysis for each sample.
Table 3.
SEM-EDS analysis average results of the elemental analysis for each sample.
| | Elements Weight % |
|---|
| Sample ID | C | O | Na | Mg | Al | Si | S | Cl | K | Ca | Mn | Fe | Cu | Pb |
|---|
SA R M01
Green
sample | 20.13 | 35.89 | 10.46 | 0.82 | 0.46 | 21.95 | - | 0.59 | 2.16 | 4.13 | 0.09 | 1.94 | 0.78 | 0.25 |
SA R M02
Green
sample | 14.88 | 38.94 | 11.53 | 0.96 | 0.50 | 23.09 | - | 0.67 | 2.24 | 4.17 | 0.08 | 1.92 | 0.70 | 0.29 |
SA R M03
Colorless sample | 16.50 | 38.71 | 11.30 | 1.55 | 0.54 | 24.13 | - | 0.57 | 1.61 | 4.51 | 0.15 | 0.13 | - | 0.15 |
SA R M04
Yellow
sample | 14.01 | 39.39 | 10.35 | 1.30 | 0.61 | 25.23 | 0.03 | 0.66 | 3.29 | 4.81 | 0.07 | 0.16 | 0.09 | - |
| Disclaimer/Publisher’s Note: The statements, opinions and data contained in all publications are solely those of the individual author(s) and contributor(s) and not of MDPI and/or the editor(s). MDPI and/or the editor(s) disclaim responsibility for any injury to people or property resulting from any ideas, methods, instructions or products referred to in the content. |
© 2025 by the authors. Licensee MDPI, Basel, Switzerland. This article is an open access article distributed under the terms and conditions of the Creative Commons Attribution (CC BY) license (https://creativecommons.org/licenses/by/4.0/).

