1. Introduction
Textiles have played a fundamental role in human history, from clothing to decorative purposes, serving not only practical functions, such as protection from the elements, but also demonstrating economic and social status, together with religious affiliation and cultural identity [
1,
2,
3,
4,
5,
6,
7,
8]. Since ancient times, textiles have been produced by fibers derived from plant and animal sources, and inorganic materials, including metal threads and asbestos, while cellulosic man-made and synthetic fibers were introduced on an industrial scale in the 1950s.
Within the framework of archaeometric studies, textiles—and the fibers they are composed of—offer insights into cultural practices, trade routes, and technological development through time. Traditional macroscopic textile analysis focuses on yarn making, weaving, and knitting techniques. Diagnostic features, such as thread twisting direction, tightness and thickness of the thread, number and twisting direction of threads that compose the yarn, warp-weft count, and pore size, define the textile under study [
2,
4,
5,
8,
9]. These features often survive even in degraded and mineralized textiles, making them valuable for historical studies. In some cases, such diagnostic techniques are invasive and destructive due to the need for sampling and extensive sample preparation [
6,
10,
11].
The methodology regarding textile recognition depends on visual inspection of macroscopic textile features with the naked eye, enhanced with a magnifying glass, or with optical and electron microscopy [
5,
8]. Given the time-consuming nature of these methods, the possibility of human error cannot be ignored [
5], especially when dealing with degraded and mineralized textile remains, where morphology interpretation requires highly specialized expertise [
9]. In cases where fibers exhibit similar morphological features, misidentification can easily occur, and the overall picture of the textiles that also preserve archaeologically relevant information may be overlooked, such as their macroscopic features, including thread and weave type [
1,
3,
6,
8].
In alignment with the growing demand for non-destructive and non-invasive methods of analysis for textile classification and documentation, artificial intelligence (AI) has been increasingly employed not only in heritage science, but also in the textile industry, including tasks as weaving parameter estimation and recognition [
5,
12]. Textile recognition and classification have gained significant traction in applications related to cultural preservation, documentation, and analysis. Recent studies have employed pretrained deep learning models such as ResNet-50 and MobileNet to classify traditional woven textile patterns, achieving accuracy above 94% even under conditions like image rotation and varying lighting [
13]. Moreover, hybrid models like YOLOv4-ViT and GANs have been used to detect and restore damaged ancient textiles, supporting the reconstruction of cultural artifacts [
14]. On an ethnographic level, convolutional neural networks (CNNs) have been applied to the classification of handwoven designs from the Kalinga tribe in the Philippines, aiding digital preservation of regional textile identities [
15]. Finally, large-scale datasets, featuring over 760,000 images, provide a unified benchmark for textile classification in both fashion and cultural heritage domains [
16].
Pretrained computer vision models offer a powerful starting point for textile classification tasks, leveraging features learned from large datasets such as ImageNet [
17]. However, unbalanced datasets, where some classes have significantly fewer samples than others, pose significant challenges to image classification [
18], as models can end up biased toward the majority classes, while underperforming the minority classes [
19]. This is a common problem in real-world applications, including textile datasets, and specifically textiles of archaeological interest, where some rare or specialized classes may have limited representation, affecting the ability of models trained on balanced benchmarks to generalize effectively [
20]. Such imbalances bias model performance toward majority classes and distort evaluation metrics, such as accuracy, failing to capture minority class performance [
21]. Different architectures, such as CNNs, transformers, and hybrid models, each respond differently to long-tailed data distributions and class imbalance, both in terms of learning dynamics and generalization capacity [
18,
22,
23].
This preliminary study investigates the potential of using pretrained deep learning models for textile classification, using conventional magnification images, within the scope of non-invasive analysis in heritage science. Such images, capturing macroscopic textile features, like fiber bundle and weave appearance and structure, texture, and glow, can be acquired with standard cameras or smartphones. This offers a faster, non-invasive, and non-destructive alternative to traditional microscopic methods, which are time consuming, and rely on specialized expertise. For this reason, six pretrained computer vision models of different architectures are examined and compared, focusing on their performance when adapting to a highly imbalanced textile image dataset. Apart from classification accuracy, the study also evaluates energy consumption and carbon emissions associated with model training and deployment. The environmental impact of artificial intelligence models has become an increasingly important consideration in several fields, as sustainability is valued. With this preliminary evaluation of the balance between classification accuracy, energy cost, and carbon emissions, the practical and ecological implications of model selection are considered for future applications of AI in cultural heritage. This approach is moving textile identification into a scalable and in situ applied method, making it attractive for fields apart from heritage-related ones, such as forensics and the textile industry [
5,
8,
24]. This preliminary study focuses on model performance under control conditions, using a publicly available dataset of contemporary textiles. Future work will involve constructing an image library dedicated to archaeological textiles, enabling model training and testing under authentic preservation states, imaging conditions, and sample heterogeneity.
3. Results
3.1. Per-Model Evaluation
The models were evaluated for textile classification using macroscopic images from the FABRICS dataset, which is characterized by significant class imbalance. The evaluation focused on the classification performance, the training process through the loss and accuracy curves, and the ability of the model to handle the imbalance problem. In general, all models achieved high overall accuracy, but with significant differences in performance for minority textile categories, as presented in the following sections.
3.1.1. ResNet50
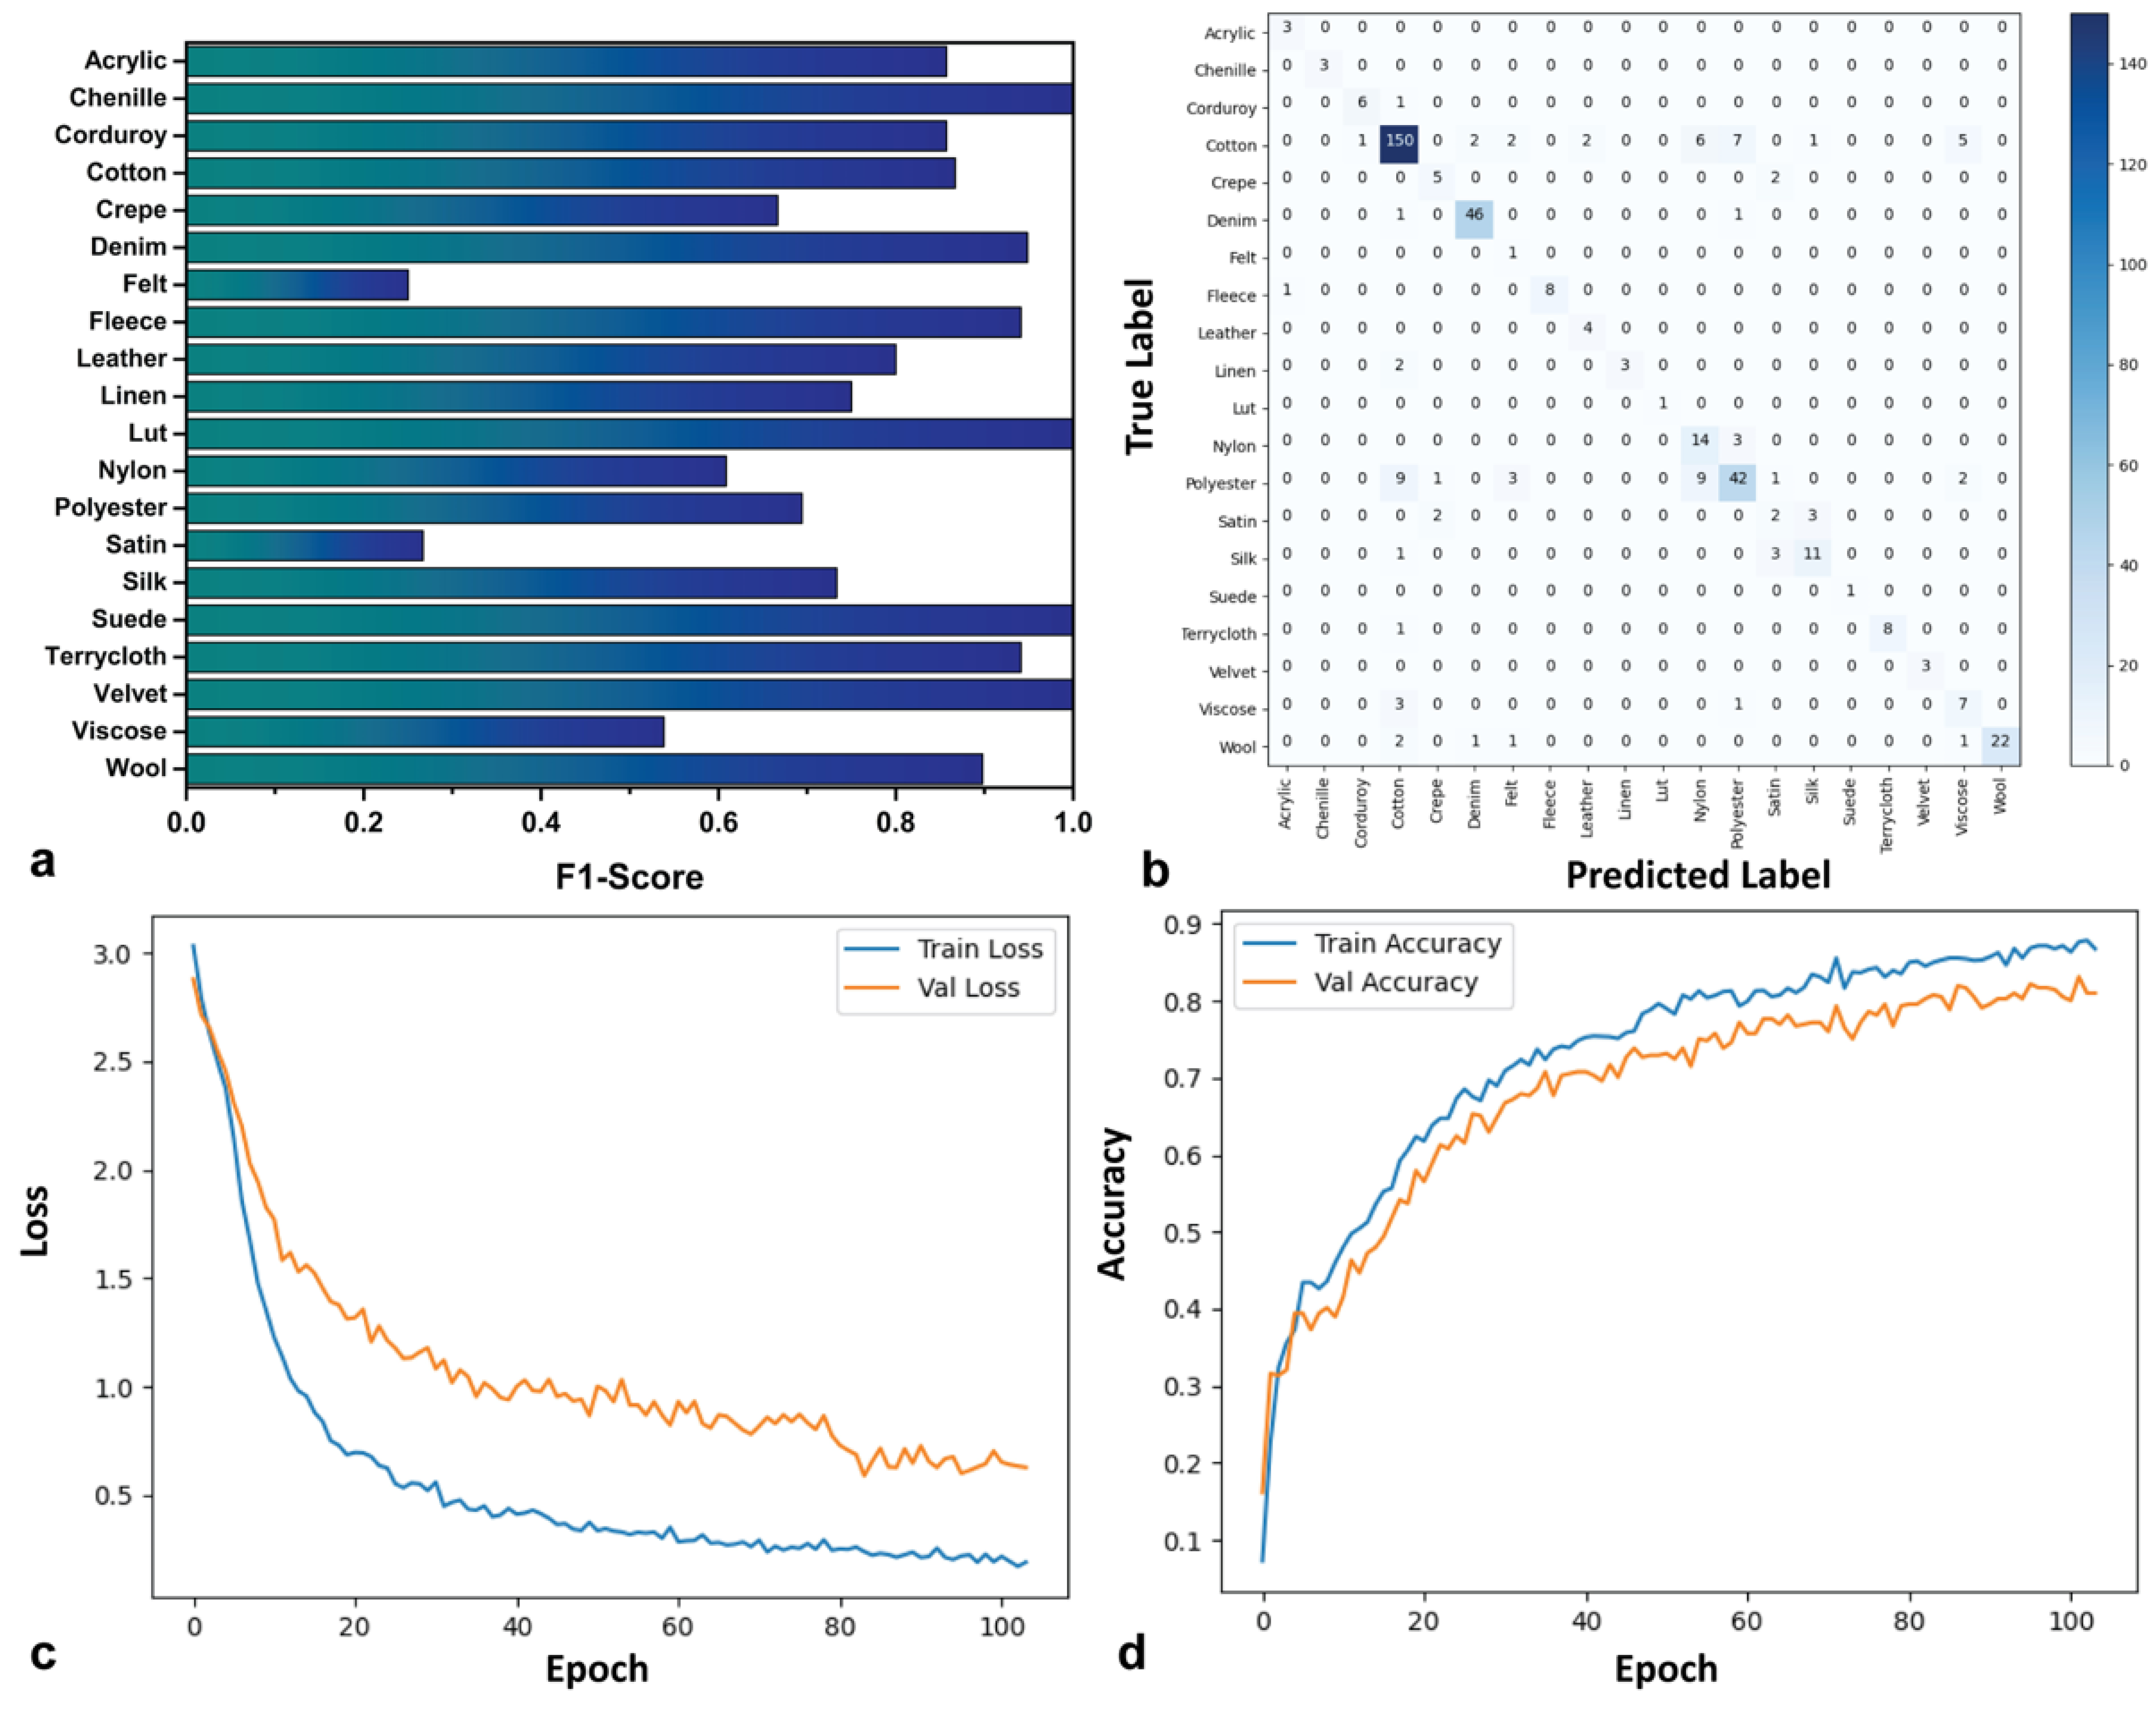
From the classification report (
Figure 1a) and confusion matrix (
Figure 1b), RestNet50 shows strong performance in identifying dominant classes and avoids false positive predictions, for example, in the classes Denim (f1-score: 0.95) and Cotton (f1-score: 0.87), followed by Polyester (f1-score: 0.69). On the other hand, the model struggles significantly with Satin (f1-score: 0.27, precision: 0.20, recall: 0.39) and Felt (f1-score: 0.25), indicating substantial difficulty in learning features of these classes. Moderate performance is demonstrated for Crepe (f1-score: 0.67) and Viscose (f1-score: 0.53), the latter presenting well-balanced recall and precision (both of 0.78%). Minority classes such as Chenille, Suede, Velvet, and Lut present a perfect f1-score of 1.00, but with minimal validation support, due to the number of samples in the validation set (between 1 and 3). Perfect performance on such a small number of samples may not generalize to larger sets and is not a strong indication of generalized ability.
The training loss curve (
Figure 1c) decreases steadily, reaching a value of 0.19 at epoch 100, indicating that the model is learning efficiently from the training data. The validation loss curve starts higher and fluctuates, and at 0.63, it is notably higher than the training loss of 0.19 at the end, suggesting a slight overfitting. Similarly, the training accuracy (
Figure 1d) increases rapidly in the initial epochs and then stabilizes at high levels, reaching 86.76%. This suggests that the model learns effectively to recognize textiles in the training set. The validation accuracy reaches 81.00%, showing good generalization, but this can be improved given the gap with training accuracy.
3.1.2. EfficientNetV2
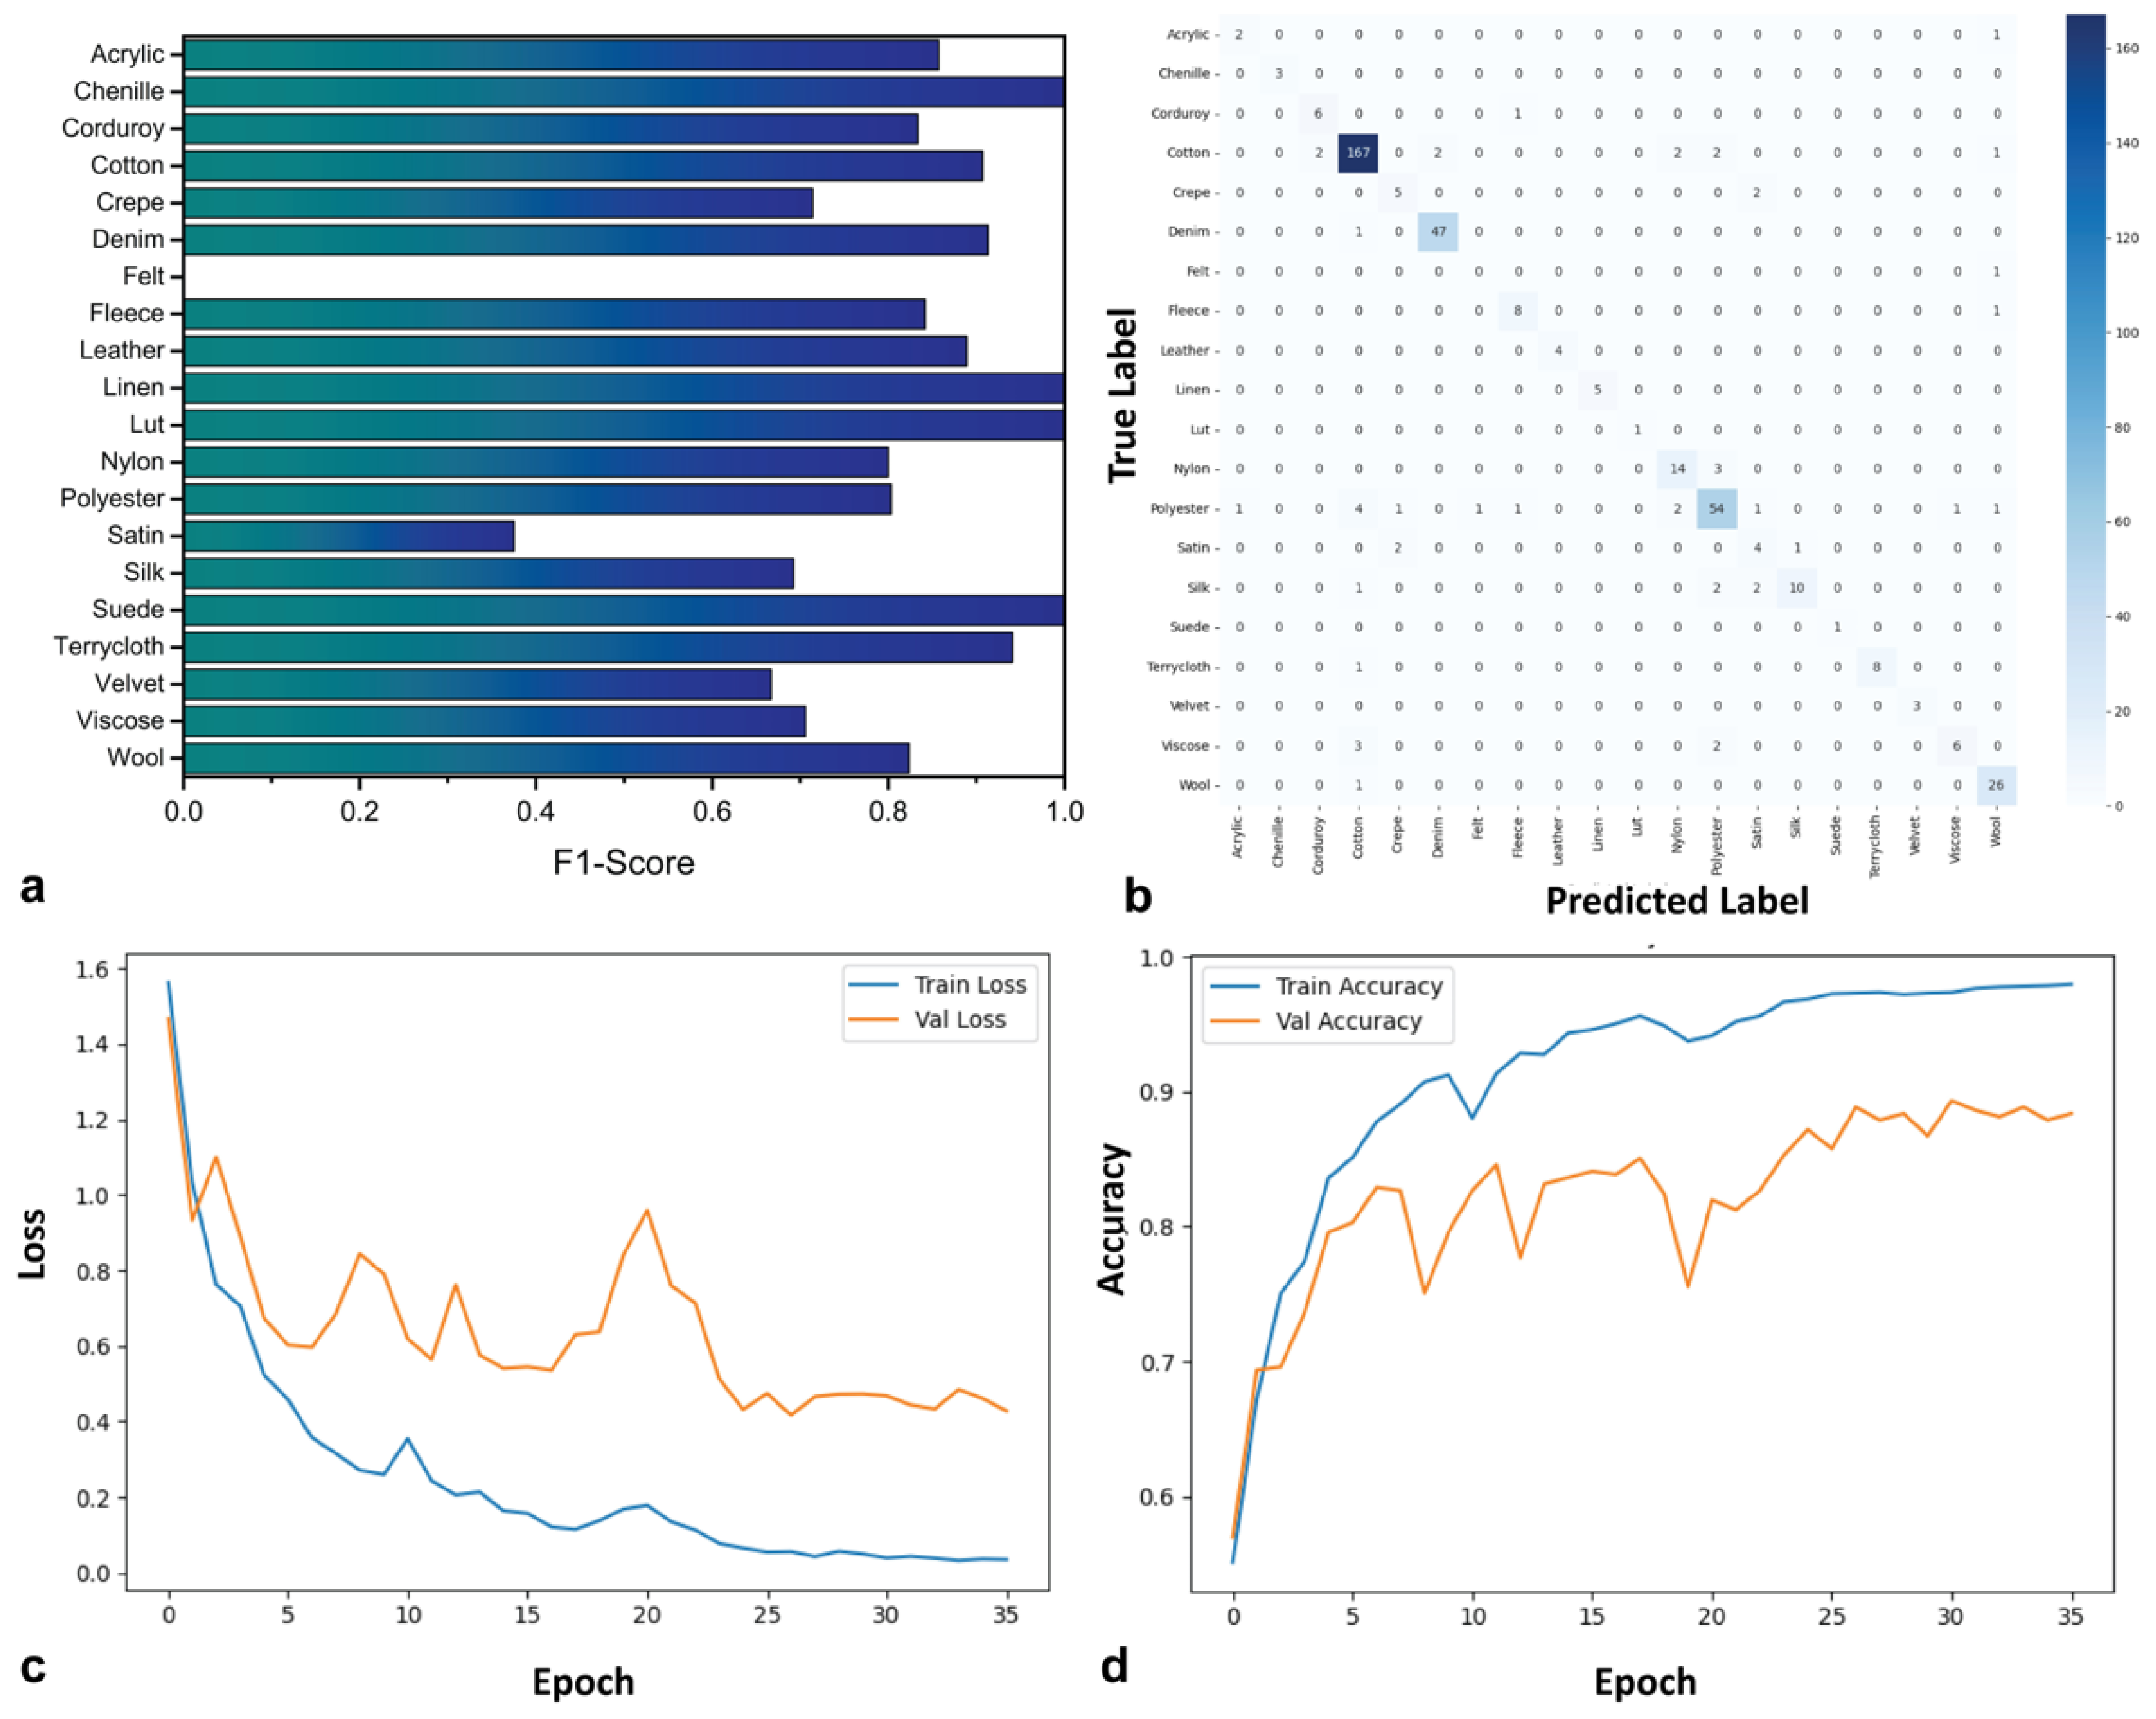
The performance of the EfficientNetV2 model is presented in
Figure 2. According to the classification report (
Figure 2a) and confusion matrix (
Figure 2b), the model achieves significant success in recognizing several classes. Cotton is identified with high confidence (f1-score: 0.94, recall: 0.95, precision: 0.94), consistent with its dominance in the dataset. Denim and Polyester classes also exhibit excellent performance, with f1-scores of 0.97 and 0.83, respectively. Satin remains a challenge, as with ResNet50 results. Its f1-score of 0.50 and recall of 0.57 both suggest confusion with other classes. On the other hand, Viscose performs satisfactorily (f1-score: 0.66), indicating a balanced classification. Classes like Crepe, Acrylic, and Corduroy present a mid-performance ability (f1-scores: 0.67–0.80). While Acrylic shows a reasonable f1-score, Crepe remains a relatively difficult class, although its performance is improved in comparison to ResNet50. Classes like Leather, Chenille, Linen, Suede, Velvet, and Lut are perfectly classified (f10scores: 1.00), but given their small number of samples, these results should be interpreted with caution and are not strong indicators of generalization ability. In any case, the distinctive morphological characteristics of Leather in comparison to all the other classes should be taken into consideration.
Regarding the learning process, the training loss curve (
Figure 2c) decreases consistently, reaching a final value of 0.12, confirming that the model learns effectively from the training data. The validation loss also drops sharply in the initial epochs and stabilizes around 0.46, remaining notably higher than the training loss. This gap was also observed in the validation loss of ResNet50, suggesting again a degree of overfitting between epochs 15 and 25, although the validation performance remains strong. The training accuracy curve (
Figure 2d) rises rapidly and reaches a plateau near 95.27%, while the validation accuracy reaches 85.18%. Despite the gap, the model exhibits strong generalization ability, and the overall performance is considered robust across both frequent and less-represented textile classes. The observed fluctuations, which are more pronounced in validation curves rather than in training curves, reflect the model’s sensitivity to class imbalance in the validation due to challenges in generalization across underrepresented classes.
3.1.3. ConvNeXt
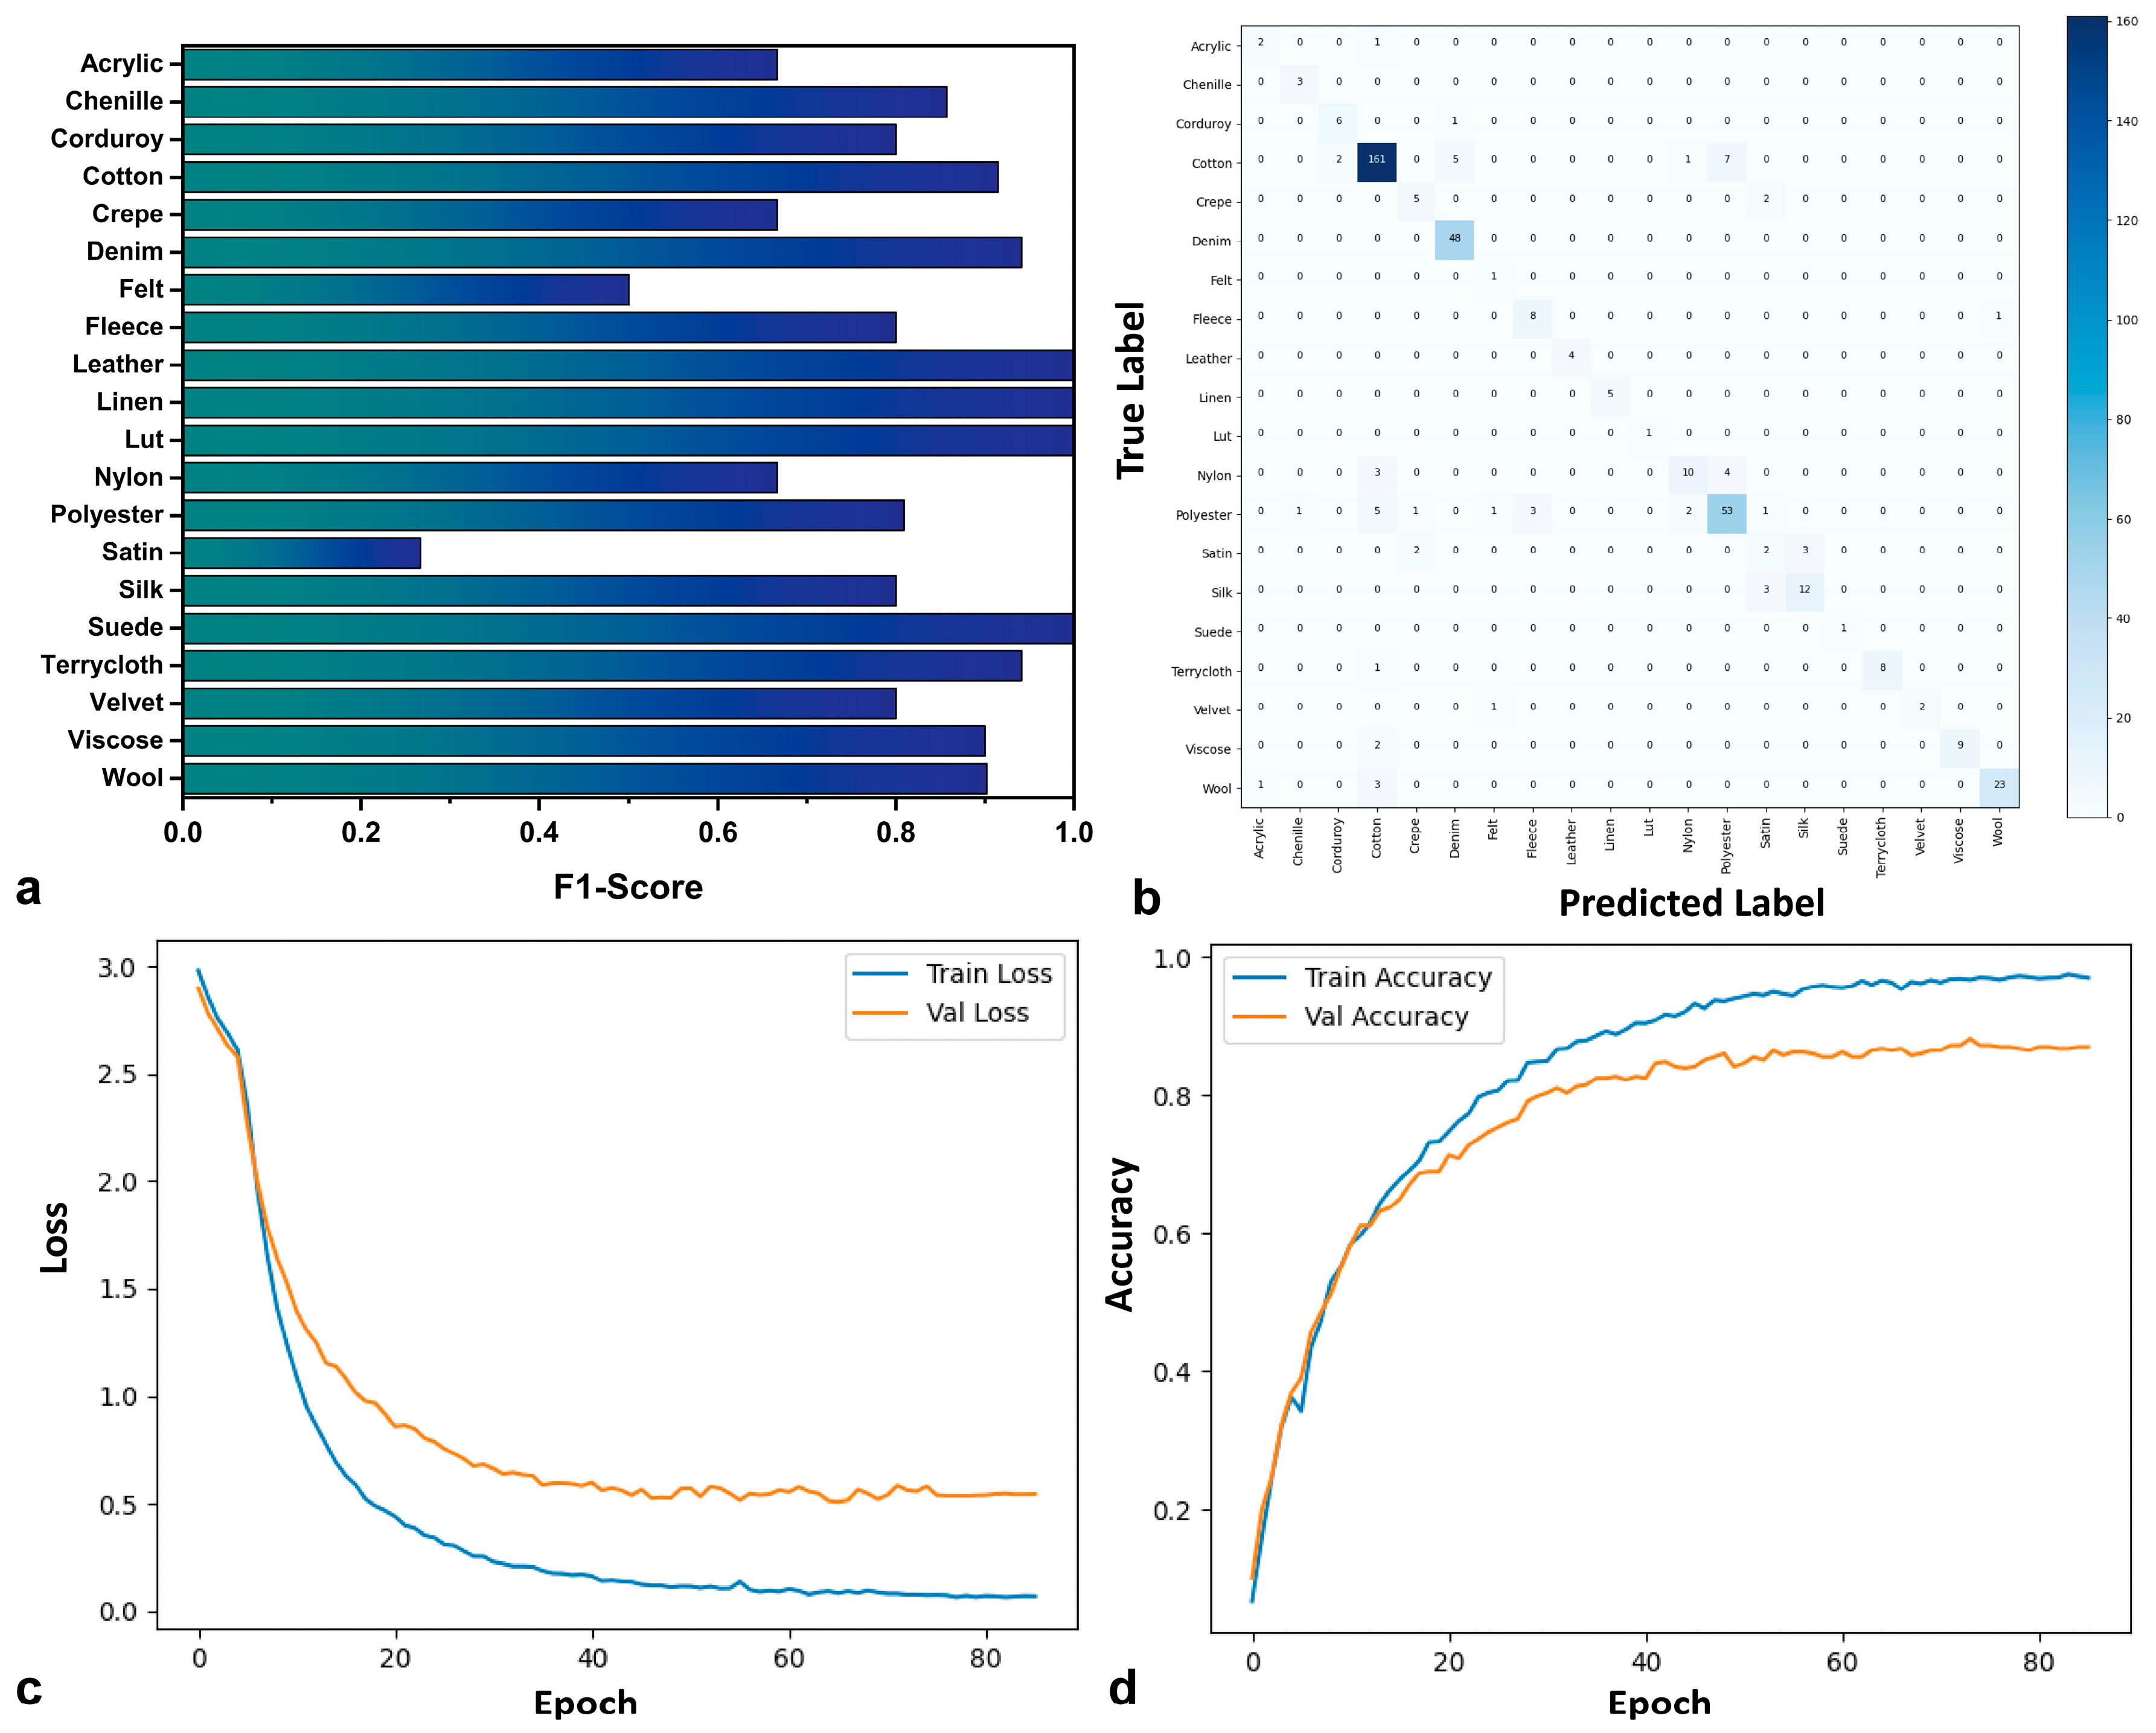
The ConvNeXt model also shows strong performance across the dominant textile categories. For example, Cotton is again recognized with great success, achieving an f1-score of 0.92 (
Figure 3a). Denim is one of the best-classified textiles, with an excellent f1-score of 0.94. For the Polyester class, the model achieves a strong f1-score of 0.81, with a high success rate for recognizing its samples (recall 0.79) and good precision (0.83). The confusion matrix (
Figure 3b) would further clarify any specific confusions. The difficulty in recognizing Satin persists (f1-score: 0.27), similar to the previous models. The confusion matrix shows that Satin continues to be mistaken for Silk and Polyester, which can be explained by similarity in morphological characteristics amongst the members of those classes. Nylon has an f1-score of 0.67, indicating that the model struggles to identify many of its samples, which is attributed to a relatively high precision of 0.77, followed by a lower recall of 0.59. Despite these weaknesses, significant improvements were seen in certain small classes. Crepe has an f1-score of 0.67. Silk is also classified more effectively, with an f1-score of 0.80. The Acrylic class performs reasonably well with an f1-score of 0.67, while Leather achieves a perfect f1-score of 1.00, as with the previous models, and Velvet also shows excellent performance with an f1-score of 0.80. For some textiles like Linen, Suede, and Lut, the f1-score is perfect (1.00), but this should be taken with caution, given the very few samples for these categories. Finally, Viscose and Wool present f1-scores of 0.90 and 0.90, respectively, showing a moderate to good level of recognition.
The training loss decreases smoothly and steadily (
Figure 3c), and the training accuracy curve (
Figure 3d) increases to a high level, as with the previous models, reaching a final training accuracy of 91.91% and a validation accuracy of 86.44%. The final training loss is 0.14, and the validation loss is 0.42. This gap between training and validation loss again suggests a degree of overfitting, but it is less wide in comparison to the previous models.
3.1.4. ViT
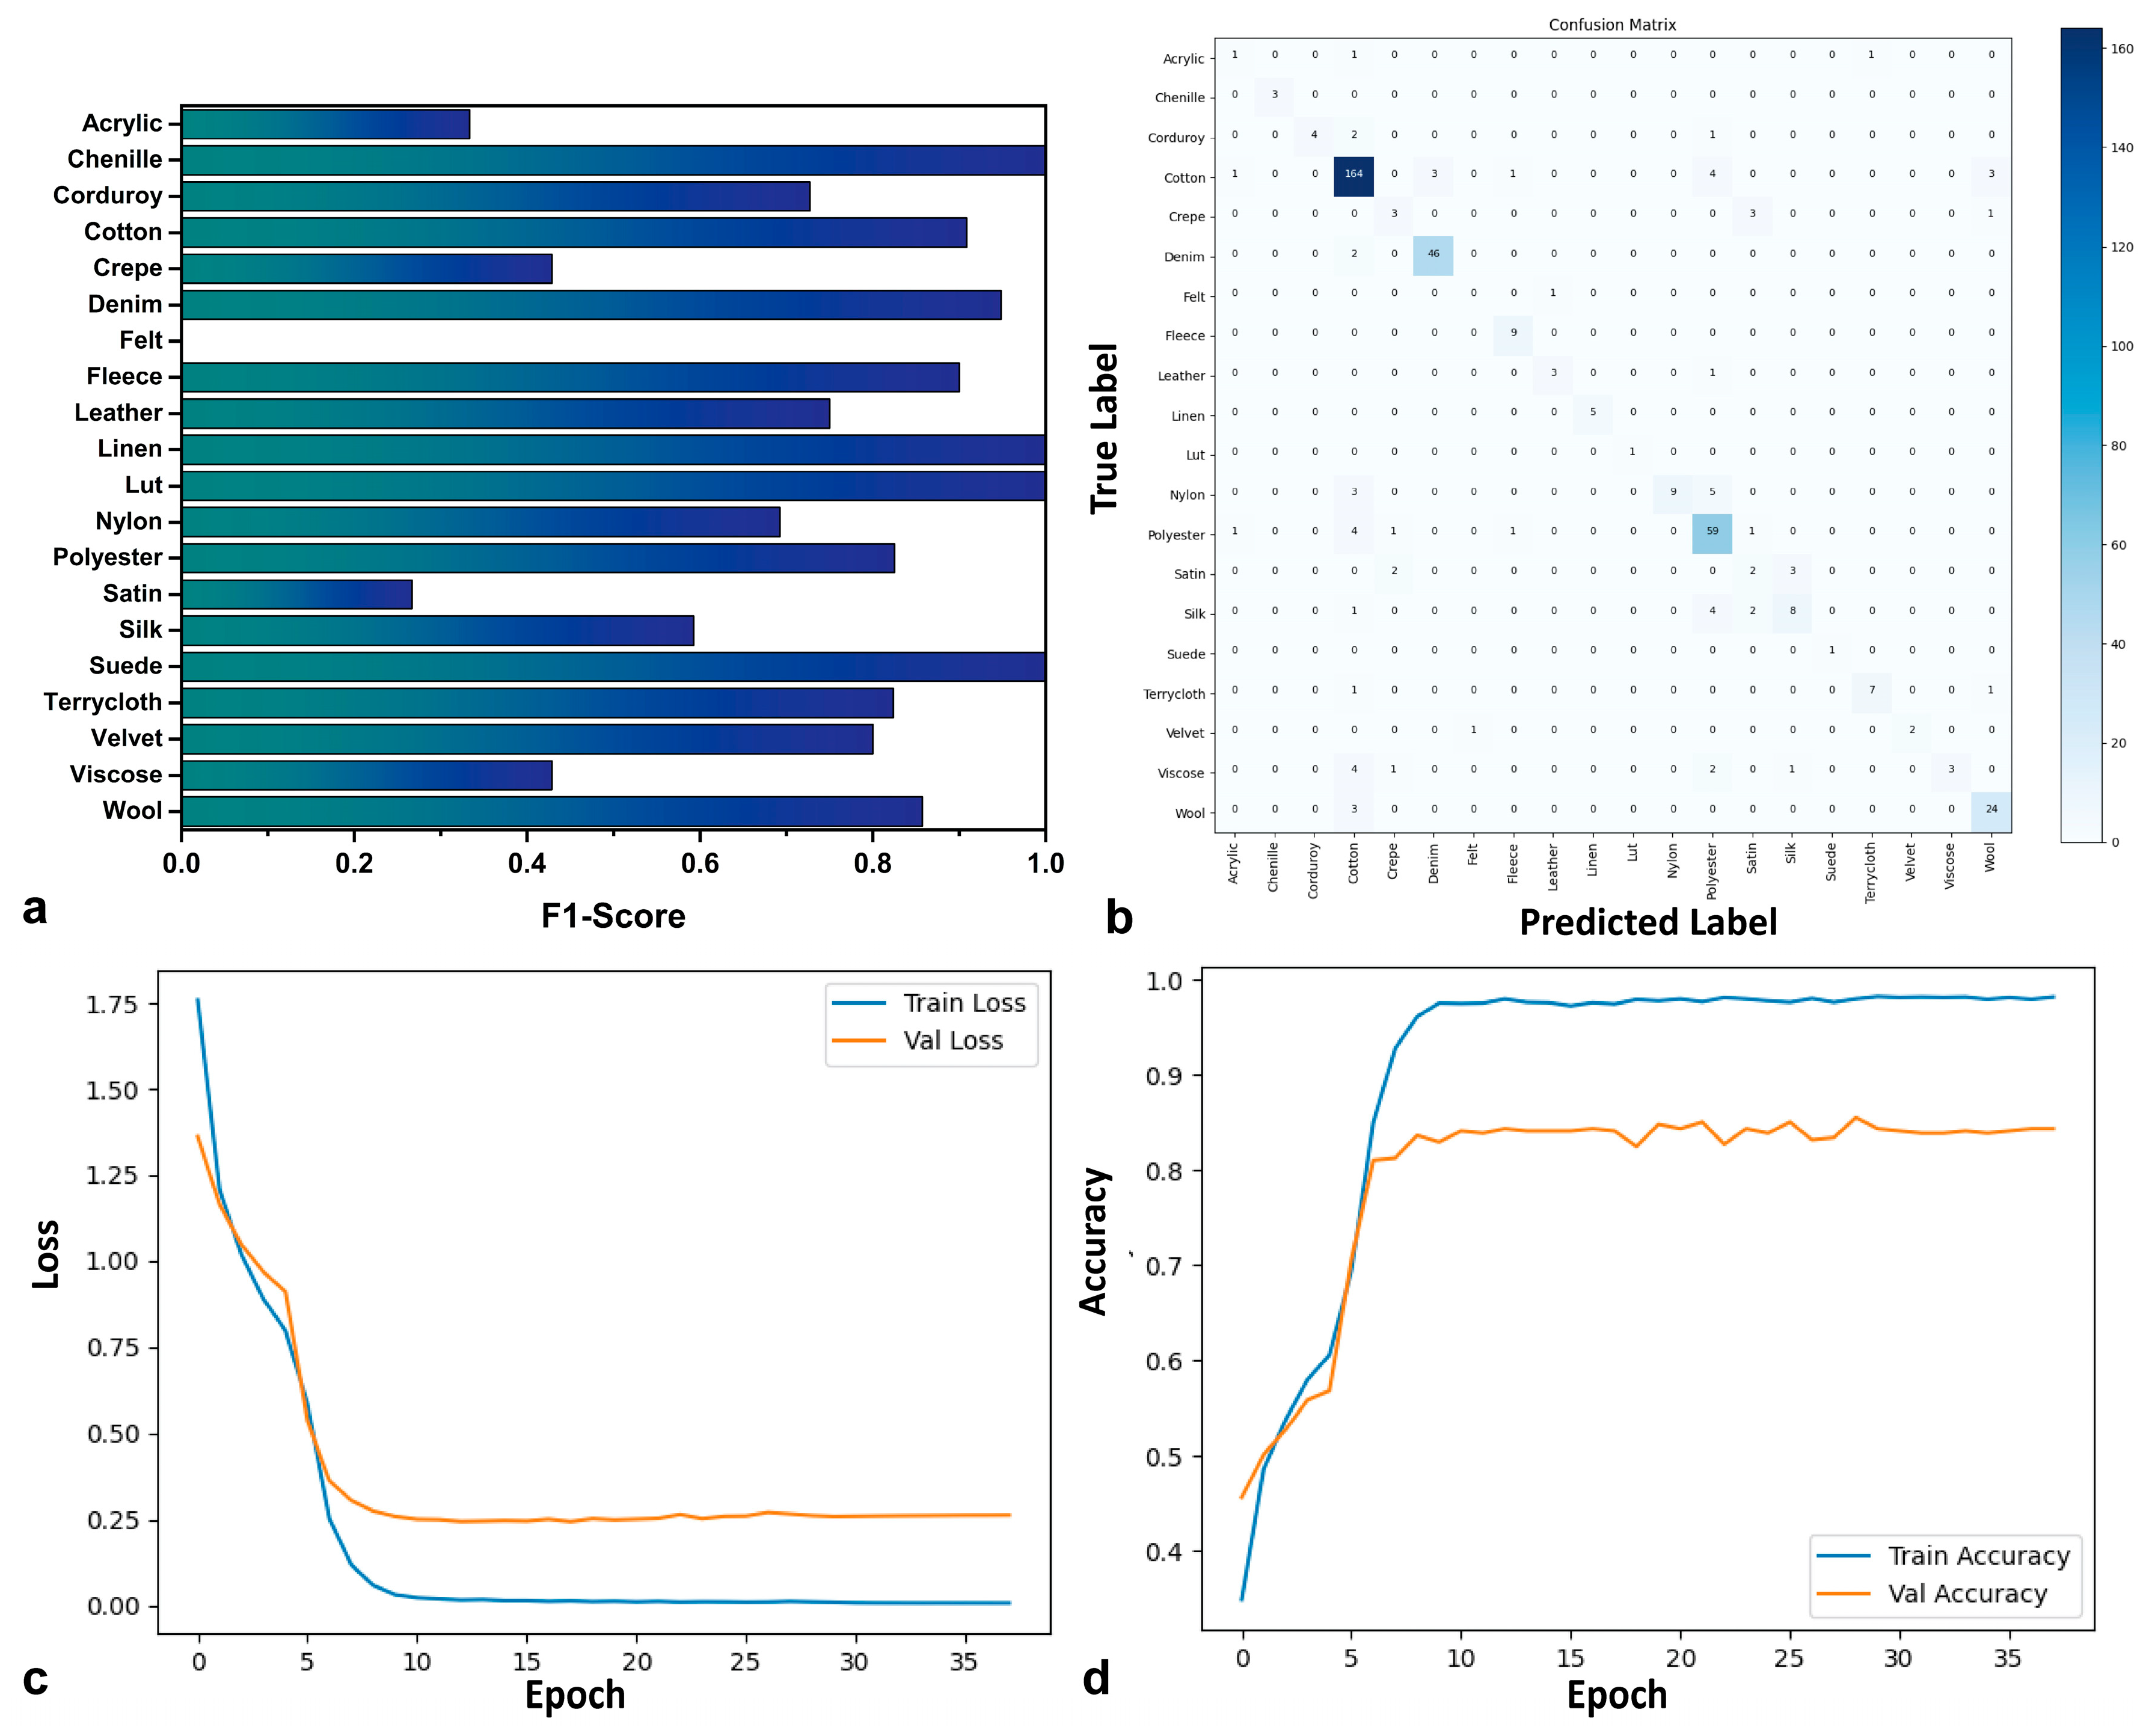
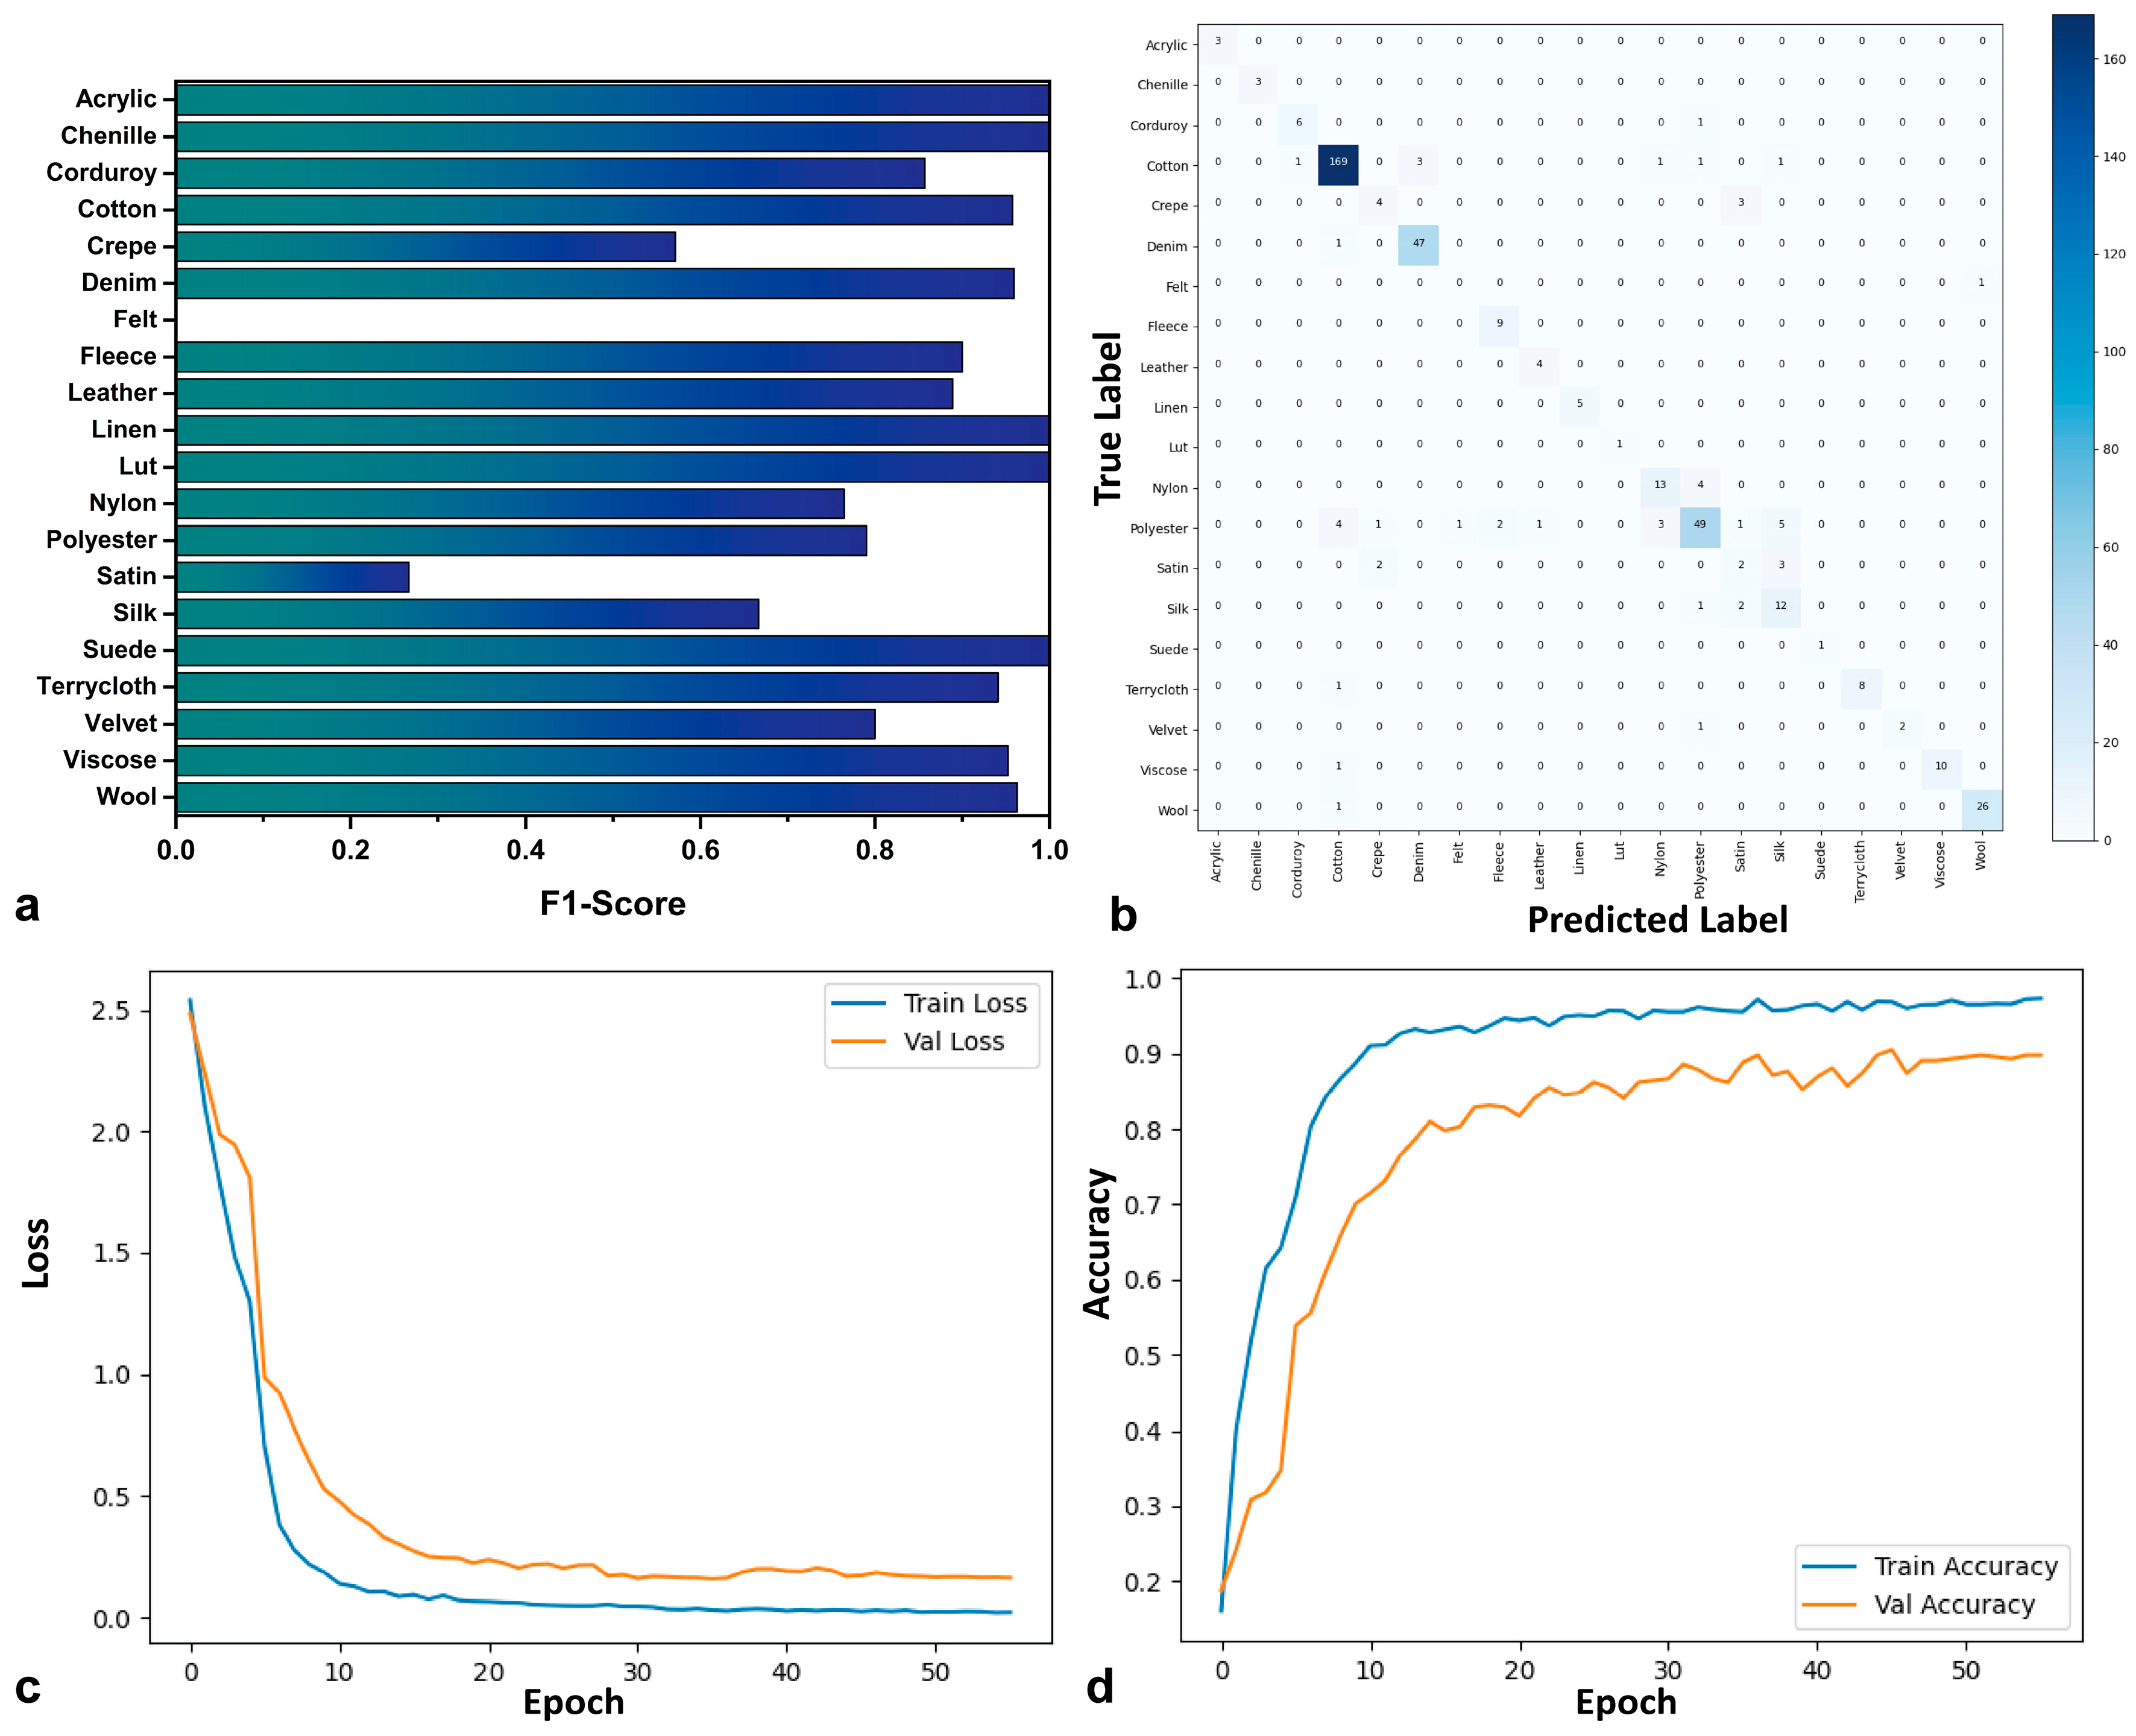
Based on the per-class performance analysis of ViT (
Figure 4a), the model shows a moderate performance in the most frequent categories. For example, the Cotton class is recognized with an f1-score of 0.91, and the Denim class is also classified well, with an f1-score of 0.95, while for Polyester, the f1-score is 0.83. In this model, too, a bias towards Polyester seems to exist, as the model tends to incorrectly classify other textiles into this category, as suggested by its precision of 0.78 compared to a recall of 0.88. The recognition of Satin is extremely poor, as the f1-score reaches only 0.27, further demonstrating that the ViT model is a weak performer in this class. Nylon has an f1-score of 0.69, with perfect precision (1.00) but low recall (0.53), indicating that the model often fails to identify many of its samples. Crepe also performs very poorly, with an f1-score of 0.43. The confusion matrix (
Figure 4b) reveals more about these misclassifications. Viscose has an f1-score of 0.43, with balanced precision and recall. In the remaining categories, the overall picture is mixed. Classes like Acrylic (f1-score: 0.33), Corduroy (f1-score: 0.73), and Silk (f1-score: 0.59) show low to moderate performance. Felt stands out with an f1-score of 0.00, while Wool has an f1-score of 0.86. Classes such as Suede, Linen, and Lut achieve perfect or very good classification, as they all reach an f1-score of 1.00. However, as with the previously presented models, these perfect scores are attributed again to the very small number of samples available for these categories, and these scores are not strong indicators of the model’s general ability.
The loss and accuracy curves (
Figure 4c,d) indicate that the training process has its own unique characteristics. The training loss curve (
Figure 4c) decreases smoothly to 0.12, but the validation loss curve shows fluctuations and remains at higher levels, reaching 0.28. This means that the model faces difficulties generalizing new data and exhibits overfitting. The training accuracy curve (
Figure 4d) rises quickly to 98.51%, but the validation accuracy curve, while good, reaches 85.89%, further confirming the challenges in generalization.
3.1.5. Swin Transformer
The f1-scores and the confusion matrix of Swin Transformer are presented in
Figure 5a,b. The model performs well in the most frequent categories. For Cotton, it achieves a good f1-score of 0.96 with very high precision (0.96) and recall (0.96), while for Denim, the performance is also excellent (f1-score: 0.96).
The model effectively identifies most of the Polyester samples (f1-score: 0.79), with a recall of 0.73 and a precision of 0.86, indicating only minor over-prediction. Regarding the more challenging categories, the performance on Satin remains low with an f1-score of 0.27, the same as ViT, indicating that this class remains a challenge. Nylon has an f1-score of 0.77, meaning that Nylon samples are always correctly predicted, but still many of the samples are missed. Notably, the model shows a significant improvement in recognizing Viscose compared to ViT, achieving an f1-score of 0.95. This indicates that the Swin Transformer is much more effective at identifying this category. In the remaining categories, the performance is generally acceptable, as Acrylic, Terrycloth, and Wool present very strong results. The learning curves indicate a smooth and stable training process (
Figure 5c,d). The training loss steadily decreases to 0.09, and the validation loss stabilizes around 0.25 with low fluctuations. The relatively small gap between the two loss curves indicates that the model avoids significant overfitting and generalizes well. The training accuracy rises quickly to 97.09%, and the validation accuracy stabilizes at a high level of 91.80%, confirming the Swin Transformer’s strong ability to generalize while maintaining high performance across both major and minor textile classes.
3.1.6. MaxViT
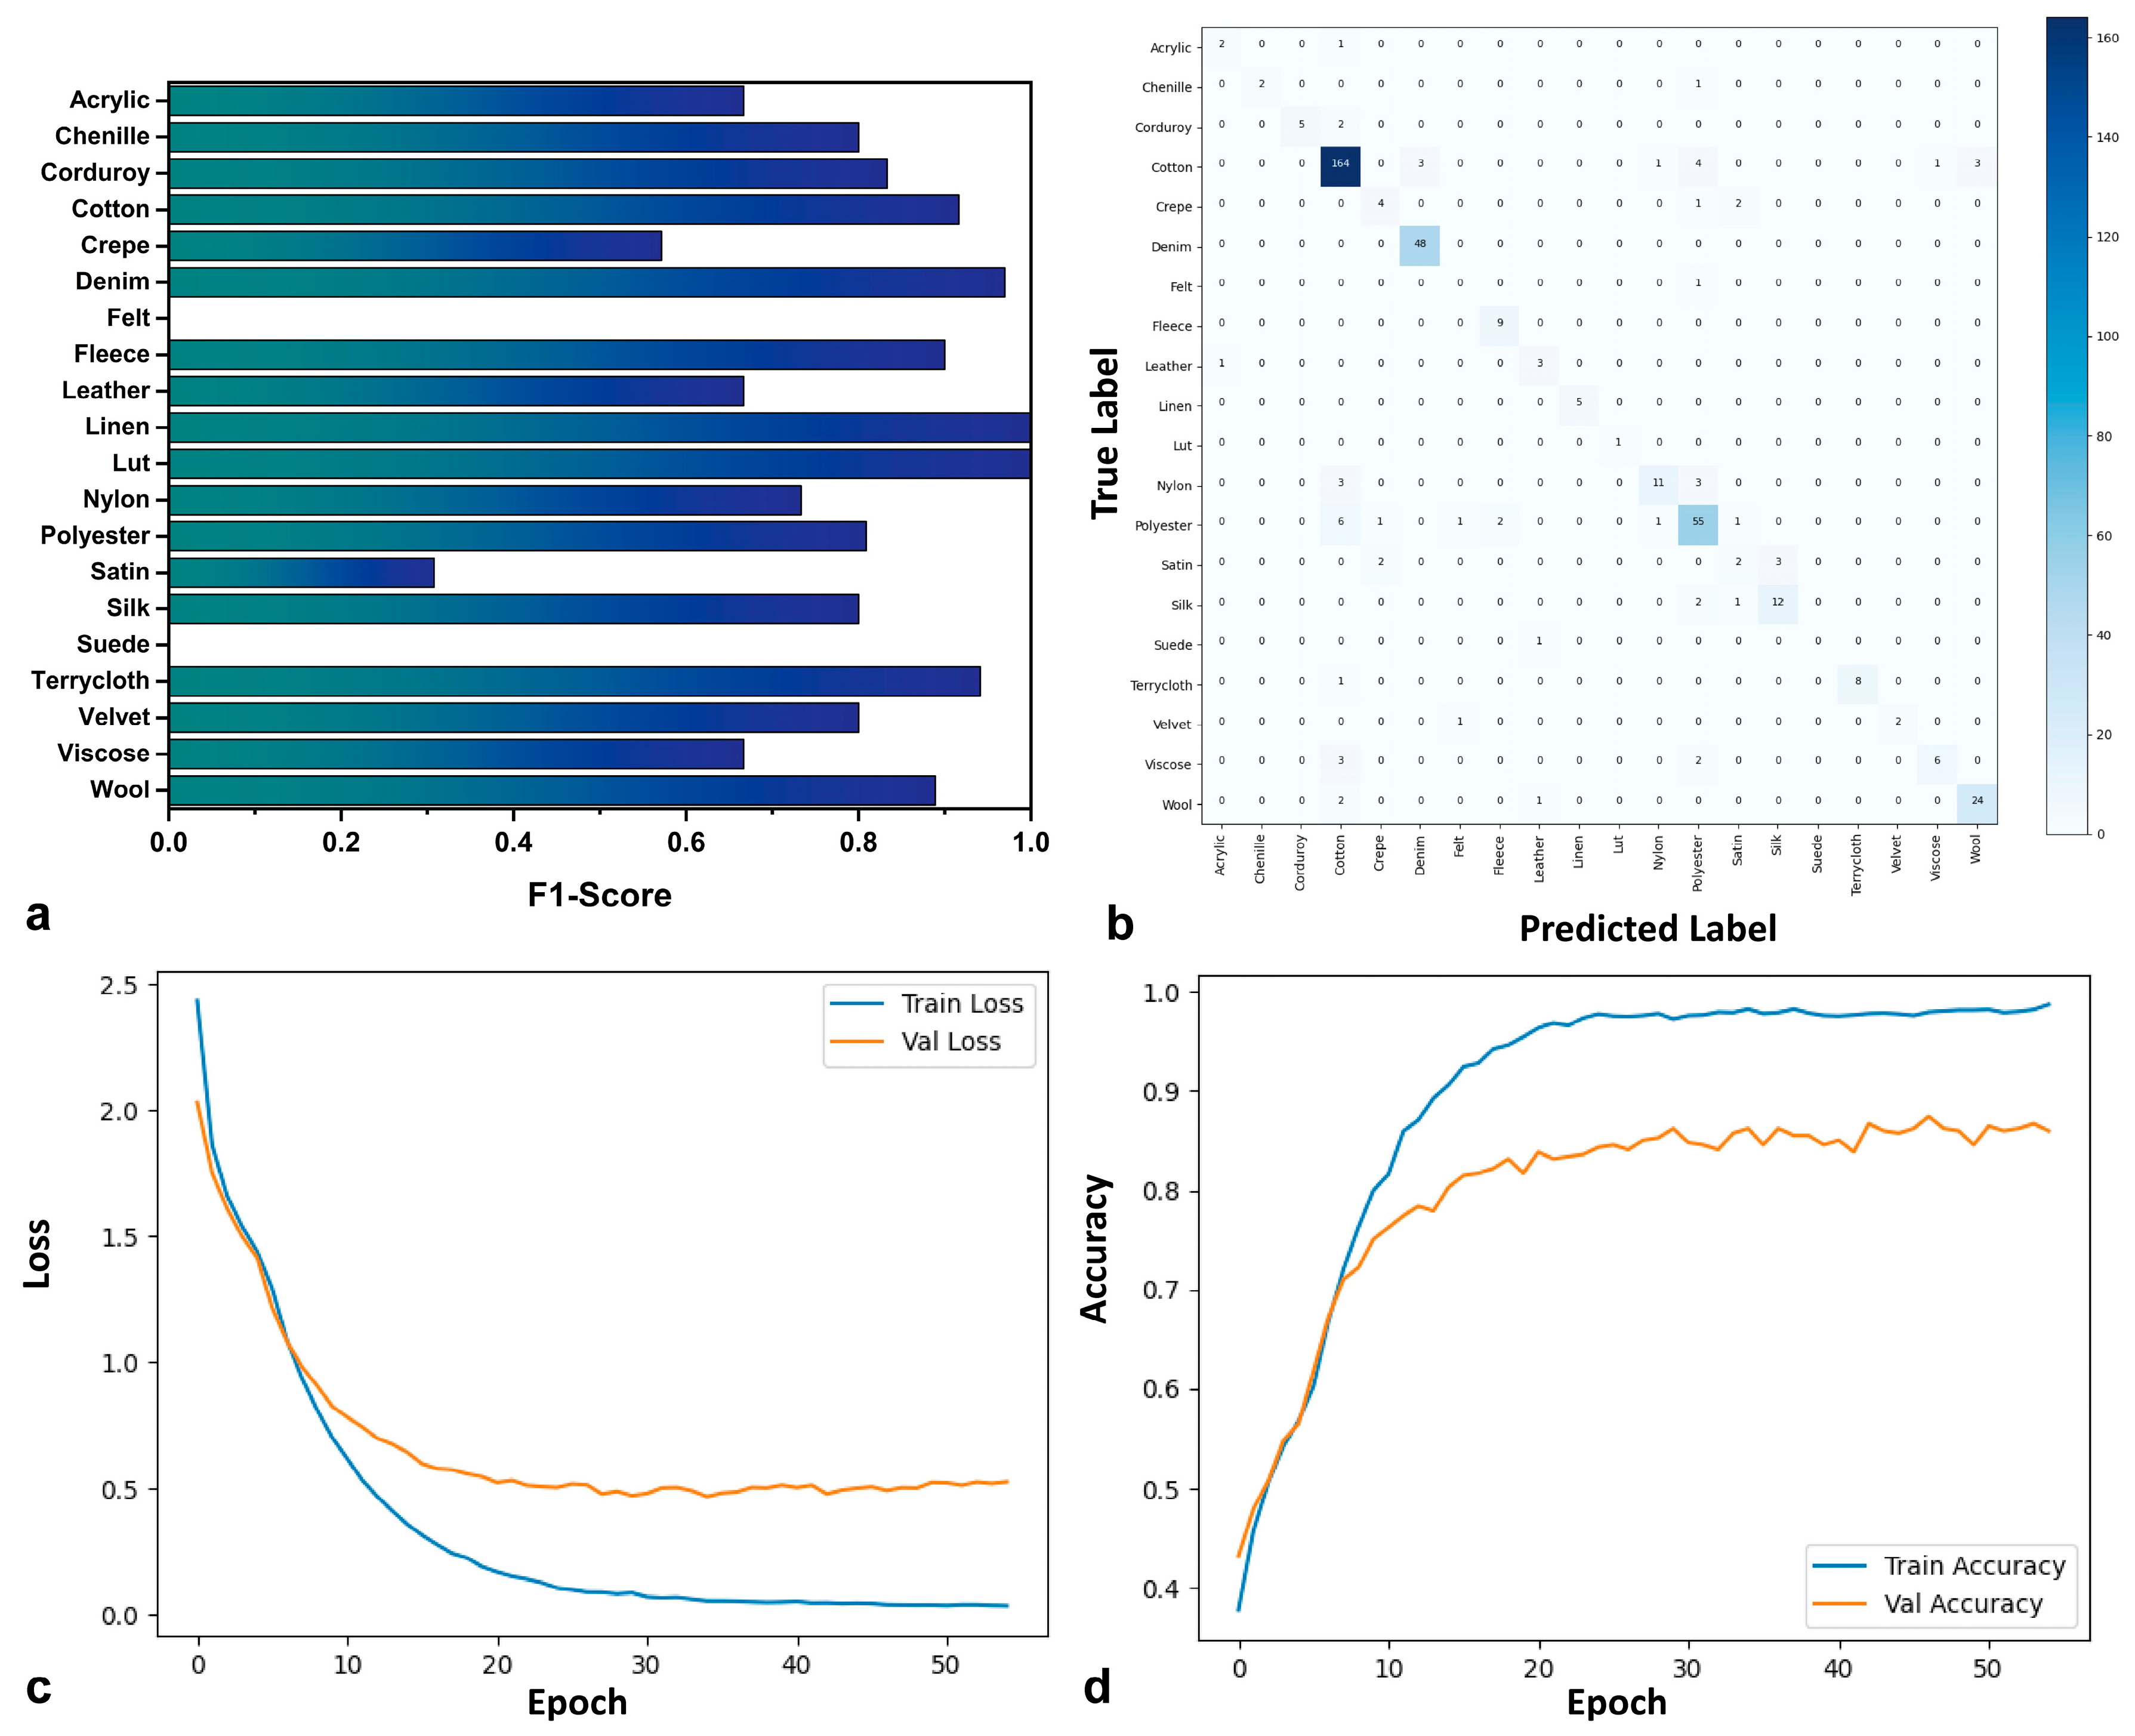
The MaxVit architecture performance is presented in
Figure 6. Apart from the f1-scores (
Figure 6a), a major weakness of the model, as its confusion matrix indicates (
Figure 6b), is its textile-by-textile performance. Lut is perfectly classified (f1-score: 1.00), although it is supported with only one sample. Satin continues to be a problematic class (f1-score: 0.30), and Crepe is also poorly classified (f1-score: 0.57). The confusion matrix further elaborates on the specific confusions for these classes. Cotton is once again well recognized (f1-score: 0.91), and Denim also performs very well (f1-score: 0.97), indicating that while the model correctly identifies almost all the class’s samples, its precision (0.95) and recall (0.94) are both very strong. For Polyester, the model presents a good f1-score of 0.81, with balanced precision (0.80) and recall (0.84). The results for the remaining classes are mixed, as classes like Corduroy, Silk, Chenille, and Velvet present satisfactory f1-scores of ~0.80, and Linen of 1.00, although Chenille and Linen classes contain very few samples. Fleece also shows strong performance, with an f1-score of 0.90.
The training loss and accuracy curves (
Figure 6c,d) reveal a training process with some inconsistencies. While the training loss curve decreases smoothly to a very low level of 0.02, the validation loss curve shows significant fluctuations and stays at relatively high levels, reaching 0.51. This suggests that the model struggles to fully generalize to new data, exhibiting signs of overfitting. Similarly, the training accuracy curve rises quickly to 97.61%, while the validation accuracy curve, although showing good performance, reaches 82.89%, indicating a notable gap between training and generalization capabilities.
3.2. Comparative Analysis of Heatmaps and Attention Maps
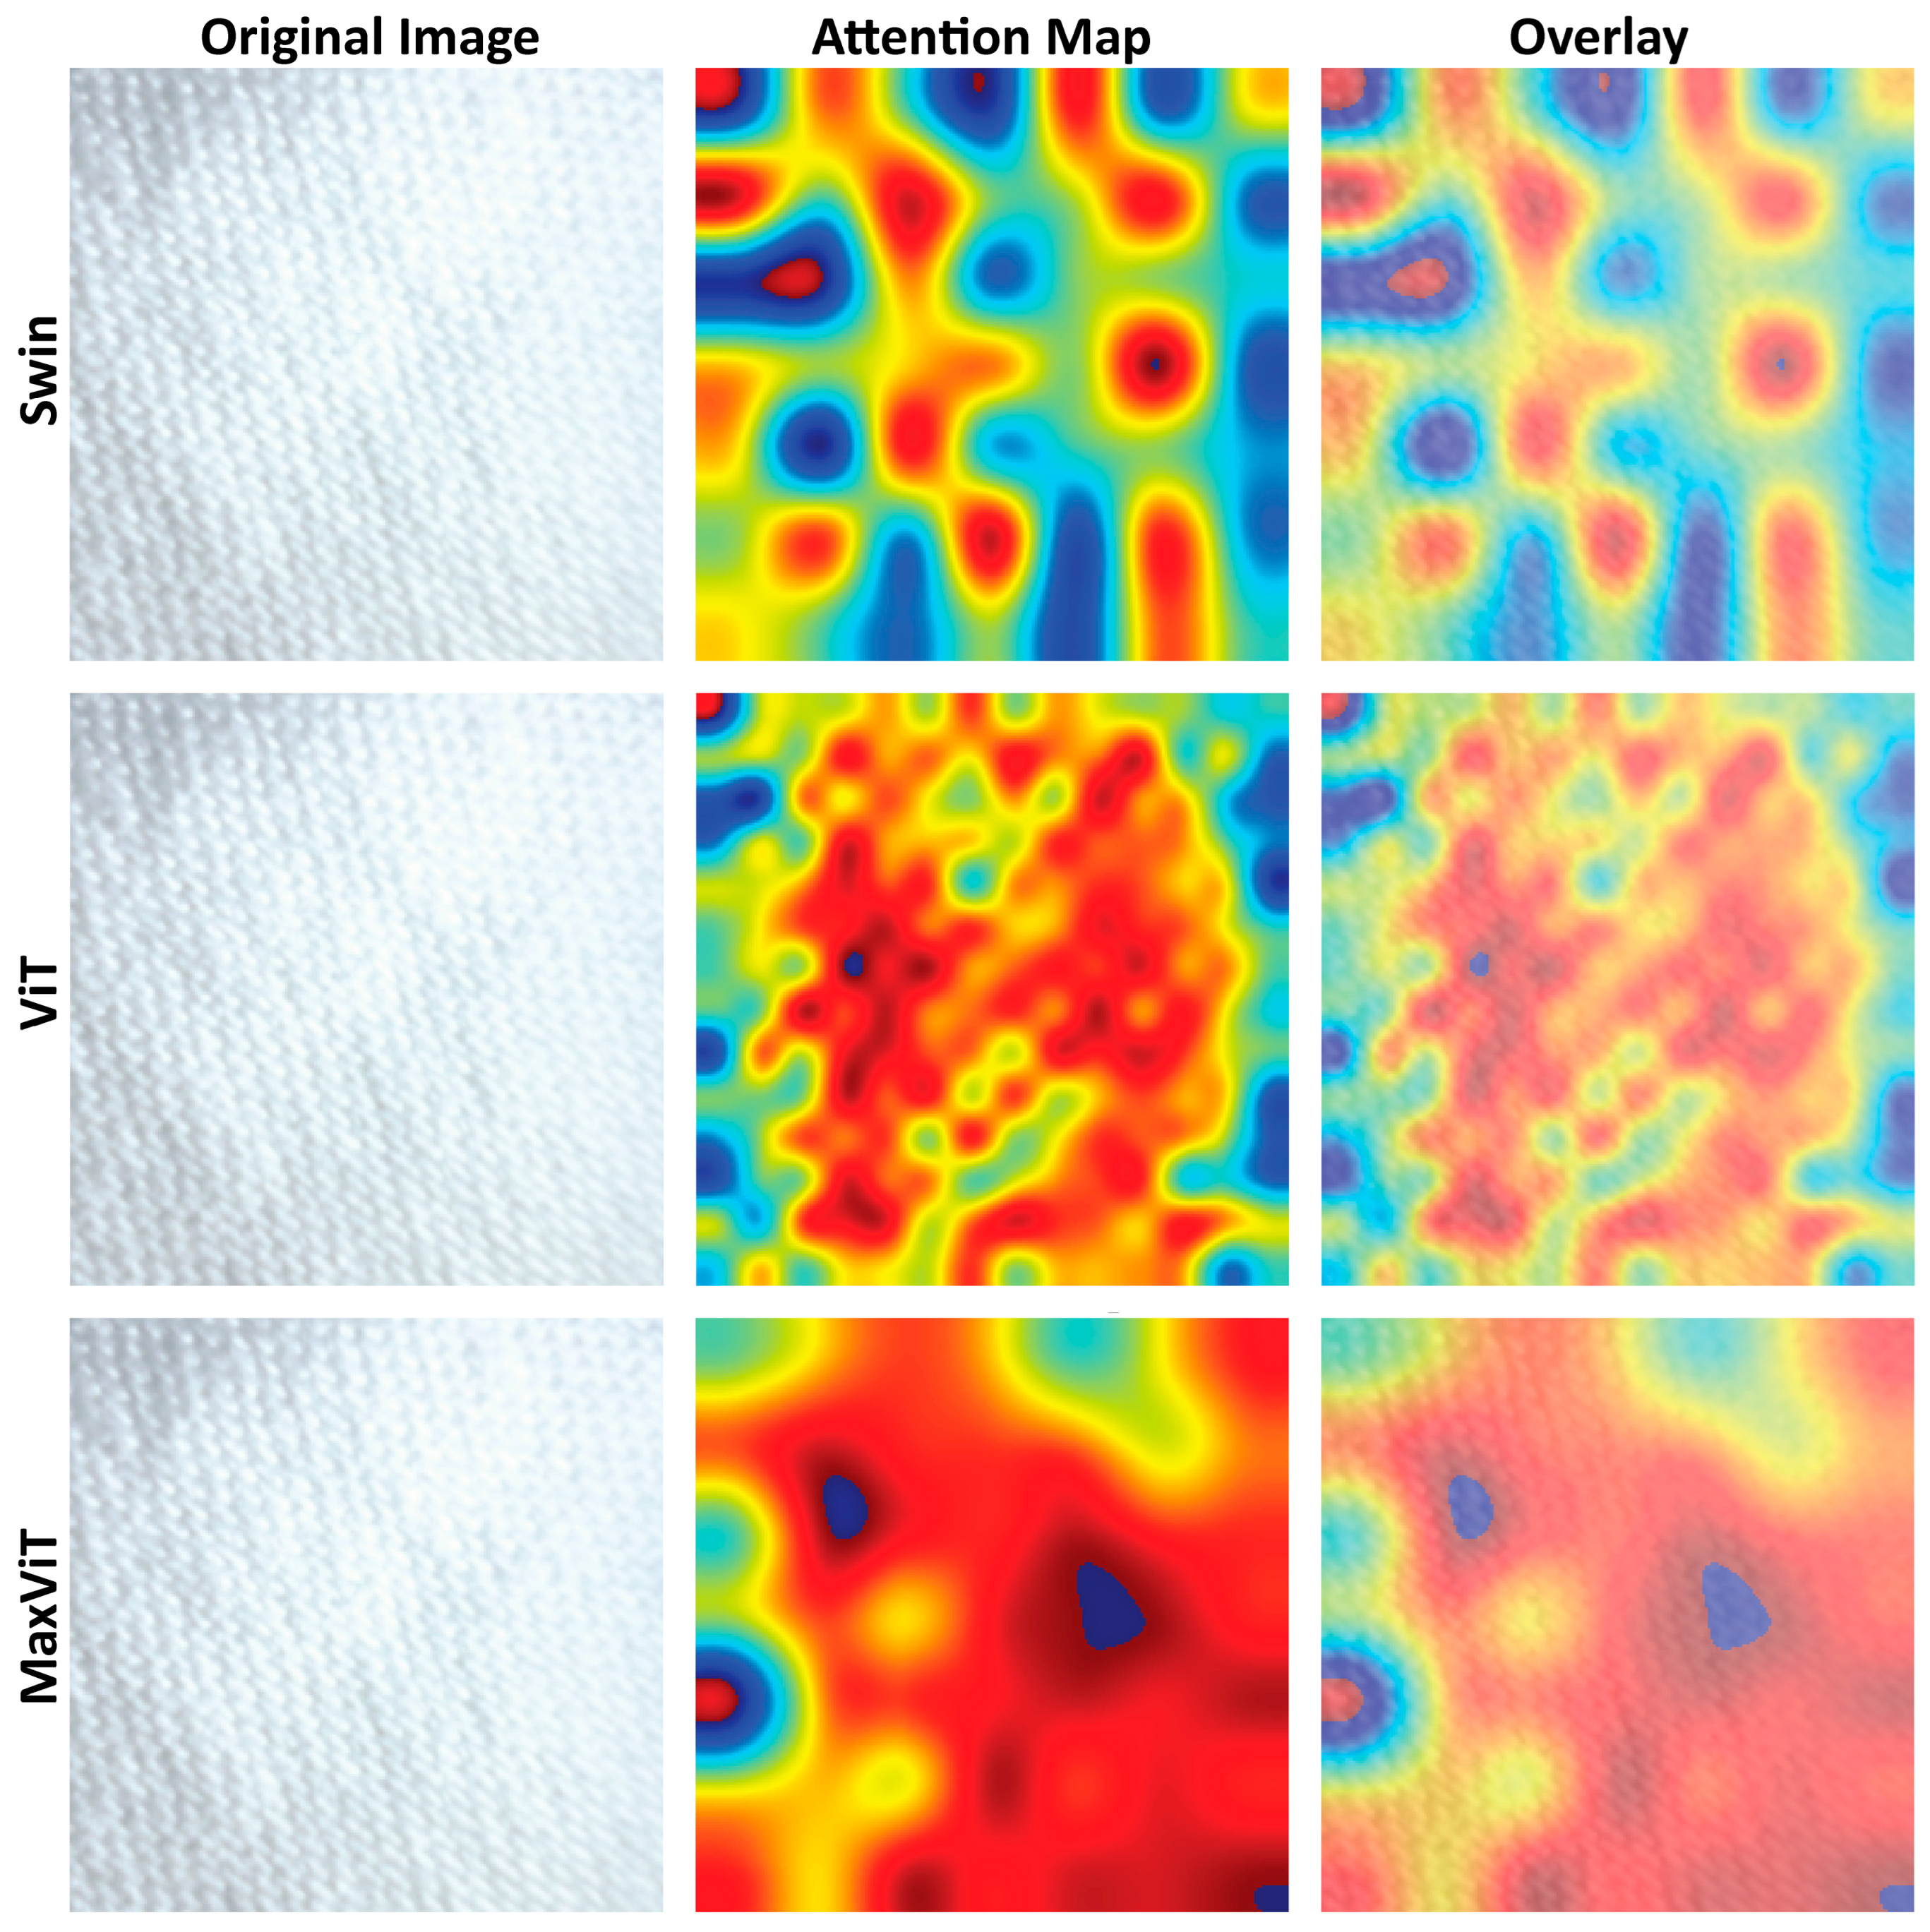
The heatmaps for CNN models and the attention maps for transformers and hybrid models provide insights into the regions of the image that each model considers important for classification [
46]. The heatmaps for the CNN models (ResNet50, EfficientNetV2, ConvNeXt) and the attention maps for transformers and hybrid models (Swin, ViT, and hybrid MaxViT) of a representative sample are presented in
Figure 7 and
Figure 8, respectively, for comparativeness.
ResNet50: The Grad-CAM heatmap for ResNet50 shows a strong, localized focus on details on the lower-left side of the textile textures. This is consistent with the nature of CNNs to extract hierarchical local features, particularly where weaving details are most pronounced.
EfficientNetV2: The attention map for EfficientNetV2 shows a broader focus across regions where weaving features are pronounced, covering a wider area than ResNet50. This suggests that EfficientNetV2 aims for multiple key local features across the image, rather than concentrating exclusively on areas where weaving details are pronounced. This distributed wide focus may contribute to its overall strong performance.
ConvNeXt: The attention map for ConvNeXt also shows a focus on areas with strong texture and pattern, but the distribution of attention appears quietly limited or spread across textured regions compared to the very broad focus of EfficientNetV2.
Swin Transformer: The attention map for the Swin Transformer reveals a focus on distinct, “patched” areas of the texture. This directly reflects the window-based self-attention mechanism of Swin Transformer, where attention is computed within local windows that are shifted in subsequent layers. The model captures local interactions within these windows and aggregates information hierarchically.
Vision Transformer (ViT): The attention map for the Vision Transformer shows a more focused and smaller patch-based result across various areas of the image. Unlike the localized or window-based focus of CNNs and Swin, the ViT processes the image as a sequence of patches and computes attention between them globally (at least in its base form). The attention map indicates that the model considers information from multiple, potentially non-contiguous small patches important for classification.
MaxViT: The attention map for MaxViT shows a focus on various texture regions, potentially combining local and more extensive features. This aligns with its multi-axis attention mechanism, which aims to capture both local and sparse global dependencies. The focus appears less severely localized than pure CNNs and more uniformly distributed than the base ViT, suggesting a hybrid approach to feature integration.
Figure 9 presents a schematic overview of the distinct focus mechanisms of the architectures, while the focus characteristics of all models are presented in
Table 3, reflecting the fundamental architectural designs of the models. CNNs excel at capturing local features through convolutional filters, while transformers, with their attention mechanisms, are better at modeling long-range dependencies. Understanding these focus patterns can provide insights into why certain models perform better on specific types of visual tasks or datasets. For textile classification, the ability to capture both fine-grained local textures and potentially broader patterns across the textile could be important. The distributed or multi-region focus observed in some models (EfficientNetV2, Swin, and ViT) might be beneficial for this task compared to a very centralized focus. These differences present practical implications for heritage professionals. CNNs focus on small and highly textured areas, such as thread crossings and weave density, while transformers focus on multiple distant regions simultaneously, capturing wider weave structures and variations. On the other hand, hybrid models combine these characteristics. As a consequence, models of broader or even multi-region attention may perform better regarding complex weave patterns or degradation irregularities, while models focusing on local texture may stand out when identifying details such as threads or distinctive fiber characteristics.
3.3. Energy Efficiency and Ecological Footprint
In addition to accuracy, the energy consumption during training and testing of the models was also evaluated, using the CodeCarbon tool [
44]. The aim was to measure the efficiency of each method, i.e., how much energy is required to achieve a level of accuracy, and therefore what its ecological footprint (CO
2 emissions) is.
As presented in
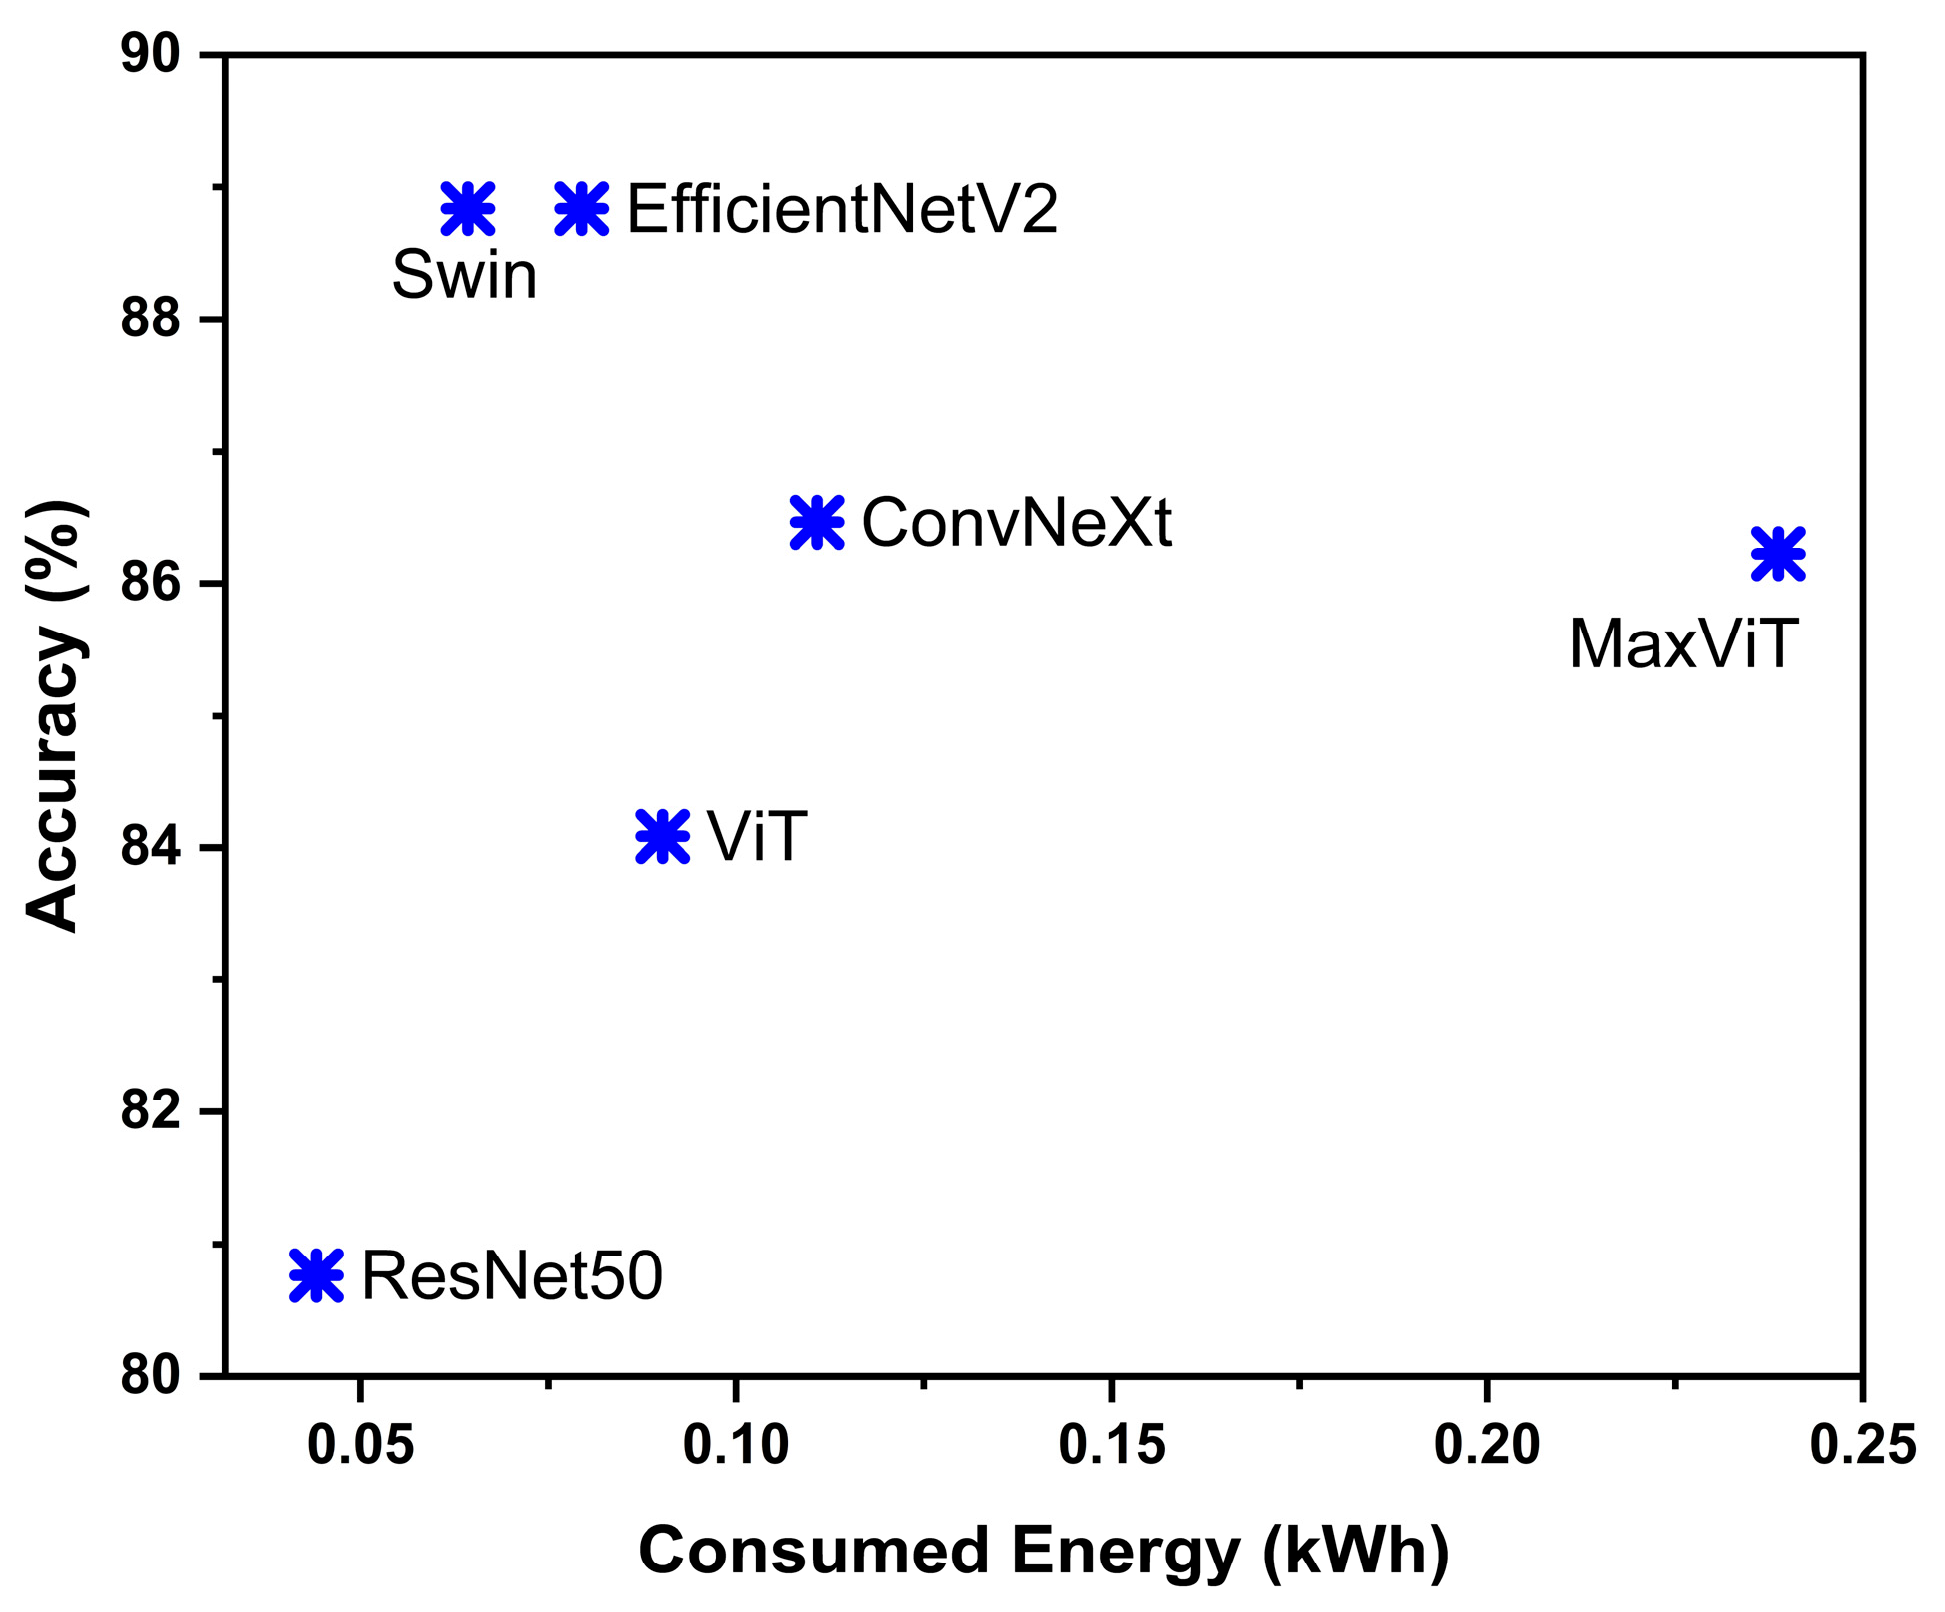
Table 4, the results show, as expected, significant differences. Swin and ResNet50 are the most energy efficient. Specifically, Swin consumed approximately 0.064 kWh for 55 training epochs, which corresponds to ~22 g of CO
2 emissions in Greece, an impressively low value for such a powerful model. ResNet50, due to its smaller architecture and optimized convergence process, showed even lower consumption (~0.044 kWh), thus achieving the best accuracy-to-energy ratio. On the contrary, ConvNeXt and MaxViT had clearly increased consumption. MaxVit was estimated to consume about 0.239 kWh for the same training time, almost thrice the energy as that of ResNet50, despite delivering lower accuracy. This also implies a larger carbon footprint.
Overall, the energy efficiency is ranked as follows: ResNet50 → Swin → EfficientNetV2 → ViT → ConvNext → MaxViT. This is also visible in
Figure 10, which plots the final accuracy against the energy spent per model. Swin and EfficientNetV2 are in the upper right corner (high accuracy and low energy), while MaxViT moves to the middle left (middle accuracy, higher energy consumption). Such a combination is undesirable when the environmental aspect is taken into consideration.
It is worth noting that all measurements were made on a local system with GPU (NVIDIA RTX 3050)-calculated and CodeCarbon-calculated emissions based on the energy mix of Greece. The absolute emission figures, a few tens of grams of CO2, are small, but on a larger scale (e.g., training multiple models or many more seasons), they would increase. Therefore, the choice of the model also has ecological significance. A more efficient model can reduce computational costs and emissions during the development and implementation of the system.
In addition, the consumption during the inference stage was also examined. It was found that heavier models (ConvNext, MaxViT) require more memory and time per image for classification, while lightweight CNNs make predictions faster. This means that in a possible real-world application (e.g., a textile recognition system on the EU scale for researchers), the use of EfficientNetV2 would be preferable not only due to accuracy but also due to faster response and lower operating costs.
In summary, the energy evaluation highlights the outperformance of newer CNN architectures over transformers in resource-constrained scenarios. These results encourage the adoption of models like Swin and EfficientNetV2 in practical applications, where sustainability and efficiency are desired, as they achieve similar or better accuracy with a smaller ecological footprint.
4. Overall Discussion on Model Selection for Heritage-Oriented Textile Classification
The choice of the FABRICS dataset was dictated by the need to test candidate model architectures in a set that simulates the challenges of archaeological research, and, in particular, the documentation and analysis of ancient, historical, and contemporary textiles. It should be noted that the FABRICS dataset consists of contemporary textiles that were photographed under controlled conditions, and not authentic artifacts, which are culture related. The imbalance of classes in the dataset, combined with the stylistic and optical diversity, together with the existence of classes based on cloth type and textile composition at the same time, simulates conditions such as limited or fragmentary preservation of textile, unevenness in images due to wear, or the presence of textures combined with the remains of other materials, as often occurs in archaeological contexts [
5,
25]. In practice, computational analysis of archaeological textiles is often based on limited samples, without the possibility of homogeneous photography or extensive preprocessing. The FABRICS dataset offers a controlled experimental environment that allows for the prototyping of models before applying them to real, noisy field data. The use of FABRICS as an experimental platform allowed for the objective evaluation and comparison of different image classification models, as well as imbalance treatment techniques, such as Focal Loss [
47] and stratified sampling [
48]. This experimental phase is a prerequisite for application to archaeological data, where the aim is to identify those models that exhibit the best generalization ability from a few samples and the greatest discriminatory power in materials with similar texture or coloration. Therefore, the study on the FABRICS dataset served as a critical preparatory phase for the development of textile classification tools in archaeological collections, with the aim of automatically assisting the documentation, analysis, and conservation of textile findings.
Additionally, it should be noted that the FABRICS dataset includes textiles of various colors, as well as patterned textiles. For the latter, the motifs result from the use of differently colored yarns, and not from printed or embroidered designs. Despite this additional visual complexity, the models achieve high classification accuracy, demonstrating again their ability to generalize across both consistent and patterned textiles. Furthermore, the FABRICS dataset grouping contains several weave and pattern variants within the same class. The Satin class is such an example, where multiple satin-type weaves are included, without further sub-classification. This reflects the dataset’s prioritizing of surface texture rather than detailed weaving accuracy, which should be taken into consideration in future work, for a more weave-specific classification.
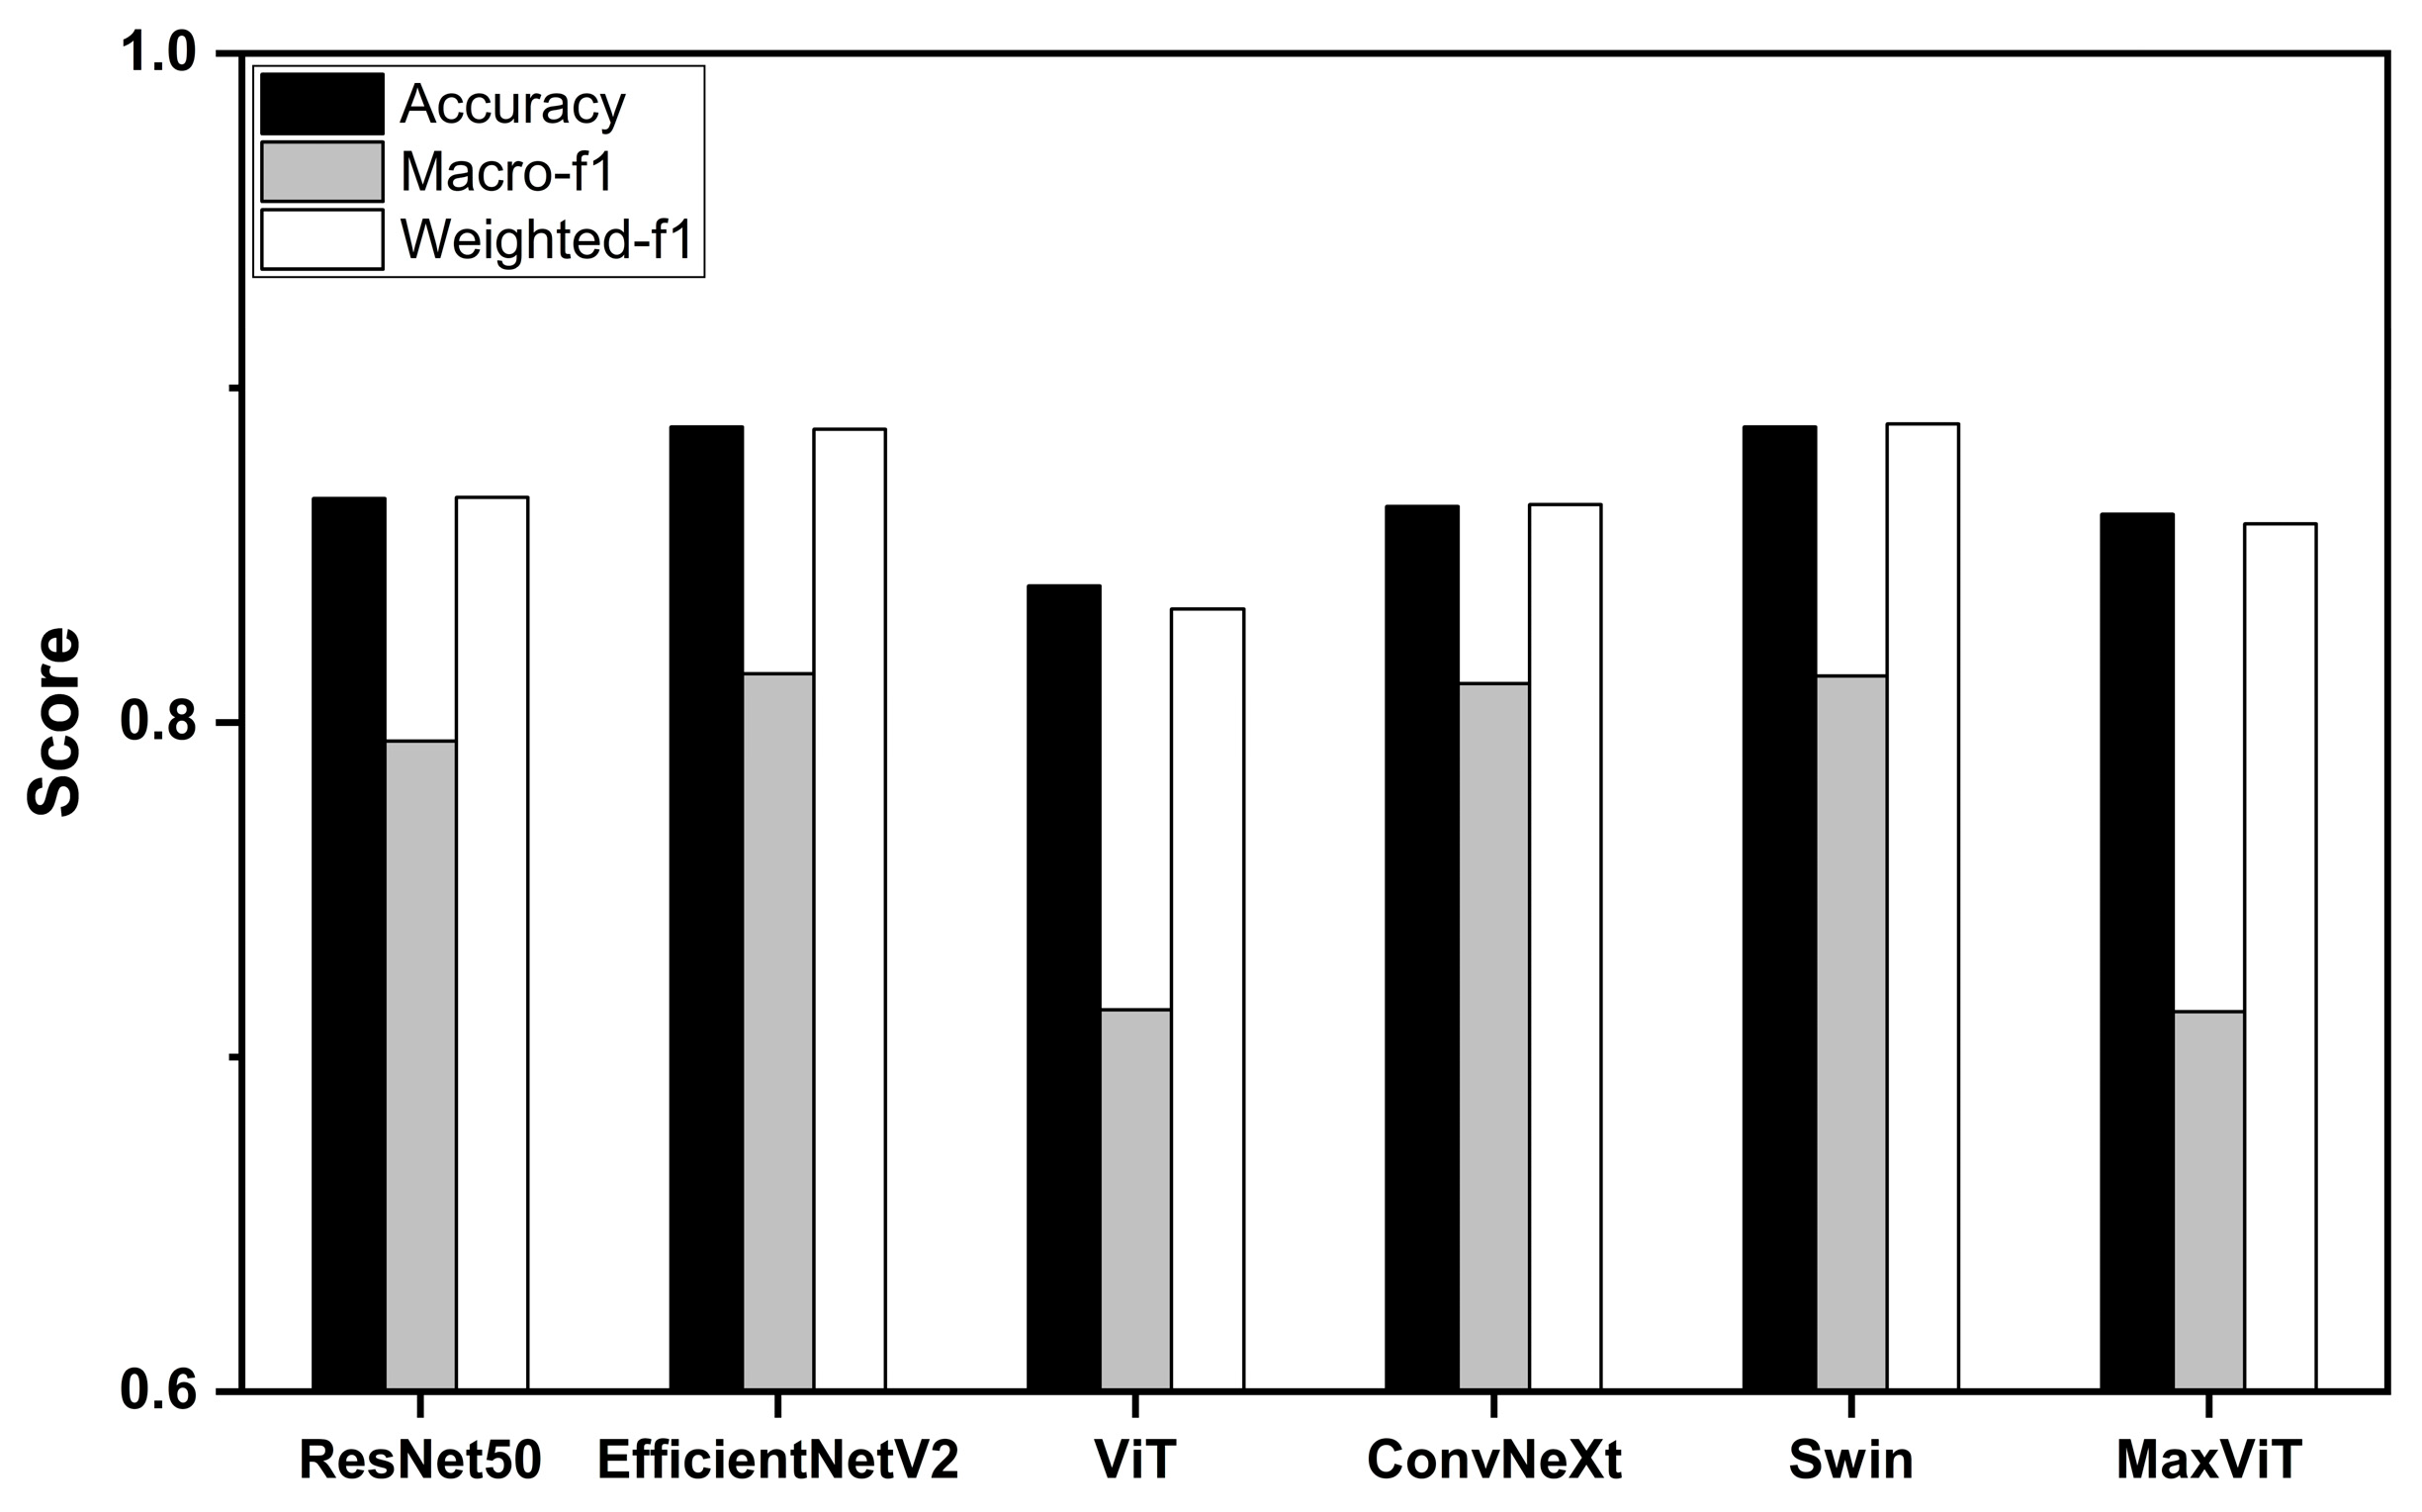
The combined results of applying six computer vision architectures towards textile classification show that the more traditional CNN models, such as Swin and EfficientNetV2, achieved the highest overall accuracies, of 0.89 (
Table 5 and
Figure 11). They also stand out with the best overall performance, as indicated by their Weighted-f1 score (0.89), while ConvNeXt closely follows (0.87). This suggests that they are the most reliable models for textile classification, even with unbalanced data [
23]. MaxVit shows impressive potential, with an overall accuracy of 0.86 and a Weighted-f1-score of 0.86, quite close to the aforementioned architectures. In contrast, ViT and RestNet50 had the lowest performances, with accuracies of 0.84 and 0.81, respectively, and lower Weighted-f1-scores (0.83 and 0.82). This suggests that they struggle more with this specific type of data. The Macro-f1-score, which is more sensitive to small classes, confirms this trend. Swin and EfficientVetV2 (Macro-f1-score is 0.89) remain at the top, showing that they handle the challenge of small classes better.
By combining all the findings presented in
Section 3, from performance metrics and energy efficiency to visual interpretation, the following guidelines are provided for selecting the most appropriate model for the unevenly distributed textile classification task. All models successfully recognize categories that have many samples, like Cotton and Denim. However, the real challenge lies in textile classes with limited samples, which can be considered as of most significance for heritage research as authentic historical findings are scarce [
49]. In this case, the recognition of Satin (
n = 24) was extremely difficult for all models, with almost all architectures presenting a low f1-score of 0.27 for the same class, apart from EfficientNetV2 (f1-score: 0.5). All models nearly failed to classify Felt, as this class has only a single sample. MaxViT faced additional difficulties, failing in the Suede class as well (
n = 5). Despite the struggles, there are also encouraging signs. Some limited sample classes like Chenille (
n = 13), Linen (
n = 19), and Velvet (
n = 11) are perfectly classified by most models. In conclusion, the choice of the right model is not based solely on overall accuracy but primarily on the f1-score of limited sample classes.
The Swin and EfficientNetV2 models proved to be the most reliable, with high overall performance combining stable and efficient operation. The choice between them might depend on computational cost, as Swin is likely more efficient. The ConvNeXt model is a very promising option, as it approaches the performance of Swin and EfficientNetV2 and offers improvements on specific, limited sample classes. It is a much better choice than ViT and MaxViT, which faced similar training sample number difficulties. Consequently, in archaeological research—where the correct classification of a limited number of textile classes is decisive—priority should be given to models with stable and reliable performance in these challenging cases with low sample number, while the potential of ConvNeXt for further improvement on the limited number of classes is also particularly interesting [
14].
Apart from their present performance in this preliminary study, the integration of the models into museum and laboratory workflows is a key future step. Lightweight and efficient models, such as Swin Transformer and EfficientNetV2, could be used in standard workstations or even portable devices, allowing for in situ classification during the standard workflows (documentation, conservation, or cataloging procedures). In laboratory environments, this automated classification could be embedded in standard and established procedures to assist with preliminary identification and prioritization for further analysis.
The explainability of the models, as demonstrated through the outcome heatmaps and attention maps, remains the most significant output of this deep learning approach. These visualizations highlight key structural textile details and offer archaeological insights that can be interpretable by researchers. The successful application of deep learning architectures highlights the need to construct an extended image library of textiles of archaeological and cultural interest. Such a dataset would allow model training using a dataset that is composed of real cases. It will also be used to test the method’s limitations, for example, in distinguishing between textiles with similar characteristics, or degraded textiles, which remain challenging even under optical and electron microscopes [
6].
5. Conclusions
The present preliminary study investigates the possibility of using pretrained deep learning models for textile classification, using low and conventional magnification textile images, under the scope of non-invasive analysis in heritage science. For this reason, three CNN models (ResNet50, EfficientNetV2, and ConvNeXt), and three transformer and hybrid models (Swin Transformer, Vision Transformer, and MaxViT) were trained and evaluated using a publicly available, imbalanced textile image dataset. This approach—bridging machine learning and heritage science—offers a non-invasive alternative for textile identification and documentation, aligned with sustainability purposes.
Overall, this benchmarking approach provides a comprehensive approach to the capabilities and limitations of each of the models under study. Based on the findings, the following recommendations are proposed for model selection, depending on accuracy, explainability, and energy efficiency requirements. EfficientNet has the best performance towards small datasets, ideal for early-stage archeometric applications, while Swin seems to be efficient when facing large datasets. On the other hand, although transformers typically require large training datasets, they should not be ruled out, as their performance could be improved with further training, pre-training, or hybrid architectural approaches. However, the present work, considering the imbalanced dataset scenario it uses, tends to conclude that classical deep learning (CNN) outperforms transformers for unbalanced texture classification, both in efficiency and effectiveness.
In conclusion, this comparative study demonstrates that although no single model outperforms others across all criteria, Swin and EfficientNetV2 emerge as the most balanced based on the proposed objectives. They both offer top accuracy, comparable to or superior to the others, keeping the minority classes at a high level, while being resource friendly. The results of the present preliminary study show that the deep learning approach can effectively be used to classify low-magnification textile images. This highlights the feasibility of developing a custom image dataset of textiles of archaeological and cultural interest, including samples of various preservation states. Moreover, the models demonstrate promising performance even with low-resolution images that can be collected using conventional microscopes or cameras, reinforcing the potential of building field-deployable textile recognition systems based on non-invasive imaging. In the long term, such approaches may enable the identification and classification of detailed textile morphological characteristics that define textile structure, such as thread-twisting direction, tightness and thickness of the thread, number of threads that compose the yarn, warp–weft count, and pore size, supporting deeper and non-invasive analysis in a heritage and forensic context.
Based on the present findings, the creation of a heritage-specific textile image dataset is recommended for future heritage-oriented applications. Such a dataset should include images of textiles of different preservation stages and typologies, enabling the training of models that generalize effectively towards archaeological contexts. This effort should be supported by the systematic recording of textile-related metadata for model explainability and reproducibility across various collections. Additionally, energy assessment protocols and in situ integration into documentation workflows would support rapid classification, prioritization, and evaluation of environmental impact. Together, these steps could support the development of an integrated, sustainable, rapid, and robust framework for large-scale textile classification.
