Abstract
A shared commitment to standardising the process of hypothetically reconstructing lost buildings from the past has characterised academic research in recent years and can manifest at various stages of the reconstructive process and with different perspectives. This research specifically aims to establish a user-independent and traceable procedure that can be applied at the end of the reconstructive process to quantify the average level of uncertainty of 3D digital architectural models. The procedure consists of applying a set of mathematical formulas based on numerical values retrievable from a given scale of uncertainty and developed to simplify reuse and improve transparency in reconstructive 3D models. This effort to assess uncertainty in the most user-independent way possible will contribute to producing 3D models that are more comparable to each other and more transparent for academic researchers, professionals, and laypersons who wish to reuse them. Being able to calculate a univocal numerical value that gives information on the global average uncertainty of a certain reconstructive model is an additional synthetic way, together with the more visual false-colour scale of uncertainty, to help disseminate the work in a clear and transmissible way. However, since the hypothetical reconstructive process is a process based on personal interpretation, which inevitably requires a certain level of subjectivity, it is crucial to define a methodology to assess and communicate this subjectivity in a user-independent and reproducible way.
1. Introduction
In the early 2000s, the scientific community started to debate the possibility of finding common ground regarding the hypothetical 3D virtual reconstruction of cultural heritage. The London Charter [1] and the Principles of Seville [2] were the first structured attempts at the international level to increase standardisation in this field. In more recent years, the handbook [3] by the DFG German network [4] and the ongoing CoVHer Erasmus + project [5] have tried to extend these foundational documents.
Among the issues debated in this context, one of the most relevant is the documentation of the reconstruction process and the evaluation of its uncertainty. The scholars operating in this field aspire to find a shared and universal way to evaluate and transmit the uncertainty of hypothetical reconstructions; however, the scientific community has not converged to a universal methodology yet. One of the main reasons is that architecture is not a hard science but, rather, embeds a relevant human-science-based component, which, by definition, is subject to creativity and thus subjectivity. For this reason, finding a universal and univocal way to quantify the amount of uncertainty is probably unachievable.
A universal scale that works for any hypothetical digital reconstructive project in any field and for any architectural style and size might not be possible. However, trying to develop a new, more objective and unambiguous way to evaluate uncertainty, at least for some sub-categories of case studies, is a legitimate effort toward improving the readability, transmissibility, and reproducibility of work in those sub-categories at least. Furthermore, the development of a shared method to evaluate uncertainty, capable of minimising overlapping and misinterpretations, would improve the comparability between different projects that use the same method and might also influence the reconstructive process itself from the roots, fostering the production of higher-quality 3D models and pushing the operators to be more aware of the importance of the documentation, assessment, and communication of the results of the 3D hypothetical reconstruction process.
This research brings forward a years-long research [6,7] aimed at developing an unambiguous and easy way to evaluate and communicate uncertainty for hypothetical reconstructions in architecture. This contribution further develops a method of extracting a numerical value describing quantitatively the average uncertainty of a reconstruction, intended as the maximum synthesis of the uncertainty analysis.
2. The State of the Art in Uncertainty Visualisation and Quantification
The assessment, visualisation, and quantification of average uncertainty is a widely studied topic in many scientific fields [8,9,10,11,12]. In the field of hypothetical virtual 3D reconstruction, many researchers have tried to go one step further than the simple completion of a single case study, addressing the challenge of making the interpretative process transparent and ensuring the reliability of its results [13,14] in order to focus on sharing the degree of knowledge achieved with both scholars and the general public. Initially, the goal was to achieve a high degree of photorealism through virtual reality, but non-photorealistic renderings are now recognised as valuable tools to help visualise the results achieved in relation to the intended audience [15,16]. The simplest and most effective approach to contextualising reconstructive hypotheses and assessing uncertainty is to create multiple models of the same object to allow comparison between different theories [17]. However, this method requires the modelling of numerous versions from the same sources, which can be resource-intensive. Kensek [14] presents a broad review of methods used in many disciplines to represent uncertainty in reconstructions, which include the following: (a) colouring schemes; (b) patterns, hatching, and line types; (c) materials; (d) rendering styles; and (e) alpha transparency. These methods have been successfully applied in architectural and archaeological reconstructions. Strothotte et al. [13] and Pang et al. [18] proposed the use of variations in line thickness to mark variations in reliability, while Zuk et al. [19] and Stefani et al. [20] (p. 124) proposed the use of wireframe or transparency on some features to visualise uncertainty.
Kensek et al. [14] proposed one of the most interesting and complex solutions, which consists of adding the information related to the lack/uncertainty of knowledge as a new layer using a colour map (e.g., red–green scale), mixed opacity, a combination of both these indicators, or different rendering types, such as wireframe and texture. Stefani et al. [20], D’Arcangelo and Della Schiava [21], Perlinska [22], and Ortiz-Corder et al. [23] are some of the many scholars that use false-colour visualisation to alert users to uncertain elements.
Temporal correspondence and different colours [24,25,26,27,28,29] are also used to represent uncertainty and to establish a “model validation” process. Interactive solutions [30] provide multiple reconstruction hypotheses, while some approaches group documentary sources by levels or classes [31,32,33] pp. 117–120. Demetrescu [34] proposes a formal archaeological language and annotation system to document reconstruction processes, linking them to investigation and interpretation procedures within the same framework. A general overview on uncertainty visualisation methods has been reported by Schäfer [35].
One of the few references that approaches mathematically the problem of uncertainty quantification is the work by Nicolucci and Hermon [36] where they assert that it is important to calculate a numerical value based on verifiable elements because it enables a scientific evaluation of the reconstruction. They individuate potential mathematical models that might be used for this task, but they warn about the risk of using the mathematical formula of probability to evaluate uncertainty because, by its nature, it “is very unreliable as a measure of reliability” [36] (p. 30) and it tends to underestimate greatly the quality of the reconstruction.
They show an example where they try to calculate how probable is for a reconstructive model to be exactly as it was reconstructed. By using the mathematical formula of probability, if the model is made of 10 elements with 80% probability each, the resulting total probability of the whole reconstruction would be just 10%, and since the elements of reconstruction are rarely 100% reliable, the total probability would worsen as more elements are added to the reconstruction. They conclude that “[…] a probabilistic approach leads to nowhere because of the normalisation property of probability, which is the basis for the multiplicative law we were forced to adopt”. [36] (p. 30).
Given this premise, Nicolucci and Hermon propose an alternative method to quantify the reliability of a reconstruction, which is based on fuzzy logic [37,38]. This method gives better results than the probabilistic approach; however, the formula proposed by Nicolucci and Hermon equalises the global reliability to the minimum reliability among the elements of the model [36] (pp. 30–31), which is an interesting number to extract in some cases but would not give any information about all the other, more reliable, elements, which might be a higher number or might weigh more in terms of importance in the reconstruction. Furthermore, Nicolucci and Hermon did not develop a user-independent method to evaluate the reliability of the single elements that might change the results based on who performs the assessment.
3. A User-Independent Methodology to Quantify Uncertainty
The methodology presented in this paper starts with the study of the state of the art and tries to maximise the conciseness, ease of use, reliability, reproducibility, transparency, and objectivity of application. To achieve these objectives, an improved, more objective and easy-to-use scale of uncertainty is proposed, and two mathematical formulas have been developed to allow a user-independent calculation of the global average uncertainty.
3.1. Improved Scale of Uncertainty
The first iteration of the improved scale of uncertainty was first presented in 2019 (published in 2021) for assessing the Critical Digital Model [6], and it was improved in 2024 to make it also usable in urban-scale reconstructions [7].
This scale (Figure 1) aims to minimise, as much as possible, ambiguities and overlapping between levels. The assignation of each level to each 3D element is decided by assessing the following characteristics of the sources used to reconstruct them:
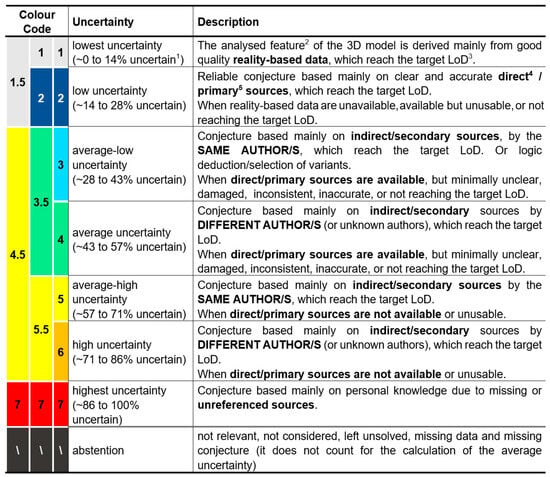
Figure 1.
Scale of uncertainty with 7, 5, or 3 levels (image produced by the authors and firstly published in [6] and updated in [7]).
- availability (available, unavailable, or partially available);
- authorship (same author, different author, or unknown author);
- type (physical remains, direct/primary sources, or indirect/secondary sources);
- quality (readable or unreadable, consistent or inconsistent, well preserved or damaged, etc.);
- LoD (provided by the sources compared with the target LoD of the reconstruction).
To each level, a colour, a number, a range of uncertainty (expressed as a percentage), and a description are assigned. For example, level 2 is blue, it ranges from 14% to 28% uncertainty, and its description is, “reliable conjecture based mainly on clear and accurate direct/primary sources, which reach the target LoD. When reality-based data are unavailable, or available but unusable, or do not reach the target LoD” (Figure 1).
The scale was developed at three different levels of granularity. The scale with 7(+1) levels considers all the characteristics of the sources, the scale with 5(+1) levels does not consider authorship, and the scale with 3(+1) levels differentiates uncertainty only based on direct/primary and indirect/secondary sources. The user will choose which level of granularity to use based on their needs (budgets, time, effectiveness, etc.). The use of the scale at different levels of granularity for different projects would not affect the comparability of the results, because the three scales were designed to be comparable even if they were subdivided into a different number of levels. This scale was designed to produce user-independent results by avoiding ambiguities and minimising overlapping. Since the amount of information that the operator needs to consider to assign each element to the correct level is high, a yes/no flowchart was developed to simplify its use (Figure 2).
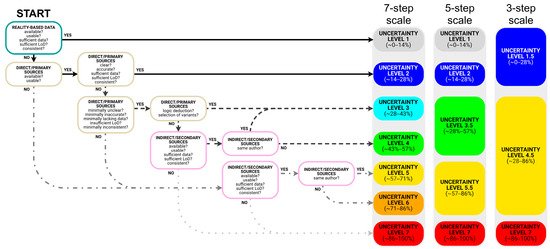
Figure 2.
Yes/no flowchart that aids in the application of the scale of uncertainty shown in Figure 1 (image produced by the authors and first published in [7]).
The scale is based on the assessment of the sources, and it can be used to evaluate the uncertainty of any of the features of the model (i.e., geometry, constructive system, surface appearance, or position). Once a particular level of uncertainty is assigned to each element, the model can be represented and visualised with false colours, as shown in Figure 3.
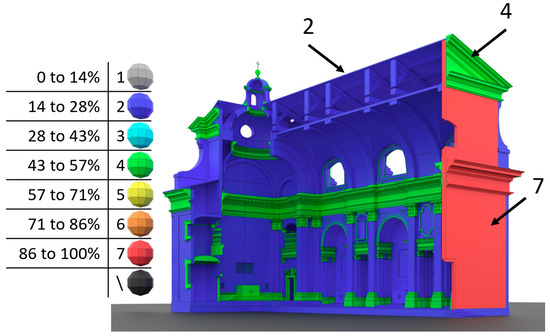
Figure 3.
An exemplificative case of a false-colour visualisation based on the scale of uncertainty shown in Figure 1.
3.2. Average Uncertainty Weighted on the Volume (AU_V)
Once the scale is applied, it provides element-by-element information and can be visualised through false-colour representation. However, false-colour shading alone is not optimal for comparing the uncertainty of multiple 3D models or having an idea of the average uncertainty of the entire reconstruction without an in-depth investigation of the 3D model. For this objective, it would be best to be able to extract a single numerical value capable of communicating at a glance the average uncertainty of the model. Nicolucci and Hermon [36] have already shown that the probability calculation is not optimal for assessing the average uncertainty because it greatly underestimates it, and the fuzzy logic approach is too user-dependent. Thus, the formula that calculates the Average Uncertainty weighted with the Volume (AU_V), presented below, was developed to limit these problems as much as possible:
where
- AU_V is the average uncertainty weighted with the volume of the individual elements;
- n is the total number of elements;
- i is the index of the considered element;
- Vol is the volume of the considered element;
- Uncert is the uncertainty value of the considered element.
Expressing the results in % makes the result more readable. Weighting by volume ensures that the result remains invariant; regardless of how the model is segmented, it must be clarified that the volumes do not consider empty spaces (rooms, halls, naves, etc.) but only the volumes of the architectural elements (walls, columns, capitals, etc.).
The models shown in Figure 4 were used to test this formula (and the following ones). To make the example simple to understand, without any loss of generality, only two levels of the scale were assigned to the model. In the exemplificative models, the ornaments (cornices, altar, capitals, basements, etc.) are assigned to level four of uncertainty, while the rest of the elements (that we will call structure for simplicity of understanding) are assigned to level one. The hypothetical reconstruction on the left and that on the right have the same overall exterior shape and volume; however, the geometry is segmented in different ways. In particular, in the case on the right, the ornaments are more granularly segmented.
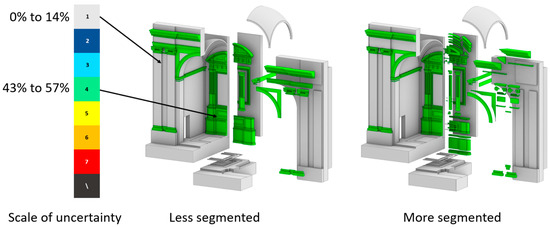
Figure 4.
The same simplified exemplificative reconstructive case segmented in two different ways (left: ornaments are less segmented, right: ornaments are more segmented). Refer to Figure 1 for the false-colour scale explanation.
The application of the formula can be performed manually without the help of any electronic tool; however, doing it manually would be very time-consuming and more subject to errors, so it is preferable to implement an automatised procedure through a computer script or an algorithm, for example, designed with visual programming applications such as Grasshopper for McNeel Rhinoceros [39], as shown in Figure 5. In the example, the AU_V formula returned an equal result of about 16% uncertainty for both models, regardless of their segmentation.
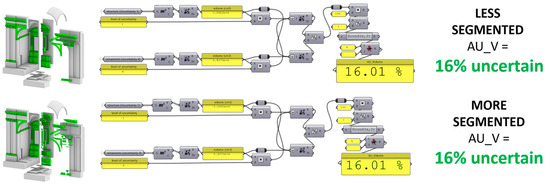
Figure 5.
Left: The reference reconstructive exemplificative model with the same shape and uncertainty but different segmentation. Right: Visual scripting of the AU_V formula implemented in Grasshopper [39].
3.3. Average Uncertainty Weighted on the Volume and Relevance (AU_VR)
The previous AU_V formulation produces a user-independent value with a given 3D model; however, it will inevitably produce results that will lean more toward the elements with larger volumes (e.g., walls or floors).
To address the problem, an additional formula was developed: the Average Uncertainty weighted on the Volume and Relevance (AU_VR). The new formula, shown below, takes into consideration the importance/relevance of the elements but is more subjective, as human operators assign the values according to their critical judgement.
where
- AU_VR is the average uncertainty weighted with the volume of the individual elements and a relevance factor assigned by operators based on their critical/subjective judgement of the importance of the individual elements;
- Relev is the relevance factor (which can be larger or smaller than 1 but never equal or smaller than 0).
In this formula, the relevance factor is superimposed on individual elements (or groups of elements) by the operator performing the analysis. It is more user-dependent; however, if the relevance factors are clearly declared, then the results will be reproducible. Since the AU_VR result is less objective but more knowledge-enriched, it has to be intended as complementary and not as a substitute for the AU_V. The two numerical values together (AU_V and AU_VR) provide a critical and synthetic assessment of the average uncertainty. Figure 6 shows the implementation in Grasshopper [39] of the AU_VR formula applied to the exemplificative case study. The AU_VR formula shown in Figure 6 returns an average uncertainty equal to about 34% (regardless of the segmentation of the model), which is about 18% higher than the AU_V calculated in Figure 5; this happened because the ornaments were multiplied for a relevance factor equal to 20 (the relevance factor was assigned based on the critical/subjective judgement of the operator).
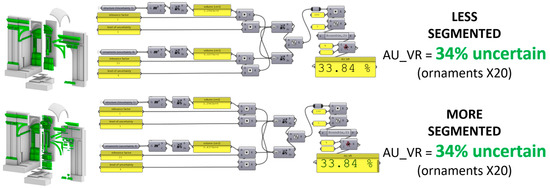
Figure 6.
Left: The reference reconstructive exemplificative model with the same shape and uncertainty but different segmentation. Right: Visual scripting of the AU_VR formula implemented in Grasshopper [39].
3.4. Is There Any Alternative to Weighting with the Volume?
The choice of adding the weighting for the volume in the formula comes from the need to make the results as user-independent as possible. However, in some cases, the reconstructive models might not have closed watertight volumes or might have self-intersections. These unstructured, surface-based, quick, or uncleaned 3D modelling practices should be avoided in the first place because they will cause problems in certain practical uses of the models (3D printing, simulations, rendering, animation, etc.) and work against the principle of reusability (refer to the next section for an in-depth discussion on 3D model quality assessment and 3D model proofing), but, most importantly, from a theoretical point of view, real-world architecture is made of volumes and closed solids and not zero-thickness open surfaces; therefore, it is important to conceive and structure a digital model taking into account this important characteristic.
Despite this, we might wonder whether there are alternatives to weighting with the volume, for example, weighting with the surface area, the number of vertices, or the mean curvature. The short answer is no: volume weighting is the most reliable method tested. The other methods evaluated are shown and discussed below.
The first alternative formula tested was the arithmetic average:
using which the results of the two differently segmented cases differ by about 20% (Figure 7), which is unacceptable for a process that aims to be reproducible and user-independent.
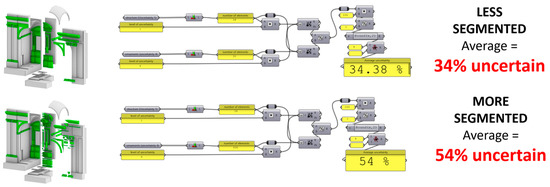
Figure 7.
Left: The reference reconstructive exemplificative model with the same shape and uncertainty but different segmentation. Right: Application of the Arithmetic average formula with Grasshopper [39]. The results are heavily influenced by the segmentation of the 3D model.
Given the obvious limits of the arithmetic average formula, other formulas were tested: the average weighted on the surface area, the vertices, and the mean curvature:
However, none of them gave acceptable results. The formula based on the surface area (4) returned different results depending on the segmentation of the model, as shown in Figure 8. In this example, the average uncertainty weighted with the surface area produced results that were not significantly different, which might seem acceptable in some cases. However, due to potential variability across different cases, this approach is not a reliable solution for a method that aims to increase the comparability of different reconstructive hypothetical models in a shared research scientific environment.
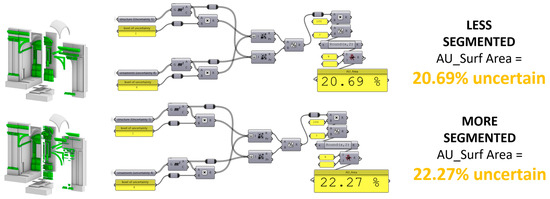
Figure 8.
Left: The reference reconstructive exemplificative model with the same shape and uncertainty but different segmentation. Right: Application of the formula of the average uncertainty weighted on the surface area with Grasshopper [39]. The results are influenced by the segmentation of the 3D model.
For the formula based on the mean curvature (6), the box-shaped geometries (e.g., walls or floors) had an irrelevant influence on the result, since their curvature is equal to zero; thus, some elements intrinsically weigh much less than others. Lastly, the formula based on the number of vertices (5) suffered both problems because elements with finer details tend to be densely subdivided (high number of vertices), while the objects with less detail tend to have coarser meshes (lower number of vertices); furthermore, the results depend not only on the segmentation of the model but also on the tessellation of the meshes, which strongly depends on users’ input. Figure 9 and Figure 10 show that the average uncertainties calculated by weighting with the vertices and the curvature gave results very close to the uncertainty of the ornaments alone; this means that some elements are almost completely irrelevant, which is not acceptable.

Figure 9.
Calculation of the average uncertainty weighted with the number of vertices; the result is unacceptable because box-like elements weigh almost zero. Refer to Figure 1 for the false-colour scale explanation.
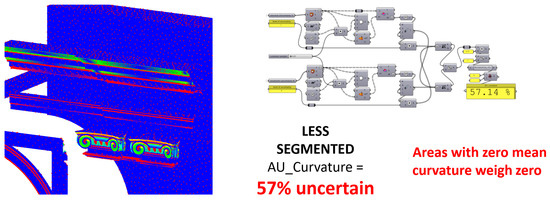
Figure 10.
Calculation of the average uncertainty weighted with the mean curvature; the result is unacceptable because elements with zero mean curvature weigh zero. Blue represents minimum men curvature and red maximum.
4. Three-Dimensional Model Quality Assessment and Validation
The methodology presented requires us to calculate the volume of each element of the 3D model, so, in order to be able to apply it, the model must comply with the following requirements:
- the model must be made exclusively using valid objects (objects with no bugs or errors);
- all the elements of the model must be closed, watertight solids;
- all the edges of each element of the model must be manifold;
- the normal vector of each surface/face composing each solid must be pointing outwards;
- the model must not have duplicate overlapping objects;
- the model must not have intersecting objects;
- models must not be welded into one single object through Boolean union (because, this way, it would be impossible to carry out any per-element assessment, e.g., the visualisation and quantification of uncertainty, or semantic segmentation and enrichment);
- the model must be scaled properly to prevent tolerance errors (the chosen unit of measurement must be fixed to a proper unit from the beginning of the modelling, e.g., millimetres for furniture, centimetres for buildings, and metres for urban areas).
The model could be validated with many different professional tools; some tools perform some of these checks automatically and highlight eventual errors (e.g., BIM software can automatically verify the intersections of solids, and solid modellers do not allow for the creation of open surfaces and poly surfaces). In Rhinoceros [39], to validate the 3D models, they can be interrogated by running the following commands:
- _SelDup (selects exactly overlapping duplicates),
- _SelOpenSrf (selects open surfaces),
- _SelOpenPolysrf (selects open poly surfaces/breps),
- _SelBadObjects (selects invalid/bugged objects),
- _MeshSelfIntersect (creates polylines from self-intersections of mesh objects; this command also works for NURBS but still generates discretized polylines rather than smooth curves. This command can be used to visually identify self-intersecting points in order to fix the surfaces that generate them).
If any of these commands return positive results, then the model must be corrected. Sometimes, the errors can be fixed automatically (e.g., in Rhinoceros, closed solids cannot have normal vectors pointing inwards; if there are only planar holes, then they can be closed with the _cap command; and if duplicates are selected, then they can be simply erased), but sometimes the errors have to be fixed manually (e.g., invalid parts must be remodelled entirely). Running these commands in Rhinoceros [39] already allows us to identify most problems; however, at the current time, there is no integrated tool to check if any solid is partially intersecting other solids. This problem is fixed by using Grasshopper [39], as shown in Figure 11.
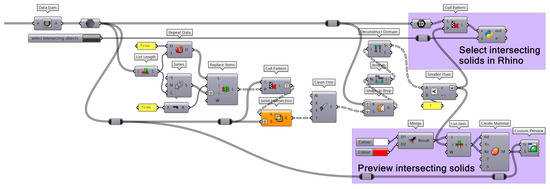
Figure 11.
Grasshopper [39] algorithm for identifying intersecting solids in Rhinoceros (this also works for partially intersecting or fully enclosed volumes); in the Python scripted node, there is a custom definition to select the geometries in the Rhinoceros viewport (“sc.doc.Objects.Find”). To improve performance, it is possible to perform clash detection before the Boolean intersection.
5. Future Work
To further improve the effectiveness, robustness, objectivity, applicability, and reproducibility of the proposed methodology, further future developments can be carried out.
The development of a complementary methodology for the balancing of the quantitative with the qualitative aspects, namely, the definition of a workflow for the assessment of the relevance/importance of the various elements of the analysed building/site object of study (based, for example, on cultural, historical, or aesthetic values) would guarantee more consistent results by contributing to minimising subjectivity. It could be configured in a list of reference relevance factors for individual architectural elements, considering their period, style, etc., that would aid the operator in choosing the proper relevance factors for the AU_VR formula.
The development and inclusion of ethical guidelines for the assessment of the uncertainty in the methodology would help avoid compromising the authenticity and integrity of heritage sites. In particular, it is important to prevent the exploitation of this methodology as a tool for the authorisation or negation of physical interventions in existing heritage. In fact, higher or lower uncertainty scores are only thought to improve the comparability and transparency of hypothetical reconstructions and do not represent a tool to validate the work or express a judgement on the quality of the work.
The effectiveness and spread of this methodology in the scientific community rely on its versatility of use while still having a framework of reference to limit the possible variations in order to improve the reusability and comparability of results; as mentioned, the scale of uncertainty, based on the assessment of sources, presented in this publication as an exemplificative case, is not the only possible way to evaluate uncertainty. In fact, the development of further novel scales that accommodate uncertainty based on different textual definitions but following the same methodology presented here might be gathered in a shared open web-based platform of reference to make them available for others who want to cite or reuse them.
The average uncertainty weighted on the volume or on the volume and relevance, despite its great usefulness in many contexts, is not omni-comprehensive. In some cases, other values might be useful in order to provide additional information. Thus, it might be interesting to develop a list of other possible formulations (other than the average uncertainty weighted on volume and relevance) that might return and synthesise additional data that are useful in some contexts (maximum uncertainty, minimum uncertainty, etc.).
The presented methodology has been extensively tested on hundreds of case studies of unbuilt or lost drawn architecture in the course ‘Architectural Drawing and Graphic Analysis’ of the single-cycle degree programme in Architecture, Alma Mater Studiorum University of Bologna; furthermore, more extensive testing is ongoing in the context of the CoVHer Erasmus+ project [5], with a wider audience of students and scholars from five different European universities operating in various disciplines (archaeology, art history, architecture, engineering, etc.). The updated methodology and the results of these tests will be published at the end of the CoVHer project in 2025.
6. Conclusions
The average uncertainty weighted with the volume of the individual elements (AU_V) is useful to calculate the average global uncertainty of a hypothetical reconstructive 3D architectural model because it guarantees user-independent and segmentation-independent results. A critical issue of this approach is that the elements with bigger volumes influence the result more than others with smaller volumes; thus, to overcome this problem, a formula that calculates the average uncertainty weighted with the volume and the relevance (AU_VR) was developed to improve the result by adding a factor that considers not only the volume but also the importance of the elements. The AU_VR formula makes the results more user-dependent but will produce more knowledge-enriched results since the relevance factors are assigned subjectively but critically by the operator who performs the analysis. Due to the added subjectivity in determining the relevance factors, they must be clearly declared to guarantee reproducibility and transparency. The development of a complementary methodology to aid in the determination of the relevance factors based on the architectural style, context, cultural values, etc., might contribute to decreasing subjectivity and improving the overall effectiveness of this methodology. Both formulas have their pros and cons; therefore, they are not exclusive, but complementary. Expressing the average uncertainty in % (percentage) makes the result more readable and comparable even by laypersons.
This method is only applicable to 3D models that are modelled with manifold, valid, watertight, closed solids, with no intersections and self-intersections. This might seem like a limitation; however, in the architectural field, models with self-intersections or with opened poly surfaces are often considered not correct or usable. Thus, this apparent critical issue might turn into a potentiality because it could foster the spread of better modelling practices and better overall topological/geometrical quality in 3D models.
If this method becomes standard in the field, then adhering to good modelling practices, correctly applying formulas, and properly documenting the assigned relevance values will be crucial in obtaining results that the scientific community considers relevant, comparable, and reusable.
Higher uncertainty scores do not necessarily mean that a reconstruction is less scientifically relevant; in fact, a reconstruction that is more uncertain might be more interesting than one with a lower uncertainty score, because it would imply a more complex and deeper study of sources and would foster discussion and advance knowledge. On the contrary, in alignment with ICOMOS guidelines, lower uncertainty scores must not automatically authorise invasive interventions on existing heritage.
In conclusion, the proposed formula associated with a scale of up to seven values allows for greater objectivity, reproducibility, and comparability of results. It is implied that these formulas could also work for other scales of uncertainty as long as the chosen scales follow the principles of reusability, exhaustiveness, unambiguity, and objectivity. The possibility of using the same formulas on different scales allows the obtention of comparable results even when the proposed scale’s definitions or the number of levels in the scale are varied.
Author Contributions
Conceptualisation, F.I.A., F.F. and R.F.; methodology, F.I.A., F.F. and R.F.; software, R.F.; validation, F.I.A., F.F. and R.F.; formal analysis, R.F.; investigation, R.F.; resources, F.I.A., F.F. and R.F.; data curation, R.F.; writing—original draft preparation, R.F.; writing—review and editing, F.I.A., F.F. and R.F.; visualisation, R.F.; supervision, F.F.; project administration, F.F.; funding acquisition, F.F. All authors have read and agreed to the published version of the manuscript.
Funding
This research was financially supported by CoVHer (Computer-based Visualisation of Architectural Cultural Heritage) Erasmus+ Project (ID KA220-HED-88555713) (www.CoVHer.eu and https://erasmus-plus.ec.europa.eu/projects/search/details/2021-1-IT02-KA220-HED-000031190, accessed on 12 August 2024).
Data Availability Statement
Data sharing does not apply to this article as no datasets were generated or analysed during the current study. Concerning the algorithms and scripts, all the needed information for the reproducibility of the study is integrated into the text or figures.
Acknowledgments
We thank the partners of the Erasmus+ project CoVHer who directly or indirectly contributed to improving the quality of our research thanks to the constructive discussions developed in the formal and informal context of the project.
Conflicts of Interest
The authors declare no conflicts of interest. The funders had no role in the design of the study; in the collection, analyses, or interpretation of data; in the writing of the manuscript; or in the decision to publish the results.
References
- Denard, H. The London Charter. For the Computer-Based Visualisation of Cultural Heritage, Version 2.1; King’s Colege: London, UK, 2009; Available online: https://www.londoncharter.org (accessed on 4 July 2024).
- Principles of Seville. ‘International Principles of Virtual Archaeology’. Ratified by the 19th ICOMOS General Assembly in New Delhi, 2017. Available online: https://link.springer.com/article/10.1007/s00004-023-00707-2 (accessed on 4 July 2024).
- Münster, S.; Apollonio, F.I.; Blümel, I.; Fallavollita, F.; Foschi, R.; Grellert, M.; Ioannides, M.; Jahn, H.P.; Kurdiovsky, R.; Kuroczynski, P.; et al. Handbook of 3D Digital Reconstruction of Historical Architecture; Springer Nature: Cham, Switzerland, 2024. [Google Scholar] [CrossRef]
- DFG Website. Available online: https://www.gw.uni-jena.de/en/faculty/juniorprofessur-fuer-digital-humanities/research/dfg-netzwerk-3d-rekonstruktion (accessed on 4 July 2024).
- CoVHer Erasmus+ Project Official Website. Available online: www.CoVHer.eu (accessed on 4 July 2024).
- Apollonio, F.I.; Fallavollita, F.; Foschi, R. The Critical Digital Model for the Study of Unbuilt Architecture. In Proceedings of the Research and Education in Urban History in the Age of Digital Libraries: Second International Workshop, UHDL 2019, Dresden, Germany, 10–11 October 2019; Springer International Publishing: Cham, Switzerland, 2021. Revised Selected Papers. pp. 3–24. [Google Scholar] [CrossRef]
- Apollonio, F.I.; Fallavollita, F.; Foschi, R. Multi-Feature Uncertainty Analysis for Urban Scale Hypothetical 3D Reconstructions: Piazza delle Erbe Case Study. Heritage 2024, 7, 476–498. [Google Scholar] [CrossRef]
- Potter, K.; Rosen, P.; Johnson, C.R. From Quantification to Visualization: A Taxonomy of Uncertainty Visualization Approaches. In Uncertainty Quantification in Scientific Computing. WoCoUQ 2011. IFIP Advances in Information and Communication Technology; Dienstfrey, A.M., Boisvert, R.F., Eds.; Springer: Berlin/Heidelberg, Germany, 2012; Volume 377, pp. 226–249. [Google Scholar] [CrossRef]
- Raber, T.R.; Files, B.T.; Pollard, K.A.; Oiknine, A.H.; Dennison, M.S. Visualizing Quantitative Uncertainty: A Review of Common Approaches, Current Limitations, and Use Cases. In Advances in Simulation and Digital Human Modeling. AHFE 2020. Advances in Intelligent Systems and Computing; Cassenti, D., Scataglini, S., Rajulu, S., Wright, J., Eds.; Springer: Cham, Switzerland, 2021; Volume 1206. [Google Scholar] [CrossRef]
- Cortés, J.C.; Caraballo, T.; Pinto, C.M.A. Focus point on uncertainty quantification of modeling and simulation in physics and related areas: From theoretical to computational techniques. Eur. Phys. J. Plus 2023, 138, 17. [Google Scholar] [CrossRef] [PubMed]
- Matzen, L.E.; Rogers, A.; Howell, B. Visualizing Uncertainty in Different Domains: Commonalities and Potential Impacts on Human Decision-Making. In Visualization Psychology; Albers Szafir, D., Borgo, R., Chen, M., Edwards, D.J., Fisher, B., Padilla, L., Eds.; Springer: Cham, Switzerland, 2023; pp. 331–369. [Google Scholar] [CrossRef]
- Boukhelifa, N.; Perrin, M.E.; Huron, S.; Eagan, J. How data workers cope with uncertainty: A task characterisation study. In Proceedings of the 2017 CHI Conference on Human Factors in Computing Systems, Denver, CO, USA, 6–11 May 2017; pp. 3645–3656. [Google Scholar] [CrossRef]
- Strothotte, T.; Masuch, M.; Isenberg, T. Visualizing Knowledge about Virtual Reconstructions of Ancient Architecture. In Proceedings of the Computer Graphics International, Canmore, AB, Canada, 7–11 June 1999; pp. 36–43. [Google Scholar] [CrossRef]
- Kensek, K.M.; Dodd, L.S.; Cipolla, N. Fantastic reconstructions or reconstructions of the fantastic? Tracking and presenting ambiguity, alternatives, and documentation in virtual worlds. Autom. Constr. 2004, 13, 175–186. [Google Scholar] [CrossRef]
- Roberts, J.C.; Ryan, N. Alternative archaeological representations within virtual worlds. In Proceedings of the 4th UK Virtual Reality Specialist Interest Group Conference Brunel University; Bowden, R., Ed.; Brunel University: Uxbridge, UK, 1997; pp. 179–188. [Google Scholar]
- Roussou, M.; Drettakis, G. Photorealism and non-photorealism in virtual heritage representation. In Proceedings of the 3rd International Symposium on Virtual Reality, Archaeology and Intelligent Cultural Heritage, VAST’06, Brighton, UK, 5–7 November 2003; Arnold, D., Chalmers, A., Niccolucci, F., Eds.; The Eurographics Association: Goslar, German, 2003; pp. 51–60. [Google Scholar] [CrossRef]
- Cargill, R.R. An Argument for Archaeological Reconstruction in Virtual Reality. Near East. Archaeol. Forum Qumran Digit. Model 2009, 72, 28–47. [Google Scholar] [CrossRef]
- Pang, A.T.; Wittenbrink, C.M.; Lodha, S.K. Approaches to uncertainty visualization. Vis. Comput. 1997, 13, 370–390. [Google Scholar] [CrossRef]
- Zuk, T.; Carpendale, S.; Glanzman, W.D. Visualizing temporal uncertainty in 3D virtual reconstructions. In Proceedings of the 5th International Symposium on Virtual Reality, Archaeology and Intelligent Cultural Heritage, VAST’05, Pisa, Italy, 8–11 November 2005; Mudge, M., Ryan, N., Scopigno, R., Eds.; The Eurographics Association: Goslar, Germany, 2005; pp. 99–106. [Google Scholar] [CrossRef]
- Stefani, C. Maquettes Numériques Spatio-Temporelles d’édifices Patrimoniaux. Modélisation de La Dimension Temporelle et Multi-Restitutions d’Édifices. Base de données [cs.DB]. Arts et Métiers ParisTech. 2010. Available online: https://pastel.archives-ouvertes.fr/pastel-00522122 (accessed on 4 July 2024).
- D'Arcangelo, M.; Della Schiava, F. Dall’antiquaria Umanistica Alla Modellazione 3D: Una Proposta di Lavoro Tra Testo e Immagine. Camenae, 10-Février, 2012. Available online: https://www.researchgate.net/publication/293200447_Dall'antiquaria_umanistica_alla_modellazione_3D_una_proposta_di_lavoro_tra_testo_e_immagine (accessed on 1 February 2023).
- Perlinska, M. Palette of Possibilities. Ph.D. Thesis, Department of Archaeology and Ancient History, Lund University, Lund, Sweden, 2014. [Google Scholar]
- Ortiz-Cordero, R.; Pastor, E.L.; Fernández, R.E.H. Proposal for the Improvement and Modification in the Scale of Evidence for Virtual Reconstruction of the Cultural Heritage: A First Approach in the Mosque-Cathedral and the Fluvial Landscape of Cordoba. J. Cult. Herit. 2018, 30, 10–15. [Google Scholar] [CrossRef]
- Apollonio, F.I.; Gaiani, M.; Sun, Z. 3D Modelling and Data Enrichment in Digital Reconstruction of Architectural Heritage. Int. Arch. Photogramm. Remote Sens. Spat. Inf. Sci. (ISPRS) 2013, 40, 43–48. [Google Scholar] [CrossRef]
- De Luca, L.; Busayarat, C.; Stefani, C.; Renaudin, N.; Florenzano, M.; Véron, P. Une approche de modélisation basée sur l'iconographie pour l'analyse spatio-temporelle du patrimoine architectural—An iconography-based modeling approach for the spatio-temporal analysis of architectural heritage. In Proceedings of the Arch-I-Tech 2010, Cluny, France, 17–19 November 2010; Available online: https://www.researchgate.net/publication/235683915_Une_approche_de_modelisation_basee_sur_l'iconographie_pour_l'analyse_spatio-temporelle_du_patrimoine_architectural#fullTextFileContent (accessed on 16 August 2024).
- Bakker, G.; Meulenberg, F.; Rode, J.D. Truth and credibility as a double ambition: Reconstruction of the built past, experiences and dilemmas. J. Vis. Comput. Animat. 2003, 14, 159–167. [Google Scholar] [CrossRef]
- Borra, D. Sulla verità del modello 3D. Un metodo per comunicare la validità dell’anastilosi virtuale. In Proceedings of the eArcom 04 Tecnologie per Comunicare l’Architettura, Ancona, Italy, 20–22 May 2004; Malinverni, E.S., Ed.; CLUA Edizioni: Ancona, Italy, 2004; pp. 132–137. [Google Scholar]
- Borghini, S.; Carlani, R. Virtual rebuilding of ancient architecture as a researching and communication tool for Cultural Heritage: Aesthetic research and source management. Disegnarecon 2011, 4, 71–79. [Google Scholar] [CrossRef]
- Apollonio, F.I.; Gaiani, M.; Sun, Z. Characterization of Uncertainty and Approximation in Digital Reconstruction of CH Artifacts. In Le vie dei Mercanti XI Forum Internazionale di Studi; La Scuola di Pitagora Editrice: Napoli, Italy, 2013; pp. 860–869. [Google Scholar]
- Bonde, S.; Maines, C.; Mylonas, E.; Flanders, J. The virtual monastery: Re-presenting time, human movement, and uncertainty at Saint-Jean-des-Vignes, Soissons. Vis. Resour. 2009, 25, 363–377. [Google Scholar] [CrossRef]
- Dell’Unto, N.; Leander, A.; Dellepiane, M.; Callieri, M.; Ferdani, D.; Lindgren, S. Digital Reconstruction and Visualization in Archaeology: Case-Study Drawn from the Work of the Swedish Pompeii Project. In Proceedings of the Digital Heritage International Congress, Marseille, France, 28 October–1 November 2013; Volume 1, pp. 621–628. [Google Scholar] [CrossRef]
- Vico Lopez, M.D. La “Restauración Virtual” Según la Interpretación Arquitectonico Constructiva: Metodologia y Aplicación al Caso de la Villa de Livia. Ph.D. Thesis, 2012. Available online: https://www.tdx.cat/handle/10803/96674 (accessed on 1 August 2024).
- Viscogliosi, A.; Borghi, S.; Carlani, R. L’uso delle Ricostruzioni Virtuali Tridimensionali Nella Storia dell’Architettura: Immaginare la Domus Aurea; Journal of Roman Archaeology; Haselberger, L., Humphrey, J., Eds.; JH Humphrey: Portsmouth, RI, USA, 2006; Supplementary Series 61; pp. 207–219. [Google Scholar]
- Demetrescu, E. Archaeological Stratigraphy as a formal language for virtual reconstruction. Theory and practice. J. Archaeol. Sci. 2015, 57, 42–55. [Google Scholar] [CrossRef]
- Schäfer, U.U. Uncertainty visualization and digital 3D modeling in archaeology. A brief introduction. International J. Digit. Art Hist. 2018, 3, 87–106. [Google Scholar] [CrossRef]
- Nicolucci, F.; Hermon, S. A Fuzzy Logic Approach to Reliability in Archaeological Virtual Reconstruction. In Beyond the Artifact. Digital Interpretation of the Past, Proceedings of the CAA2004, Prato, Italy, 13–17 April 2004; Nicolucci, F., Hermon, S., Eds.; Archaeolingua: Budapest, Hungary, 2010; pp. 28–35. Available online: https://proceedings.caaconference.org/paper/03_niccolucci_hermon_caa_2004/ (accessed on 4 July 2024).
- Zadeh, L.A. Fuzzy sets. Inf. Control 1965, 8, 338–353. [Google Scholar] [CrossRef]
- Yager, R.R.; Filev, D. Essentials of Fuzzy Modeling and Control; Wiley: New York, NY, USA, 1994. [Google Scholar]
- Rhinoceros 8 Official Website. Available online: https://www.rhino3d.com/it/ (accessed on 4 July 2024).
Disclaimer/Publisher’s Note: The statements, opinions and data contained in all publications are solely those of the individual author(s) and contributor(s) and not of MDPI and/or the editor(s). MDPI and/or the editor(s) disclaim responsibility for any injury to people or property resulting from any ideas, methods, instructions or products referred to in the content. |
© 2024 by the authors. Licensee MDPI, Basel, Switzerland. This article is an open access article distributed under the terms and conditions of the Creative Commons Attribution (CC BY) license (https://creativecommons.org/licenses/by/4.0/).