Article

Practices and Rules of 16th Century Genoese Gilding: Exploring Gold Leaf Thickness and Caratage through X-ray and Ion Beam Techniques

by
Letizia Ciarlo
1,
Massimo Chiari
2,*,
Maria Clelia Galassi
1,
Maurizio Ferretti
3,
Elias Sideras-Haddad
4,5,
Alessandro Zucchiatti
5,6 and
Elena Castagnotto
3
1
Dipartimento di Italianistica, Romanistica, Antichistica, Arti e Spettacolo (DIRAAS), Via Balbi 6, 16126 Genova, Italy
2
Istituto Nazionale di Fisica Nucleare (INFN), Sezione di Firenze, Via G. Sansone 1, 50019 Firenze, Italy
3
Dipartimento di Chimica e Chimica Industriale (DCCI), Via Dodecaneso 31, 16146 Genova, Italy
4
Department of Industrial Design & Production Engineering, University of West Attica, Egaleo, 12241 Athens, Greece
5
School of Physics, University of the Witwatersrand, Braamfontein, Johannesburg 2017, South Africa
6
Dipartimento di Scienze della Terra, dell’Ambiente e della Vita (DISTAV), C.so Europa 26, 16132 Genova, Italy
*
Author to whom correspondence should be addressed.
Heritage 2024, 7(7), 3630-3642; https://doi.org/10.3390/heritage7070172
Submission received: 5 June 2024 / Revised: 29 June 2024 / Accepted: 3 July 2024 / Published: 11 July 2024

Abstract

:
This study investigates the practices and rules of Genoese gilding, drawing insights from a 16th-century manuscript containing regulations for gold leaf production. Employing X-ray and ion beam techniques, we quantitatively assess the manuscript’s gold leaf thickness without destructive sampling. Artisanal goldbeater-produced leaves of different thicknesses, applied with a guazzo or mordant technique, served as standards. Further analysis of samples with unknown thickness from the furniture of Palazzo Spinola di Pellicceria in Genoa (Italy) has confirmed the method’s applicability to practical cases. External beam Rutherford backscattering spectrometry (RBS) and particle-induced X-ray emission (PIXE) analyses were carried out using 3 MeV protons at the LABEC accelerator laboratory in Florence. A linear relationship between Gold Lα peak yield and leaf thickness, as measured by RBS, has been established for optimal calibration of portable or hand-held X-Ray fluorescence (XRF) instrumentation for in situ measurements. Moreover, the caratage of the gold foil preserved in the manuscript has been assessed.
Keywords:
gilding; gold foil; XRF; PIXE; RBS

Graphical Abstract

1. Introduction

In Genoa, decorating with thin gold foils—called gold leaf gilding—has been regulated since the medieval age by strict rules. The Genoese panorama represents a unique case due to the vast archival documentation available, among which the Giovanni Battista Paggi 1590 querelle (trial), an ideological debate, stands out [1,2]. The painter launched a legal battle to liberate the art of painting from the corporative system, in which craft tasks, such as gilding, were still practiced. The consequence was that gilding emerged as an autonomous discipline and the gilders founded their own guild [3]. Therefore, since the 16th century, numerous regulations governing the application of gold leaf in Genoa have existed [4,5]. Trade in ‘gilded tin’ was expressly forbidden and gilding was to be done only with aurum bonum (“good/pure gold”—predominantly 23 ¾ and 24 carat—i.e., 100% pure gold). Moreover, in numerous documents, we find sample leaves of 9 × 9 cm2, meaning that in Genoa, a larger foil size than the ones produced by Venetian and Florentine guilds (7.2 × 7.2 or 7.3 × 7.3 cm2) was allowed [6,7,8].
The discovery of a manuscript that preserves the prototype of the gold leaf intended for trade in Genoa, signed by the producers (i.e., the goldbeaters) and the customers (i.e., the painters) who used it in their gilding, represents a turning point in the research in this field (Figure 1a).
It is known that the censors, with whom the gold leaf prototype was deposited, regulated the production of goods in the city and had the duty of guaranteeing their quality [9,10,11]. It is, therefore, a true commercial agreement that regulates the shape, thickness, and carat of the gold leaf in commerce. Thickness is quite important to characterize gilding: the progress made by goldbeater artisans through the ages can be traced thanks to the evolution of the thickness of the gold foil product [8,12,13,14]. Moreover, assessing the caratage of the leaf can provide insight into the actual compliance with the guild’s aurum bonum rule. Unfortunately, the integrity of the leaf in the document is quite compromised both because of the normal wear and tear derived from the page consultation and because of intentional engravings (Figure 1b), but an estimation of the original features, like composition, thickness, size, and type of substrate employed, can be obtained by means of X-ray fluorescence (XRF) analysis, which usually does not require invasive sampling.
XRF is a versatile technique that combines high analytical sensitivity with low cost and simple instrumentation and it can be used to assess the gold foil thickness [15,16,17,18,19,20,21,22,23,24], appropriately calibrating the instrument with the support of ion beam analysis (IBA) techniques, namely Rutherford backscattering spectrometry (RBS) and the particle-induced X-ray emission (PIXE) technique [25]. Caratage (K) is, instead, estimated by calculating the ratio of pure gold to the total weight of the alloy, determining the percentage of gold in the gold leaf, with higher caratages indicating a higher proportion of gold over copper or silver [26,27]. Moreover, thanks to the possibility of scanning large areas with an XRF spectrometer (Macro Area XRF or MA-XRF), we can determine the foil size, which is assessed thanks to the increased thickness derived from the overlapping areas [15,28,29,30].
The aim of this paper is to set up a method for inferring gilded artifact properties through XRF analysis, and fully characterize the preserved gold leaf prototype, determining its caratage and thickness. The approach lays a foundation for future comparisons of the manuscript between 16th-century gilded Genoese artifacts, further verifying if the gold foil used is actually in compliance with the censor rules, in terms of composition and size. To this purpose, gold leaves of different thicknesses and caratages were employed to build a set of matrix standards and calibrate the XRF quantitative analysis (Figure 1c). The foils were produced by a certified artisanal goldbeater and the models were prepared on different substrates. Initially, the gold foil thickness was assessed by means of RBS, and the linear relation between the gold foil thickness and the PIXE response was established. The Au standards were analyzed along with a set of gilded samples of unknown thickness and composition coming from the furniture of Palazzo Spinola di Pellicceria, hereafter called “historic samples”, which can be dated to the middle decades of the 18th century and are used as the validation set (Figure 1d). Consequently, the XRF instrument has been calibrated and the information collected has been used to fully characterize the manuscript, assessing the composition, size, caratage, and thickness of the gold foil.

2. Materials and Methods

2.1. Gold Leaf Reference Sets

The gold leaf was handcrafted by a Venetian goldbeater who maintained the steps of production used in ancient goldbeating. Leaves were mounted by a professional restorer on wood cubes either using a mordant or a guazzo technique. The former refers to a gilding technique in which the gold leaf adheres directly to the surface using an oil–resin adhesive, to which drying pigments may be added, while the latter involves the application of the gold leaf over a layer of dampened bole on a surface that has been previously prepared with gypsum. The term bole, or bolus, describes a clay material malleable enough to allow burnishing of the superimposed gold leaf, conferring a smooth and shining effect to the gilded surface. It is mainly composed of Al, Si, and K, with Fe, which provides the typical red color. Red (or Armenian) bole began to be recommended as a base for gilding around the end of the 14th century and it can be found on paper, parchment, or wood supports [31,32]. Moreover, gold leaves have also been overlapped to achieve larger thicknesses. A summary of the standard samples is given in Table 1.

2.2. X-ray Fluorescence (XRF) Analysis

XRF was performed with a portable energy-dispersive spectrometer ELIO (XG Lab, Milan, Italy; Bruker Optics, Billerica, MA, USA). The XRF employs a 25 mm2 Silicon Drift Detector with CUBE technology and a 50 kV–4 kW X-ray tube generator based on an Rh anode. The excitation X-ray beam is collimated to a 1.2 mm spot diameter on the sample surface. The typical energy resolution is below 140 eV FWHM for the Mn Kα line and elements from Na to U can be detected. Elemental 2D mapping is achieved through automatic XY raster scanning with a total travel area of 10 × 10 cm2. XRF point measurements were performed at a 40 kV tube voltage and 30 µA tube current for 120 s. Mapping measurements were performed employing a tube voltage of 40 kV and a tube anode current of 30 μA, with an acquisition time of 5 s for each point. Data was processed using ELIO 1.6.0.29 software.

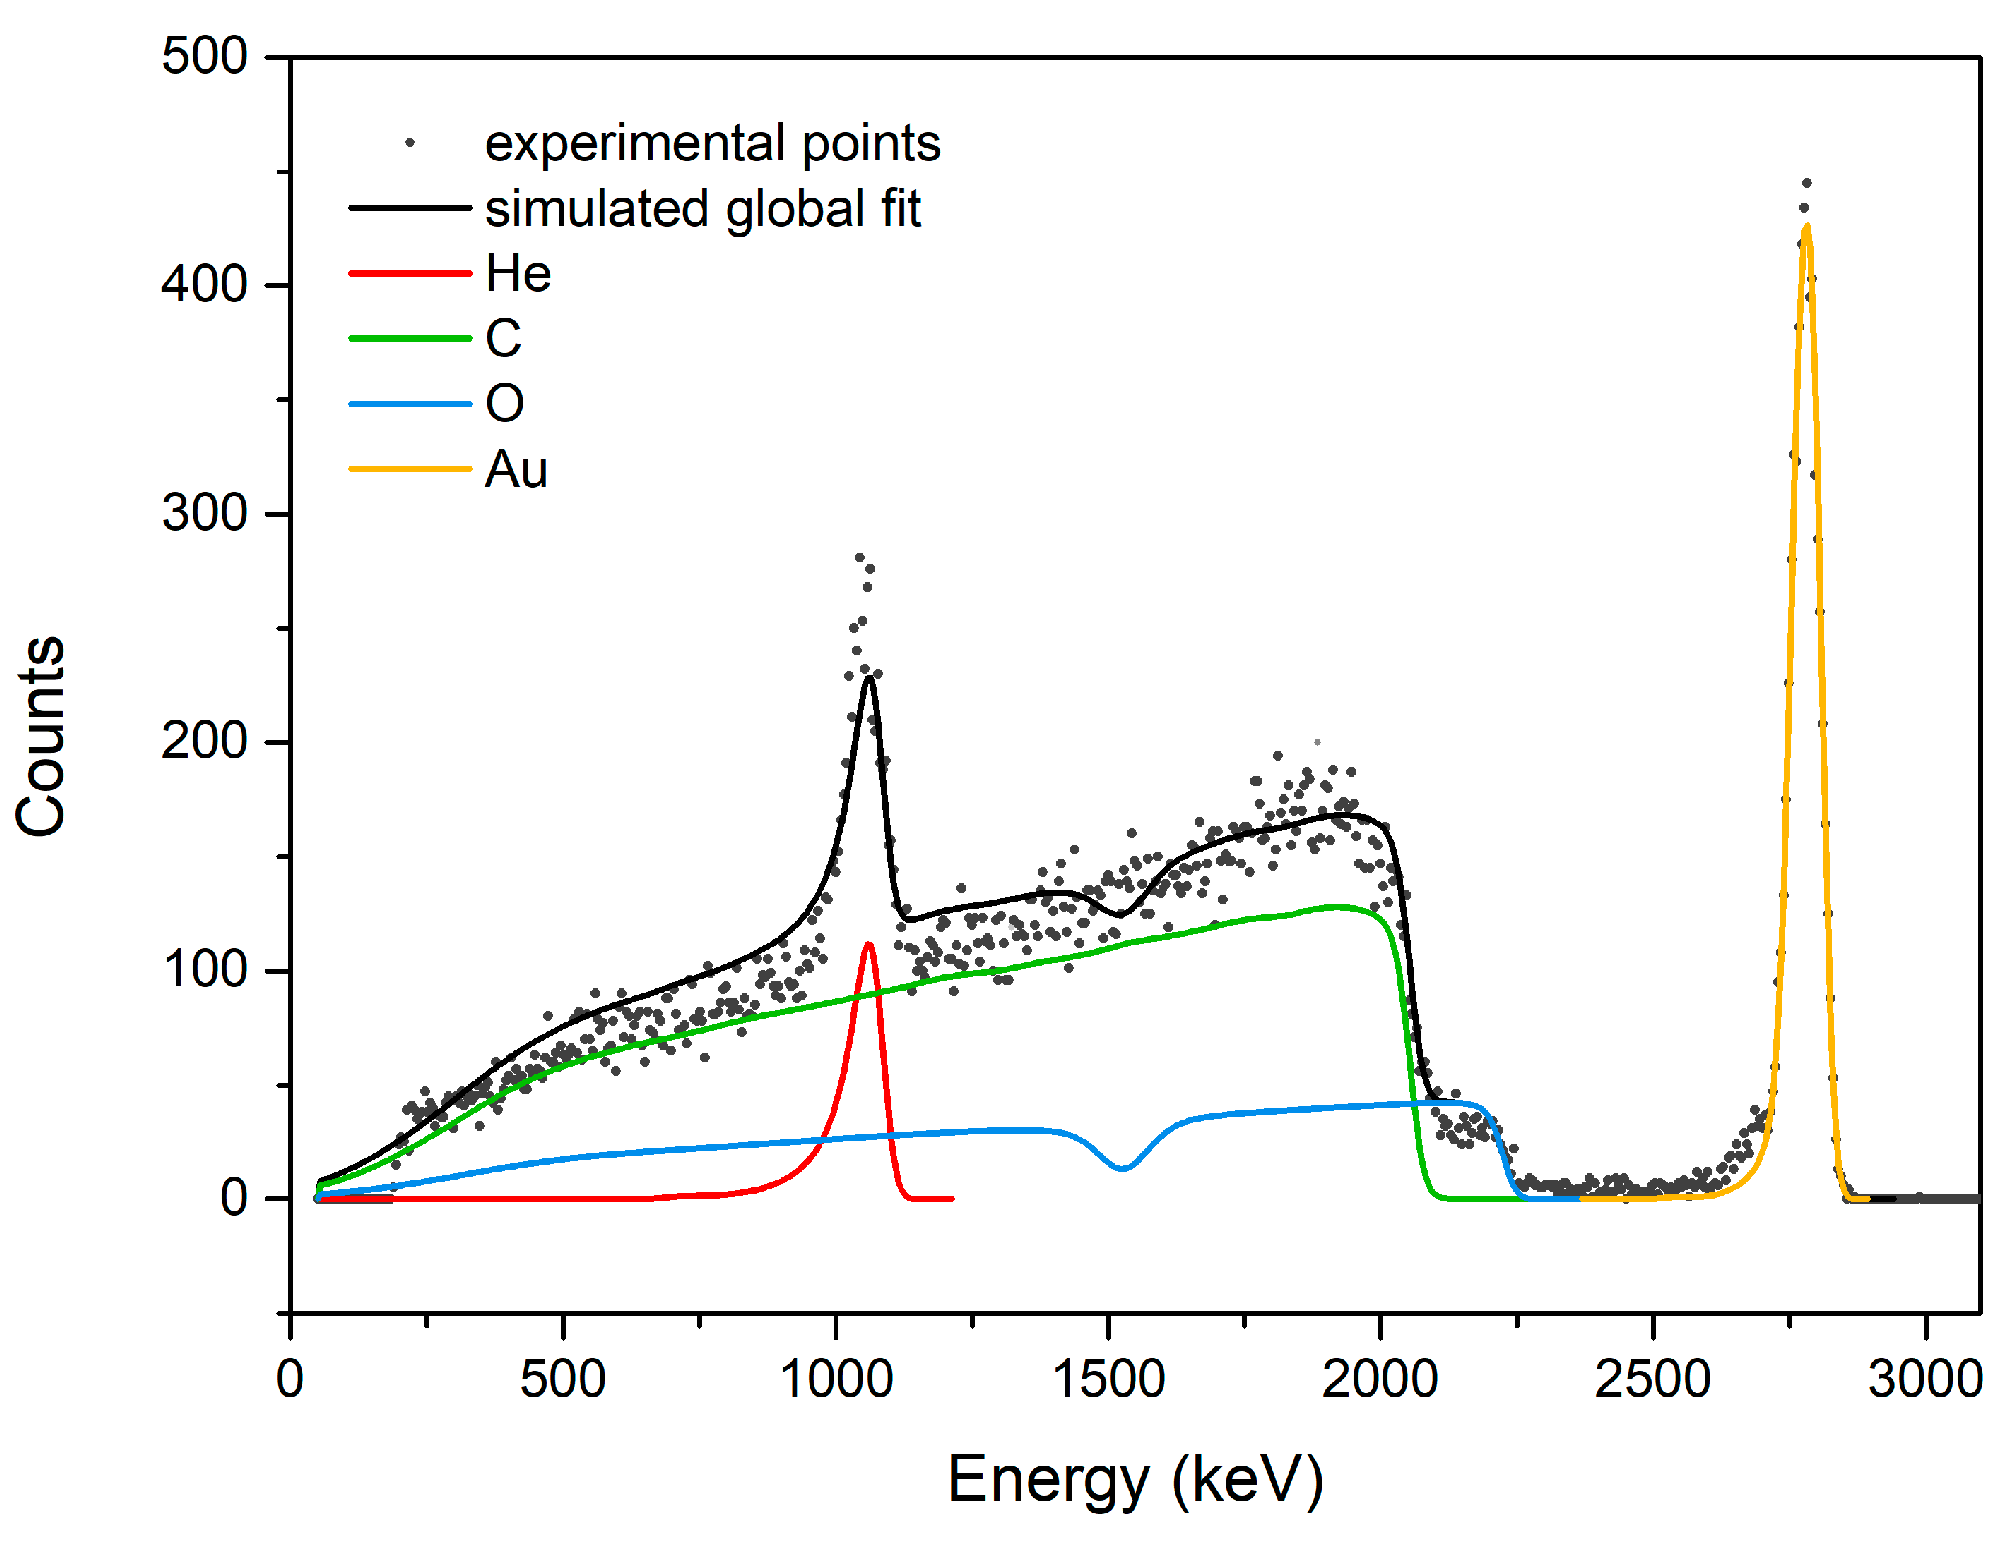
2.3. Particle-Induced X-ray Emission (PIXE) and Rutherford Backscattering Spectrometry (RBS) Analyses

PIXE and RBS analysis were carried out simultaneously using the 3 MV Tandetron electrostatic accelerator (by High Voltage Engineering Europa) at the INFN LABEC ion beam laboratory in Florence, Italy [33]. The protons produced by a 358 Duoplasmatron source were accelerated up to 3 MeV and delivered to the sample via the +45° beamline specifically designed for measurements on cultural heritage objects. The beam was extracted in air through a Si3N4 window (energy on target is 2.935 MeV) and the beam size was about 0.5 mm in diameter on the target surface; the measurements were conducted by moving the sample over a 1 cm long line scan in order to average out possible local inhomogeneities in the layer thickness. The instrumental set-up, extensively described elsewhere, includes, among others, detectors for PIXE and RBS, as well as a rotating chopper for the beam charge monitor [34]. The two X-ray detectors for the PIXE technique were a 10 mm2 Ketek SDD with a 125 eV energy resolution FWHM (for the light element (Na-Ca) analysis) and a 150 mm2 Ketek SDD with a 135 eV energy resolution FWHM, equipped with a 450 μm thick Mylar absorber for mid-heavy elements (Fe-Pb). Both detectors were at 45° with respect to the beam direction. The particle detector for the RBS technique was a 10 × 10 mm2 Hamamatsu Si pin diode, placed at a 135° scattering angle, mounted in an aluminum case, and kept at 10−1 mbar pressure. The overall energy resolution, including detector resolution, extracted beam energy straggling, and kinematic straggling, was about 30 keV FWHM. A helium flow was maintained in front of the target in order to reduce the attenuation of low-energy X-rays and the stopping of the extracted proton beam. The measurement time was 300 s and beam currents between 40 and 500 pA were used. Some standards (metallic and not) were also measured to check the data reduction procedures.

3. Results and Discussion

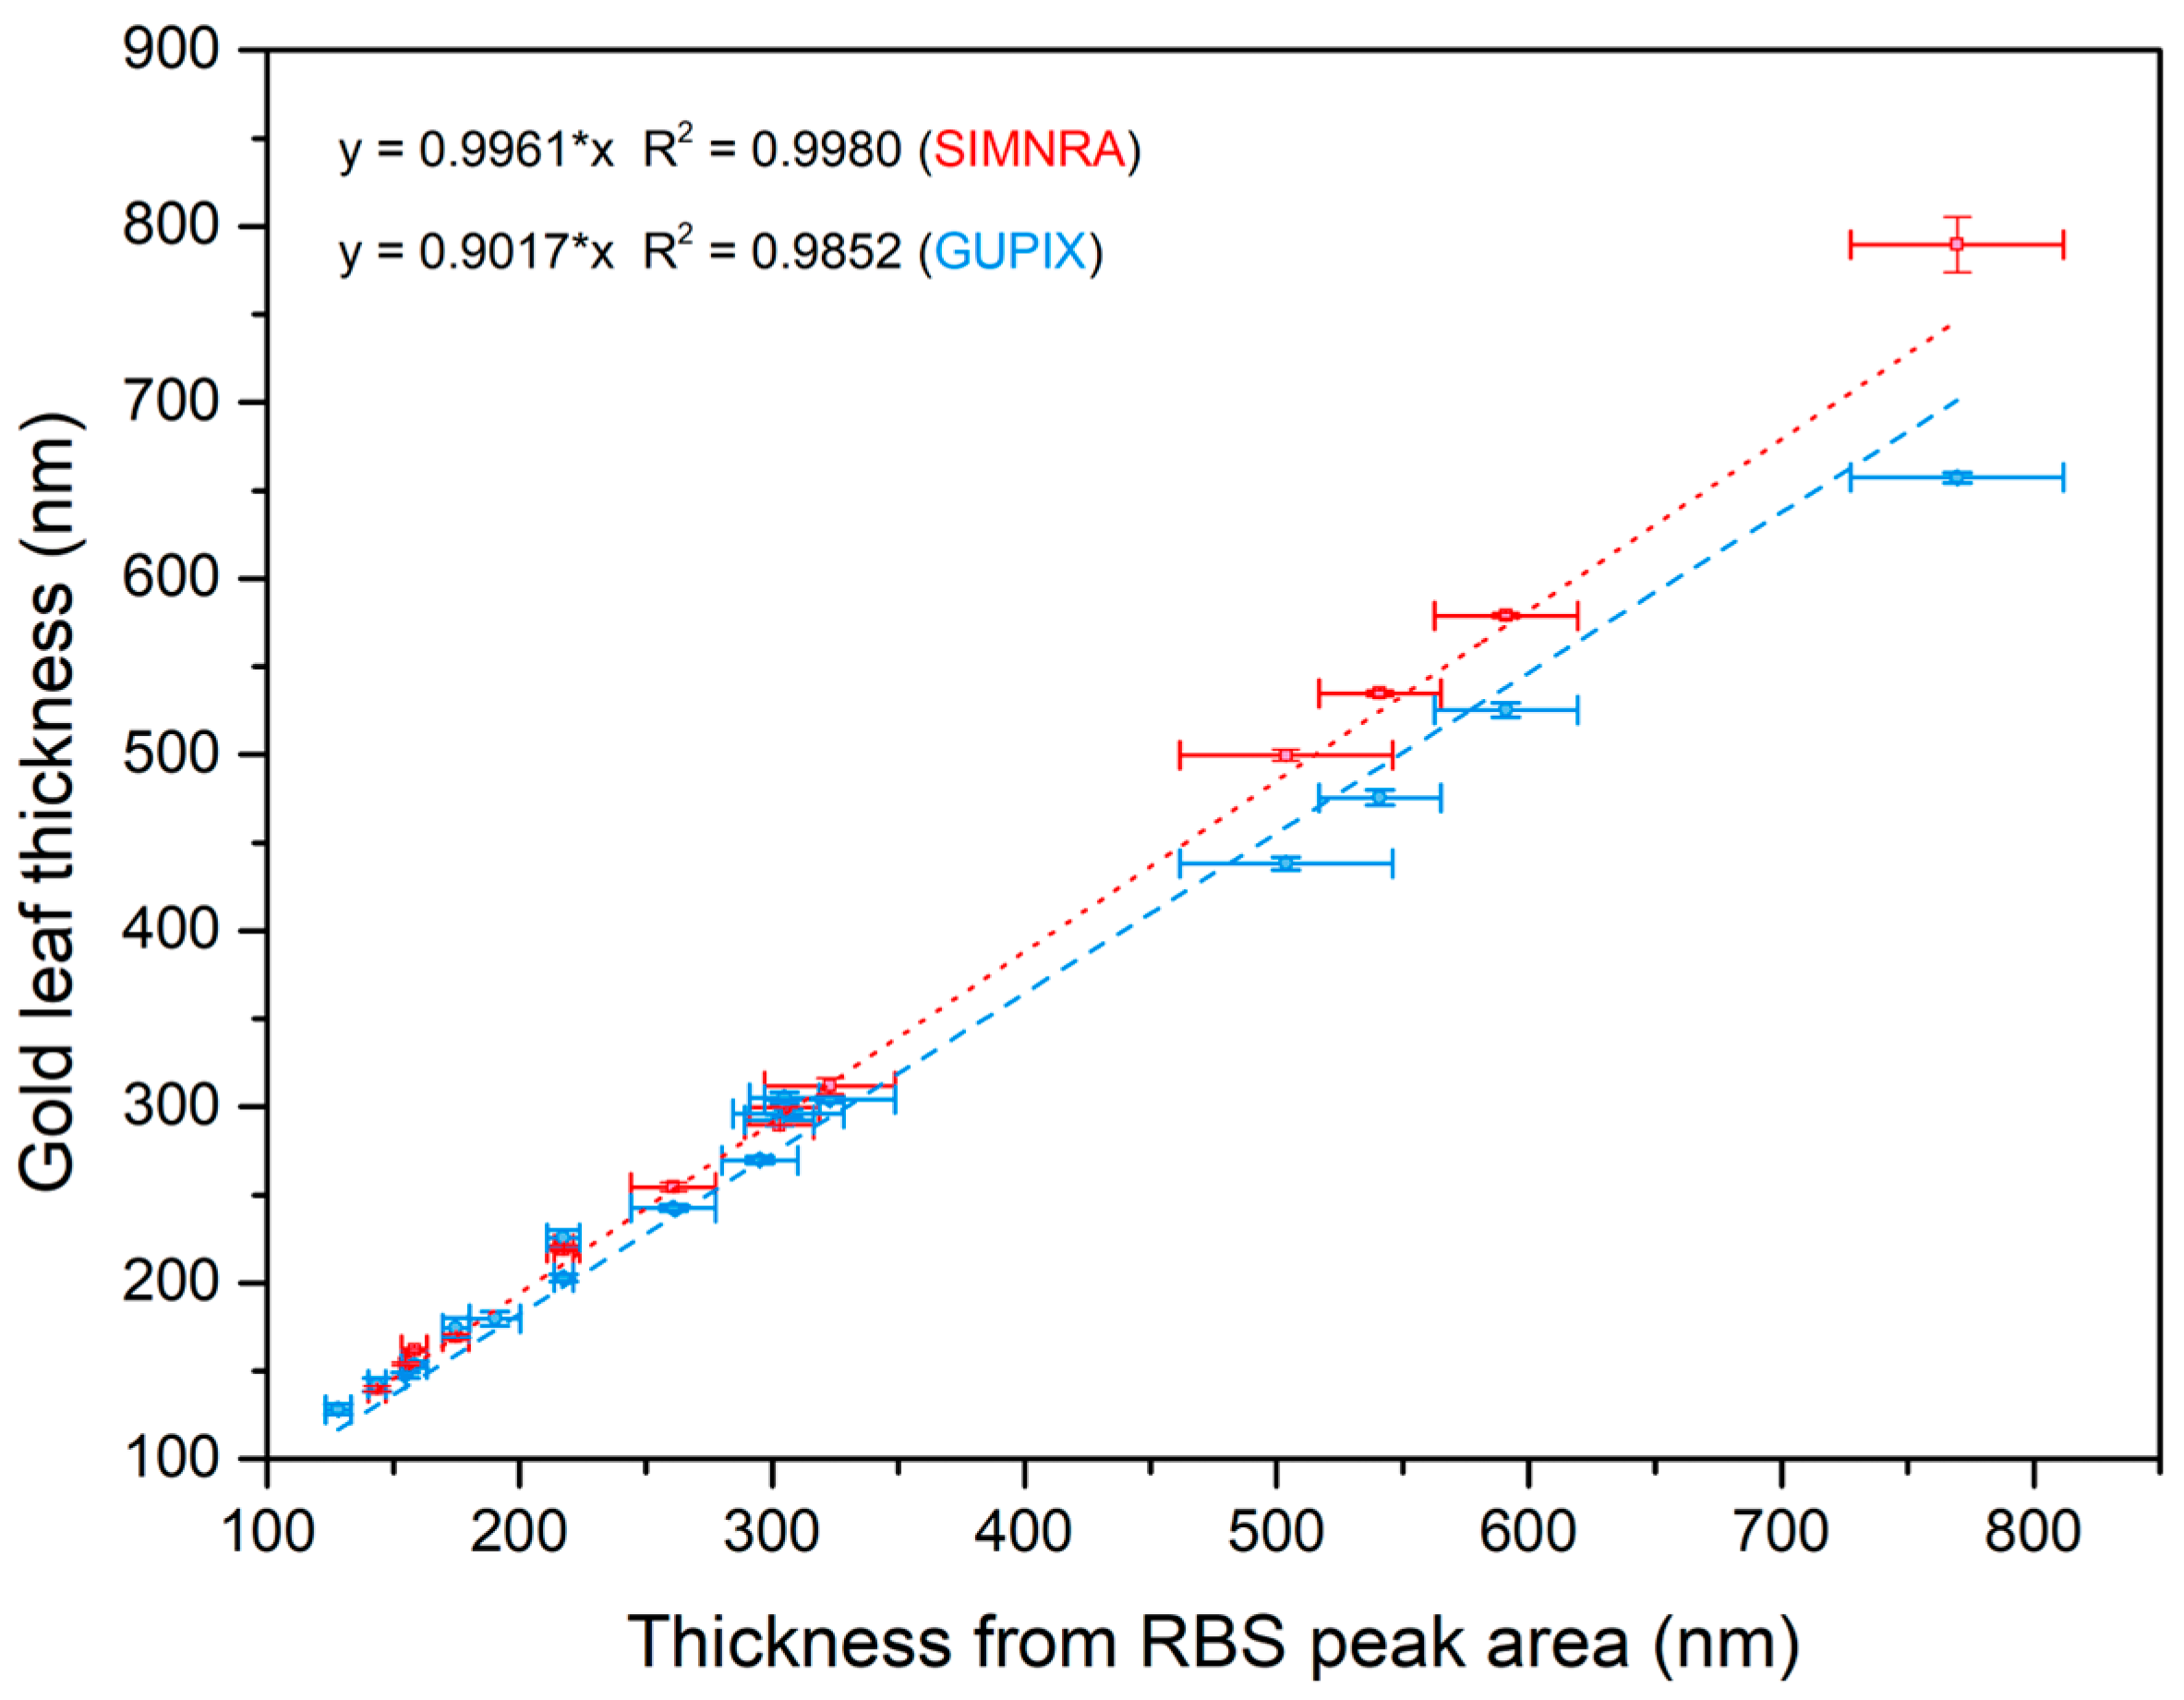
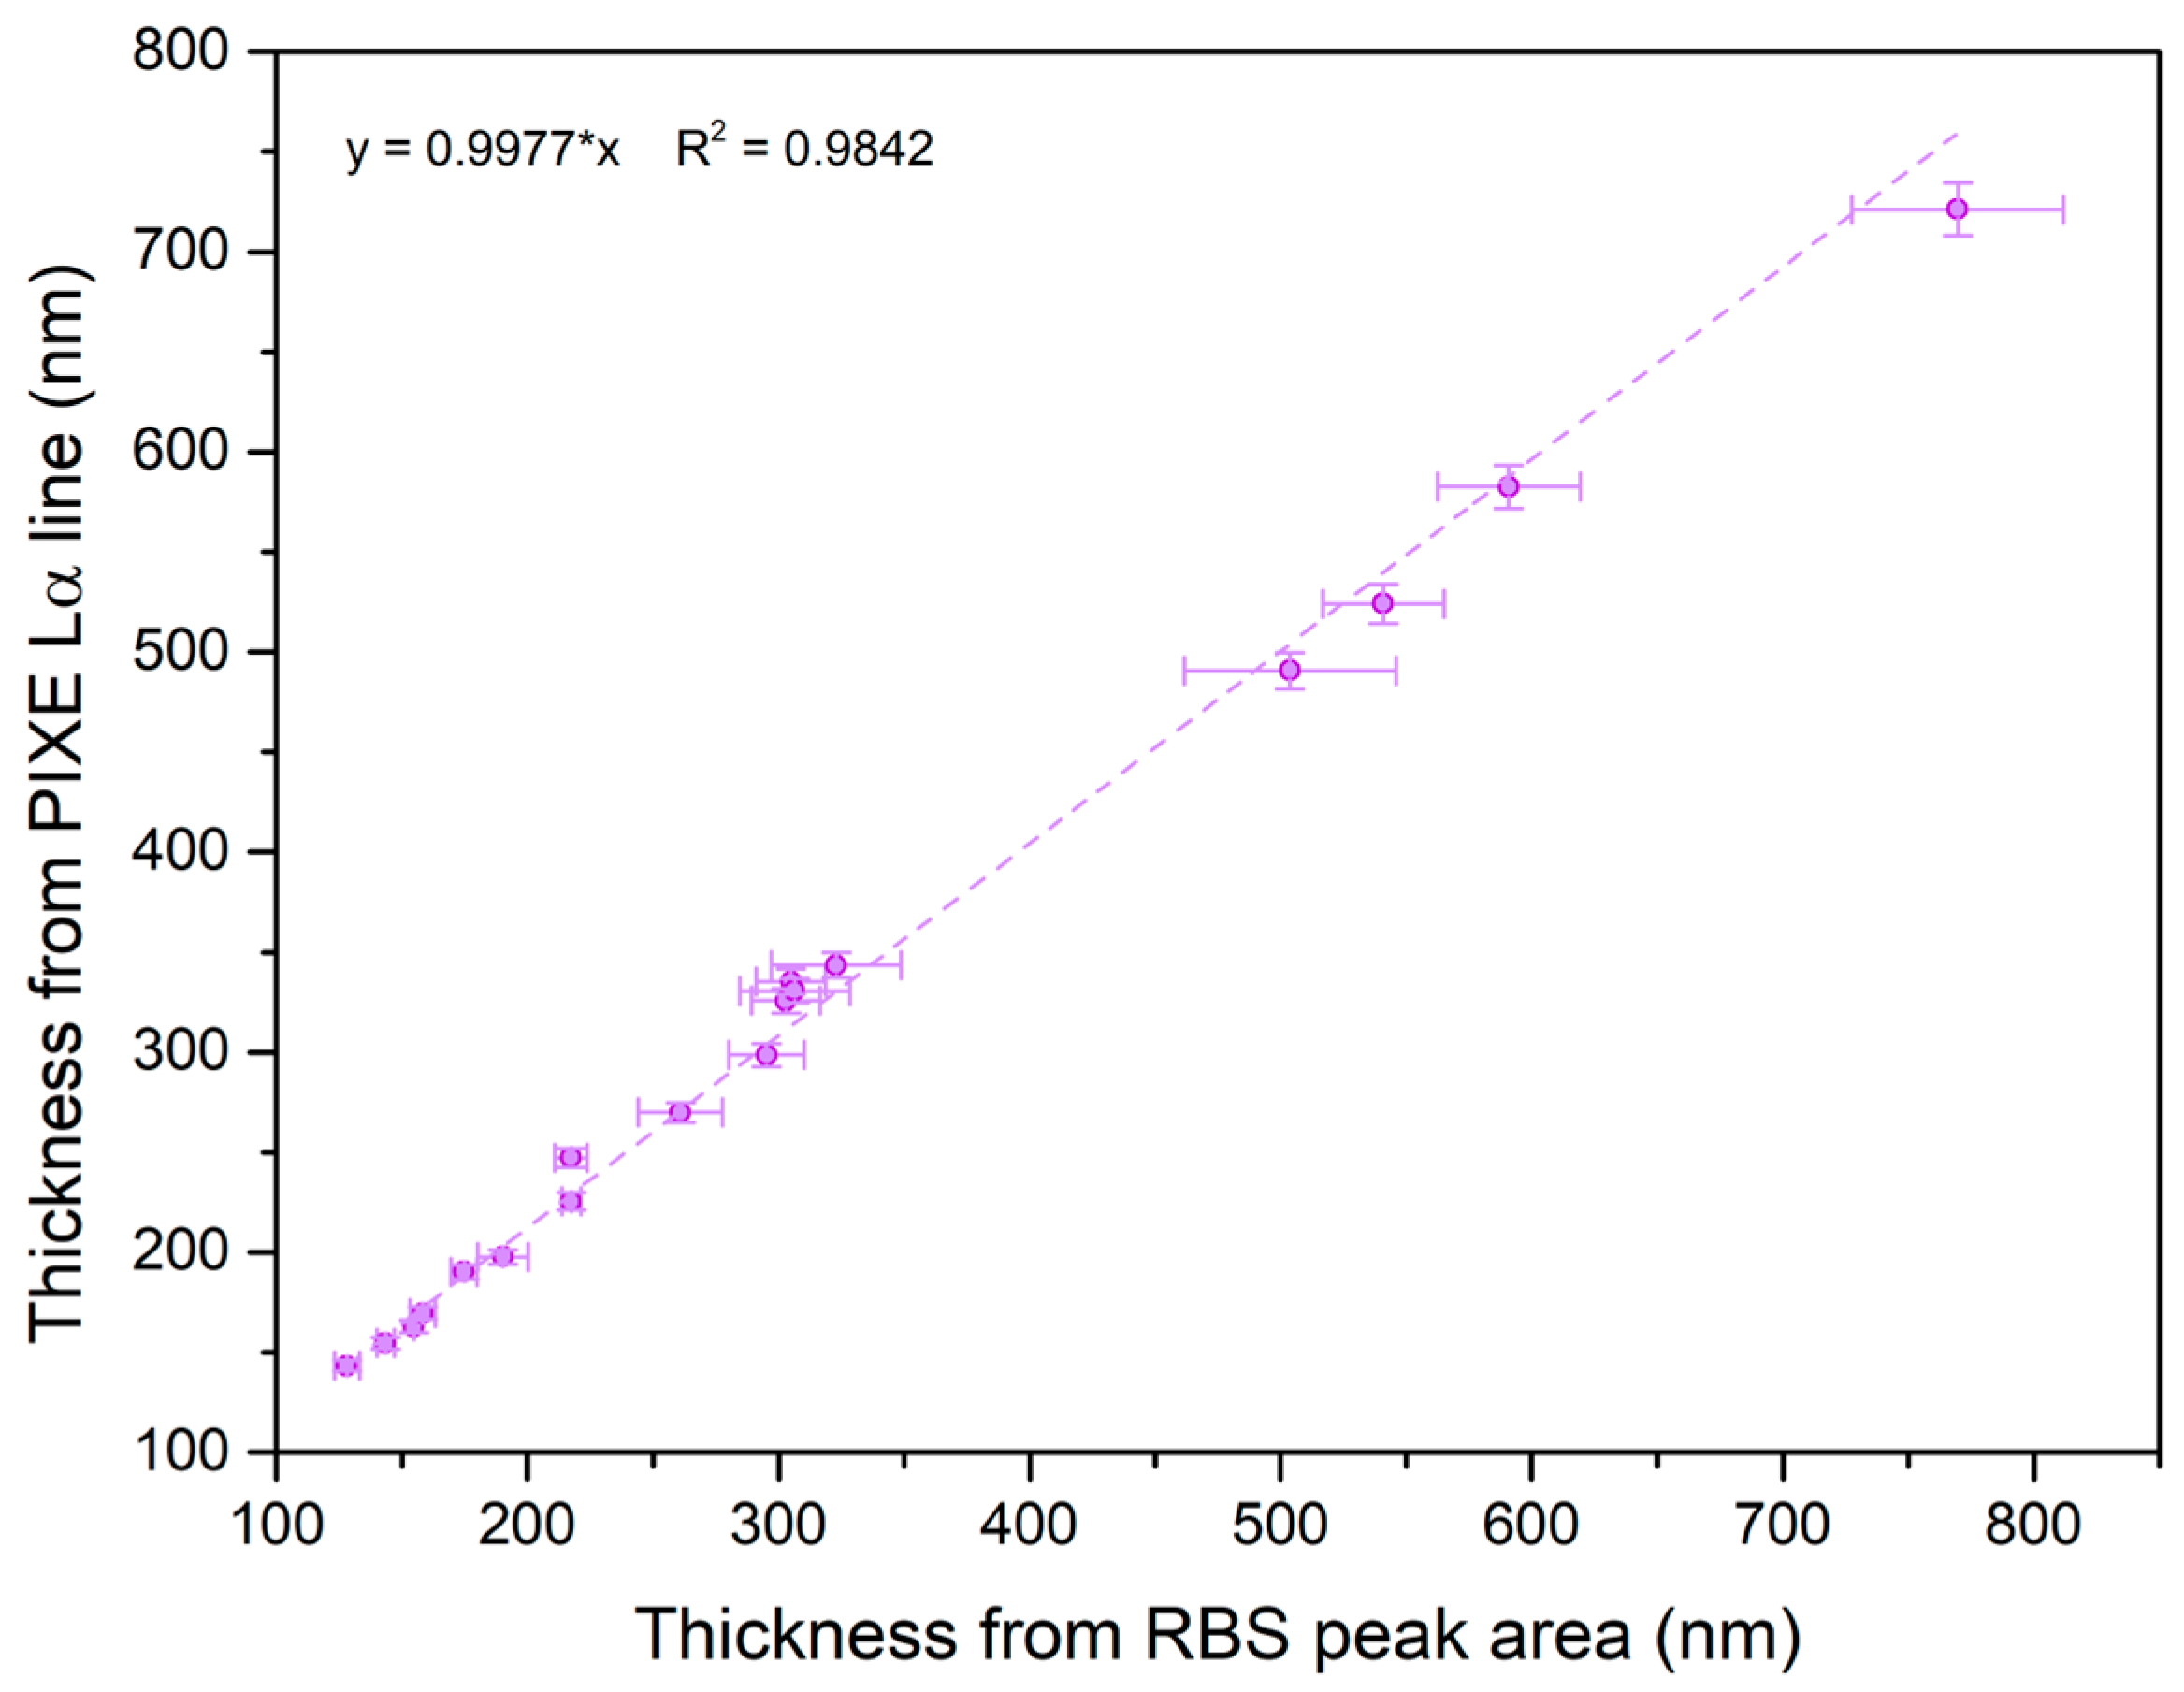
3.1. Measurement of Gold Leaf Thickness

Artistic gold leaves are traditionally manufactured with thicknesses of the order of a few hundred nanometers (e.g., Table 1). In the thin target hypothesis, while analyzing gold leaves, we expect that a gold characteristic X-ray yield (e.g., Lα yield at 9.713 keV), produced by a leaf (either ancient or modern) both in X-ray fluorescence and in PIXE, depends linearly on the thickness DAu:
Y X R F ( A u L α ) = K ( A u L α ) · D A u  
Details are given in the Supplementary Material. The coefficient K is an instrumental constant that is determined by the experimental setup and by the specific X-ray line observed. It can be computed through calibration with gold standards of known thickness (in the range expected for leaves), in fixed experimental conditions. The factor can be used in the same instrumental conditions to determine the thickness of unknown samples from the X-ray yield. This is the experimental approach we employed—using the standards presented in Table 1 and the unknown samples of this study (Figure 1b,d). First, the thickness of the reference standard leaves was measured by RBS. The sample thickness can be calculated either using a simple equation in the thin target hypothesis or by a simulation of the RBS spectra. In the thin target hypothesis, the proton energy loss in the leaf is negligible, thus the backscattering cross-section can be assumed constant and the gold leaf thickness DAu is given by the following equation:
D A u [ nm ] = ( Y · e [ C ] · A [ g ] Q [ C ] · N 0 · ρ [ gcm 3 ] · d Ω [ sr ] · d σ d Ω [ cm 2 sr 1 ]   ) × 10 7
where Y is the yield of the protons backscattered on Au, e is the elementary charge, A is the atomic weight, Q is the collected beam charge, N0 is Avogadro’s number, is the detector solid angle, and dσ/dΩ is the Rutherford elastic scattering cross-section. A more accurate result is obtained by the simulation of RBS spectra with the SIMNRA code [35] in which experimental parameters and microphysical data (cross-sections and stopping powers) are introduced, and the sample thickness is adjusted to obtain the best fit to the shape of the backscattered proton peak. An example of an acquired RBS spectrum and its SIMNRA simulation is given in Figure 2.
The PIXE spectra acquired on reference standards have been analyzed by the GUPIX code [36]. Among the various options that the code offers to describe the sample, gold has been considered as a thin surface layer sitting in front of a bulk containing elements expected in bole or from the mordant. In this configuration, by introducing the beam and instrumental parameters, the code iteratively adjusts the gold layer’s thickness, to finally obtain—by considering absorption in the gold and the bulk—the correct relative height of the peaks in each group of characteristic X-rays (K, L, M). It calculates the bulk concentration from the fundamental parameters. From the PIXE analysis, we extracted the gold thickness, the 2-FWHM area of the gold Lα peak, and the concentration of the bulk (substrate) elements. The results of the investigation of reference samples are given in Table 2. As shown in Figure 3, the thicknesses calculated from Equation (2) and SIMNRA differ by less than 1% on average while those calculated in the GUPIX fitting of PIXE spectra are, on average, almost 10% lower. Using the thicknesses calculated from the RBS data, we demonstrate (Figure 4) the linearity existing between the yield of the gold Lα peak and the leaf thickness, as from Equation (1). It is worth repeating that the coefficient of linearity that we have deduced is only valid for the specific experimental setup since the K factor in the equation depends on the beam and detector parameters. However, the calibration procedure can be repeated with the same set of reference samples in any other set-up since their thicknesses are now assessed through the analysis of the RBS data. For double-checking the procedure, we calculated the reference leaf thicknesses starting from the Lα line and using the calibration coefficient 0.0058, obtained from Figure 4. In Figure 5, the PIXE-computed thicknesses are plotted as functions of those calculated from the RBS peak area (Equation (2)). In this case, there is very good linearity between the two sets of data; on average, their ratio is practically 1. The slight deviations observed for thicknesses below and over 400 nm can be due to the thin target approximation assumed. This approximation for PIXE, including both variations in X-ray production energy loss due to finite proton energy loss and self-absorption of the emitted X-ray, can be considered valid within 5% for thicknesses up to 500 nm and within 10% for thicknesses around 800 nm. As discussed in the Supplementary Materials, for XRF, we expect a validity of the thin target approximation around 7% once thicknesses exceed 600 nm.

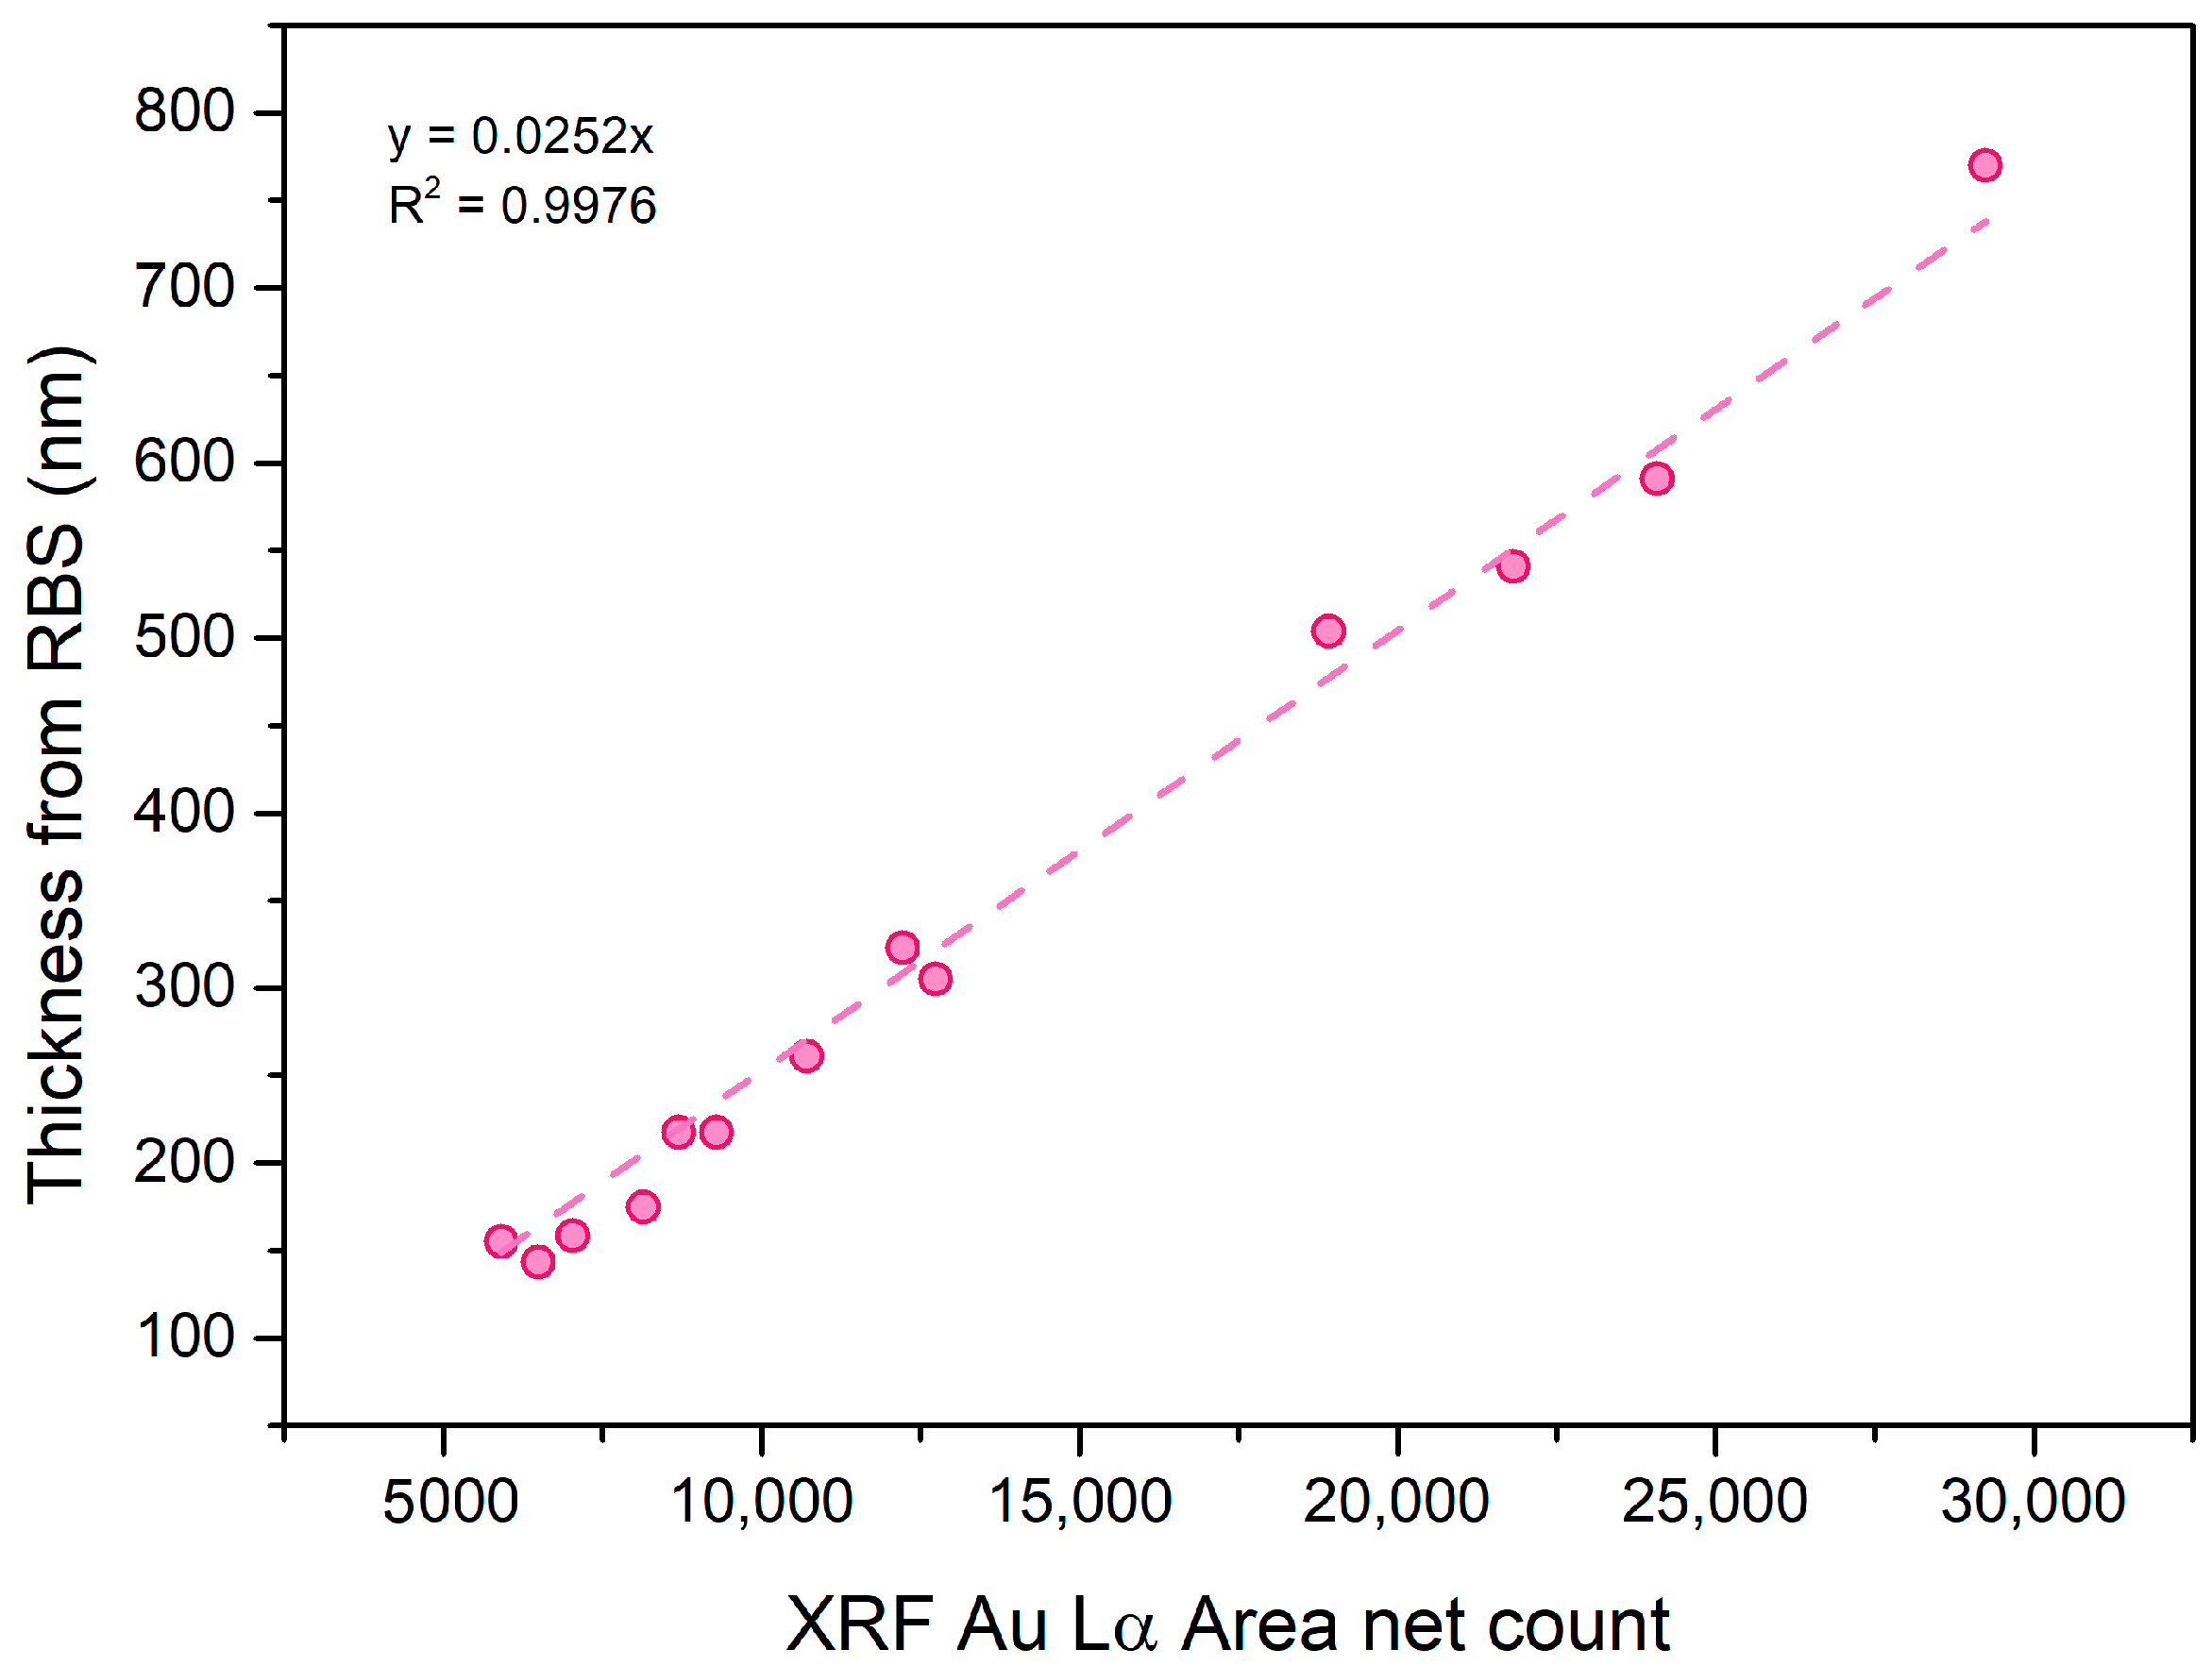
3.2. Calibration of the ELIO Setup and XRF Analysis of Historic Samples

The calibration procedure was repeated using the XRF ELIO setup. Figure 6 shows the linear relation between the RBS thickness and the XRF Au Lα area net yield. Once determined, the linearity coefficient and the XRF yield were transformed into thicknesses for the historic samples from Palazzo Spinola di Pellicceria, and analyzed in the same instrumental conditions as the standards. Even though these gildings are not all coeval, they represent suitable empirical validation sets because they show a variety of thicknesses, compositions, caratages, and shapes. They also differ greatly in the state of conservation. After careful inspection, some areas of gilding appear quite damaged, while others are well preserved. A minimum of five XRF point measurements have been taken for each historic sample. Table 3 shows the Au Lα area net counts of the eleven historic samples with the associated calculated thicknesses. Minimum, maximum, and average values are reported. Assuming that the highest net count corresponds to a pristine gold leaf, this value should be indicative of the original thickness of the employed foils, while the minimum net area count might be linked to a damaged leaf. The original thickness spans from around 143 nm for S5 to around 489 nm for sample S9. Additional XRF point analyses were performed in the same points as the RBS/PIXE measurements and the relative thickness values were compared. The XRF results agree with RBS/PIXE results and the techniques provide compatible data.
Moreover, to test the capability of the instrument to provide useful thickness information in the mapping mode, a 10 × 10 cm2 sample made from overlapping foils of different thicknesses applied in various combinations was analyzed. This is useful because, during the gilding process, a portion of the gold leaf overlaps with the previously applied one (sormonto); with the XRF mapping function, it is possible to visualize these overlapped zones and assess the original sizes of the leaves. In Figure 7, the XRF map is shown. By extracting values from a specific pixel column, a thickness profile can be generated to assess the gilding pattern. From a compositional point of view, both PIXE and XRF analyses have revealed the presence of Al, Si, S, K, Ca, Ti, and Fe, demonstrating the constant use of the guazzo technique in the artistic samples of Palazzo Spinola. The guazzo technique, in fact, involves applying gold foil over a mirror-polished gypsum (CaSO4) ground, which is covered by a thin bole layer—a red ochre composed of an aluminosilicate fraction, plus Fe and Ti [31]. Furthermore, the presence of Sr has been associated with the natural provenance of gypsum, while impurities of V, Cr, and Ni are commonly associated with ochres [37].

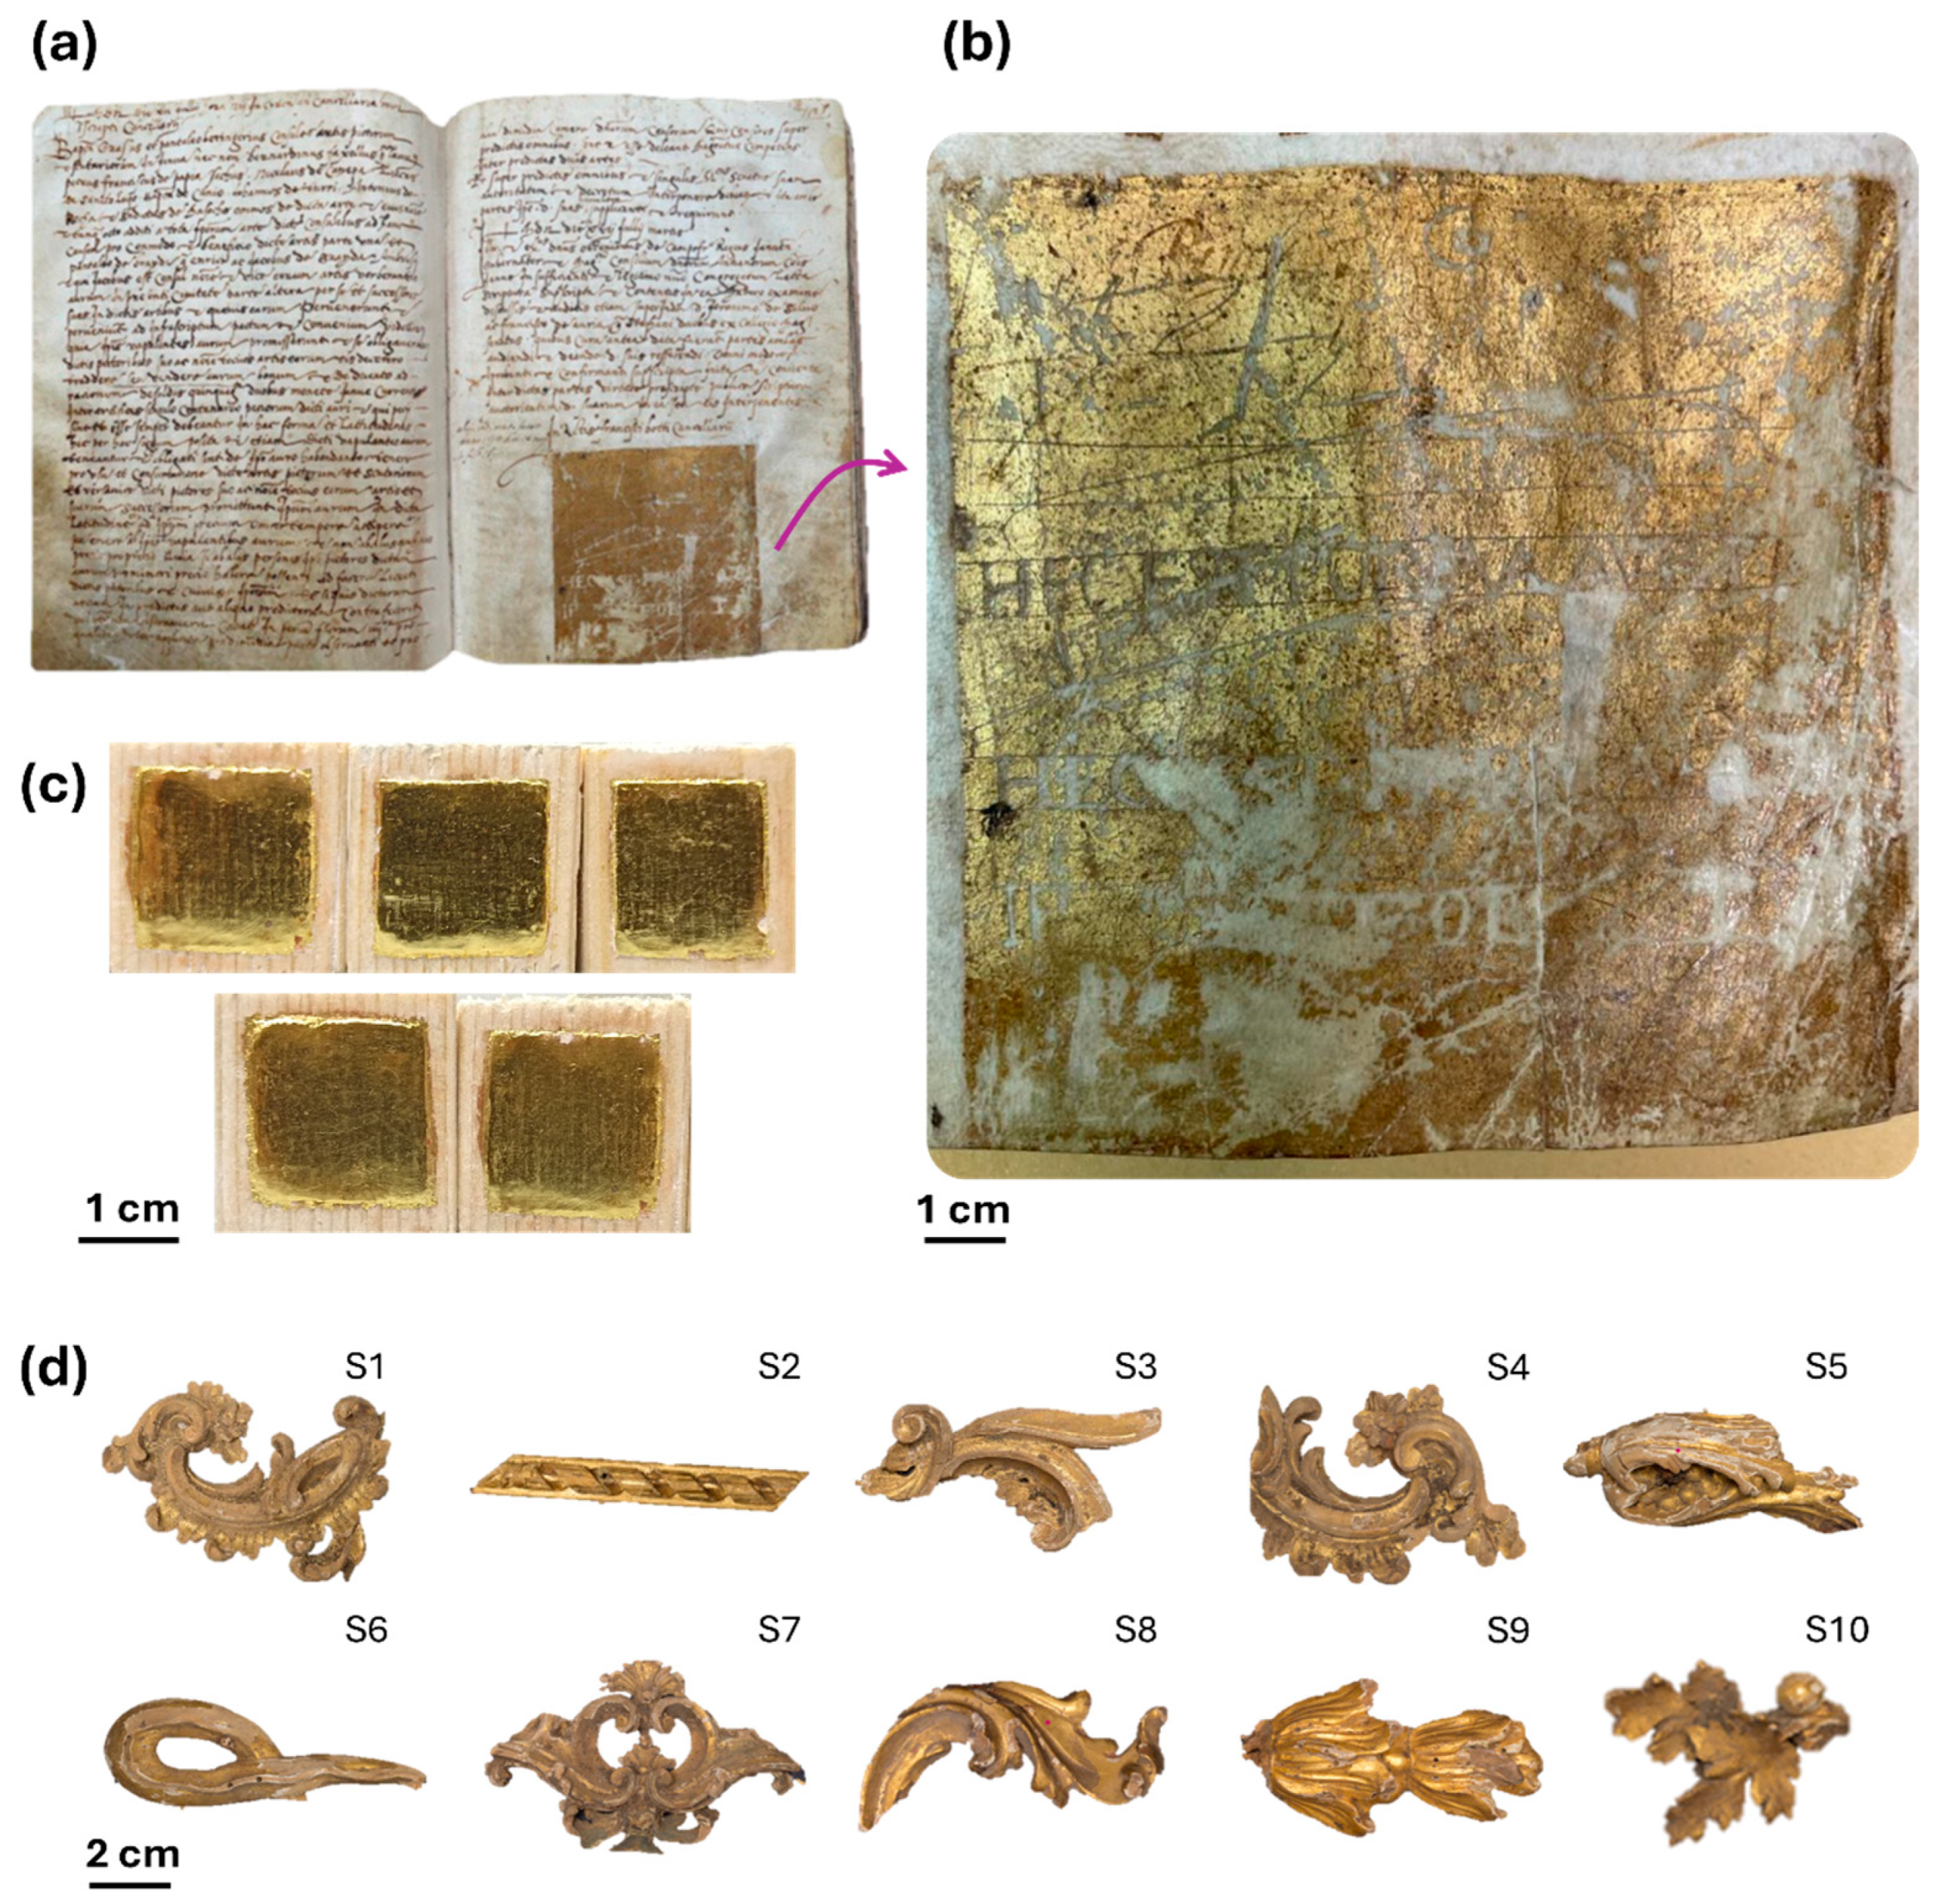
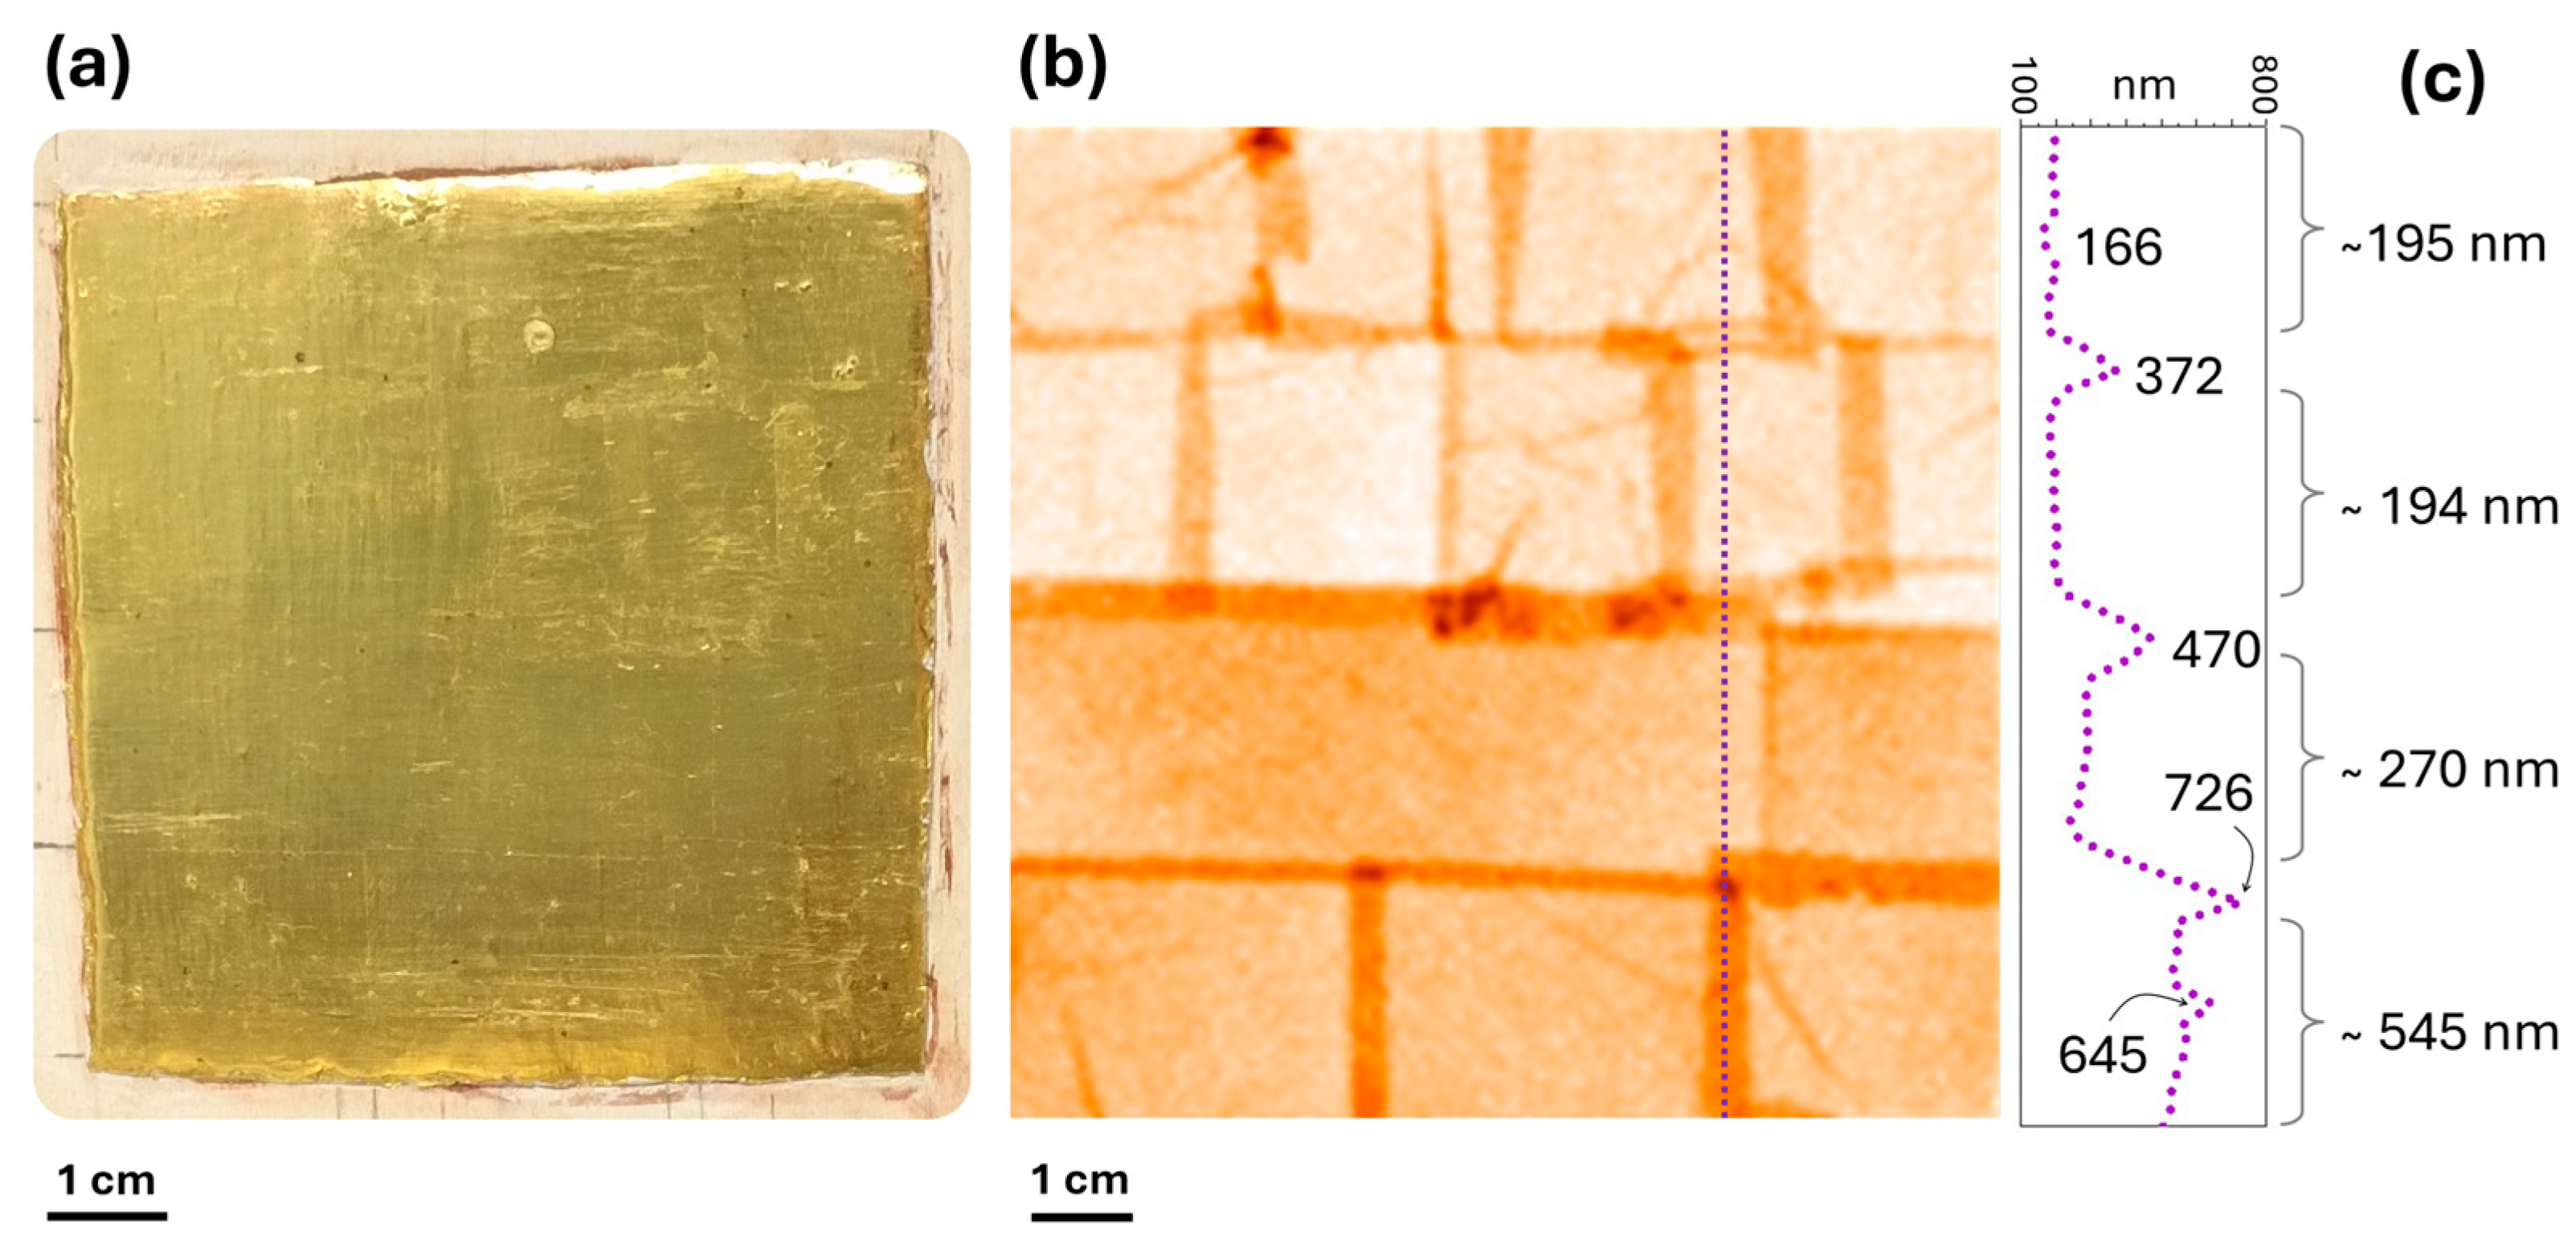
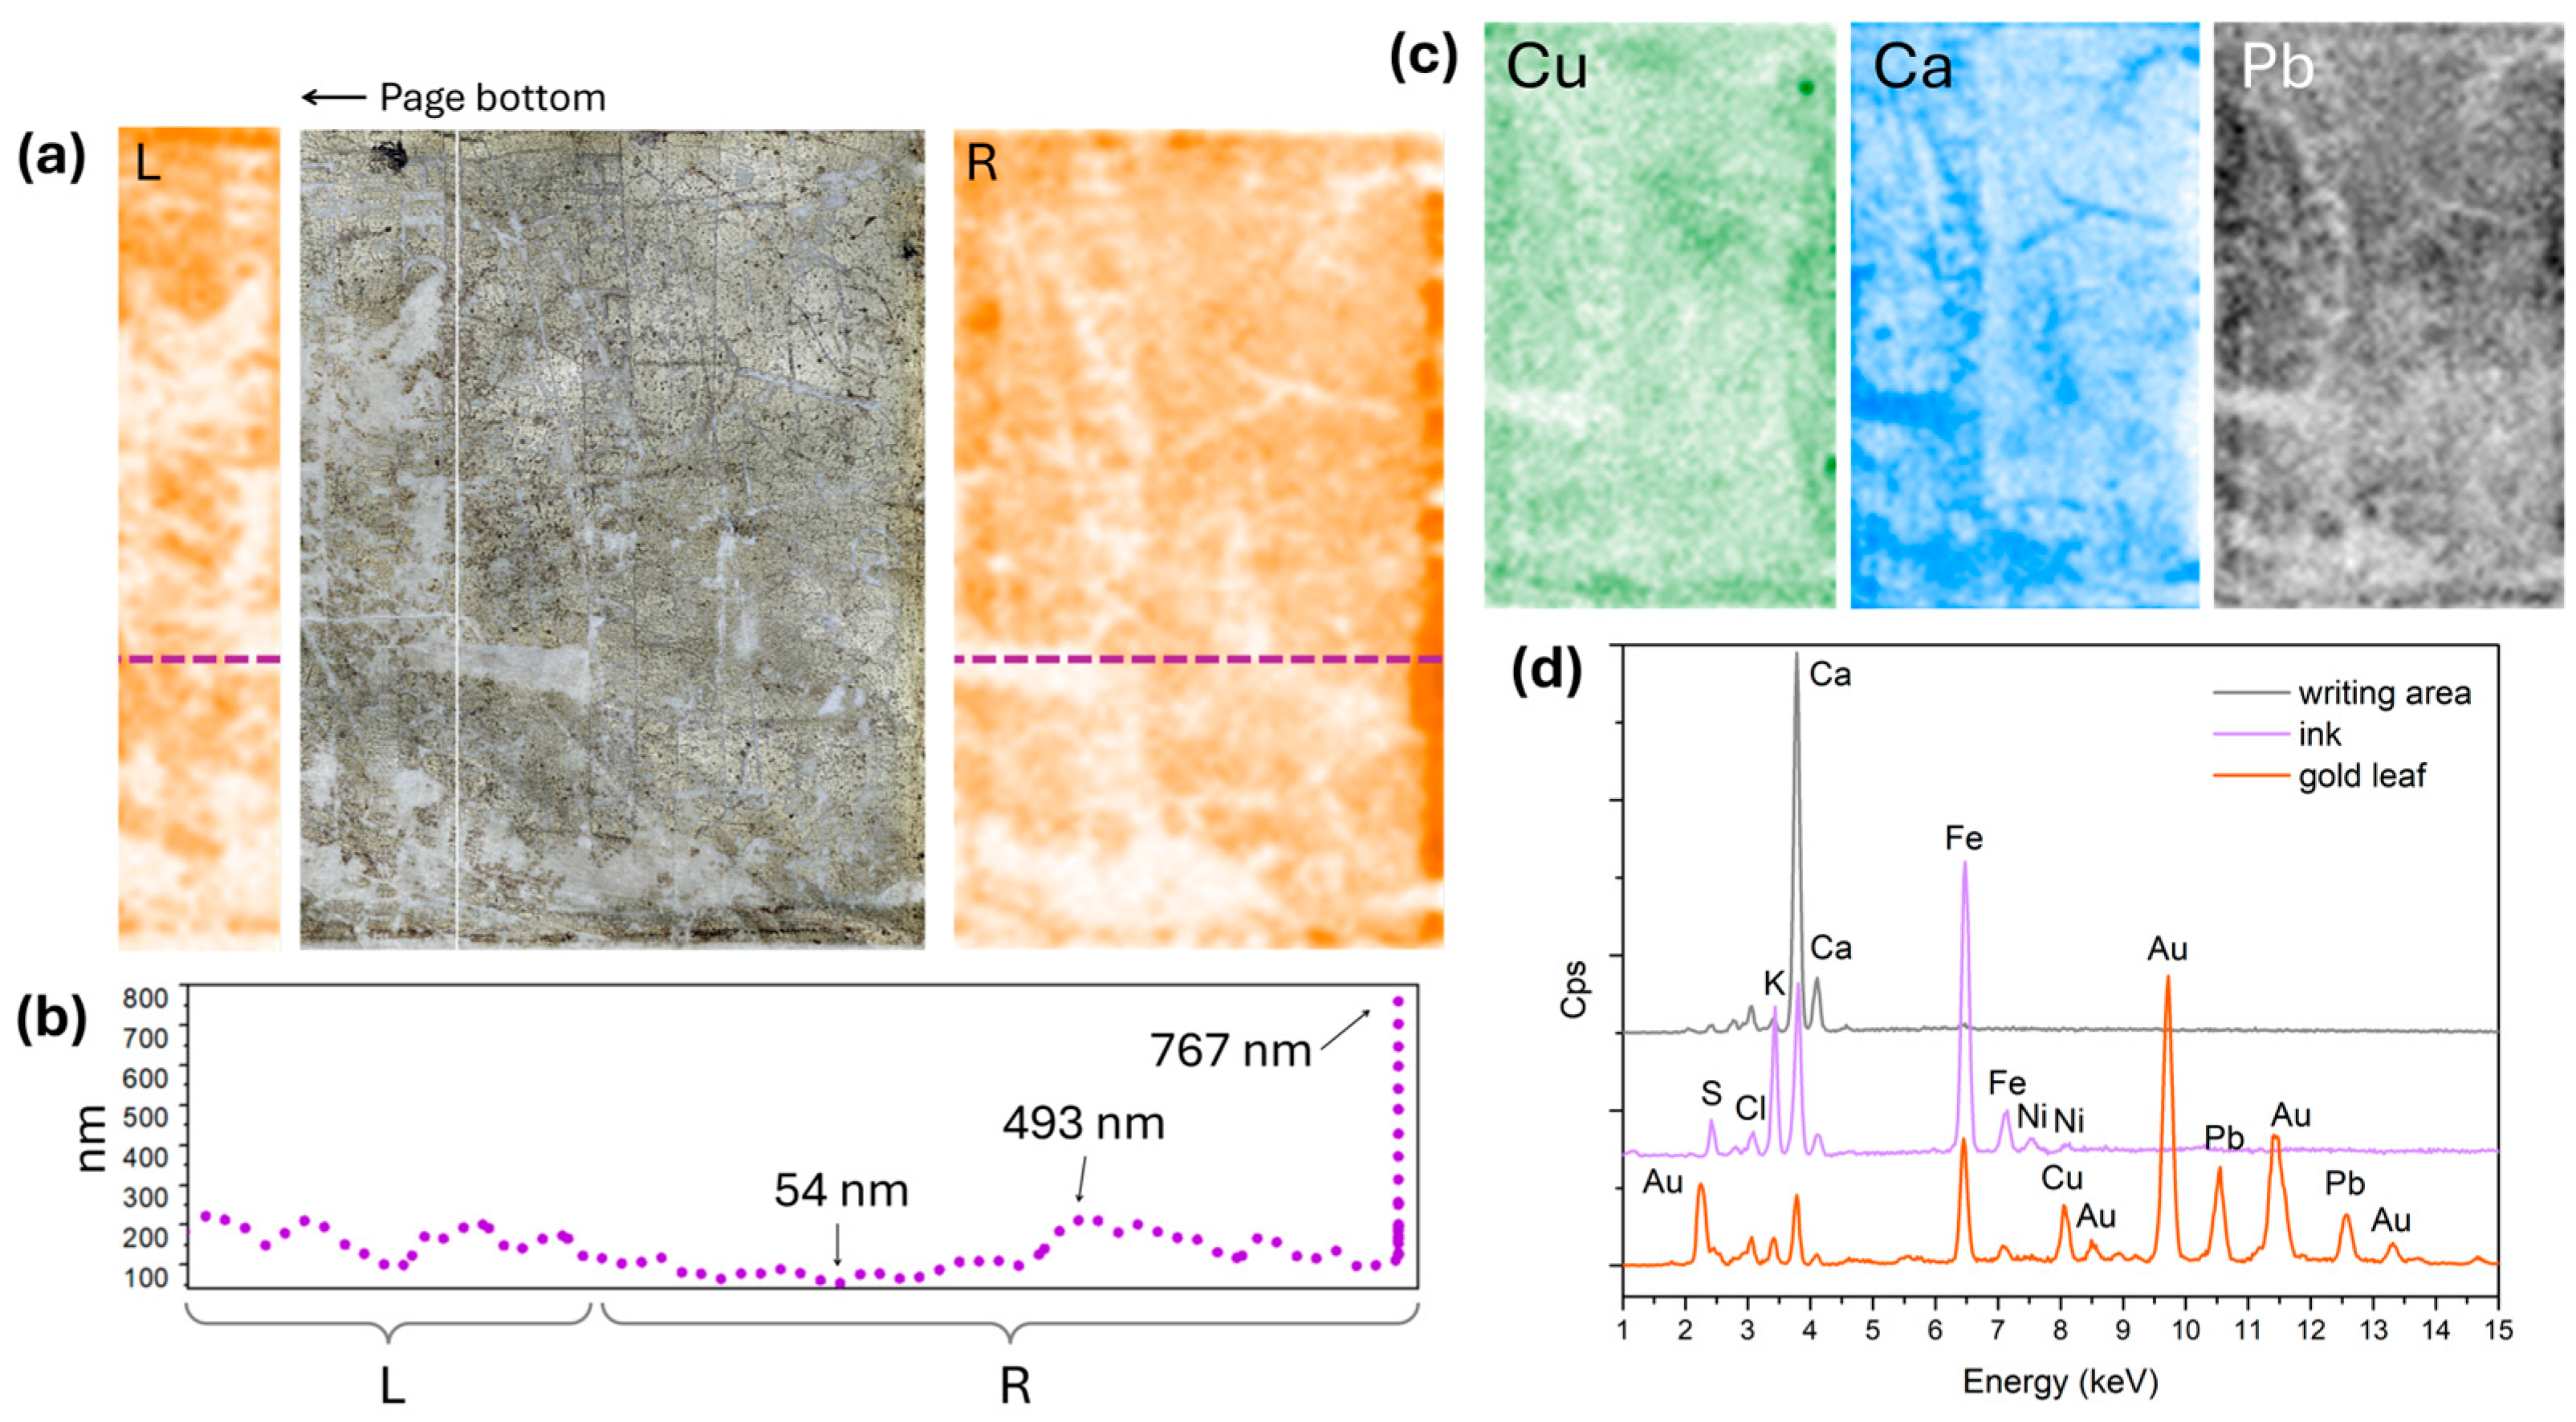
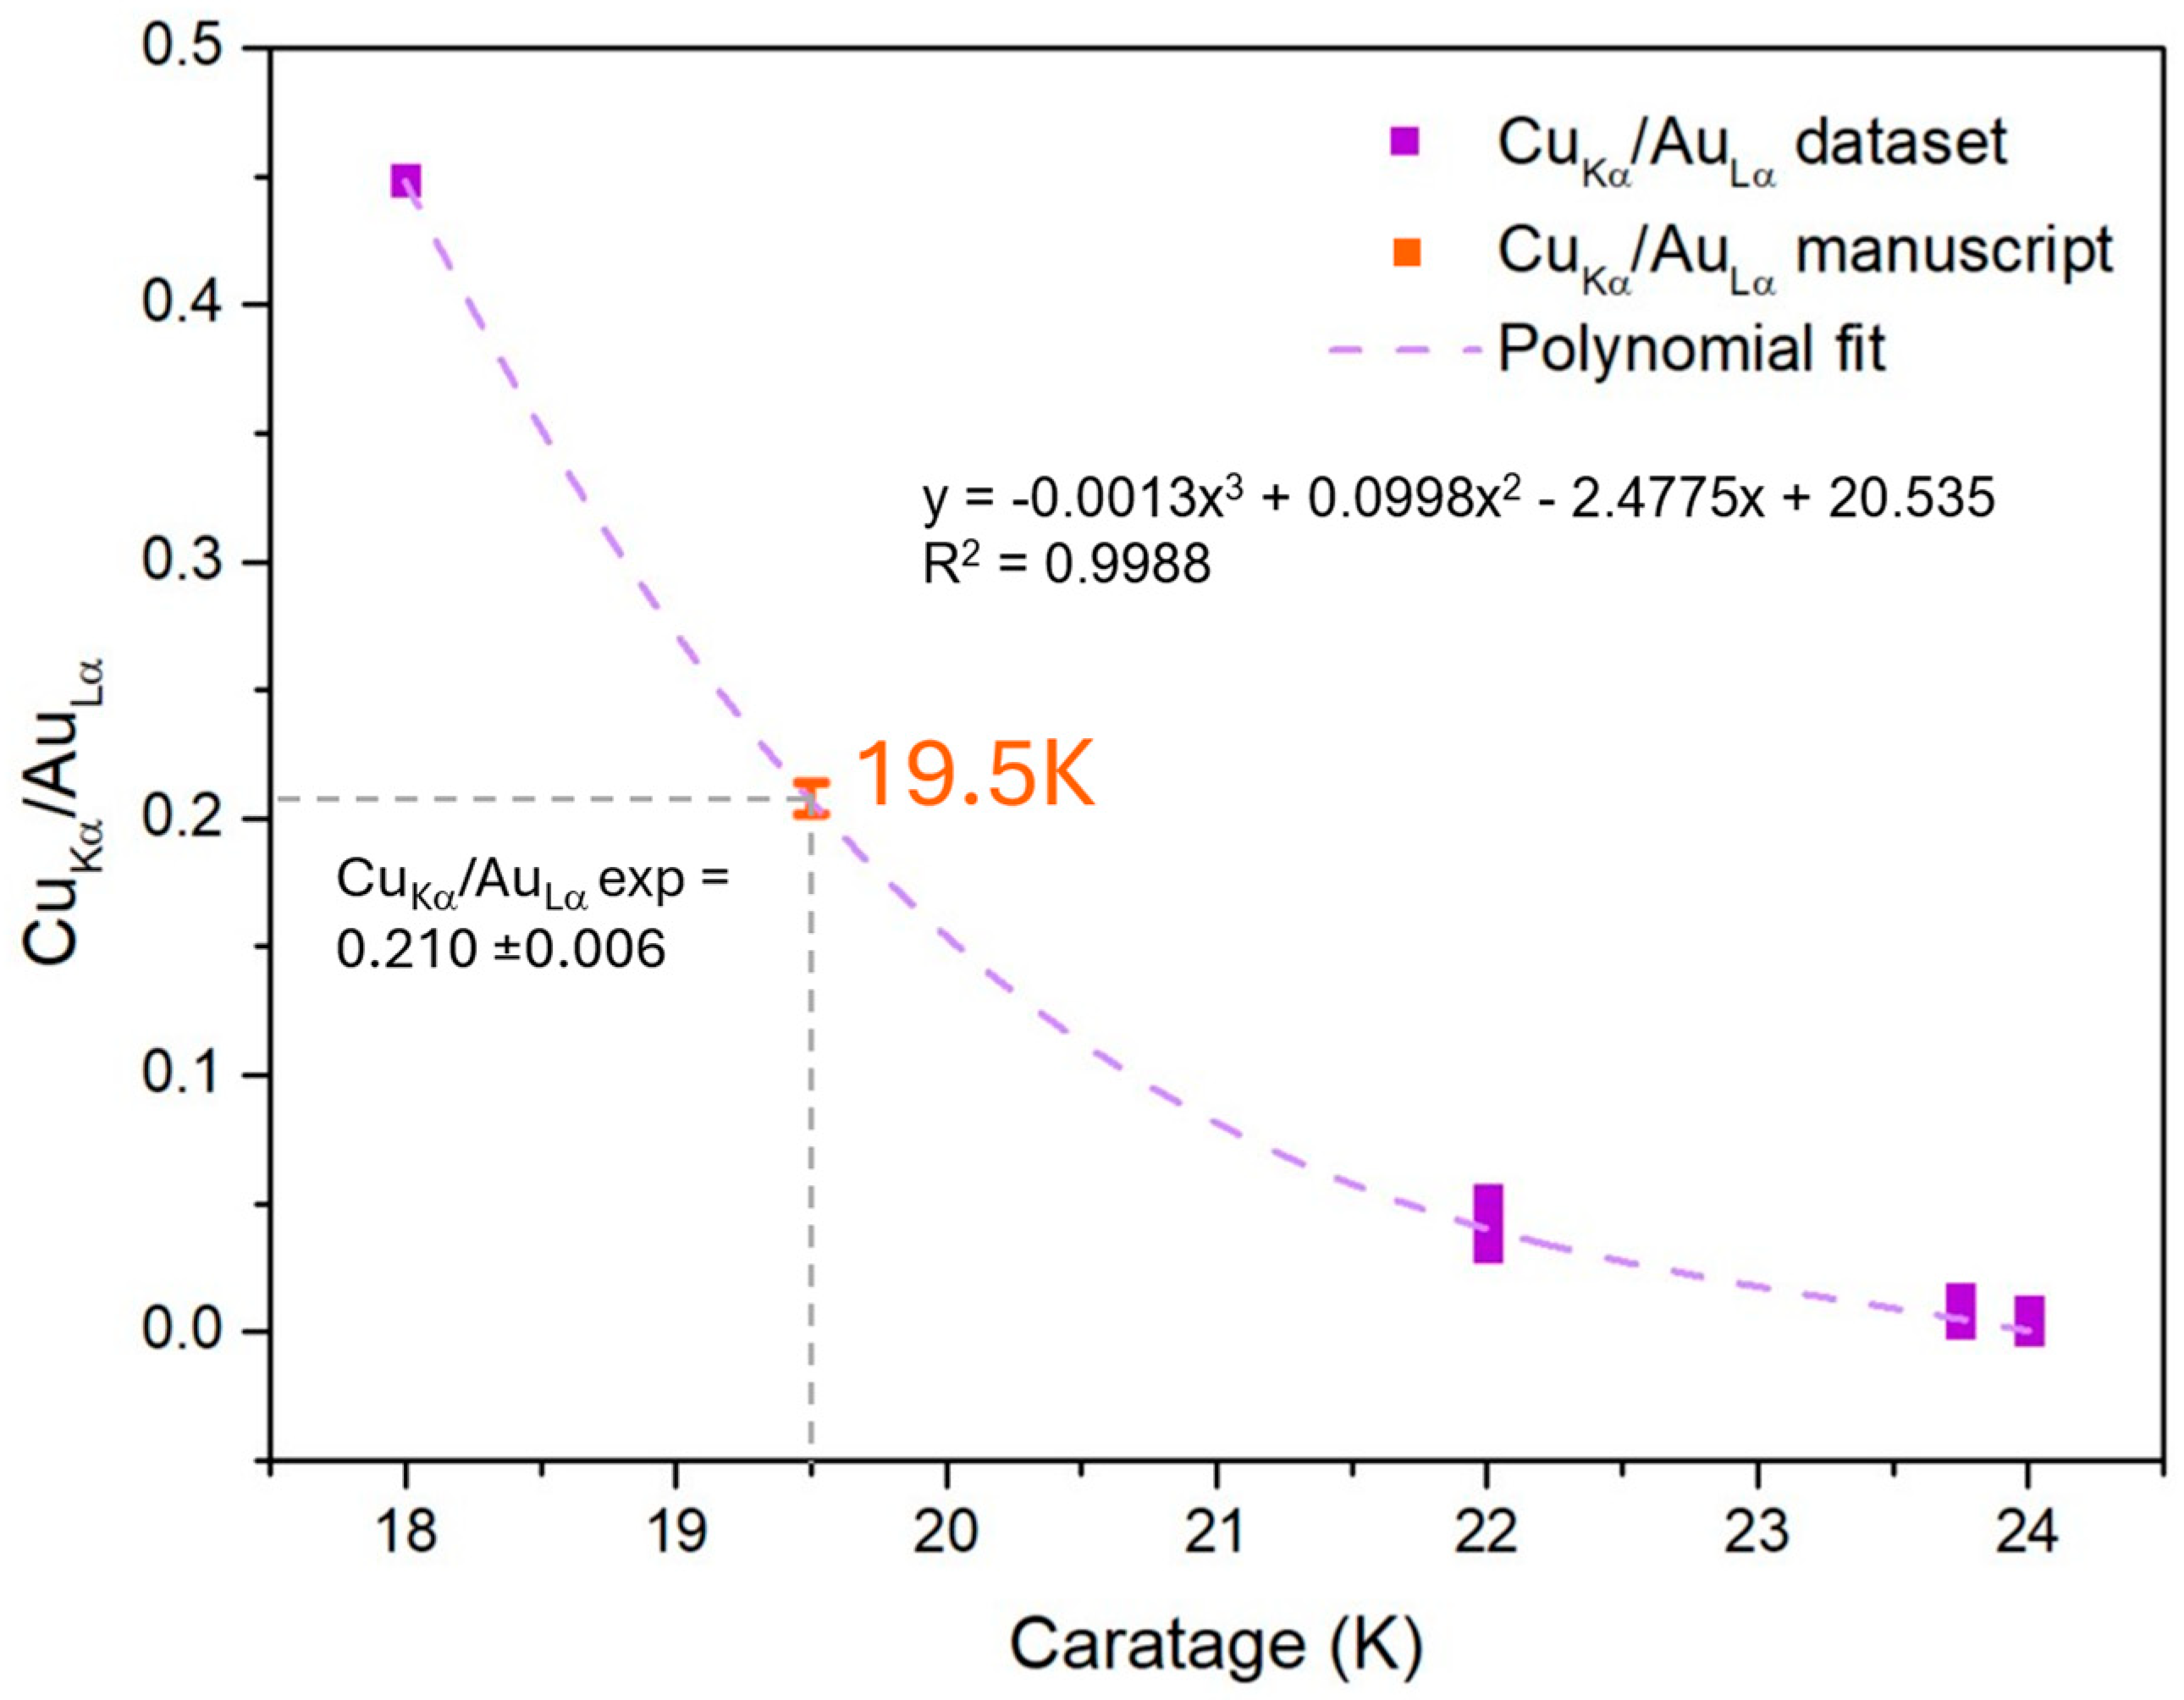
3.3. Characterization of the Manuscript

The trade agreement governing the sale of gold leaf in the city of Genoa was signed during three different periods: 1520, 1550, and 1641. The original copy of the stipulations is preserved within a manuscript drafted annually by the magistracy of the censors in order to regulate what was produced in the city. The peculiarity of the first agreement (1520) is that a prototype of gold leaf was included next to the text, to prove what finished product had to be used and traded. To fulfill the covenant, we find the commitment of the goldbeater and the painter on the sides of the prototype leaves. The signature of the painter was presumably affixed with a carbonaceous ink or a lacquer (no XRF signals), while the goldbeater engraved the inscription “hec est forma auri” (“this is the shape of gold”). The size of the leaf is confirmed to be 9 × 9 cm2, as is reported in other documents. XRF point analyses were performed on the manuscript and three main areas of interest were identified: parchment, ink, and gold leaf (Figure 8). The page composition slightly differs between the central area (where the words were meant to be written) and the borders. The hypothesis is that the page was prepared with a Ca-based primer in written parts [38,39,40]. An iron-based ink, presumably an iron gall ink, was uniformly used. Analysis of the gold leaf shows the presence of Cu as an alloying element. In combination with the gilded area, Ca, Fe, and Pb are also detected. Their presence may suggest the use of a mordant prepared with a Pb-based pigment or adhesive, along with the addition of bole as a tinting element [41,42,43,44]. The mapping function of the XRF allowed us to verify how plausible the assumptions were so far about the stratigraphy. It can be observed that Au-Cu-Pb has the same distribution, while Ca results are complementary. This, coupled with the substantial presence of Ca in the written areas, suggests that it was used only as a page primer and not as the gold foil substrate. Moreover, the XRF mapping enabled the assessment of the state of conservation of the leaf from the perspective of abrasion damage. The maximum thickness, calculated in the best-preserved areas, is equal to 493 nm in the center and 767 nm on the border, i.e., the less worn portion. To determine the caratage of the unknown gold foil, we used a reference set, including 24 K, 23 ¾K, 22 K, and 18 K gold leaves, i.e., gold alloys with 99.9%, 99.1%, 91.7%, and 79.2% gold content, with the rest being copper. The procedure consisted of relating the known caratage to the net Cu Kα to Au Lα ratio and using the curve as a calibration for unknown samples, similar to what was done for thickness assessment. In Figure 9, the calibration curve is presented. Assuming a carat value of 19.5 K, the corresponding Cu/Au ratios are equivalent to the experimental data measured on the manuscript leaf, with an error of 0.006.

4. Conclusions

The Genoese gilding context is unique due to the discovery of a prototype gold leaf that is supposed to have been used as a reference for all the gildings made in the city, starting from the 1520s. To gain insight into the formulations used by goldbeaters, who typically did not reveal (in writing) their methods, and into the actual guild rules, understanding the exact features of this foil is very important. This study offers a comprehensive characterization of the gilding technique and materials employed in the prototype leaf. Through the integration of X-ray fluorescence analysis (XRF) and ion beam analysis (IBA) techniques, such as particle-induced X-ray emission (PIXE) and Rutherford backscattering spectrometry (RBS), various aspects of gilding, including thickness, caratage, and composition, were analyzed. After calibration against laboratory-based IBA techniques, XRF proved to be a valid method for measuring in situ the thickness of gilding, as attested by the results obtained in measurements on historical samples from Palazzo Spinola di Pellicceria, which exhibited diverse thicknesses, compositions, and states of conservation. Furthermore, the examination of caratage using reference sets of known compositions allowed for accurate assessments of gold purity, shedding light on the adherence to guild regulations governing the use of aurum bonum. The manuscript leaf was found to have an Au-Cu composition, a maximum thickness of 767 nm, and a caratage of 19.5 K. This latter value is significant as it deviates considerably from the expected standard of aurum bonum.
In conclusion, this manuscript provides unique insights into historical trade agreements and gilding practices in Genoa, serving as a solid basis for future comparative analyses of Genoese artistic gilding. Through this comparison, it will be possible to understand if painters and gilders adhered, as promised, to the norms in force in the city regarding leaf carat and thickness. One might wonder whether Genoese production is distinguished by a low carat, or paradoxically, whether the leaf used as a model was of much lower quality than the gilding carried out daily in the workshops of Genoese masters.

Supplementary Materials

The following supporting information can be downloaded at https://www.mdpi.com/article/10.3390/heritage7070172/s1. X-Ray production in XRF analysis of thin gold samples.

Author Contributions

Conceptualization, L.C. and E.C.; data curation, M.C.; formal analysis, M.C., E.S.-H., A.Z. and E.C.; funding acquisition, M.C.; investigation, L.C., A.Z. and E.C.; methodology, L.C., A.Z. and E.C.; project administration, E.C.; resources, M.C. and M.F; supervision, M.C.G., M.F., A.Z. and E.C; validation, M.C., E.S-H., A.Z. and E.C.; visualization, L.C., A.Z. and E.C., writing—original draft, L.C., M.C., A.Z. and E.C.; writing—review and editing, M.C. and A.Z. All authors have read and agreed to the published version of the manuscript.

Funding

Access to INFN-LABEC laboratory was funded through the Transnational Access scheme of EU Horizon 2020 project RADIATE (Grant Agreement No. 824096) for experiment proposal 21002424-ST.

Data Availability Statement

The original RBS and PIXE data presented in the study are openly available at https://www.openaccessrepository.it/record/74306; DOI 10.15161/oar.it/74306 (accessed on 20 June 2024).

Acknowledgments

We are grateful to Marino Menegazzo, Laura Virdis, and Paolo Antonino Maria Triolo, for assisting in various phases of this work. We are indebted to the Historical Archive of the city of Genova and its staff, especially the directors Andreana Serra and Enrico Isola, for their collaboration and for allowing the analysis of the manuscript.

Conflicts of Interest

The authors declare no conflicts of interest. The funders had no role in the design of the study; in the collection, analyses, or interpretation of data; in the writing of the manuscript; or in the decision to publish the results.

References

  1. Pesenti, F.R. La disputa a Genova del 1590 sull’Arte della Pittura e Giovanni Battista Paggi. In La Pittura in Liguria: Artisti del primo Seicento; Stringa Editore: Genova, Italy, 1986; pp. 9–12. [Google Scholar]
  2. Lukehart, P.M. Contending Ideals: The Nobility of G. B. Paggi and the Nobility of Painting; The John Hopkins University: Baltimore, MD, USA, 1987. [Google Scholar]
  3. Ciarlo, L. Vicende Corporative e Professione dell’Indoratore a Genova nel Seicento, Qualche Dato a Confronto; Collana di Studi e Ricerche dell’Accademia Ligure di Scienze e Lettere: Genova, Italy, 2020; Volume LXIV. [Google Scholar]
  4. Orengo, M.T. L’arte dei Brea tra Francia e Italia. In Proceedings of the Conservazione e Valorizzazione; All’insegna del Giglio: Genova, Italy, 2005. [Google Scholar]
  5. Di Fabio, C. Il Polittico della Cervara di Gerard David; Silvana Editoriale: Milano, Italy, 2005. [Google Scholar]
  6. Baldinucci, F. Vocabolario Toscano Dell’arte del Disegno; Per Santi Franchi al Segno della Passione: Firenze, Italy, 1681; 115p. [Google Scholar]
  7. Marini, M. Giorgio Vasari, Le Vite dei più Eccellenti Pittori, Scultori e Architetti (1568); Newton Compton Editori: Roma, Italy, 2012. [Google Scholar]
  8. Marabelli, M.; Basile, G. Le lamine metalliche utilizzate nella decorazione dei dipinti murali giotteschi. In Giotto nella Cappella degli Scrovegni: Materiali per la Tecnica Pittorica; Istituto poligrafico e Zecca dello Stato: Roma, Italy, 2005. [Google Scholar]
  9. Ciarlo, L. Storia Dell’arte e Valorizzazione del Patrimonio Artistico (Art History and Valorization of Artistic Heritage). Master’s Thesis, University of Genoa, Genoa, Italy, 12 December 2017, unpublished. [Google Scholar]
  10. Ciarlo, L. Il Mestiere del Battiloro a Genova fra i Secoli XV e XVII: La Testimonianza dei Verberatores Auri in Folio; 1986; pp. 5–34. ISBN 978-88-97099-39-0. ISSN 2037-7134. Available online: https://www.storiapatriagenova.it/Scheda_vs_info.aspx?Id_Scheda_Bibliografica=6101 (accessed on 20 May 2024).
  11. Sanguineti, D. Assetti corporativi tra obblighi e rivendicazioni: Gli scultori in legno e i bancalari nella Repubblica di Genova. Atti Soc. Stor. Patria 2013, 53, 149–195. [Google Scholar]
  12. Ottavi, C. Supporti metallici. In I Supporti nelle Arti Pittoriche. Storia, Tecnica, Restauro; Maltese, C., Ed.; Mursia: Milano, Italy, 1990. [Google Scholar]
  13. Galliano Lalli, G.; Innocenti, F. La doratura nelle tecniche artistiche. OPD Restauro 2016, 28, 340–348. [Google Scholar]
  14. Sandu, I.; Afonso, L.; Murta, E.; De Sa, M. Gilding techniques in religious art between east and west, 14th–18th Centuries. Int. J. Conserv. Sci. 2010, 1, 47–62. [Google Scholar]
  15. Brocchieri, J.; Sabbarese, C. Thickness determination of the gilding on brass materials by XRF technique. Nucl. Instrum. Methods Phys. Res. Sect. B Beam Interact. Mater. Atoms 2021, 496, 29–36. [Google Scholar] [CrossRef]
  16. Martinuzzi, S.; Giovani, C.; Giurlani, W.; Galvanetto, E.; Calisi, N.; Casale, M.; Fontanesi, C.; Ciattini, S.; Innocenti, M. A robust and cost-effective protocol to fabricate calibration standards for the thickness determination of metal coatings by XRF. Spectrochim. Acta Part B At. Spectrosc. 2021, 182, 106255. [Google Scholar] [CrossRef]
  17. Lopes, F.; Melquiades, F.L.; Appoloni, C.R.; Cesareo, R.; Rizzutto, M.; Silva, T.F. Thickness determination of gold layer on pre-Columbian objects and a gilding frame, combining pXRF and PLS regression. X-Ray Spectrom. 2016, 45, 344–351. [Google Scholar] [CrossRef]
  18. Fiorini, C.; Gianoncelli, A.; Longoni, A.; Zaraga, F. Determination of the thickness of coatings by means of a new XRF spectrometer. X-Ray Spectrom. 2002, 31, 92–99. [Google Scholar] [CrossRef]
  19. Cesareo, R.; Rizzutto, M.A.; Brunetti, A.; Rao, D.V. Metal location and thickness in a multilayered sheet by measuring Kα/Kβ, Lα/Lβ and Lα/Lγ X-ray ratios. Nucl. Instrum. Methods Phys. Res. Sect. B Beam Interact. Mater. Atoms 2009, 267, 2890–2896. [Google Scholar] [CrossRef]
  20. Barcellos Lins, S.A.; Ridolfi, S.; Gigante, G.E.; Cesareo, R.; Albini, M.; Riccucci, C.; di Carlo, G.; Fabbri, A.; Branchini, P.; Tortora, L. Differential X-Ray Attenuation in MA-XRF Analysis for a Non-invasive Determination of Gilding Thickness. Front. Chem. 2020, 8, 1–9. [Google Scholar] [CrossRef]
  21. Wu, Q.; Watts, B.; Döbeli, M.; Müller, J.; Butz, B.; Lombardo, T.; Schmidt-Ott, K.; Fink, R.; Nolting, F.; Ganz, D. Medieval nanotechnology: Thickness determination of Zwischgold samples. J. Cult. Herit. 2021, 49, 211–221. [Google Scholar] [CrossRef]
  22. Osticioli, I.; Lavacchi, A.; Capozzoli, L.; Berretti, E.; Gallo, L.; Berberich, C.; Agresti, J.; Siano, S. Novel insights on the study of a fifteenth-century oro di metà/Zwischgold gilding by means of ion and electron microscopy: Characterization of the stratigraphy avoiding cross-sections preparation. J. Cult. Herit. 2020, 44, 297–306. [Google Scholar] [CrossRef]
  23. Moro, D.; Ulian, G.; Valdrè, G. Monte Carlo SEM-EDS micro- and nanoanalysis of ultrathin gold leaves in glass mosaic tesserae: Thickness effects and measurement strategy. Meas. J. Int. Meas. Confed. 2018, 129, 211–217. [Google Scholar] [CrossRef]
  24. Figueiredo, E.; Silva, R.J.C.; Araújo, M.F.; Senna-Martinez, J.C. Identification of ancient gilding technology and Late Bronze Age metallurgy by EDXRF, Micro-EDXRF, SEM-EDS and metallographic techniques. Microchim. Acta 2010, 168, 283–291. [Google Scholar] [CrossRef]
  25. Chiari, M. External Beam IBA Measurements for Cultural Heritage. Appl. Sci. 2023, 13, 3366. [Google Scholar] [CrossRef]
  26. Corsi, M.; Cristoforetti, G.; Palleschi, V.; Salvetti, A.; Tognoni, E. A fast and accurate method for the determination of precious alloys caratage by Laser Induced Plasma Spectroscopy. Eur. Phys. J. D 2001, 13, 373–377. [Google Scholar] [CrossRef]
  27. Le Gac, A.; Seruya, A.I.; Lefftz, M.; Alarcão, A. The main altarpiece of the Old Cathedral of Coimbra (Portugal). ArchéoSciences 2009, 33, 423–432. [Google Scholar] [CrossRef]
  28. Otero, V.; Sanches, D.; Montagner, C.; Vilarigues, M.; Carlyle, L.; Lopes, J.A.; Melo, M.J. Characterisation of metal carboxylates by Raman and infrared spectroscopy in works of art. J. Raman Spectrosc. 2014, 45, 1197–1206. [Google Scholar] [CrossRef]
  29. Mihalic, I.B.; Fazinic, S.; Barac, M.; Karydas, A.G.; Migliori, A.; Doracic, D.; Desnica, V.; Mudronja, D.; Krstic, D. Multivariate analysis of PIXE + XRF and PIXE spectral images. J. Anal. At. Spectrom. 2021, 36, 654–667. [Google Scholar] [CrossRef]
  30. MacLennan, D.; Llewellyn, L.; Delaney, J.K.; Dooley, K.A.; Patterson, C.S.; Szafran, Y.; Trentelman, K. Visualizing and measuring gold leaf in fourteenth- and fifteenth-century Italian gold ground paintings using scanning macro X-ray fluorescence spectroscopy: A new tool for advancing art historical research. Herit. Sci. 2019, 7, 25. [Google Scholar] [CrossRef]
  31. Hradil, D.; Hradilová, J.; Bezdička, P.; Serendan, C. Late Gothic/early Renaissance gilding technology and the traditional poliment material “Armenian bole”: Truly red clay, or rather bauxite? Appl. Clay Sci. 2017, 135, 271–281. [Google Scholar] [CrossRef]
  32. Cennini, C. Il Libro Dell’arte o Trattato Della Pittura; Frezzato, F., Ed.; Editore Neri Pozza: Venezia, Italy, 2009. [Google Scholar]
  33. Chiari, M.; Barone, S.; Bombini, A.; Calzolai, G.; Carraresi, L.; Castelli, L.; Czelusniak, C.; Fedi, M.E.; Gelli, N.; Giambi, F.; et al. LABEC, the INFN ion beam laboratory of nuclear techniques for environment and cultural heritage. Eur. Phys. J. Plus 2021, 136, 472. [Google Scholar] [CrossRef]
  34. Chiari, M.; Migliori, A.; Mandò, P.A. Measurement of low currents in an external beam set-up. Nucl. Instrum. Methods Phys. Res. Sect. B Beam Interact. Mater. Atoms 2002, 188, 162–165. [Google Scholar] [CrossRef]
  35. Mayer, M. SIMNRA User’s Guide; Max Planck Institute for Plasma Physics: Garching, Germany, 1997. [Google Scholar]
  36. Campbell, J.L.; Cureatz, D.J.T.; Flannigan, E.L.; Heirwegh, C.M.; Maxwell, J.A.; Russell, J.L.; Taylor, S.M. The Guelph PIXE Software Package V. Nucl. Instrum. Methods Phys. Res. Sect. B Beam Interact. Mater. Atoms 2021, 499, 77–88. [Google Scholar] [CrossRef]
  37. Franceschi, E.; Locardi, F. Strontium, a new marker of the origin of gypsum in cultural heritage? J. Cult. Herit. 2014, 15, 522–527. [Google Scholar] [CrossRef]
  38. De Viguerie, L.; Rochut, S.; Alfeld, M.; Walter, P.; Astier, S.; Gontero, V.; Boulc, F. XRF and reflectance hyperspectral imaging on a 15th century illuminated manuscript : Combining imaging and quantitative analysis to understand the artist ’ s technique. Herit. Sci. 2018, 6, 11. [Google Scholar] [CrossRef]
  39. Duran, A.; López-montes, A.; Castaing, J.; Espejo, T. Analysis of a royal 15th century illuminated parchment using a portable XRF e XRD system and micro-invasive techniques. J. Archaeol. Sci. 2014, 45, 52–58. [Google Scholar] [CrossRef]
  40. Note, T.; Cappa, F. Non-Invasive Physico-Chemical and Biological Analysis of Parchment Manuscripts—An Overview und biologische Analyse von Pergamenthandschriften—Ein Überblick. Restaurator 2022, 43, 127–142. [Google Scholar]
  41. Pouyet, E.; Devine, S.; Grafakos, T.; Kieckhefer, R.; Salvant, J.; Smieska, L.; Woll, A.; Katsaggelos, A.; Cossairt, O.; Walton, M. Analytica Chimica Acta Revealing the biography of a hidden medieval manuscript using synchrotron and conventional imaging techniques. Anal. Chim. Acta 2017, 982, 20–30. [Google Scholar] [CrossRef]
  42. Carsote, C.; Library, R.A.; Badea, E. Bindings of Rare Books from the Collections of the Romanian Academy Library—A Multidisciplinary Study. Rev. Piel. Incaltaminte 2018, 18, 307. [Google Scholar] [CrossRef]
  43. Magkanas, G.; Bagan, H.; Sistach, M.C.; García, J.F. Illuminated manuscript analysis methodology using MA-XRF and NMF : Application on the Liber Feudorum Maior. Microchem. J. 2021, 165, 106112. [Google Scholar] [CrossRef]
  44. Sandu, C.A.I.; De Sá, M.H.; Pereira, M.C. Ancient “gilded” art objects from European cultural heritage: A review on different scales of characterization. Surf. Interface Anal. 2011, 43, 1134–1151. [Google Scholar] [CrossRef]
Figure 1. (a) Photo of the manuscript that preserves the gold foil prototype and (b) close-up of the gold foil showing inscriptions and damages. (c) Example of the gold foil standards with different thicknesses and caratage used for the XRF quantitative analysis calibration. (d) Samples are from Palazzo Spinola di Pellicceria and are used as the validation set; the historical samples are identified by the letter S (1–10).
Heritage 07 00172 g001
Figure 2. RBS spectrum obtained with 3 MeV protons for sample S4 together with the SIMNRA simulation. Dots are experimental points, and the continuous lines represent the global fit and the single-element fit. C and O come from the mordant, while He is not in the sample itself, but it is a “parasitic” element, common to RBS spectra collected in an external beam set-up under helium flow.
Heritage 07 00172 g002
Figure 3. Comparison of the three differently calculated thicknesses for each sample. The thicknesses calculated, respectively, by SIMNRA fitting and GUPIX fitting are compared to those calculated from Equation (2).
Heritage 07 00172 g003
Figure 4. The thicknesses of the reference leaves, from RBS measurements, as functions of the normalized gold Lα peak areas obtained by PIXE. The linear fit gives us a calibration constant of 0.0058.
Heritage 07 00172 g004
Figure 5. Comparison between the thicknesses of the reference leaves computed from the Lα peak areas obtained by PIXE, using the calibration coefficient 0.0058, and the leaf thicknesses calculated from Equation (2). The linear fit indicates that the ratio between the two sets is, on average, 0.9977.
Heritage 07 00172 g005
Figure 6. Comparison between the thicknesses of the reference leaves measured with RBS and the Au Lα peak areas from XRF measurements.
Heritage 07 00172 g006
Figure 7. (a) Photo of the overlapping gold foils; the picture shows that, to the naked eye, it is difficult to assess where the different leaves are placed. (b) XRF Au Lα map image of the overlapping gold foils; the map image is achieved by generating a grid of pixels where each one has a color assigned, depending on the corresponding area net count of the Au Lα recorded; a darker color corresponds to a higher count. (c) The thickness profile extracted from the line is highlighted in purple.
Heritage 07 00172 g007
Figure 8. (a) XRF Au Lα map images of two areas of the manuscript’s gold foil prototype (L = left area, R = right area). (b) Thickness profiles extracted from the line are highlighted in purple. (c) XRF Cu Kα, Ca Kα, and Pb Kα map images of the left area of the manuscript’s gold foil prototype. (d) XRF spectra were collected on the three areas of interest: gold leaf, parchment, and ink.
Heritage 07 00172 g008
Figure 9. Comparison between the CuKα/Au ratios measured for the reference set with XRF analysis and the corresponding caratages. The experimental ratio measured for the manuscript’s gold foil (from which the cartage has been inferred (orange)) is inserted into the calibration curve.
Heritage 07 00172 g009
Table 1. Gold leaf reference sets. Each sample is identified by a letter and a number as follows: C = 24 K single leaves mounted either with mordant (1–4) or guazzo (5–8) technique; M = 24 K multiple overlapping leaves on guazzo; K = single leaves of different caratages mounted on guazzo. Leaves are differentiated by thickness according to the information provided by the manufacturer.
DatasetCaratage
(K)
SubstrateSample NameThickness
(g) 1
Nominal
Thickness (nm)
Thickness
calibration
24 KmordantC120160
C222180
C332260
C440320
24 KguazzoC520160
C622180
C732260
C840320
M120 + 22340
M222 + 22360
M332 + 40580
M440 + 40640
M532 + 40 + 40900
Caratage
calibration
18 KguazzoK132260
22 KK232260
23 3/4 KK332260
24 KK432260
1 Value provided by the goldbeater to distinguish between different thicknesses, refers to the initial weight of the unbeaten speck of gold used to produce 1000 8 × 8 cm2 leaves.
Table 2. Results from the reference sample investigation.
SampleRBSPIXE
Thickness from
Au RBS Peak Area
Thickness from SIMNRA FitThickness from Au Lα Peak AreaThickness from
GUPIX Fit
DAu (nm)Err [%]DAu (nm)Err [%]DAu (nm) *DAu (nm)Err [%]
C1304.94.51299.50.02332.1305.11.1
C2217.42.96219.70.76237.5225.71.98
C3143.32.411401.09154.7142.22.73
C4174.72.91169.41.07190.7174.53.25
C5260.96.46254.40.95271.0242.60.81
C6217.31.74219.10.1227.9202.90.94
C7154.70.04154.10.55164.4147.51.17
C8158.23.16161.90.74170.3153.61.08
M1322.97.97311.91.47343.7304.10.58
M2503.78.38499.70.67493.3438.20.82
M3540.94.47534.70.35527.1475.50.92
M4590.94.8578.90.28585.9525.30.74
M5769.65.47789.71.99724.9657.20.46
* Error on the coefficient derived from the linear regression fit in Figure 4 = 1.85% (1σ).
Table 3. Results of the thickness calculation from XRF data collected for the historic samples from Palazzo Spinola di Pellicceria.
Historic SamplesXRF Au Lα Area Net CountXRF Thickness (nm)
MinAverageMaxMinAverageSt. DevMax
S14910881512,50112422278315
S25826842914,39514621270362
S31071563511,5342614298290
S42147428056895410734143
S55498934514,07413823568354
S65611846117,04314121394429
S74373828414,979110208108377
S8609110,28519,430153259129489
S93797529380609513343203
S10553510,45816,443139263103414
Disclaimer/Publisher’s Note: The statements, opinions and data contained in all publications are solely those of the individual author(s) and contributor(s) and not of MDPI and/or the editor(s). MDPI and/or the editor(s) disclaim responsibility for any injury to people or property resulting from any ideas, methods, instructions or products referred to in the content.

