1. Introduction
Al Ain is located at the edge of the tropical belt and is defined as a hot-arid subtropical desert climate, i.e., BWh in the Köppen–Geiger climate classification [
1,
2] with high temperatures and rare and scarce precipitation. The region is vulnerable to the risk of climate change and is subject to an increase in hot, and hot extremes [
3]. This increases the risk of unfavorable indoor microclimate that causes discomfort to users and can damage buildings and collections. Reaching a stable indoor environment that meets the requirements of artifacts as well as visitors’ satisfaction with the least energy consumption is a difficult objective. The accepted temperature and humidity ranges depend on the material types, their combination, and the conservation conditions. Several studies have been performed on this subject [
4,
5,
6,
7,
8,
9].
After archaeological sites have been excavated, the burial environment remains exposed to the extreme weather of the tropics or is protected indoors. Historical houses and museums naturally become the safe keepers of archaeological heritage while providing the general public with a space where the relics could be exhibited [
10]. In this respect, many architectural monuments and even urban districts are simultaneously archaeological zones because of the underground remains of predecessor buildings [
11], as in the present case study, focused on the Bait Mohamed Bin Khalifa House (BMBK).
BMBK is a historic house-museum transformed into a community center, part of The Cultural Sites of Al Ain, UAE, which is a UNESCO World Heritage serial property [
12]. The house was built for the late Sheikh Mohammed bin Khalifa Al Nahyan (1909–1979), the father-in-law of the late Sheikh Zayed bin Sultan Al Nahyan, the Founding Father of the United Arab Emirates. The house was rehabilitated in 2021 by the Department of Culture and Tourism (DTC)—Abu Dhabi and adapted into a community center for residents and visitors, with a permanent exhibition on the recent history of UAE.
The house was built in 1958 and is a rare example of a transitional style of architecture, merging traditional architecture and design with modern materials and building techniques [
13]. The period of the 1930s–1960s represents a time of social and cultural change for Abu Dhabi, following the early exploration and discovery of oil. The economic growth helped to stimulate planned urban development and new technological innovations were introduced, like the use of reinforced concrete in the field of construction. The traditional vernacular architecture, built with local materials (mudbrick, limestone, gypsum, and palm trunks) was transformed during the so-called “transitional period” creating a sort of hybrid architectural style, mixing different techniques and materials (cement) or experimentally using them.
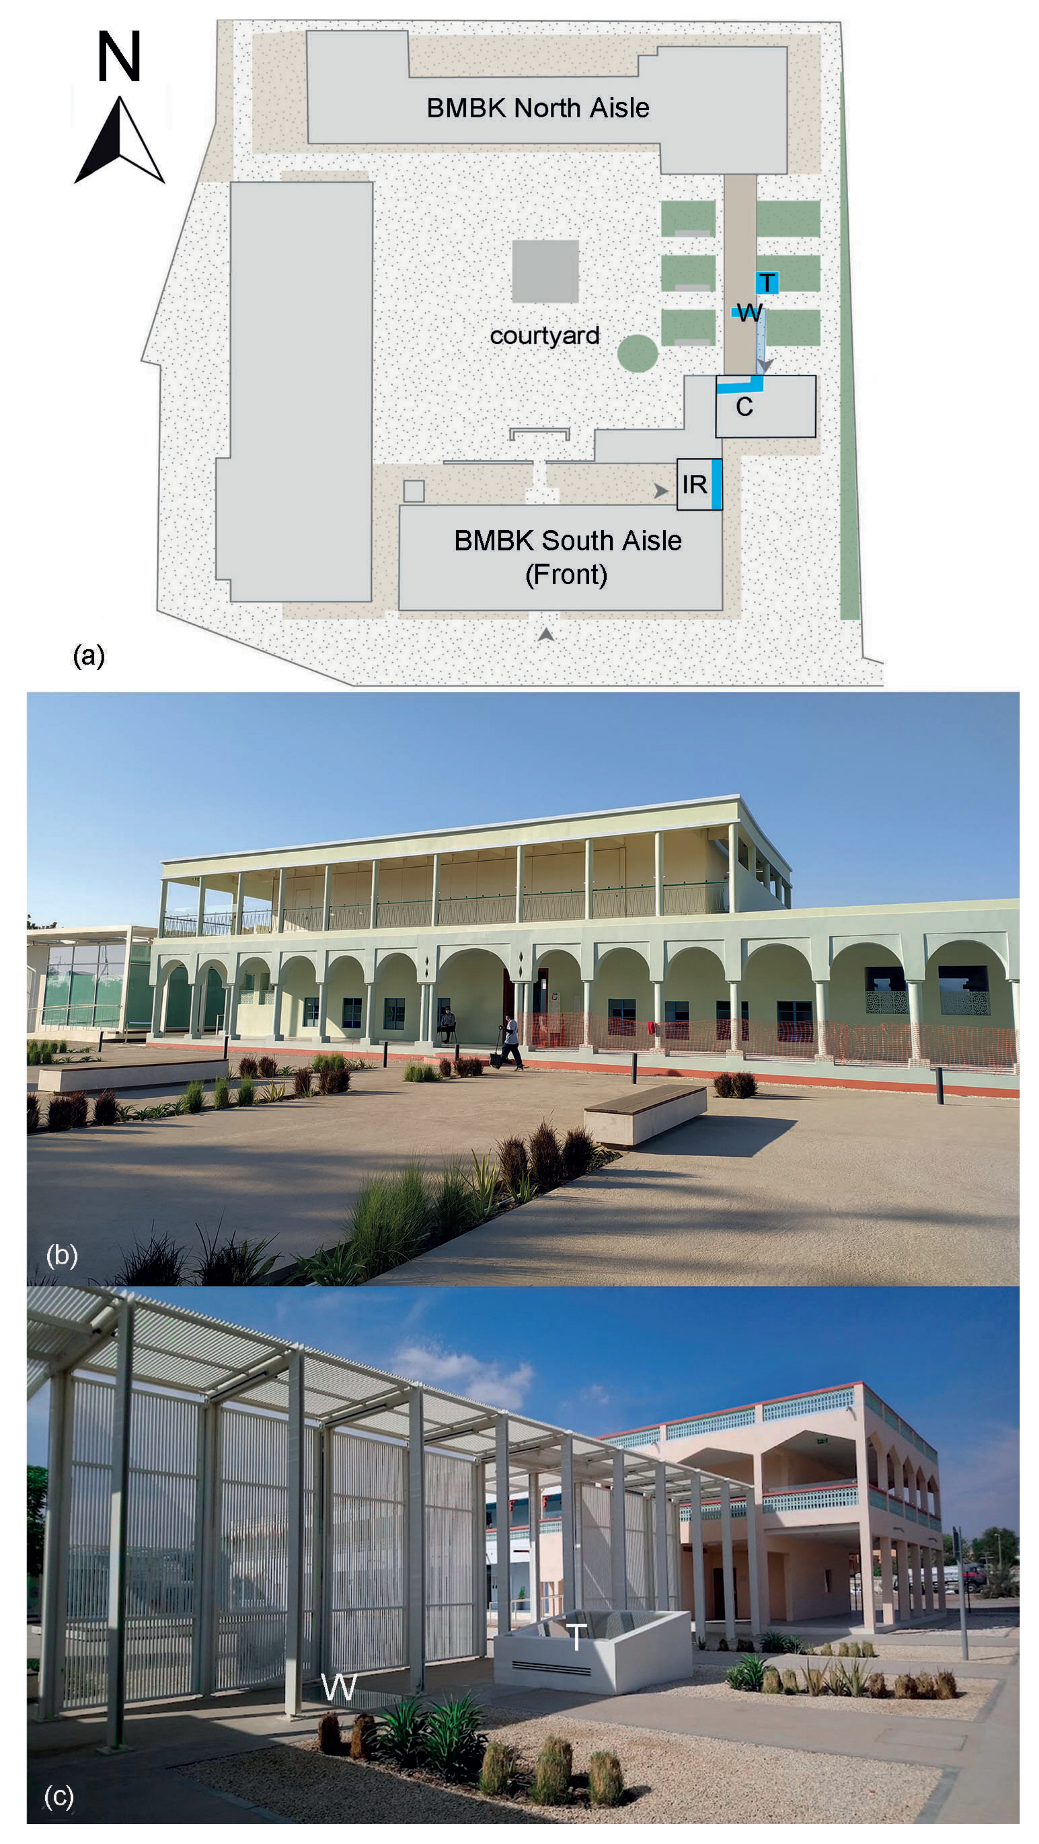
The House is composed of two two-story buildings and one service block, organized around a courtyard enclosed by a boundary wall, and it was built up over time (
Figure 1). Seven different phases were identified based on building investigations. Archaeological investigations in the courtyard and kitchen uncovered earlier phases of occupation as well as traces of the domestic life of the House. Archaeological investigations carried out during the DCT project to restore the BMBK indicated the presence of a number of distinct phases of construction or activity. Several of these phases are represented by features displayed inside Classroom (C), formerly the kitchen block, and in the area immediately to the north.
The earliest phase was composed of a substantial mudbrick building with white plastered walls, plaster floors and a courtyard that extends eastwards beyond the limits of the current plot. The continuation of these mudbrick walls below the Classroom kitchen shows that this phase pre-dates the present BMBK building and may be the original mud brick house referred to in some oral histories.
This building was subsequently demolished for the construction of the present house and the stone kitchen block. Cooking took place within the kitchen and in the open area in front of it, as shown by the presence of numerous firepits and the stone and cement ‘tanoor’ or underground oven, where meat would be wrapped in palm leaves and cooked slowly overnight.
The rehabilitation of the House from 2017 to 2021 included the repair and restoration of the buildings and the preservation and exhibition of the archaeological remains that provide an understanding of domestic life in the courtyard as well as the development of the site. These buried remains are exhibited in glass showcases: two outdoors and two indoors.
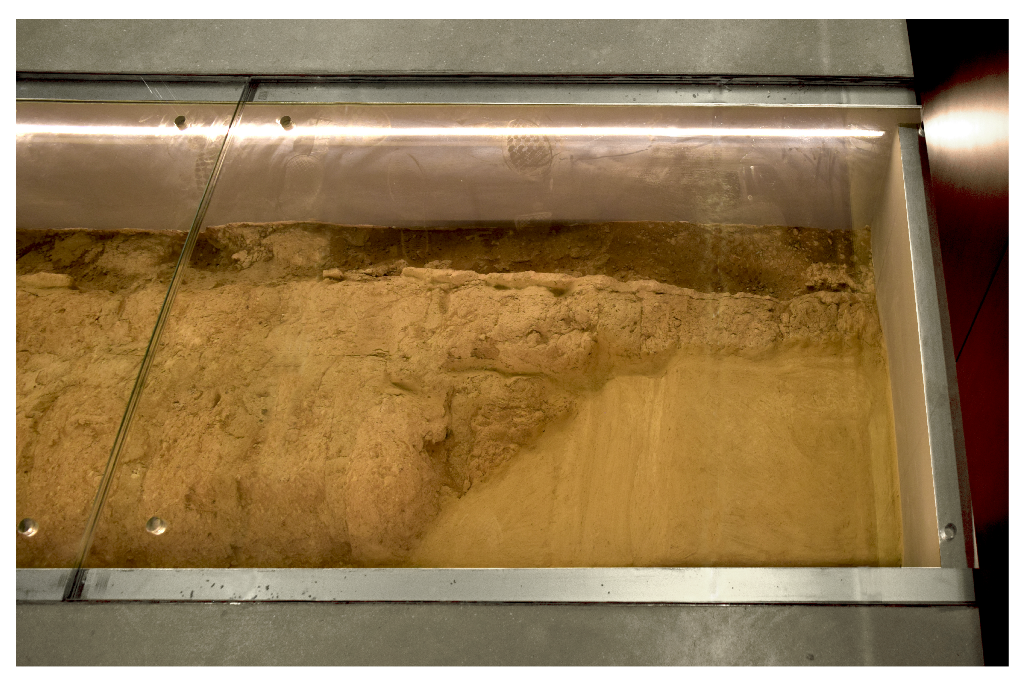
In the Classroom, the remains of an earthen foundation are exhibited in the showcase, while in the interpretation room the showcases lie underground and consist of protective walls built around the remains. The top is made of glass panes at room floor level. A linear light is placed on both sides of the remains. Inside the Interpretation Room, a linear showcase shows the stone foundation of an earlier structure of boundary wall, upon which a modern wall was erected. This ancient wall is on one side directly connected to the outdoors. In the two rooms, the showcases are similar between them. Both rooms lie around 80 cm above the external ground level; therefore, the remains lie 80 cm below the room floor.
The two showcases located outdoors lie in extreme conditions, and in particular, the greenhouse effect generated by the strong solar radiation of the Tropic of Cancer. They have been studied and presented in another paper [
14]. The result was that the strong solar radiation hitting the glass panes generates a greenhouse effect and the showcases reach very high temperatures, e.g., 80 °C. During the day, the extreme heat forces moisture to evaporate from the remains; during the nocturnal cooling, the moisture in the air reaches saturation and condenses on the inside surface of the glass panes, forming large drops that hide the view, and fall onto the earthen remains. The repetition of these evaporation-condensation cycles accumulates soluble salts on the remains. This paper is concerned with the indoor environment, and the compatibility between the needs for use and those for conservation.
The building lies in a dry and hot region. The Classroom is often used as a workshop room attended by several people, while the Interpretation room is part of the museum route, with few visitors simultaneously present. Therefore, a heating, ventilating and air conditioning system (HVAC) is necessary to mitigate the hot tropical climate and provide a comfortable indoor environment.
There are international and national standards and regulations concerning showcases. The only international standards are of the European Committee for Standardization, i.e., EN 15999-1 (2014) [
15] and prEN 15999-2 [
16] (in production, expected 2024). Among the national recommendations, the Conservation Institute of Canada has published an extensive guideline [
17], while the ASHRAE [
18] in the USA includes a short list of characteristics and problems related to showcases. It must be specified, however, that the existing standards, regulations, and guidelines concern exclusively museum showcases and their characteristics. For instance, they should have a separate technical volume to include moisture sorbents, they should be tight, they should not release volatile organic compounds (VOC) and so on. Showcases to protect burial environments have no regulations except that they must comply with basic, general requests, i.e., to guarantee use (i.e., to be transparent to allow viewing of remains), safety (e.g., no slippery) and security (not breakable) issues, like everything else contained within the building. A problem arises when internal condensation forms on the lower surface of the glass pane, because the droplets of water form misting, and this fogging obscures the view. It is unthinkable to control humidity with moisture sorbents, e.g., silica gel because enormous quantities of sorbents would be required. In addition, they would occupy volumes greater than the exhibition space and need continuous control and maintenance by professional personnel. Furthermore, the condensation on the glass surface is not directly related to the relative humidity level inside the showcase, but to a combined effect involving the humidity mixing ratio inside the showcase, and the glass temperature. The former is related to the evaporation from the remains and the air exchanges, while the latter is related to the room temperature.
This paper has the following aims.
To investigate the showcases in their environmental context, including the exchanges of heat and moisture between the archaeological remains, the showcases and the rooms;
To identify under which conditions glass misting develops, which prevents the viewing of the archaeological remains;
To verify whether the conditions generated inside the showcases may constitute a risk to the conservation of the archaeological remains;
To discuss possible solutions for this case study, either limitations to comfort and use, or other mitigation remedies. In addition, their feasibility and transferability to other similar cases.
2. Methodology
2.1. Description of the Used Sensors
A microclimate monitoring system has been installed at BMBK to monitor the outdoor and indoor environment for one year (i.e., 22 April 2022 to 30 May 2023).
For the external conditions, a pair of combined sensors
, including air temperature
and relative humidity
, has been installed outdoors, protected with a standard multiplate solar shield (for details see [
14]).
The indoor environment is constituted of two rooms with showcases built around the archaeological remains, and they lie embedded in the room floor. Rooms and showcases have been monitored as follows.
The air temperatures and the relative humidities inside the two rooms and their showcases have been also measured with similar combined sensor pairs, i.e., and , respectively. In the Classroom, the showcase is long and L-shaped; therefore, it has been provided with two pairs, one per wing. As both the pairs gave almost identical results, only one pair is considered in this paper. In the Interpretation Room, the showcase is linear, composed of a single volume dug into the ground, and has been provided with only one pair.
The temperatures of the glass panes topping the showcases have been measured in both rooms with a contact temperature sensor. This parameter has been measured because when it reaches or drops below the dew point, the glass surface starts misting or forming drops by condensation.
In the Classroom showcase, which was affected by glass mist, a sensor to measure the soil moisture content , i.e., the volumetric water content was inserted into the ground close to the archaeological remains. is a dielectric sensor that operates at a frequency of 70 MHz and measures the dielectric constant of soil in the space immediately adjacent to the probe surface (over 1 liter volume). The output is expressed in %, volumetric water content (VWC), i.e., water volume/soil volume.
The sensors comply with the European 370 Standards EN 15758 for temperature [
19], EN 16242 for relative humidity [
20], EN 16682 371 for moisture content [
21]. All sensors are connected via cable to a datalogger, and the sampling time is 15 min. The technical characteristics of the sensors are reported in
Table 1.
2.2. Description of the Calculated Parameters
From the recorded temperature and relative humidity data, other parameters useful for environmental diagnostic purposes have been obtained by calculation [
6,
20] as illustrated in
Figure 2.
The mixing ratio (
) is the (dimensionless) ratio of the mass of water vapor to the mass of dry air in any selected volume of air. It represents how many grams of water vapor (
) are mixed with 1 kg of dry air (
and
). This ratio is invariant to changes in temperature, volume and pressure, and changes only when some external vapor is added to the system, or is removed from it, or when some external air is mixed with it. This parameter is useful for recognizing when evaporation or condensation occurs (the former giving an increase in
, the latter a decrease), as well as the exchanges between different air masses, e.g., showcase and room. This parameter is calculated by the formula [
6,
20]:
where
p is the atmospheric pressure (hPa) and
t is the air temperature (°C).
At constant atmospheric pressure, and any given value of mixing ratio
, the dew point
is the temperature at which the water vapor becomes saturated, and begins to condense into water droplets. As the changes in atmospheric pressure are limited, the
is primarily determined by the
. When the glass pane temperature reaches the dew point, i.e.,
, it starts misting. When
falls below this threshold, i.e.,
, condensation occurs at a high rate, forming and feeding large water drops. It must be specified, however, that the presence of hydrophilic contaminants on the surface of the glass pane may start misting before this threshold, e.g., at
°C. This parameter is calculated by the formula [
6,
20]:
2.3. Soluble Salt Monitoring
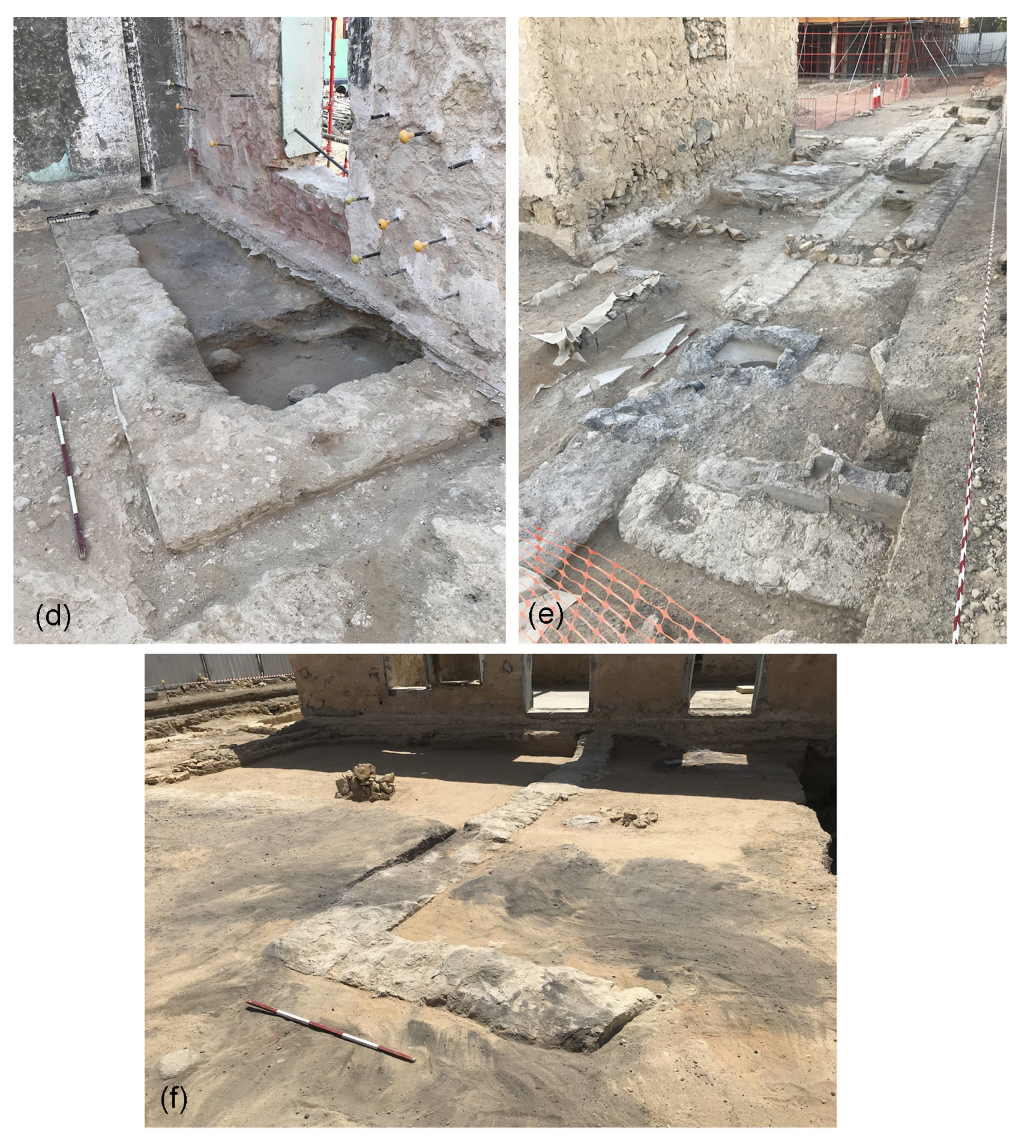
The showcases were built during the 2017–2021 rehabilitation works. Soluble salts constitute a real potential problem, and a periodic control plan has been established, that will continue in the future. With simple visual inspections, it is not easy to recognize deterioration of earthen remains, because their surface is rough, uneven, and shapeless (
Figure 3), with the consequence that only macroscopic forms of damage can be assessed when it is too late to remedy.
The most efficient measure is prevention, by periodic monitoring of the accumulation rate of soluble salts. These constitute a cumulative quantity destined to increase over time. To fix the first benchmark, in May 2022, during the microclimate campaign, samples of the remains were taken according to the EN 16085 standard [
22] to measure the concentration of soluble salts. The chemical analyses have been performed with a Scanning Electron Microscope (SEM) combined with energy-dispersive X-ray spectroscopy (EDS). This has evidenced a patina, with medium-fine grain size, mainly based on calcium sulfate, in hydrated and non-hydrated form, which can be correlated to gypsum derived from sulfation. This patina is not very compact and distributed unevenly on the sample under examination. In addition, low concentrations of chlorine and sodium ions were detected, due to contamination of soluble salts, in particular, sodium chloride. The concentration detected in 2022 will be compared with the values found in the next years to assess the growing rate. This is a long-term investigation that should be continued for decades, by repeating the chemical analyses every year or two, but always strictly at the same time of day and same season to avoid misinterpretations due to the daily and seasonal cycles.
3. The Classroom Case Study
3.1. Data Analysis of the Classroom
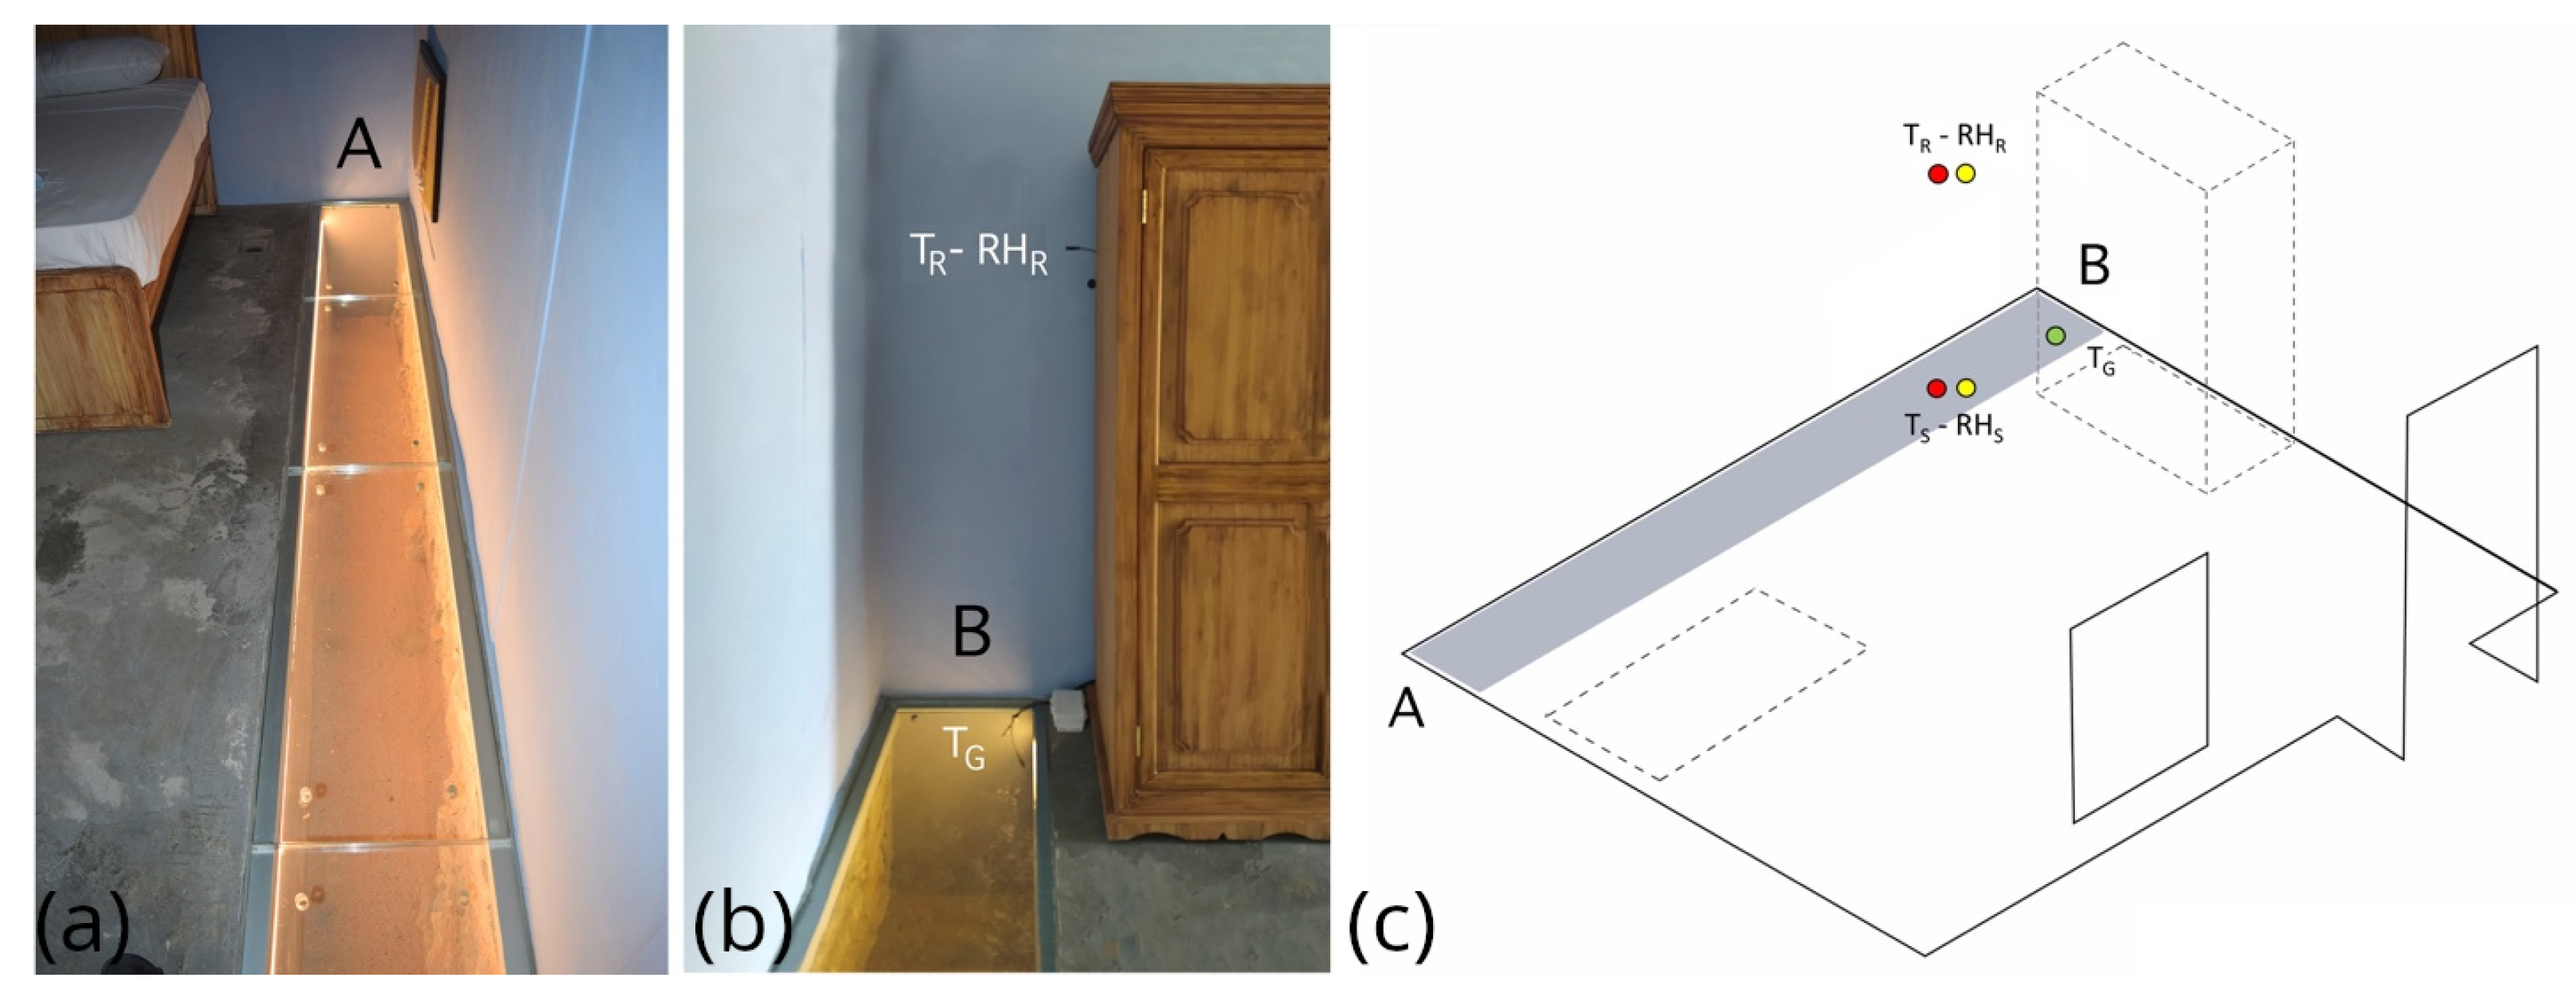
3.1.1. Location of Sensors in the Classroom
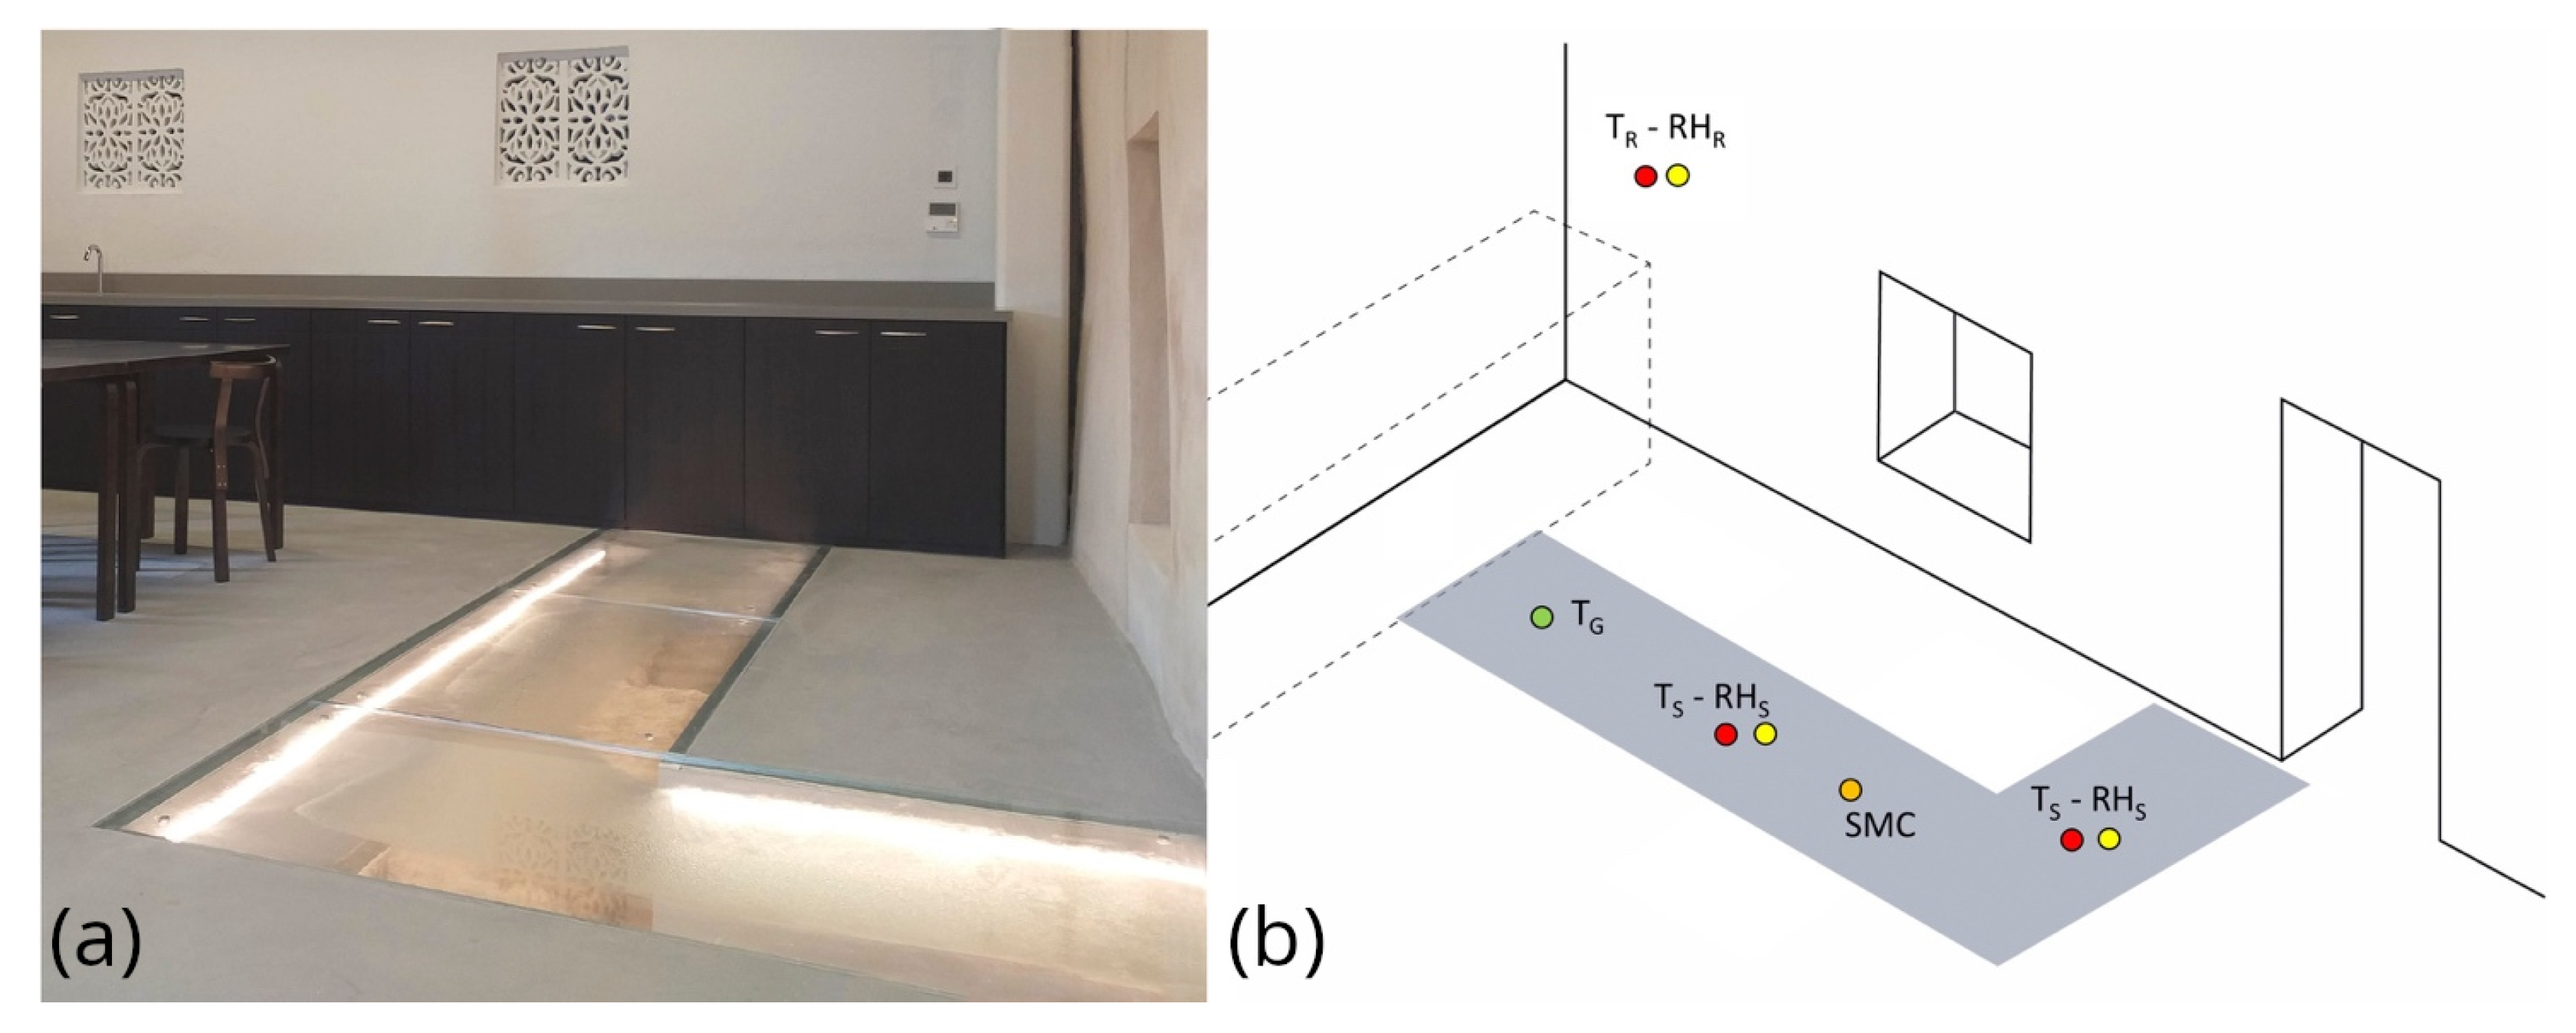
In the Classroom, the showcase is L-shaped and is topped by three glass panes. On the external size, the two wings have a length of 365 cm and 188 cm; a width of 89 cm; depth of 44 cm. The location of sensors is shown in
Figure 4. A pair of combined
sensors was installed on the wall to monitor the room climate. The sensor of the glass pane temperature
was fixed on the lower side of the pane, where condensation occurs. Two
pairs were positioned inside the showcase. The sensor of soil moisture content
was inserted into the ground close to the archaeological remains.
3.1.2. Soil Moisture Content
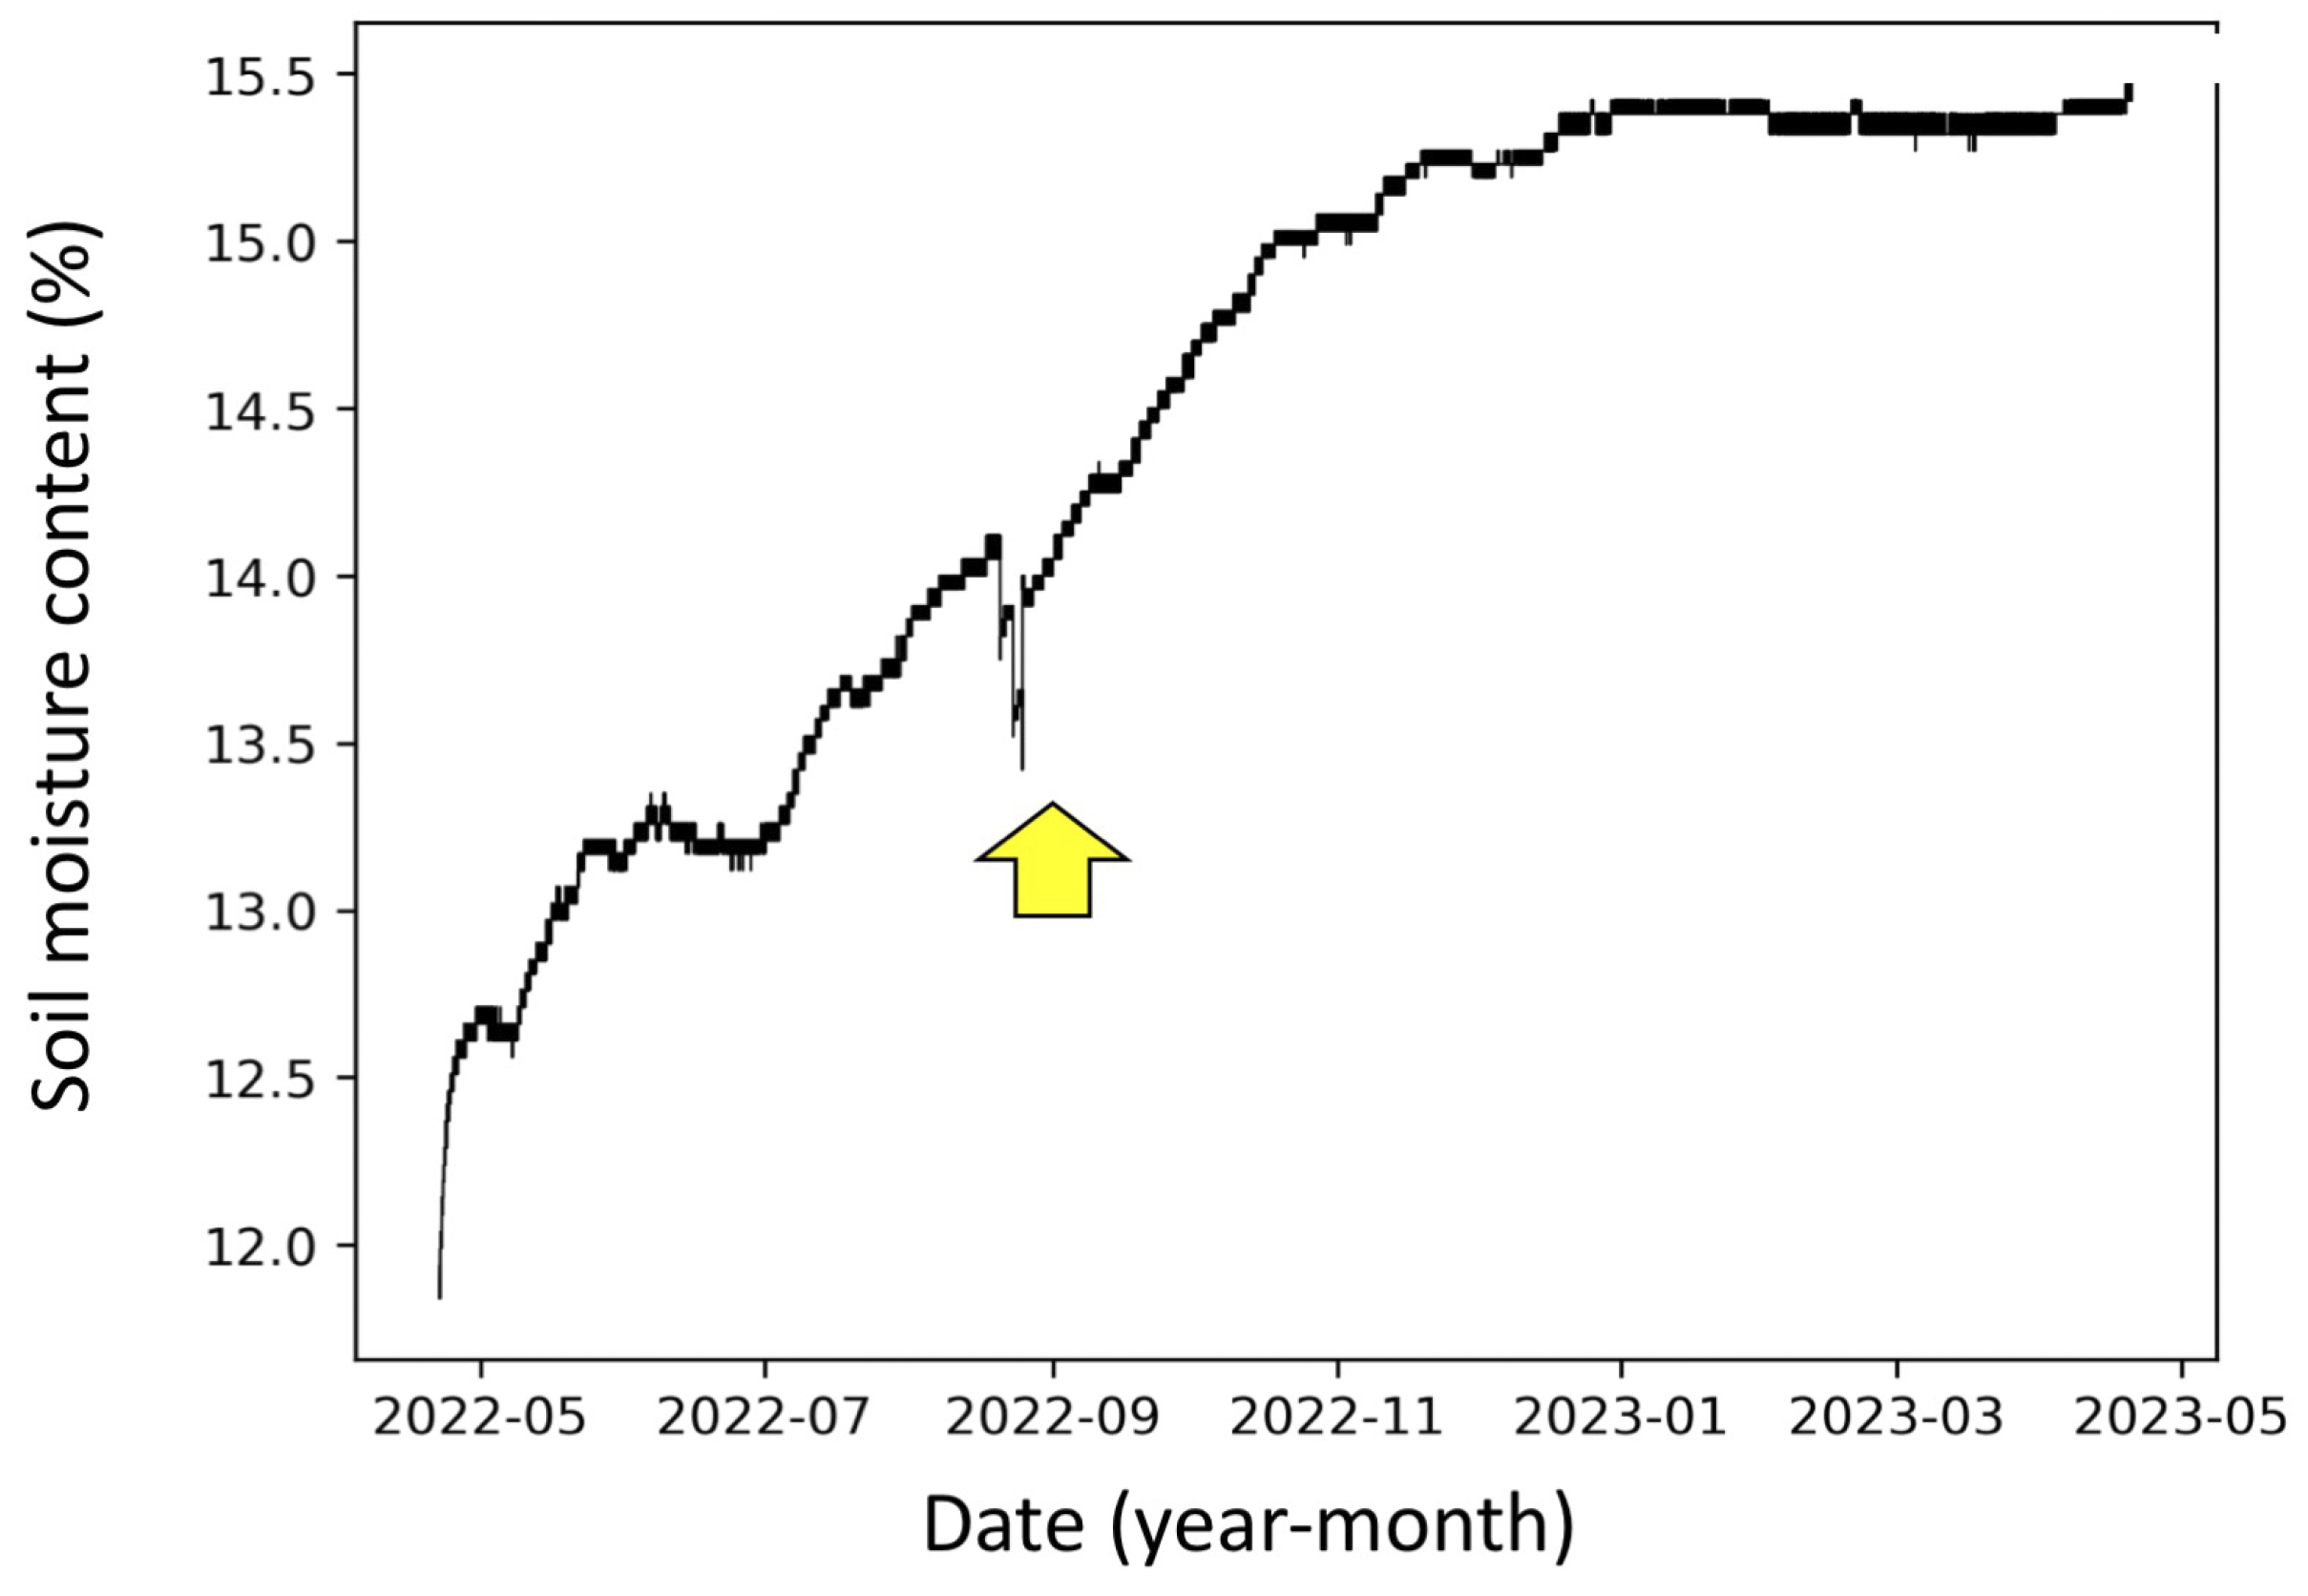
In the Classroom, the glass misting is frequent, and a possible explanation that had to be verified is whether the external plant watering causes an underground percolation of water that reaches the open bottom of the showcase and then evaporates from the remains, causing the condensation on the glass pane. This hypothesis is justified because some flowerbeds with small plants and a tree are located near the building, and when they are watered, some water may reach the archaeological remains. Therefore, a simple soil moisture sensor can provide an answer: if the cause is underground water percolation, this should be recognizable from the record, where moisture peaks should be related to the glass misting and the plant watering, although with some delay for the distance. However, the plot of the soil moisture content (
Figure 5) shows no peaks, but an increasing trend over 2022; it stabilized in 2023. On the 20–25 August, a sharp drop is visible (arrow) for some works that have required the removal of the glass panes. This homogeneous trend excludes the hypothesis that the glass misting in this room is directly related to single episodes of infiltration and percolation of external water. The general increase followed by a plateau may suggest that the plant watering has caused an average (small) increase in the moisture content in the surrounding area in 2022 when the green areas were created.
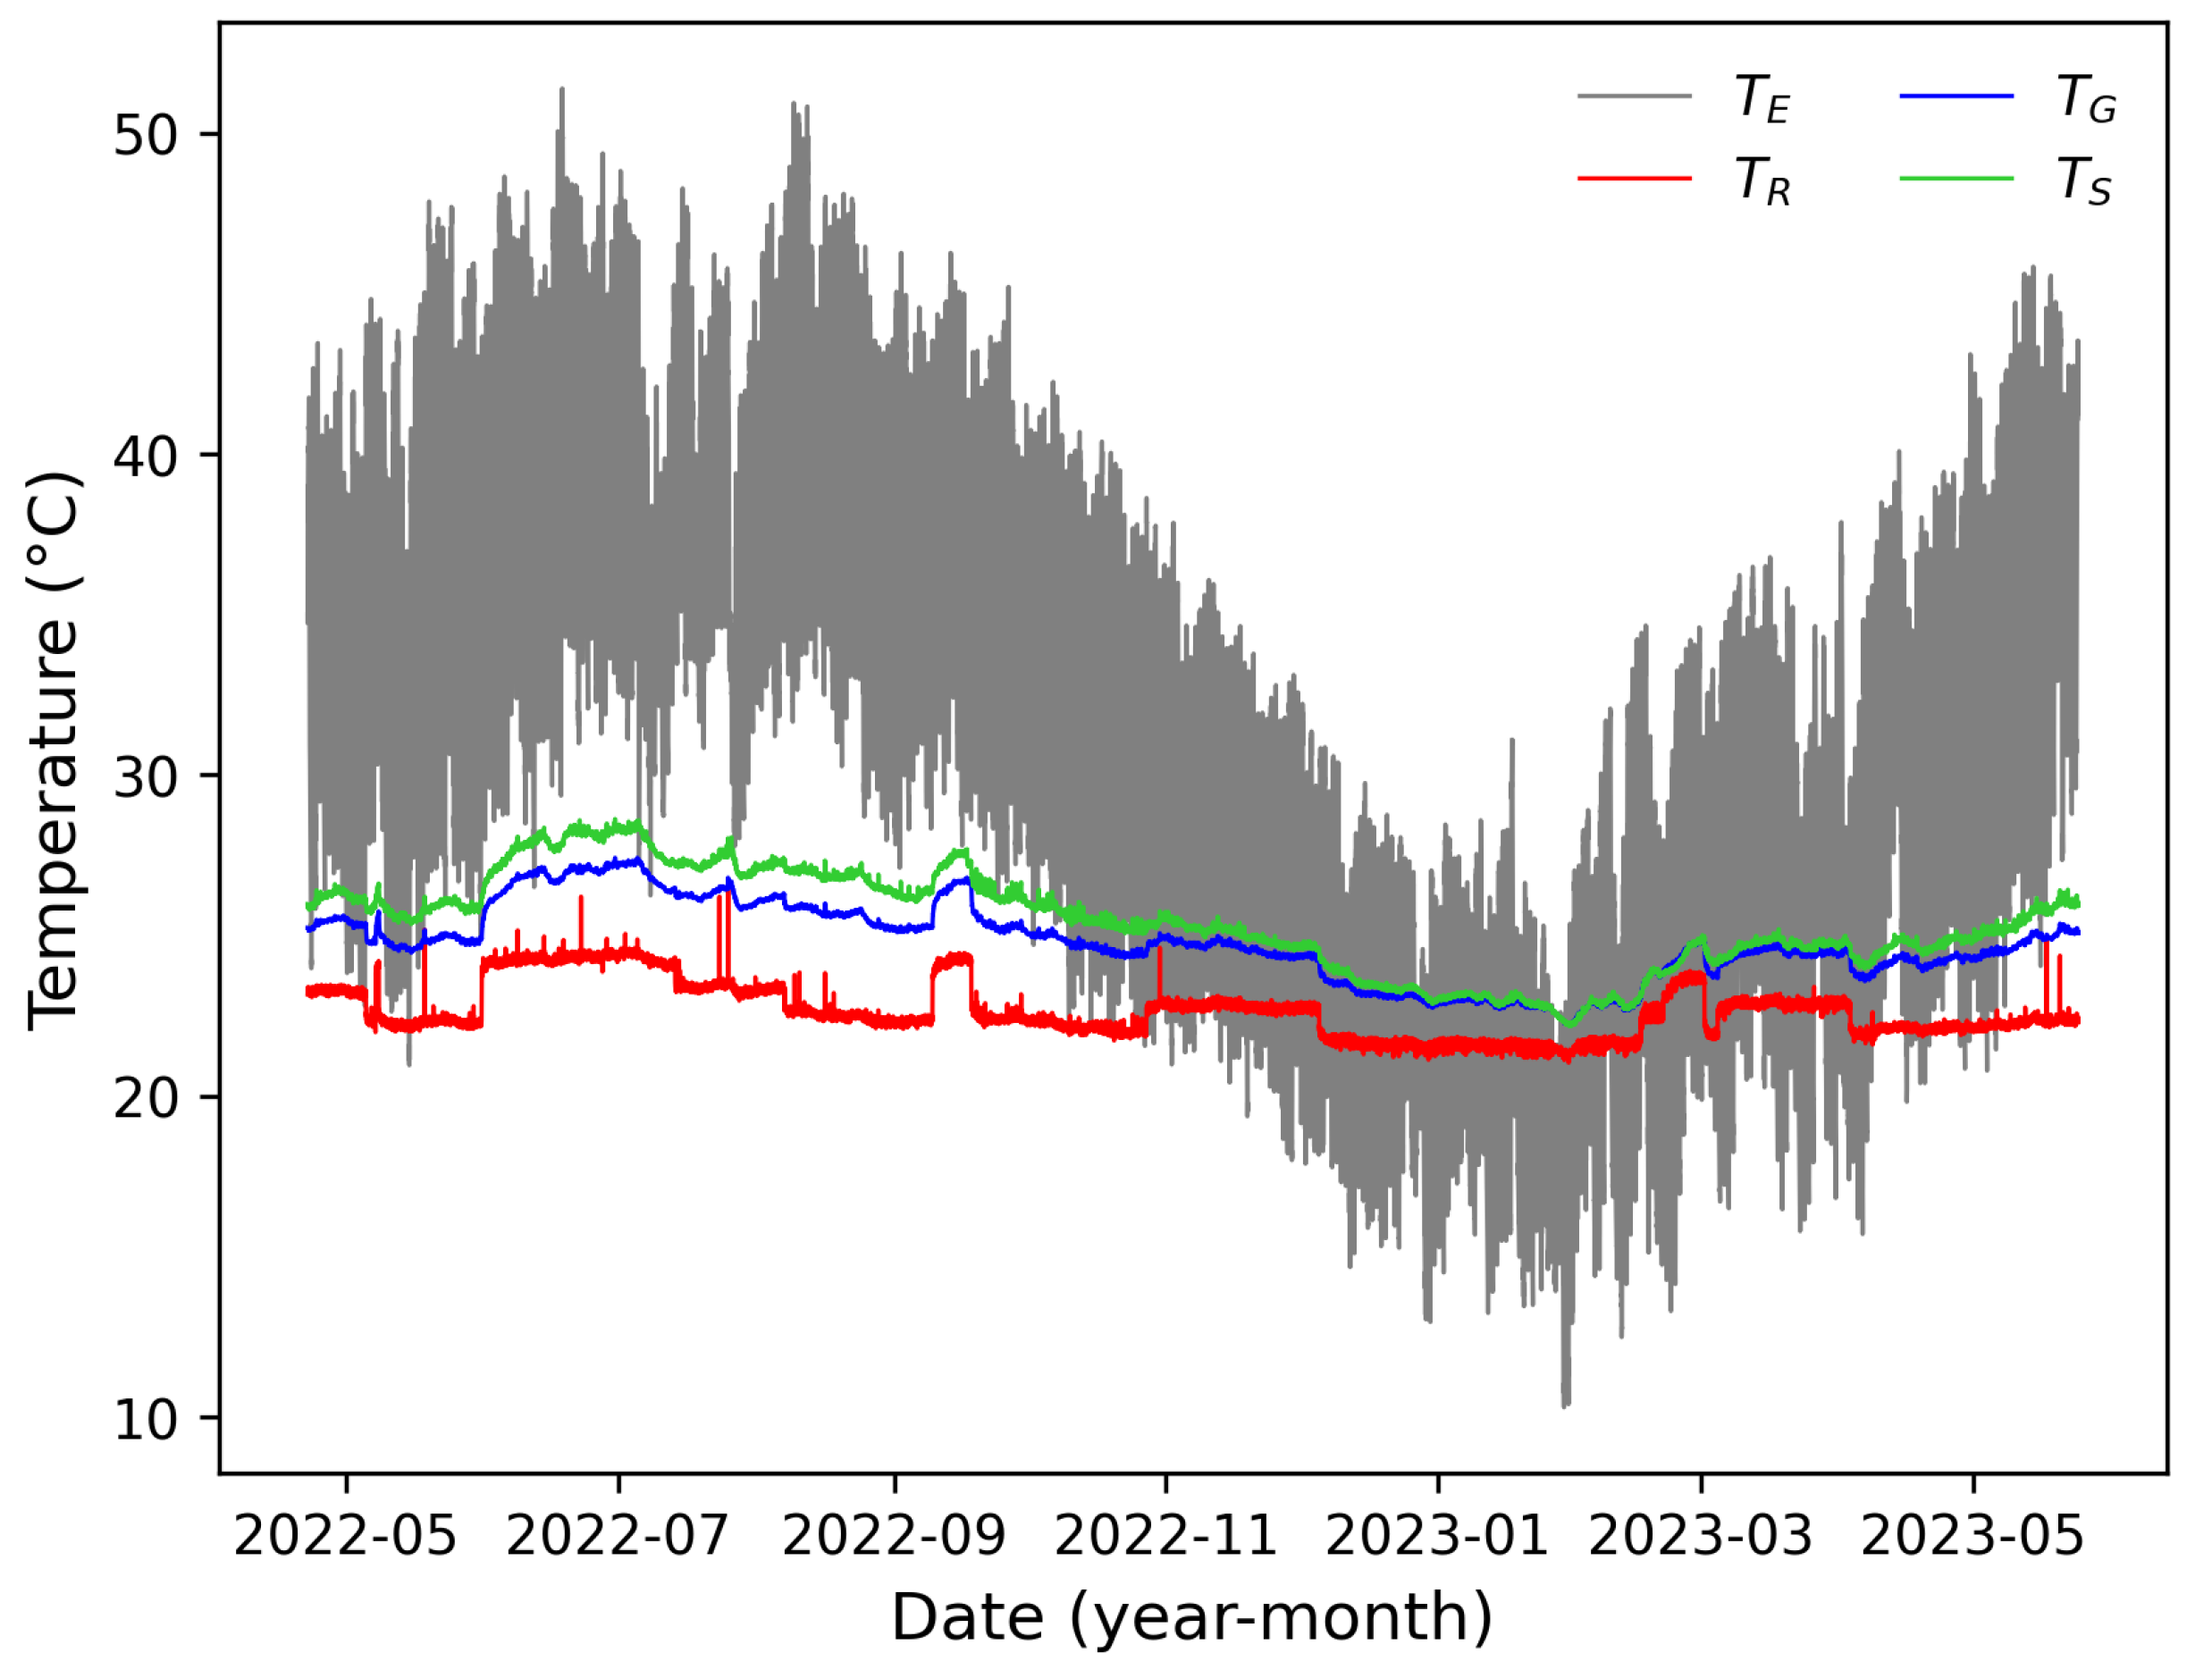
3.1.3. Temperature
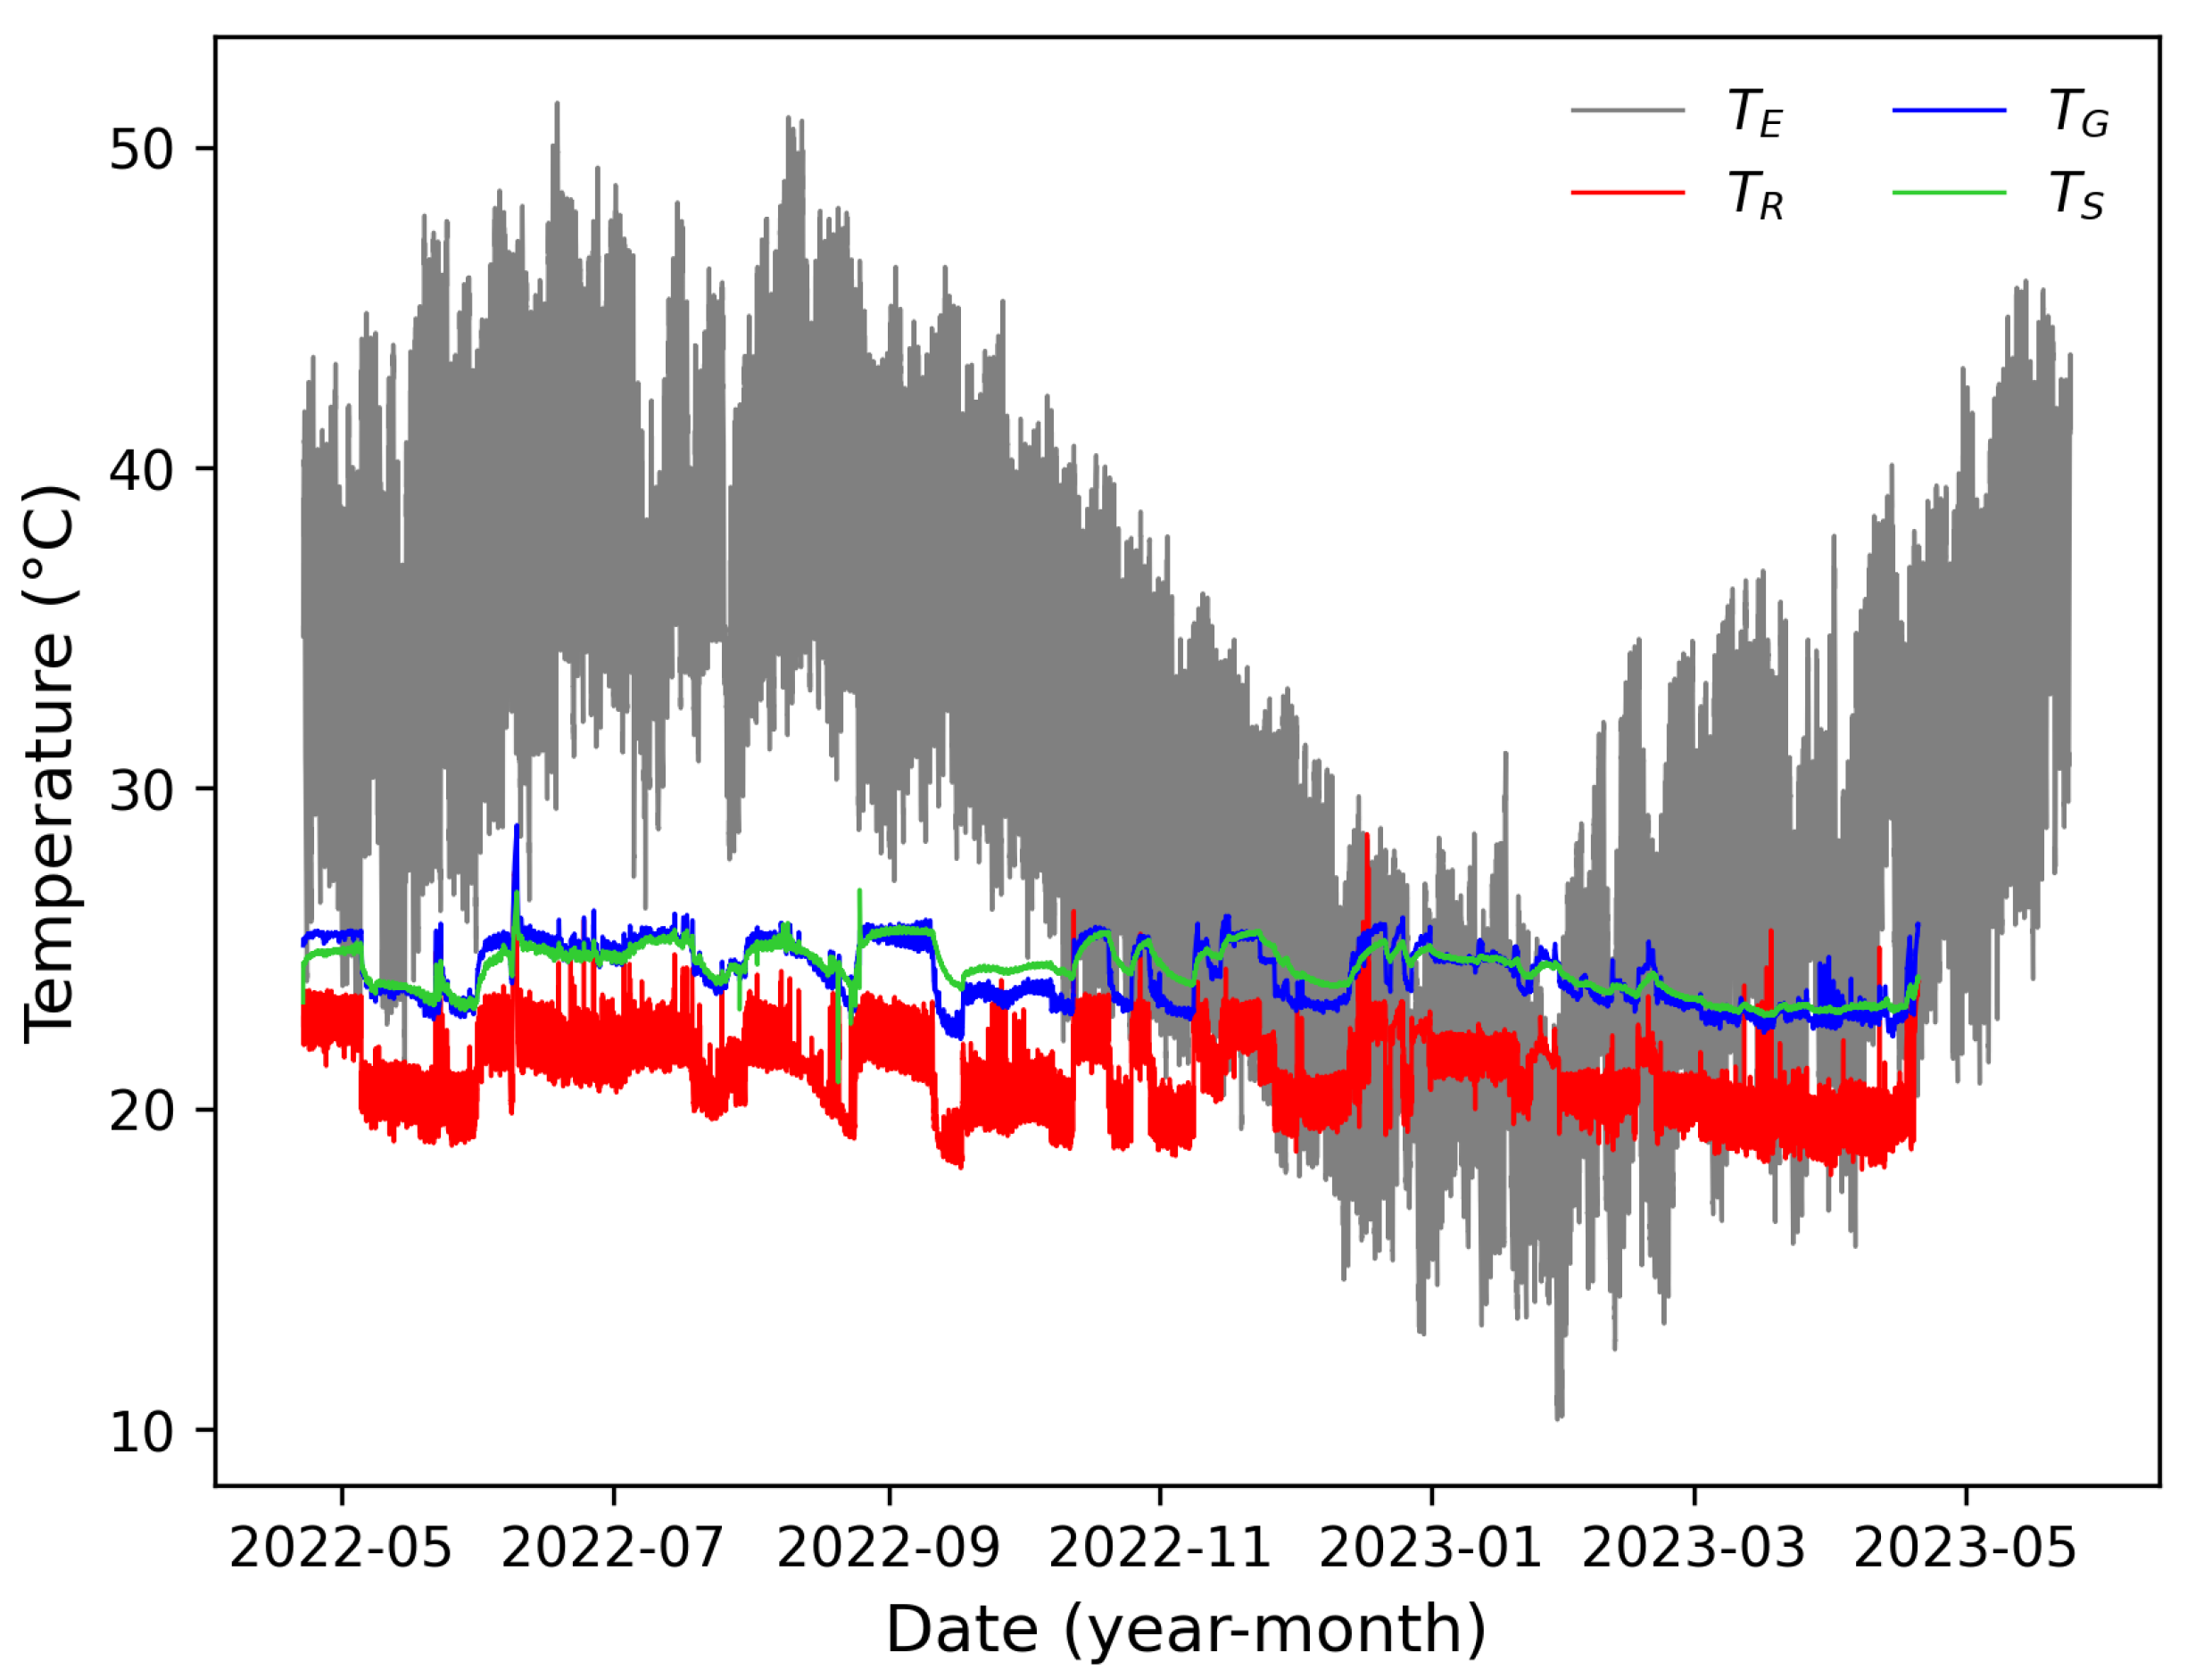
During this campaign, the temperatures directly or indirectly related to the Classroom are reported in
Figure 6.
The external temperature followed an annual cycle that, on average, lies between 22 °C and 40 °C, with the mode around 35 °C. The annual extremes reach 10 °C and 50 °C. The amplitude of daily cycles (i.e., ) is from 10° to 15 °C.
The room temperature generally lies between 18° and 24 °C, with levels established by the setting points of the HVAC. Some short peaks should be attributed to use, for example, temporary air exchanges due to the opening of doors or windows, or interruptions of the HVAC.
The glass pane temperature lies between 22° and 26 °C and is determined by the heat exchanges between the embedded showcase volume (that is a bit warmer) and the room temperature.
The showcase temperature is in strict equilibrium with the glass panes, but is slightly warmer, lying between 22° and 26 °C. The record shows some temporary disturbances, due to maintenance interventions.
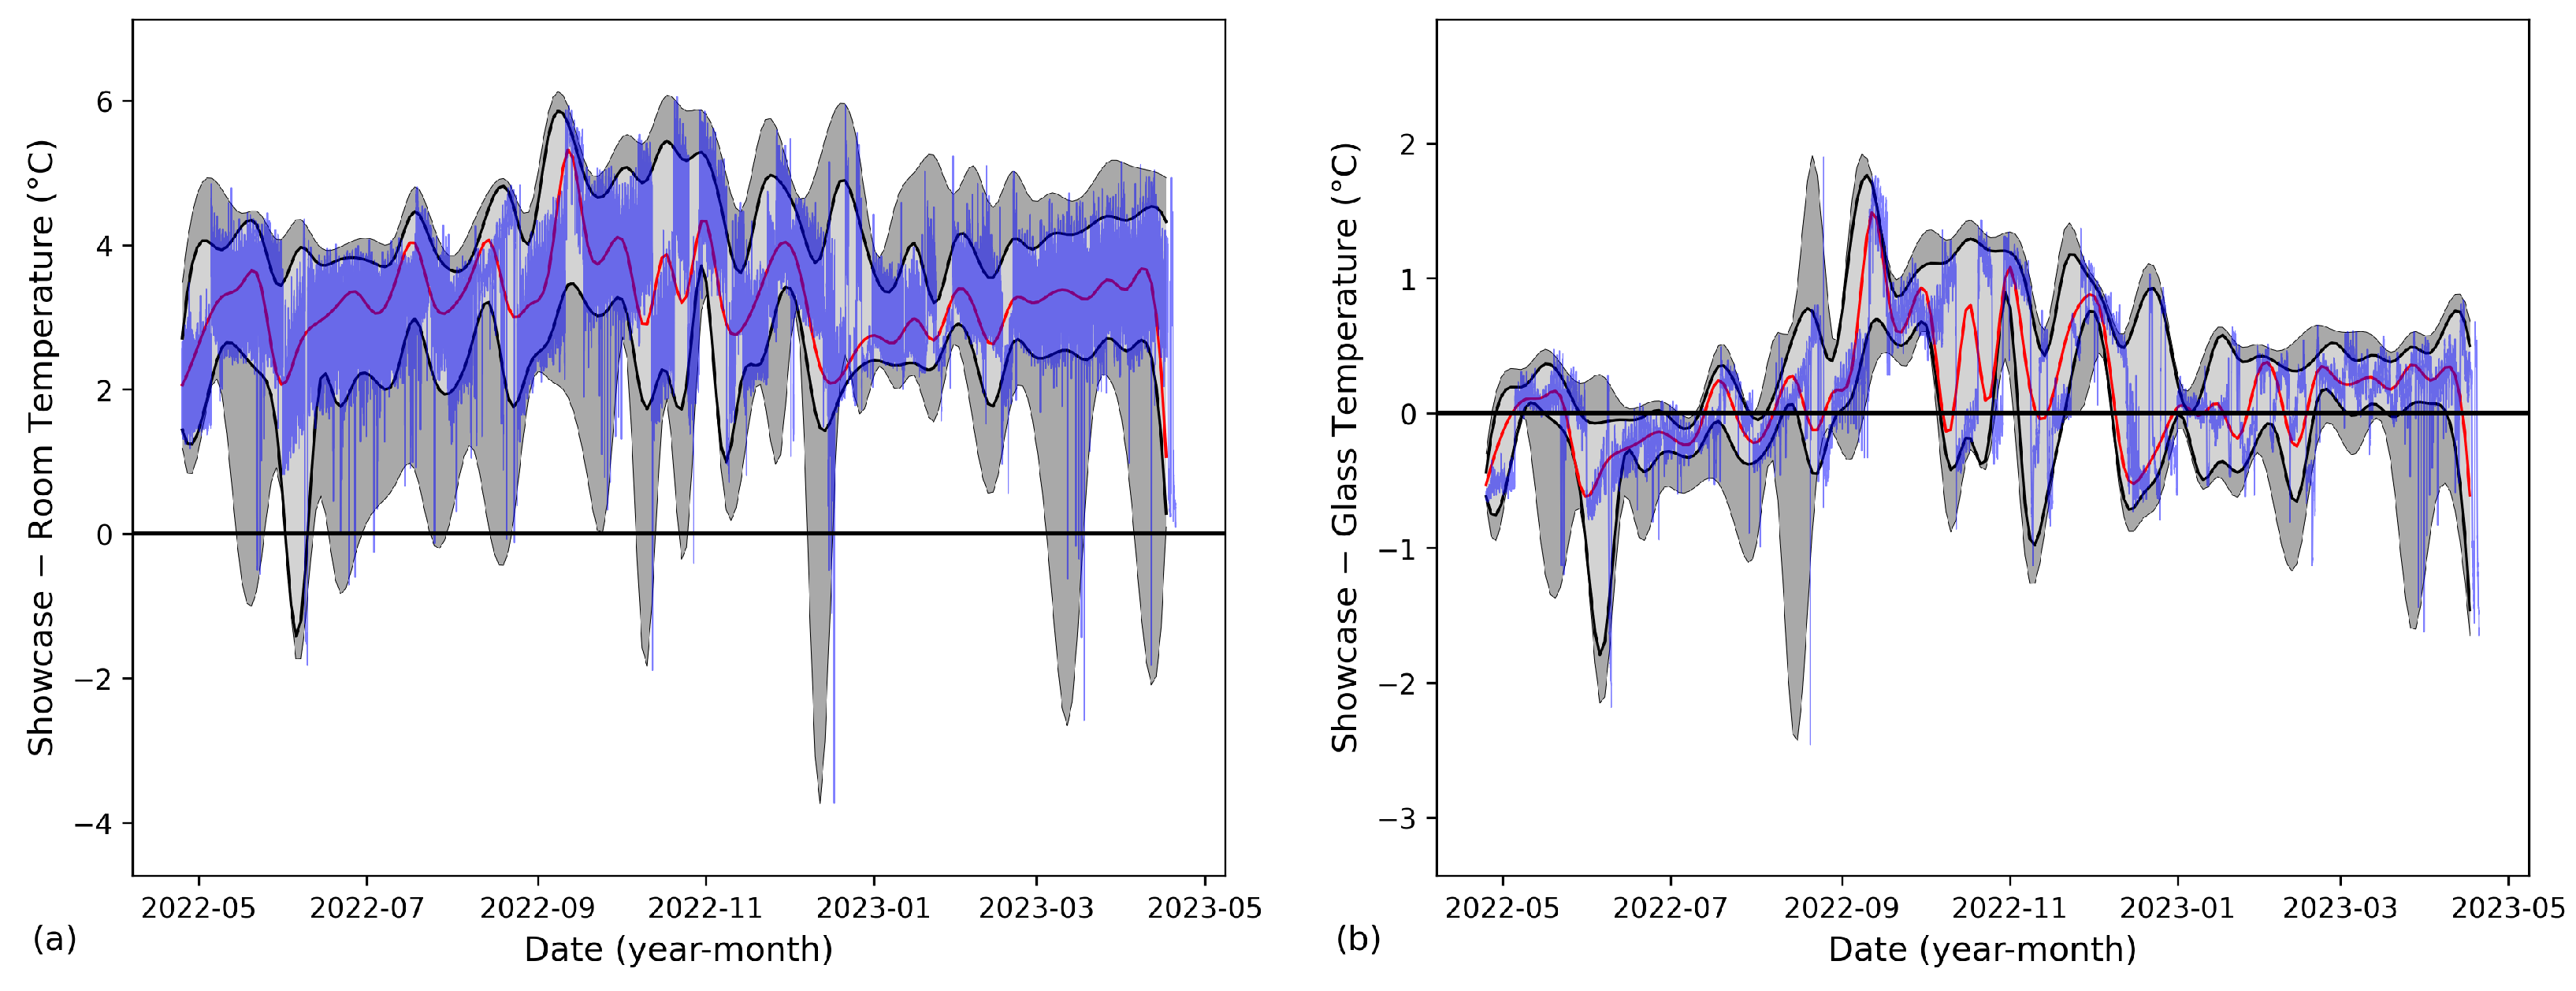
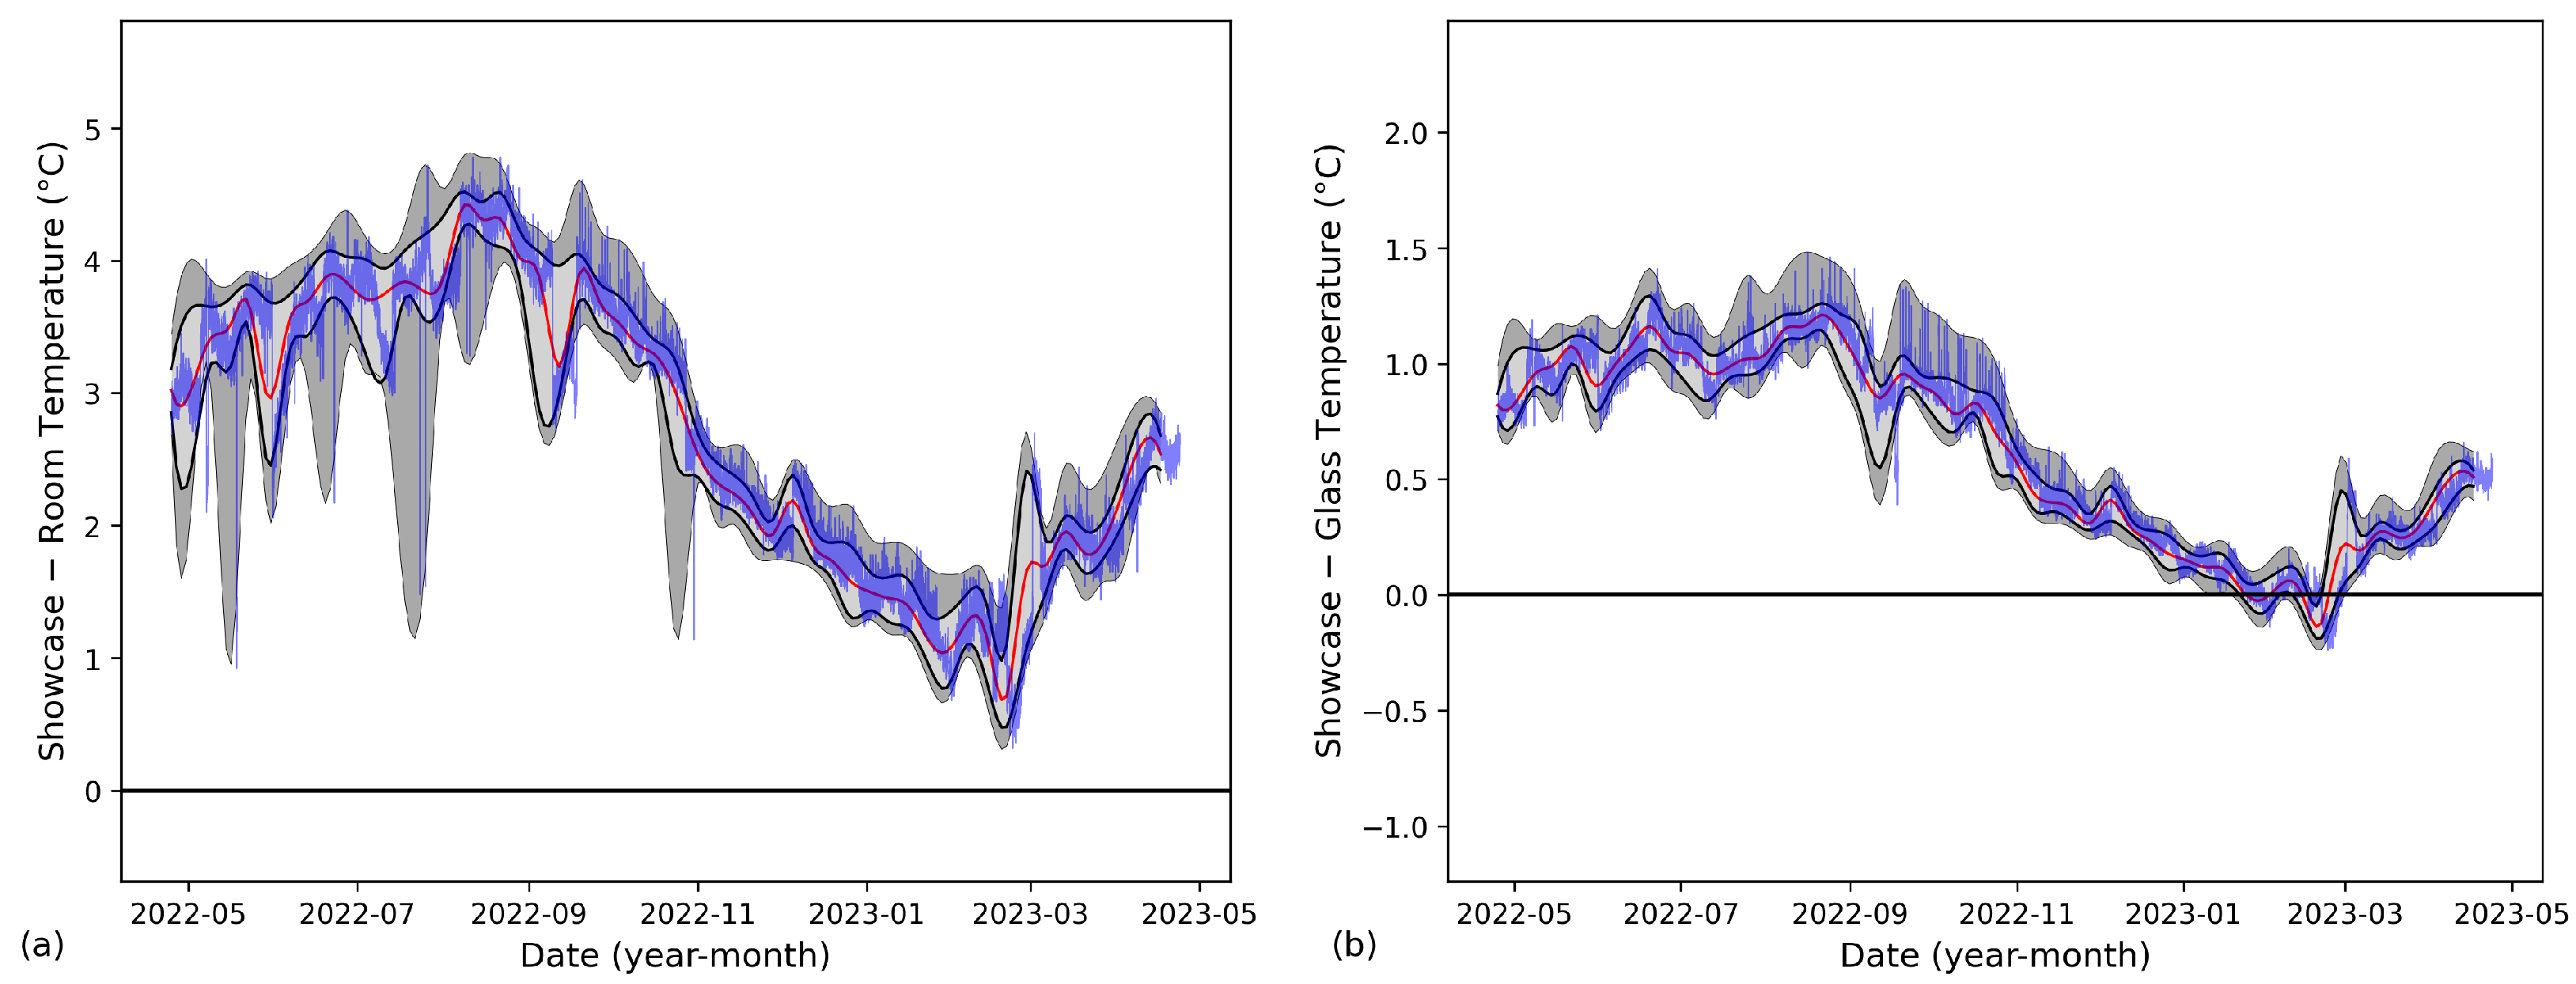
The difference between the showcase and the room temperature (
Figure 7a) shows that for the HVAC, the Classroom is permanently colder (mainly
to 5 °C) than the showcase. Negative values occur when the HVAC stops operating (e.g., during the night) and the room returns to the naturally warmer climate determined by the building envelope.
The difference between the showcase and the glass temperature
(
Figure 7b) shows that the glass panes closely follow the air temperature of the showcase; the variability is within 1 °C, with peaks reaching 2 °C. Negative values are explained as in the previous difference.
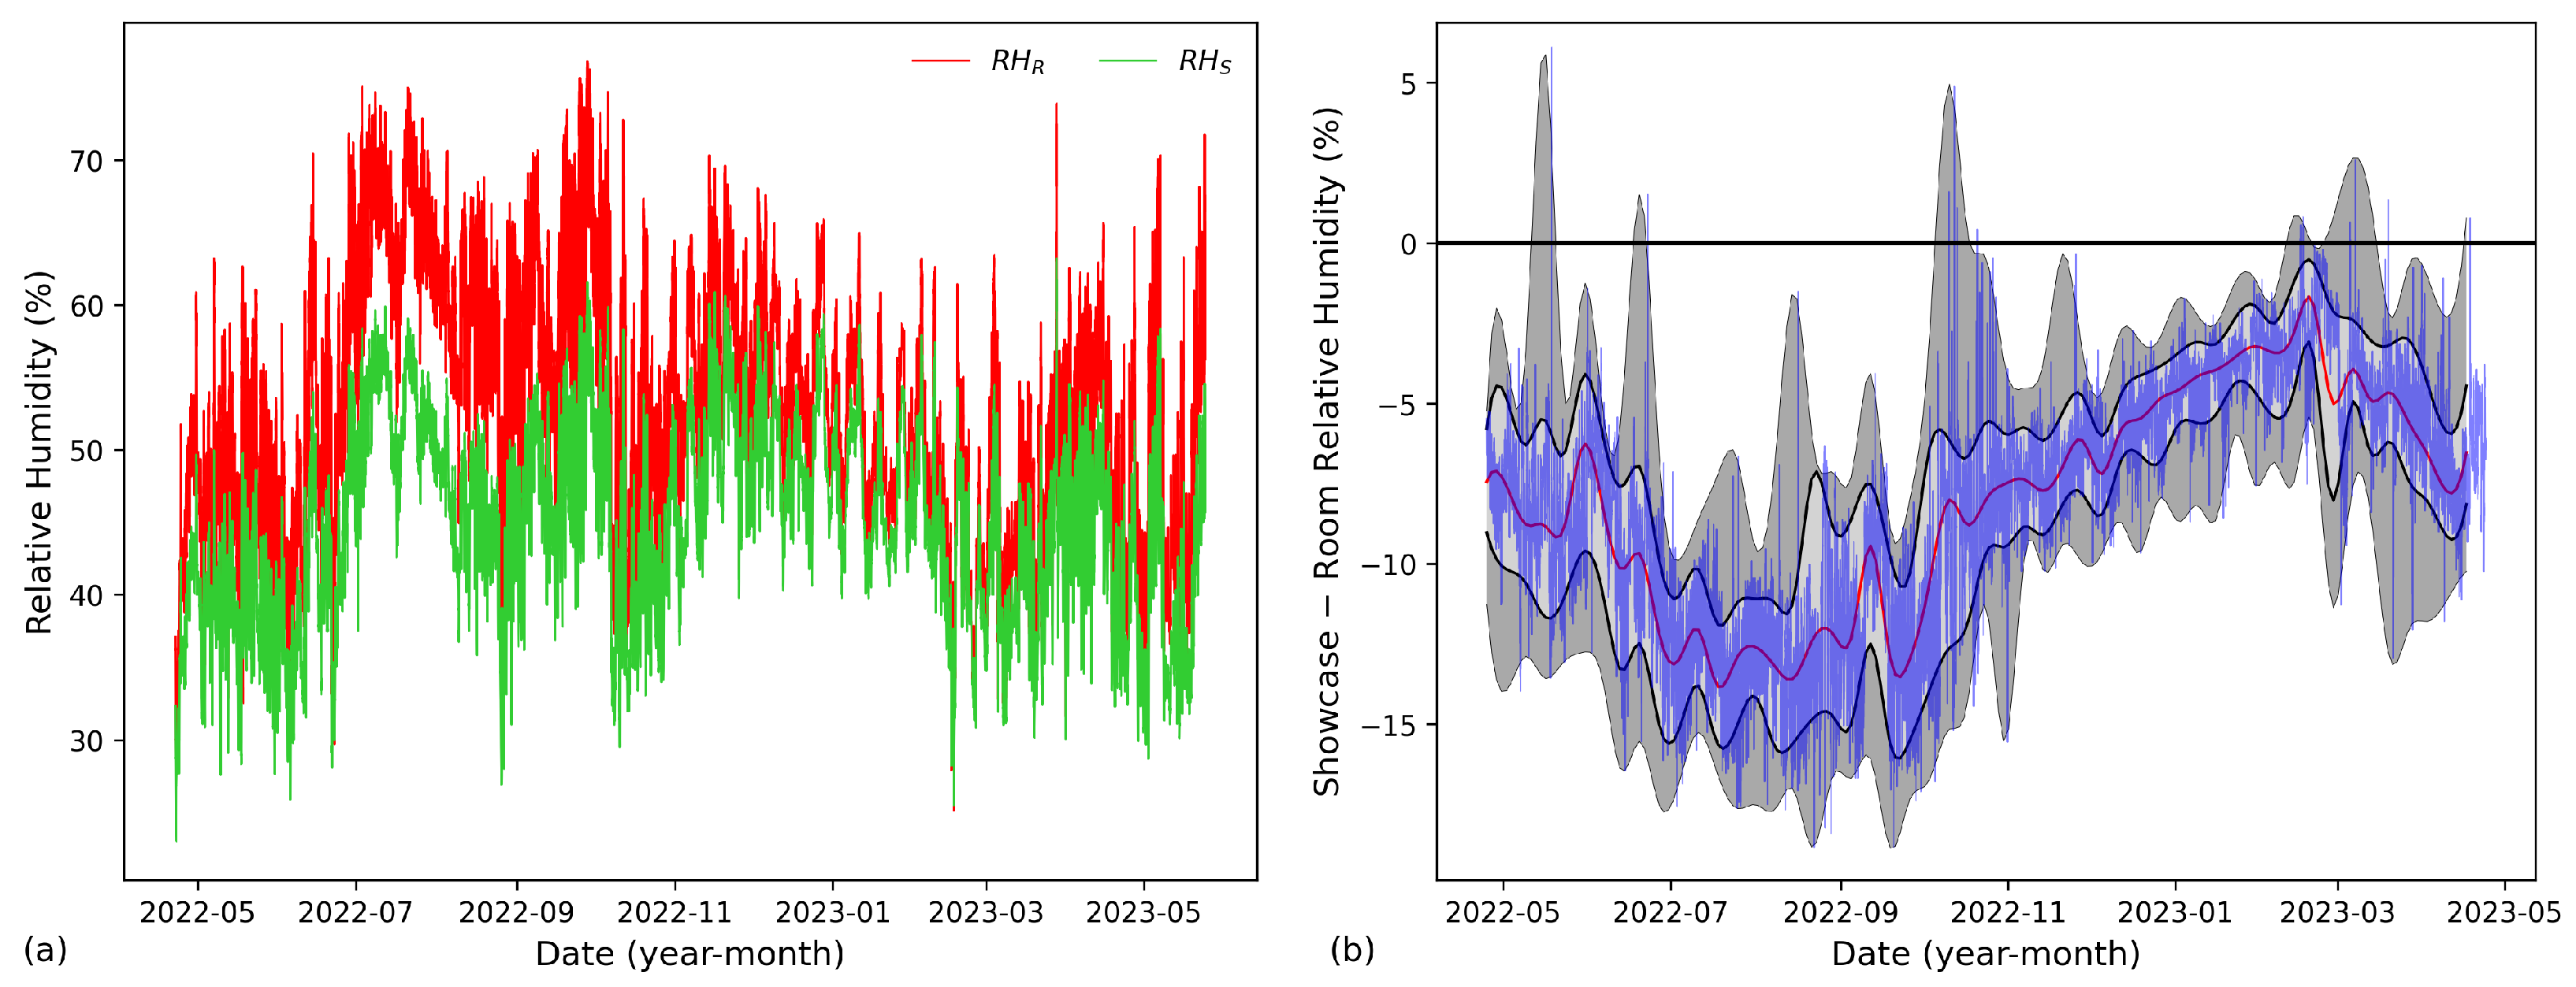
3.1.4. Relative Humidity
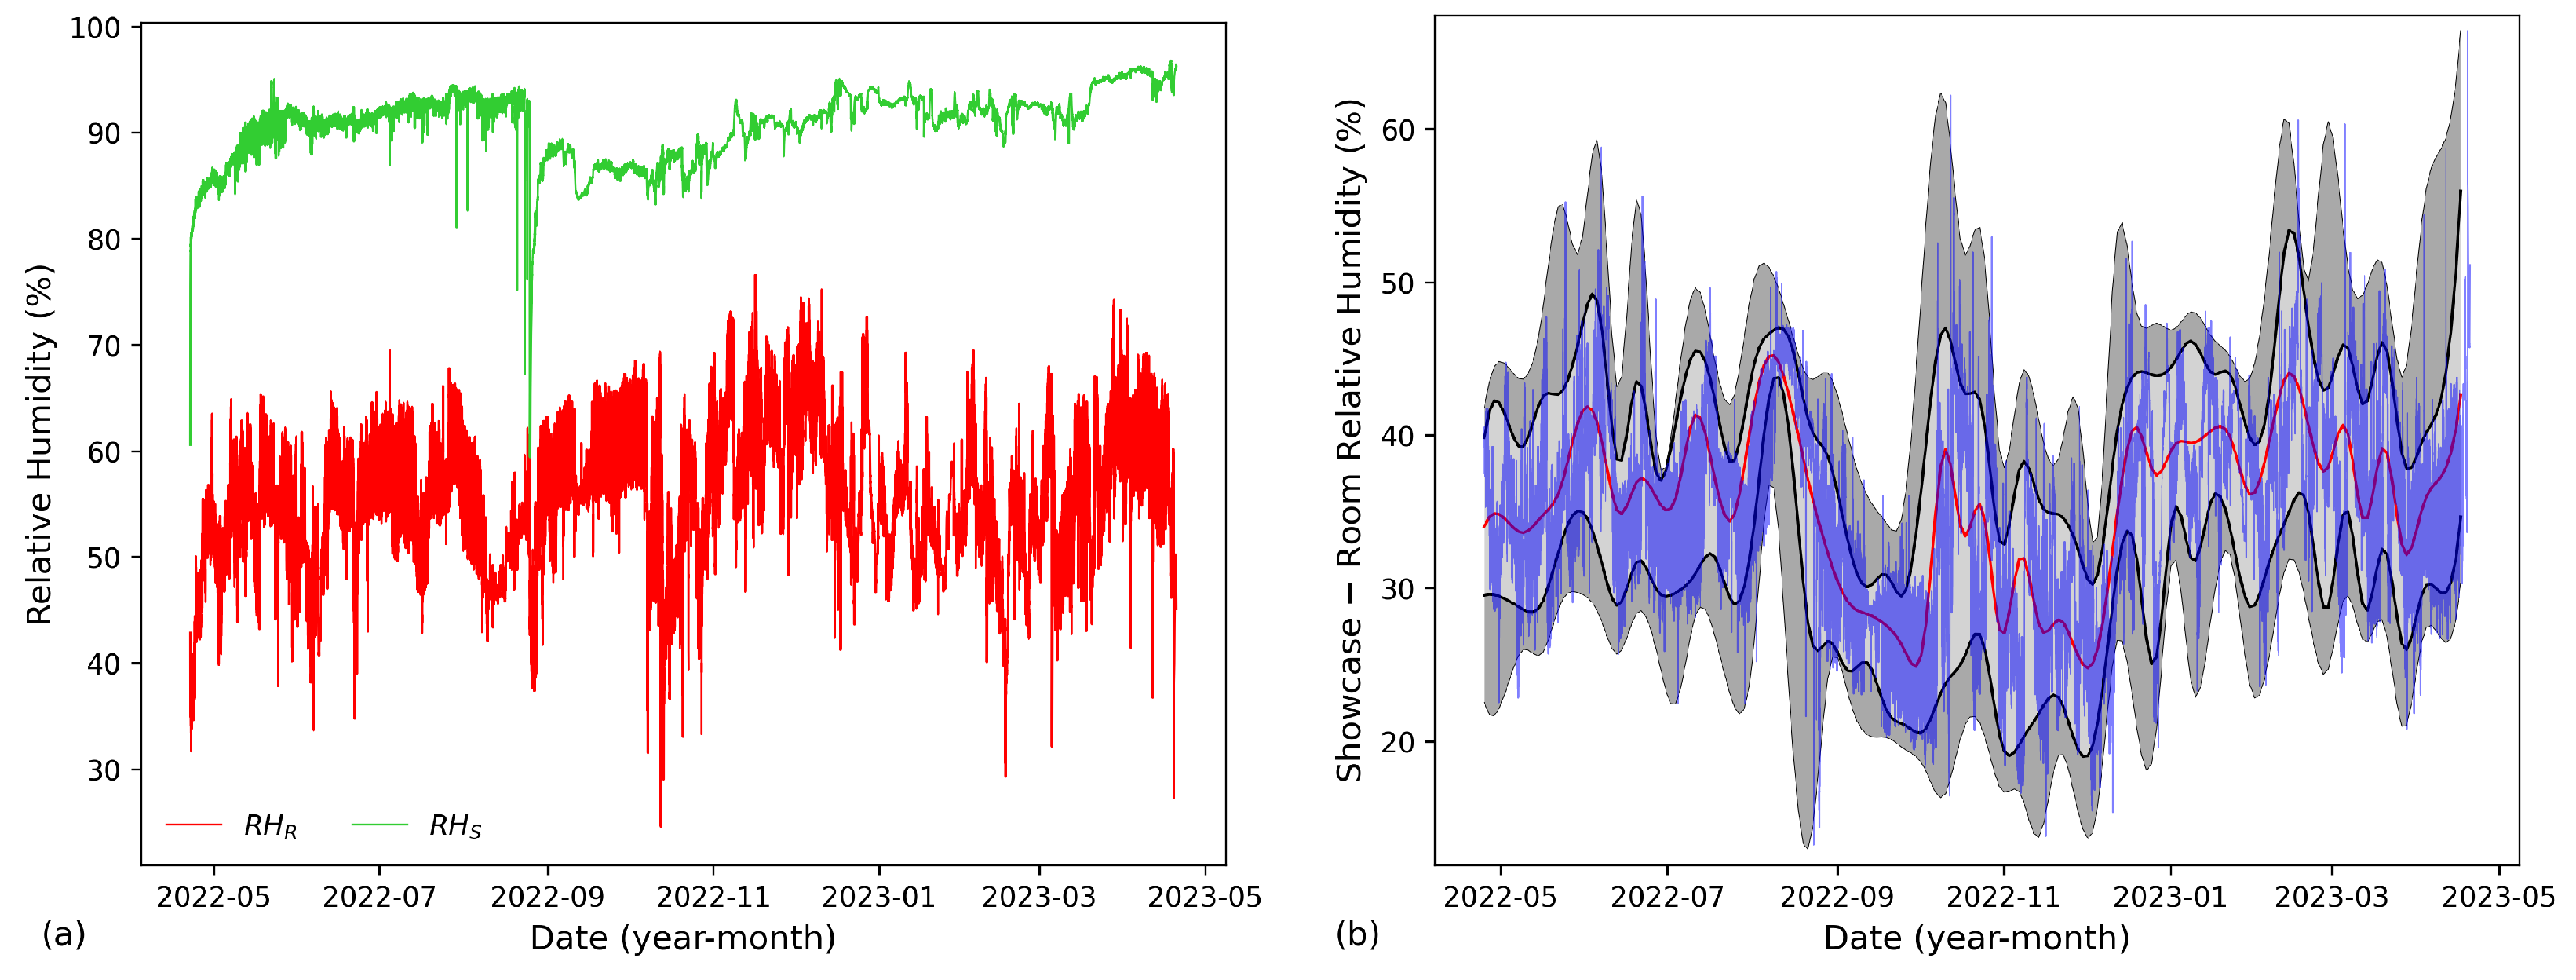
The comparison between the two relative humidities in the room and the showcase is reported in
Figure 8a. The relative humidity in the room (
) has a median of around 55% but is not strictly controlled because it is affected by large imbalances. It generally lies between 40% and 70%. However, at times, the
drops to very dry values, i.e., 20% to 30%. The relative humidity in the showcase (
) is very high, lying between 80% and 100%. In the occasion of maintenance interventions, when the topping glass panes were removed (yellow arrow in
Figure 5), the
level reached dry conditions.
The difference in relative humidity between the room and the showcase (
) (
Figure 8b) shows that, for the climate control operated by the HVAC system, the humidity level in the Classroom is permanently lower than in the showcase, i.e.,
. The difference
is highly variable, from around 20% to 50%.
3.1.5. Mixing Ratio
The mixing ratio in the room is determined by the external value and the balance with local inputs or sinks, e.g., the HVAC that supplies air at selected temperature and humidity, the presence of people who release moisture for respiration and transpiration, the masonry or other surfaces that release or absorb moisture, and air exchanges at the door or window openings [
6]. Physiological determinations found that at room temperature 25 °C and
50%, the basic rate of moisture released by a person for respiration and transpiration is around 50 g/h if the person is seated at rest, and around 160 g/h is standing ([
23,
24]).
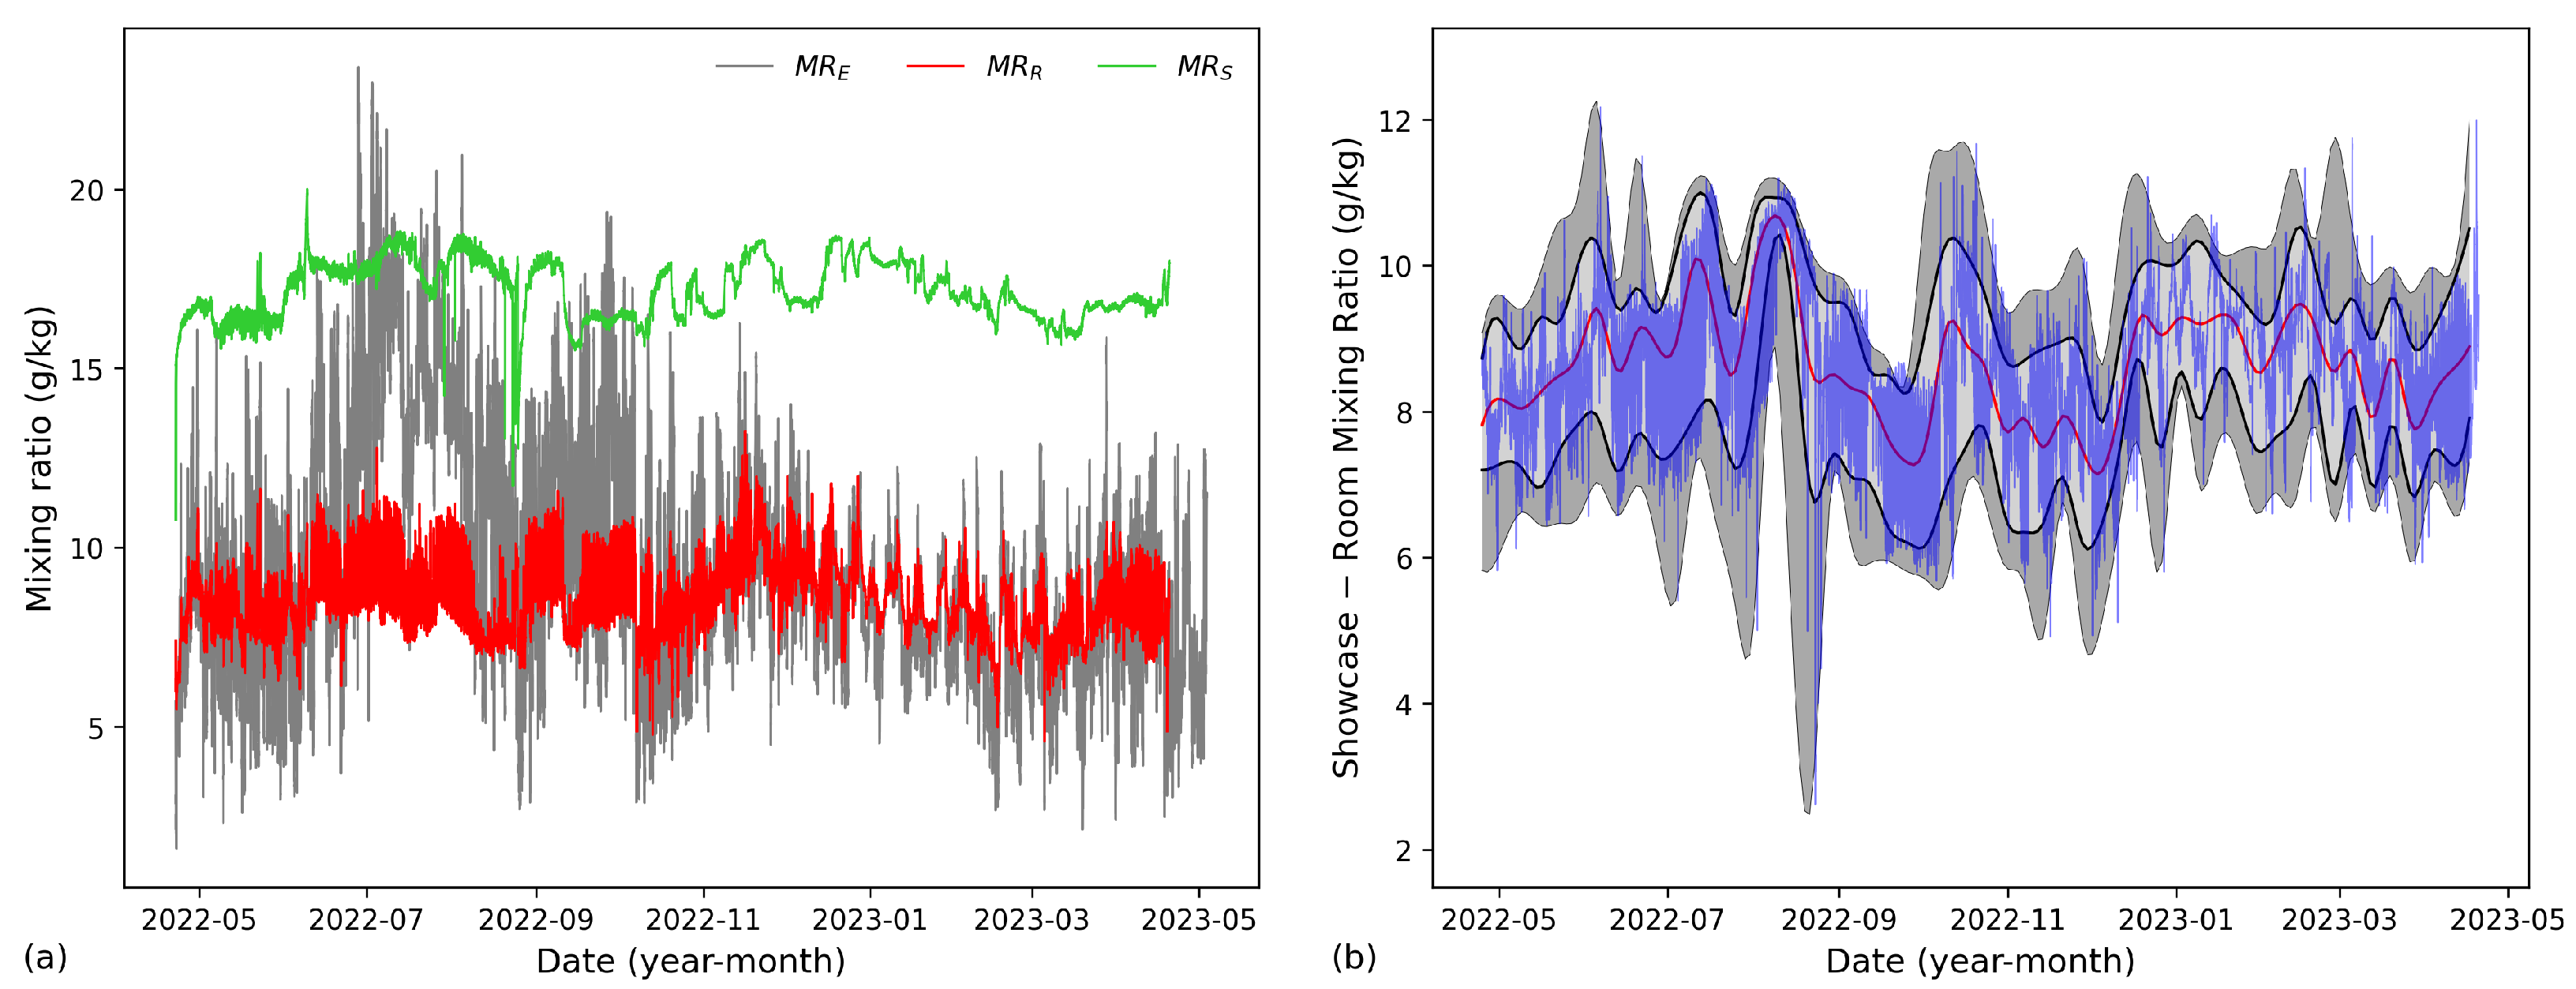
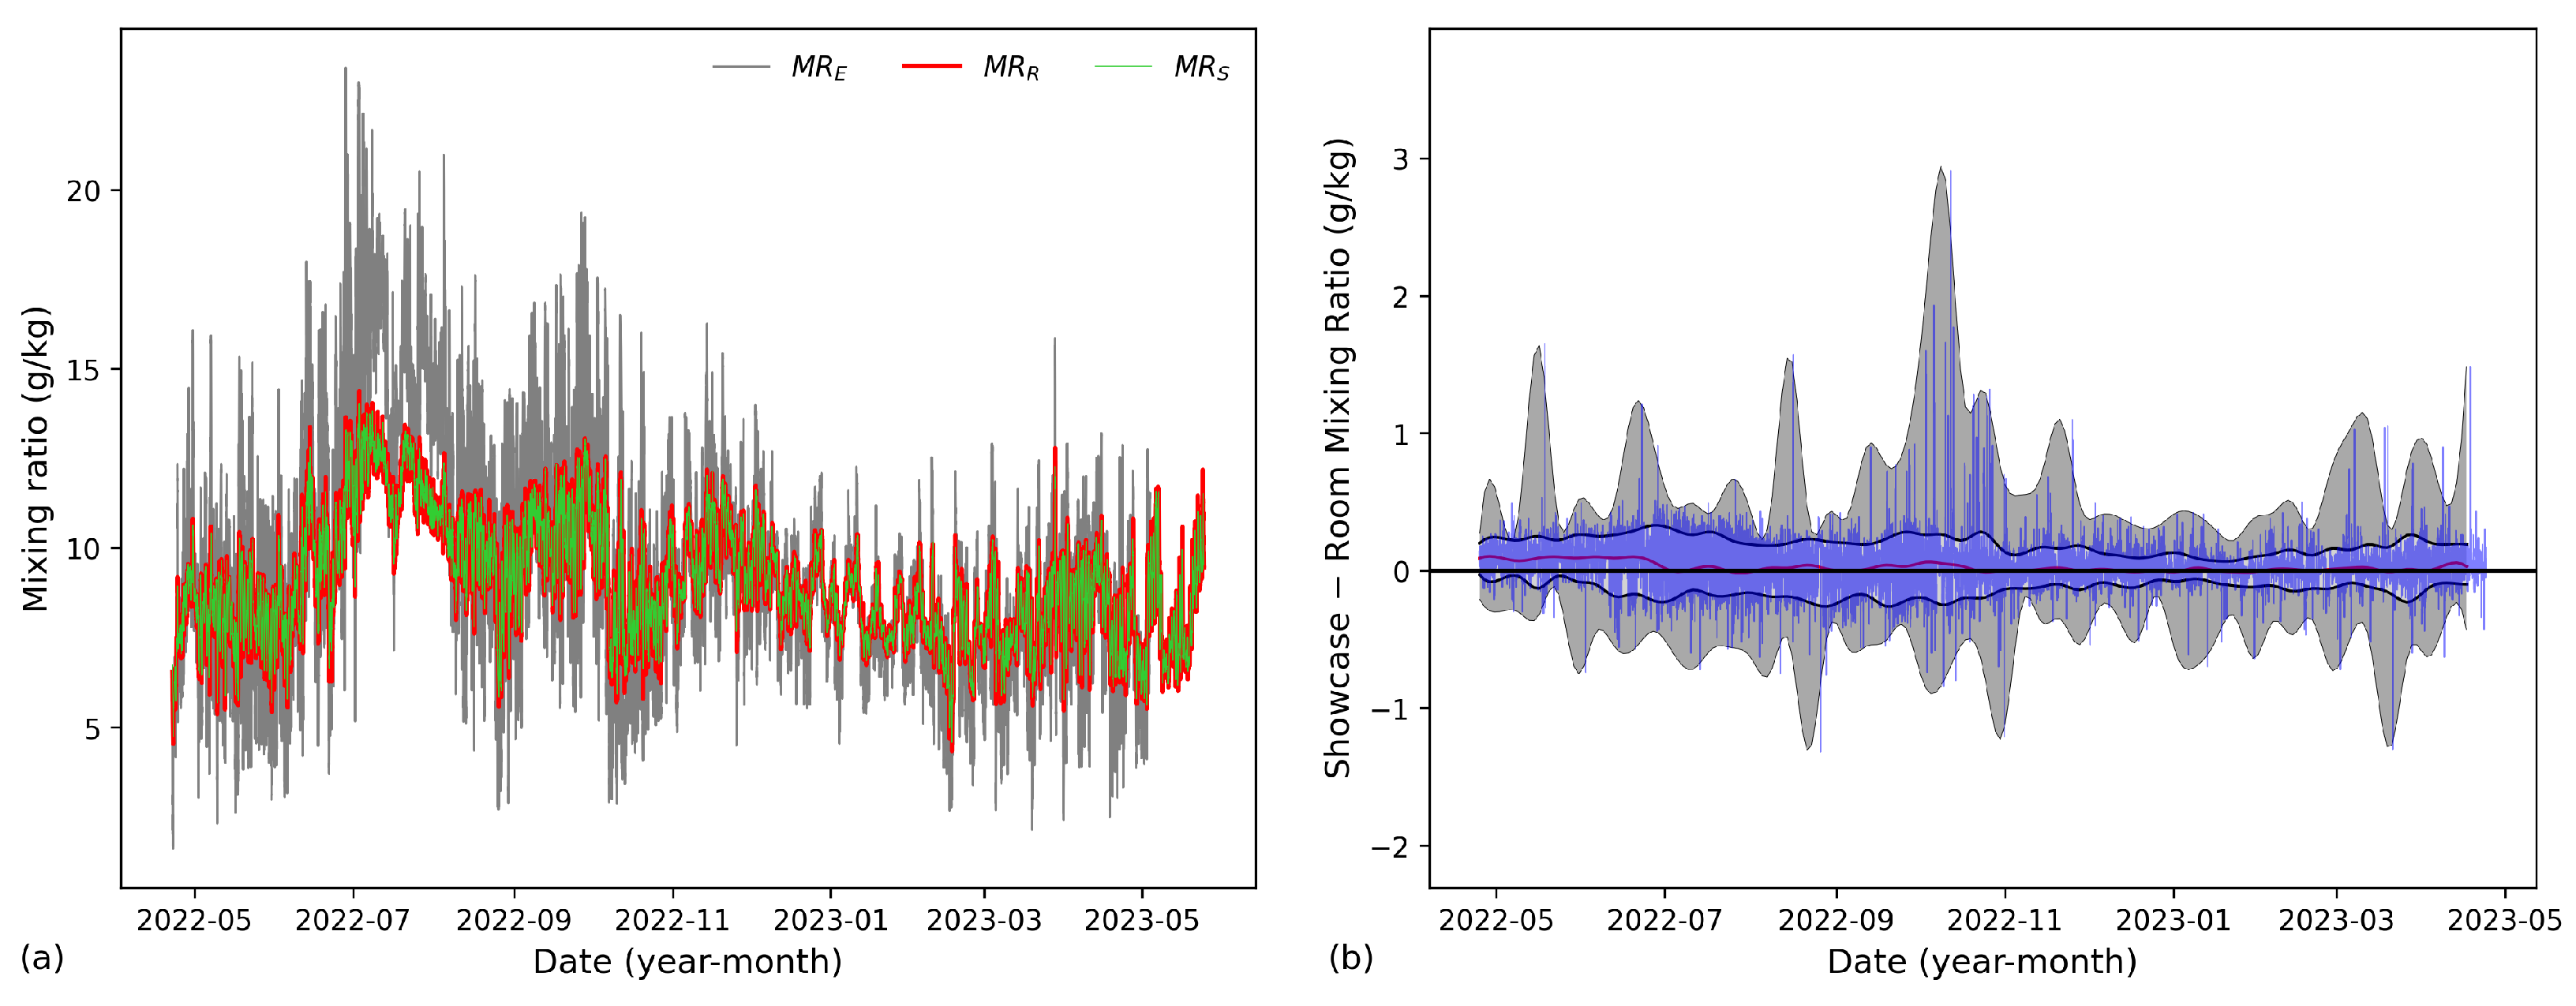
The three mixing ratios related to this showcase, i.e., external, room and showcase, are reported in
Figure 9a.
The mixing ratio measured outdoors lies between 2 and 20 g/kg, with a mode of around 8 g/kg. Similar to air temperature, the annual cycle of the reaches its highest levels in summer and its lowest in winter. The mixing ratio in the Classroom generally lies between 6 and 12 g/kg. The mixing ratio in the showcase generally lies between 15 and 19 g/kg.
The difference between the two mixing ratios, in the showcase and the room (
Figure 9b) shows that the mixing ratio is permanently higher in the showcase than in the Classroom, i.e.,
. This means that the showcase includes a source of moisture, and the only possibility is from the bottom, i.e., the archaeological remains and the surrounding ground. This confirms that the remains are fed by moisture seeping underground.
3.1.6. Glass Temperature and Misting
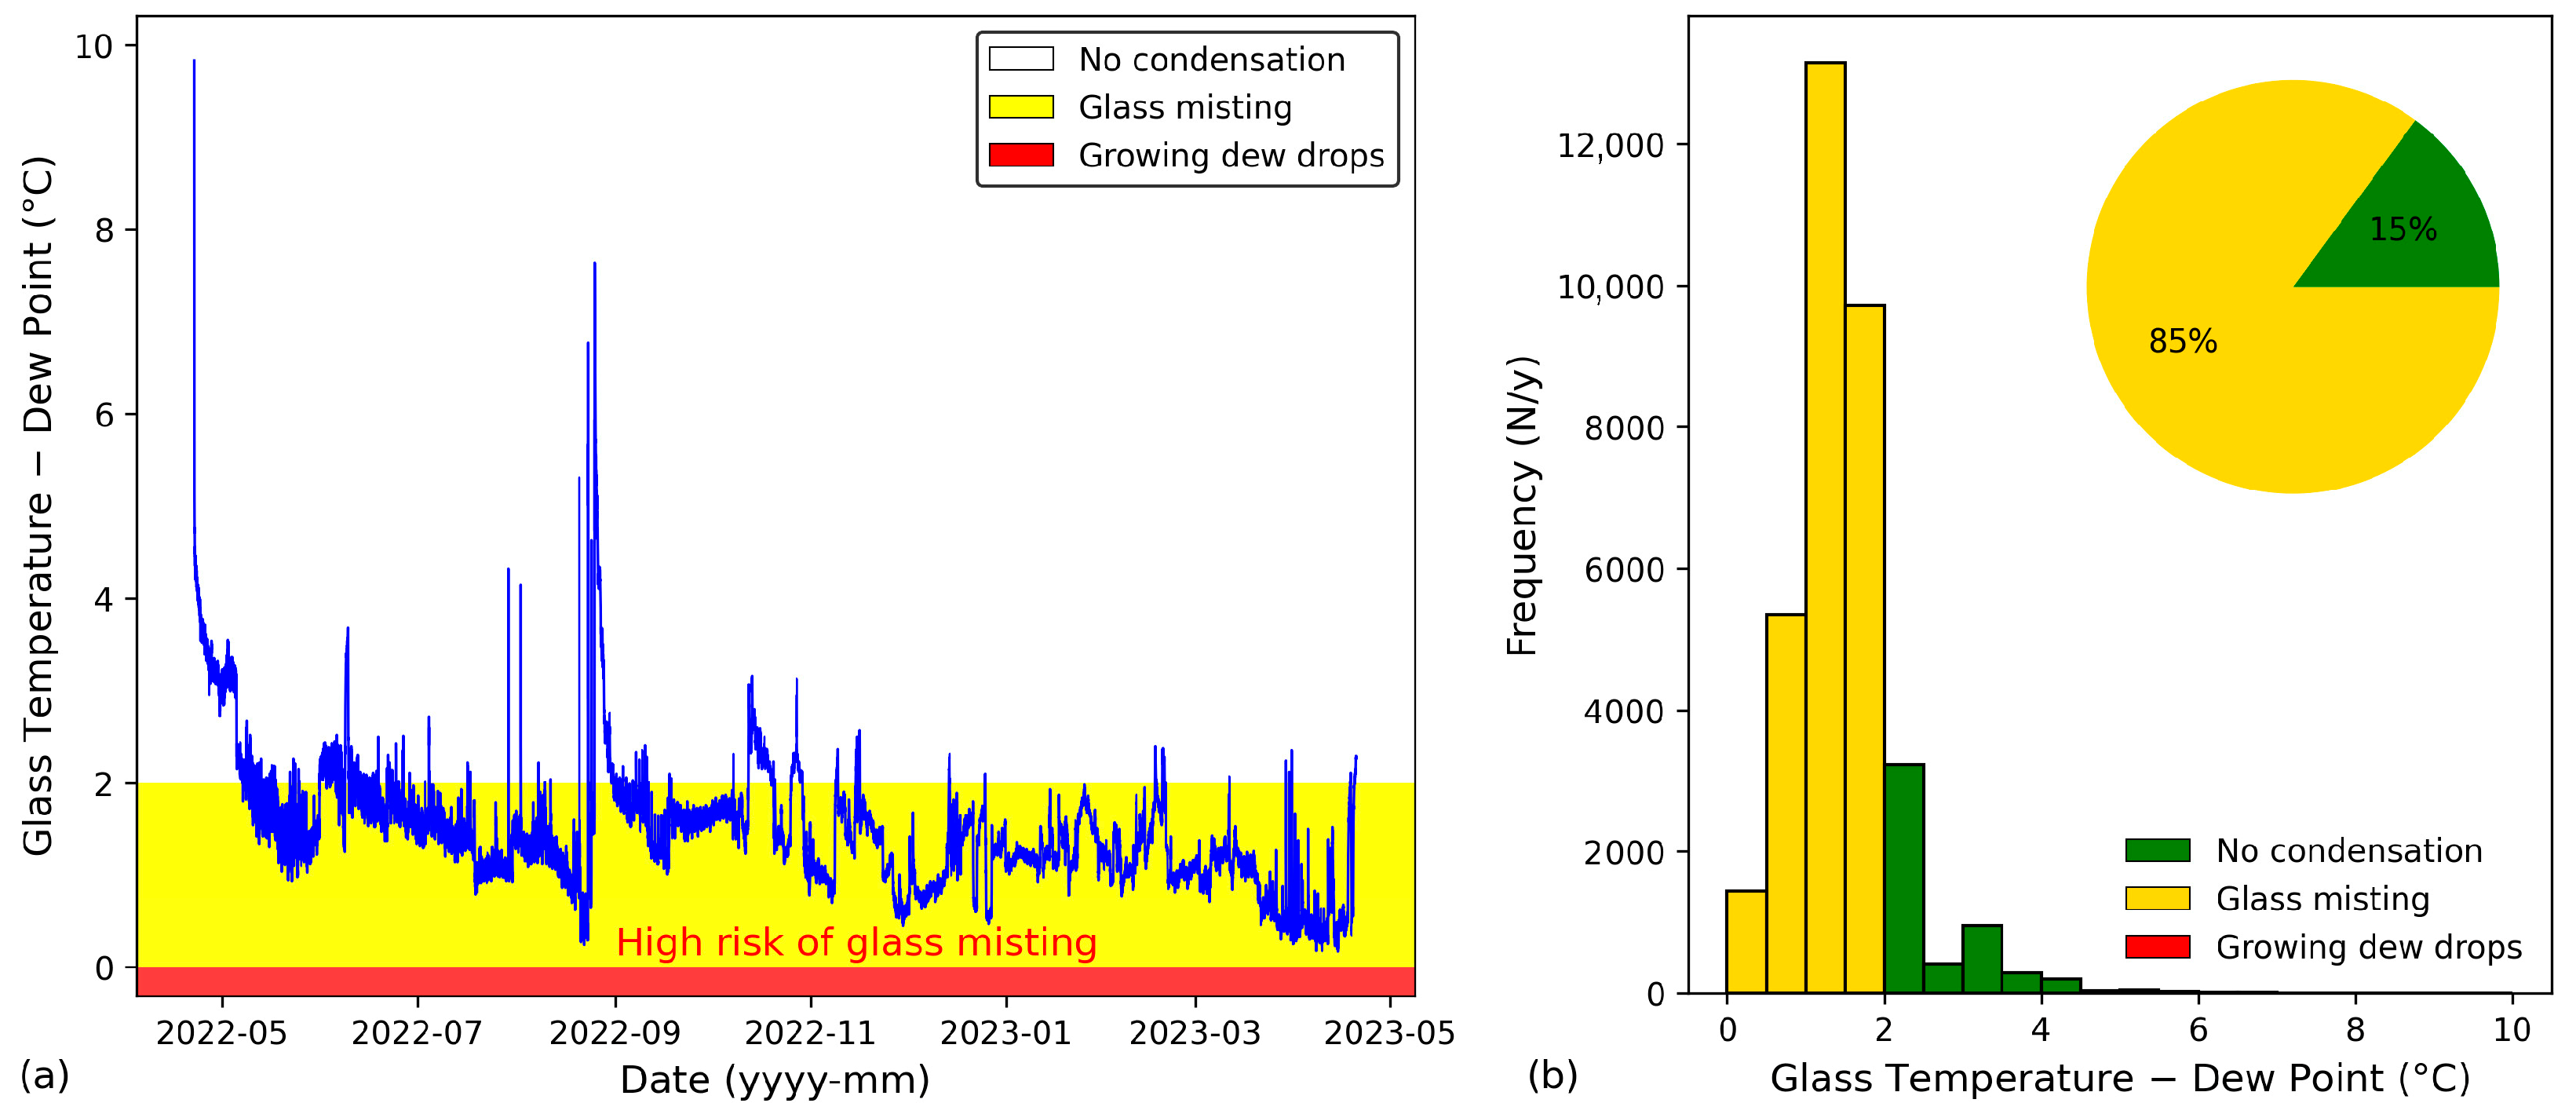
The difference between the glass temperature
and the dew point
observed during the monitoring period is reported in
Figure 10a. It must be specified that the dew point is determined exactly by optical dew point meters, and only approximately by traditional temperature and
RH sensors, due to the uncertainty that affects
RH sensors as they approach saturation [
6,
20].
sensors are intended for use in dry conditions, i.e., excluding the presence of liquid water. The declared accuracy of the sensors decreases when the 90%
is exceeded, and the uncertainty increases with the humidity level. When saturation is reached and the capacitive film is damp, the sensor is faulty and three solutions are possible, depending on the manufacturer: (i) the sensor, by default, indicates 100%, and this is the most common use; (ii) the sensor continues to operate, giving levels above 100%; (iii) the output is stopped because it is unreliable [
6,
25,
26].
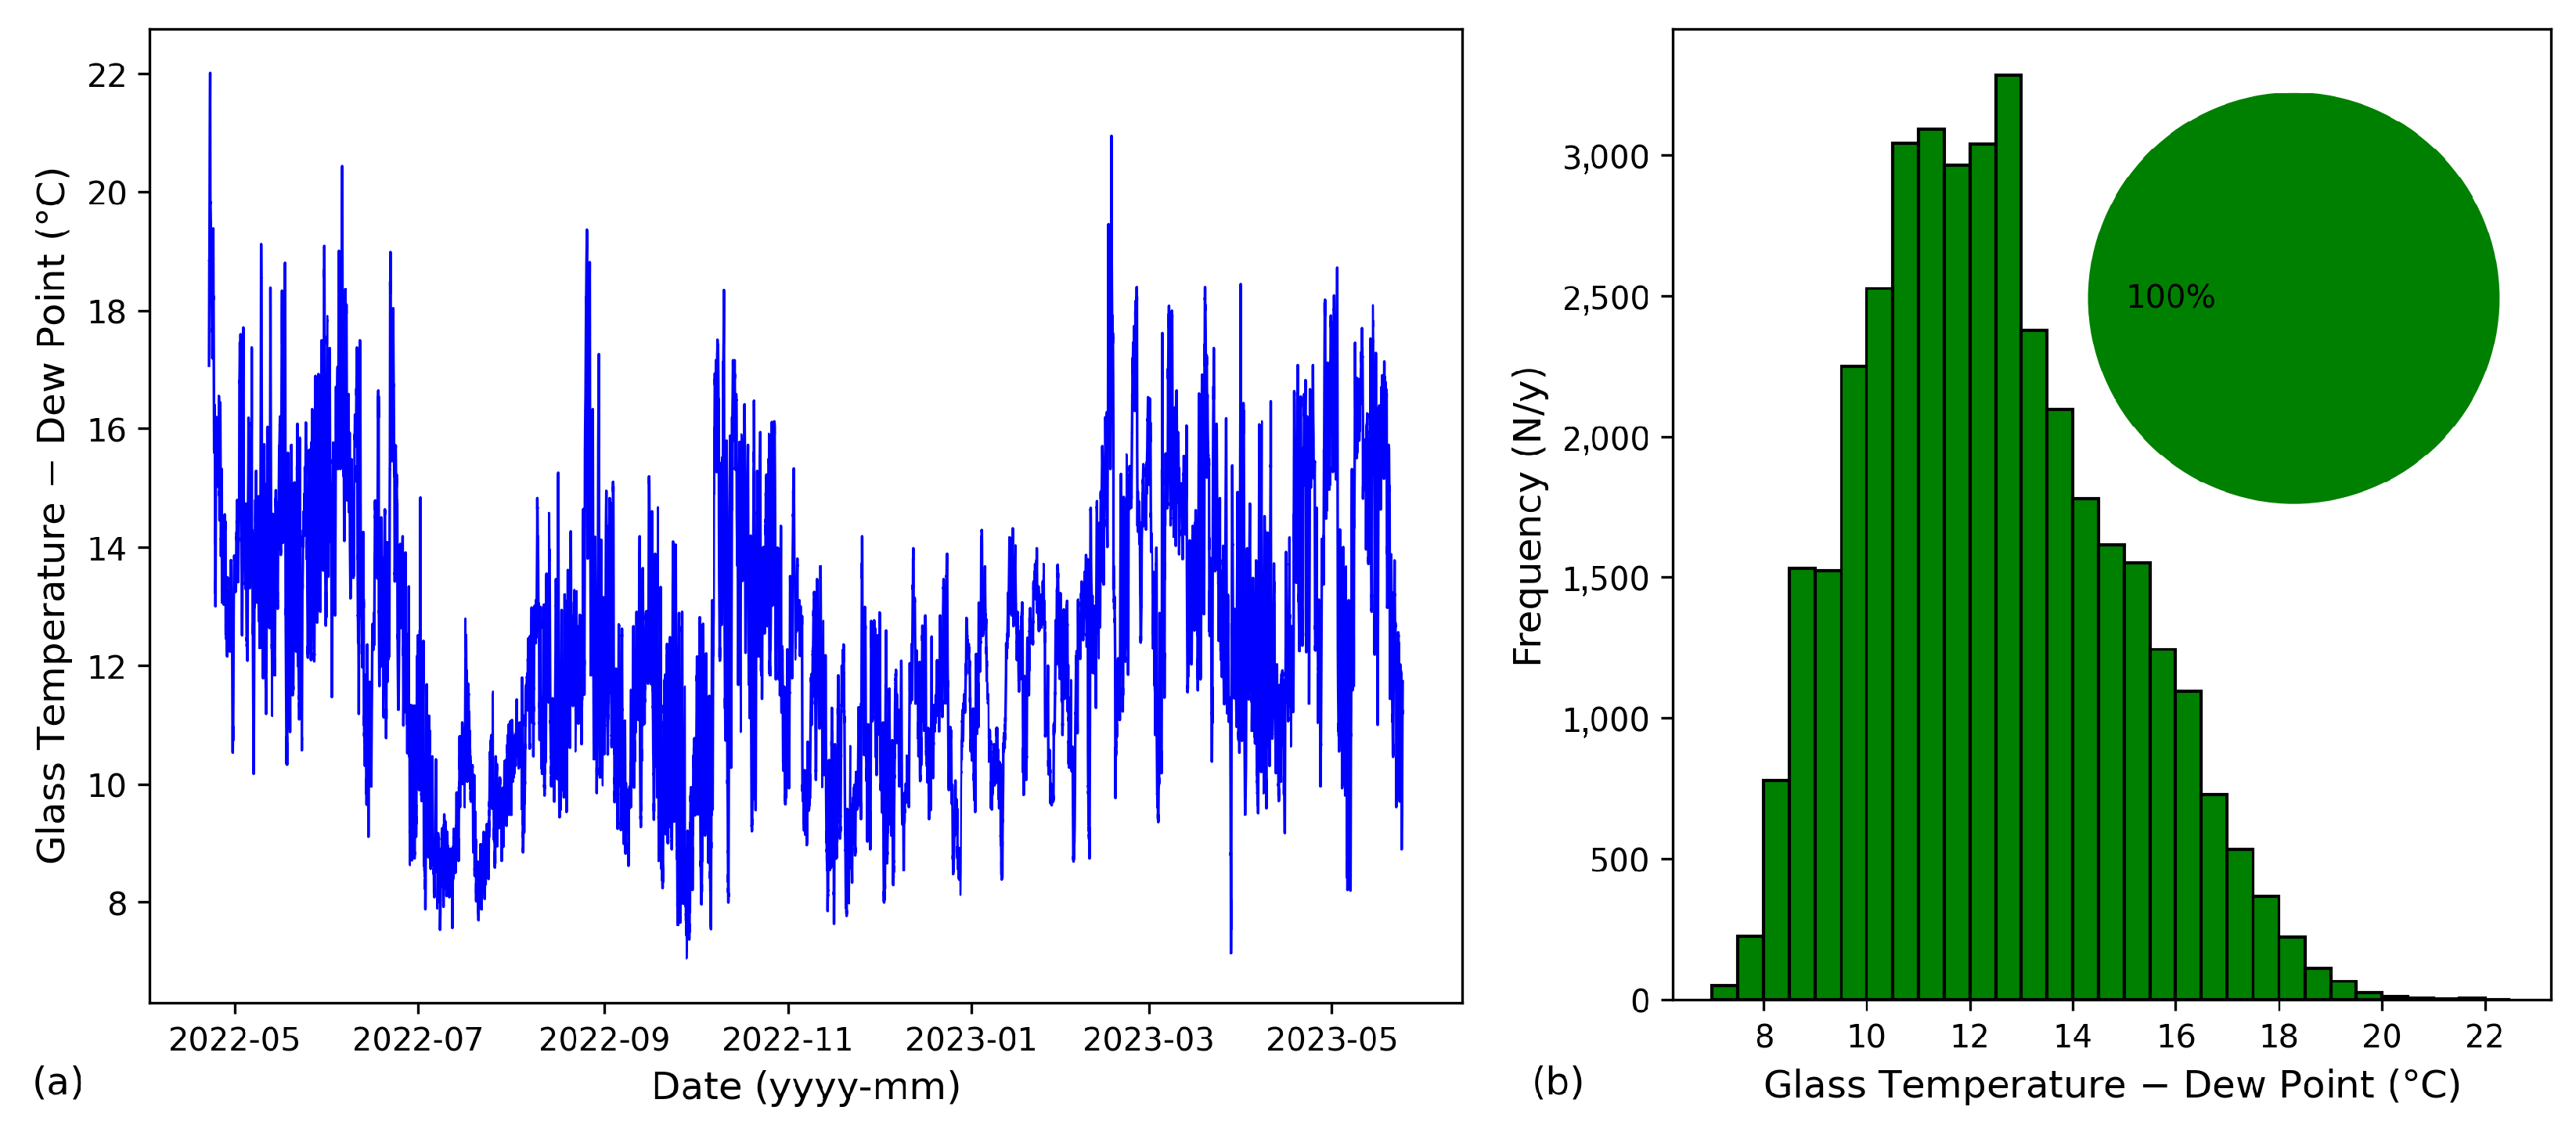
After the sensor is wet, and in contact with liquid water, it takes a long time to evaporate the sorbed moisture, and its output is not reliable until the polymer film dries. In conclusion, sensors are reliable only before condensation (i.e., ), i.e., when they are above the dew point. Considering that the uncertainty becomes critical for , at a BMBK room temperature of 25 °C this threshold corresponds to 1 °C above the dew point. In addition, condensation may occur earlier in the case the glass is contaminated with detergents, pollutants, dirt, or dust. This implies an additional 1 °C of uncertainty, i.e., a total uncertainty band of 2 °C. Although, in the Classroom, the difference is always positive, only a small part of the graph exceeds 2 °C, and is safe against condensation. For most of the period, the graph lies in the yellow area, in which some misting may form on the glass panes. The red area, below the dew point, is characterized by dewing. The yellow area close to the condensation point is a transition area affected by hysteresis and instrumental uncertainty. There may or may not be misting, depending on the previous conditions, i.e., if yellow is reached coming from warmer conditions there is no misting; if yellow remains for a long time, misting is very likely; if yellow is preceded by red (i.e., condensation), misting continues because evaporation is difficult. The misting risk is homogeneously distributed over the whole year. The showcase would benefit from a heating system to temporarily raise the glass pane temperature when it approaches the dew point.
The information about the frequencies of no misting (green), misting (yellow), or condensation (red), is reported in the histogram (
Figure 10b). The frequency represents how many times during the monitoring period the difference
was found within each temperature bin in the abscissa. The pie represents the percentage of time in which the three classes (no condensation; misting; dewing) have occurred in a year.
The frequency histogram shows that in the Classroom the conditions for misting have been largely dominant over the whole monitored period. The pie diagram shows that the glass was foggy for 85% of the time.
3.2. Discussion of the Classroom Data
In the Classroom, the room temperature is determined by the setting of the HVAC, fixed in the range 19 °C to 23 °C, i.e., . These values are too low in relation to the natural mixing ratio of the air in the showcase, which is determined by a physical balance with the earthen archaeological remains and the ground around them. Under the present temperature setting, the glass pane temperature approaches or falls below the dew point, and the glass is misted. The risk conditions of glass misting have been largely dominant (85%) throughout the monitored period. There is a risk that, in the event of more abundant condensation, the drops under the glass pane could grow and fall on the earthen remains, damaging them and generating an excess of dampness.
The relative humidity in the showcase is very high, lying between 80% and 100%, and constitutes a humid habitat that may allow the development of molds and algae, as well as for insects [
27,
28,
29,
30,
31]. The showcases are recent, having been built in the building rehabilitation period, from 2017 to 2021. In 2022, there was no evidence of molds. However, this building-museum is open, and frequented by tourists from all over the world. Wind or people may transport new spores and, if the showcases offer a suitable habitat, they risk being colonized. This means that prevention and continuous controls are needed.
For conservation, should be kept at the same level over time. Changes are dangerous. To avoid mold infestation values lower than 60% are suggested. However, if the molds keep their vegetative hyphae in a medium (i.e., ground, earthen remains) with high moisture content, they can survive even if their aerial mycelium is surrounded by air with low values.
The fact that the mixing ratio is permanently higher in the showcase than in the Classroom suggests that the exhibits and the surrounding ground release moisture by evaporation to the air inside the showcase. In the long run, this continuous evaporation will accumulate soluble salts on the surface of the archaeological remains [
32,
33,
34,
35].
4. the Interpretation Room
4.1. Data Analysis of the Interpretation Room
4.1.1. Location of Sensors in the Interpretation Room
In the Interpretation Room, a linear showcase was dug on the floor to display the wall foundation (
Figure 11a,b). The dimensions are: length 443 cm, width 48 cm, depth 76 cm. The location of sensors is shown in
Figure 11c. A pair of combined
sensors was installed on the wall to monitor the room climate. The sensor of the glass pane temperature
was fixed on the lower side of the pane. A pair of temperature and relative humidity sensors
was positioned inside the showcase.
4.1.2. Temperature
The temperature of the Interpretation Room (
Figure 12) has been kept between 21 °C and 24.5 °C, with levels established by the setting points of the HVAC. The plot shows some minor irregularities due to use, e.g., HVAC turned off, and temporary air exchanges through doors or windows. The showcase and the glass pane have similar temperature levels and are at an intermediate level between the external values and the room temperature, which appear to be the main drivers. The glass pane temperature lies between 22 °C and 27.5 °C, and the room cooling is a bit lower than the showcase temperature which lies between 22 °C and 28.5 °C.
The small differences in temperature between the showcase and the room, and between the showcase and the glass pane, are highlighted in
Figure 13. The showcase temperature is permanently higher than the room temperature (mainly 2 °C to 5 °C), for the cooling operated by the HVAC. Only rarely does the difference change sign, e.g., when the HVAC is turned off.
4.1.3. Relative Humidity
In the room, the relative humidity has a median of around 50%, but is poorly controlled and generally swings between 30% and 75%, sometimes reaching more extreme values (
Figure 14a). In the showcase, the relative humidity has a median of around 45% and generally lies between 30% and 60%.
The difference between the two relative humidities, i.e.,
, shows that the humidity in the Interpretation Room is permanently higher than in the showcase (
Figure 14b). The difference is variable, from around
to
RH with the largest departure in summer (when the air conditioning is more powerful). The relative humidity is determined by the combination of air temperature and mixing ratio. In the showcase, the lower relative humidity level is explained because the HVAC cooling keeps the room temperature lower, while the mixing ratio is the same (next section).
4.1.4. Mixing Ratio
In the Interpretation Room, the mixing ratio generally lies between 5 and 14 g/kg and is mainly controlled by the HVAC. The mixing ratio in the showcase generally lies between 5 and 14 g/kg, i.e., the same values as the room. The difference between the two mixing ratios in the showcase and in the room (
Figure 15b) is always small, around the zero level, with temporary imbalances likely related to the variability in the room for its use. This suggests that there is a balance between the two environments and that there is no evaporation from the ground in the showcase, i.e., the showcase behaves like a box with all sides closed, including the bottom, without exchanges with the underground moisture.
4.1.5. Glass Temperature and Misting
In the Interpretation Room, the difference between the glass pane temperature and the dew point of the air inside the showcase is always positive (
Figure 16a). The frequency histogram (
Figure 16b) shows that during the reporting period, the Interpretation Room has been mostly from 7.5 °C to 20 °C above the misting threshold, with a 12 °C modal value. The pie diagram shows that the percentage of time far from the misting conditions has been 100%.
4.2. Discussion of the Data of the Interpretation Room and Mitigation Remedies
In the Interpretation Room, the temperature is mainly determined by the HVAC. In the showcase, the temperature is always higher than in the room, especially in summer; some heat arrives for conduction from the external environment through the building foundations and the ground. On the other hand, the relative humidity of the room is very unstable, with large imbalances that can reach extremely dry values. This situation makes the room inappropriate for the long-term conservation of porous hygroscopic materials, especially wooden objects, because these fluctuations are potentially dangerous for these materials, as recommended by the European Standard EN 15757 [
36].
In the showcase, the relative humidity is slightly more stable, ranging from 45% to 60%. The average value is suitable for the conservation of the earthen remains because it remains (slightly) lower than the habitat of molds and algae [
27,
28,
29,
30,
31]. However, the high variability has a negative impact on the conservation of the archaeological remains, especially for the dry peaks, when evaporation is forced and soluble salts accumulate on the earthen remains. The European Standard EN 15757 recommends maintaining the natural values of temperature stable, as well as the relative humidity to which hygroscopic materials have been accustomed over time, and avoid fluctuations or changes [
6,
36,
37].
The equilibrium conditions in which the mixing ratio in the showcase is closely related to, or even equals, the values in the room, suggest that: (i) there is no continual evaporation from the ground and earthen remains, (ii) there are no water exchanges or connections between the remains and the underground environment; (iii) there is no risk that soluble salts will accumulate on the surface of the remains. This situation is very positive for conservation.
The difference between the glass pane temperature and the dew point of the air inside the showcase is always positive and at a safe distance from misting conditions. Therefore, no remedies are needed, except to reduce the internal variability, of either short-term or long-term imbalances. Under such conditions, if the use and the HVAC setting will remain unchanged, there is no risk of misting or condensation.
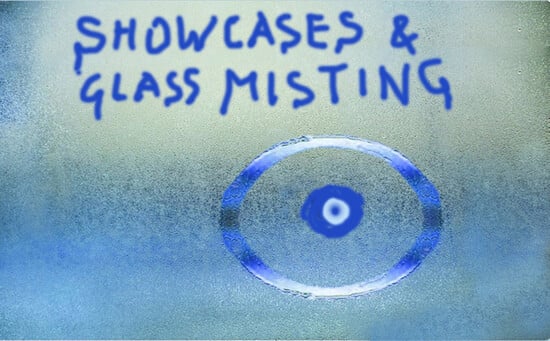
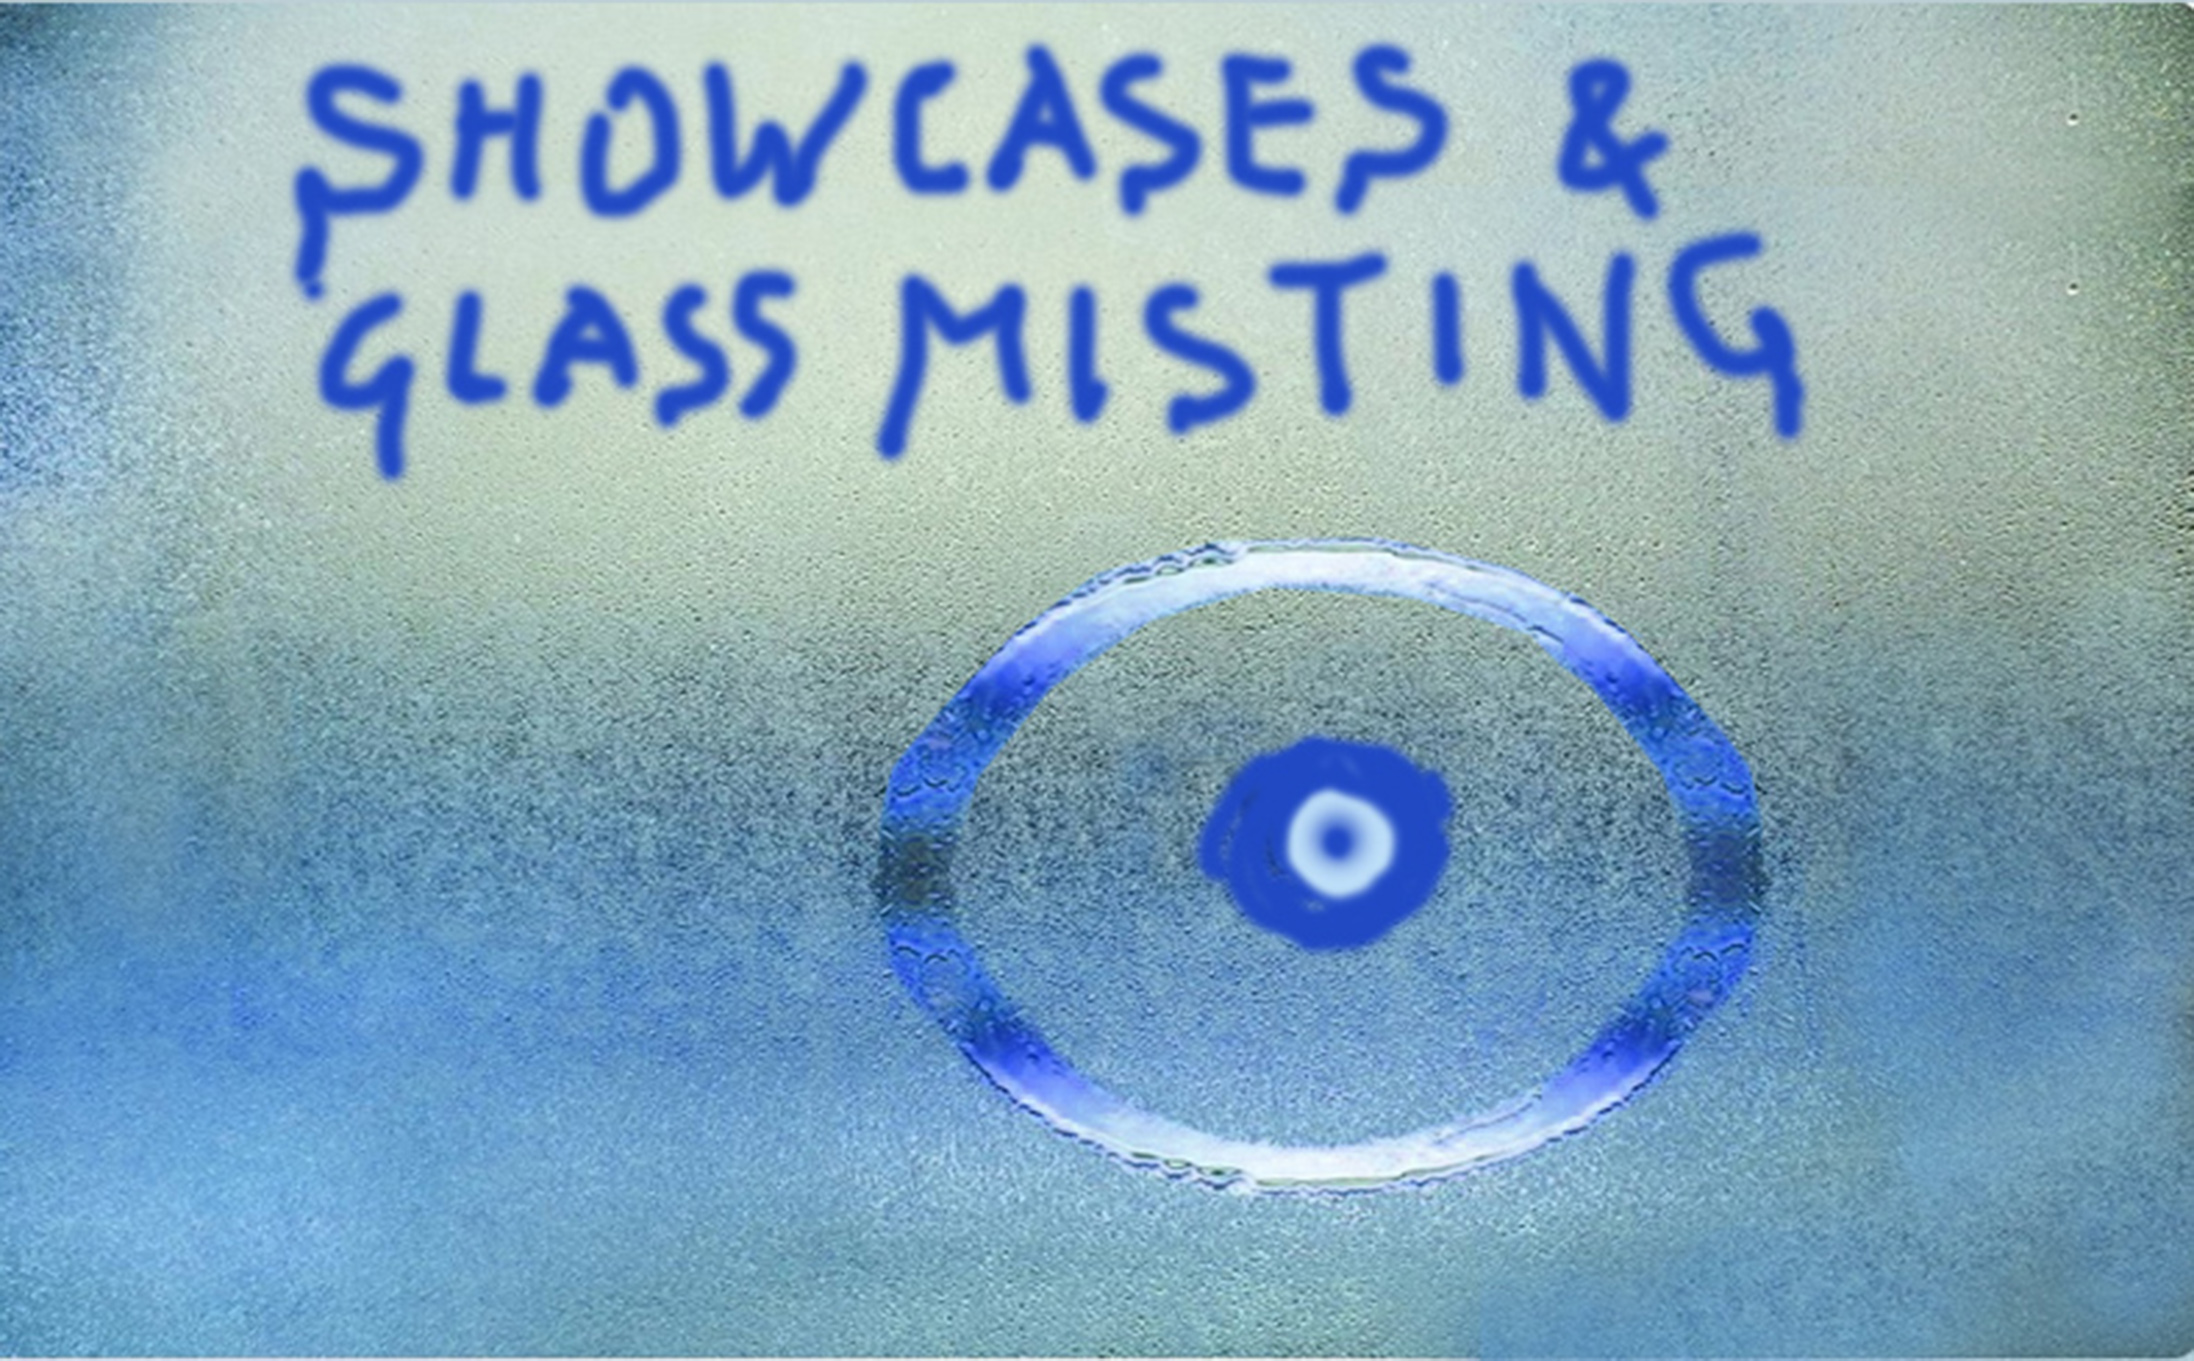
5. Glass Misting and Methodologies to Demist
In the Classroom showcase, the misting of the glass pane is due to water droplets formed by condensation. This phenomenon is also named dewing (e.g., in meteorology) fogging, or hazing, if one considers the optical effect of reducing the view of objects behind the glass. The condensation of the water vapor is due to a combination of two factors, i.e.,
- 1.
The mixing ratio of the air inside the showcase volume. On the bottom of the showcase, the earth and the earthen archaeological remains include a certain moisture content, which may evaporate to reach equilibrium with the air inside the showcase. Another potential source of moisture is room cleaning and some water percolating inside. Another factor that regulates the mixing ratio inside the showcase is the air leakage, i.e., the natural ventilation between the showcase and the room. Keeping other things constant, the higher the showcase mixing ratio, the more frequent and intense the dewing.
- 2.
Glass pane temperature. On the top of the showcase, the glass pane temperature is lowered by the room air conditioning. If the glass temperature falls below the dew-point of the air inside the showcase, condensation occurs. This dew-point is uniquely determined by the mixing ratio in air. Keeping other things constant, the lower the room temperature, the more frequent and intense the dewing.
To obtain an efficient system, it is convenient to operate on both crucial factors, i.e., the temperature of the glass pane (that should be higher) and the mixing ratio inside the showcase (that should be lower), as follows.
- 1.
The temperature of the glass pane can be controlled with a heating glass. The heating glass is fully transparent but includes some conductive metal atoms that allow the passage of an electric current and, therefore, generate some heating. The electric current is switched on by a dew sensor fixed to the pane [
6,
38], which enables the electrical feeding for the whole period of time in which some mist lies on the glass. Miniaturized dew sensors are commonly employed in electronic devices (e.g., photographic cameras, smartphones, notebooks) to avoid short-circuits with sharp changes in temperature or humidity, or the pharmaceutical industry, food processing, warehouses, and other applications. A thermostat fixed to the glass pane prevents the glass from exceeding a selected maximum temperature, e.g., 30 °C, 35 °C, 40 °C, established by the operator, to avoid the glass becoming hot. This method has been applied to pews in churches to improve the thermal comfort of churchgoers in cold climates [
39,
40]. Glass anti-misting systems with heating controlled by on–off switches are commonly used in refrigerated showcases to display ice cream.
- 2.
The mixing ratio inside the showcase can be controlled with natural ventilation. Some slits along the border of the showcase, just below the border supporting the glass panes, may allow some natural ventilation and prevent an excessive accumulation of moisture inside the case. Ventilation transports a certain quantity of air with its moisture content. To be efficient, the flow must be established between slits located on opposite sides of the showcase. The airflow requires a free passage of air through slits, and it must be considered that the flow is reduced in the case a grill mesh is applied to prevent insects from entering.
Glass panes are positioned at floor level and each glass has four small cylindrical holes for handling. The cylindrical holes are some 2 cm in diameter and 3 cm in depth, i.e., the glass pane thickness, and are located in the proximity of the corners, all on the same complanar surface, i.e., the horizontal plane. This situation cannot produce efficient air exchanges through the holes but allows some diffusive transport of vapor molecules, which is a poorly efficient exchange mechanism. This explains why the water vapor dispersed inside the showcase may reach saturation, and condense on the lower surface of the glass pane.
A combination of two factors, i.e., (i) gentle natural ventilation, i.e., advection exchange of air through slits located on the opposite sides of the showcases, to prevent an excessive accumulation of moisture inside the case, and (ii) some temporary glass heating when some mist is forming on the pane, constitutes an efficient mitigation measure. This combined system does not require special HVAC settings or limitations to selected air temperatures in the classroom, i.e., does not affect the comfort of the people inside, but just avoids the conditions for glass misting.
It is possible to increase the air exchange between the room and the showcase, e.g., with ventilation slits. This may improve the situation but, in the long term, salts will accumulate on the remains in a quantity that depends on the ground dampness, presence of soluble salts, and evaporation rate. The accumulation of salts is dangerous for conservation and this option would require monitoring the concentration of soluble salts in the ground and the remains over the years to assess the growing rate and decide mitigation measures.
The user is free to decide the preferred solution (i.e., qualitative choice, e.g., change plants that do not require watering, reduce the room temperature less, raise the glass temperature) and the level of efficiency (i.e., intensity, quantitative tuning). The result will depend both on the choice and on the intensity of the application. It is important to optimize a balance between room temperature, ventilation and control of the glass pane temperature. This is also good for the conservation of the remains and may be compatible with, or close to, the present choice of thermal setting.
6. Conclusions
This study shows that to conserve an exhibit, it is not sufficient to only control the microclimate of the showcase with a thermometer and a hygrometer kept inside it, but it is necessary to clarify the whole system of the dynamic exchanges between the exhibit, the showcase, the room, and the external environment.
The microclimate investigation inside BMBK has recognized that the two similar showcases located in two rooms of the same building, apparently under the same conditions, have different behaviors. In both rooms, the temperatures of the glass panes closely follow the room temperature, while the mixing ratios of the air inside the two showcases are different from the room values. This can be explained by the different connections between the bottom of the showcases and the underground environment. In the Classroom, the result suggests a dynamic situation in which some underground water may reach the showcase bottom and the exhibit, feeding continual evaporation. In turn, the natural mixing ratio inside the showcase reaches saturation, and therefore, misting. This is favored by the low glass pane temperature caused by the low temperature kept in the room.
On the other hand, the Interpretation Room with appears as a closed system in which the showcase has no exchanges with the underground environment; therefore, it can reach a stable equilibrium between the room and the showcase.
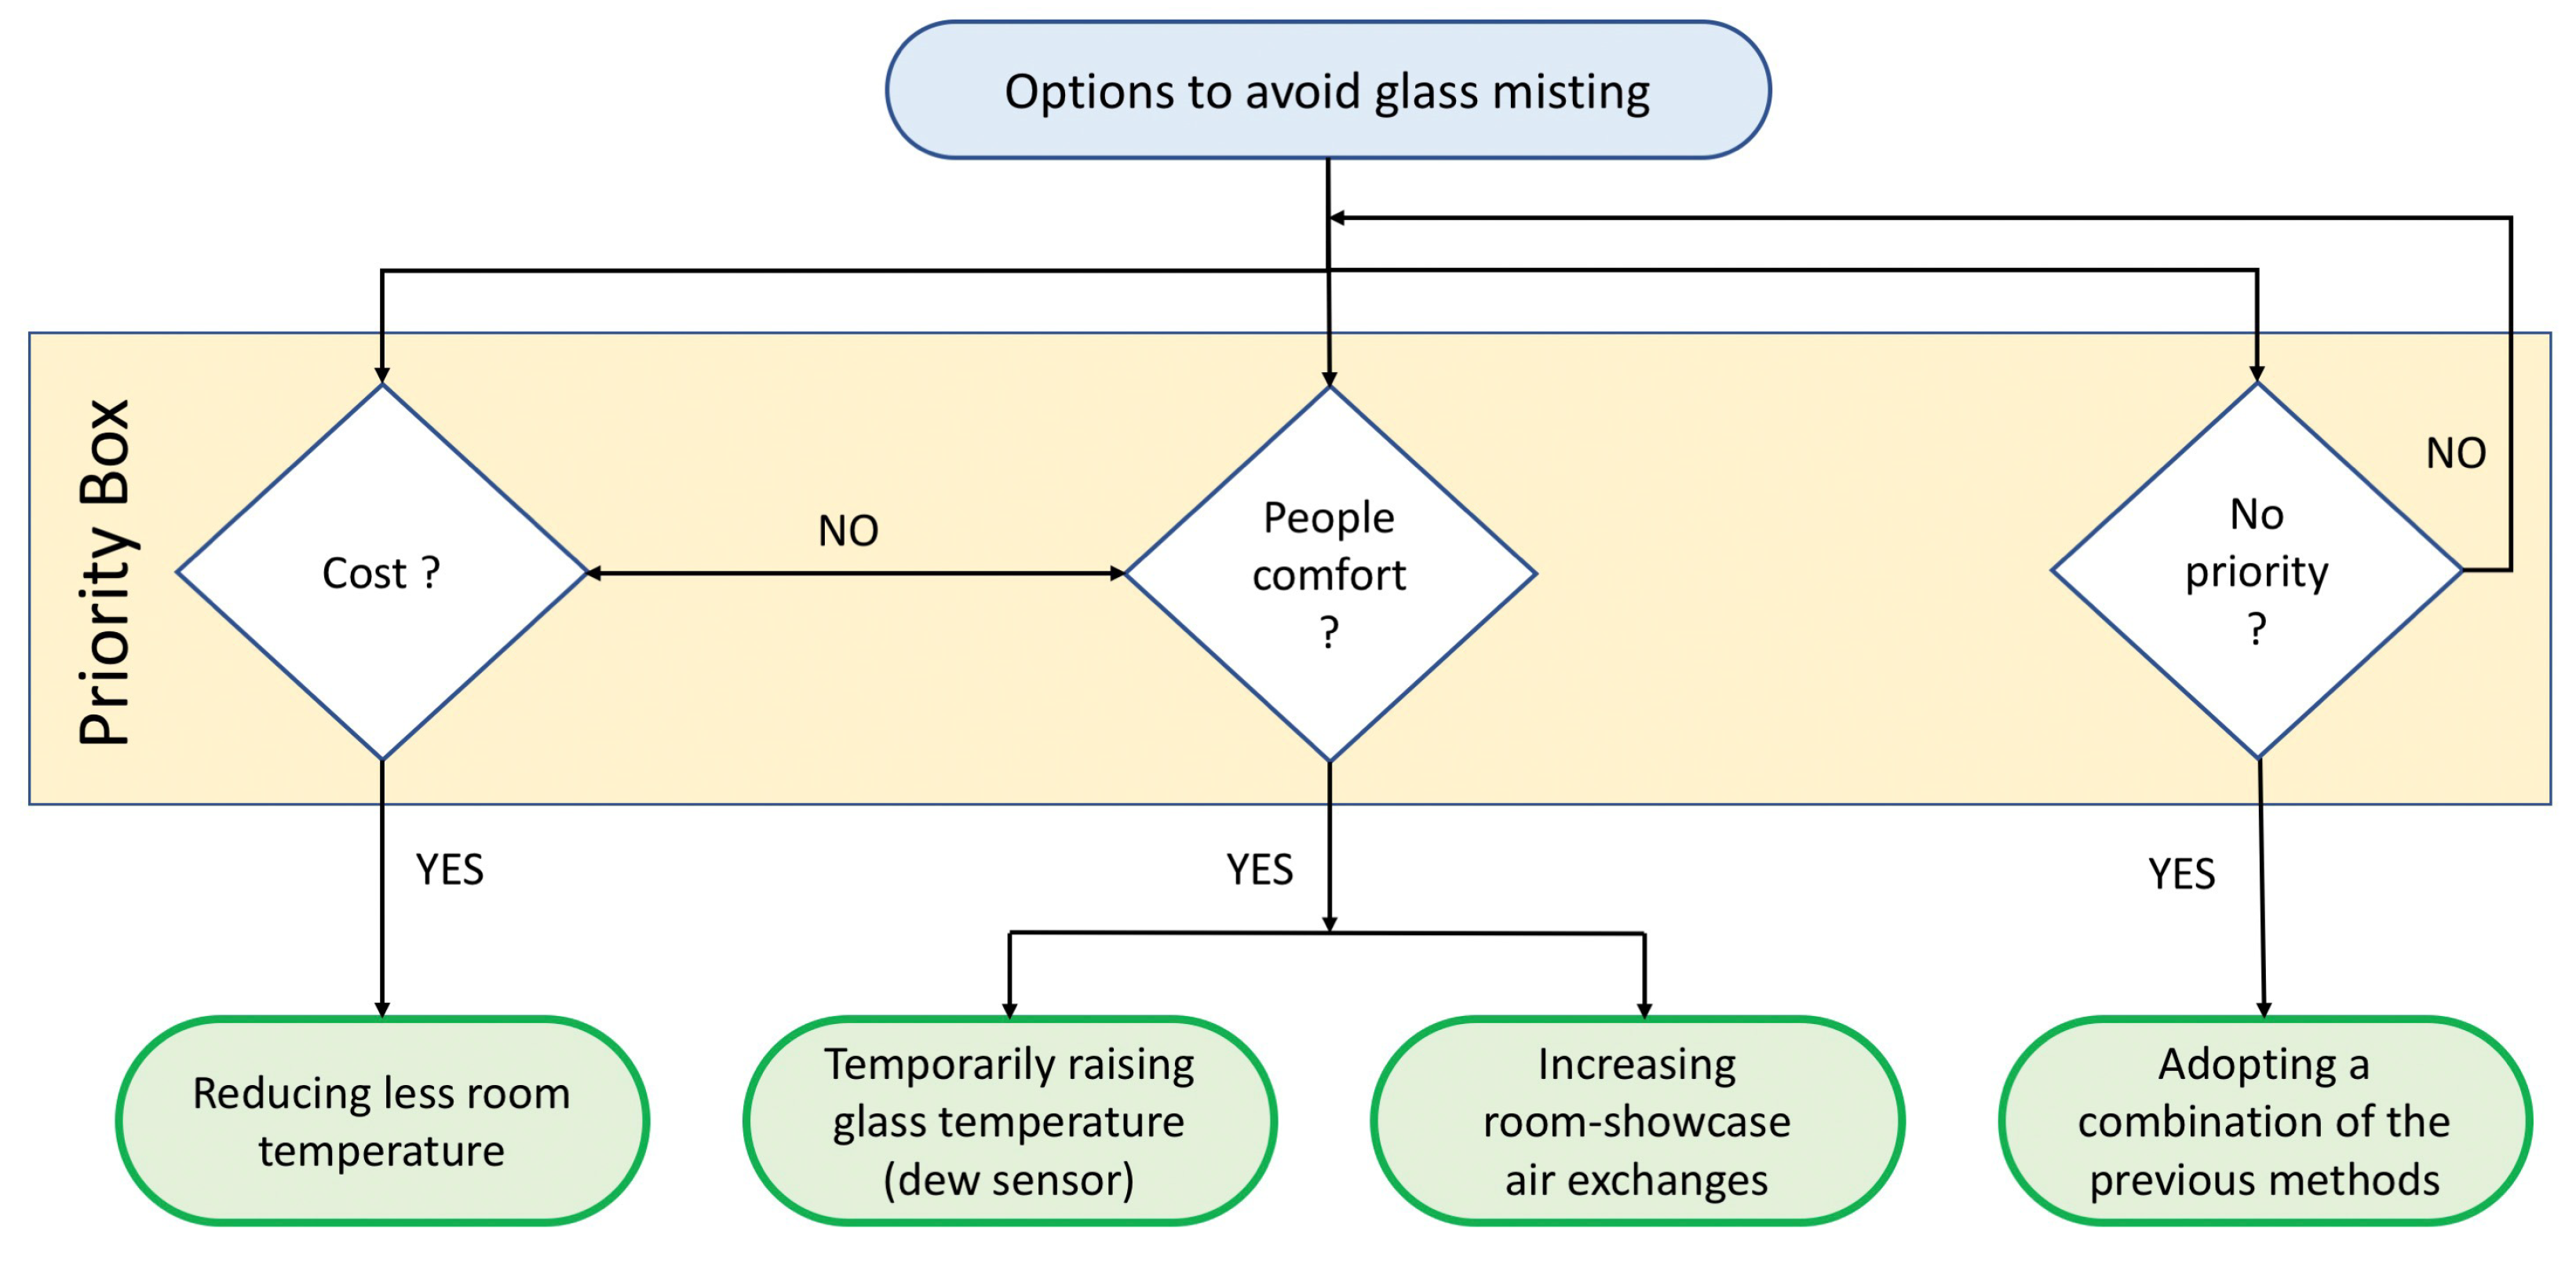
The Classroom has frequent glass misting, while the Interpretation Room does not. Therefore, a mitigation remedy is due only in the Classroom. From the physical point of view, condensation and misting may be avoided if the glass pane temperature remains above the dew point temperature of the showcase. This means that it is possible to operate either on the glass pane temperature, on the dew point of the showcase, or both. This gives four options as shown in
Figure 17:
- 1.
To reduce the room temperature less, to keep it above the dew point of the showcase. This option is the easiest one: it is sufficient to move the thermostat setting from to . However, the choice of the setting points is subjective and depends on the desired comfort level of the user, which is related to the planned activity and other specific needs.
- 2.
To temporarily raise the glass pane temperature above the dew point of the showcase, in this case by 5, for a limited period of misting. This is possible by using electrically heated glass panes and using a dew sensor to trigger heating. This option has a cost but is free from the need to change the room temperature setting and allows for maintaining the desired comfort level.
- 3.
To increase the natural air exchanges between the showcase and the room. This is another easy option because it is sufficient to open some natural ventilation slots between the glass panes and the floor. This option, however, is advisable only in case of modest evaporation, otherwise, ventilation risks increasing the evaporation rate and the accumulation of soluble salts on the archaeological remains.
- 4.
Reducing plant watering can help to reduce the problem, but does not solve it because it is not the only cause.
- 5.
To adopt a combination of the previous options. For instance, increasing the natural ventilation of option 3, which lowers the dew point, and consequently reduces the room temperature increase required in option 1. Alternatively, increasing the ventilation in option 3 as before, but reducing the need, duration and intensity of glass warming in option 2.
These options provide a variety of solutions, that every user may select and apply, depending on personal choices or room use. In this case study, all choices are more or less equivalent; however, in other situations, the choice must be determined by the results of the investigation, and in particular, by the temperature difference that should be compensated, or the difference in mixing ratio, and the cost that each option will entail.
If one excludes the formation of large drops that grow and fall on the remains, as observed in the outdoor showcases [
14], the simple glass misting penalizes the exhibition, but not necessarily the conservation. To this aim, the relative humidity in the showcases and the differences between the mixing ratios in the showcase and the room are more relevant. In both showcases, but especially in the Interpretation Room, the
shows wide variability, establishing either excessively dry environments that force evaporation followed by the accumulation of soluble salts on the exhibits, or too humid conditions that risk favoring the development of molds and algae, or insect colonization. Another problem is that when the mixing ratio inside the showcase is higher than in the room, the moisture migrates from inside to outside the showcase, allowing the evaporation and salt accumulation to continue. In the BMBK case study, the Interpretation Room has, on average, a null difference between
and
, while the Classroom has
and needs some attention and control over time.


 ,
, 


