Abstract
In this paper, the seismic vulnerability of churches is assessed using different methods characterized by different levels of complexity depending on the accuracy of the results to be achieved. Specifically, we compare the two main types of methodologies applied in the literature, namely, empirical and analytical methods. Empirical methods assess seismic vulnerability based on engineering judgements. In this study, these evaluations were carried out through an automatic tool, the MACHRO form, which was introduced in the past by the authors with the purpose of making evaluations as objective as possible. Analytical methods evaluate the vulnerability of a stock of churches through linear and nonlinear kinematic analyses performed for the most vulnerable macro-elements, which are treated by means of mechanical models. When the number of churches in the stock is huge, this type of evaluation might prove unfeasible. For this reason, churches are grouped into a manageable number of archetypes in order to be analyzed. The above-described methodologies were applied to a relevant number of churches, aiming to appraise discrepancies in terms of results and highlight advantages and drawbacks of their application.
1. Introduction
The vulnerability assessment of assets at risk is a topic of paramount importance, especially in the promotion of policies for the protection and conservation of historical and architectural heritage. In Italy, this topic is particularly felt due to the nation’s rich cultural heritage, which includes a vast number of masonry buildings of remarkable historical value. These structures exhibit a wide range of architectural and structural differences, reflecting the historical and cultural contexts in which they were conceived and built [1]. Moreover, when focusing on churches, their aggregating and religious function represents an added value that must be preserved. Hence, significant efforts must be dedicated to appraising the vulnerability of these assets and implementing all necessary measures to ensure their preservation during catastrophic events.
Unfortunately, over the past centuries, earthquakes have continued to pose a significant threat to churches, often causing irreparable damage and loss. The destructive seismic events that occurred in Italy over the past three decades (i.e., Molise, 2002 [2]; L’Aquila, 2009 [3]; Emilia, 2012 [4,5]; and Central Italy, 2016 [6]) have highlighted the insufficient awareness of the vulnerability of churches with respect to ordinary buildings, owing to the significant complexity of their architectural and typological peculiarities [7]. It is evident that scientifically grounded seismic mitigation policies must be implemented urgently. These efforts must be supported by risk assessment methodologies tailored to different scales. This will ensure effective and sustainable resource allocation by establishing the prioritization of interventions while accounting for the tangible and intangible values of churches. In this process, the application of reliable vulnerability assessment methods represents a critical step, enabling the identification of potential damage scenarios by considering the main fragilities of churches.
Large-scale seismic assessment procedures commonly serve to study the vulnerability of large stocks of churches. Due to the large number of elements in stocks, empirical methods are often used. These rely on scores assigned based on engineering judgments, vulnerability sources and seismic protection systems related to the seismic behavior of the main macro-elements of the relevant churches [8]. These scores are weighted depending on the importance of the considered macro-elements with respect to the structural stability of the churches and are exploited to obtain a vulnerability index for each structure. Once vulnerability indices have been determined for all the churches in the stock, they are applied in empirical formulations to derive damage parameters that, linked to damage probability functions, allow the estimation of damage for different levels of earthquake intensity [9]. Empirical methods often represent the only viable way to assess vulnerability at the large scale because of the rapidness of the evaluation process, which relies on engineering judgment. However, they are approximate, as they involve uncertainties in score assignments and are based on empirical formulations validated using past earthquake scenarios that were influenced by specific features of the built environment, fault systems and soil conditions.
On the other hand, more precise methods rely on the application of numerical and analytical analyses that account for both linear and nonlinear behavior of masonry materials and elements. These methods allow evaluation of the behavior of churches under strong seismic demands, which may lead to collapse mechanisms. Numerical analyses resort to sophisticated FEM models, which should ideally be calibrated on the basis of tests. Given the high architectural and historical value of churches, it is necessary that such tests be nondestructive [10,11]. Analytical methods make use of mechanical models of the main macro-elements of churches. These models are employed to carry out pushover kinematic analyses or even dynamic analyses [12] so as to determine the seismic demands that induce the attainment of pre-established limit states in the considered macro-element.
Although numerical and analytical methods, if well-conceived, are notoriously more accurate than empirical ones—primarily because of the reduced uncertainty from engineering judgments—they become impractical when the goal is to assess the vulnerability of churches at a large, territorial scale. This is because of the high computational effort needed to analyze a large number of complex models, particularly when the target is the evaluation of their nonlinear behavior. Thus, hybrid methods have emerged in the last few decades.
Another convenient approach for large-scale vulnerability assessments is to define a limited and manageable number of archetype churches featuring the key characteristics of the whole stock. The seismic response of these archetypes is considered representative of all churches in the stock, allowing vulnerability assessments to be conducted with reasonable computational effort [13]. Obviously, the assessment must consider the representativeness of each archetype within the broader stock to properly weigh its importance in the outlined damage scenarios.
Building on the research framework described above, this paper aims to compare vulnerability assessment results for a stock of churches at the regional scale. Both an empirical method—calibrated by the authors using churches from another territorial area—and an analytical method—based on mechanical models of the main macro-elements of representative archetype churches—are applied. The churches selected for the study are located in Central Italy, an area severely impacted by a destructive seismic sequence in 2016. The final goal is to highlight advantages and drawbacks of each method and to highlight the discrepancies in their results.
The paper is organized as follows: Section 2 describes the application of the proposed empirical method to the studied stock of churches, which is carefully characterized in terms of structural and stylistic features. Then, in Section 3, the archetype churches are introduced for analysis, while Section 4 presents the linear and nonlinear kinematic analyses performed on their macro-elements. Section 5 offers a comparison of the results obtained via the two methodologies. Finally, Section 6 concludes the paper, summarizing the key findings and outlining possible future developments.
2. Structural Survey and Empirical Seismic Vulnerability of the Studied Stock of Churches
2.1. The Studied Churches in Central Italy
Following the seismic sequence that hit Central Italy in 2016, almost 4000 inspections were carried out on churches in the affected area to assess their damage and usability. These inspections were conducted by the Italian Department of Civil Protection (DPC) in support of the Italian Ministry of Cultural Heritage (MIC), through the application of the “A-DC” forms [14], which are designed for emergency management and the evaluation of cultural heritage usability.
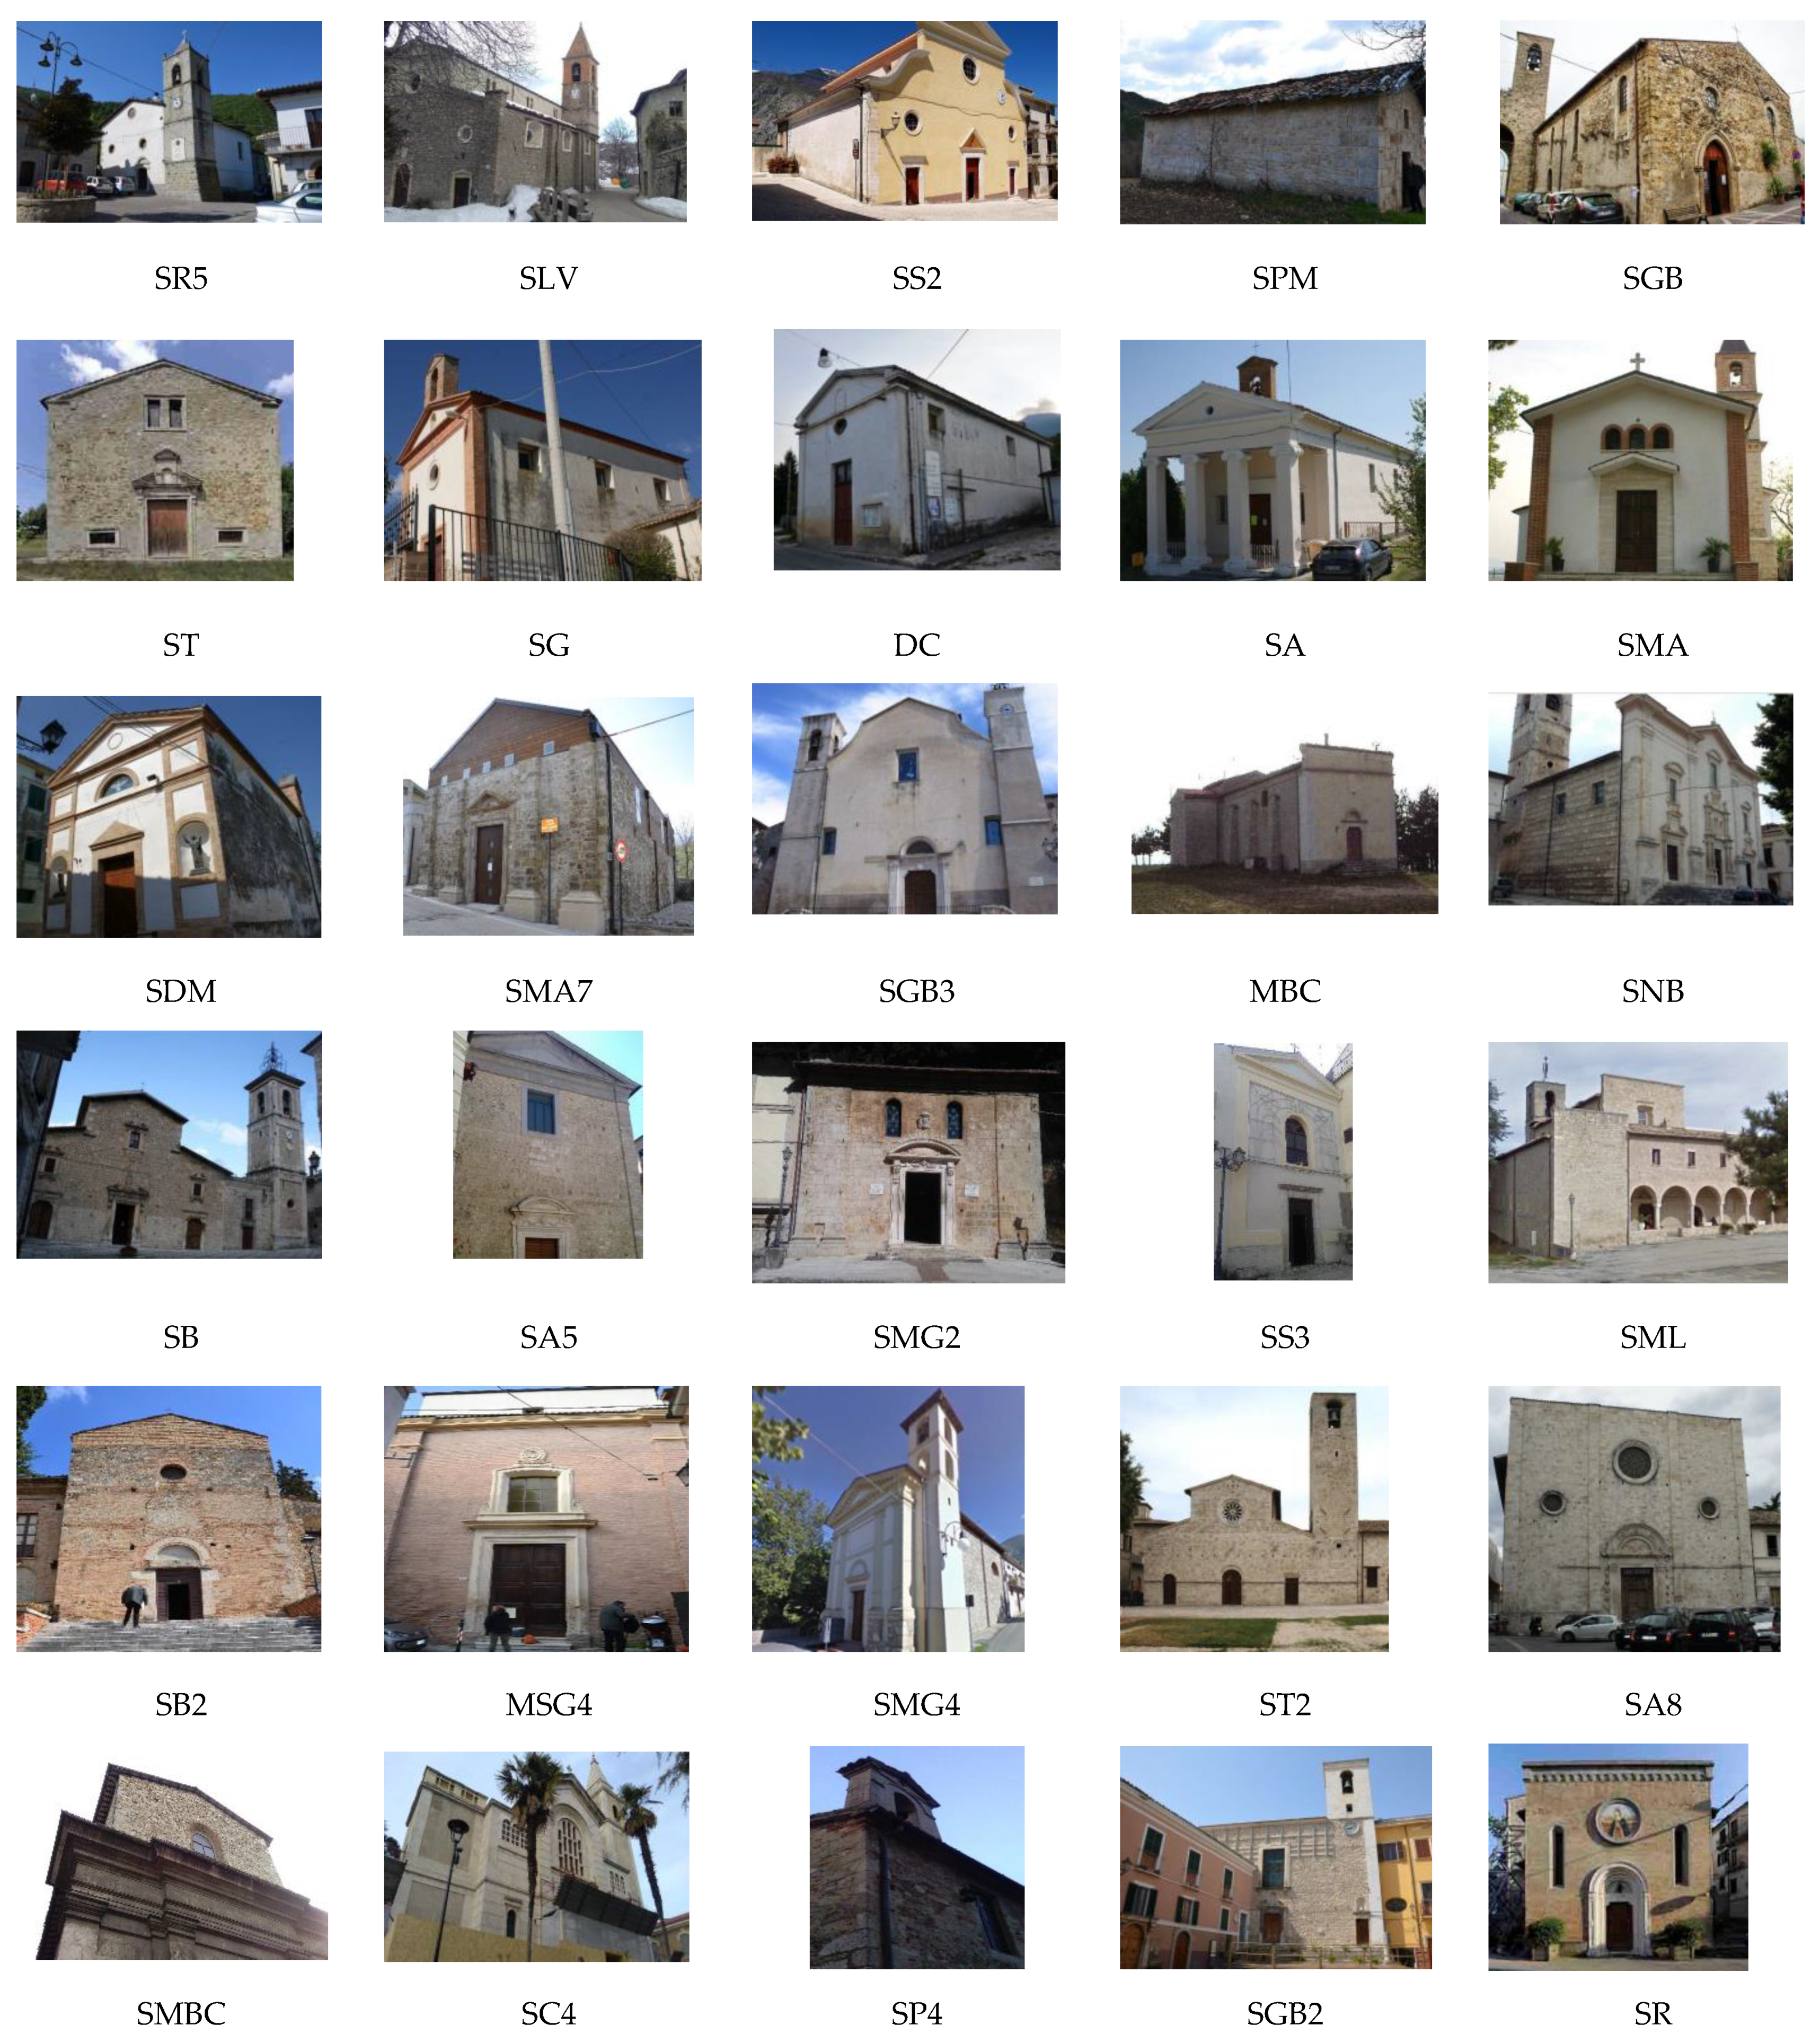
In this context, the authors surveyed 87 churches, which composed the stock analyzed in this paper. These churches are located in Abruzzo (70%), Lazio (15%) and Marche (15%) (Figure 1)—most of them between 25 and 50 km from the epicenters of the August and October seismic events—and were selected specifically because they were directly surveyed by the authors. A list of the inspected churches, identified by specific acronyms, is provided in Table 1. A photographic overview is given in Figure 2.
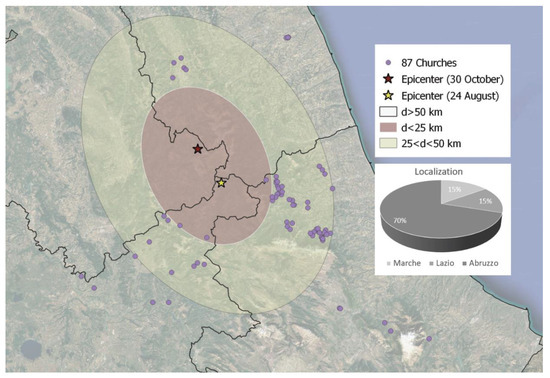
Figure 1.
Identification of the sample of churches analyzed with reference to the main shocks of the 2016 earthquake sequence.

Table 1.
List of inspected churches.

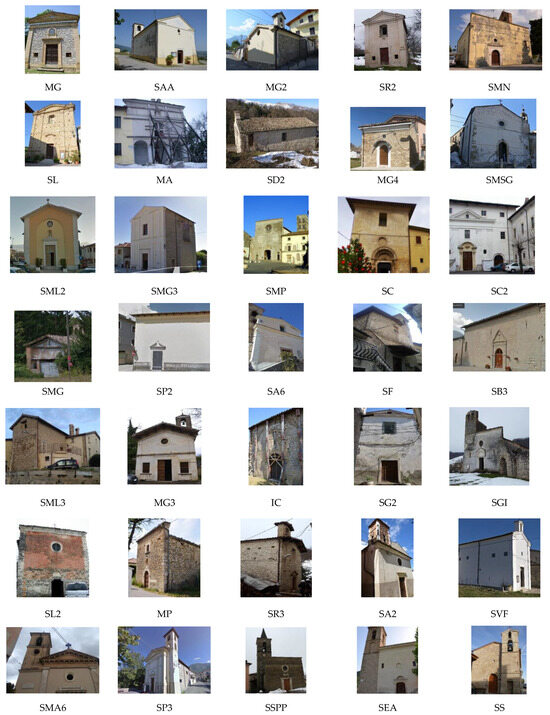
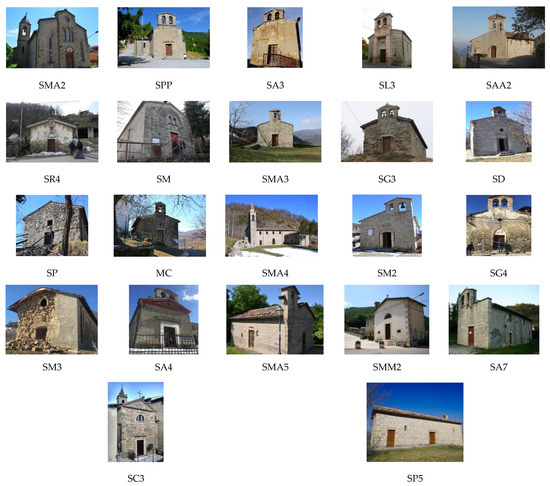
Figure 2.
The stock of analyzed churches: photographic overview.
The majority of churches in the stock are simple buildings, with 79% having a single nave. Only 5% feature two naves, whereas the remaining 16% have three naves. The survey revealed a predominance of gable façades and two types of bell towers: bell gables (40%) and tower bells (36%). The remaining 24% of churches do not have bell towers. Macro-elements, such as transepts, domes and chapels, are rarely found. The analyzed churches mainly have two types of roofs: visible wooden trusses and vaulted ceilings in the central nave (mostly barrel vaults with lunettes). More information on the geometrical features of these churches can be found in [15].
2.2. The Applied Empirical Method
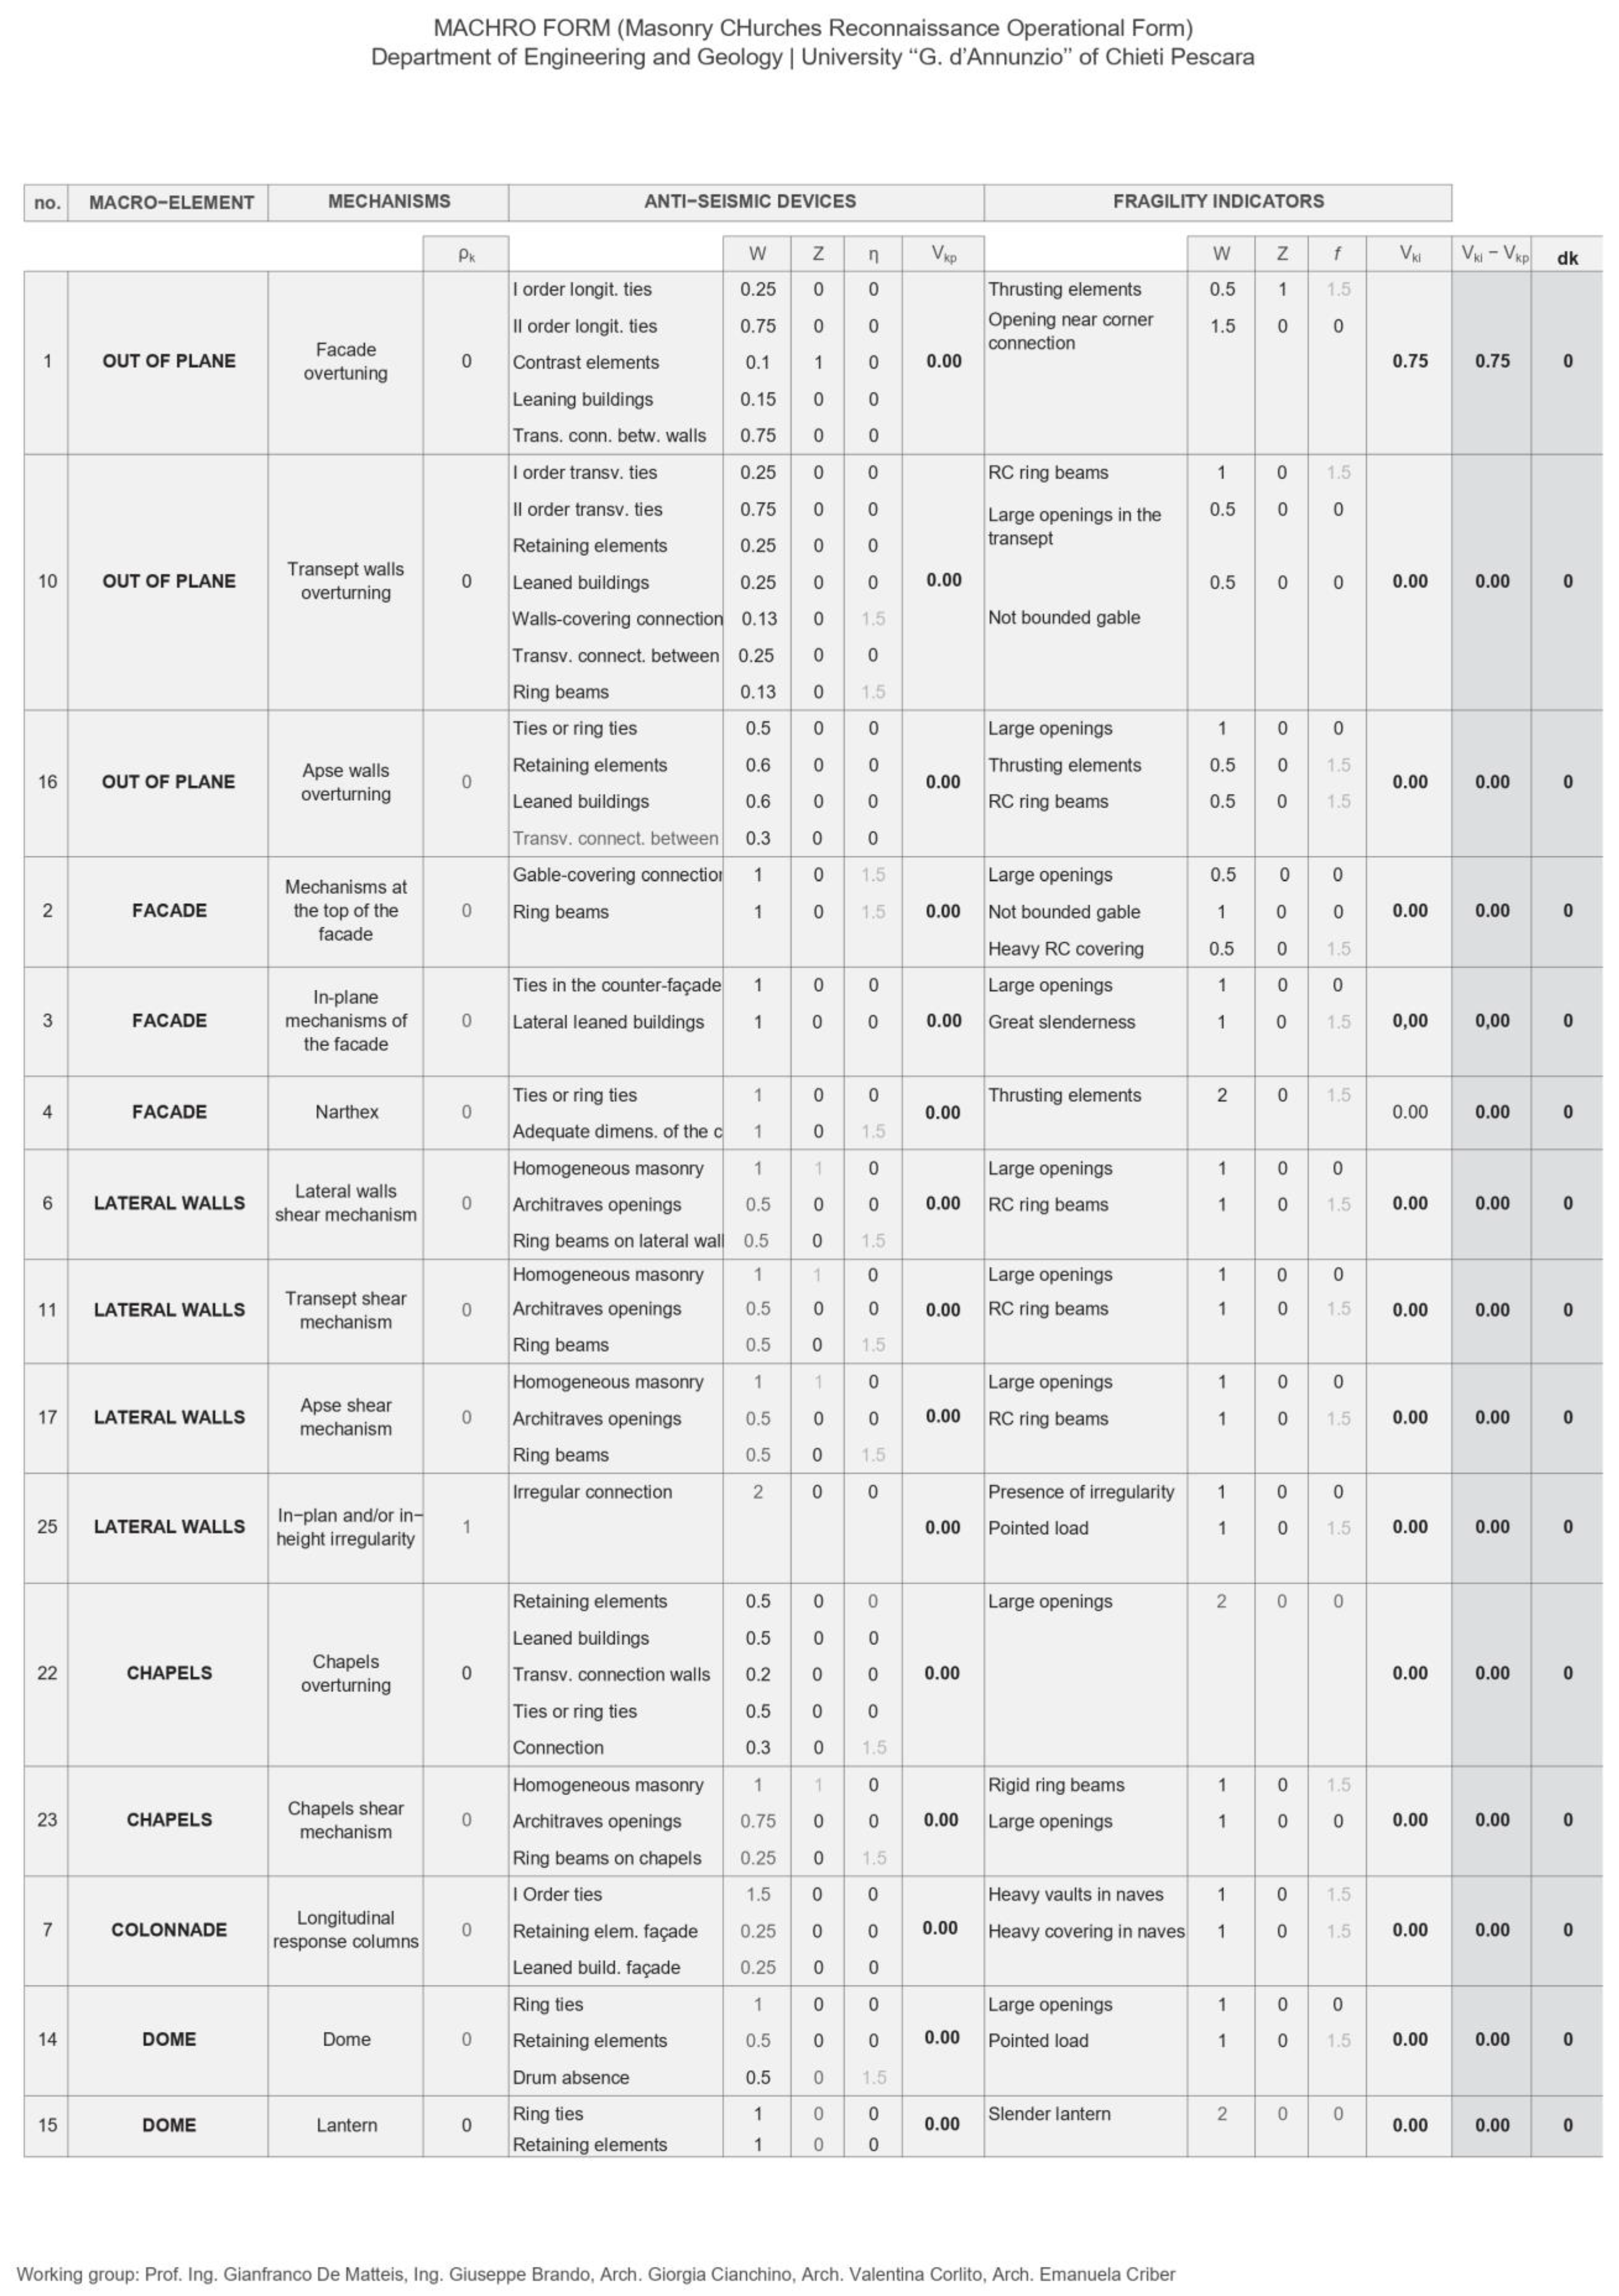
The vulnerability assessment of churches was carried out through the method calibrated by De Matteis et al. [12] following the 2009 L’Aquila earthquake. This method builds on the approach suggested by the Italian Guidelines on Cultural Heritage [8], which identifies 28 potential mechanisms that can affect 9 macro-elements of a church. Seismic performance is evaluated by a vulnerability index (Iv), assigned according to Equation (1):
In the equation above, for the generic mechanism k that a macro-element can experience (with k ranging from 1 to 28), vk,i and vk,p are scores assigned through engineering judgement to the fragility sources and to the anti-seismic devices that the macro-element in question may feature, while ρk is a factor that weighs the mechanism according to its importance with regard to the global stability of the church (ρk = 0 for mechanisms that cannot occur due to the lack of the macro-element and 0.25 ≤ ρk ≤ 1 otherwise).
In the procedure proposed in [12], the evaluation of the scores is carried out according to Equations (2) and (3), which are applied by defining specific factors (z, w, f and η):
where
- w is an importance factor. In Equation (2), it represents the potential impact of the fragility source in determining the vulnerability of the mechanism, whereas in Equation (3) it measures the effectiveness of the applied protection device in inhibiting the development of the mechanism. The maximum value of w is 2;
- z is a Boolean coefficient related to the presence or absence of each anti-seismic device and fragility indicator; it ranges from 0 (when the device is absent) to 1 (when the device is present);
- f, in Equation (2), is a factor that reflects the influence of the observed fragility indicator. It ranges from 0 (meaning that the indicator does not influence the activation of the mechanism) to 1.5 (if the indicator has full influence on the onset of the mechanism);
- η, in Equation (3), is the efficiency factor that measures the effectiveness of each anti-seismic device. It ranges from 0 (ineffective) to 1.5 (fully effective).
The vulnerability indices (Iv) are then used to calculate the average vulnerability index (Iv*) for the whole stock, which is subsequently employed to evaluate the mean damage (µd) of the investigated churches under earthquakes of macro-seismic intensity (IMCS (0 ≤ IMCS ≤ 12, according to the Mercalli–Cancani–Sieberg scale)) through the application of the vulnerability function given in Equation (4):
which is a modification of the equation from Lagomarsino and Podestà [16] proposed by the authors in [12] in order to reduce the scatter between observed and predicted damage in the analyses conducted after the L’Aquila earthquake of 2009.
The values for the expected mean damage (µD) are then used to estimate the probability of attaining a damage level (Dj) for each earthquake intensity (IMCS) by applying the binomial probability distribution function (BPDF) as per Equation (5):
with Dj ranging from 1 to 5, according to the criteria defined in [8], where D1 represents light damage, D2 moderate damage, D3 extensive damage, D4 partial collapse and D5 total collapse.
The obtained probabilities can therefore be cumulated for each earthquake intensity and used to plot fragility curves, which represent the probability of exceeding damage level Dj (Equation (6)) for different earthquake intensities:
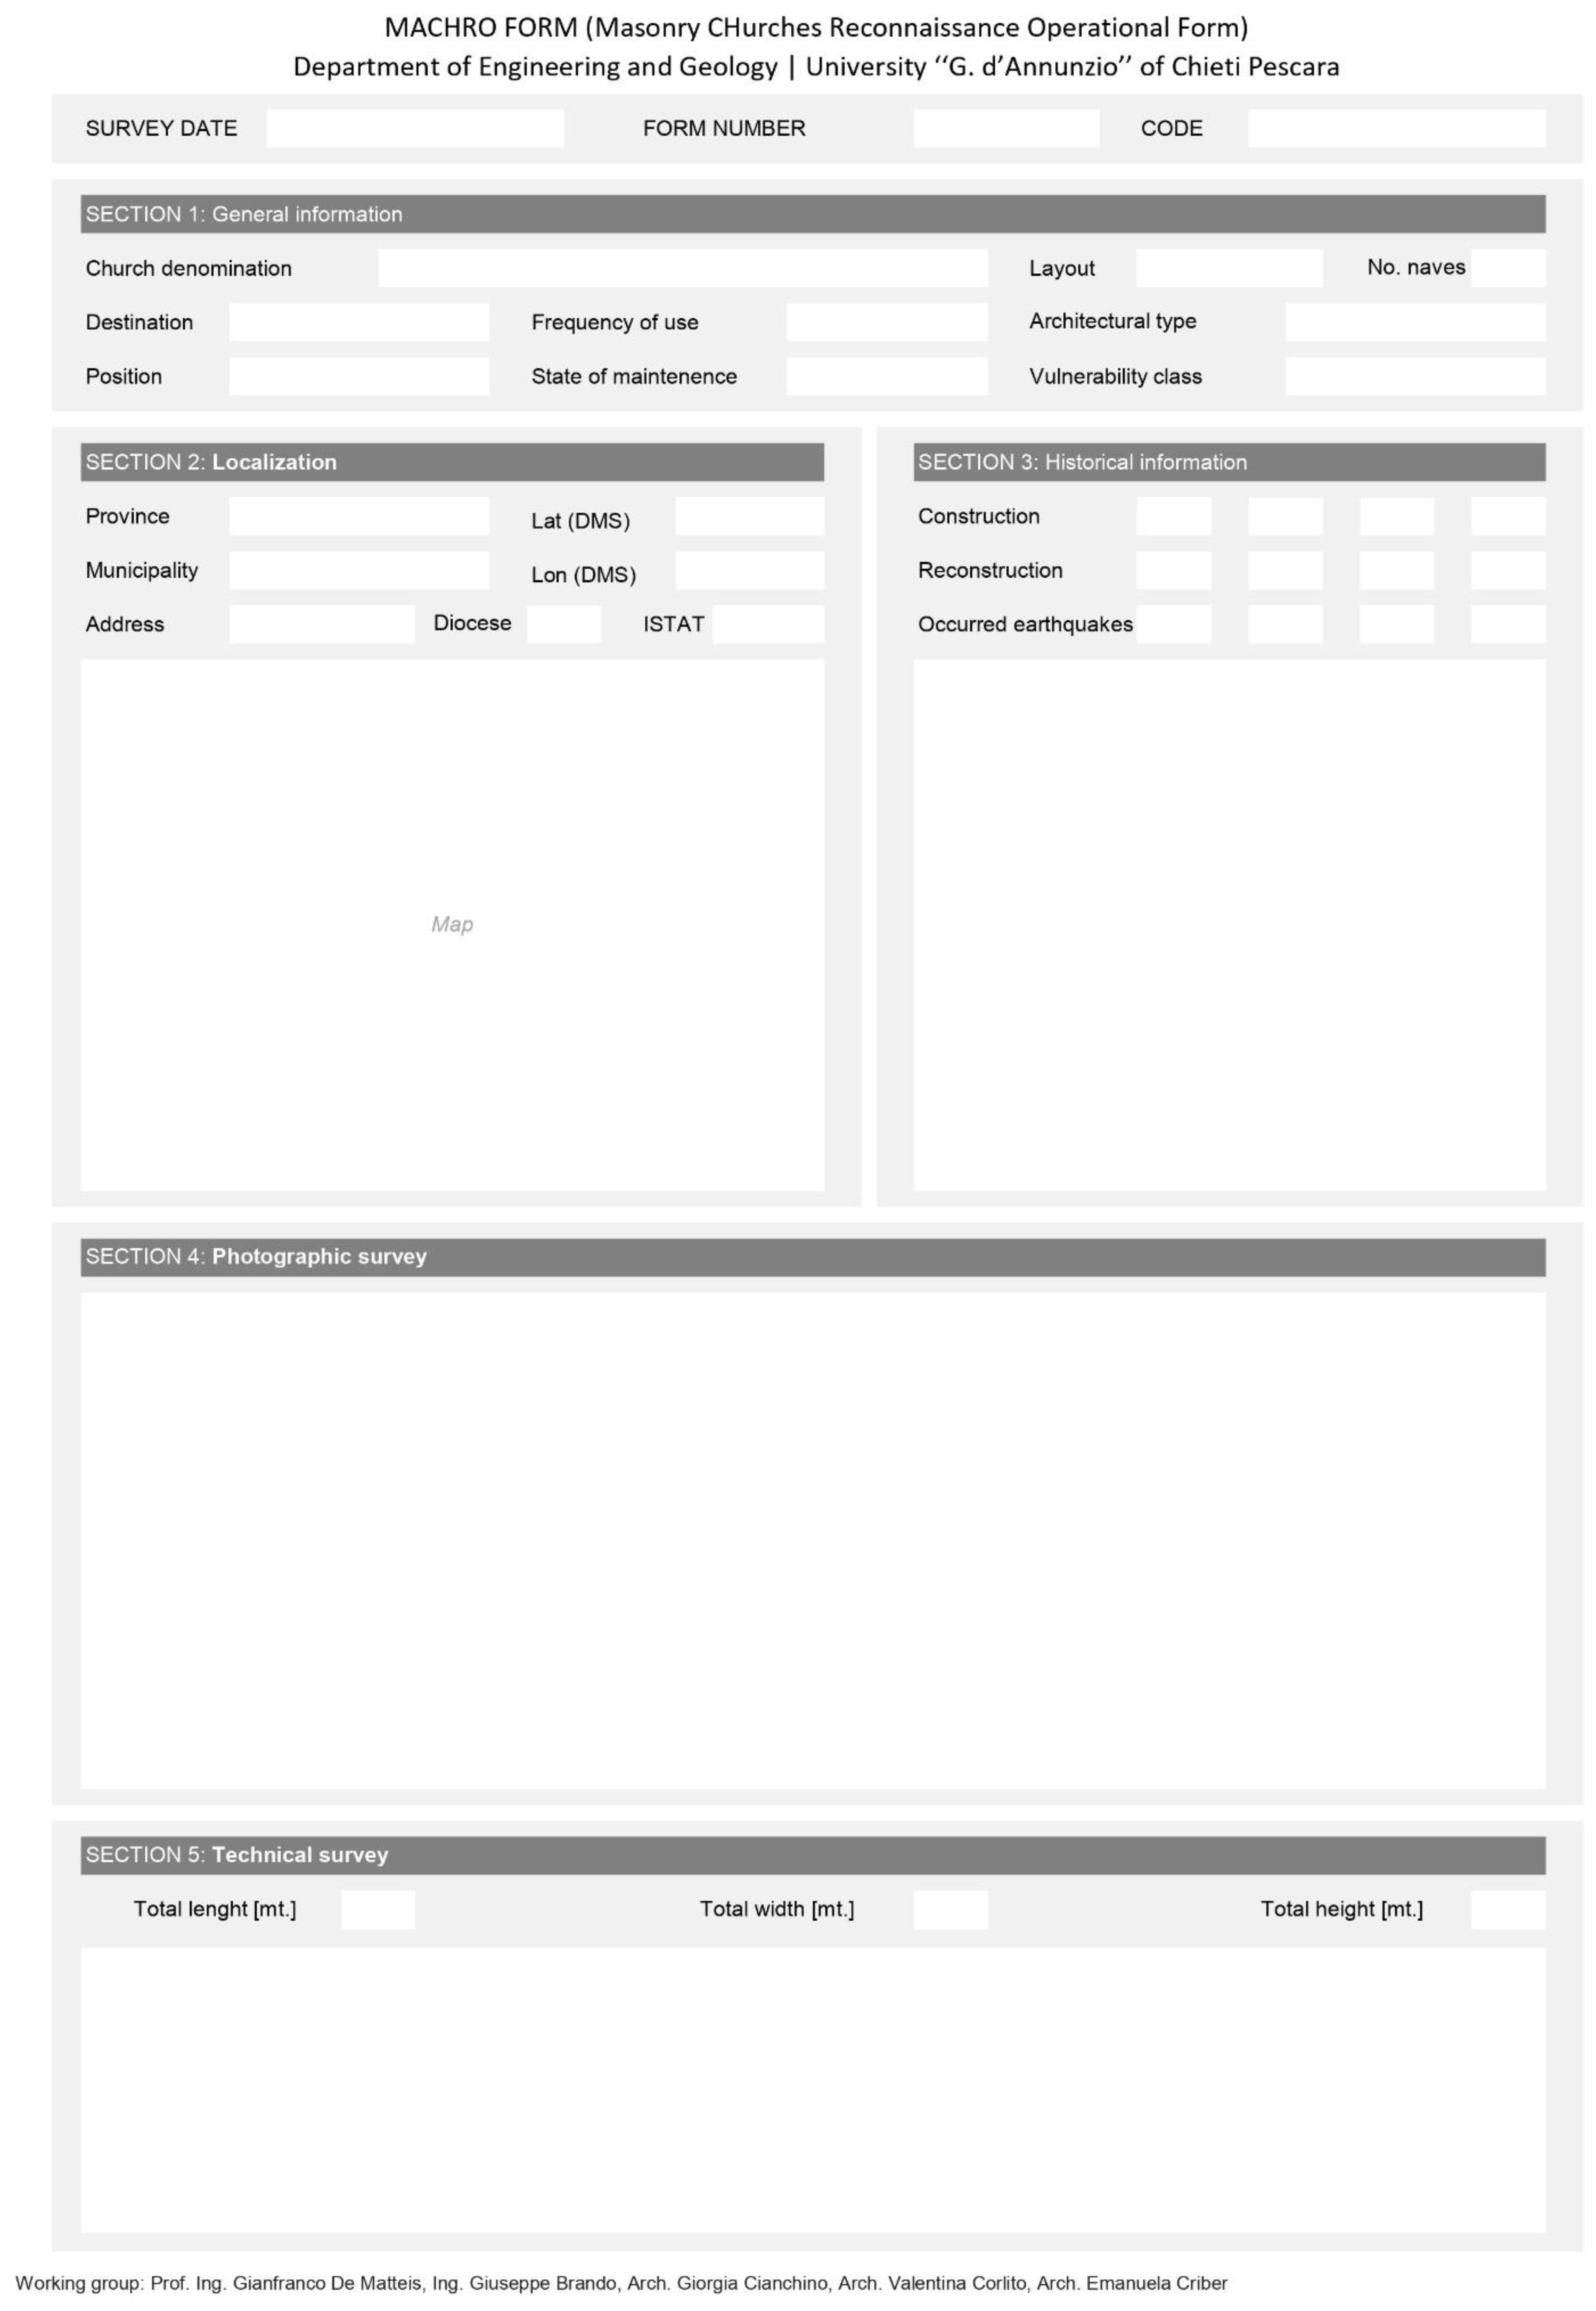
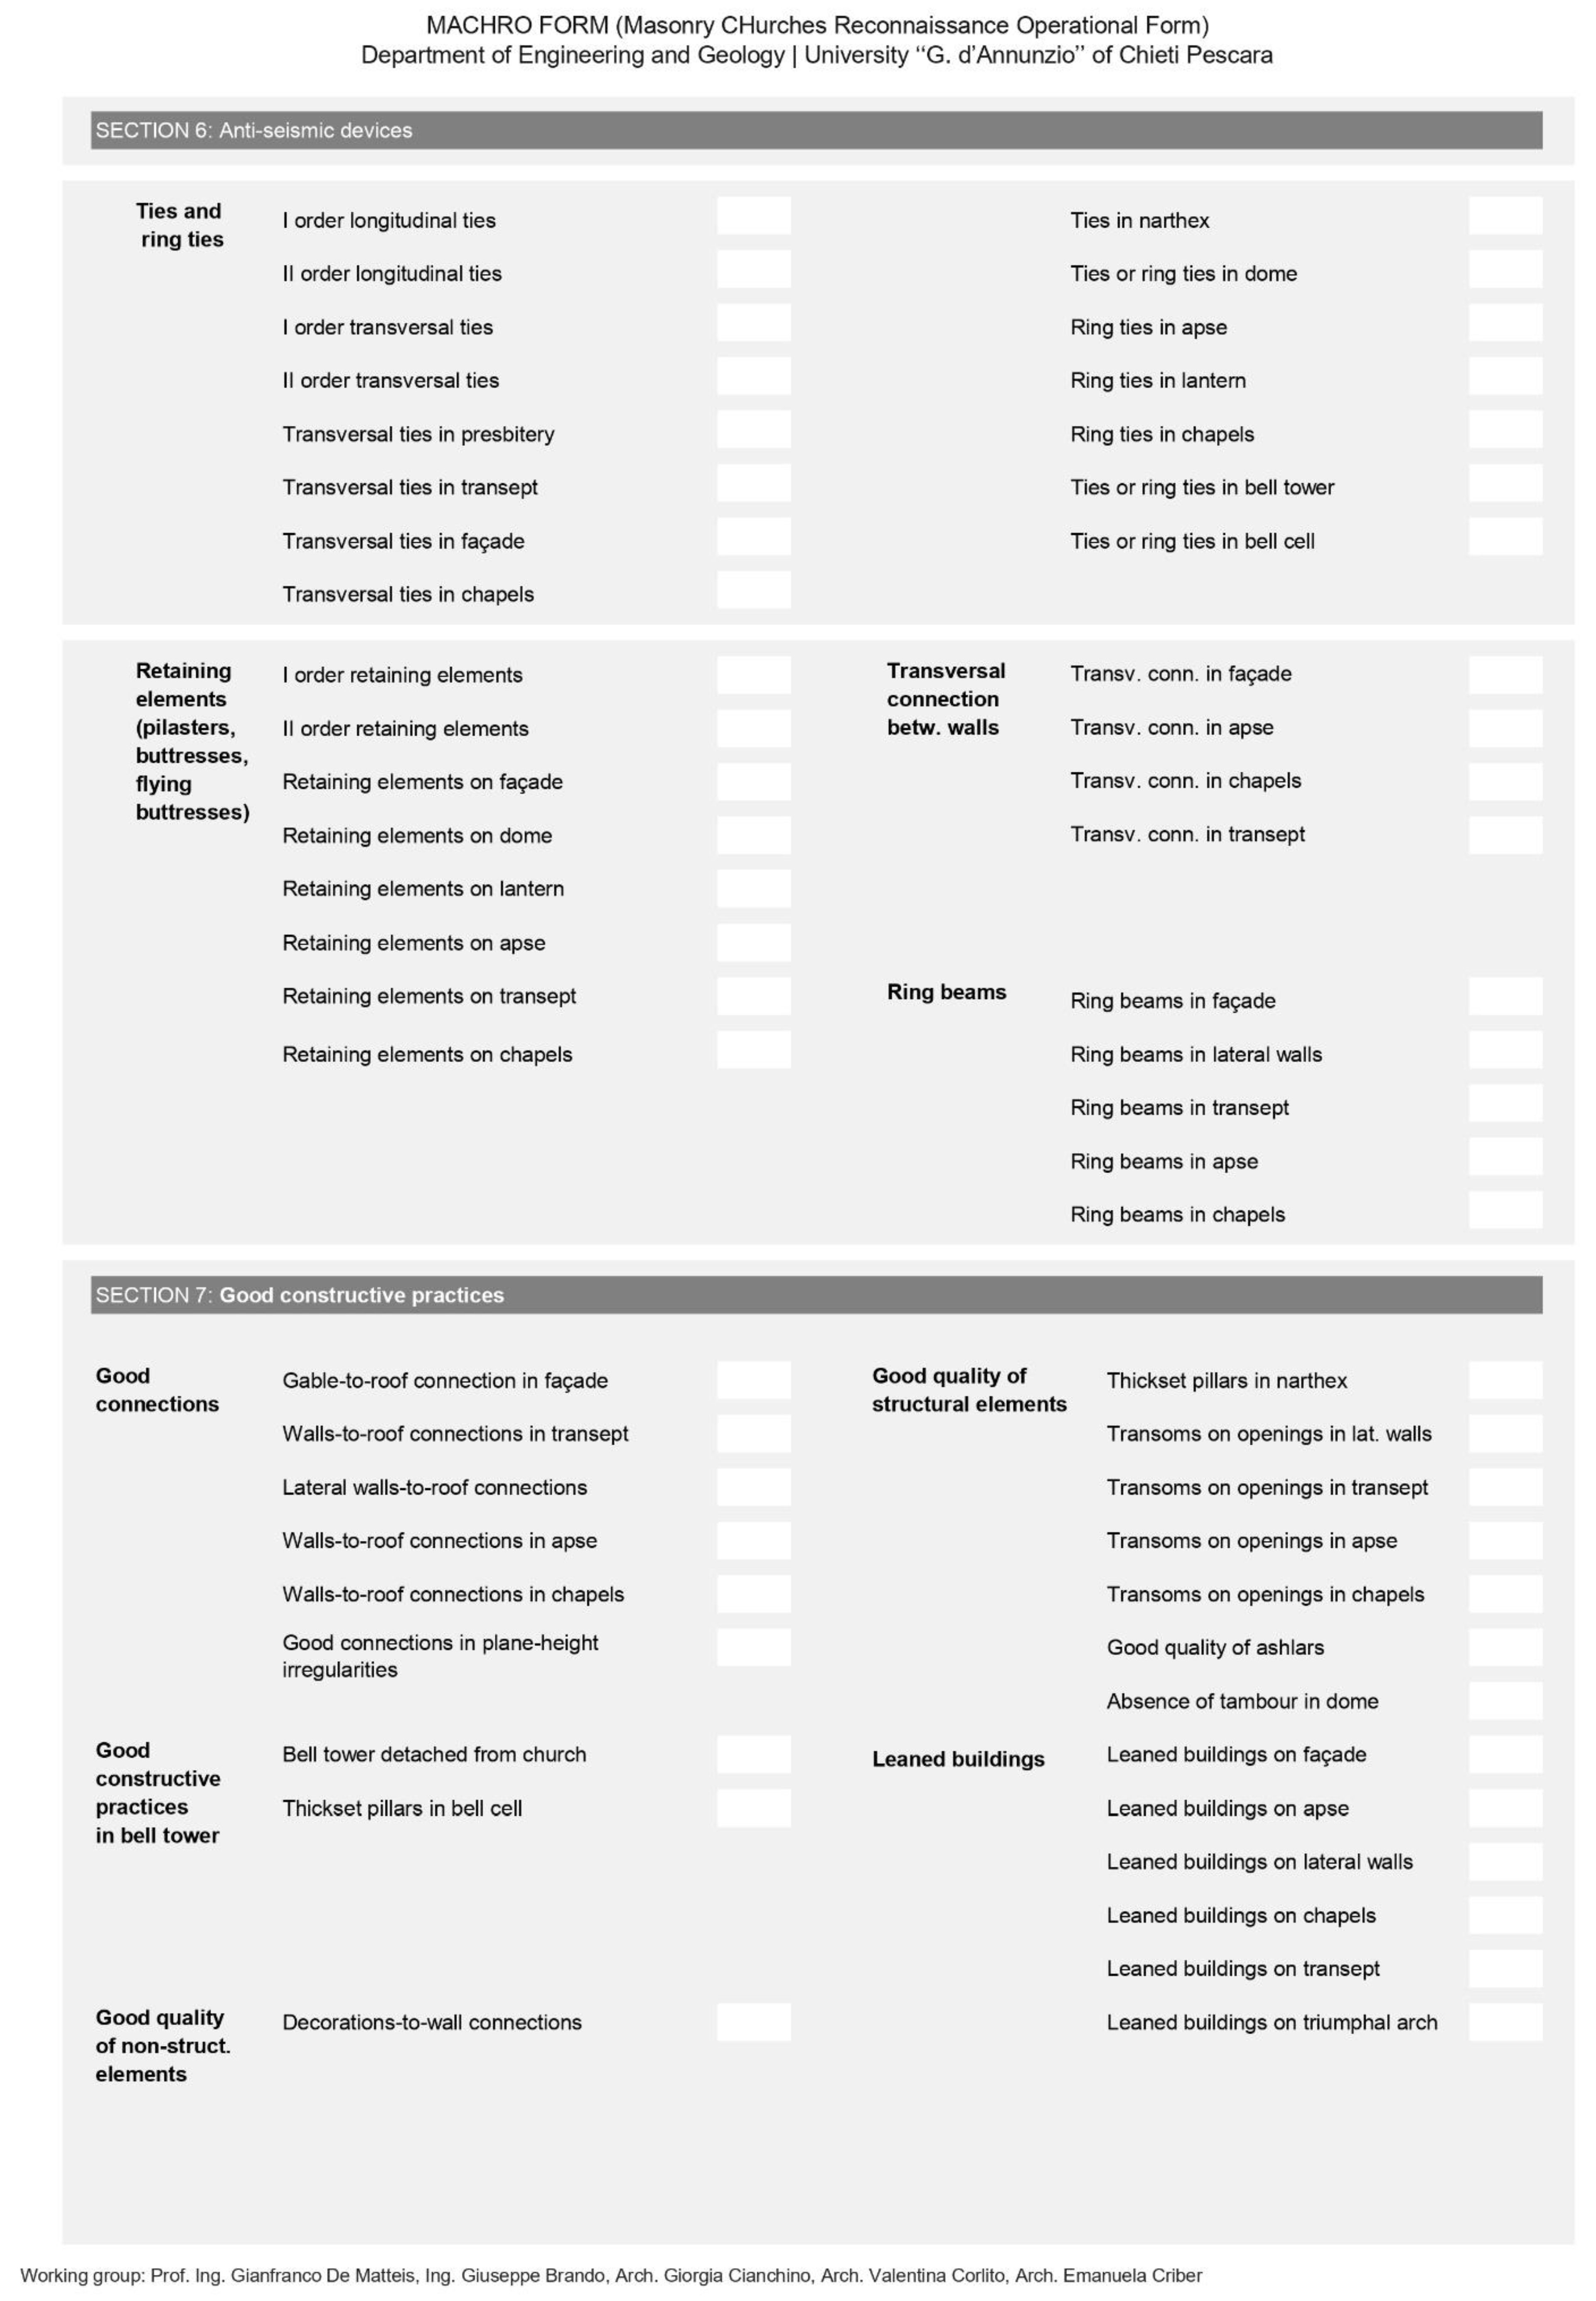
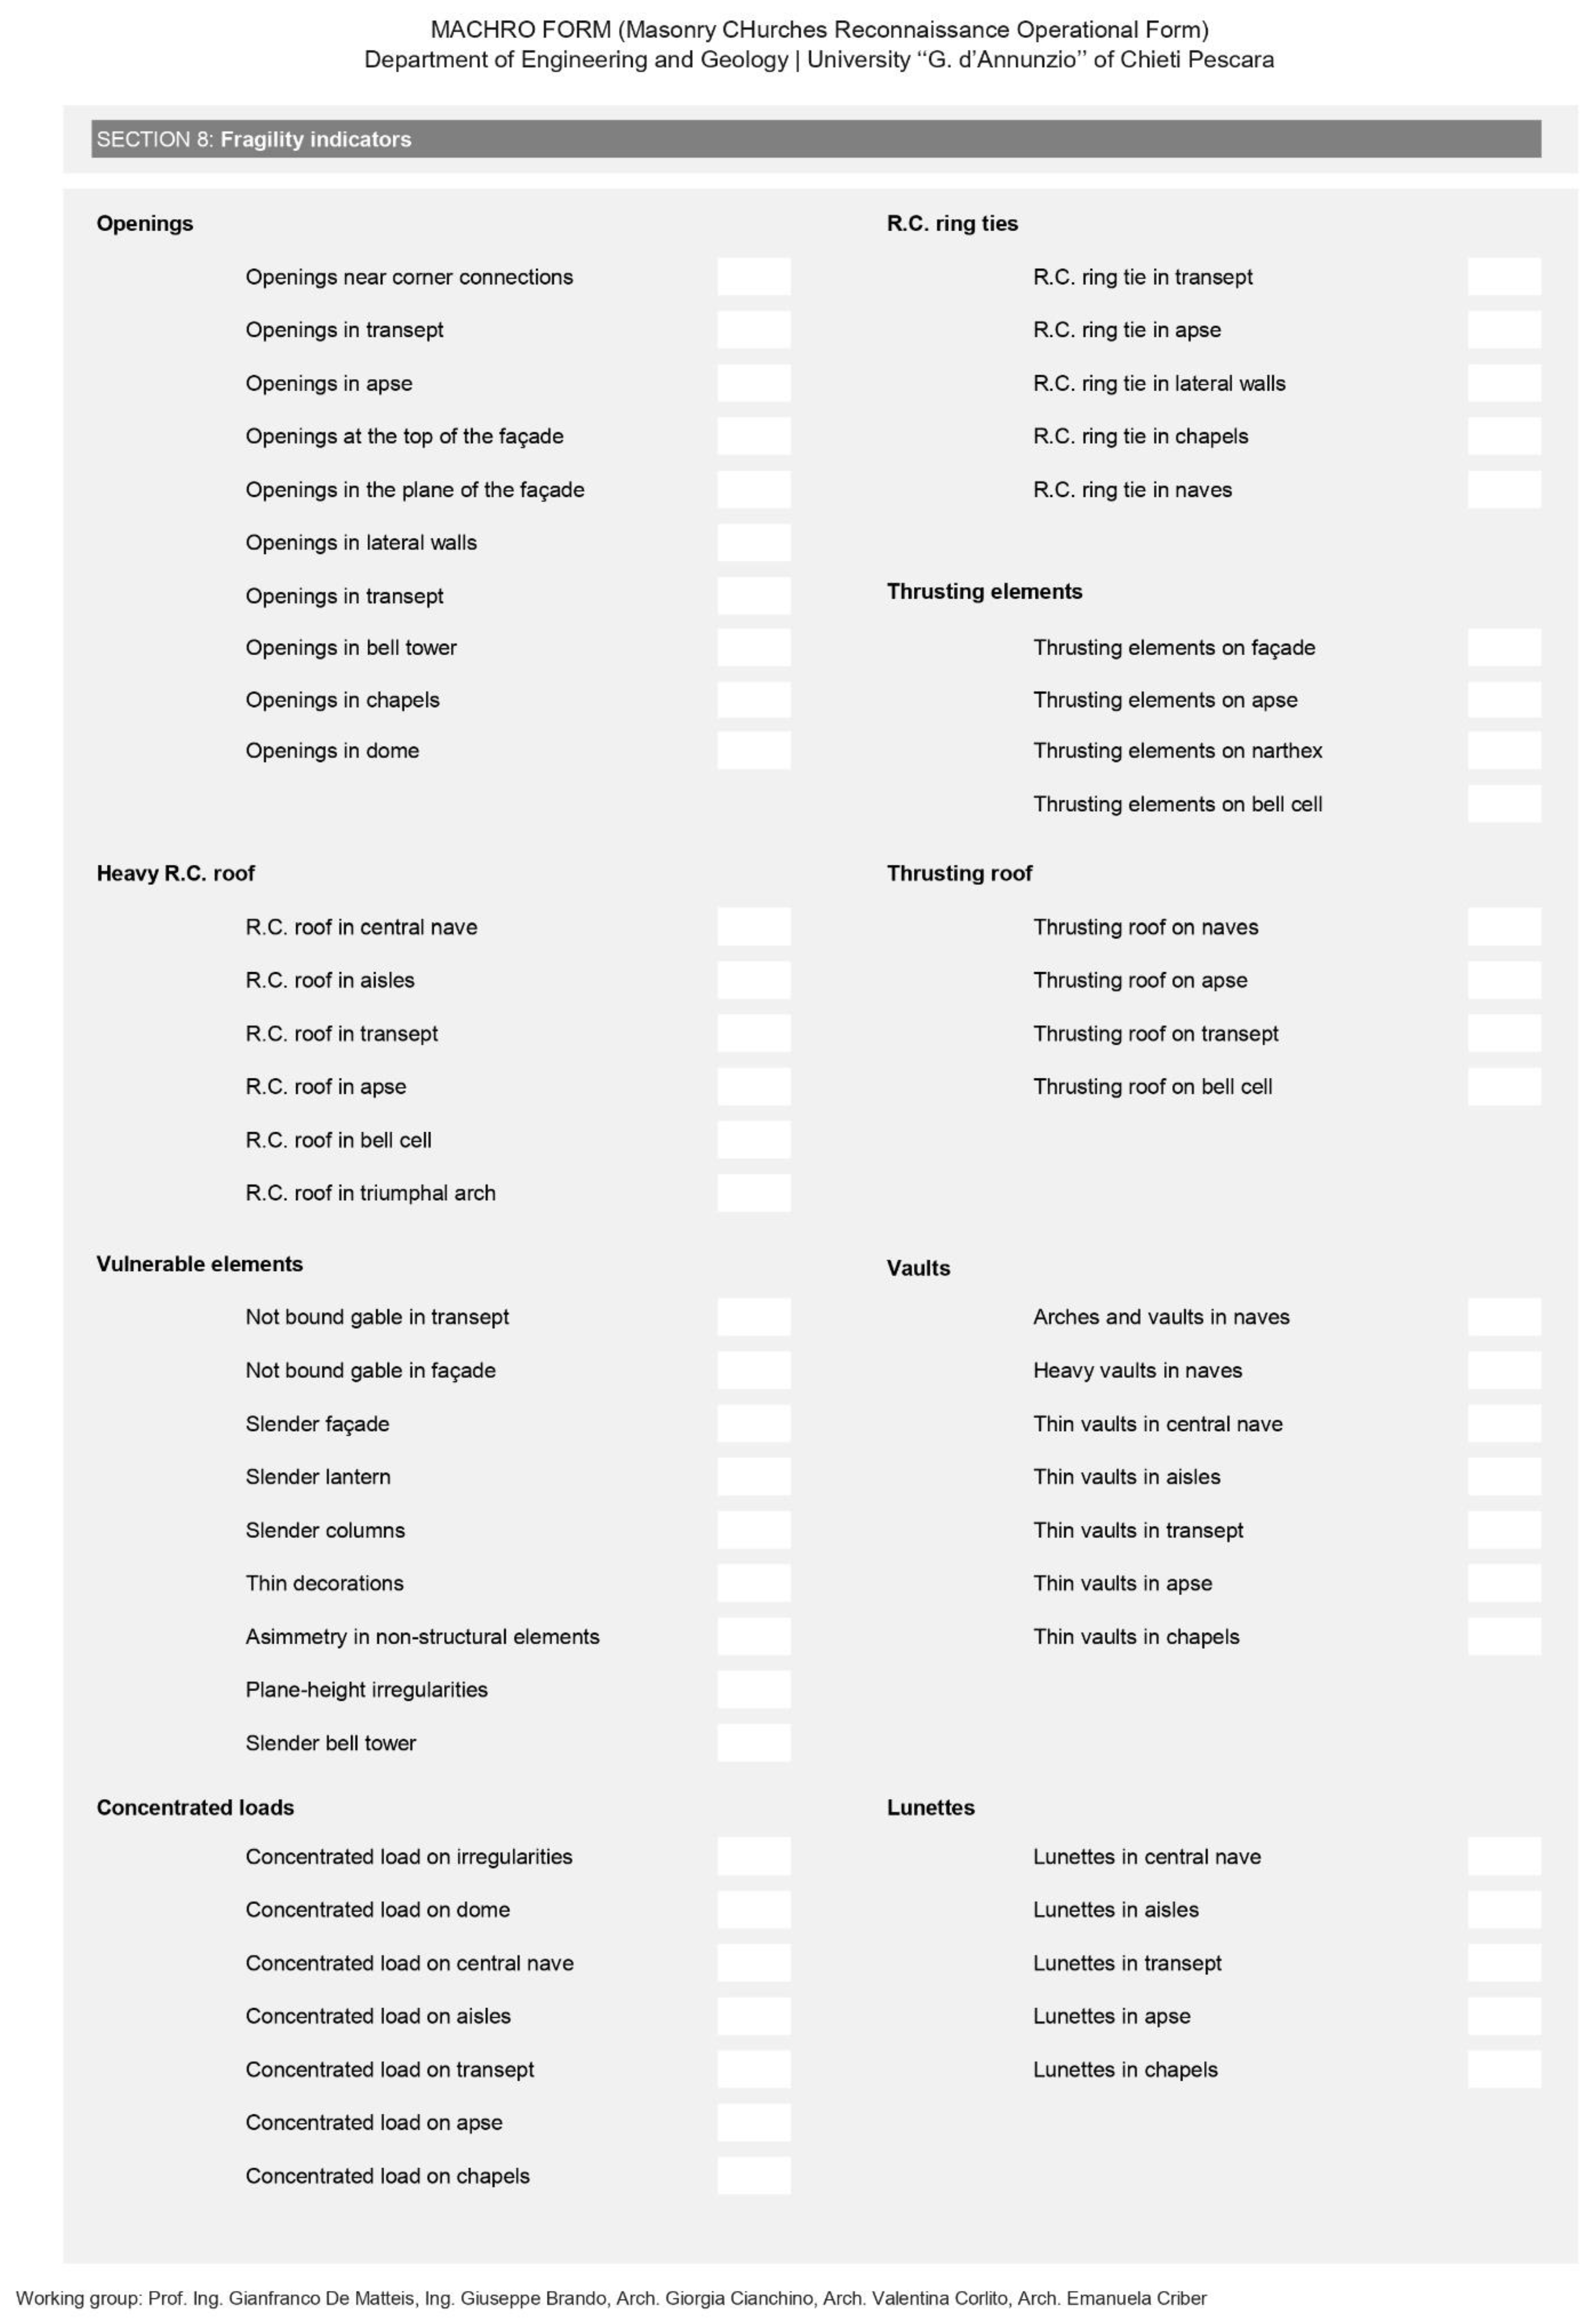
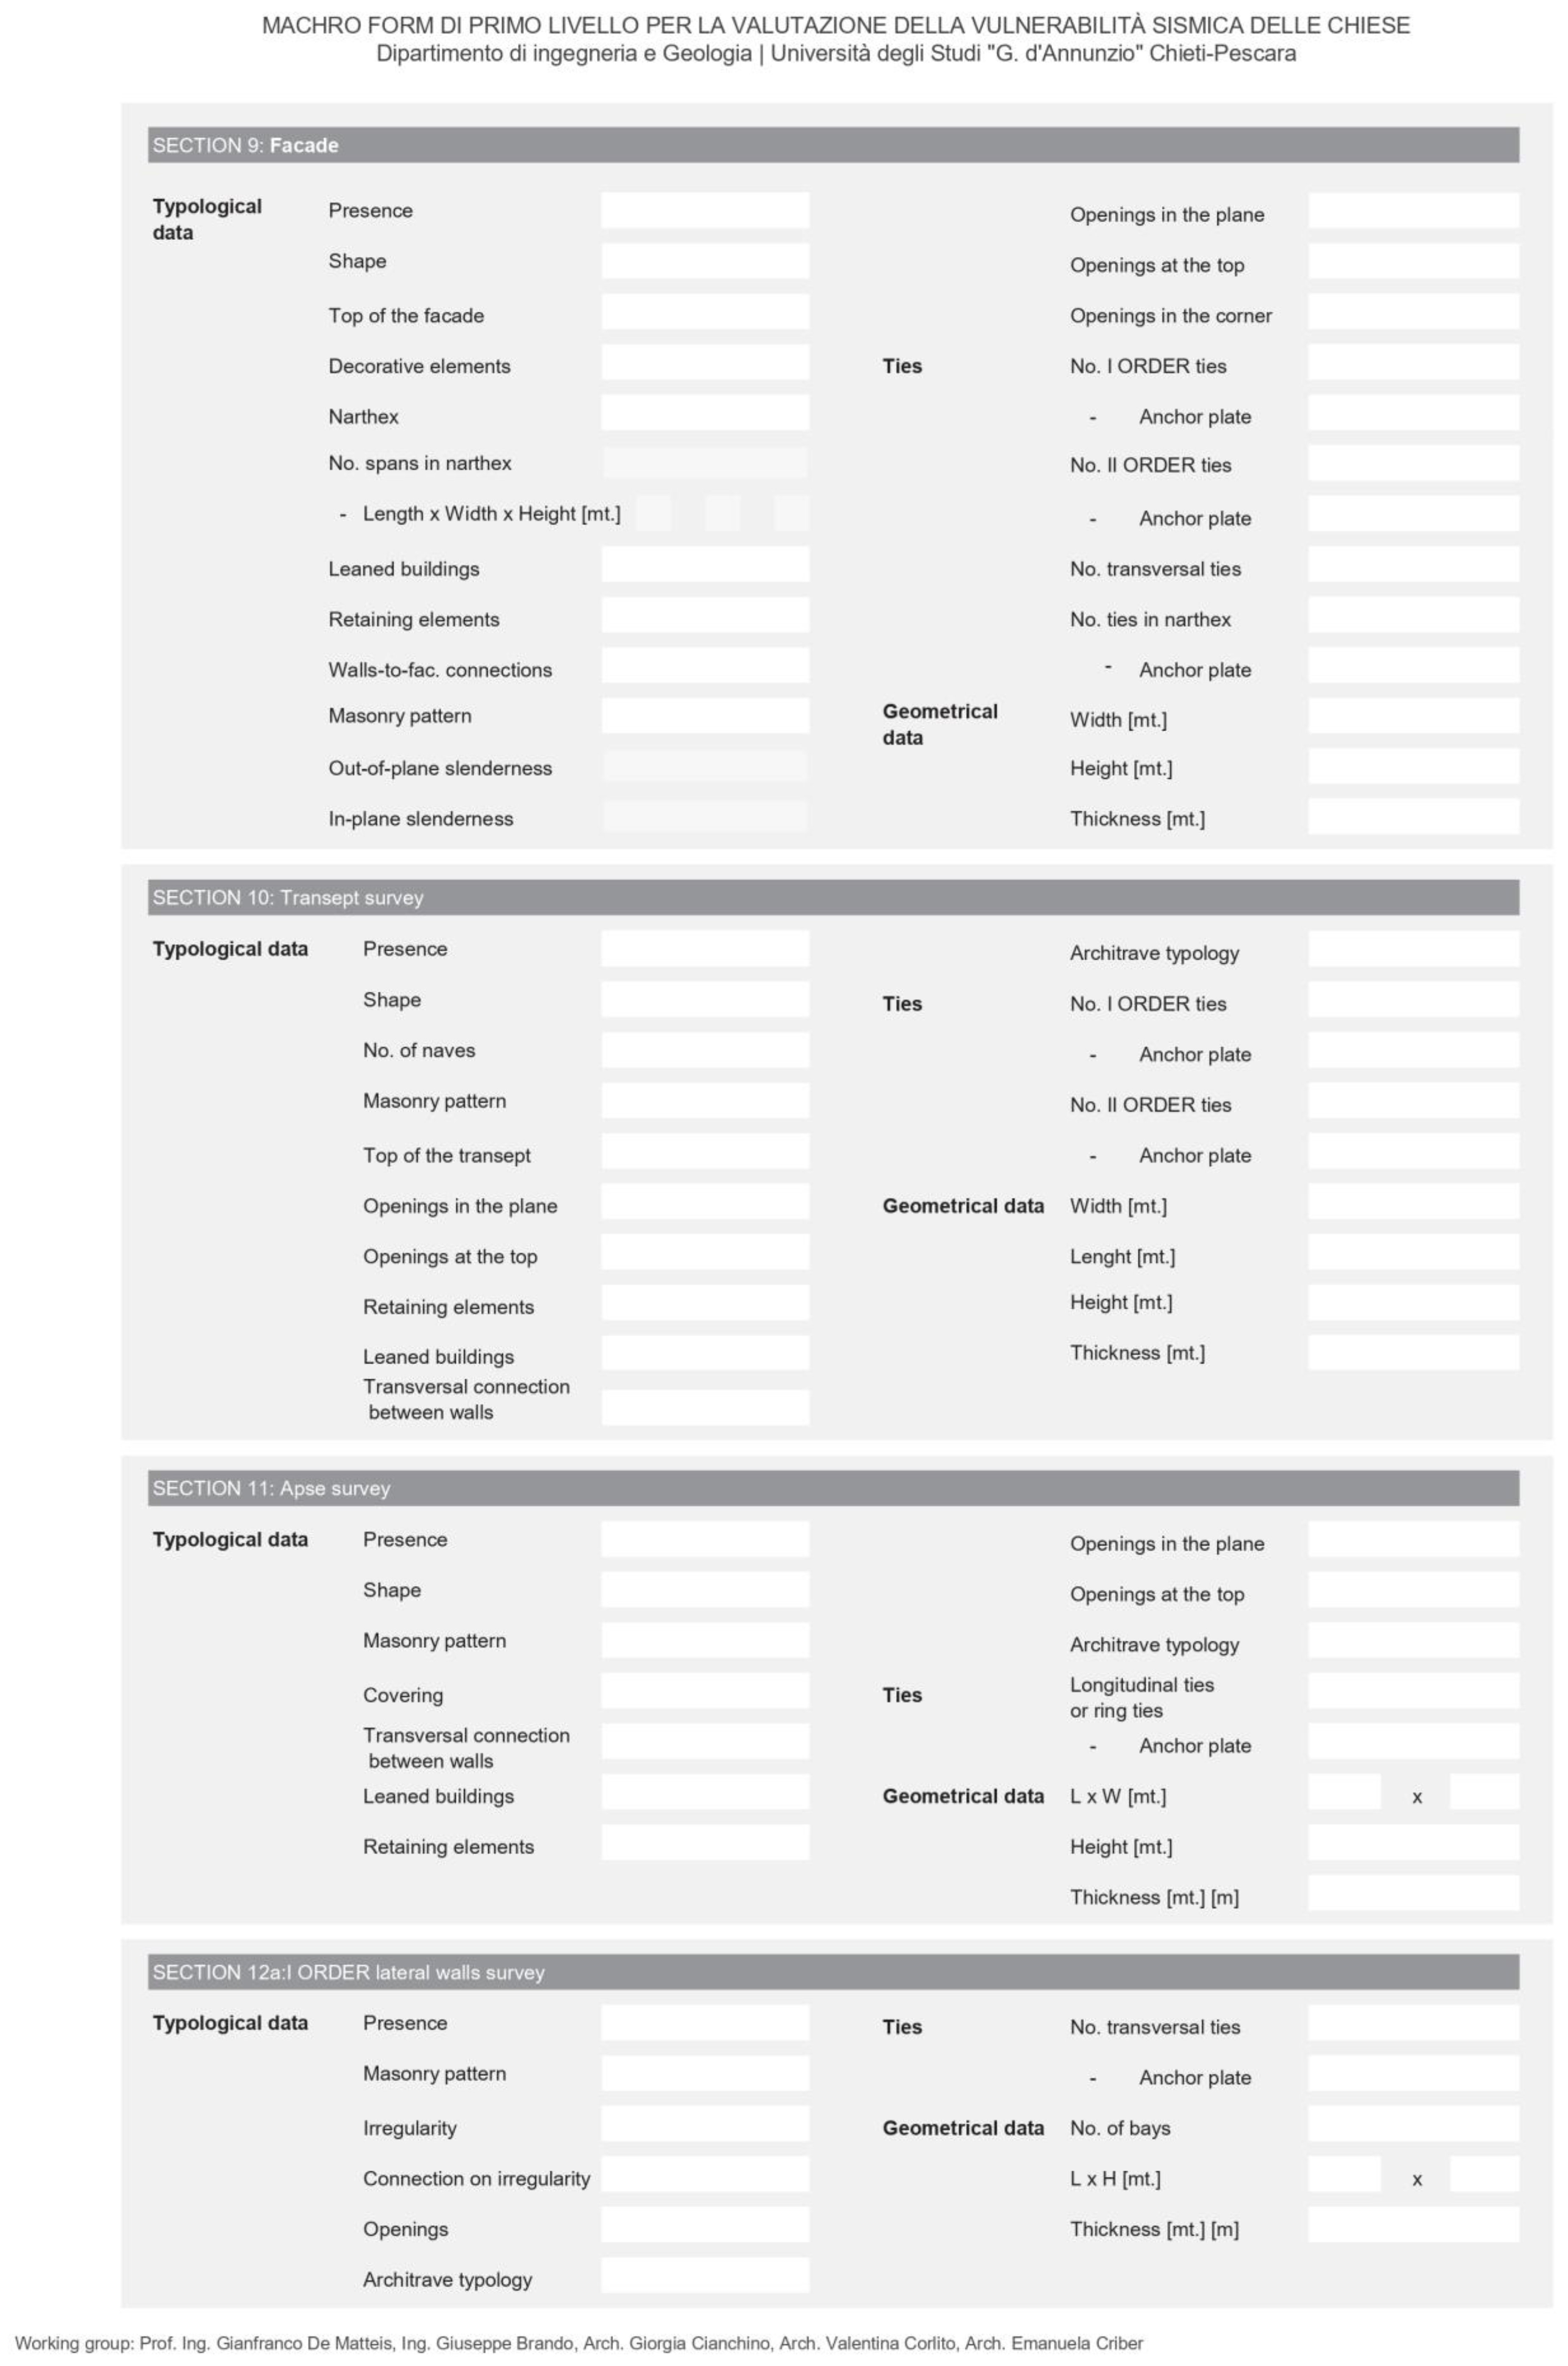
2.3. The MaCHRO Form
The empirical methodology described above may be subject to a high level of uncertainty because of the subjectivity of the engineering judgments required. In the interest of reducing potential biases, the main features of the churches discussed in this paper were identified through the MaCHRO form [17]. Unlike other similar forms, such as the GNDT form [18], the MACHRO form (where MaCHRO stands for Masonry CHurches Reconnaissance Operational) is an automated tool. It consists of a worksheet conceived by the authors which requires the compiler to describe the considered church by selecting basic information concerning the configuration of the macro-elements and any applied anti-seismic devices, without assigning scores. Once the information is entered, the MaCHRO form automatically associates the scores needed in Equations (2) and (3), which are then used to compute the vulnerability index (Iv) of the church.
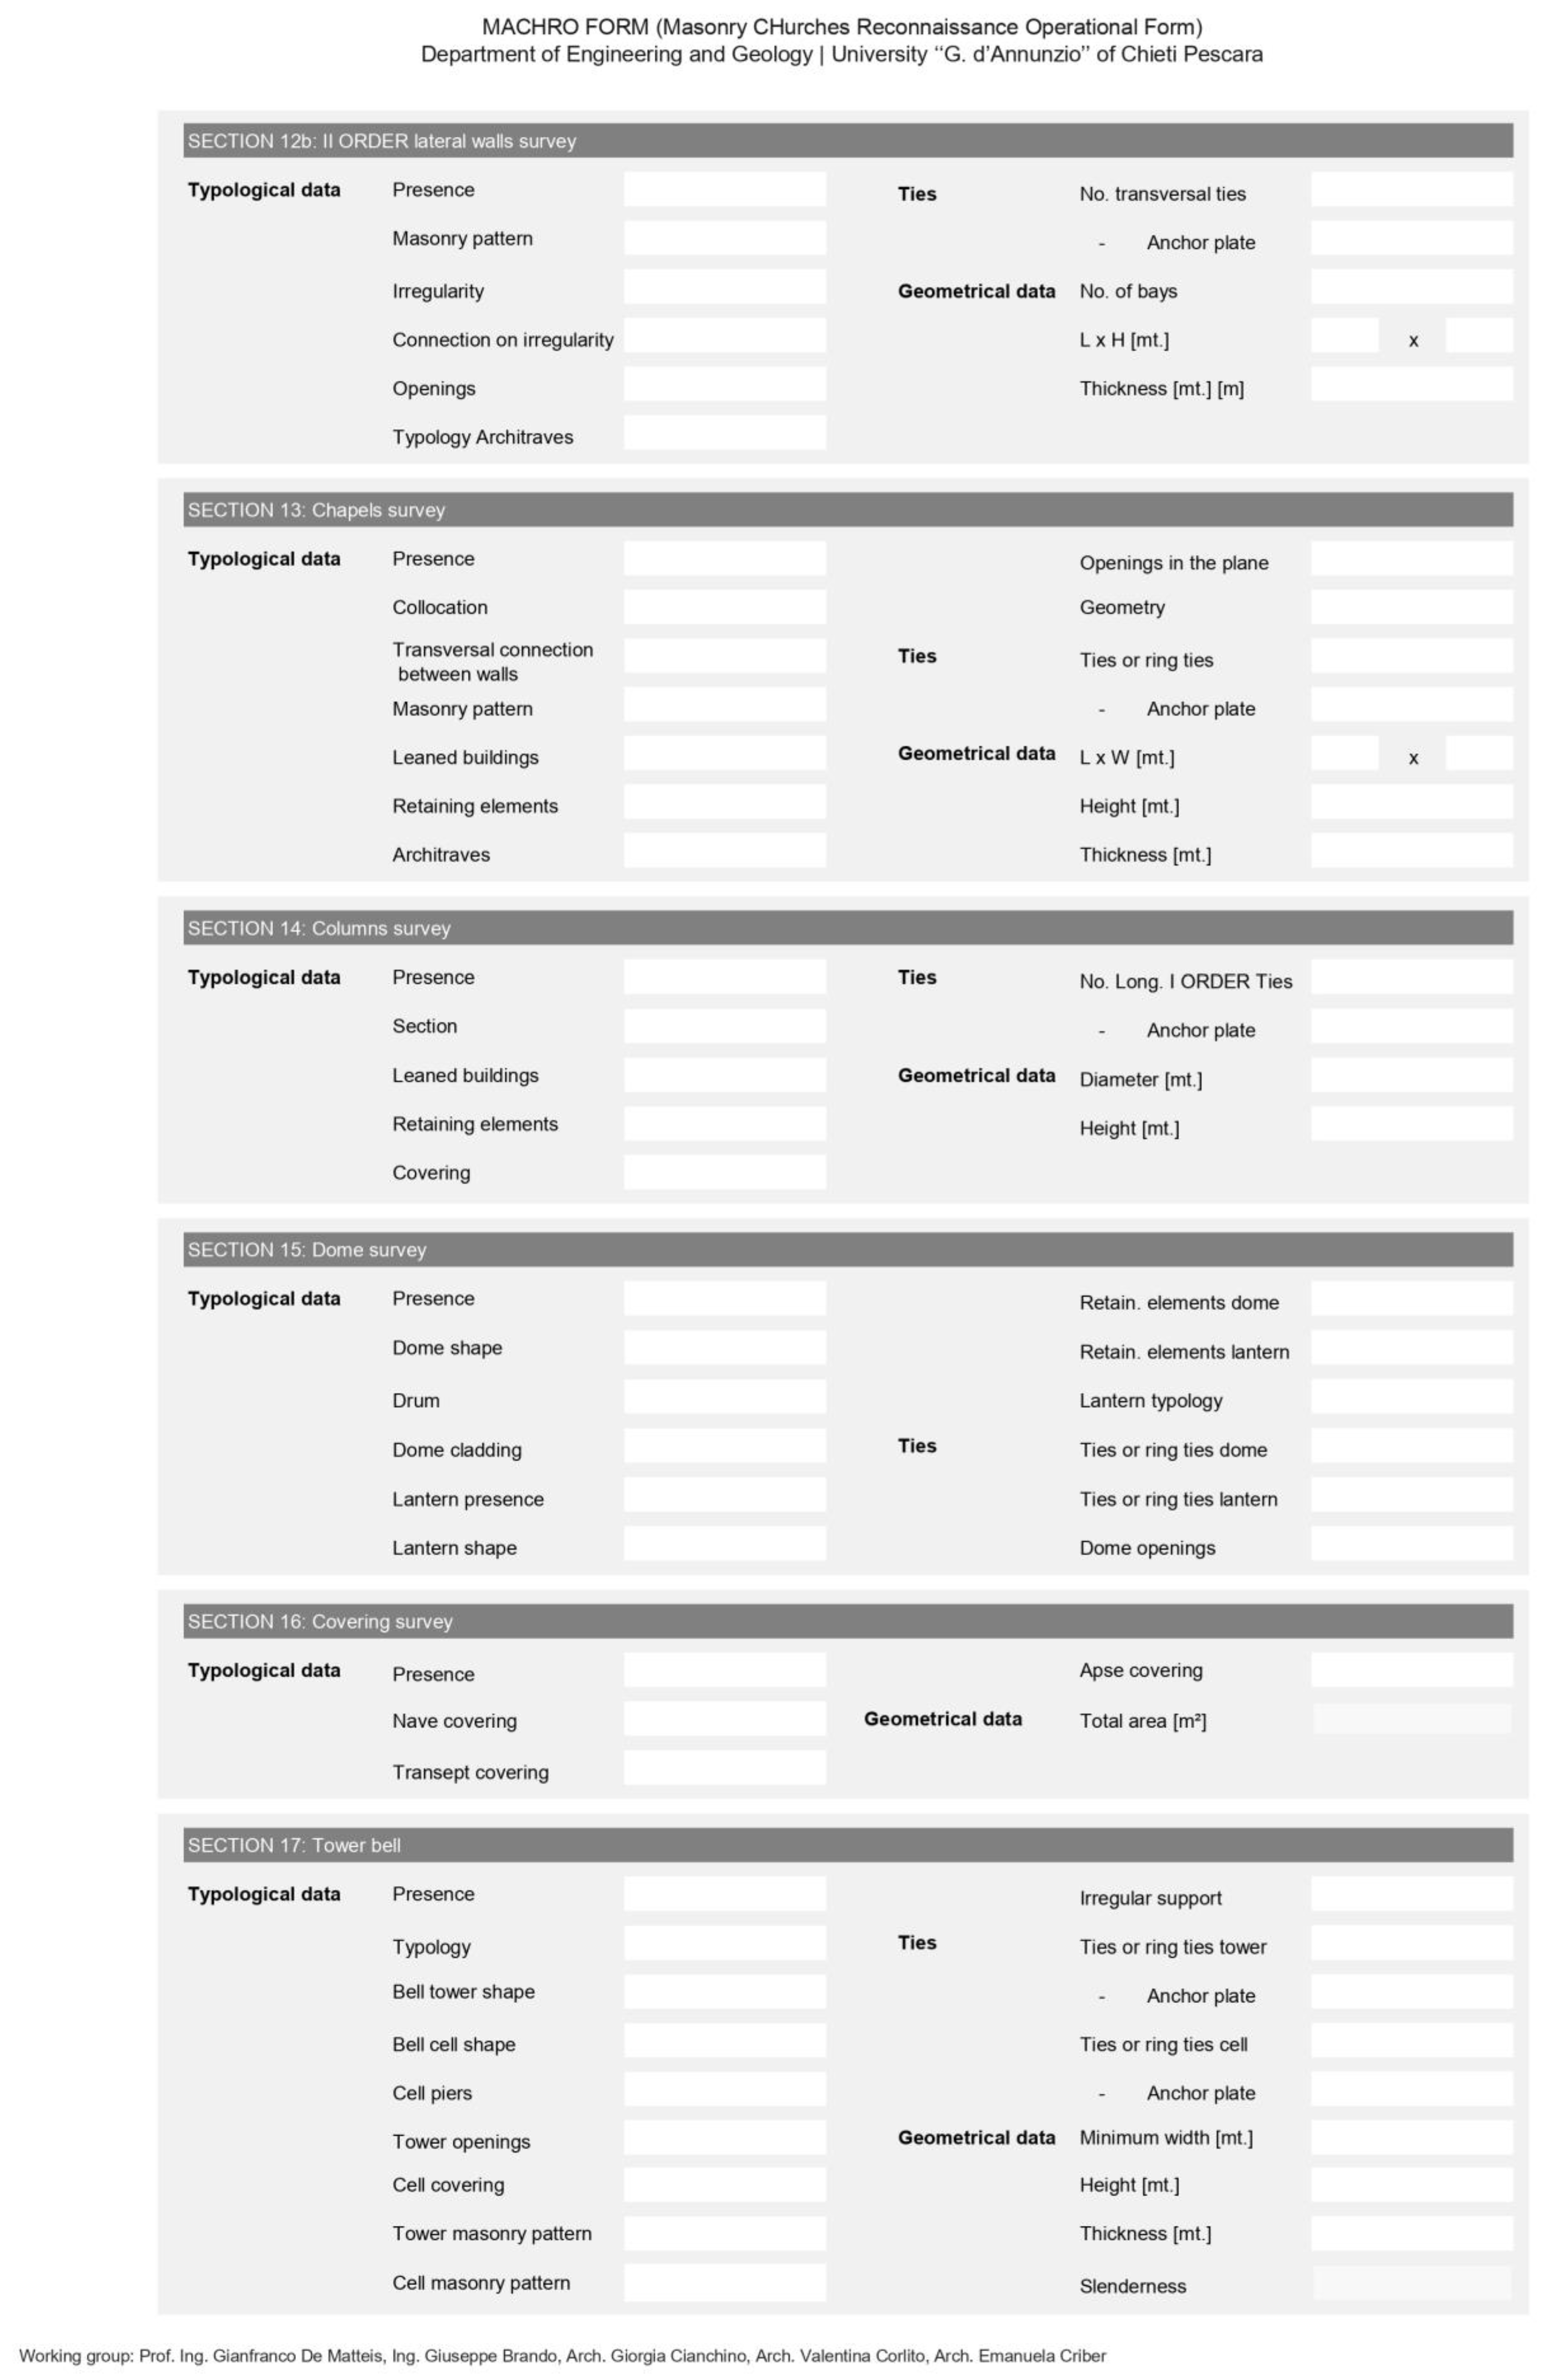
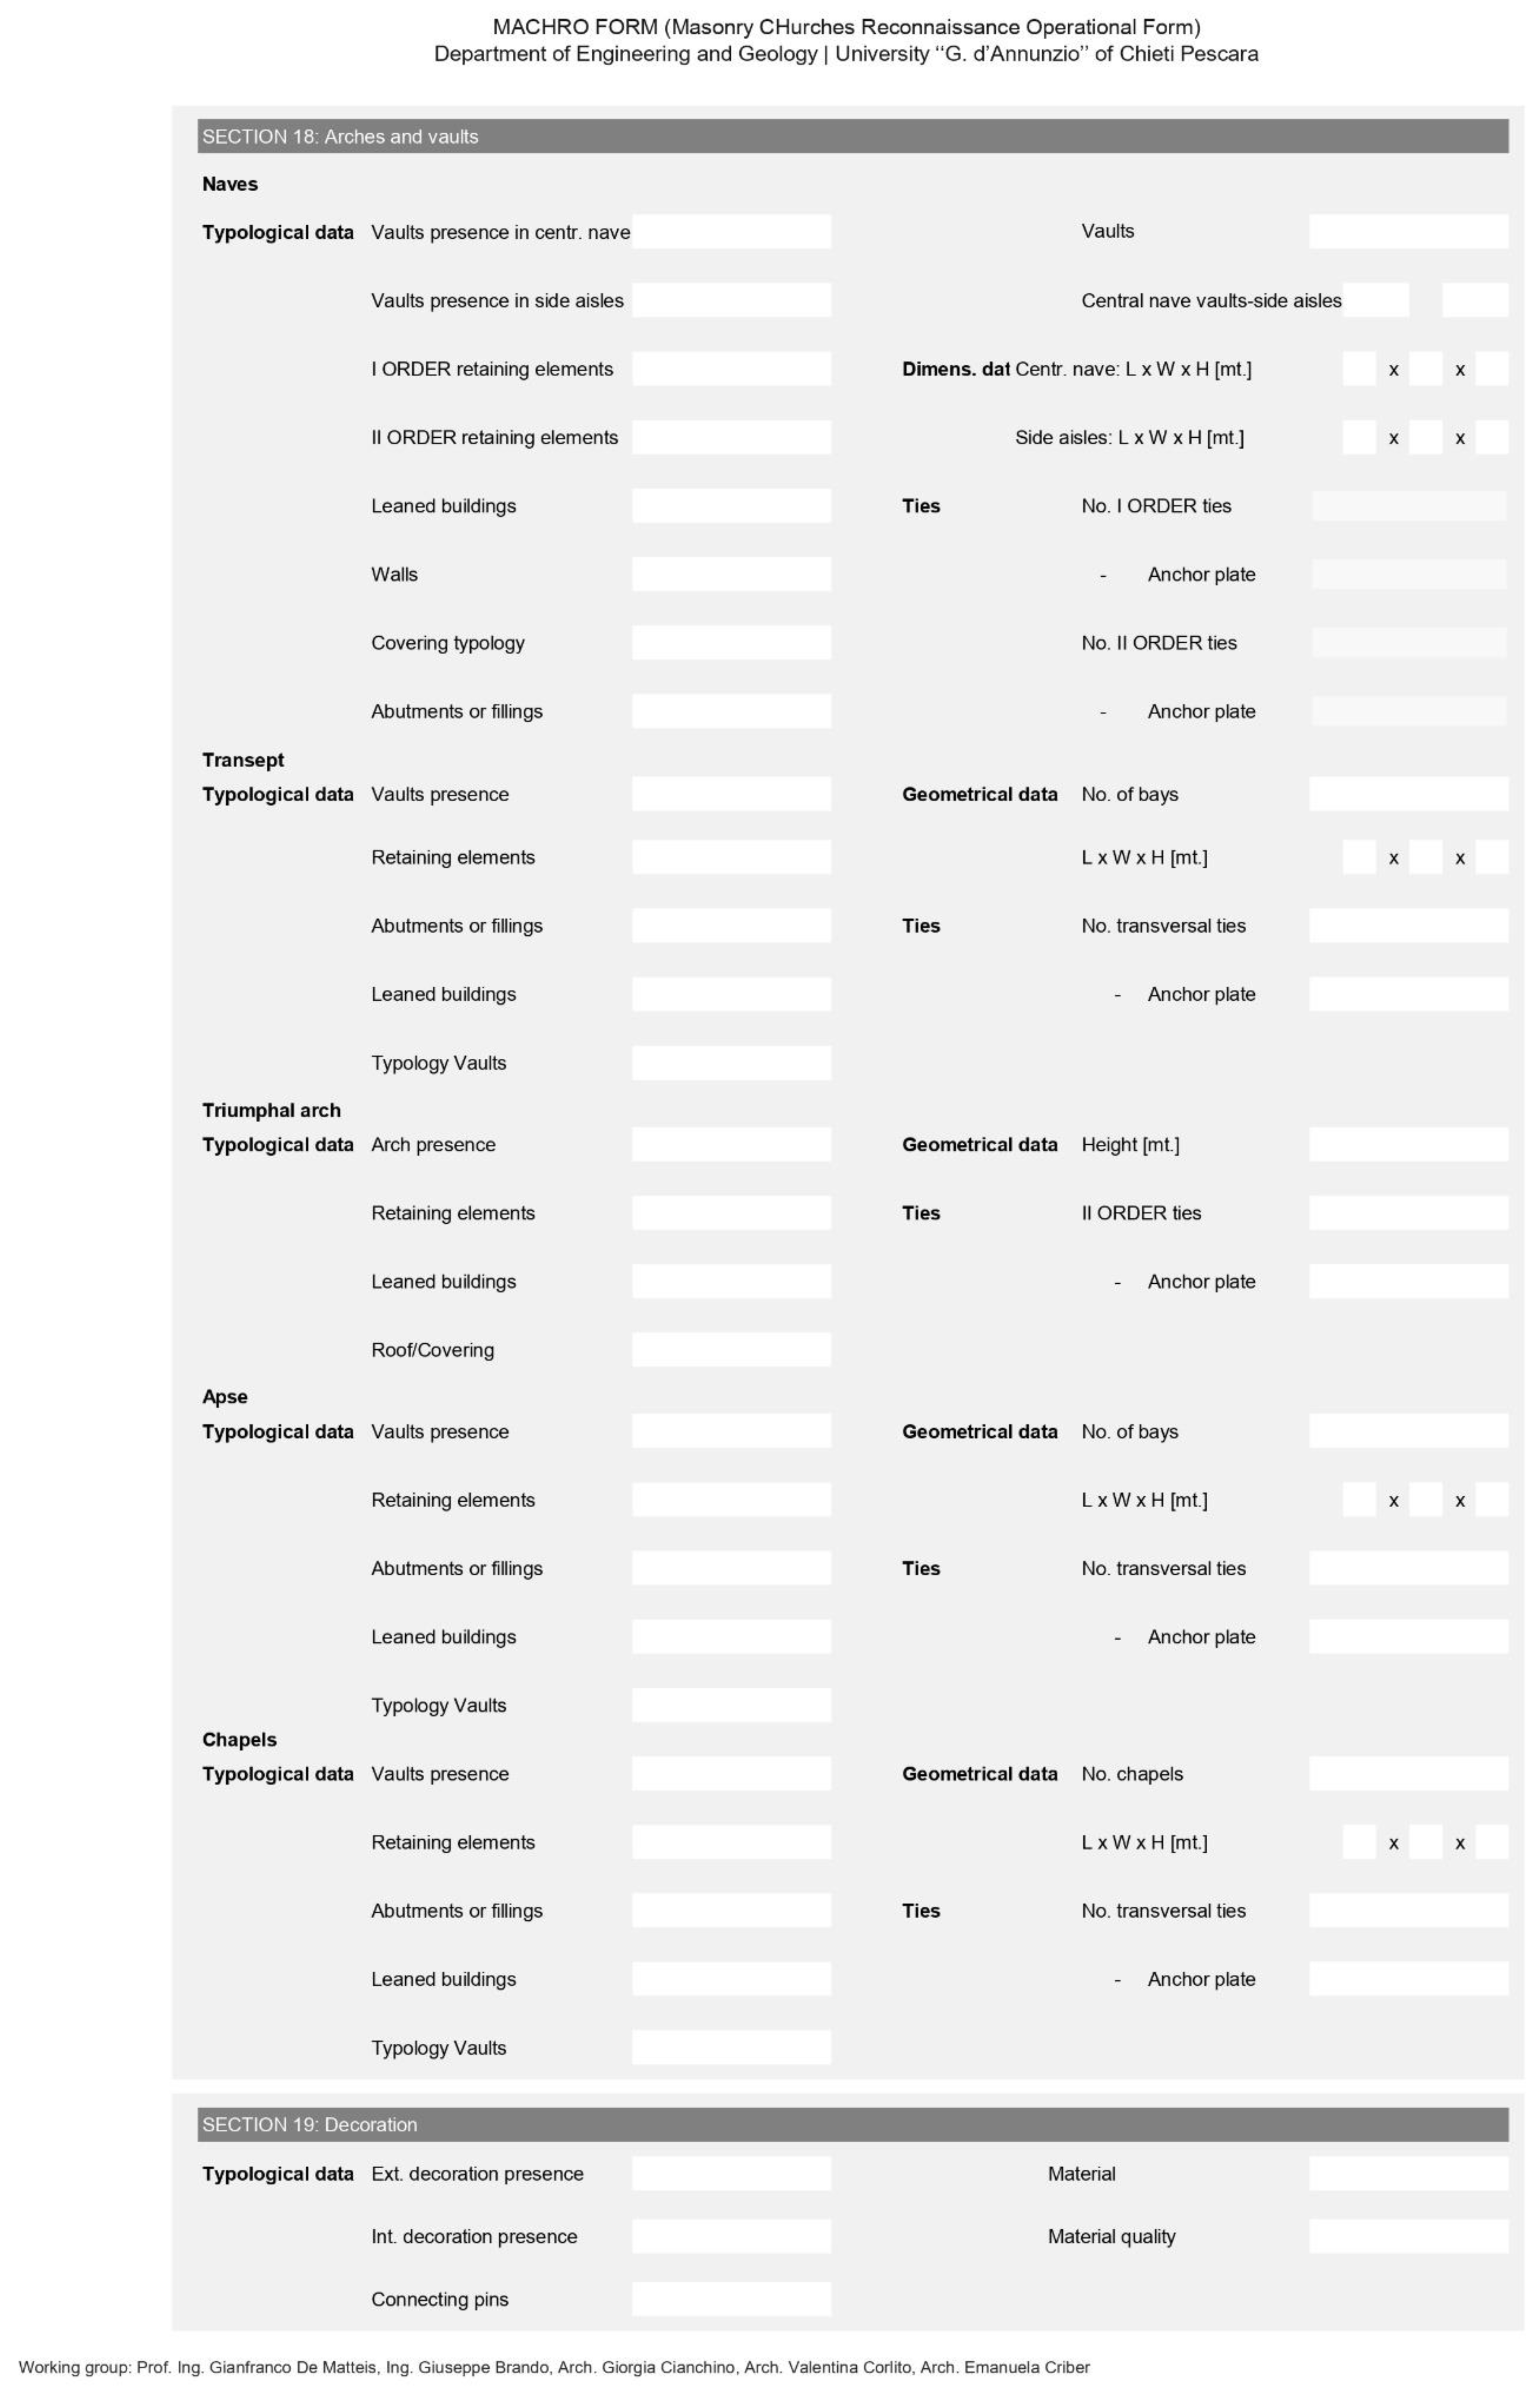
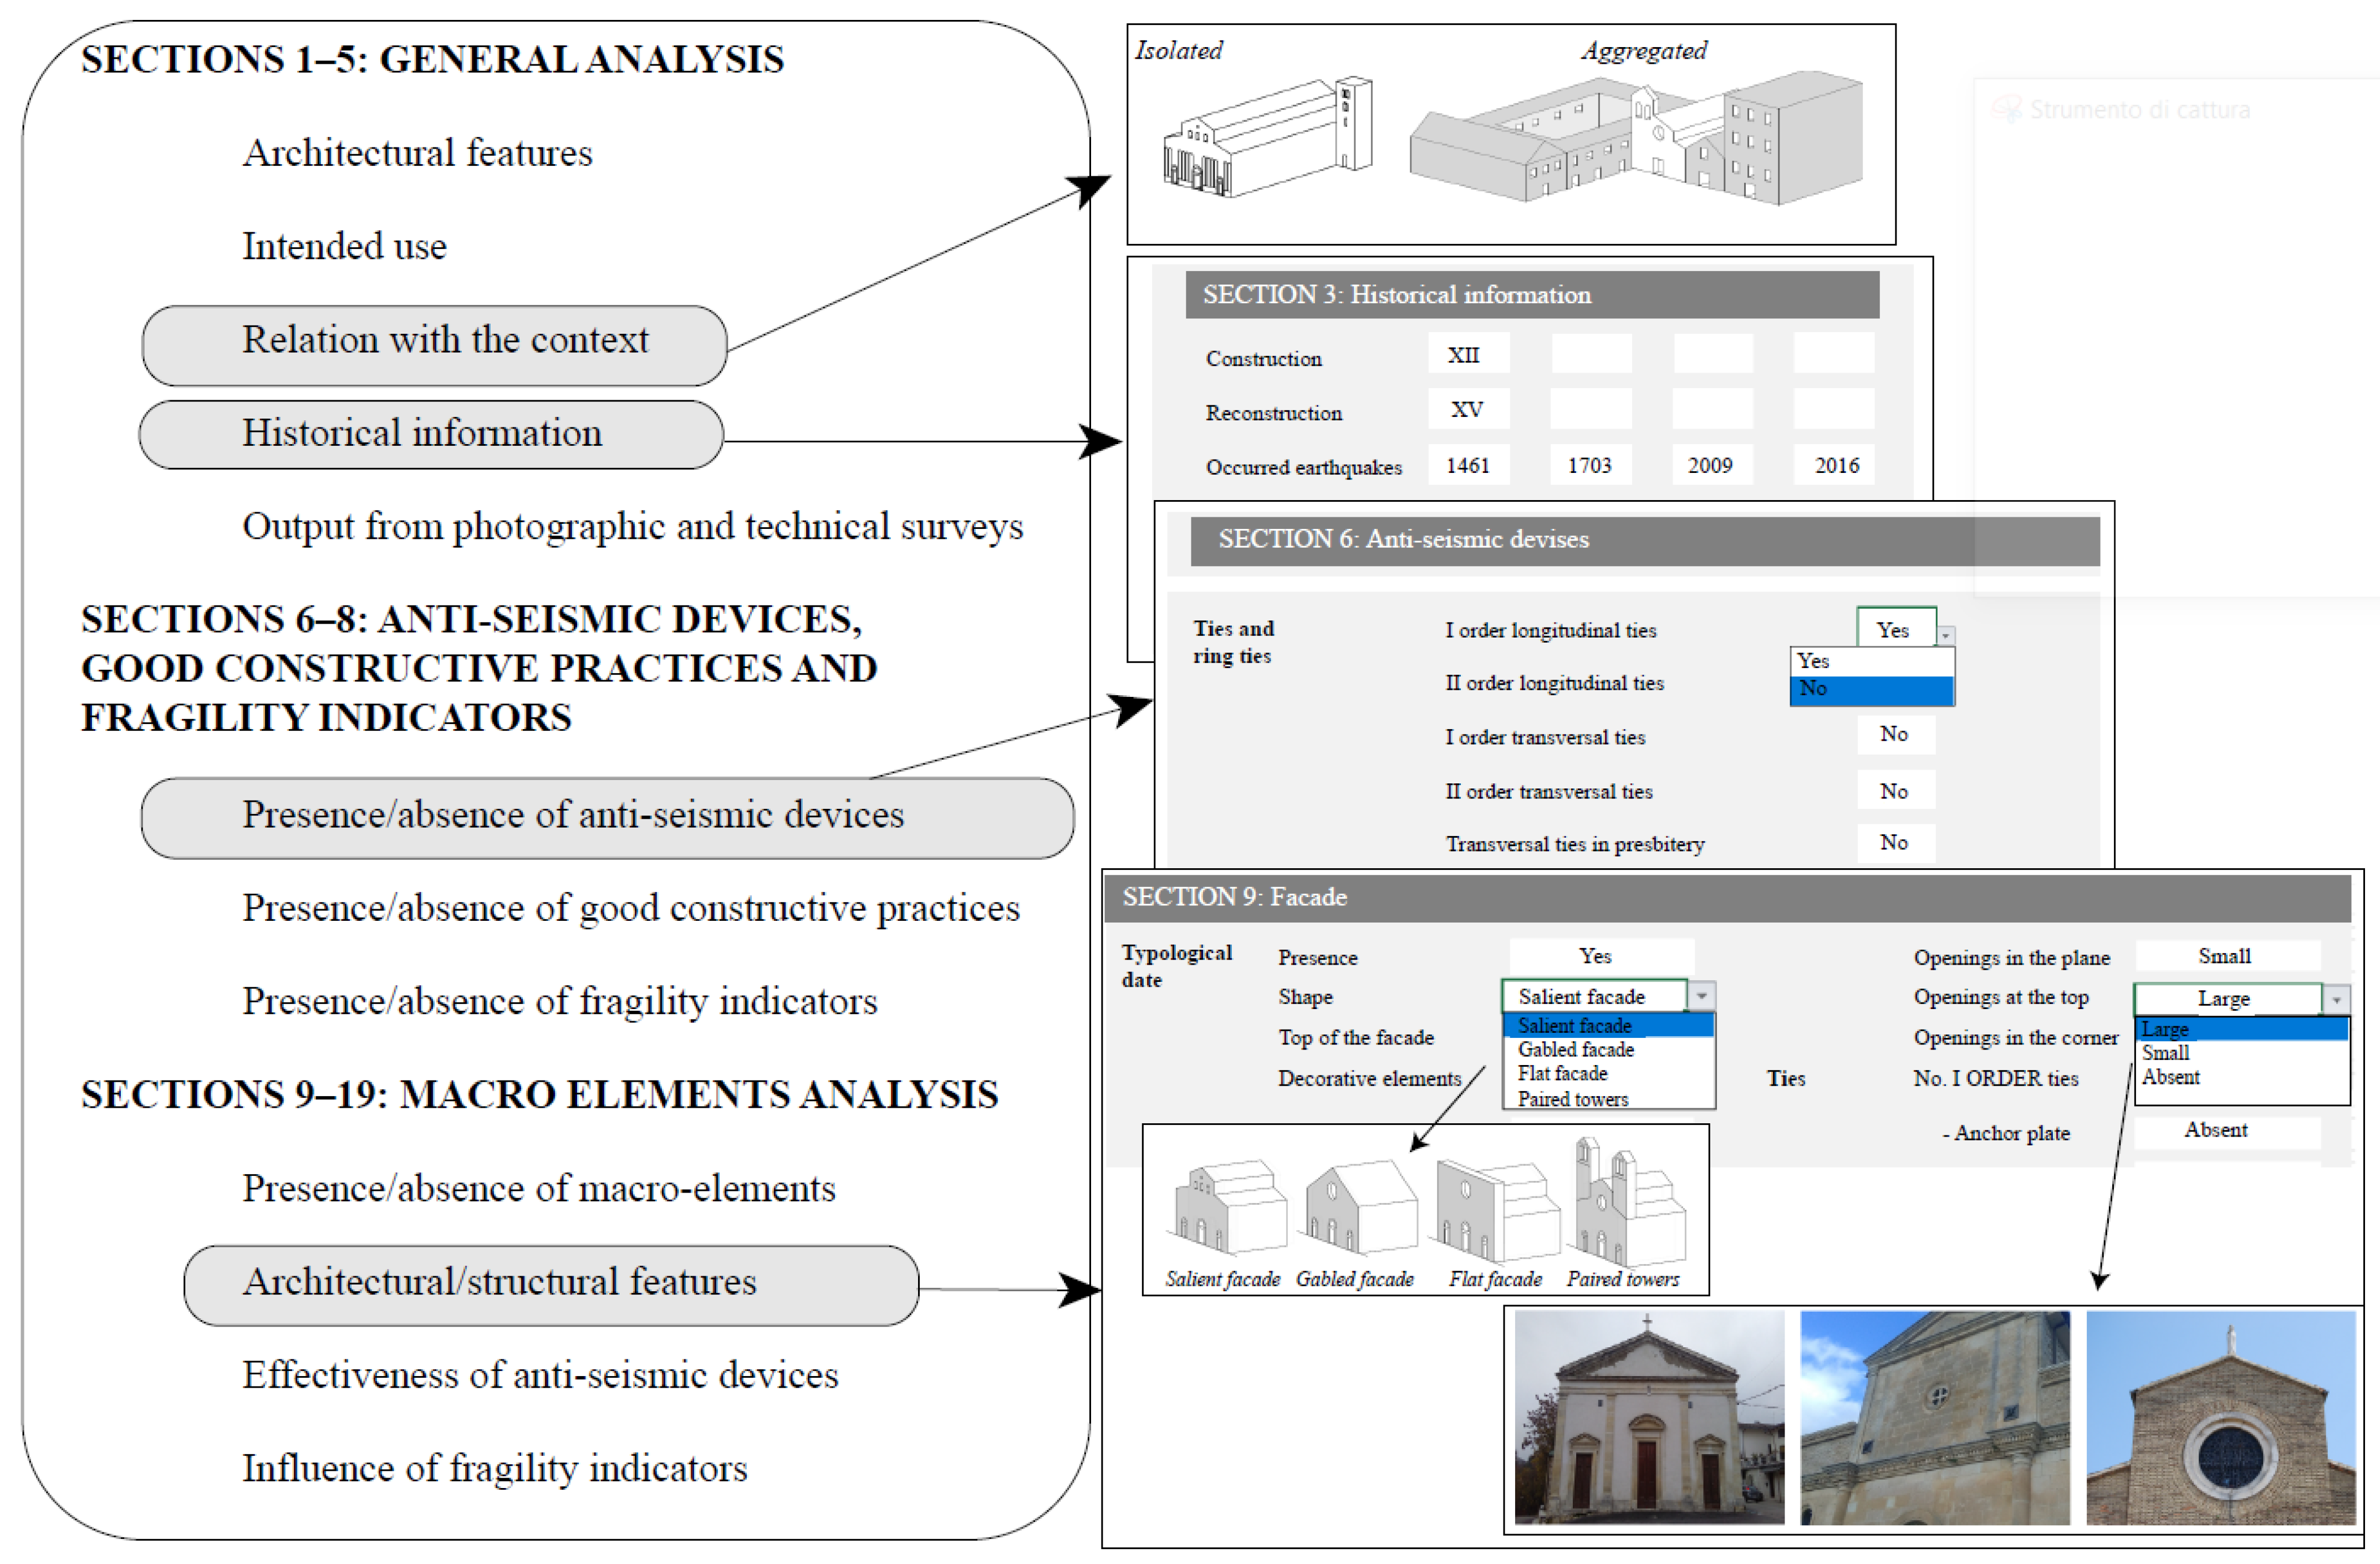
The MaCHRO form consists of 20 sections, which can be organized into three main macro-groups:
- SECTIONS 1–5: General informationThis section allows the definition of (a) architectural features of the church (denomination, layout and number of naves), (b) the intended use (destination, frequency of use and state of maintenance), (c) the relationship to the context (position), (d) the localization (i.e., province, municipality, address, diocese, DMS coordinates and ISTAT code), (e) historical information (construction and reconstruction periods, as well as the years of past earthquakes) and (f) photographic and technical drawings providing geometric details of the church (e.g., total length, width and height, in meters).
- SECTIONS 6–8: Anti-seismic devices, construction practices and fragility sourcesThese sections list the presence or absence of various anti-seismic devices (e.g., tie rods and retaining elements), good construction practices (e.g., strong connections and high-quality masonry) and fragility sources (e.g., large openings and thrusting roofs) that can be observed in the church.
- SECTIONS 9–19: Macro-elementsThese sections enable detailed description of all the macro-elements detectable in the church. The data provided by the compiler allow for an analysis of each single macro-element from a typological, structural and geometrical point of view. Each option in the form corresponds to a precise level of fragility or protection, providing indications about the structural behavior of the considered macro-element during a seismic event. For example, in the “Shape” box (section 9—Façade), the compiler can choose between four types of façades: a salient façade, a gabled façade, a flat façade or paired towers. This information, combined with the top shape of the façade (flat, constrained gable, unconstrained gable, tower, or flat with leaning tower) as well as the geometric information given in the previous sections, allows prediction of the possible out-of-plane behavior of the façade macro-element. The scores assigned to each seismic behavior are pre-set by the authors and are not editable. These scoring rules were defined based on the authors’ experiences and validated following the 2009 L’Aquila earthquake in Abruzzo, Italy. More details on the pre-assigned scores are available in [17].
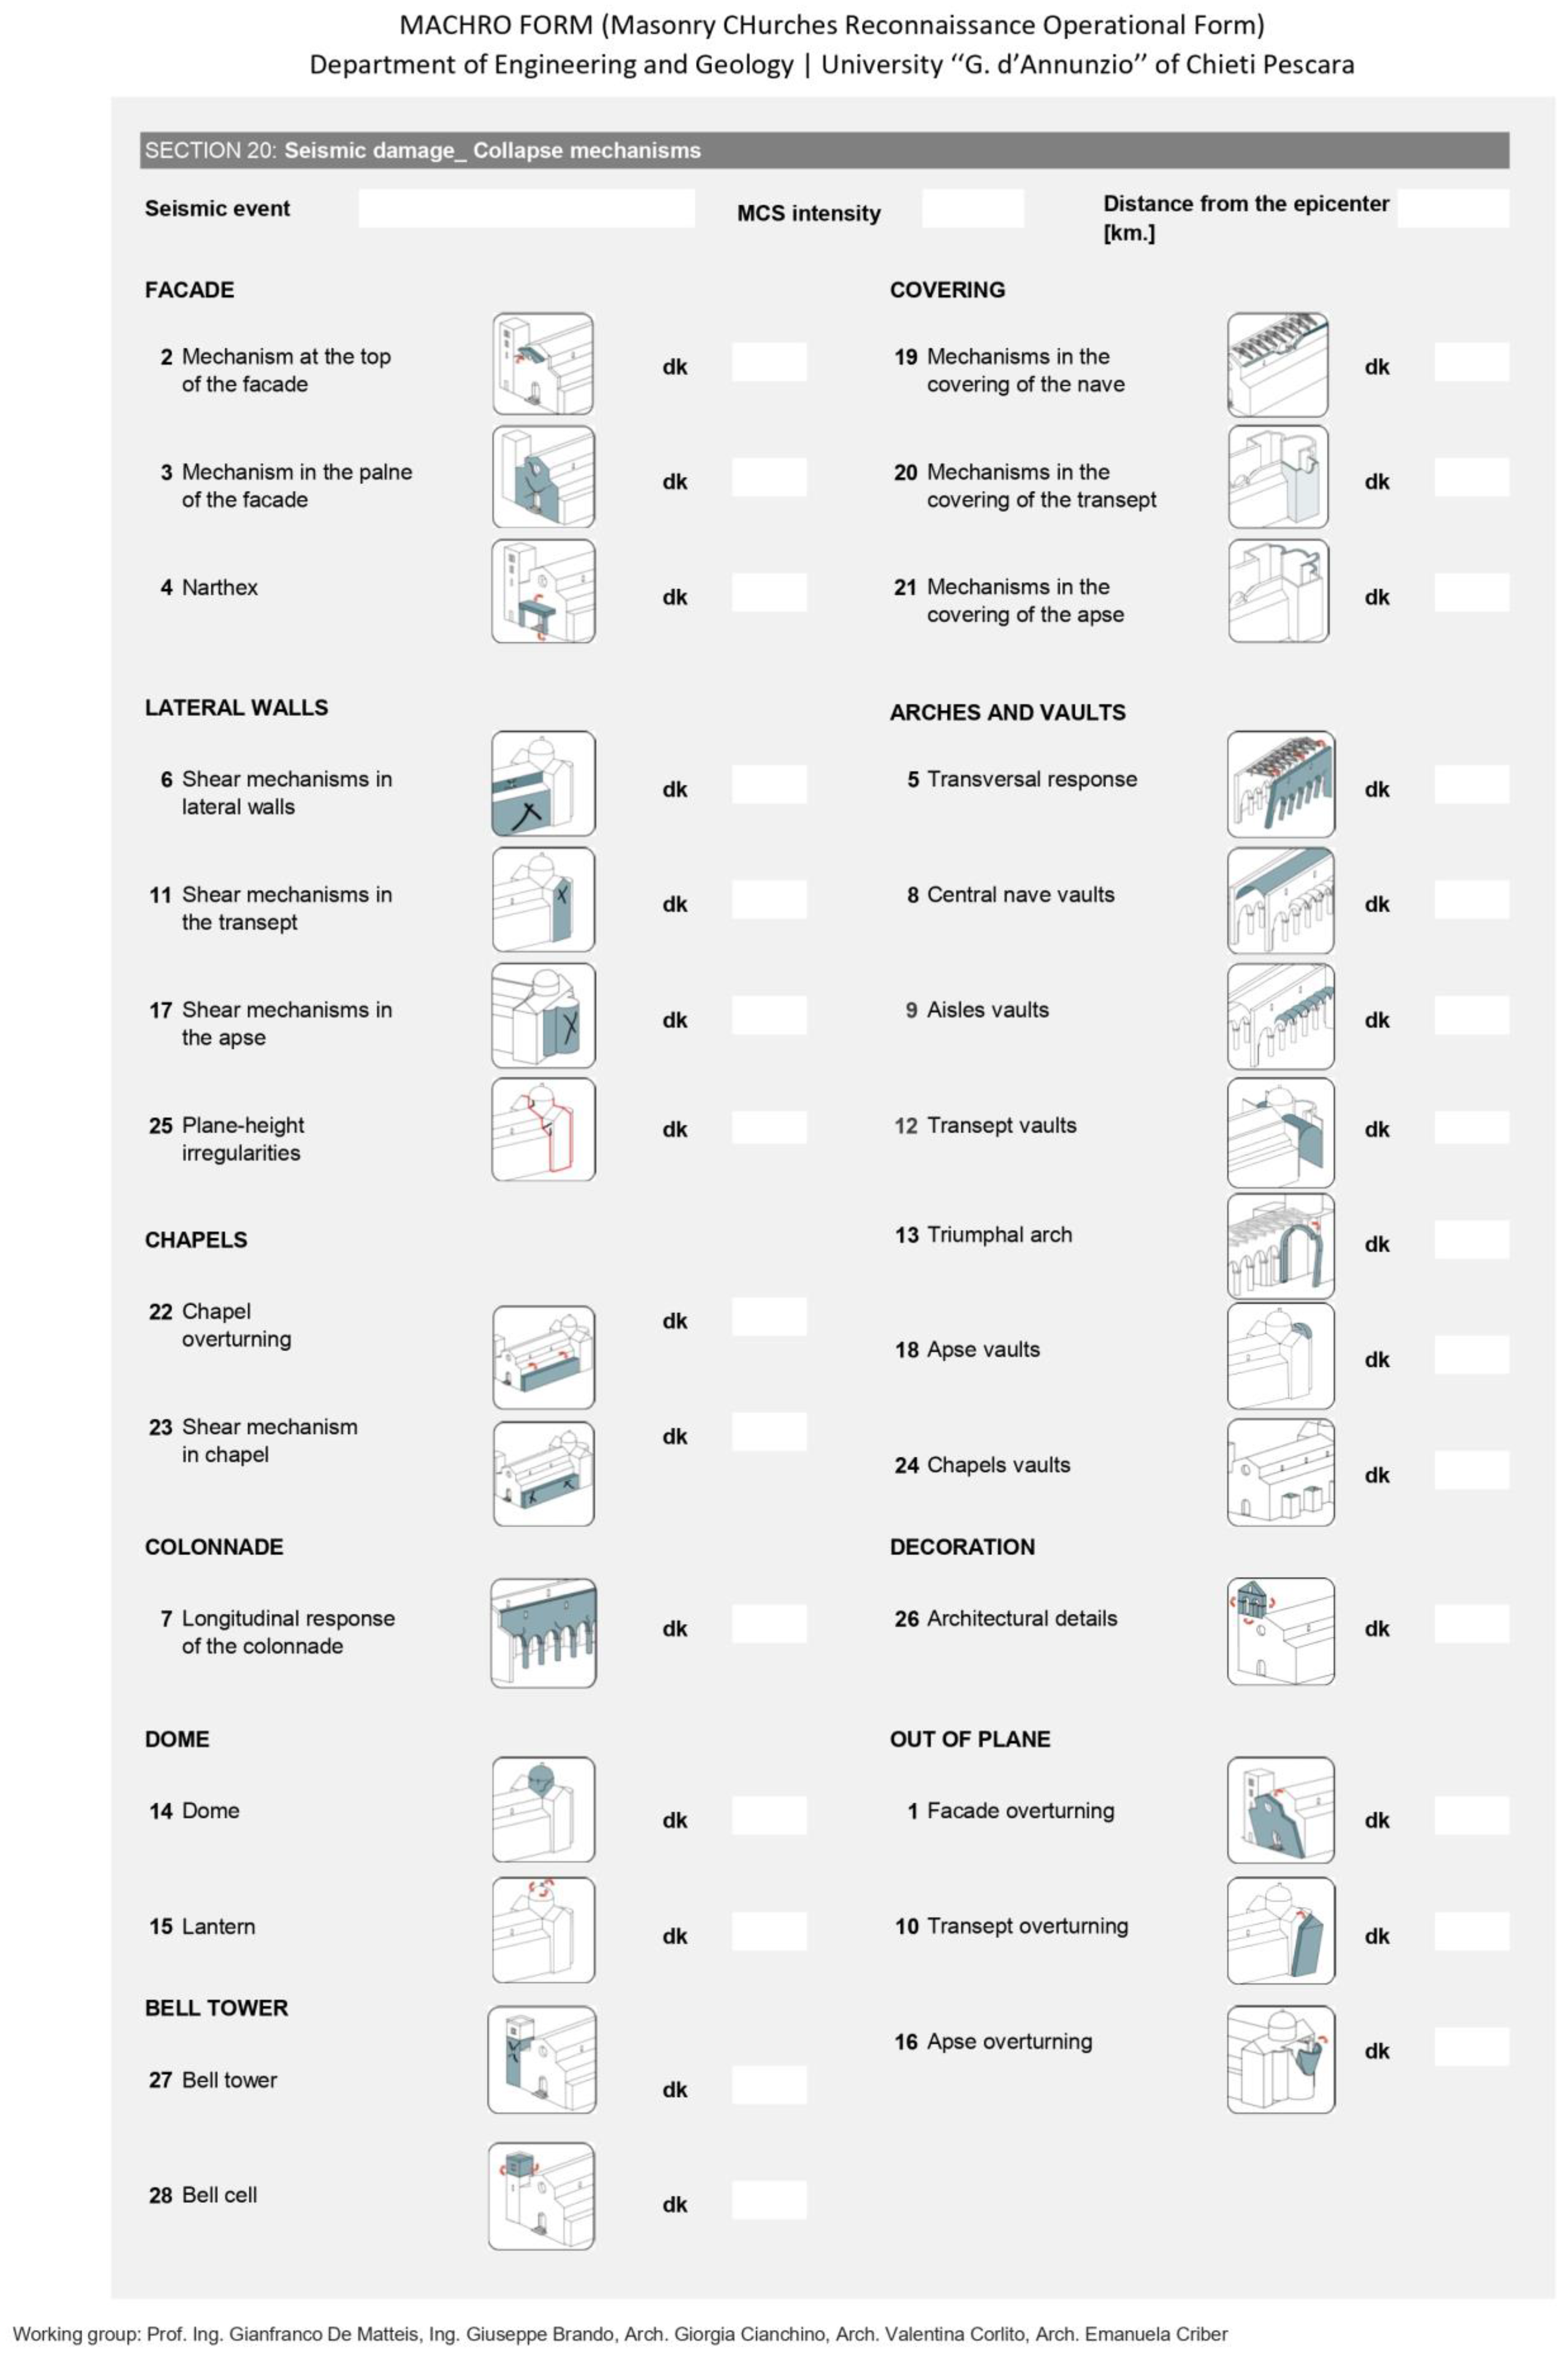
- SECTION 20: Damage assessmentIn this section, for each potentially activable mechanism, damage assessment is possible according to the criteria outlined in the Cultural Heritage Guidelines.
Figure 3 shows an excerpt from the structure of the MaCHRO form, while Appendix A includes the complete form.

Figure 3.
Excerpt of the MaCHRO form structure with close-ups of the significant sections.
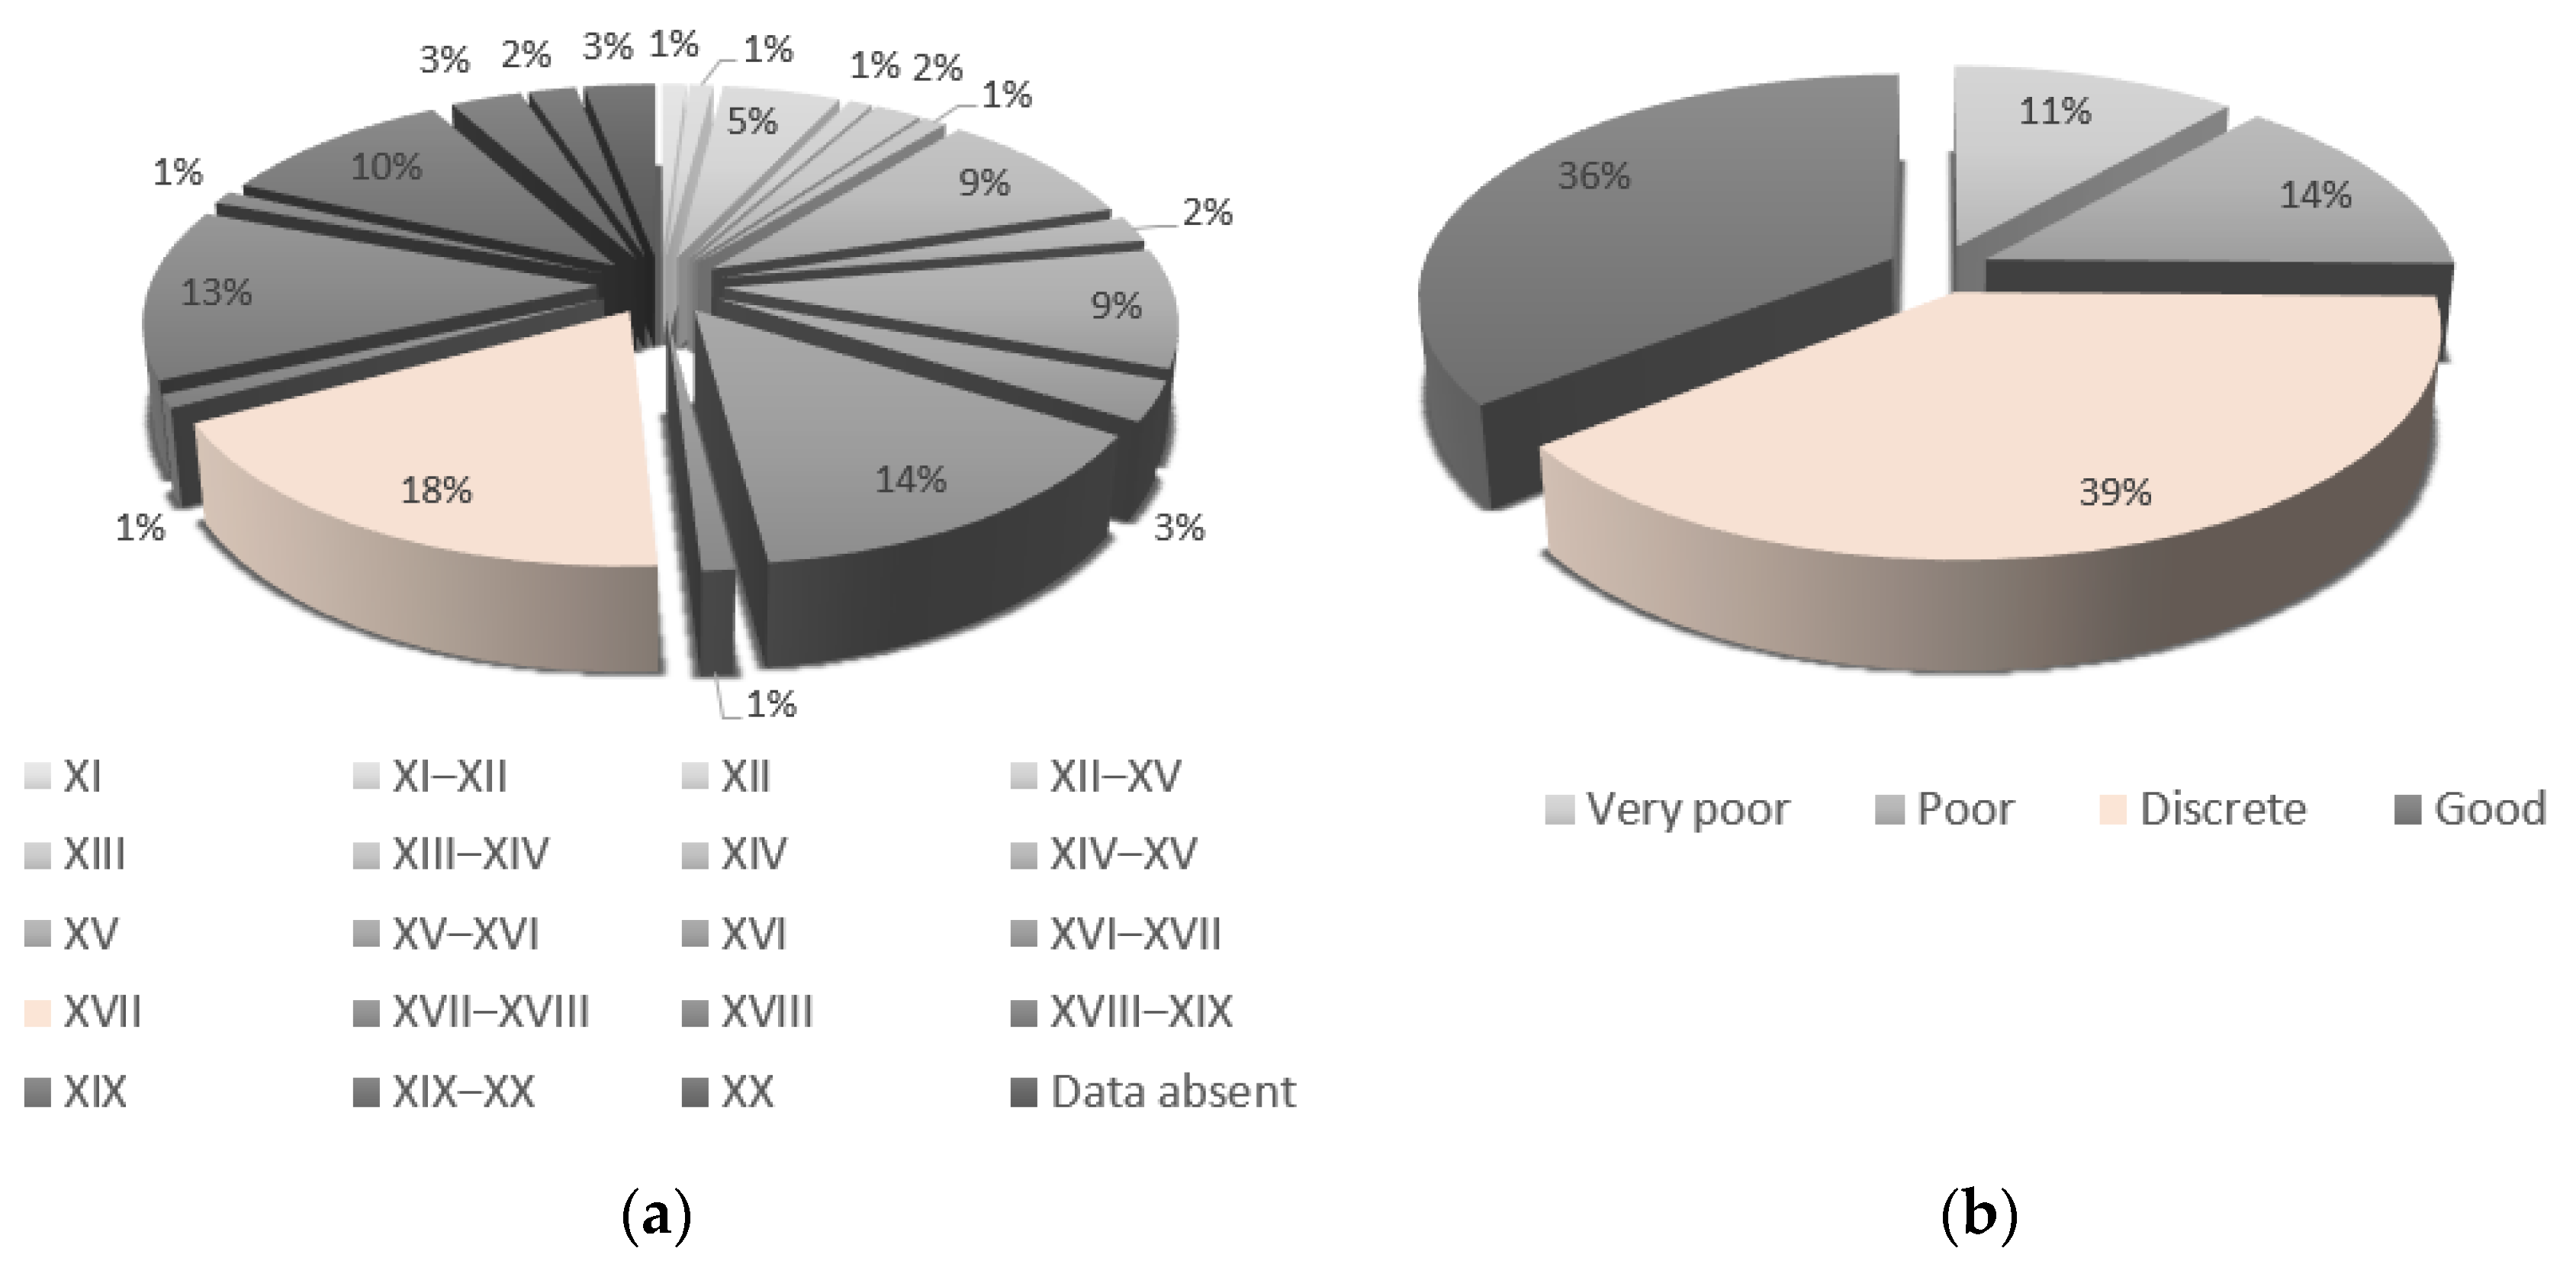
By filling out sections 1–5, it was found that the construction periods of the churches in the stock varied significantly, with a slight prevalence of churches built in the XVII century (Figure 4a). Before the earthquake, the overall state of maintenance of the buildings was rated as discrete (39%) or good (36%), and only 25% presented poor (14%) or very poor conditions (11%), as shown in Figure 4b. This suggests that the churches in the studied stock had no critical issues before the earthquake. However, this aspect highlights how important in-depth knowledge of structures and interactions between components is for predicting the development of collapse mechanisms. In fact, despite the apparent good state of maintenance, after the 2016 Central Italy earthquake, more than half of the surveyed churches were deemed “unusable” (53%); 22% were deemed “usable with countermeasures”, i.e., protection measures were required before the churches could be opened; 4% were “partially usable” (partially accessible); and only 21% were deemed “usable”, i.e., without structural damage.
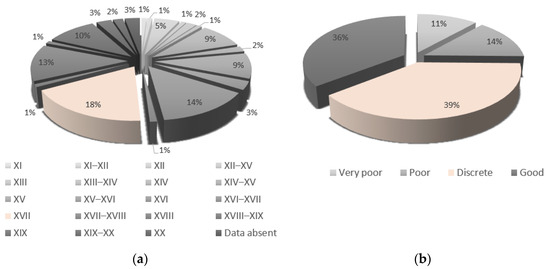
Figure 4.
Frequencies of (a) ages of construction and (b) states of maintenance for the entire sample of churches.
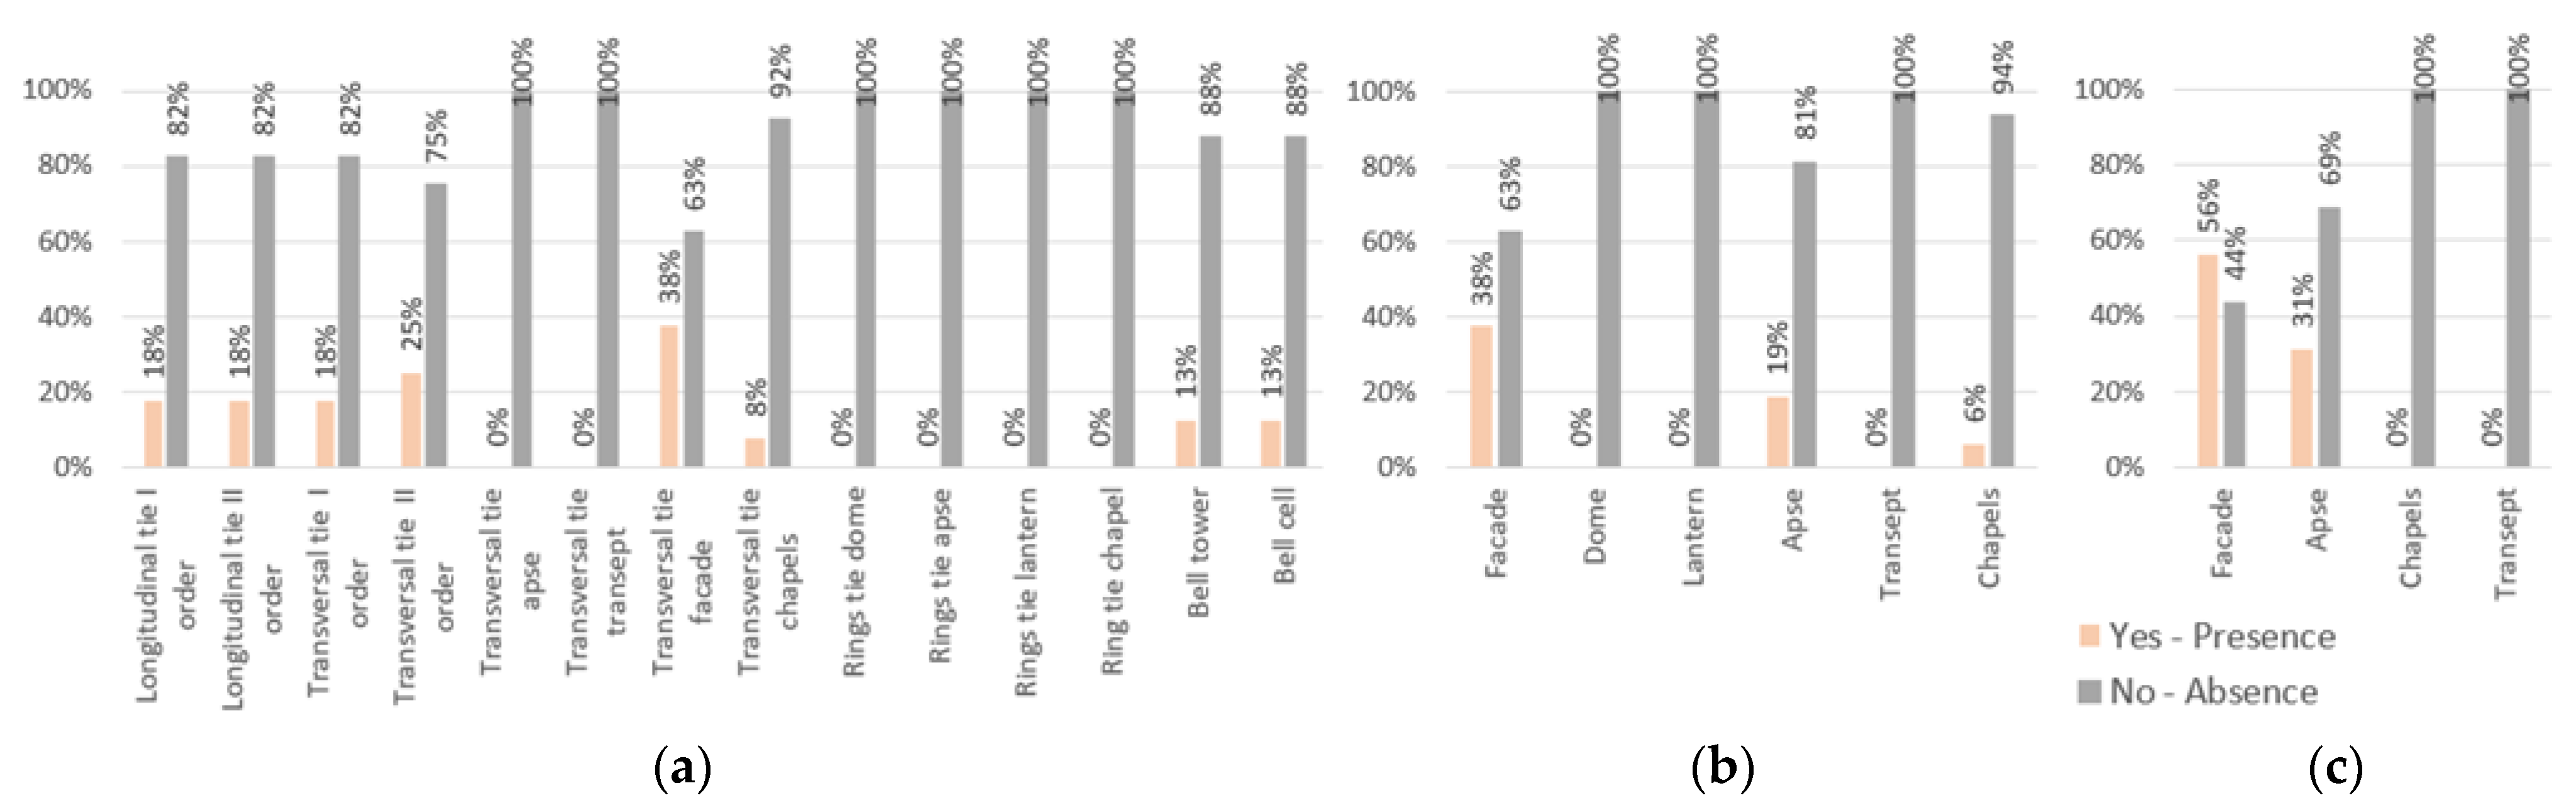
As stated before, sections 6–8 are filled out by selecting “Yes/No” options from drop-down menus in order to indicate the presence or absence of anti-seismic devices for each macro-element. The main results for all the investigated churches concerning the anti-seismic devices are shown in Figure 5, which reports the frequencies of the presence of (a) tie rods, (b) retaining elements and (c) corner connections. It can be seen that most of the tie rods (Figure 5a) are located transversely in the facades (38%) and in the lateral walls (25%). The difference between orders I and II refers to the location of these elements, either at the impost of an arch or at roof level, respectively.
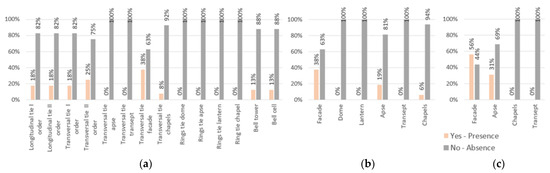
Figure 5.
Frequencies of (a) tie rods, (b) retaining elements and (c) corner connections in the investigated churches.
The main contrasting elements (buttresses, piers, etc.) (Figure 5b) are found in the façades (38%), as in the Church of San Salvatore in Cortino (SS), where the leaning bell tower prevents the development of overturning mechanisms. Figure 5c shows that 56% of the churches feature effective corner connections between orthogonal walls. An example is the church of Santa Maria della Mercede (SMM2), where the connection to the lateral walls is defined by well-sized elements, placed according to the rules of art.
While the earlier sections describe only the presence or absence of anti-seismic devices in a church, from section 9 onwards the form evaluates the effectiveness of these devices for each macro-element.
For example, with reference to the macro-element façade (section 9), the effectiveness of the presence of corner connections can be assessed by selecting the item “Good quality” or “Poor quality”, where the quality attribute is related to the type of masonry and to the capacity to connect transversal walls.
Similarly, the effectiveness of tie rods in inhibiting out-of-plane mechanisms can be evaluated by assessing the quality and features of the detected ties (e.g., first- or second-order ties and type of anti-push elements).
Therefore, in this section, each previously identified element is evaluated for its effective capacity to reduce or increase vulnerability. In other words, the compilation of sections 9–19 defines the values of η and f in Equations (2) and (3) through the qualitative description of the macro-elements detected in the church in question. These values, together with the values for w (ranging from 0 to 2, with 2 indicating maximum influence, and not modifiable by the compiler), allow evaluation of the vulnerability scores (vk,i and vk,p) for each macro-element and, finally, the calculation of the vulnerability indices for each church.
2.4. Evaluation of the Iv Index Through the MaCHRO Form
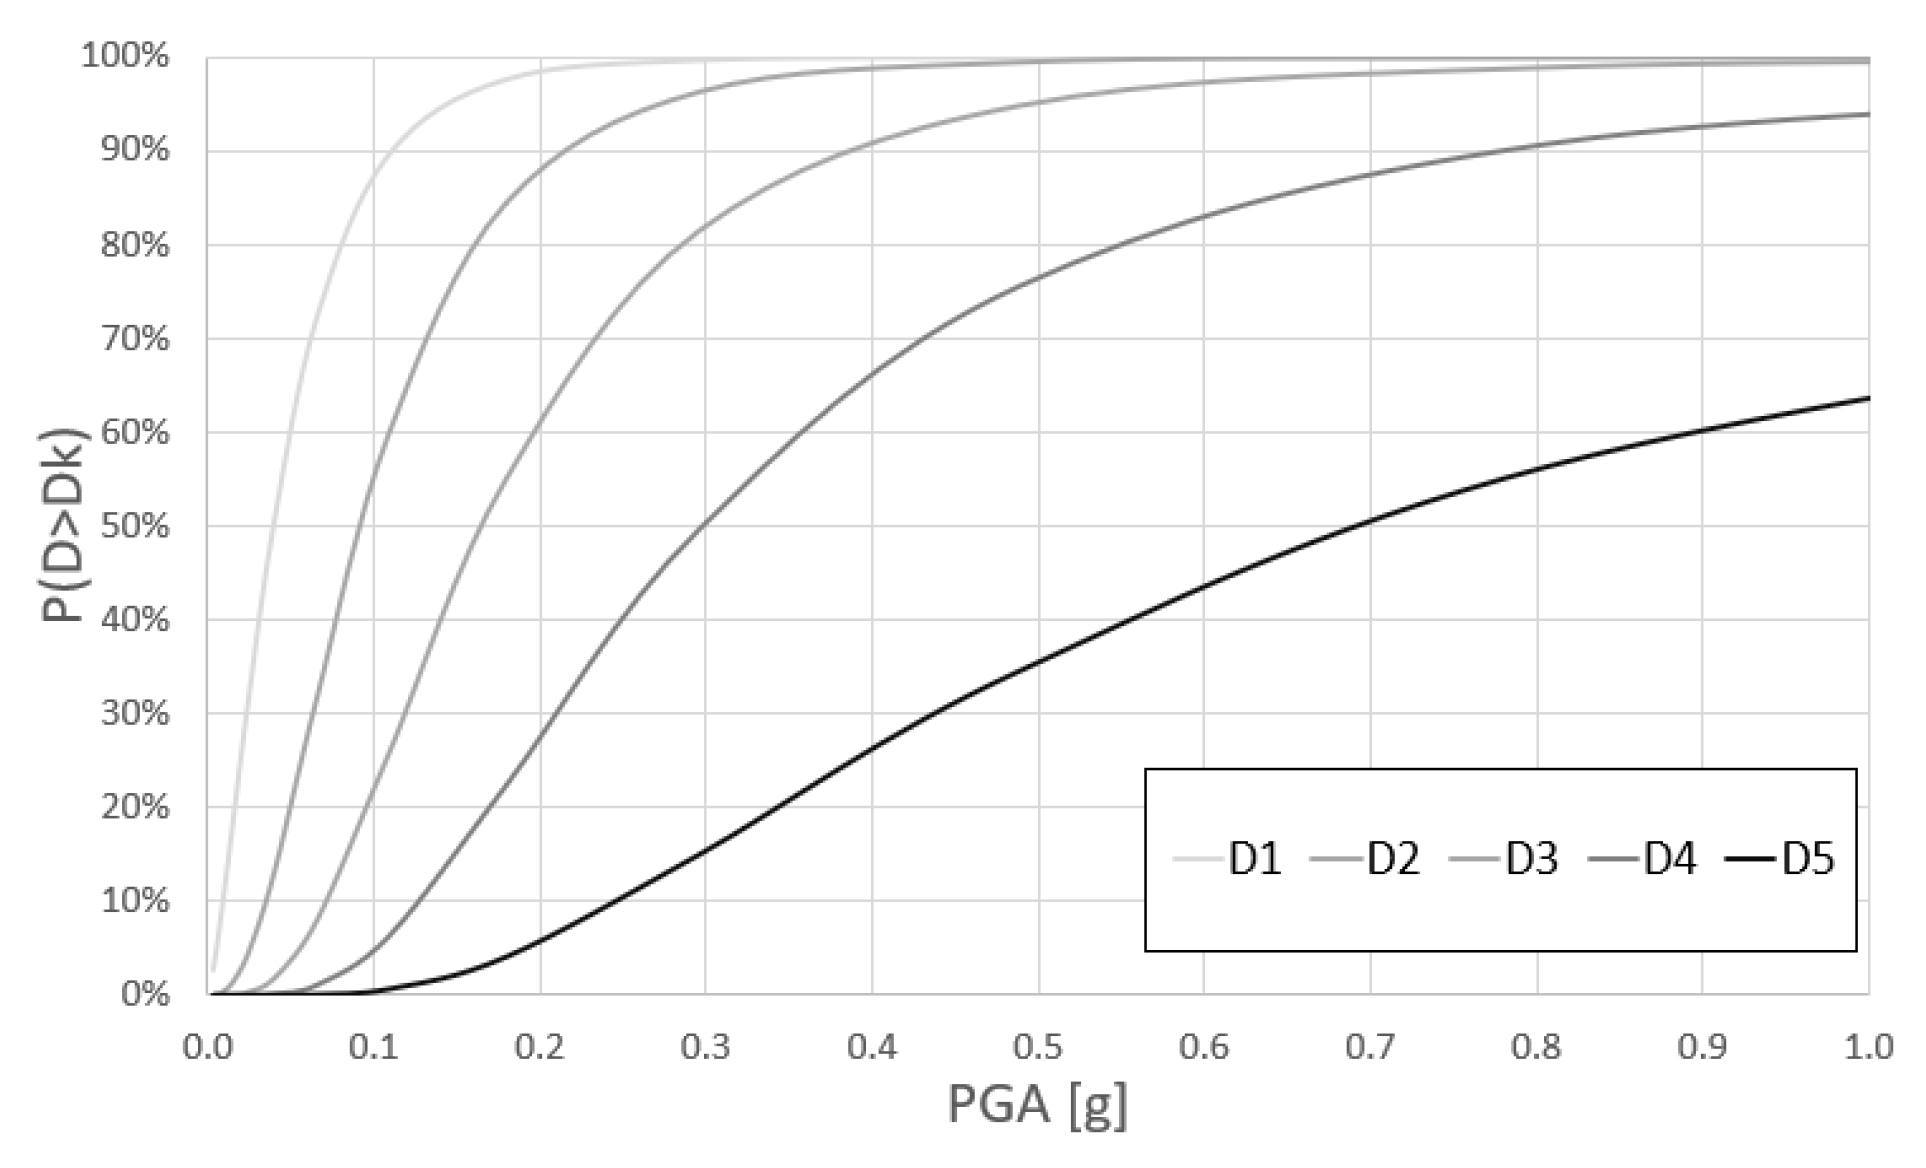
The application of the MaCHRO form allowed the average vulnerability index (Iv) to be obtained for the whole stock of churches, which was equal to 0.51. This value was used to define the expected mean damage (µD) for different macro-seismic intensities (IMCS (0 ≤ IMCS ≤ 12)), according to Equation (4). Damage probability matrices were subsequently obtained by applying the binomial probability distribution (see Equation (5)). Finally, the resulting probabilities for different damage levels were cumulated to obtain the probability of exceeding each damage level. Prior to this step, the macro-seismic intensity was converted into a PGA according to the relation given by Margottini et al. [19], which has proven effective for Italian earthquakes. The final results were plotted in terms of fragility curves, as shown in Figure 6. These fragility curves predict the expected damage scenarios for different seismic intensities. For example, for a PGA of 0.3 g, almost 16% of the considered churches are expected to exceed damage level D5, 34% are expected to experience a damage level between D4 and D5, 33% a level between D3 and D4, 13% a level between D2 and D3, 3% a level between D1 and D2, and 1% are expected to sustain no significant damage.

Figure 6.
Fragility curves of the studied churches obtained through the application of the empirical method proposed by De Matteis et al. [12].
3. Definition of Archetype Churches
In this section, archetypes representing the majority of churches in the area hit by the 2016 Central Italy earthquake were defined with the aim of performing analytical mechanical-based vulnerability analyses. Specifically, 4000 churches were considered. Their geometric and structural characteristics were identified through the DADO-Chiese database [14] developed by the European Center for Training and Research in Earthquake Engineering (Eucentre) [16] for Italian Civil Protection. The definition of archetype churches is based on a statistical analysis of these data (hereafter referred to as parameters (Px)). Moreover, it must be stressed that the identified archetype churches exhibit seismic behavior comparable to the churches they represent. This means that the results of the analyses conducted on these buildings can be extrapolated to other churches in the stock with similar characteristics.
After an in-depth study of the principal fragility sources of Central Italian churches [20], only the parameters deemed most relevant for the structural characterization of these buildings were selected from all the parameters collected during the survey phases. They are reported in Table 2. Parameters related to the presence of chapels, domes and transepts are excluded because they were not commonly observed in the surveyed sample.
Table 2.
Parameters selected for the definition of archetype churches.
The identification of archetype churches was performed through a MATLAB® routine designed to “dialogue” with the database. This routine aggregates churches with similar parameters and provides the representativeness of each aggregated group, namely, the percentage of churches belonging to that group with respect to the total of 4000 churches.
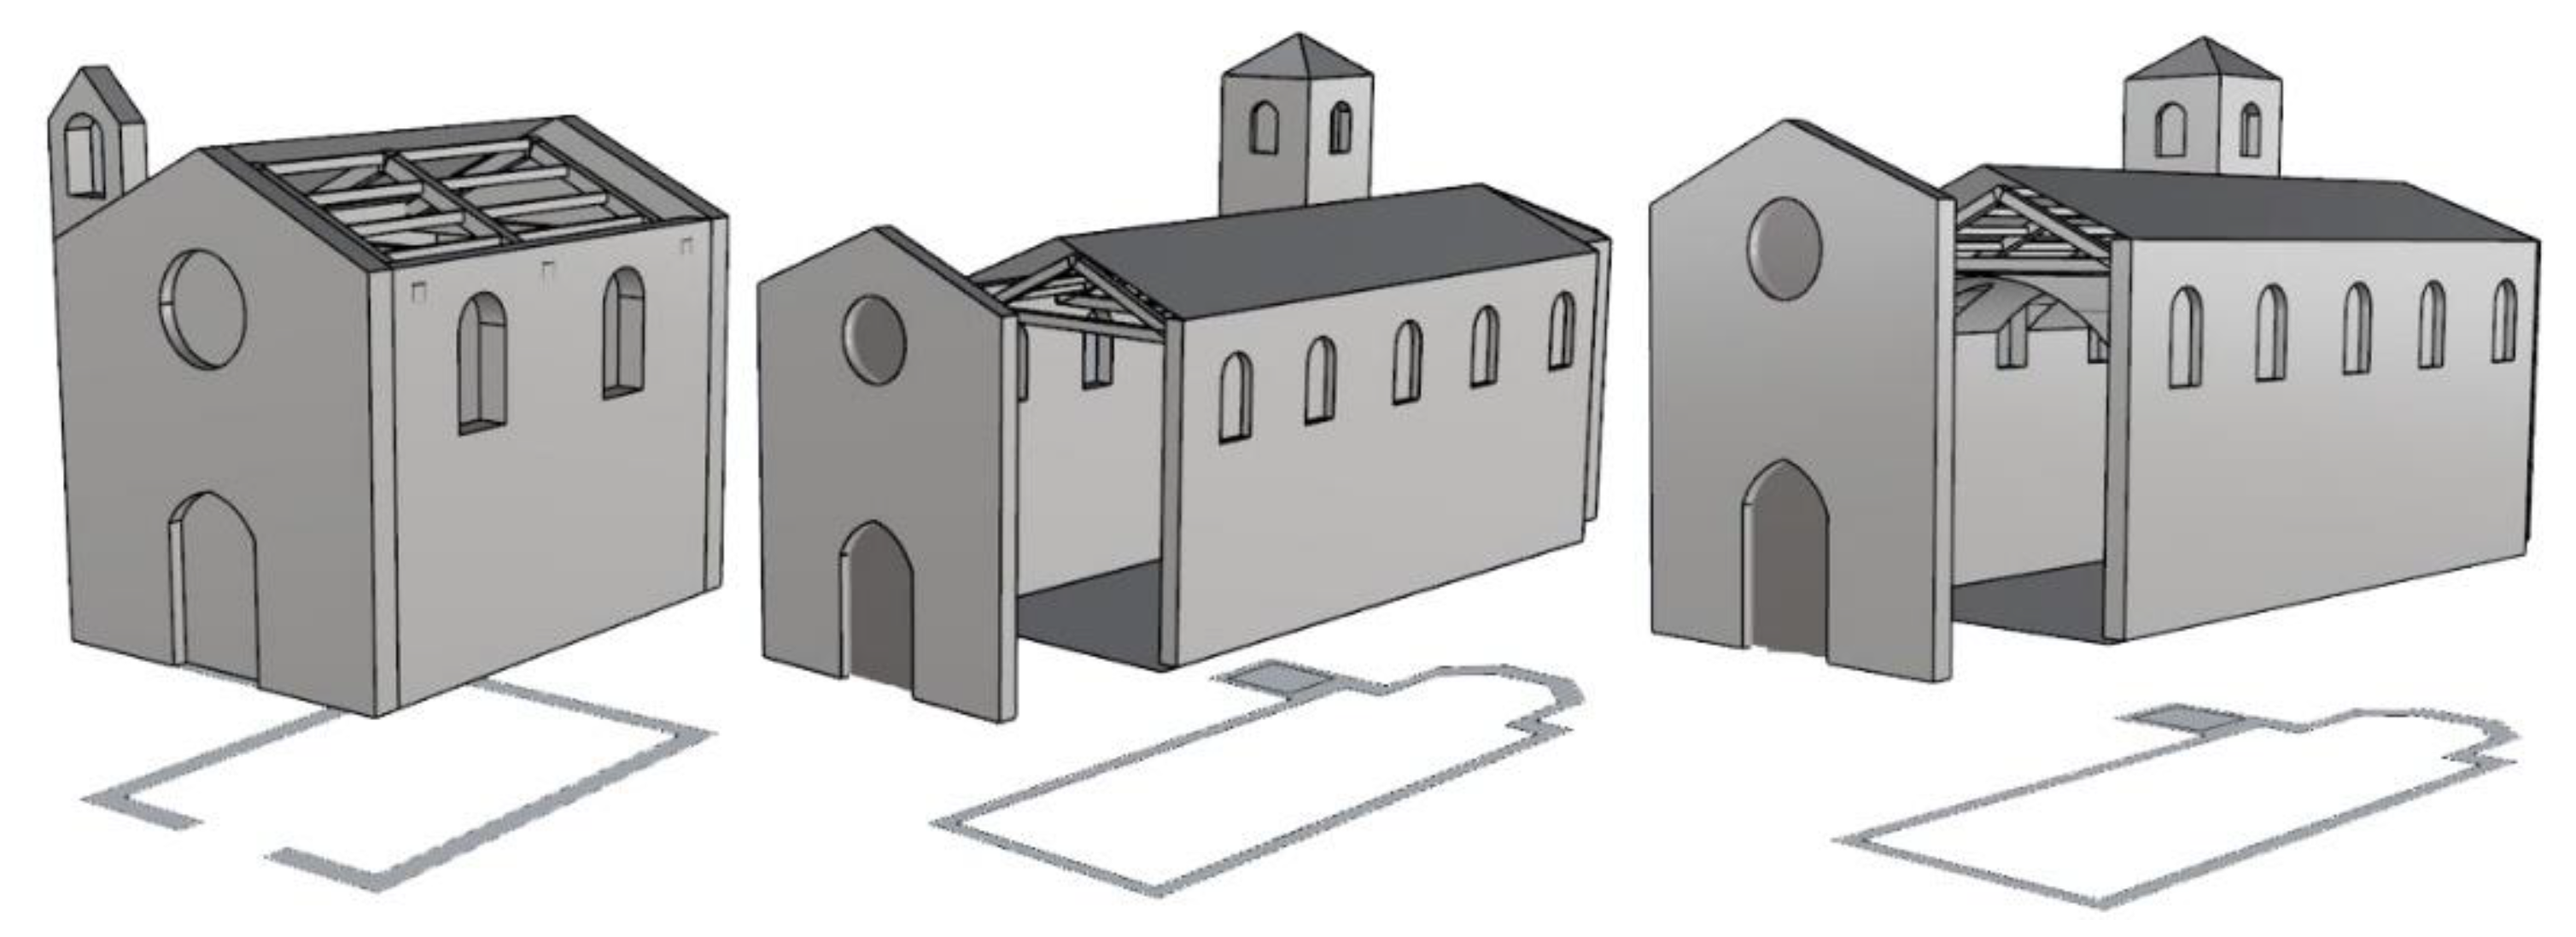
Based on the selected parameters, three archetype churches were obtained. As can be observed in Table 3, their representativeness (repr.) values were 22.11%, 17.75% and 8.87%, respectively, covering almost 50% of the entire stock. The characteristics of these archetypes are depicted in Figure 7. They consist of irregular masonry churches with a single-nave layout and a gabled façade, and they differ from each other with respect to the presence or absence of apses and vaults. Additional attributes, such as geometric dimensions, were considered by evaluating the most frequently observed values in the database for each archetype.
Table 3.
Most representative archetypes across the territory of Central Italy.
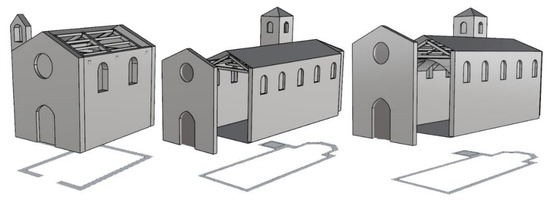
Figure 7.
The ideal reference models for the three identified archetype churches.
In particular, the first archetype includes small churches, with the top of the façade well constrained by the lateral walls. The second comprises churches with a larger size, an unrestrained façade top, an apse and a wooden roof. The third archetype is similar to the second but features vaults.
Photographic documentation and geometric studies allowed the identification of the main features of the churches. Based on this information, ideal reference models were created for each archetype church, as illustrated in Figure 7. These models served as representative examples for their respective groups, capturing the essential structural and architectural characteristics needed for further analytical assessments.
4. Analytical Vulnerability Assessment Through Mechanical-Based Models
4.1. The Performed Analyses
In this section, the vulnerability assessment of churches was carried out through the implementation of kinematic analyses, focusing on the most critical and fragile macro-elements of the proposed archetypes. The procedure aimed at identifying kinematic admissible mechanisms and verifying structural capacity in terms of maximum admissible accelerations (linear kinematic analysis) and ultimate displacements (nonlinear kinematic analysis).
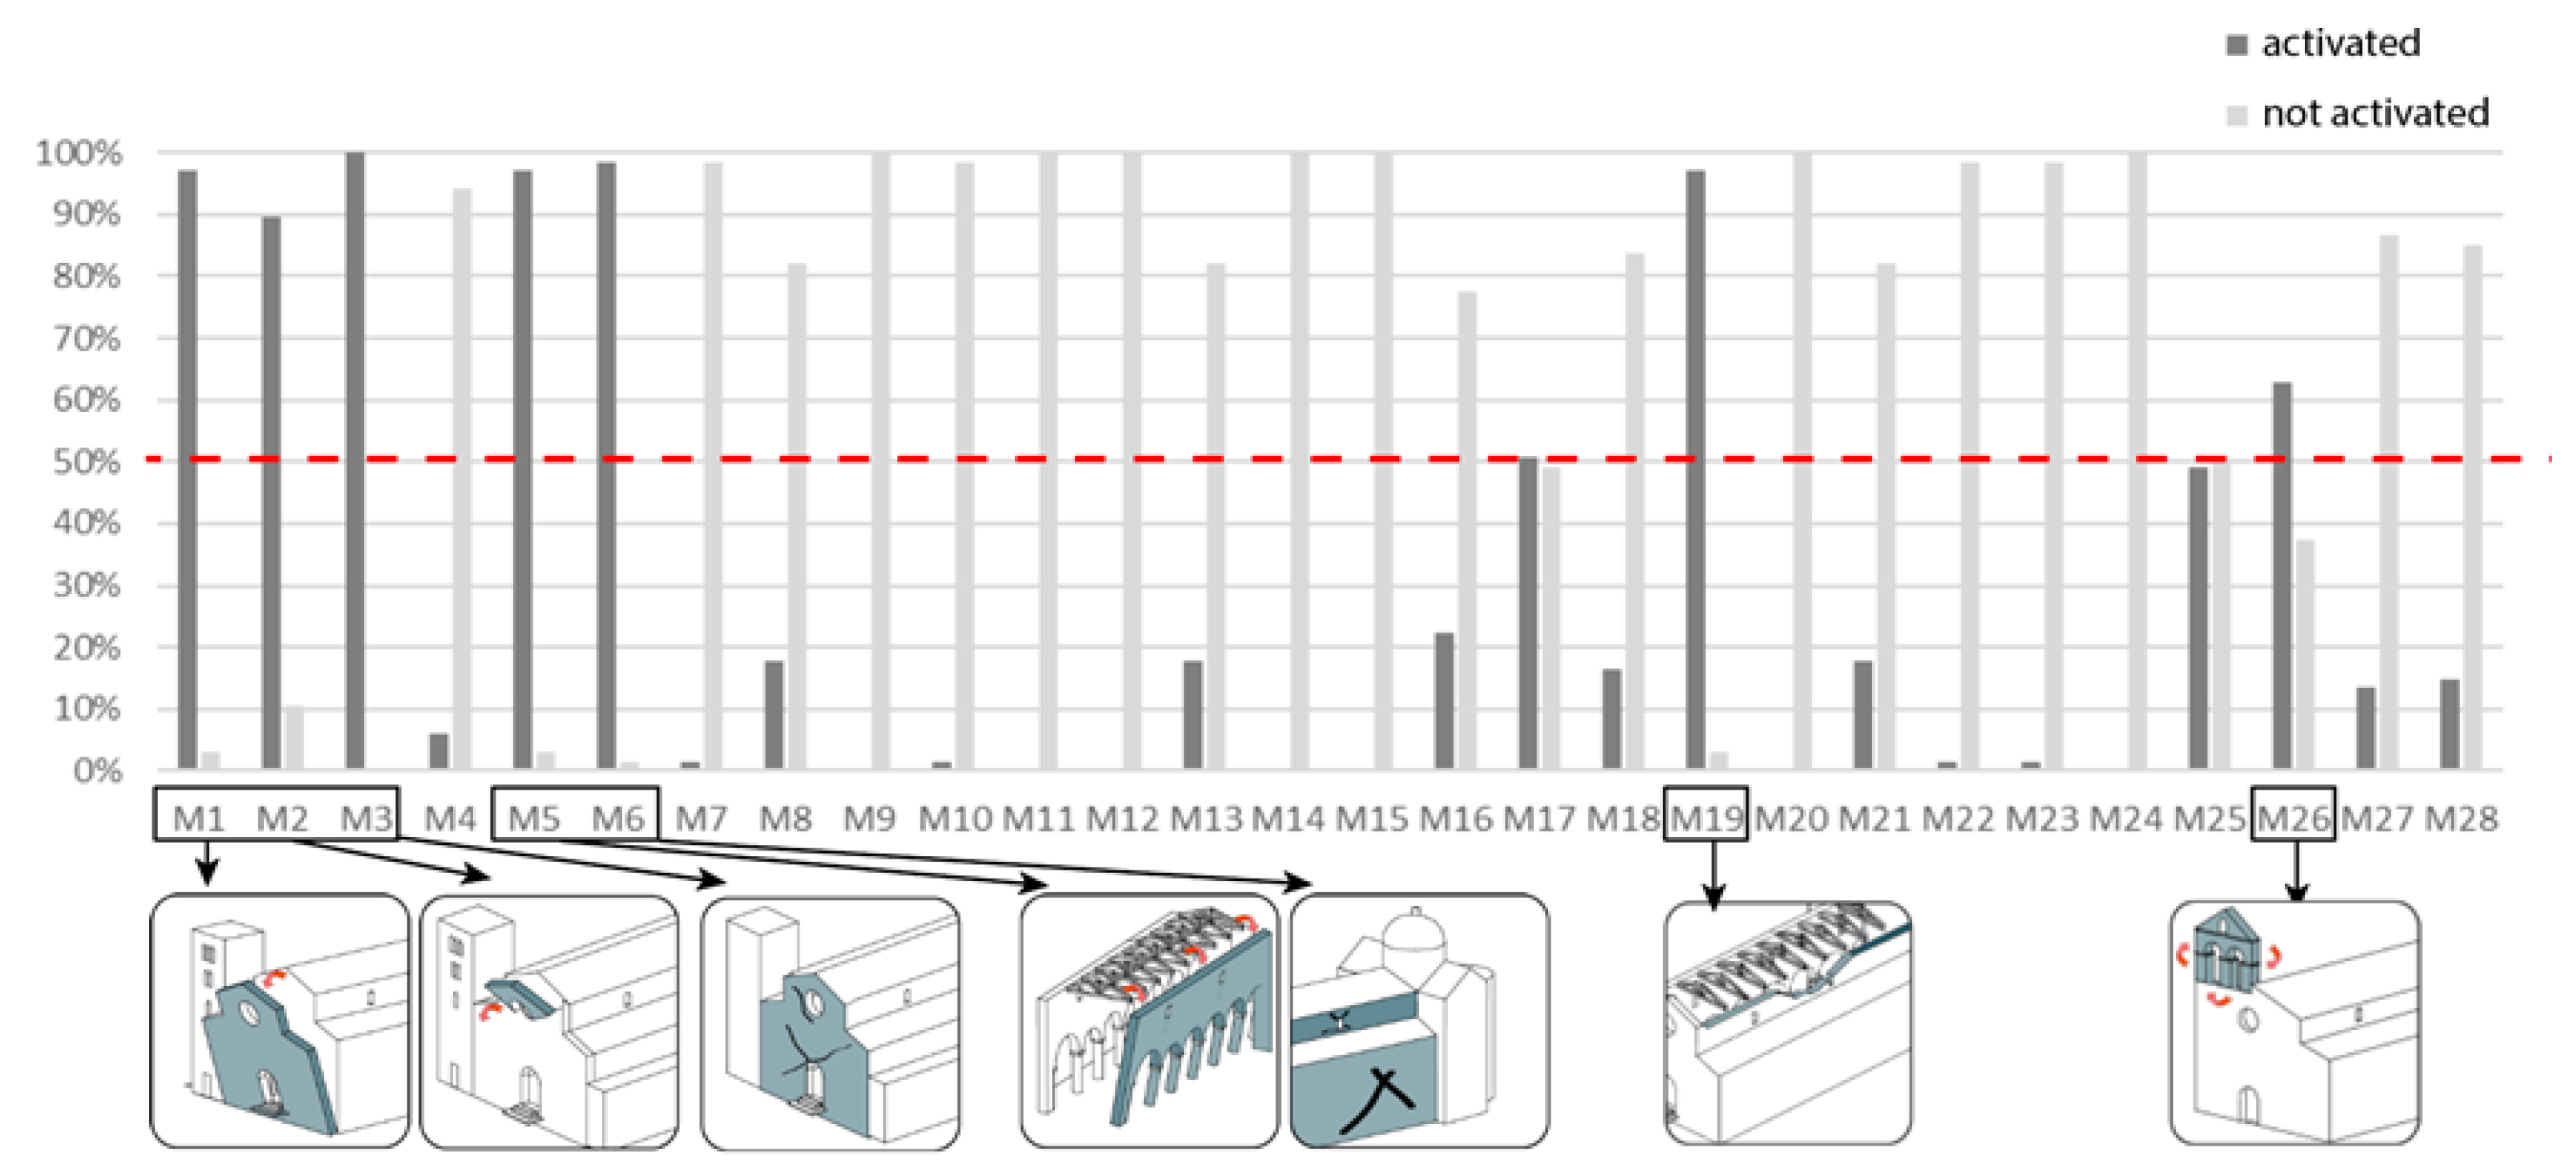
The analytical evaluation of local mechanisms is an efficient way of studying the vulnerability of churches, particularly in cases where so-called box-like behavior is not expected, and structures can be divided into distinct homogeneous parts exhibiting rigid-body responses. Moreover, the study of the damage mechanisms that operated in the churches during the 2016 earthquake sequence revealed that they mostly (>50%) (Figure 8—red dashed line) affected key structural elements, namely, façades (M1—façade overturning; M2—mechanism at the top façade; M3—in-plane mechanism of the façade), lateral walls (M5—transversal response; M6—shear mechanism of lateral walls), roofs (M19—roof mechanism in the nave) and bell cells (M26—architectural details). This proves that an analysis focused on kinematic mechanisms is sufficient to prevent at least the most dangerous failures; also, out-of-plane kinematic mechanisms, in the absence of anti-seismic devices, generally present lower safety factors compared to in-plane mechanisms. In this paper, the proposed vulnerability assessment was carried out only with reference to the I-mode mechanisms associated with the macro-elements, as these are the first mechanisms that activate under lower accelerations.
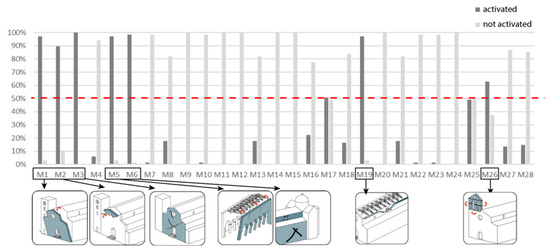
Figure 8.
Collapse mechanisms activated in the analyzed sample of churches following the 2016 earthquake.
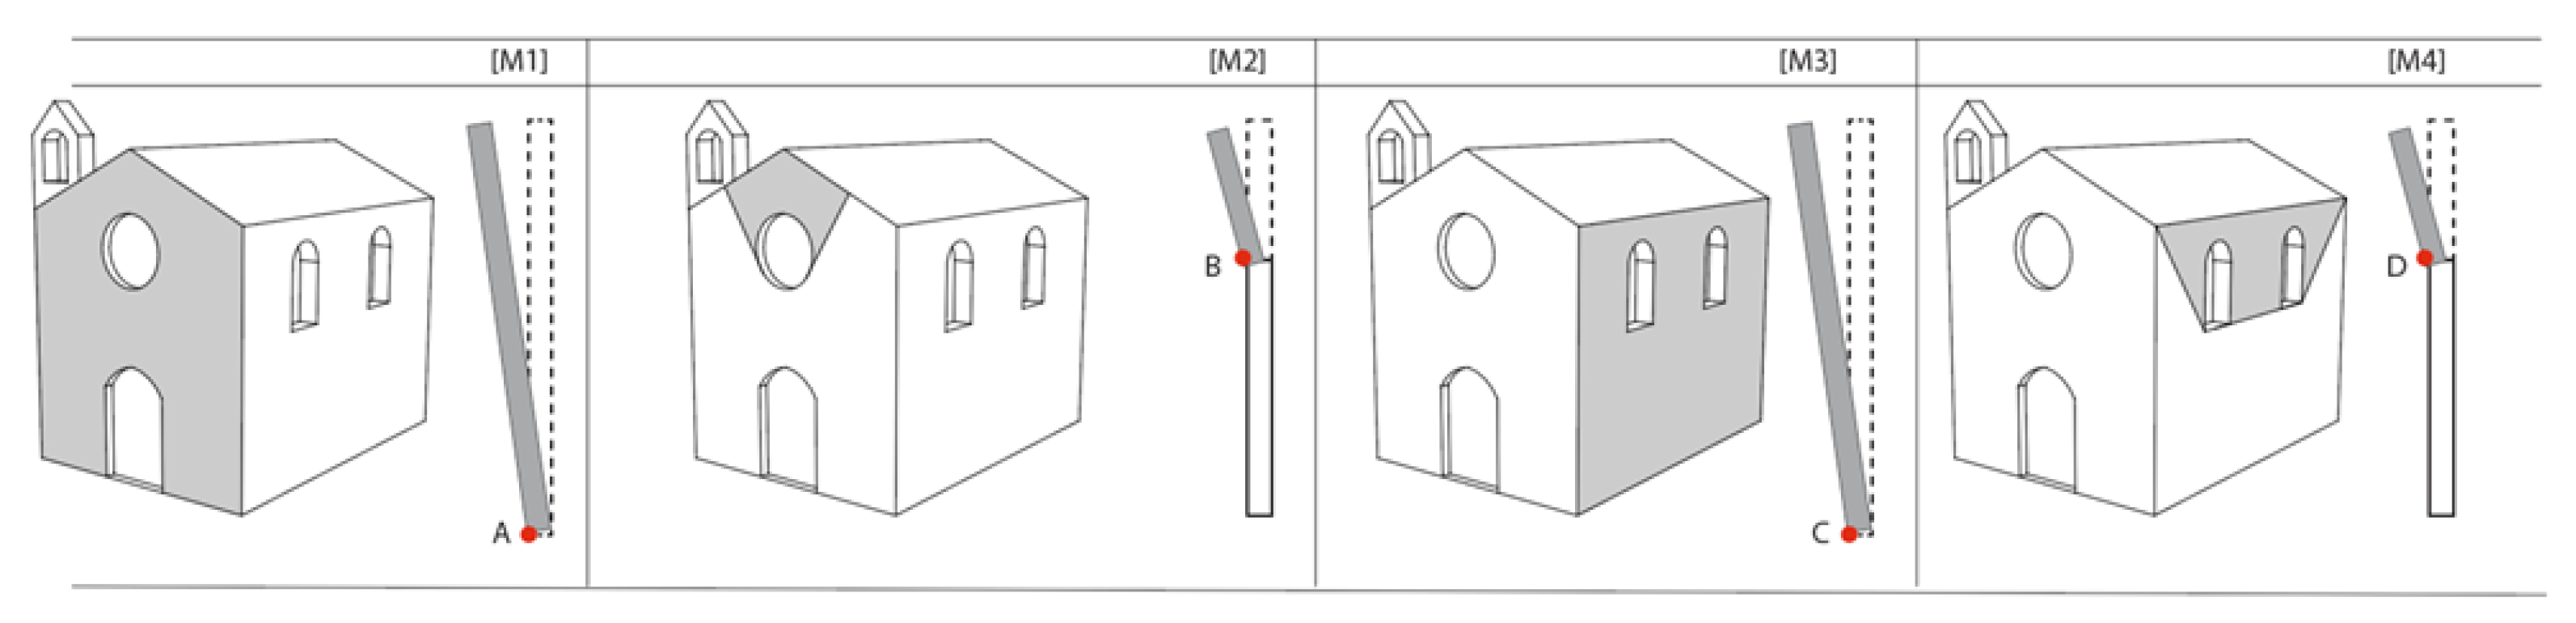
In particular, two macro-elements were analyzed with respect to out-of-plane mechanisms: façades and lateral walls. Damage surveys showed that the masonry walls of churches are often poorly connected to the remaining parts of the structures. For this reason, the considered macro-elements are most susceptible to experiencing first-mode mechanisms, which can be schematized as a rigid rotation of the wall around a cylindrical hinge. A specific number of kinematically admissible collapse mechanisms was identified for these macro-elements (Figure 9). Specifically, overturning can be divided into global monolithic overturning [Figure 9—M1 and M3] and partial monolithic overturning [Figure 9—M2 and M4].

Figure 9.
Kinematic mechanisms considered for the “façade” and “lateral wall” macro-elements.
The analyses were performed considering the presence or absence of constraint conditions (e.g., tie rods), the presence or absence of thrusting elements (e.g., vaults) and the influence of the typological features (e.g., geometric and structural characteristics) of the macro-elements on the likelihood of activating each possible mechanism.
The analysis of the identified kinematic mechanisms was conducted using limit analysis with a linear kinematic approach. For each mechanism, the horizontal load multiplier (α0) was defined by applying the Principle of Virtual Works, expressed in Equation (7):
where
- n and m are the numbers of rigid blocks involved or not involved in the kinematic chain, respectively;
- o is the number of external forces applied to the blocks;
- Pi is the self-weight of involved blocks;
- Pj represents the weight of the m elements not directly involved in the mechanism but generating horizontal forces;
- δx,i and δy,i are the corresponding horizontal and vertical virtual displacements according to the kinematic chain;
- Fh is the horizontal external force acting on the blocks and δh is the corresponding displacement;
- Lfi is the internal work, which is assumed to be null.
For each load multiplier, the spectral acceleration (a0*) referred to an equivalent single-degree-of-freedom (SDOF) system, evaluated according to Equation (8):
where g is the gravity acceleration, FC is the confidence factor related to the level of knowledge (LC) of the investigated structure and e* is the mass participation factor in the considered mechanism, defined according to Equation (9). Here, M* is the participating mass and Pj is the self-weight of the blocks. Given the limited knowledge level (LC1) about the considered population of churches, an FC = 1.35 was assumed in this study.
To account for the structure factor (q), assumed to be equal to 2 due to limited data, the value of the spectral acceleration was modified as follows:
In the case of collapse mechanisms involving portions of a structure located at a certain height (e.g., the top of a façade), the ground acceleration that activates the mechanism is found with Equation (11):
where Z is the height of the macro-element’s center of mass, H is the building height, and Ta and T1 are the fundamental periods of the macro-element and the building, respectively.
The linear kinematic analyses of the archetype churches’ macro-elements showed that the mechanism requiring the lowest acceleration to activate it is always the monolithic overturning of the façade.
In order to better evaluate the macro-element behavior until collapse, nonlinear kinematic analyses were also carried out. This approach allows investigation of the displacement capacity of a structure during the progression of the associated mechanism. The nonlinear analysis calculates the horizontal load multiplier (α0) from Equation (7) but considering the displaced configuration, thereby tracing the evolution of the mechanism until collapse.
Through the nonlinear kinematic analyses, the capacity curve of the equivalent SDOF system was derived. This curve represents the relationship between the spectral acceleration (a*) and the spectral displacement (d*). The former is the maximum acceleration that a macro-element can withstand before the mechanism’s activation, while the latter is evaluated according to the following expression:
where
- dk is the ultimate lateral displacement of the center of mass of the analyzed macro-element, identified by imposing a null value for the load multiplier (α0);
- δx,k is the virtual horizontal displacement of the control point.
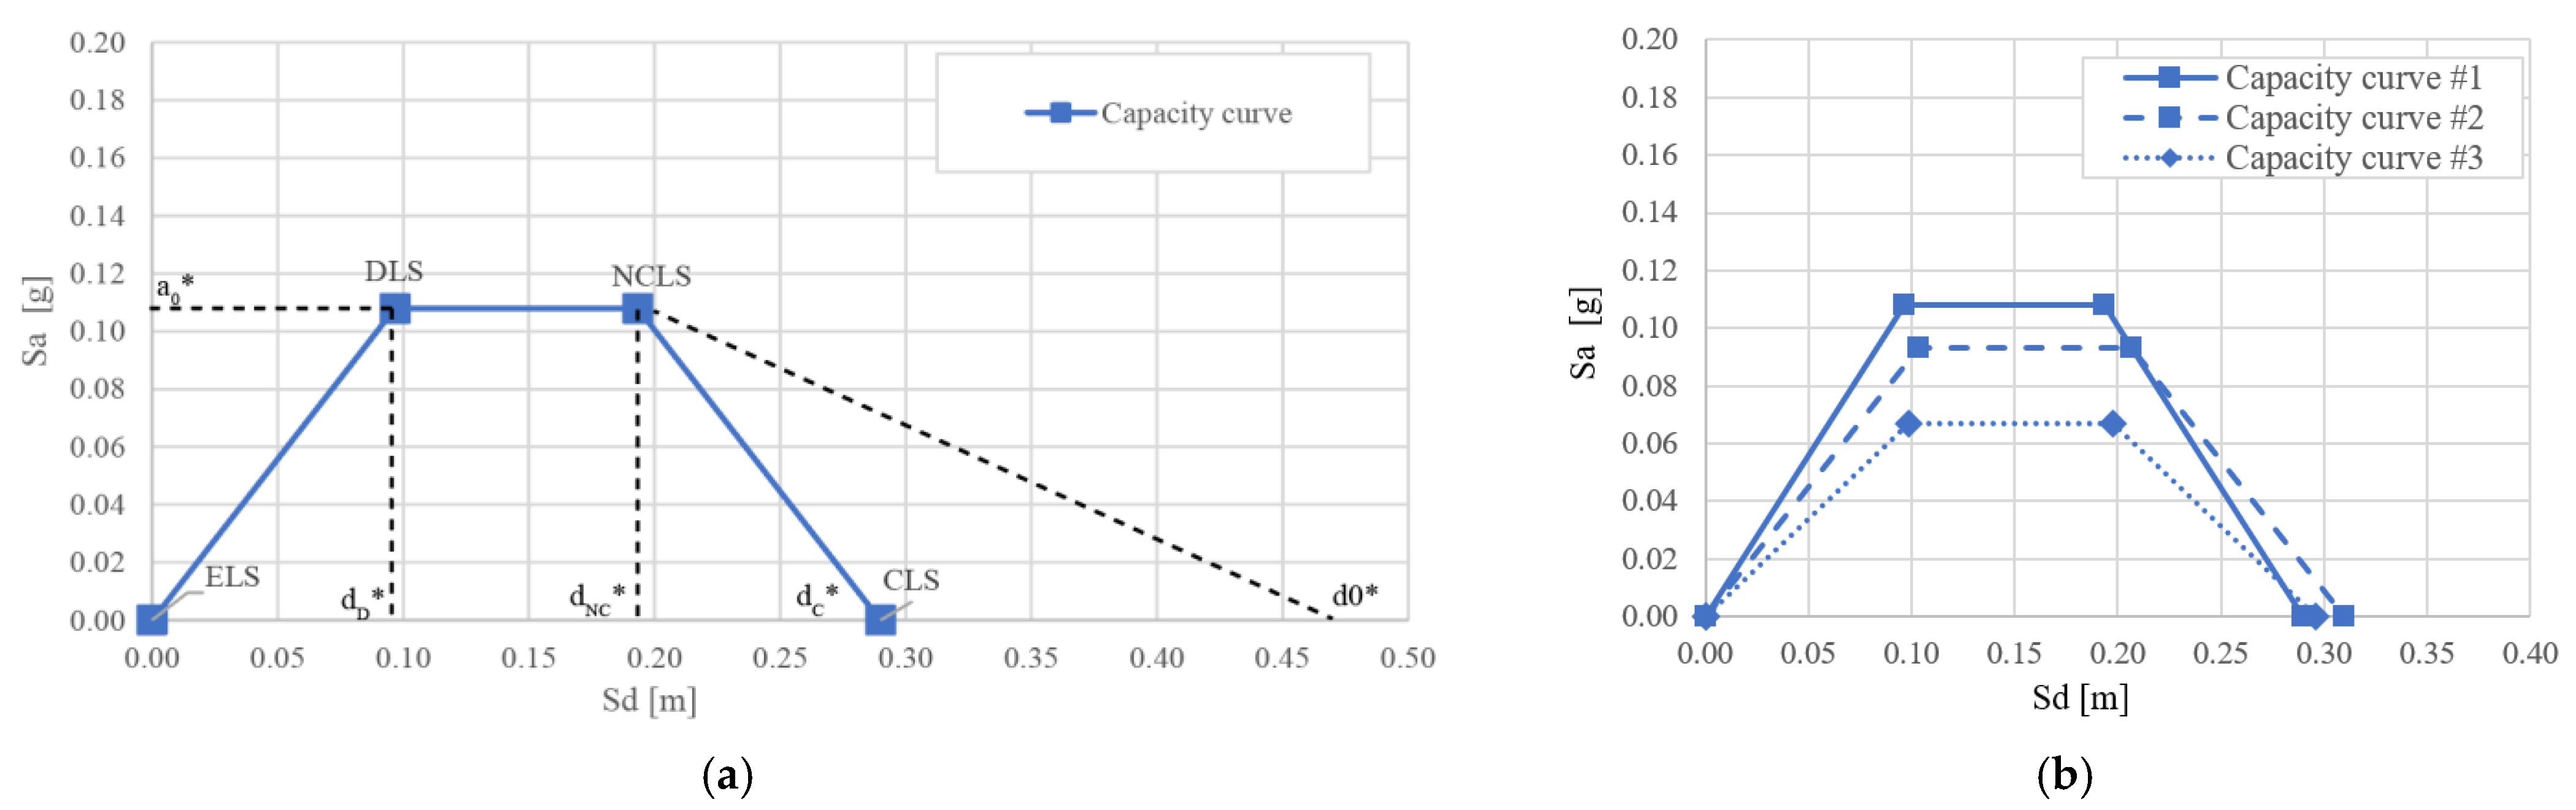
According to the Italian Guidelines [21], capacity curves are outlined by detecting four points corresponding to four performance levels: the Elastic Limit State (ELS), the Damage Limit State (DLS), the Near-Collapse Limit State (NCLS) and the Collapse Limit State (CLS). Since dk, as described in Equation (12), may not accurately reflect the real behavior of the element, the actual ultimate displacement (dc*) of the SDOF system is usually evaluated as 60% of dk, which corresponds to the Collapse Limit State (CLS). The displacement related to the attainment of the Near-Collapse Limit State (NCLS) can be defined as 40% of dk, while for the Damage Limit State (DLS) it can be set equal to dNC*/q. Lastly, the displacement for the Elastic Limit State (ELS) can be defined as follows:
where si is the wall thickness and hbar is the height of the macro-element’s center of mass. Table 4 shows the results obtained from the linear and nonlinear kinematic analyses for the monolithic overturning of the façades of the considered archetypes. Through this procedure, schematized in Figure 10a, capacity curves were obtained for each archetype (Figure 10b).
Table 4.
Results of the linear and nonlinear kinematic analyses.
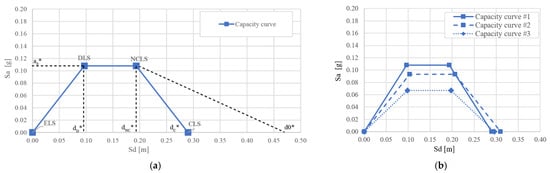
Figure 10.
(a) Capacity curve schematization and (b) capacity curves of the identified archetypes.
The comparison of trilinear capacity curves shows a reduced structural capacity for Archetype #3 as compared to the others. In fact, the presence of thrusting elements (vaults) in the analyzed macro-element generates additional horizontal forces that facilitate the earlier activation of kinematic mechanisms, thus reducing the overall structural resistance to seismic forces.
4.2. Damage Limit States
Several researchers in the past have carried out studies to define Damage Limit States using trilinear capacity curves representing the behavior of macro-elements subjected to out-of-plane mechanisms. The aim is to correlate each point of a capacity curve with a specific condition of the structure according to the “Performance Level”-based theory [22].
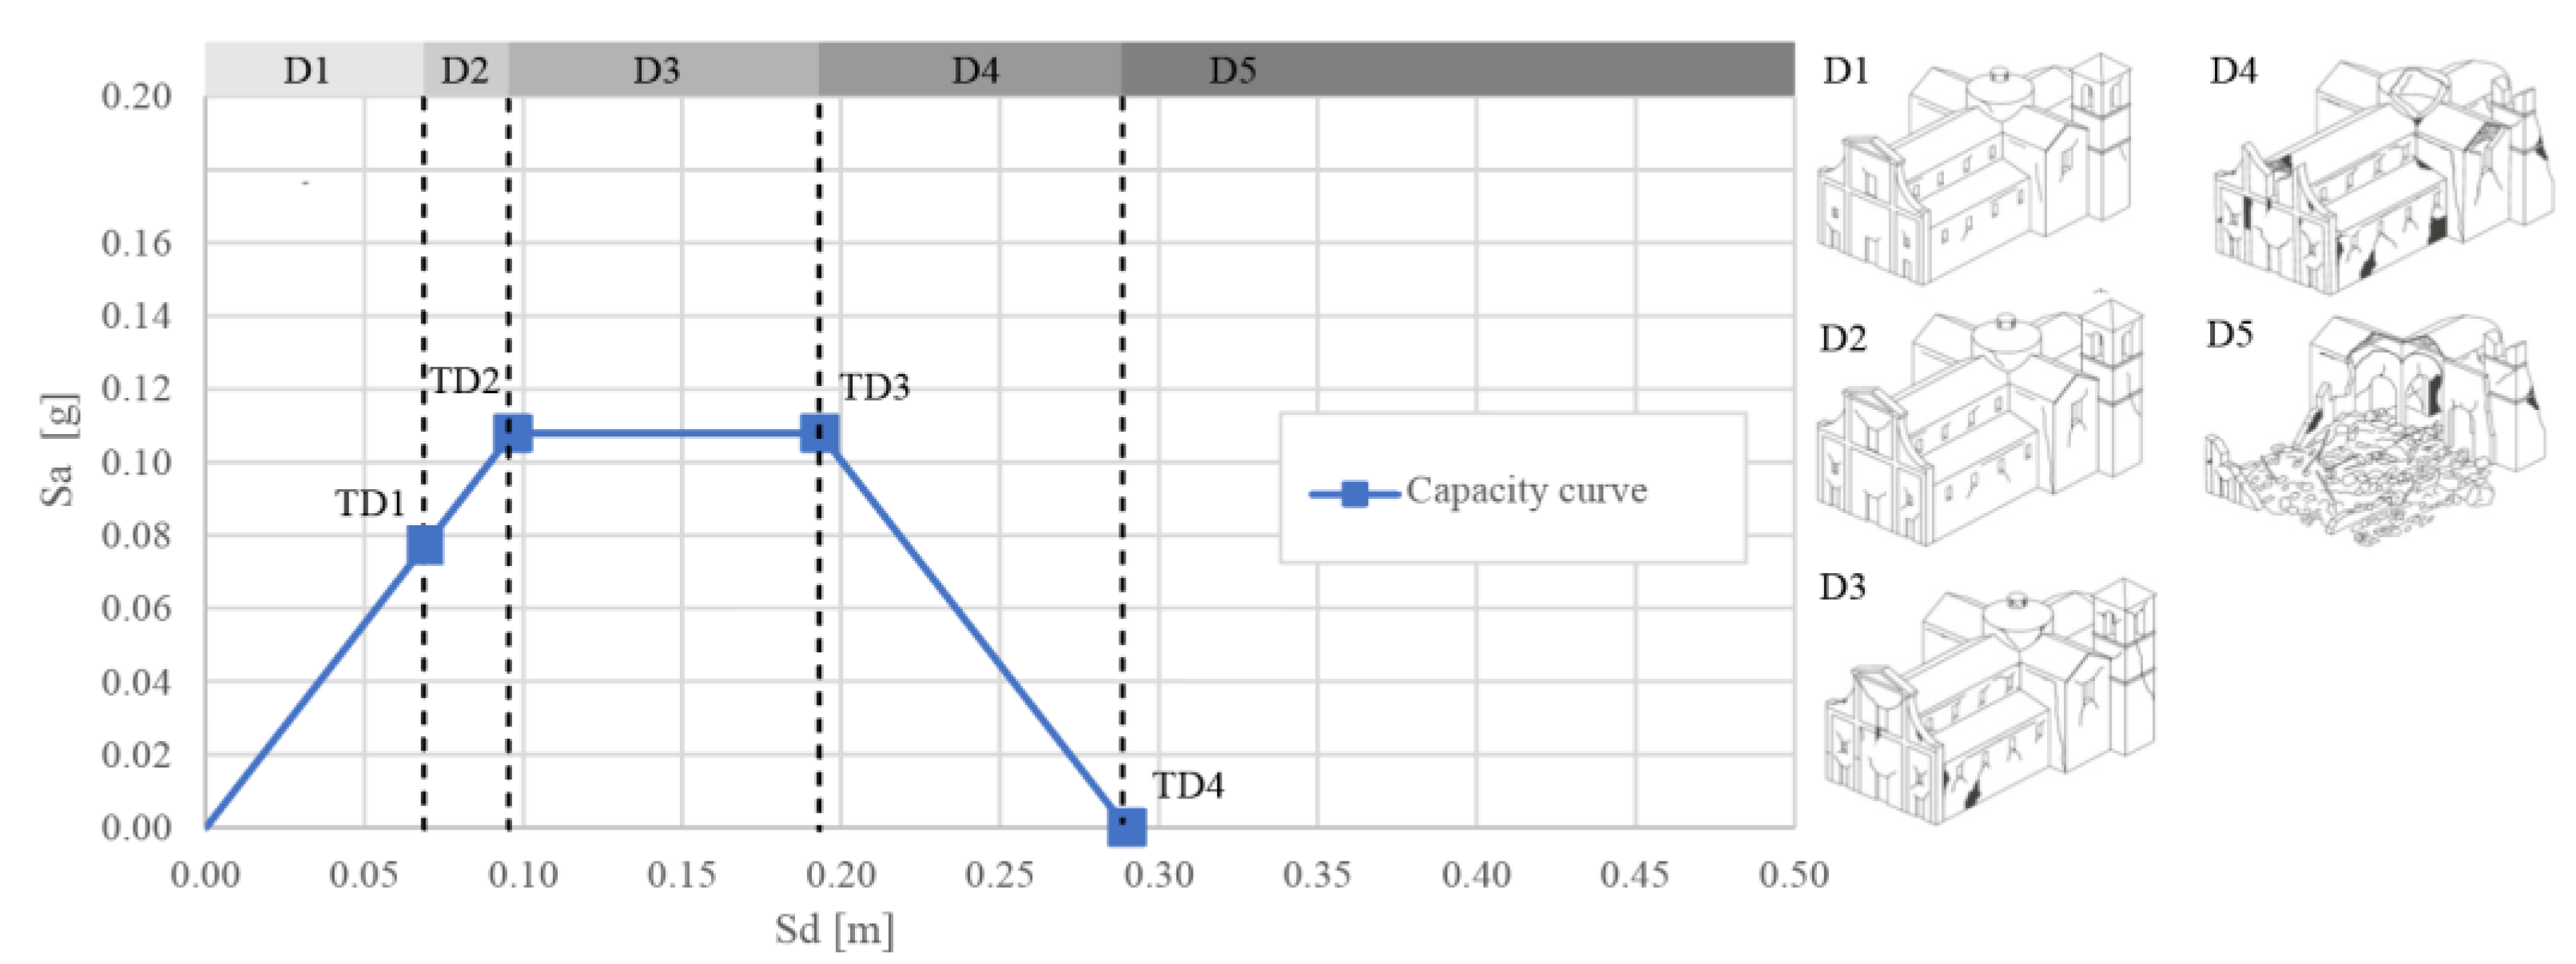
For the purposes of the current study, four damage limits (TD1, TD2, TD3 and TD4), corresponding to the thresholds between the five damage levels (DLs), were considered. These levels are defined in analogy to the definition given for masonry residential buildings by Grunthal [23] in the European macro-seismic scale EMS98. The TD2 threshold (end of linear branch) represents the displacement at which rocking is activated. For overturning mechanisms in rigid blocks, the structure does not present any permanent damage at this stage because the block returns to its initial configuration at the end. However, in real structures, cracks occur. This threshold, TD1, is conventionally set to 70% of TD2 and marks the initial formation of cracks before full rocking is activated. TD3 is related to the displacement corresponding to the attainment of the Near-Collapse Limit State, marking the last point before the decreasing branch of the curve. TD4 is activated when the displacement is equal to the one corresponding to the Collapse Limit State, i.e., when the spectral acceleration reduces to zero. The damage thresholds adopted for the analytical capacity curves are shown in Figure 11.
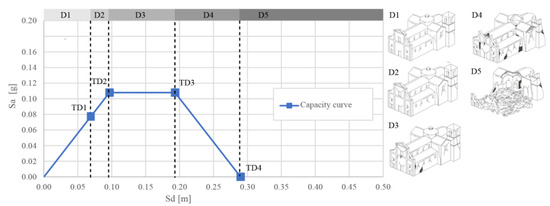
Figure 11.
Generic capacity curve with indication of damage levels (D0 to D5) and associated damage thresholds (TDs).
4.3. Seismic Demand
Seismic analyses inherently involve a great number of uncertainties, the main one of which is the variability of the seismic input. To address this aspect, for this study, a robust suite of accelerograms was employed to assess the structural capacity of masonry buildings under different ground motion records. A large dataset comprising 125 natural seismic records corresponding to different levels of ground accelerations was considered. These records were transformed into elastic spectra in the ADRS (Acceleration–Displacement Response Spectra) form for comparison with the trilinear capacity curves obtained in the previous section. The selected seismic inputs were elaborated within the framework of the ReLuis project (Network of University Laboratories for Earthquake Engineering), funded by the Italian Civil Protection Department (DPC), with the final purpose of updating the Italian National Risk Assessment [24].
The 125 accelerograms refer to records measured at epicentral distances below 30 km for soil types of category A or B. They are characterized by a moment magnitude (Mw) ranging from 5.4 to 7.1 and a PGA ranging from 0.40 m/s2 to 17.16 m/s2 and from 0.40 m/s2 to 11.58 m/s2 in the X and Y directions, respectively [25]. These accelerograms are divided into nine families, each one corresponding to a pre-selected range of PGA values (Table 5).
Table 5.
Range and average PGA values for the nine families of seismic inputs.
4.4. Mechanical-Based Fragility Curves
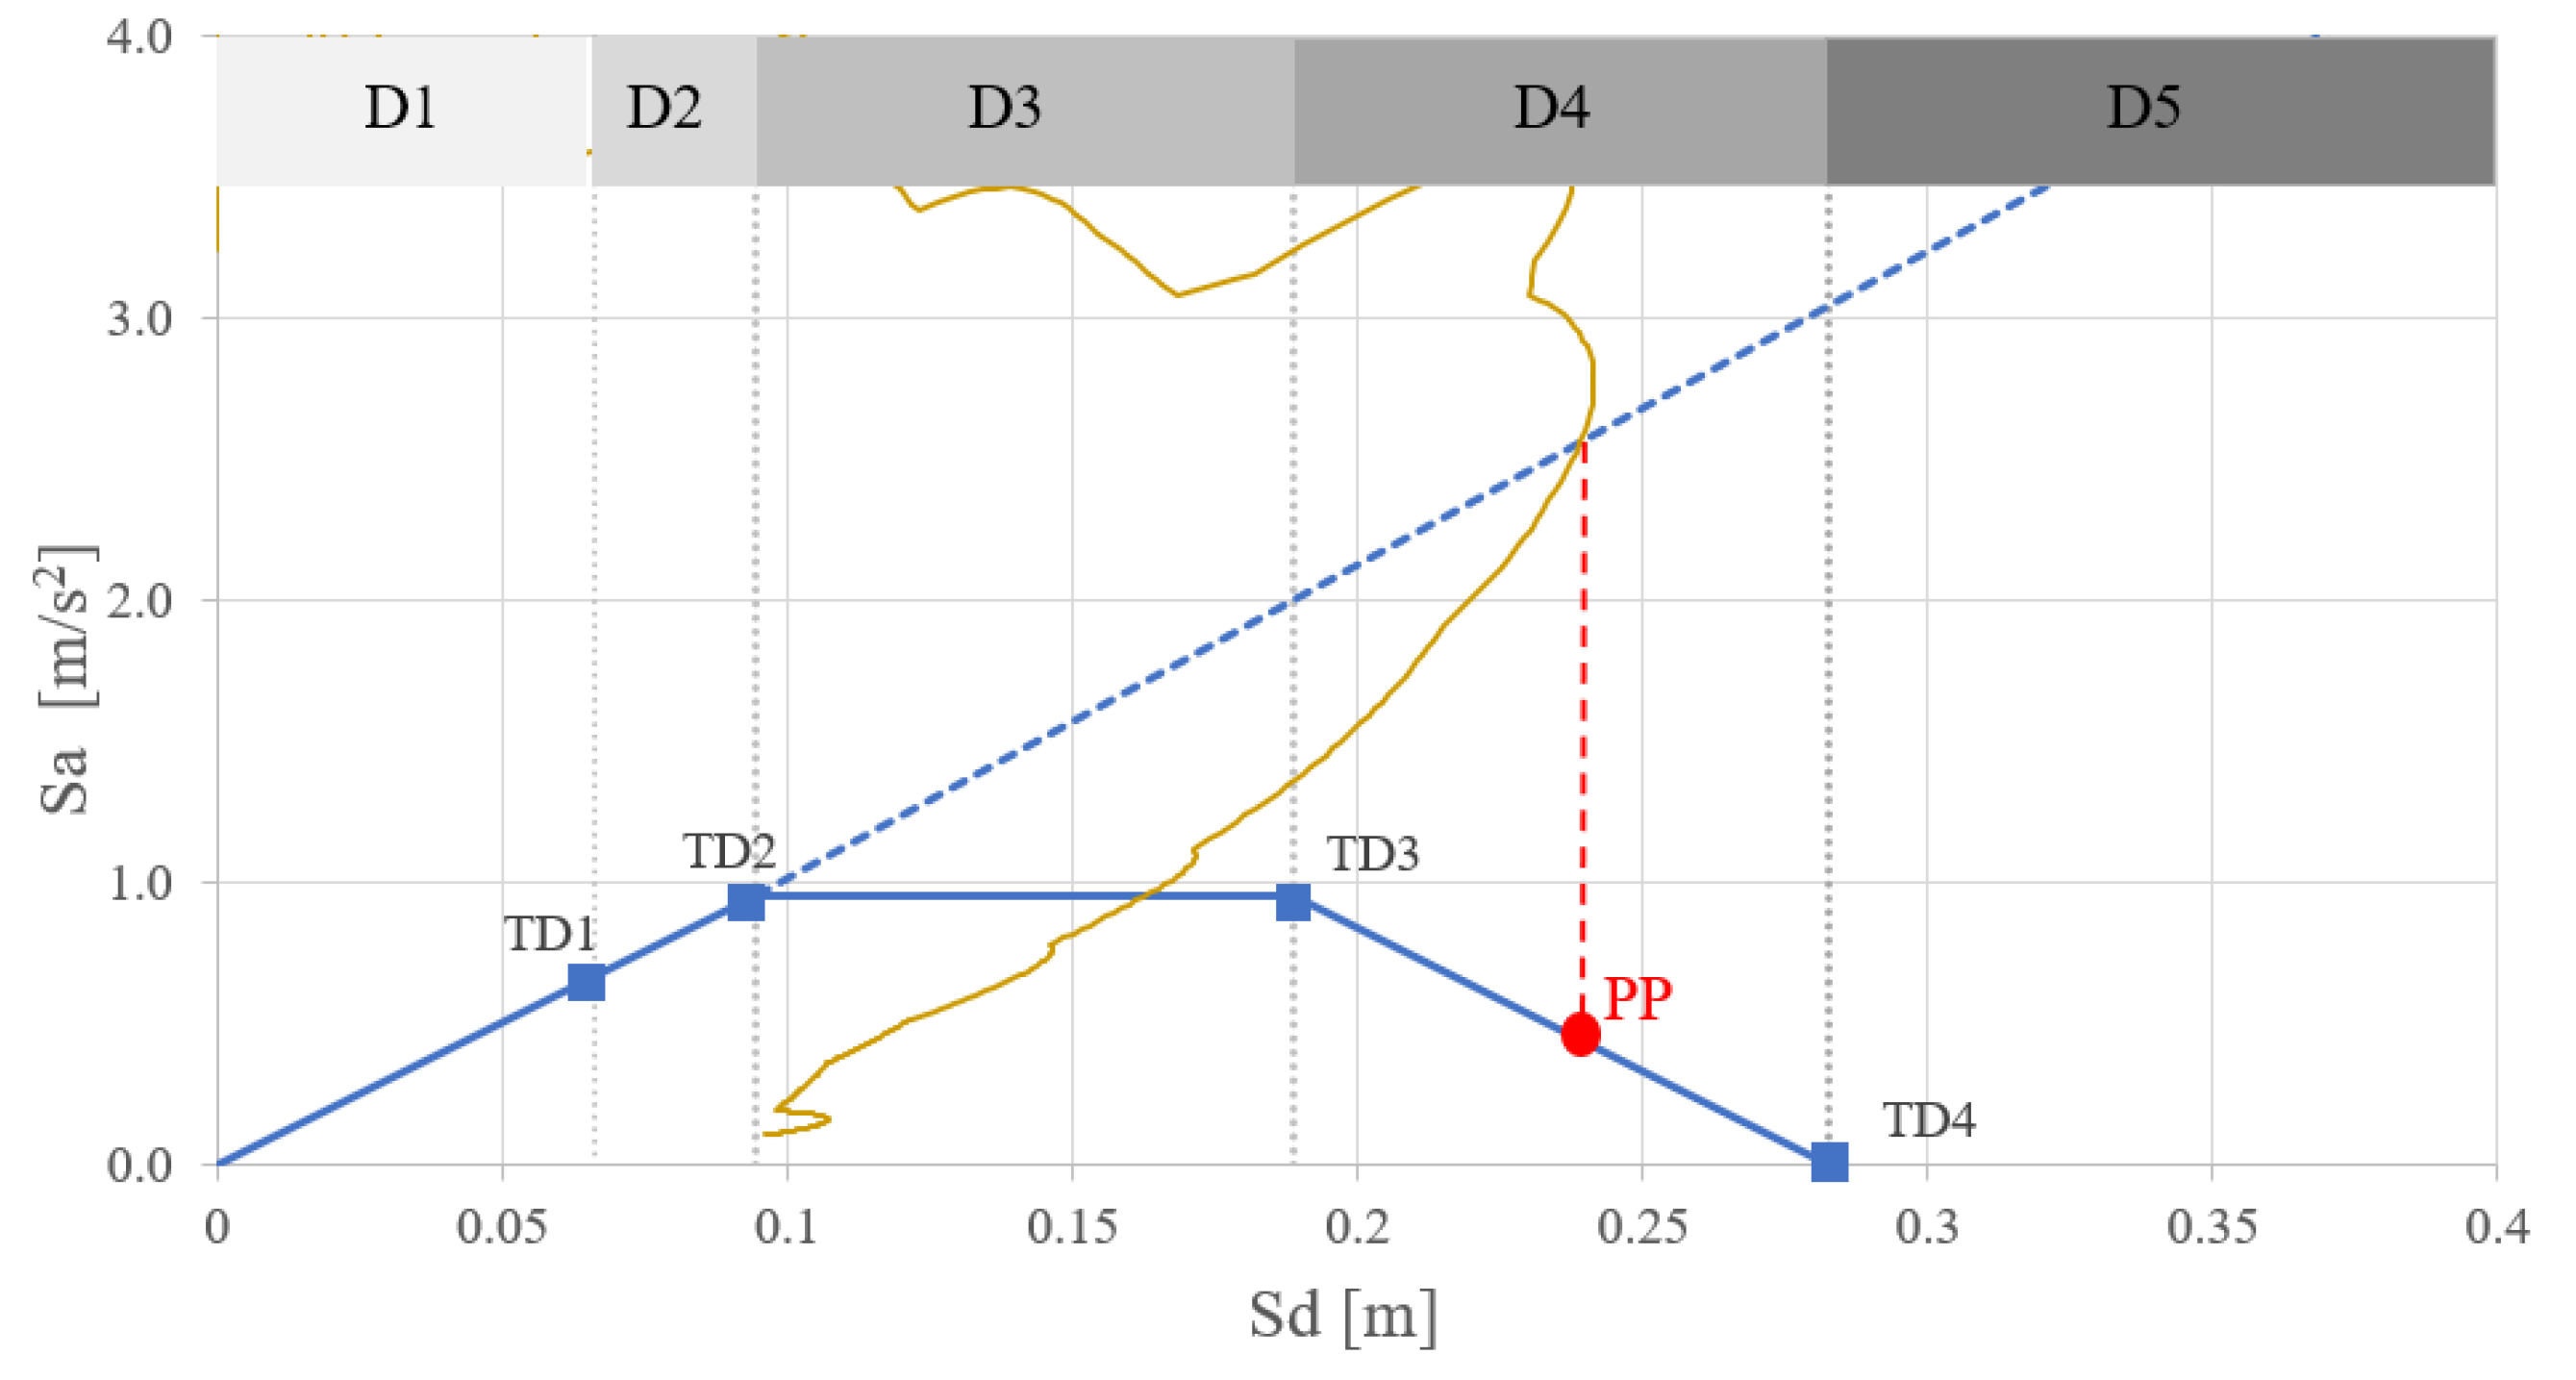
The superposition of the trilinear capacity curves and the seismic demand spectra allowed estimation of the displacement achieved by the analyzed church macro-elements and thus assessment of whether the structures exceed any of the pre-established Damage Limit States discussed in Section 4.2. This approach is based on the definition of the Performance Point (PP), which is the point of the capacity curve that has the same displacement of the point at the intersection between the elastic branch of the capacity curve and the seismic demand spectrum. In Figure 12, the methodology is visually explained with reference to Archetype Church #1 and a seismic demand corresponding to a PGA of 0.324 g. In summary: (1) the analytical capacity curve of the analyzed archetype, derived from nonlinear kinematic analyses, is plotted (the continuous blue line in the figure); (2) the Damage Limit States (D1 to D5) are defined as explained in the previous section and overlaid on the curve; (3) the demand seismic spectrum in ADRS format corresponding to a selected PGA (3.24 m/s2 in this example) is represented (the yellow line in the Figure); (4) the extension of the elastic branch of the capacity curve is drawn (the dotted blue line) to intersect with the demand spectrum. The example reported in Figure 12 shows that the studied macro-element of Archetype #1, under the selected earthquake scenario, is likely to suffer significant structural damage (the PP is located within the Partial Collapse (D4) Damage Limit State).
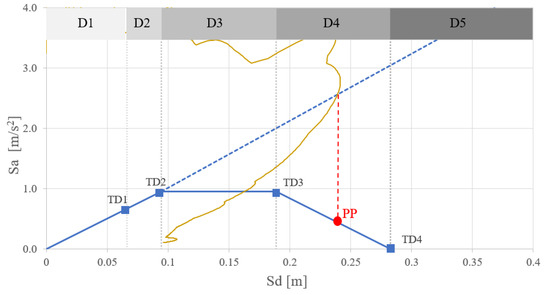
Figure 12.
Performance Point definition (red point) through superposition of capacity curve and demand spectrum for Archetype #1.
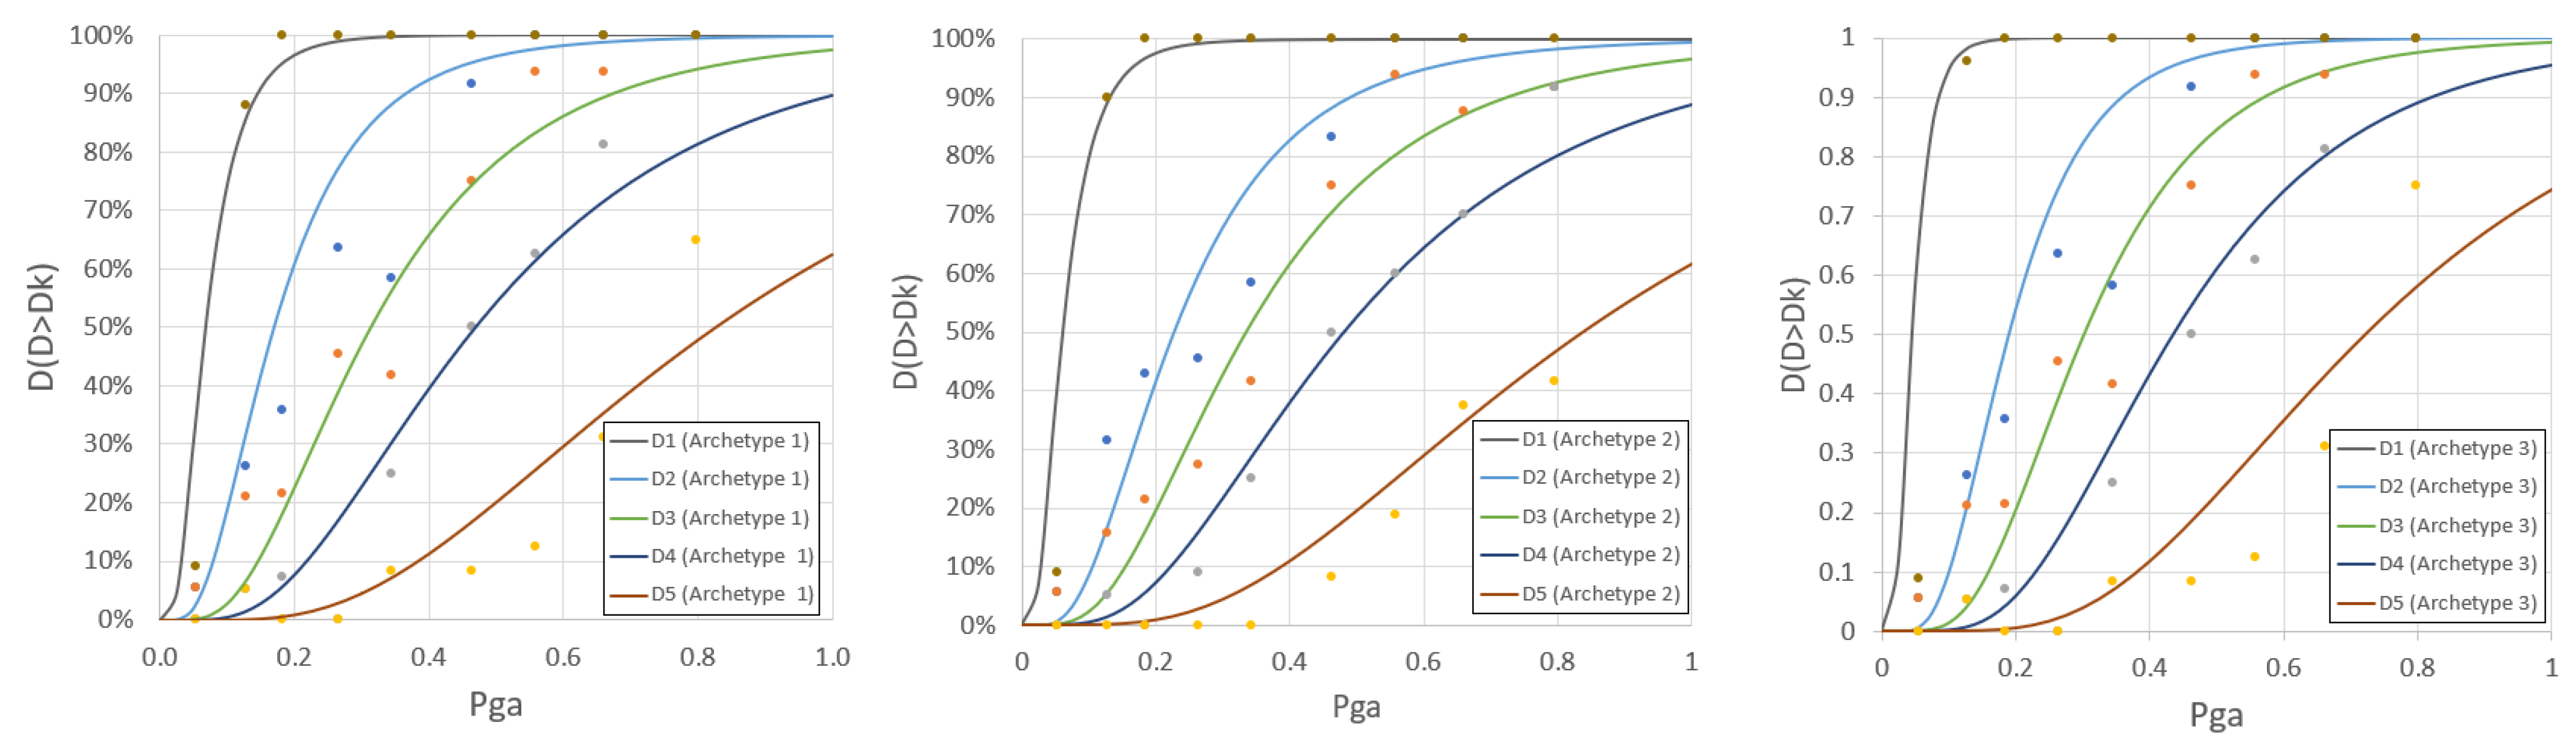
The repetition of the procedure described above for all the spectra of each family in the accelerogram suite allowed the number of earthquakes that caused the achievement of the pre-established damage limit states to be recorded. This number, divided by the total number of earthquakes in the family, yielded the probability of failure (with respect to the considered limit state) related to the PGA characterizing the family of spectra, also accounting for the record-to-record variability. In this way, Damage Probability Matrices (DPMs) were estimated. These probabilities were then cumulated, in a way similarly to the empirical method described in Equation (6), to obtain a series of points that were fitted to a lognormal probability distribution using maximum likelihood estimation (MLE) (Figure 13). This distribution was characterized by a median PGA and a standard deviation, according to [26]. For the sake of clarity, the median PGA generally increases for different damage levels, while the standard deviation (β) is assumed to be constant across damage levels to avoid intersections of fragility curves within the interval of numerical integration of the risk convolution [27]. The results of the entire procedure, expressed in terms of fragility curves, are shown in Figure 13 for the three investigated archetypes.
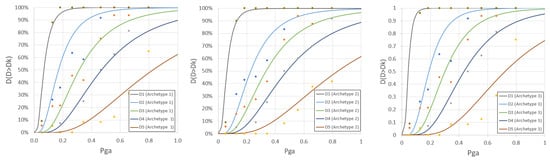
Figure 13.
Construction of fragility curves for the façade macro-elements of the archetype churches, where points are interpolated by a lognormal function.
By comparing the plots, it was found that Archetype #3—characterized by higher structural complexity as compared to Archetypes #1 and #2—has greater vulnerability. This is especially evident for severe damage levels (D4 and D5).
5. Comparison of Large-Scale Vulnerability Assessment Methodologies
The fragility curves derived from the empirical method (Section 2) and the mechanical-based method (Section 4) are here compared for each Damage Limit State. As highlighted in Figure 14, the empirical methodology yielded more severe fragility curves for all damage levels. One of the main reasons for these differences is the considerable structural inhomogeneity in the empirical sample. As shown in Figure 2 (Section 2.1), this sample includes a broad range of churches with varying structural complexities (e.g., varying numbers of naves). In addition, the stock considered in the empirical method contains churches with interventions, such as reinforced concrete roofs, which are often negatively evaluated in post-earthquake assessments [20] and so are negatively evaluated by the MaCHRO form. These features increase their vulnerability, as amply demonstrated by studies carried out by the authors previously. On the other hand, the most representative archetypes have single naves with lightweight, nonthrusting roofs.
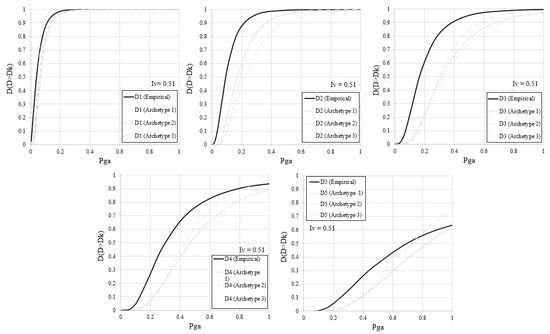
Figure 14.
Analytical fragility curves of archetype churches (grey lines) versus empirical fragility curves with Iv = 0.51 (black lines).
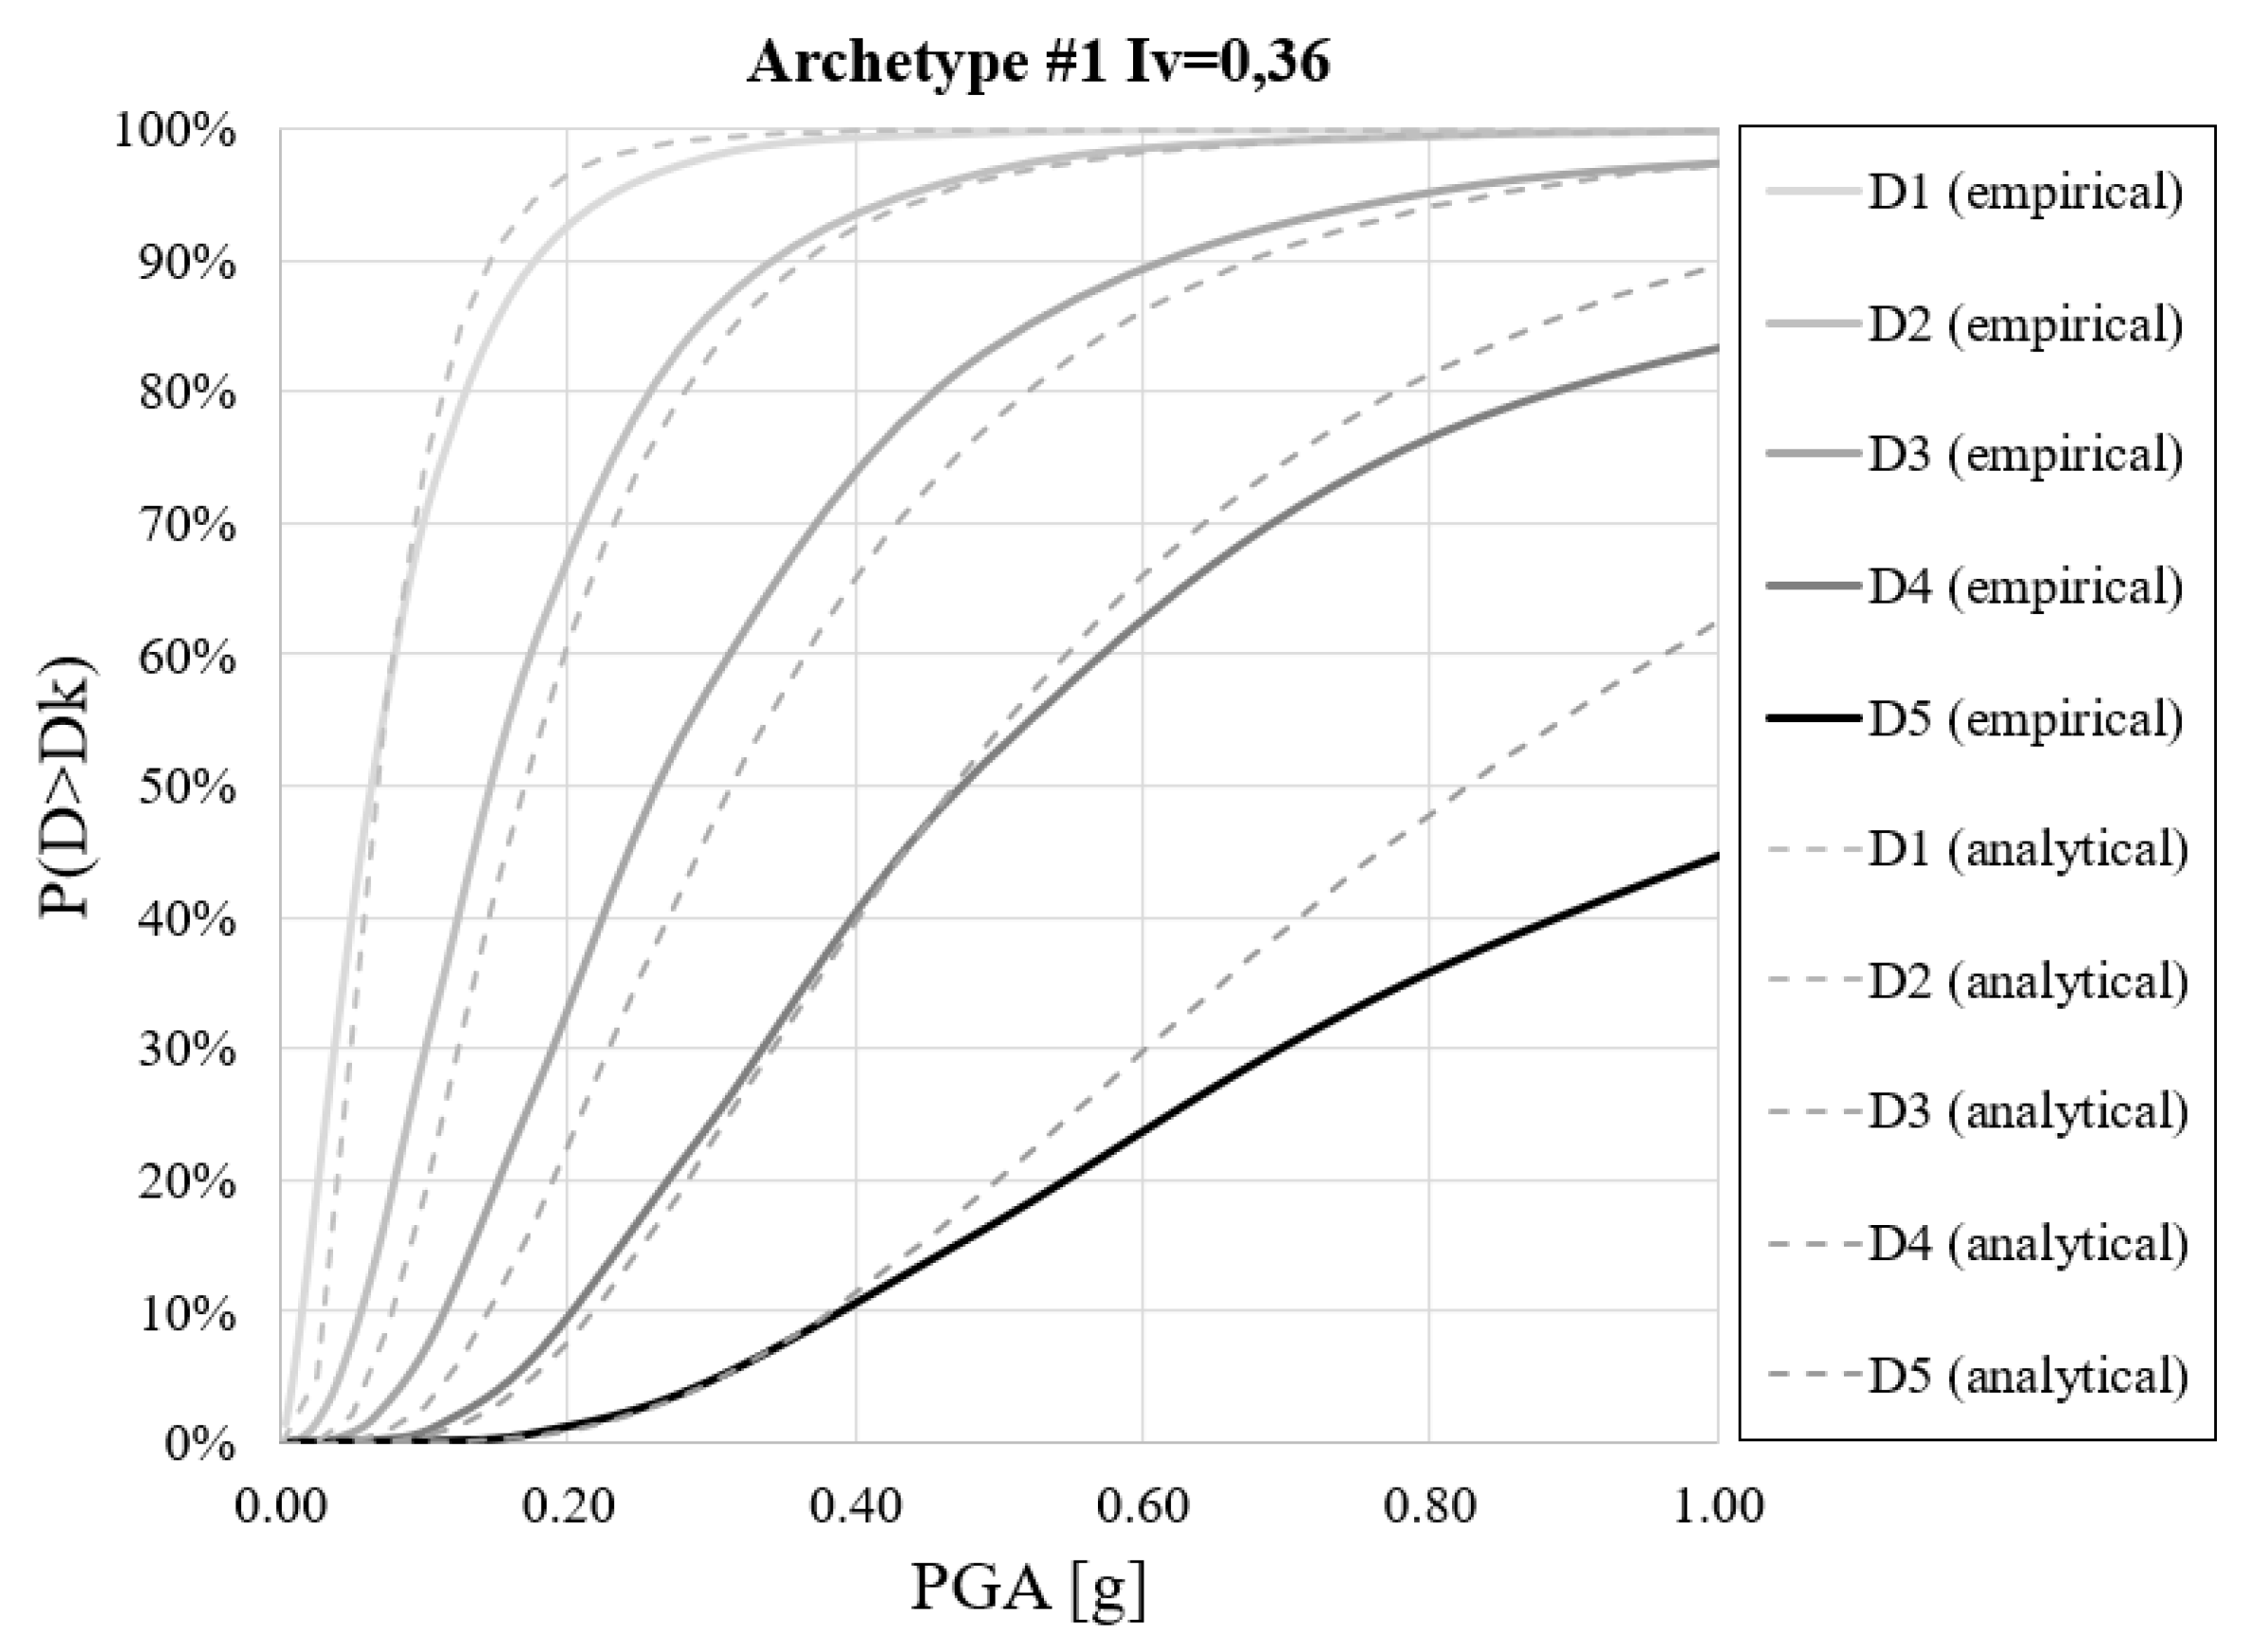
With the aim of improving comparability, among the 87 churches that form the stock analyzed with the empirical method, only those with structural characteristics similar to Archetype #1 were extrapolated. The procedure discussed in Section 2.3 was therefore re-applied, yielding a new average Iv value of 0.36. Figure 15 shows the refined comparison of the two methods in terms of fragility curves. When restricting the analysis to structurally comparable churches, the results were very similar. This indicates that, for archetypes with very simple structures, the empirical methodology provided results that were truly comparable to the results given by the analysis of the most fragile macro-elements of the churches.

Figure 15.
Analytical fragility curves (dotted lines) versus empirical fragility curves (continuous lines) for Archetype #1.
6. Conclusions
In this paper, two different methodologies for the seismic evaluation of churches in Central Italy were proposed and comprehensively compared. The results were described in terms of seismic fragility curves, which are useful in predicting the probability of exceeding pre-established damage levels for different seismic intensities. A key finding from the comparison is the cross-validation of the methodologies. A summary of the main conclusions drawn from the study is given below.
- The MACHRO form is an automated tool that can be profitably used to reduce the subjectivity associated with engineering judgments in the definition of seismic vulnerability indices (Iv) for churches when implementing empirical methods for seismic assessments. This tool, supported by a connected spreadsheet, allows the seismic vulnerability of structures to be determined in a simple way. By evaluating both the sources of vulnerability and the presence of seismic devices, the form facilitates planning and allocation of economic resources.
- The results highlight the importance of appropriately categorizing churches into homogeneous groups for better accuracy when implementing the empirical methodology. In fact, empirical results satisfactorily match with those of the mechanical approach when similar structures are considered, while significant differences are observed in other cases.
- The analysis of kinematic mechanisms, applied to the macro-elements of archetype churches, is extremely valuable in assessing their seismic capacity and evaluating the effectiveness of preventive measures. In the analyzed examples, the overturning of façades was consistently the first failure mode under seismic loads as compared with other macro-elements. This denotes poor connections with the lateral walls but also structural deficiencies due to transformations and reconstructions performed over time without seismic criteria.
- Archetype-based analyses can be used to improve current large-scale seismic risk assessment approaches for churches. Additionally, the analytical procedure could be extended to include other macro-elements to better represent the global seismic behavior of churches.
Author Contributions
Conceptualization, G.C.; methodology, G.B. and G.D.M.; formal analysis, M.G.M.; writing—original draft preparation, G.C.; writing—review and editing, M.G.M. and G.B.; Visualization, G.C., Supervision, G.B. and M.G.M. All authors have read and agreed to the published version of the manuscript.
Funding
This research received no external funding.
Data Availability Statement
Restrictions apply to the availability of the data. Data were obtained from Department of Civil Protection and are available at “https://egeos.eucentre.it/danno_osservato/web/danno_osservato, accessed on 15 November 2024” with the permission of Eucentre.
Acknowledgments
The study presented in this article was partially carried out within the framework of the Project GENESIS: seismic risk manaGEmeNt for the touristic valorisation of thE hiStorIcal centres of Southern Italy. PON MIUR “Research and Innovation” 2014–2020 and FSC. D.D. 13 July 2017 n. 1735. Industrial research and experimental development projects in the 12 Smart Specialization areas. Specialization area: Cultural Heritage. Project Code ARS01_00883. The opinions and conclusions presented by the authors do not necessarily reflect those of the funding agency.
Conflicts of Interest
The authors declare no conflict of interest.
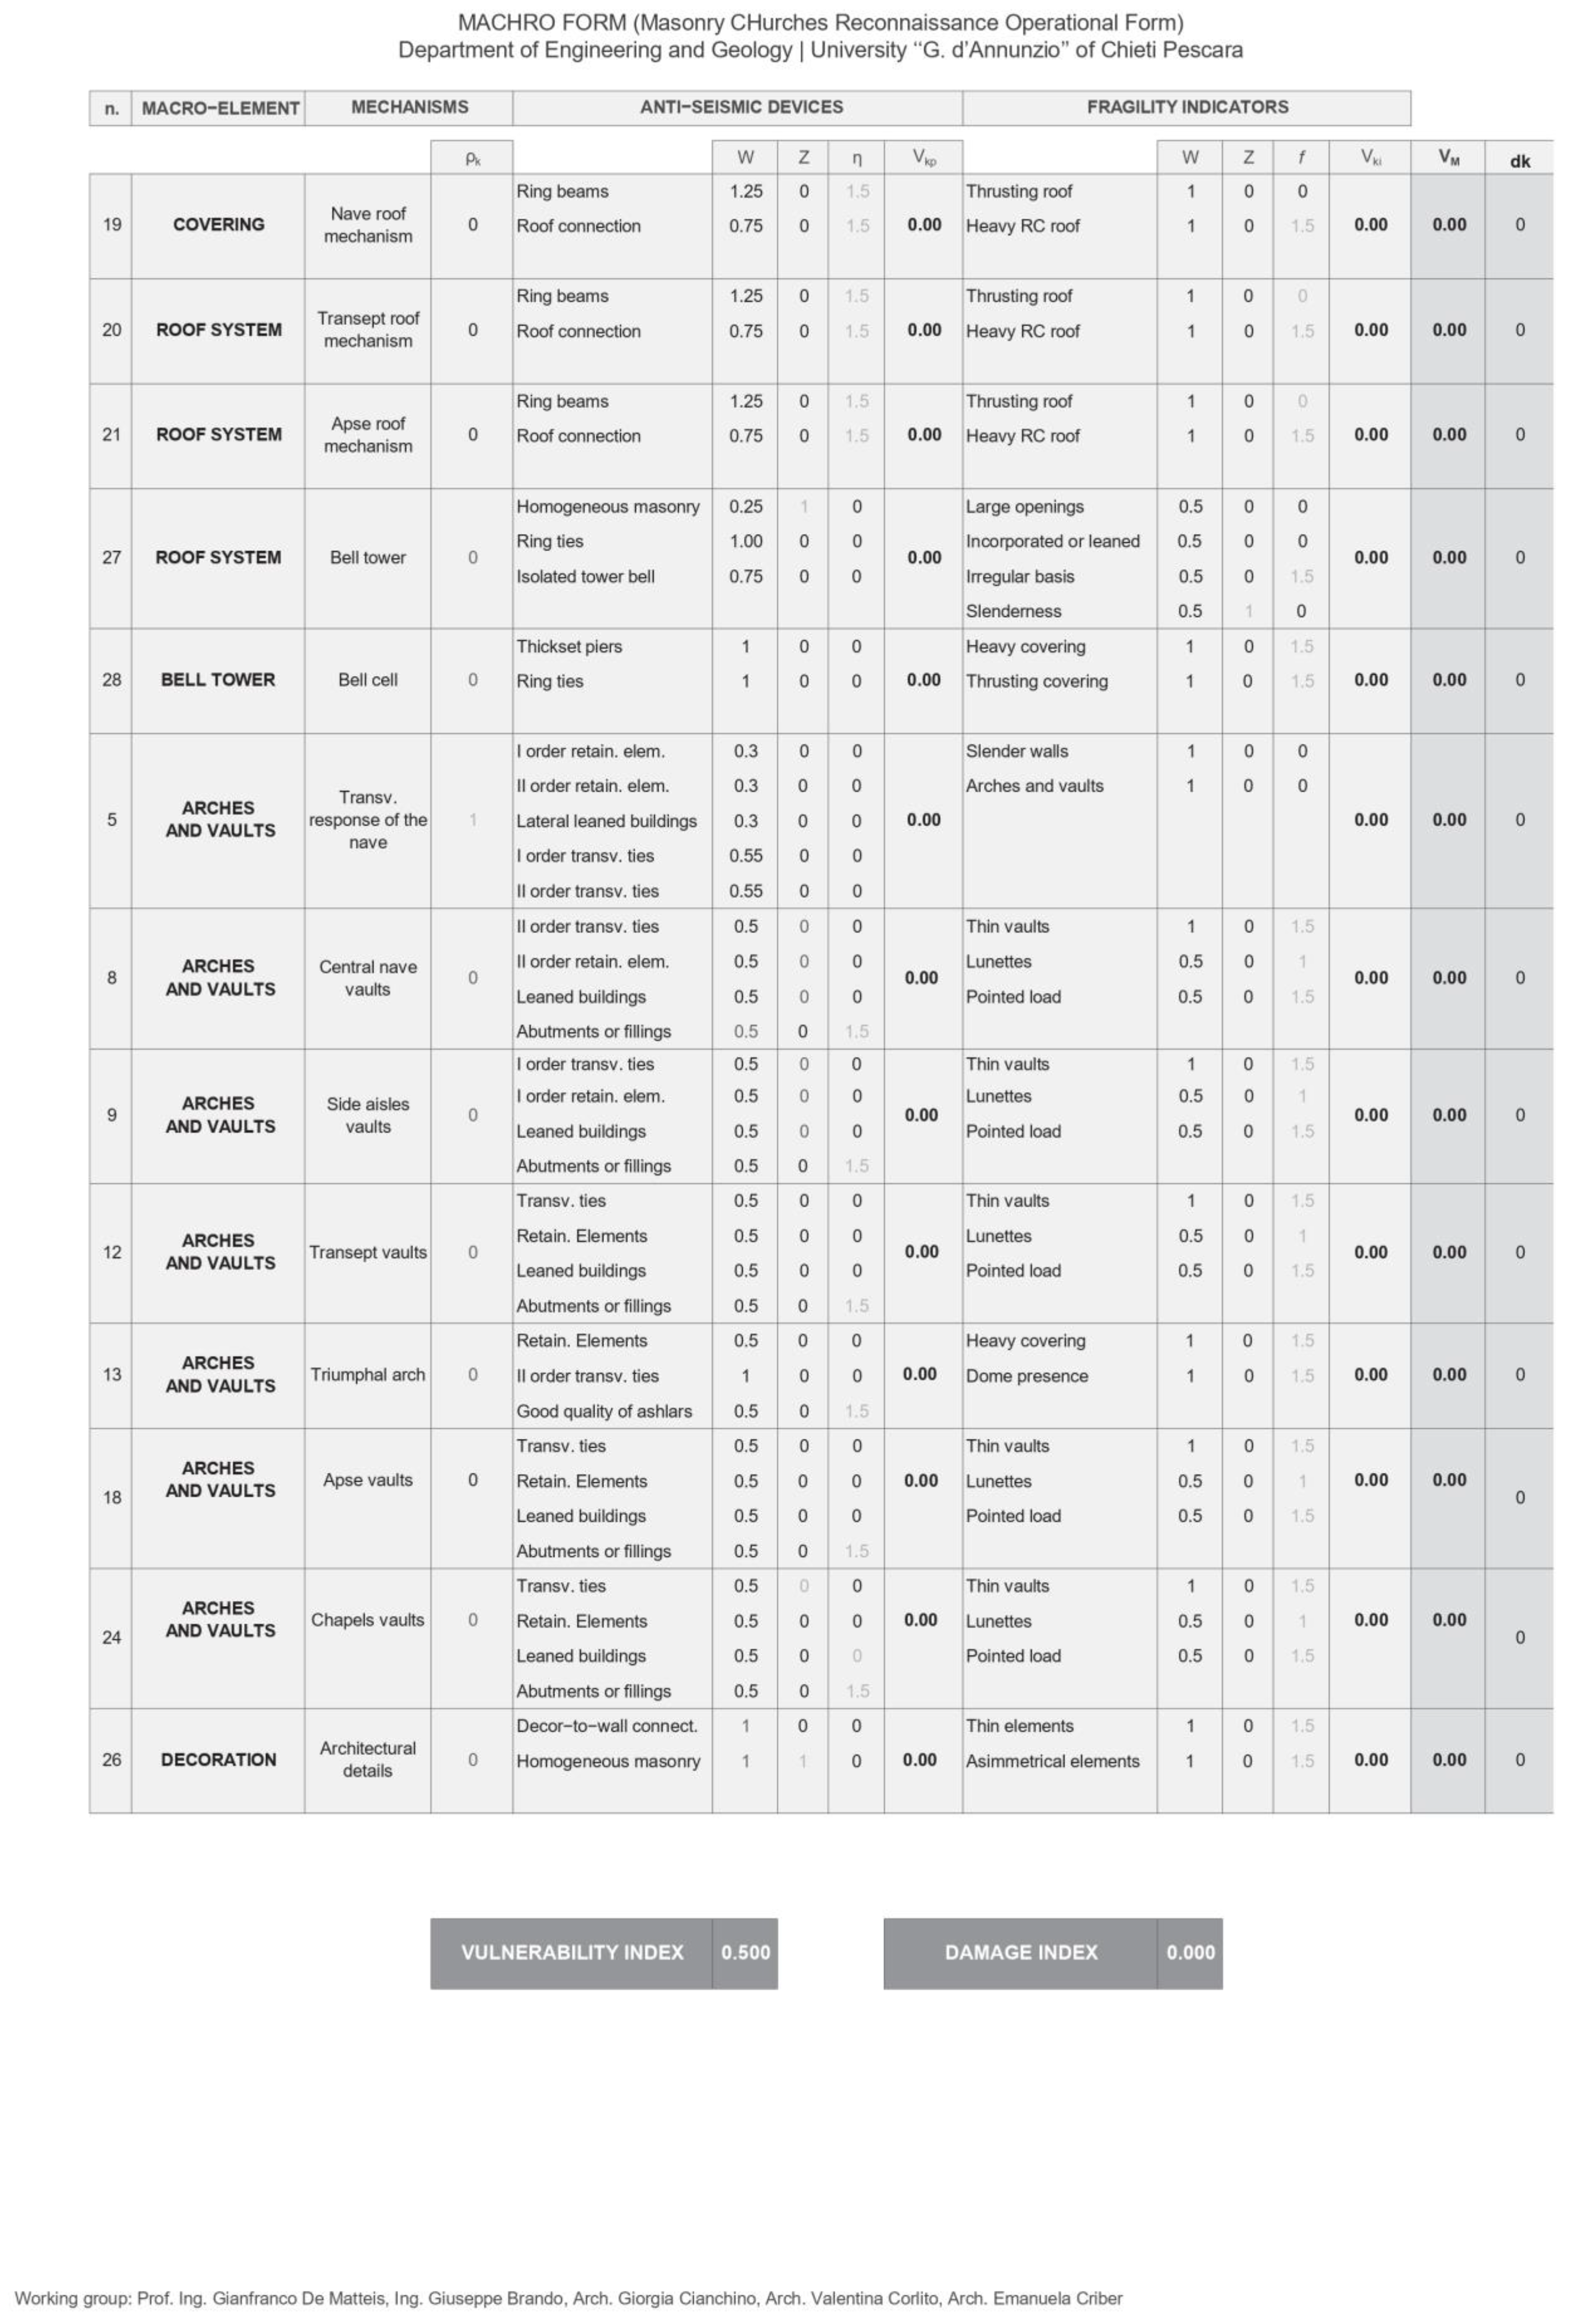
Appendix A
References
- D’Antonio, M. Ita terraemotus damna impedire. In Note Sulle Tecniche Antisismiche Storiche in Abruzzo; Carsa Editore: Pescara, Italia, 2013; 223p. [Google Scholar]
- Lagomarsino, S.; Podestà, S. Damage and vulnerability assessment of churches after the 2002 Molise, Italy, earthquake. Earthq. Spectra 2004, 20, S271–S283. [Google Scholar] [CrossRef]
- Brandonisio, G.; Lucibello, G.; Mele, E.; de Luca, A. Damage and performance evaluation of masonry churches in the 2009 L’Aquila earthquake. Eng. Fail. Anal. 2013, 34, 693–714. [Google Scholar] [CrossRef]
- Valente, M.; Barbieri, G.; Biolzi, L. Damage assessment of three medieval churches after the 2012 Emilia earthquake. Bull. Earthq. Eng. 2017, 15, 2939–2980. [Google Scholar] [CrossRef]
- Sorrentino, L.; Liberatore, L.; Decanini, L.D.; Liberatore, D. The performance of churches in the 2012 Emilia earthquakes. Bull. Earthq. Eng. 2014, 12, 2299–2331. [Google Scholar] [CrossRef]
- Cescatti, E.; Salzano, P.; Casapulla, C.; Ceroni, F.; da Porto, F.; Prota, A. Damages to Masonry Churches After 2016–2017 Central Italy Seismic Sequence and Definition of Fragility Curves; Springer: Berlin/Heidelberg, Germany, 2020; Volume 18. [Google Scholar]
- Anzani, A.; Cardani, G.; Condoleo, P.; Garavaglia, E.; Saisi, A.; Tedeschi, C.; Tiraboschi, C.; Valluzzi, M.R. Understanding of historical masonry for conservation approaches: The contribution of Prof. Luigia Binda to research advancement. Mater. Struct. 2018, 51, 140. [Google Scholar] [CrossRef]
- Minister of Heritage and Cultural Activities. Linee Guida per la Valutazione e la Riduzione del Rischio Sismico del Patrimonio Culturale con Riferimento Alle Norme Tecniche per le Costruzioni (Circular No. 26, Prot. 10953 of 02/12/2010). Italian Code for Protection of Cultural Heritage. 2010. Available online: https://www.soprintendenzapdve.beniculturali.it/la-soprintendenza-informa/atti-di-indirizzo/linee-guida-per-la-valutazione-e-riduzione-del-rischio-sismico-del-patrimonio-culturale/ (accessed on 10 November 2024).
- De Matteis, G.; Brando, G.; Corlito, V. Predictive model for seismic vulnerability assessment of churches based on the 2009 L’Aquila earthquake. Bull. Earthq. Eng. 2019, 17, 4909–4936. [Google Scholar] [CrossRef]
- Tashkov, L.; Krstevska, L.; Naumovski, N.; De Matteis, G.; Brando, G. Ambient vibration tests on three religious buildings in Goriano Sicoli damaged during the 2009 L’aquila earthquake. In COST ACTION C26: Urban Habitat Constructions Under Catastrophic Events—Proceedings of the Final Conference; CRC Press: Boca Raton, FL, USA, 2010; pp. 433–438. [Google Scholar]
- Brando, G.; Criber, E.; De Matteis, G. The effects of L’aquila earthquake on the st. gemma church in goriano sicoli: Part II—Fem analysis. Bull. Earthq. Eng. 2015, 13, 3733–3748. [Google Scholar] [CrossRef]
- Borzi, B.; Crowley, H.; Pinho, R. Simplified pushover-based earthquake loss assessment (SP-BELA) method for masonry buildings. Int. J. Archit. Herit. 2008, 2, 353–376. [Google Scholar] [CrossRef]
- Basaglia, A.; Cianchino, G.; Cocco, G.; Rapone, D.; Terrenzi, M.; Spacone, E.; Brando, G. An Automatic Procedure for Deriving Building Portfolios Using the Italian ‘CARTIS’ Online Database. Structures 2021, 34, 2974–2986. [Google Scholar] [CrossRef]
- DPC. Survey Form of the Cultural Heritage—Damage of the Churches (in Italian). Department of Civil Protection. Available online: https://egeos.eucentre.it/danno_osservato/web/danno_osservato?lang=EN (accessed on 18 July 2022).
- Cianchino, G.; De Matteis, G.; Brando, G. Typological Classification and Observed Damage Patterns of Masonry Churches After the 2016 Central Italy Earthquake. Available online: https://www.scipedia.com/public/Cianchino_et_al_2021a (accessed on 30 November 2021).
- Lagomarsino, S.; Podestà, S. Seismic Vulnerability of Ancient Churches: II. Statistical Analysis of Surveyed Data and Methods for Risk Analysis. Earthq. Spectra 2004, 20, 395–412. [Google Scholar] [CrossRef]
- Brando, G.; Cianchino, G.; Corlito, V.; Criber, E.; De Matteis, G. La scheda MaChro: Un nuovo strumento automatizzato per la ricognizione delle chiese finalizzato alla valutazione speditiva della vulnerabilità sismica. In Proceedings of the XVII Convegno ANIDIS l’Ingegneria Sismica, Pistoia, Italy, 17–21 September 2017. [Google Scholar]
- Available online: https://www.eucentre.it/ (accessed on 1 February 2022).
- GNDT-SSN. Scheda di Esposizione e Vulnerabilità e di Rilevamento Danni di Primo e Secondo Livello; Murata e Cemento Armato: Rome, Italy, 1994. [Google Scholar]
- Margottini, C.; Molin, D.; Narcisi, B.; Serva, L. Intensity vs acceleration: Italian data. Proc. Work Hist. Seism. Cent. Mediterr. Reg. 1987, 213–226. [Google Scholar]
- Cianchino, G.; Masciotta, M.G.; Verazzo, C.; Brando, G. An Overview of the Historical Retrofitting Interventions on Churches in Central Italy. Appl. Sci. 2023, 13, 40. [Google Scholar] [CrossRef]
- Ministero delle Infrastrutture e dei Trasporti. CIRCOLARE 21 Gennaio 2019 n.7_Istruzioni per l’applicazione dell’«Aggiornamento delle “Norme Tecniche per le Costruzioni”» di cui al Decreto Ministeriale 17 Gennaio 2018; Italian Guideline, Supplemento Ordinario Alla “Gazzetta Ufficiale” n. 35 Del 11 Febbraio 2019—Serie Generale; Ministero delle Infrastrutture e dei Trasporti: Rome, Italy, 2019; Volume 337.
- Lagomarsino, S. Seismic assessment of rocking masonry structures. Bull. Earthq. Eng. 2015, 13, 97–128. [Google Scholar] [CrossRef]
- Grünthal, G. (Ed.) European Macroseismic Scale 1998 (EMS-98) European Seismological Commission, Sub Commission on Engineering Seismology, Working Group Macroseismic Scales; Conseil de l’Europe, Cahiers du Centre Européen de Géodynamique et de Séismologie: Luxembourg, 1998; Volume 15.
- Masi, A.; Lagomarsino, S.; Dolce, M.; Manfredi, V.; Ottonelli, D. Towards the Updated Italian Seismic Risk Assessment: Exposure and Vulnerability Modelling; Springer Netherlands: Dordrecht, The Netherlands, 2021; Volume 19. [Google Scholar]
- Manfredi, V.; Masi, A.; Özcebe, A.G.; Paolucci, R.; Smerzini, C. Selection and spectral matching of recorded ground motions for seismic fragility analyses. Bull. Earthq. Eng. 2022, 20, 4961–4987. [Google Scholar] [CrossRef]
- Baker, J.W. Efficient Analytical Fragility Function Fitting Using Dynamic Structural Analysis. Earthq. Spectra 2015, 31, 579–599. [Google Scholar] [CrossRef]


Disclaimer/Publisher’s Note: The statements, opinions and data contained in all publications are solely those of the individual author(s) and contributor(s) and not of MDPI and/or the editor(s). MDPI and/or the editor(s) disclaim responsibility for any injury to people or property resulting from any ideas, methods, instructions or products referred to in the content. |
© 2024 by the authors. Licensee MDPI, Basel, Switzerland. This article is an open access article distributed under the terms and conditions of the Creative Commons Attribution (CC BY) license (https://creativecommons.org/licenses/by/4.0/).