1. Introduction
Ms. Magl. III 43, also known as the “Florence scroll”, is a rare example of an illuminated Middle Eastern Hebrew manuscript, illustrating a pilgrimage from Egypt to the mountains of Lebanon through images of the sacred places that its creator met along the way. The Hebrew Scroll, inventory number Magl. III 43 of the Magliabechiana collection, was acquired by the Biblioteca Nazionale Centrale Firenze (National Central Library of Florence, BNCF) in 1902 and at the time it was catalogued as an “object of no artistic or scientific value”. It was described as a very long membranous scroll with colored drawings depicting fantastic figures of places and monuments of Arabia and Palestine, along with handwritten texts in different languages (Hebrew, Italian, and Arabic words written in Hebrew) concerning biblical and rabbinic history, with indications in square Hebrew, some of which have been translated into Italian [
1].
In recent years, the peculiarities of this ancient document have attracted scholars’ attention, leading its reconsideration as a rare written document from the Land of Israel. Therefore, in-depth research was carried out [
2,
3], which highlighted the rarity of this manuscript and its inherent value as historical document. From 14 October 2021 to 23 January 2022 the “Florence Scroll” was loaned to the Israel Museum of Jerusalem for the exhibition “Painting a Pilgrimage: A 14th-Century Hebrew Scroll Unveiled”.
Although recent investigations [
2,
3] had provided several new clues on this artefact, dating, authorship, and the interpretation of the original function of the Scroll remain unsolved.
According to Sarfati [
2,
3], the Scroll would be devoted to describing, with illustrations and texts, the holy sites visited by Jewish, Muslim, and Christian pilgrims during the Middle Ages. The custom of pilgrimage by Eastern Jews to the Holy Land developed in the thirteenth century [
4], taking place every year in spring. The Hebrew inscriptions that appear alongside the illustrations reflect information already well known from Jewish travelogues and written accounts [
5,
6,
7]. Thus, the scroll was presumably created by a Jewish pilgrim. While it has no colophon, details in the inscriptions indicate that the creator was part of the Jewish community of Fustat (Old Cairo) and a painter by trade [
2,
3].
The paleographic analysis [
2] of the different handwriting and figures that appear along the scroll dates it to the fourteenth century. The scroll includes several texts in Italian, the earliest of which dates to the mid-fourteenth century [
2,
3]. In 1301, the Mamluk rulers in Cairo issued decrees closing Jewish and Christian places of worship. The texts accompanying the first illustration allude to the abolishment of these decrees in 1310, thus suggesting that the scroll could have been created shortly after, in the second decade of the fourteenth century. Based on this dating, it might be the oldest still available document depicting sacred sites from Egypt to Lebanon [
2,
3].
It could be hypothesized that, following the Mamluk decrees, the scroll’s creator left Egypt on a pilgrimage, which was also a journey of immigration to the Holy Land. There he presumably sold the scroll to Italian pilgrims [
2,
3].
On its loan to the Israel Museum, a restoration intervention was undertaken, aimed at allowing for the safe handling and transportation of such a fragile object. A preliminary diagnostic campaign based on non-invasive analytical protocols was carried out. Measurements were aimed at documenting the conservation status of the artefact, along with gaining insights on constitutive materials and manufacturing processes. Preliminary studies of works of art using noninvasive survey techniques are essential to get a view of the work as complete as possible, although the results will never be completely comprehensive. As presented in the literature, there is considerable variability in the techniques that can be used for this type of study [
8,
9,
10] and in this case a multi-analytical approach was adopted, using multiband and hyperspectral imaging techniques and spot spectroscopic analyses. Hyperspectral imaging was performed with a portable hyperspectral camera in the 400–1000 nm range, while advanced imaging documentation of the entire scroll was acquired using multiple photographic techniques such as visible (VIS), raking light, trans-illumination (TI), and luminescence induced by ultraviolet radiation (UVL). Macro Area X-Ray Fluorescence (MA-XRF) was carried out on seven areas, with the addition of XRF spot analysis when needed.
Fiber optic reflectance spectroscopy (FORS) in the 350–2200 nm and external reflectance Fourier transform infrared spectroscopy (ER FT-IR), µRaman spectroscopy, were applied as spot techniques.
2. The Hebrew Scroll
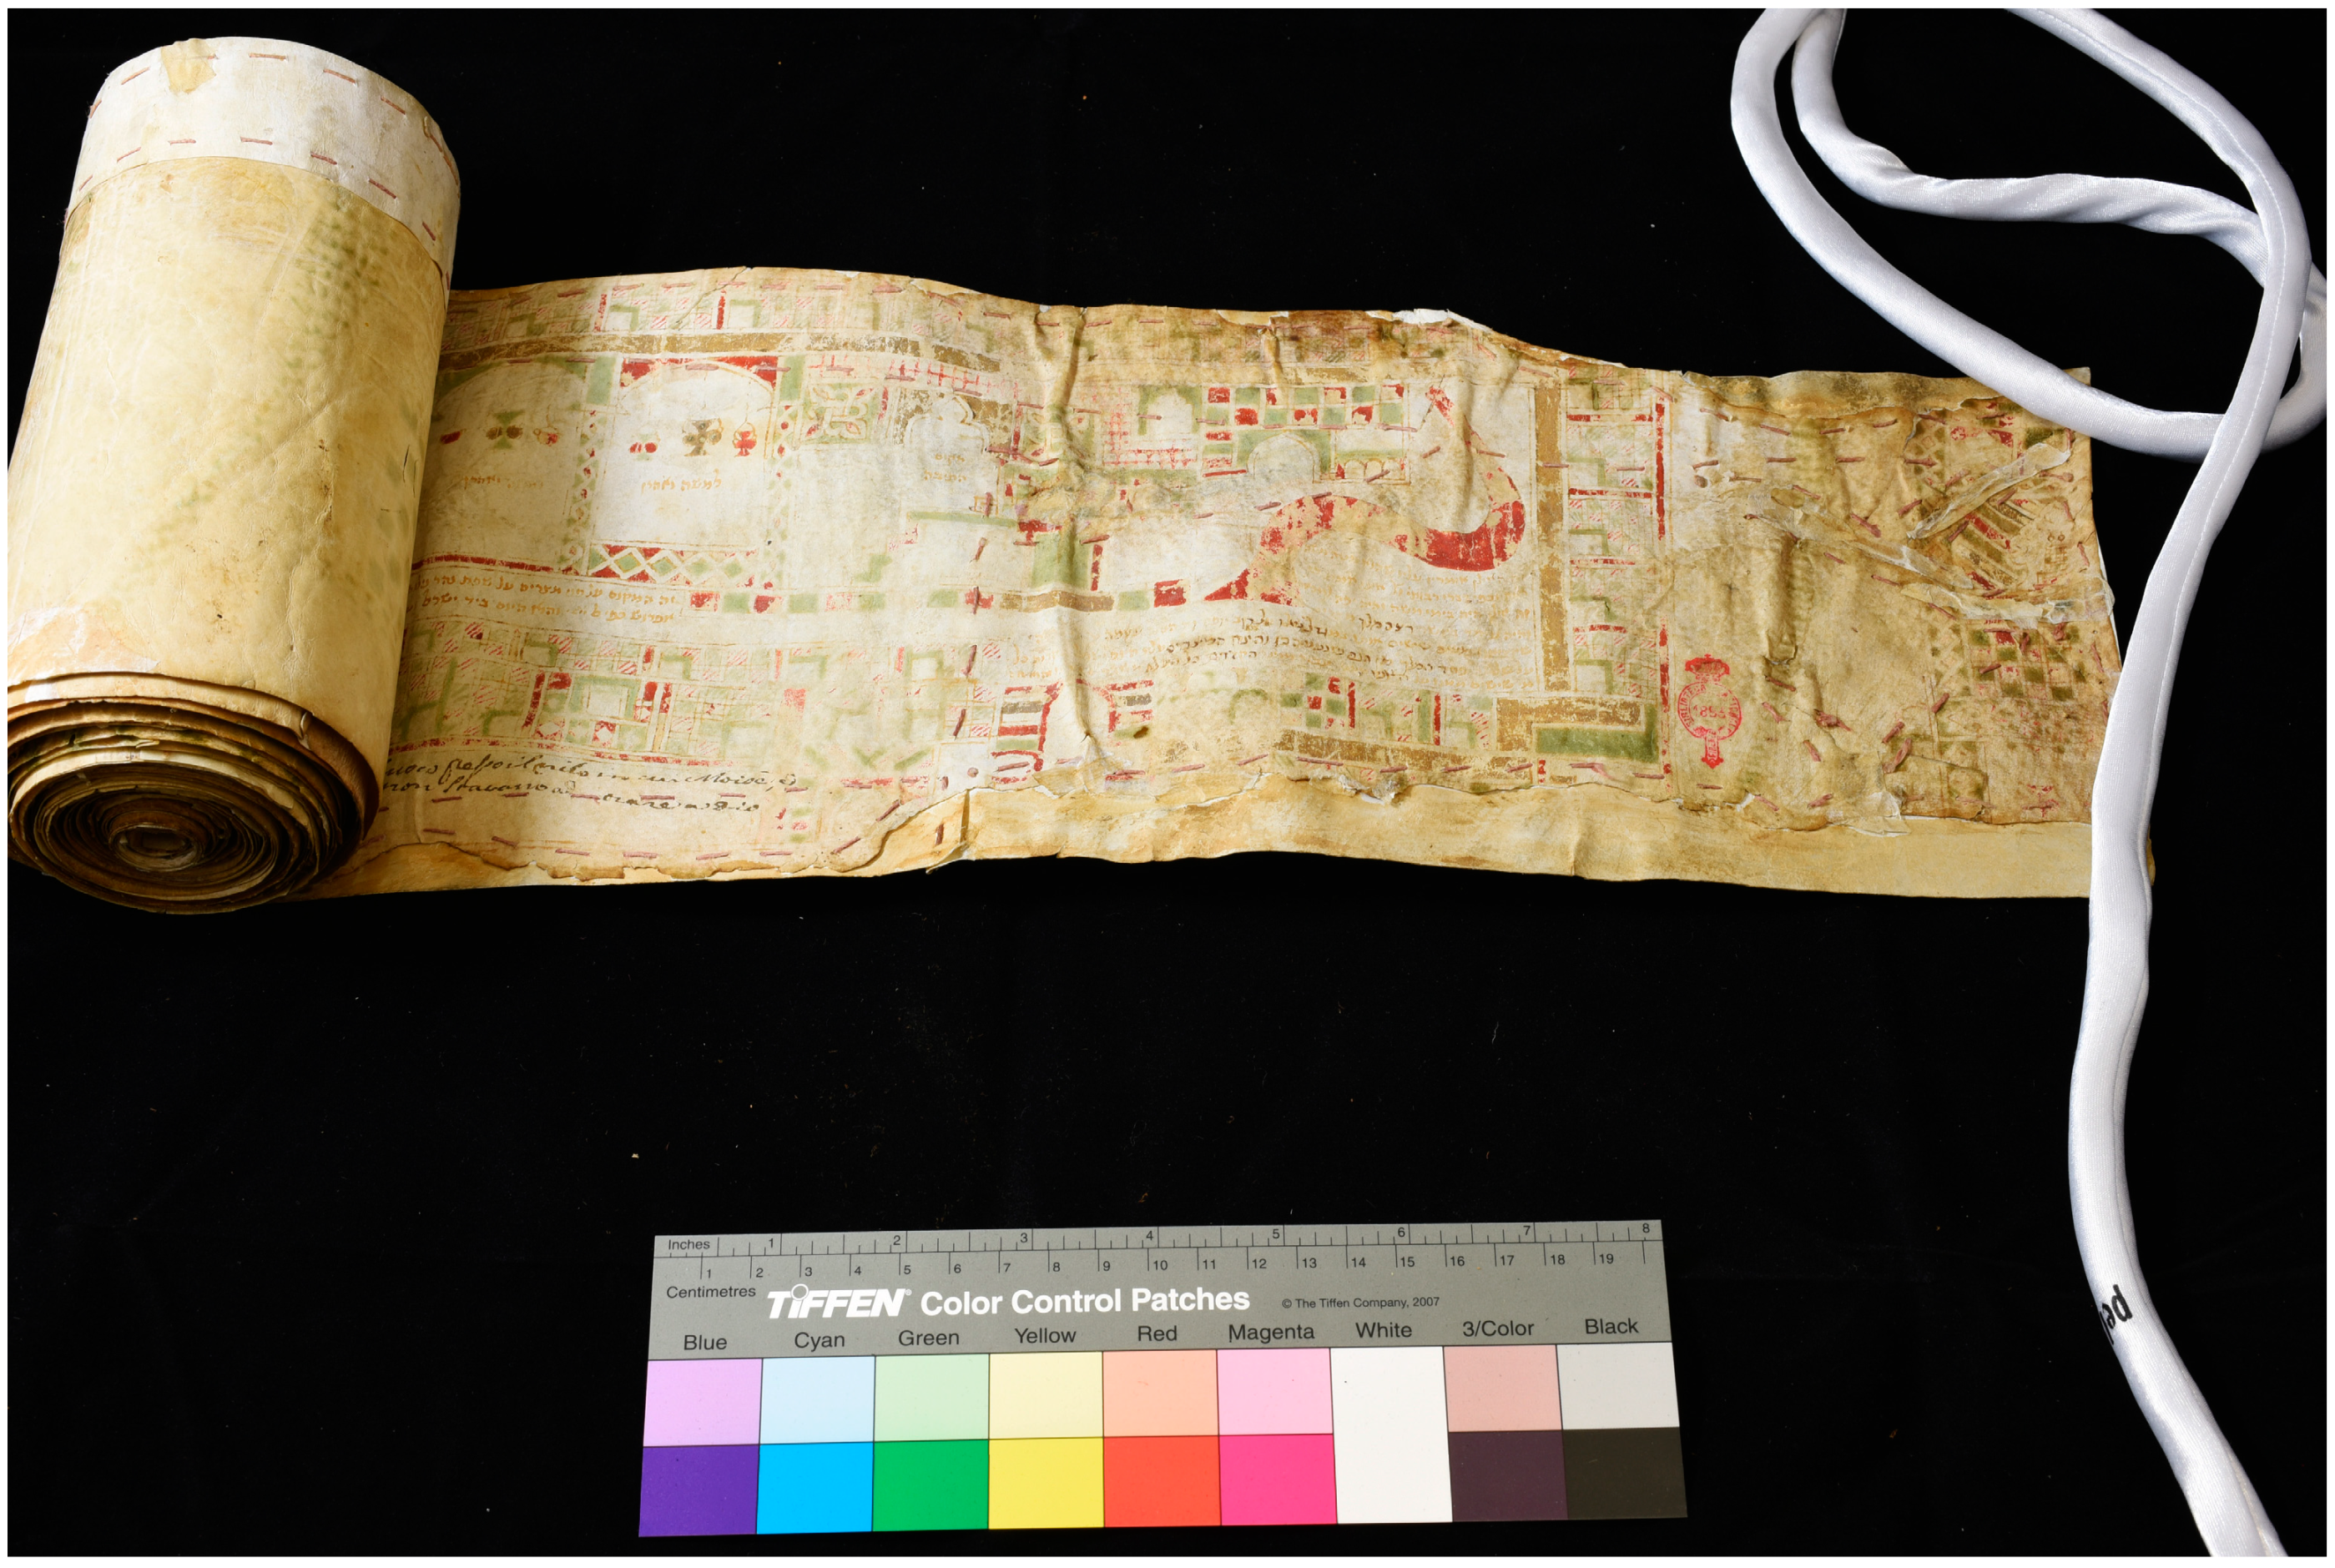
The Hebrew Scroll (
Figure 1) is a pictorial decorated roll of parchment, including 27 sections sewn together (except one which is attached with glue, due to a previous restoration). It is a strip almost 11 m long (10,886 mm, this value was obtained by measuring the individual sewn parchment sections and adding the lengths) and has a height ranging from 172 mm to 192 mm. It seems that the initial part of the Scroll has been lost and thus the exact original length is not known. Furthermore, the upper margin of the initial part has been cut and it can be assumed that its original height was about 200 mm [
2]. The various sections also slightly differ in size and thickness and, in some cases, tend to be semi-transparent.
The painted decorations cover the entire height of the page and are extended along the whole length of the roll; they appear stylistically homogeneous, featuring three colors: green, red, and yellowish gold. Texts among the figures are written in Hebrew or Italian, with occasional Arabic words written in Hebrew. Retouches and past interventions are present through the entire manuscript, in texts and figures.
The texts were written with Inks of different colors (brown, black and red). Visually, it is possible to distinguish two kinds of brown ink. The most widespread one has a lighter color and is found in the parts written in Hebrew and in the outlines of the figures. Another brown ink, but with a darker color, was used for the writings in Italian, to go over some faded lines, and to write notes beneath pictorial backgrounds in the final part of the scroll. In the same area, there are small words written in red. These notes were probably used to help the artist during the manufacture. Finally, there are also black writings in Italian, Hebrew, and Arabic words written in Hebrew. The back (verso) of the scroll is not decorated. The verso also features some handwritten notes made in pencil and ink, a purple stamp, and two paper tags. According to the restorers’ observation, the recto of the scroll is always made using the flesh side of the parchment.
The painted figures are elaborately painted with rich decorative motifs, sequentially from right to left, and without internal divisions. Each image is accompanied by a Hebrew name identifying the site; only a few drawings have one or two written lines and sometimes a short text is found. The images and the handwritten parts show elements that describe various existing traditions or that reflect historical realities [
2].
The realistic details incorporated within the stylized depictions would indicate that the manuscript could be a souvenir object, or a diary created after a journey from Egypt to the Land of Israel, whose path shows similarities with the routes followed by Jewish pilgrims at the time. However, it could be hypothesized that the depicted itinerary might also recount a fictive journey and illustrate places that the painter never actually reached [
2,
3].
As reported in the literature, there are only two other 14th century manuscripts showing affinity with Ms. Magl. III 43. One of these is a small sheet known as the “List of Yitgaddal” [
11], which would have been produced in Egypt. The second one is formed by two strips of parchment that were originally part of a single scroll and has been called the “Princeton Scroll” [
3,
11]. This manuscript has not yet been fully studied, but it seems that it was also created in Egypt or in the Land of Israel, as with both the Hebrew Scroll and the “List of Yitgaddal” [
2,
3]. These two fourteenth-century manuscripts were apparently created by the owners as objects of their pilgrimage [
2,
3].
There is, additionally, a known corpus of scrolls depicting the holy sites dating to the 16th century. Despite several similarities among all of these manuscripts, a difference is immediately evident: the Florence Scroll is almost 11 m long and represents about 130 places, while the others present a maximum of 80 sites with a length not exceeding 2 m [
2,
3]. It can therefore be said that, to the best of our knowledge, the Florence Scroll represents a uniqueness of its kind.
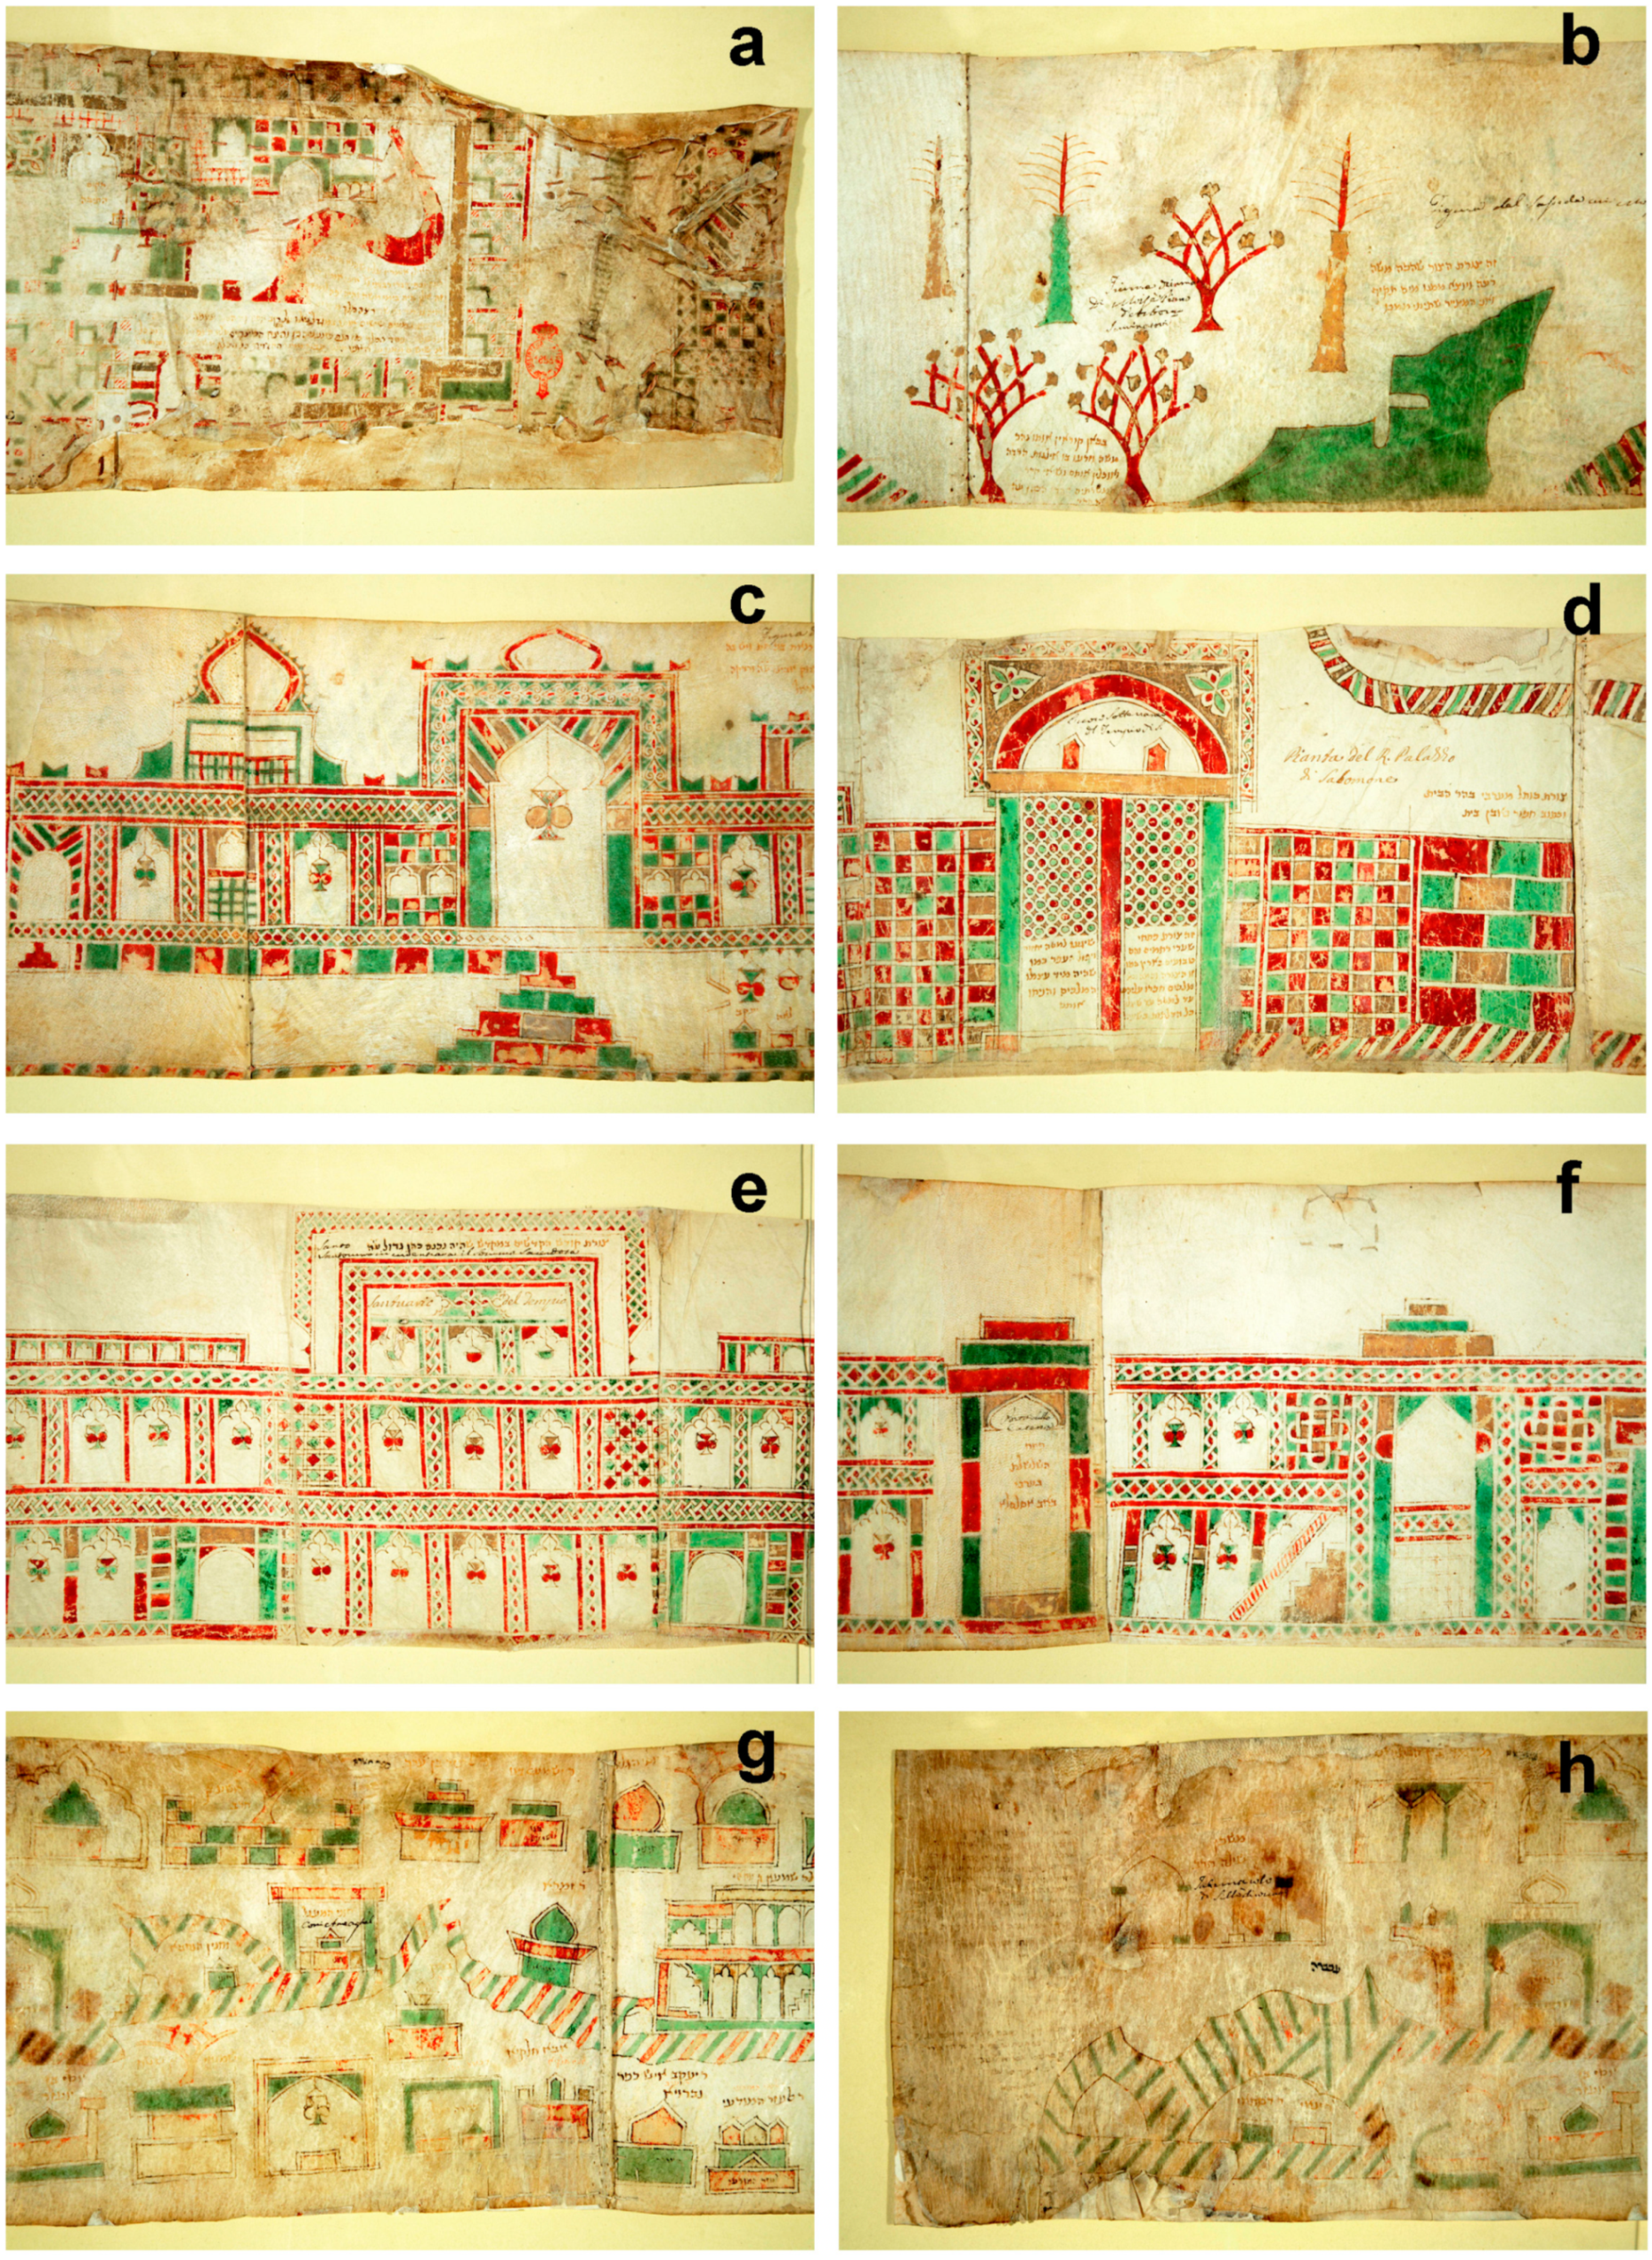
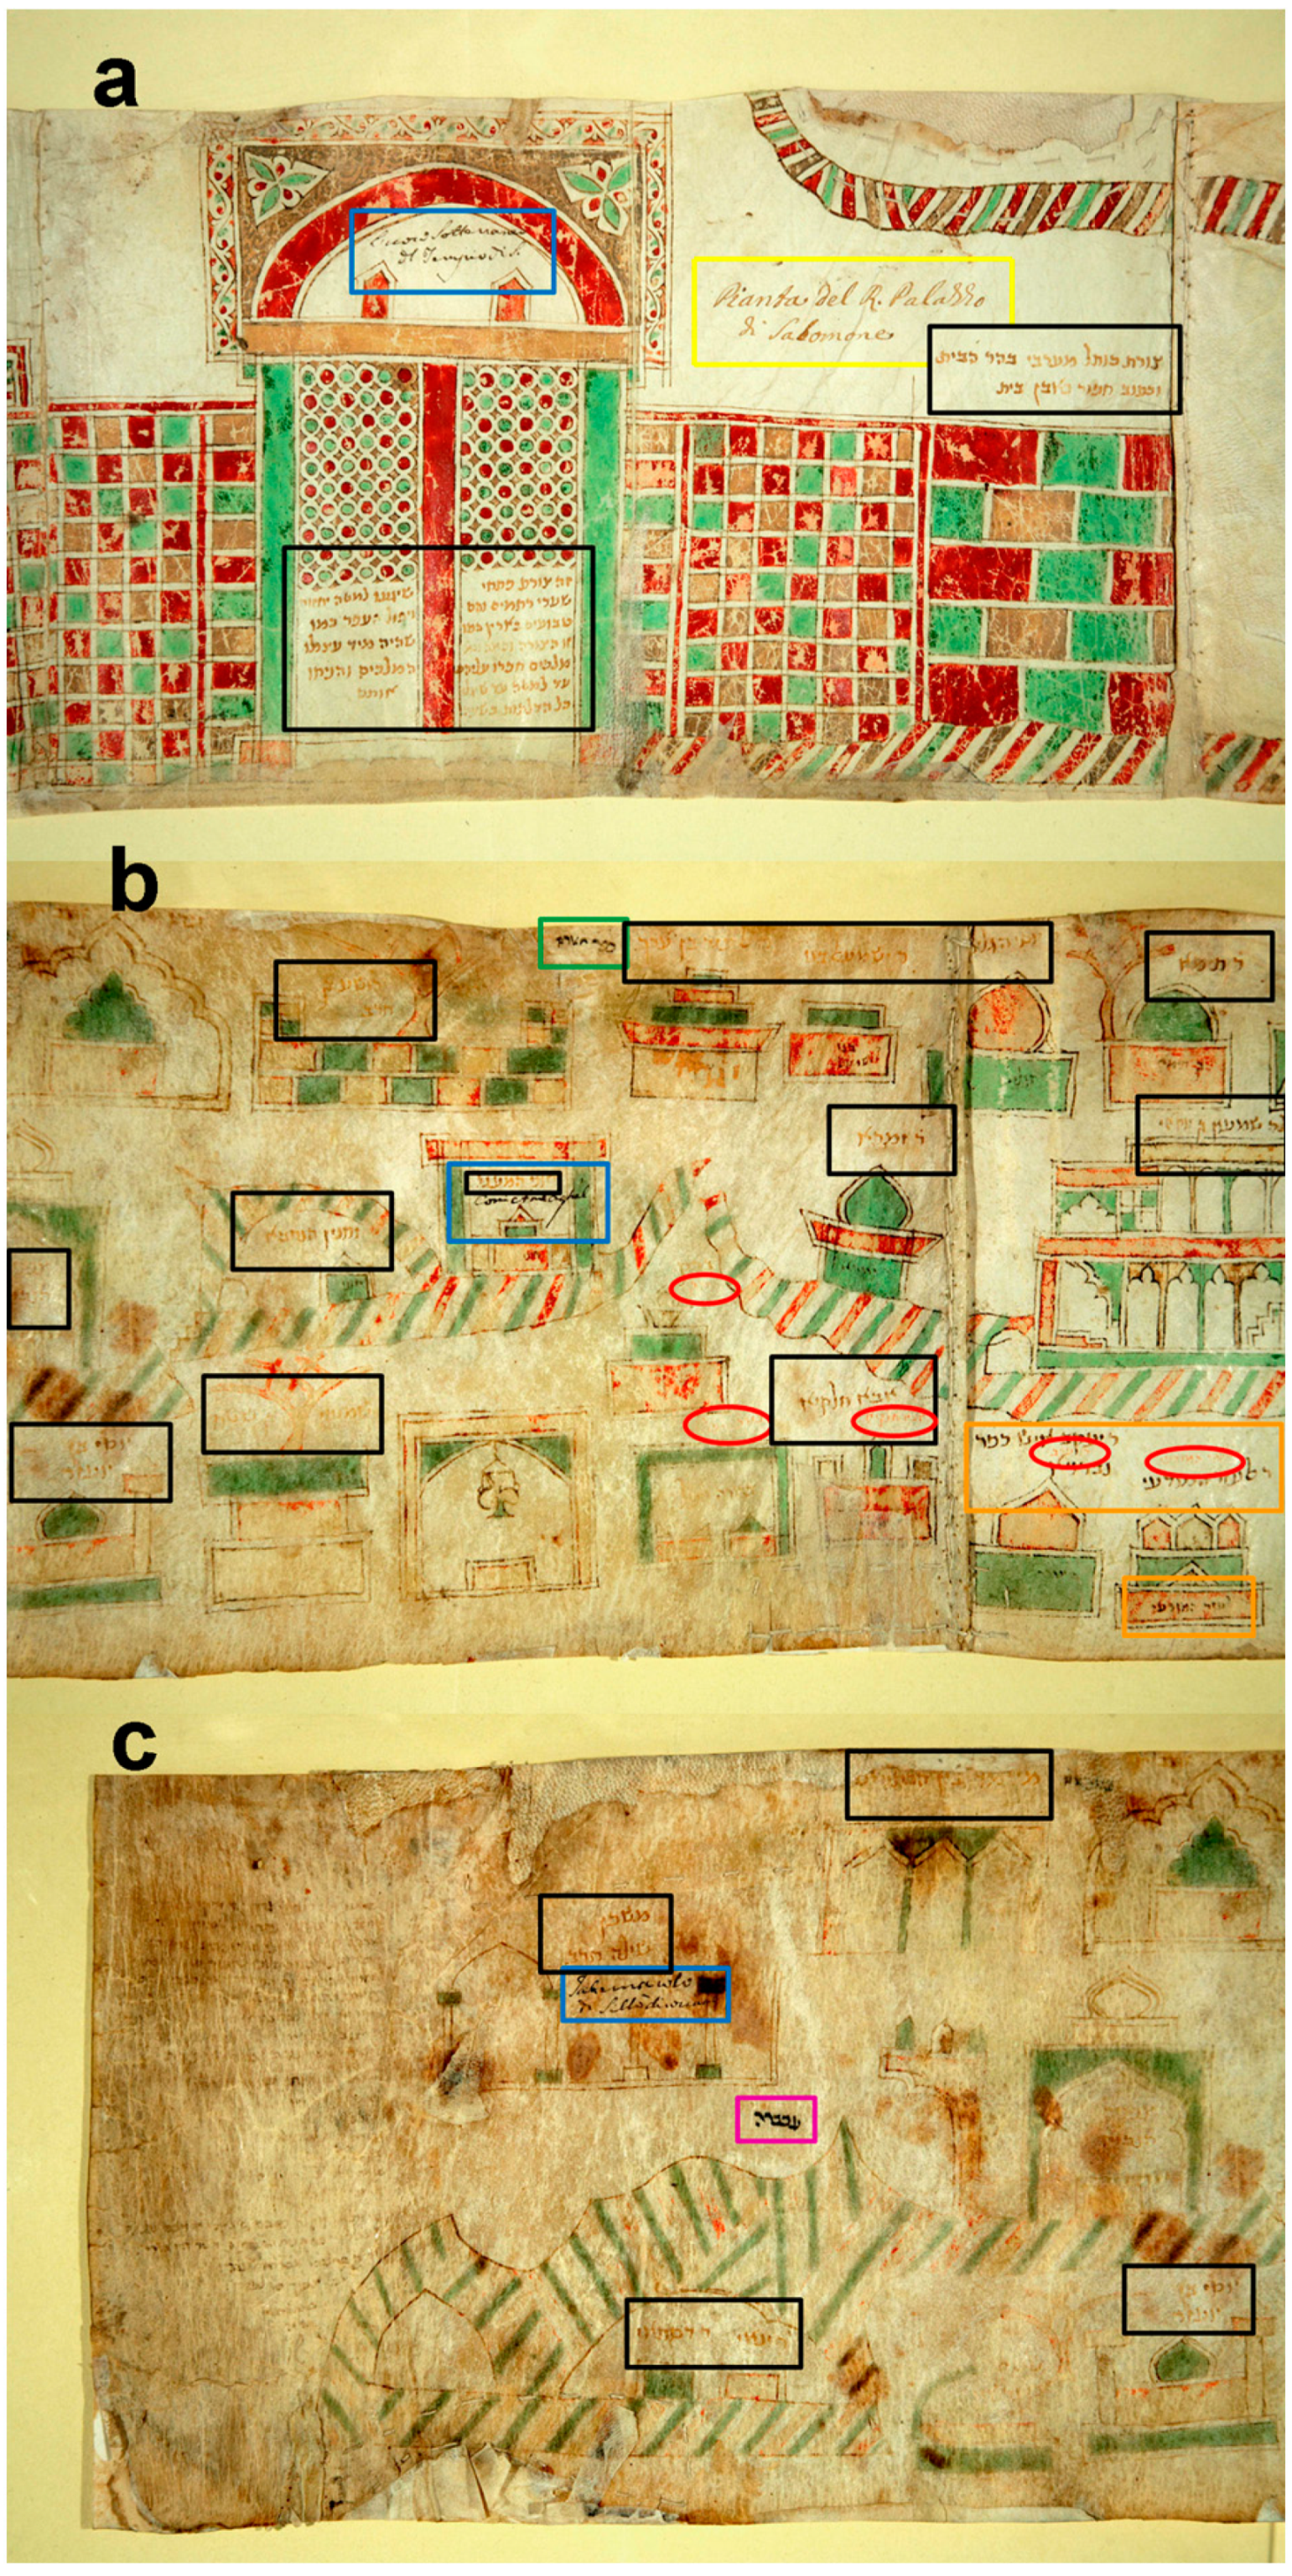
2.1. The Description of the Areas of Interest
Some areas of the Scroll were selected, from a point of view of both the style and materials used for the written and painted parts, as those of greatest interest for in-depth analysis. These selected areas are shown in
Figure 2.
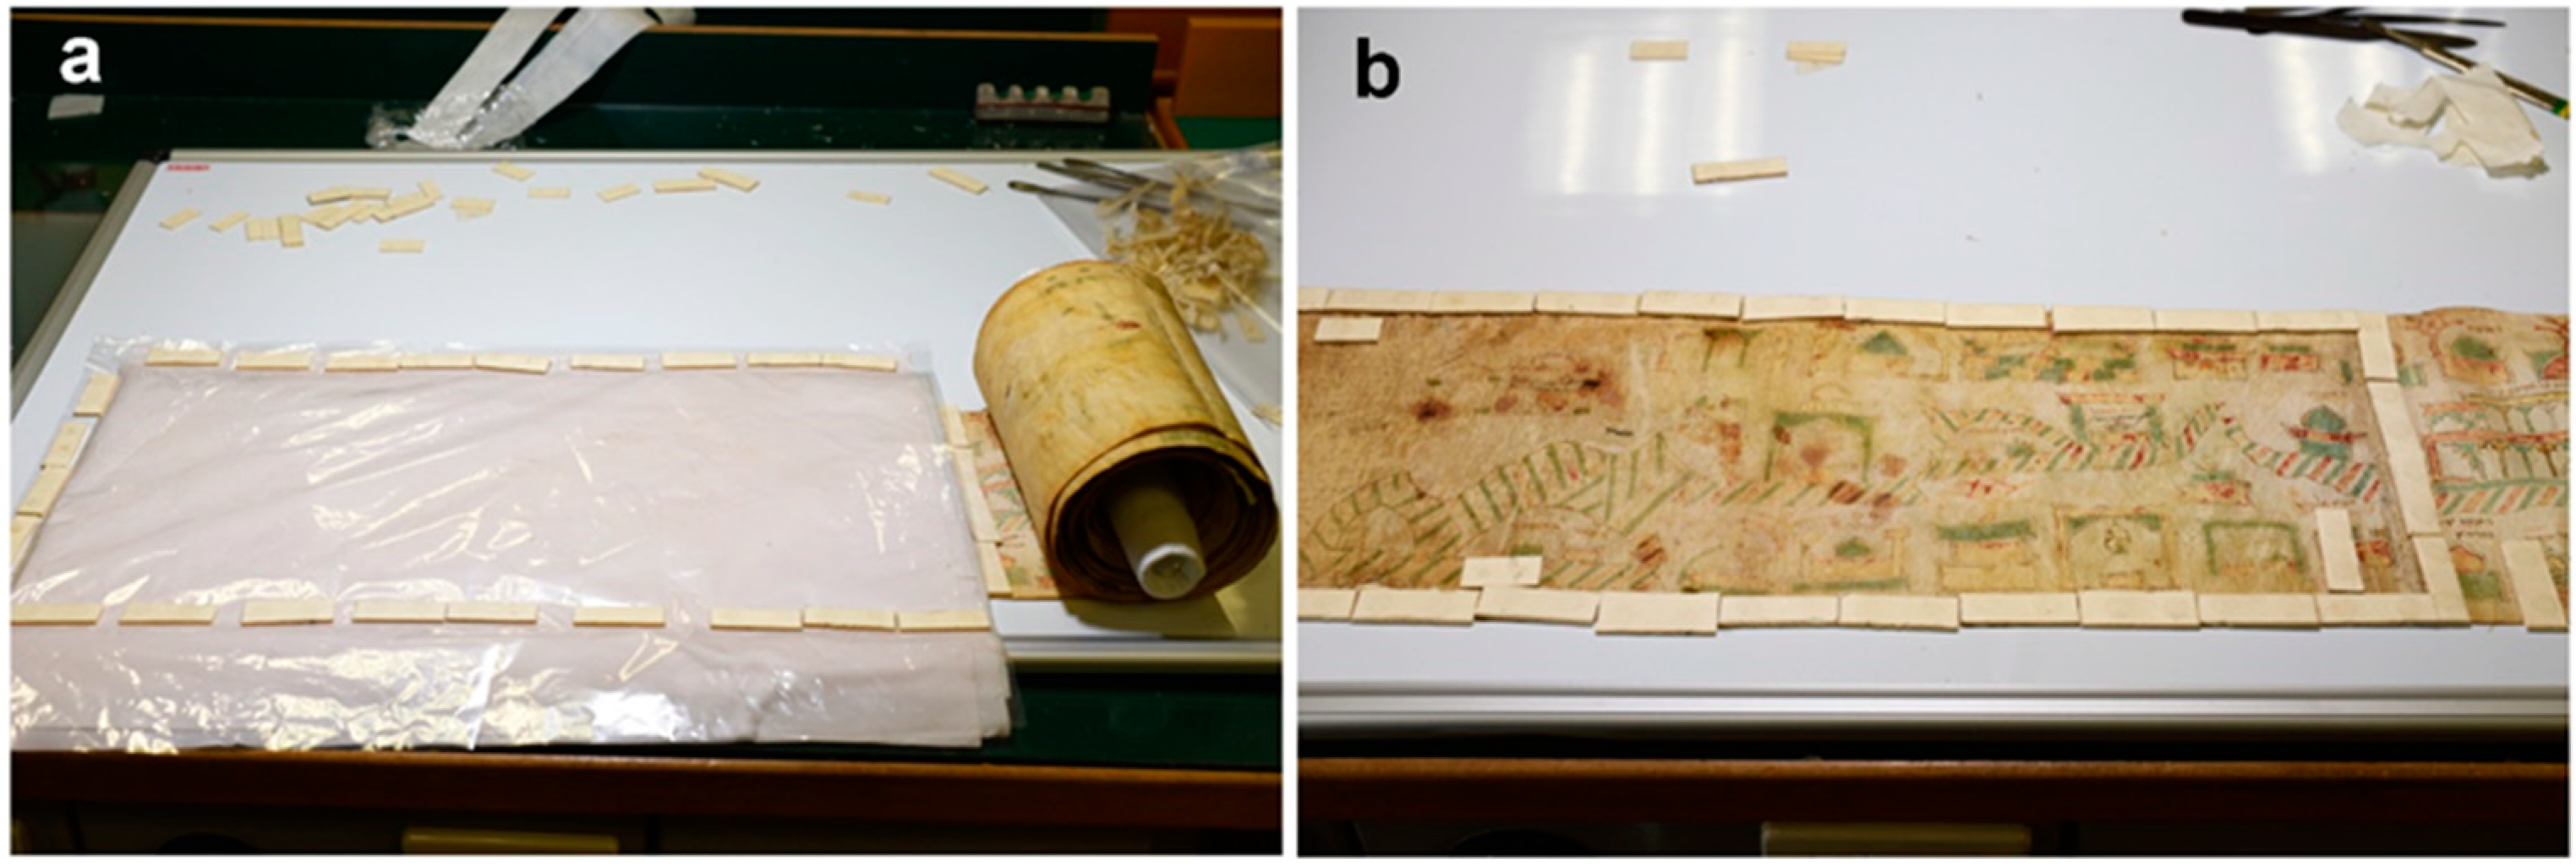
2.2. The State of the Conservation of the Hebrew Scroll
Until the recent restoration of 2019, the Scroll had been kept within a tube of small dimensions, and thus it was rolled in a very narrow manner with its final part having a very small diameter. This caused the impossibility of keeping the inner part of the Scroll open. The manuscript had many distortions and folds, especially in the initial and final sections, which showed the greatest damage and several past restoration interventions. In addition, the head and foot margins of the Scroll appear overall as highly degraded. Along the margins there were frequent tears of limited size and parchment restorations made to adhere from the recto or the verso, mostly almost transparent. There were also many restorations and patches sewn in a topstitch with reddish thread in the initial part, then, with a white thread. There was evidence that the manuscript has previously been completely or partially disassembled. Indeed, all of the joints between the parchment sheets have the holes of a previous seam.
In some sections, holes are found which were probably caused by contact with metals or by the acidity of the green pigment.
Brown stains are widespread, especially along the edges, some made in wax and some in ink. Also on the back, there are many brown stains and insect droppings.
As for the state of the conservation of the pigments, the green still appears intense, even if a careful visual analysis highlighted that it penetrated a lot in the parchment and in some areas was largely lost. The red and “gold” backgrounds show important color losses in the form of flakes, partly due to abrasions. In some cases, the yellowish gold areas present a color change to a brown-grey tone.
The inks are sometimes faded, and the writings are no longer legible. The final part of the Scroll, where there is a handwritten part, is very degraded and abraded.
3. Methods
3.1. Visible and UV Imaging Documentation
Since the parchment was not flat but wrinkled, it was decided to use a metal support on which to place the Scroll by securing it with magnets coated with non-acidic cardboard. These magnets were placed along the edges of the parchment during its documentation and analysis.
Images in visible were taken primarily for documenting the entire artefact and its details. A Nikon (Minato-ku, Tokyo, Japan) D750 camera with 24.3 Mpixel CMOS sensor and Nikon Sigma lens EX DG 50/2.8 macro together with an LED ART LUX 50LW (56 LEDs at 5000 K for VIS and 6 UV LEDs) produced by CTS (Altavilla Vicentina, Vicenza, Italy) was used for the study of the state of the conservation of the Scroll. For transillumination imaging a Huion (Shenzhen, China) L4S LED Light Pad was used.
Spatially coincident high-resolution frames of the Scroll in both reflected VIS and UVL were acquired using a Nikon D600 camera, equipped with a Nikon FX 24.3 Megapixel silicon CMOS sensor and a Nikon FX AF-D 50 mm lens. The acquisition of the whole artwork was accomplished by sequentially recording areas of about A4 size with slight overlapping for the mosaicking process. The recorded data were saved in RAW and JPG format for both VIS and UVL images. To check the color balance of the reflectance VIS images a Tiffen Color Separation Guide with Grey Scale chart was included in the frames. The camera was mounted on a special support so that it was as stable and firm as possible, at 60 cm vertically from the Scroll. Two Panasonic (Kadoma, Ōsaka, Japan) LED lamps LDAHV11LH3 10.5 W were used for the visible images. Two UV illuminators specially assembled by IFAC-CNR were utilized for the acquisition of the UVL images. Each UV lamp body is composed of three Philips (Amsterdam, the Netherlands) PL-S Black Light Blue low-power mercury vapor lamps with maximum emission at 365 nm (Wood lamps). Each lamp window is made with a wide Schott DUG 11 filter (no longer in production), which has the purpose of cutting off even the slightest residue of radiation from the lamps with a wavelength greater than 400 nm. Furthermore, the small amount of radiation emitted by Wood lamps in the near infrared range (NIR, i.e., the range between 700 and 1000 nm) is also suppressed, thus avoiding any interference with any possible UVL signal in that range. A glass-plastic laminated filter Schott (Mainz, Germany) KV418 (no longer in production) was used as a cutting filter in front of the camera lens to block the UV component reflected by the Scroll and acquire only the luminescence signal. For both VIS and UVL configurations, the light sources were positioned symmetrically to the camera at 45° angles.
The final output was made accessible through a built-on-purpose viewer platform, available online on the website
https://xp9.ifac.cnr.it/webshare/rotolo/viewer.html (accessed 21 December 2023). The viewer enables the simultaneous visualization of the same area in VIS and UVL.
3.2. Hyperspectral Imaging
A portable pushbroom hyperspectral camera, Specim IQ, from SPECIM Spectral Imaging Ltd. (Oulu, Finland) was used. It is compact (207 mm × 91 mm × 74 mm), light (1.3 kg), and suitable for making fast measurements, with a time for recording data from about 0.6 s to 300 s, depending on the lighting conditions. It operates in the 400–1000 nm spectral range, recording 204 spectral bands. The spectral resolution is 7 nm. It uses a silicon CMOS sensor, with 512 × 512 pixels. To acquire the data, the camera was mounted on a support, positioned at about 50 cm from the surface of the Scroll. The illumination of the target was generated using two Shott halogen lamps with double beam optical fibers, mounted symmetrically at 45° with respect to the normal plane of the Scroll. The white reference calibration was performed at the beginning and at the end of every measurement’s session, using a Spectralon® (Labsphere, North Sutton, NH, USA) certified white target supplied with the camera. The data were processed using the Specim IQ Studio PC software (version: 2019.05.29.2) and through the application of the Spectral Angle Mapper (SAM) algorithm.
3.3. Fiber Optic Reflectance Spectroscopy (FORS)
The FORS device consisted of two spectroanalyzers and a source housed in a compact chassis. The 190–1015 nm (UV-NIR) range was covered with a Zeiss (Oberkochen, Germany) MCS 601UV-NIR spectrum analyzer equipped with a diffraction grating and a linear detector of 1024 silicon photodiodes with a sampling step of 0.8 nm/pixel. The second one, Zeiss MCS611 NIR 2.2 WR, operated in the 910–2200 nm (NIR) range with a diffraction grating and a linear detector of 256 photodiodes of InGaAs (indium and gallium arsenide) with a sampling step of about 6 nm/pixel. The two analyzers work in cascade. A Zeiss CLH600 model equipped with a 10 W halogen lamp with a color temperature of about 3000 K and an emission spectrum in the 320–2500 nm range was used as a light source. Spectra were acquired in the 350–2200 nm range using two different configurations: a probe head with 8°/8° geometry and 2 mm diameter measurement spots and a single fiber that can be placed at different angles for backscattered reflectance measurements covering a 1 mm diameter measurement spots. The former configuration was used for uniform areas such as vellum and painted backgrounds, and the latter for small details and text.
A total of 120 FORS spectra were acquired. The data were processed with Zeiss Aspect Plus
® software (Version 1.80). The FORS IFAC-CNR spectral database was used for material identification (
https://spectradb.ifac.cnr.it/fors/ (accessed 21 December 2023)).
3.4. External Reflectance Fourier Transform Infrared Spectroscopy (ER FT-IR)
A portable spectrometer model FT-IR ALPHA of Bruker Optics Inc. (Billerica, MA, USA) supplied with the external reflectance (ER) accessory was used. The spectrometer is equipped with a SiC globar type source (silicon carbide with emission comparable to that of a black body with a temperature of about 1000 K) and a DTGS pyroelectric detector (deuterated triglycine sulfate). For each spectrum, 256 scans were acquired with a resolution of 4 cm−1 in the spectral range of 7500–375 cm−1. Twelve spectra were acquired on selected areas. Data were processed using OPUS 7.0.122 and EZ OMNIC 7.3 software.
3.5. µRaman Spectroscopy
A BWTEK micro-Raman spectrometer equipped with a 785 nm laser and operating in the 3200–80 cm−1 spectral range was used to investigate microscopic portions of the artefact with a spatial resolution of about 5 μm. The spectra were acquired with a spectral resolution of 3 cm−1, using a Raman signal strength in the 3.5–10 mW range, with a total measurement time of four frames of 60 s each for each point analysed. The reference signal (dark) was subtracted from the data by means of an off-laser detection. The head was connected to the laser and the spectrometer by means of two optical fibres and was equipped with a 5 mm NIR lens and a 40× microscope objective to focus the laser radiation on the sample, resulting in a spot with a diameter of approximately 2 μm on the investigated area at the maximum magnification. The head is internally equipped with a notch filter to allow the collinearity of the output laser and the Raman spectrum input from the measurement optics. Thirty-one micro-Raman spectra were acquired on the Scroll.
3.6. MA-XRF
MA-XRF analyses were carried out using the MA-XRF scanner developed in the framework of the Cultural Heritage Network of the Italian National Institute of Nuclear Physics (INFN-CHNet). The instrument is specifically designed for cultural heritage applications, and is thought to be a lightweight piece of equipment useful for in situ measurements.
The instrument is composed of a measuring head mounted on three linear stages by Physik Instrumente© (Karlsruhe, Germany, 300 mm travel range in the x and y directions and 50 mm along the z perpendicular direction). The measuring head is composed of an X-Ray tube by Moxtek© (Orem, UT, USA, 40 kV maximum voltage, 0.1 mA maximum anode current, with Mo anode) and a Silicon Drift Detector by Amptek© (Bedford, MA, USA, XR100 SDD, 75 mm2 effective active surface, 500 μm thickness). This hardware is placed on top of a carbon fiber box which contains power supplies, signal digitizer (CAEN DT5780), and other auxiliary elements. In addition, the scanner is equipped with a Keyence IA-100 telemeter (Keyence, Osaka, Japan) to adjust the sample-measuring head distance (~6 mm) during the scan. Motion, acquisition, and data analysis are remotely controlled via a PC, with a software developed by CHNet and based on the open-source Qt platform. The elemental maps are given in color scale, with the maximum counts associated with red color. It is worth noting that the color scale of different maps is associated with different X-ray counts and thus the elemental maps are not directly comparable.
Measurements were performed on the sample using the following experimental conditions: 38 kV anode voltage, 100 μA filament current, 1 or 5 mm/s scanning speed, 500 or 1000 μm pixel size, and collimator diameter 800 μm. No helium was flown during these measurements. Seven areas of the Scroll were investigated by acquiring nine XRF spectra.
4. Results and Discussion
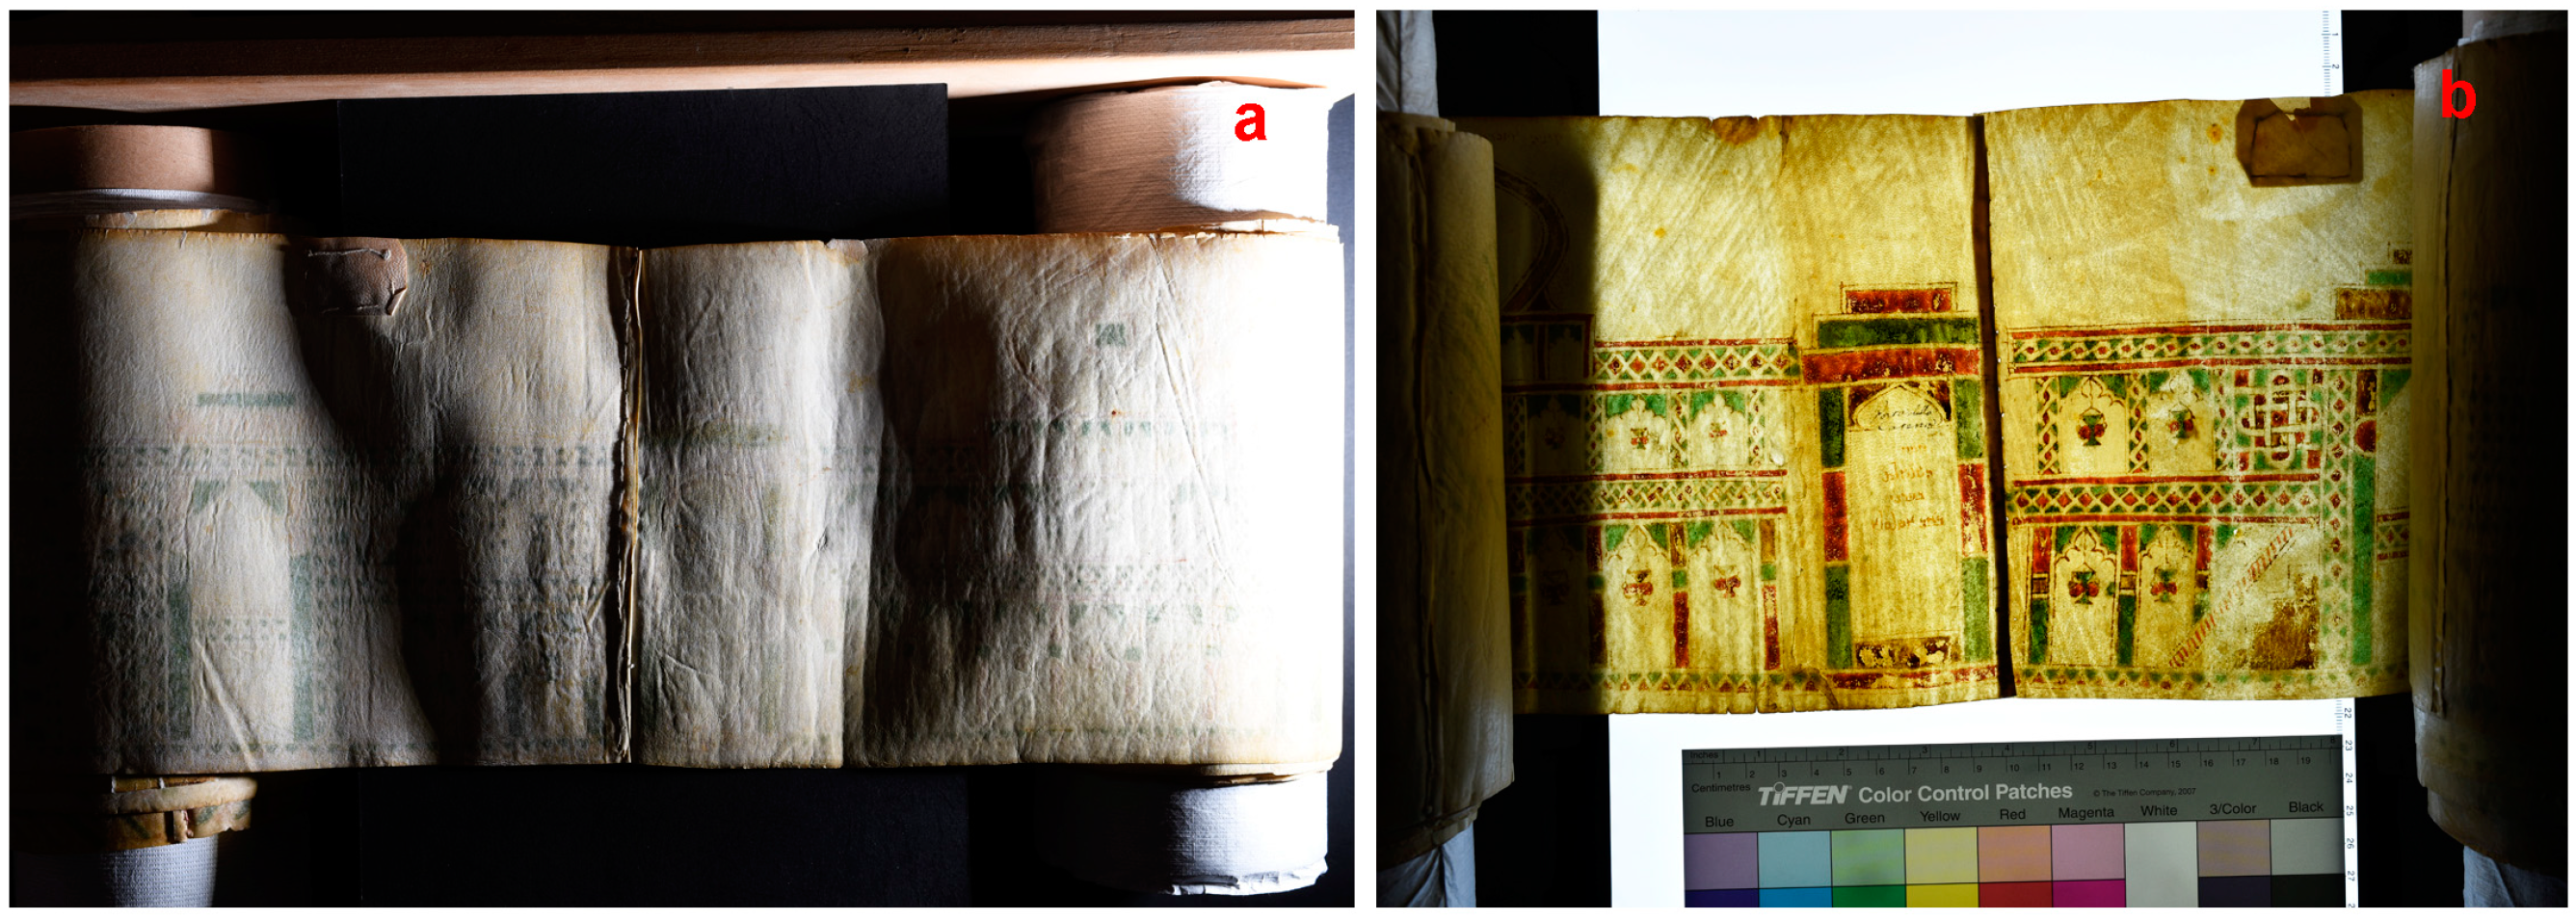
The raking light imaging technique made it possible to detect the deformations of the parchment, which is the main critical issue in the conservation status of the Scroll, the presence of previous restoration interventions, and marks etched by a knife used during the manufacture of the parchment. Trans-illumination images revealed various situations of unevenness in the parchment related to its different thicknesses and production (
Figure 3).
Spot analyses, carried out both on the double layer parchment and on the thin parchment, revealed its preparation. FT-IR and Raman analyses showed a diffuse presence of calcite (CaCO
3). Indeed, this was indicated by the absorption bands at 2520, 1790, 1460, 875, and 715 cm
−1 in FT-IR and at 1085 cm
−1 in Raman [
12,
13,
14,
15,
16,
17,
18,
19]. However, the high intensity of the calcite bands in FT-IR prevented the detection of the absorptions due to the protein part of the parchment, so only the band at 1655 cm
−1, due to the C=O stretching (amide I), was noticeable [
20]. The XRF data showed only the presence of Ca, Fe, and K, with traces of Ti, Mn, Sr, Cu, and As, the last two being possibly due to the contact with other parts of the parchment painted in green and yellow, respectively. This type of preparation is typical of Western-made parchment [
21]. Tannins, which give the parchment a light brown color, were not observed in the present case [
22], using FT-IR and micro-Raman techniques.
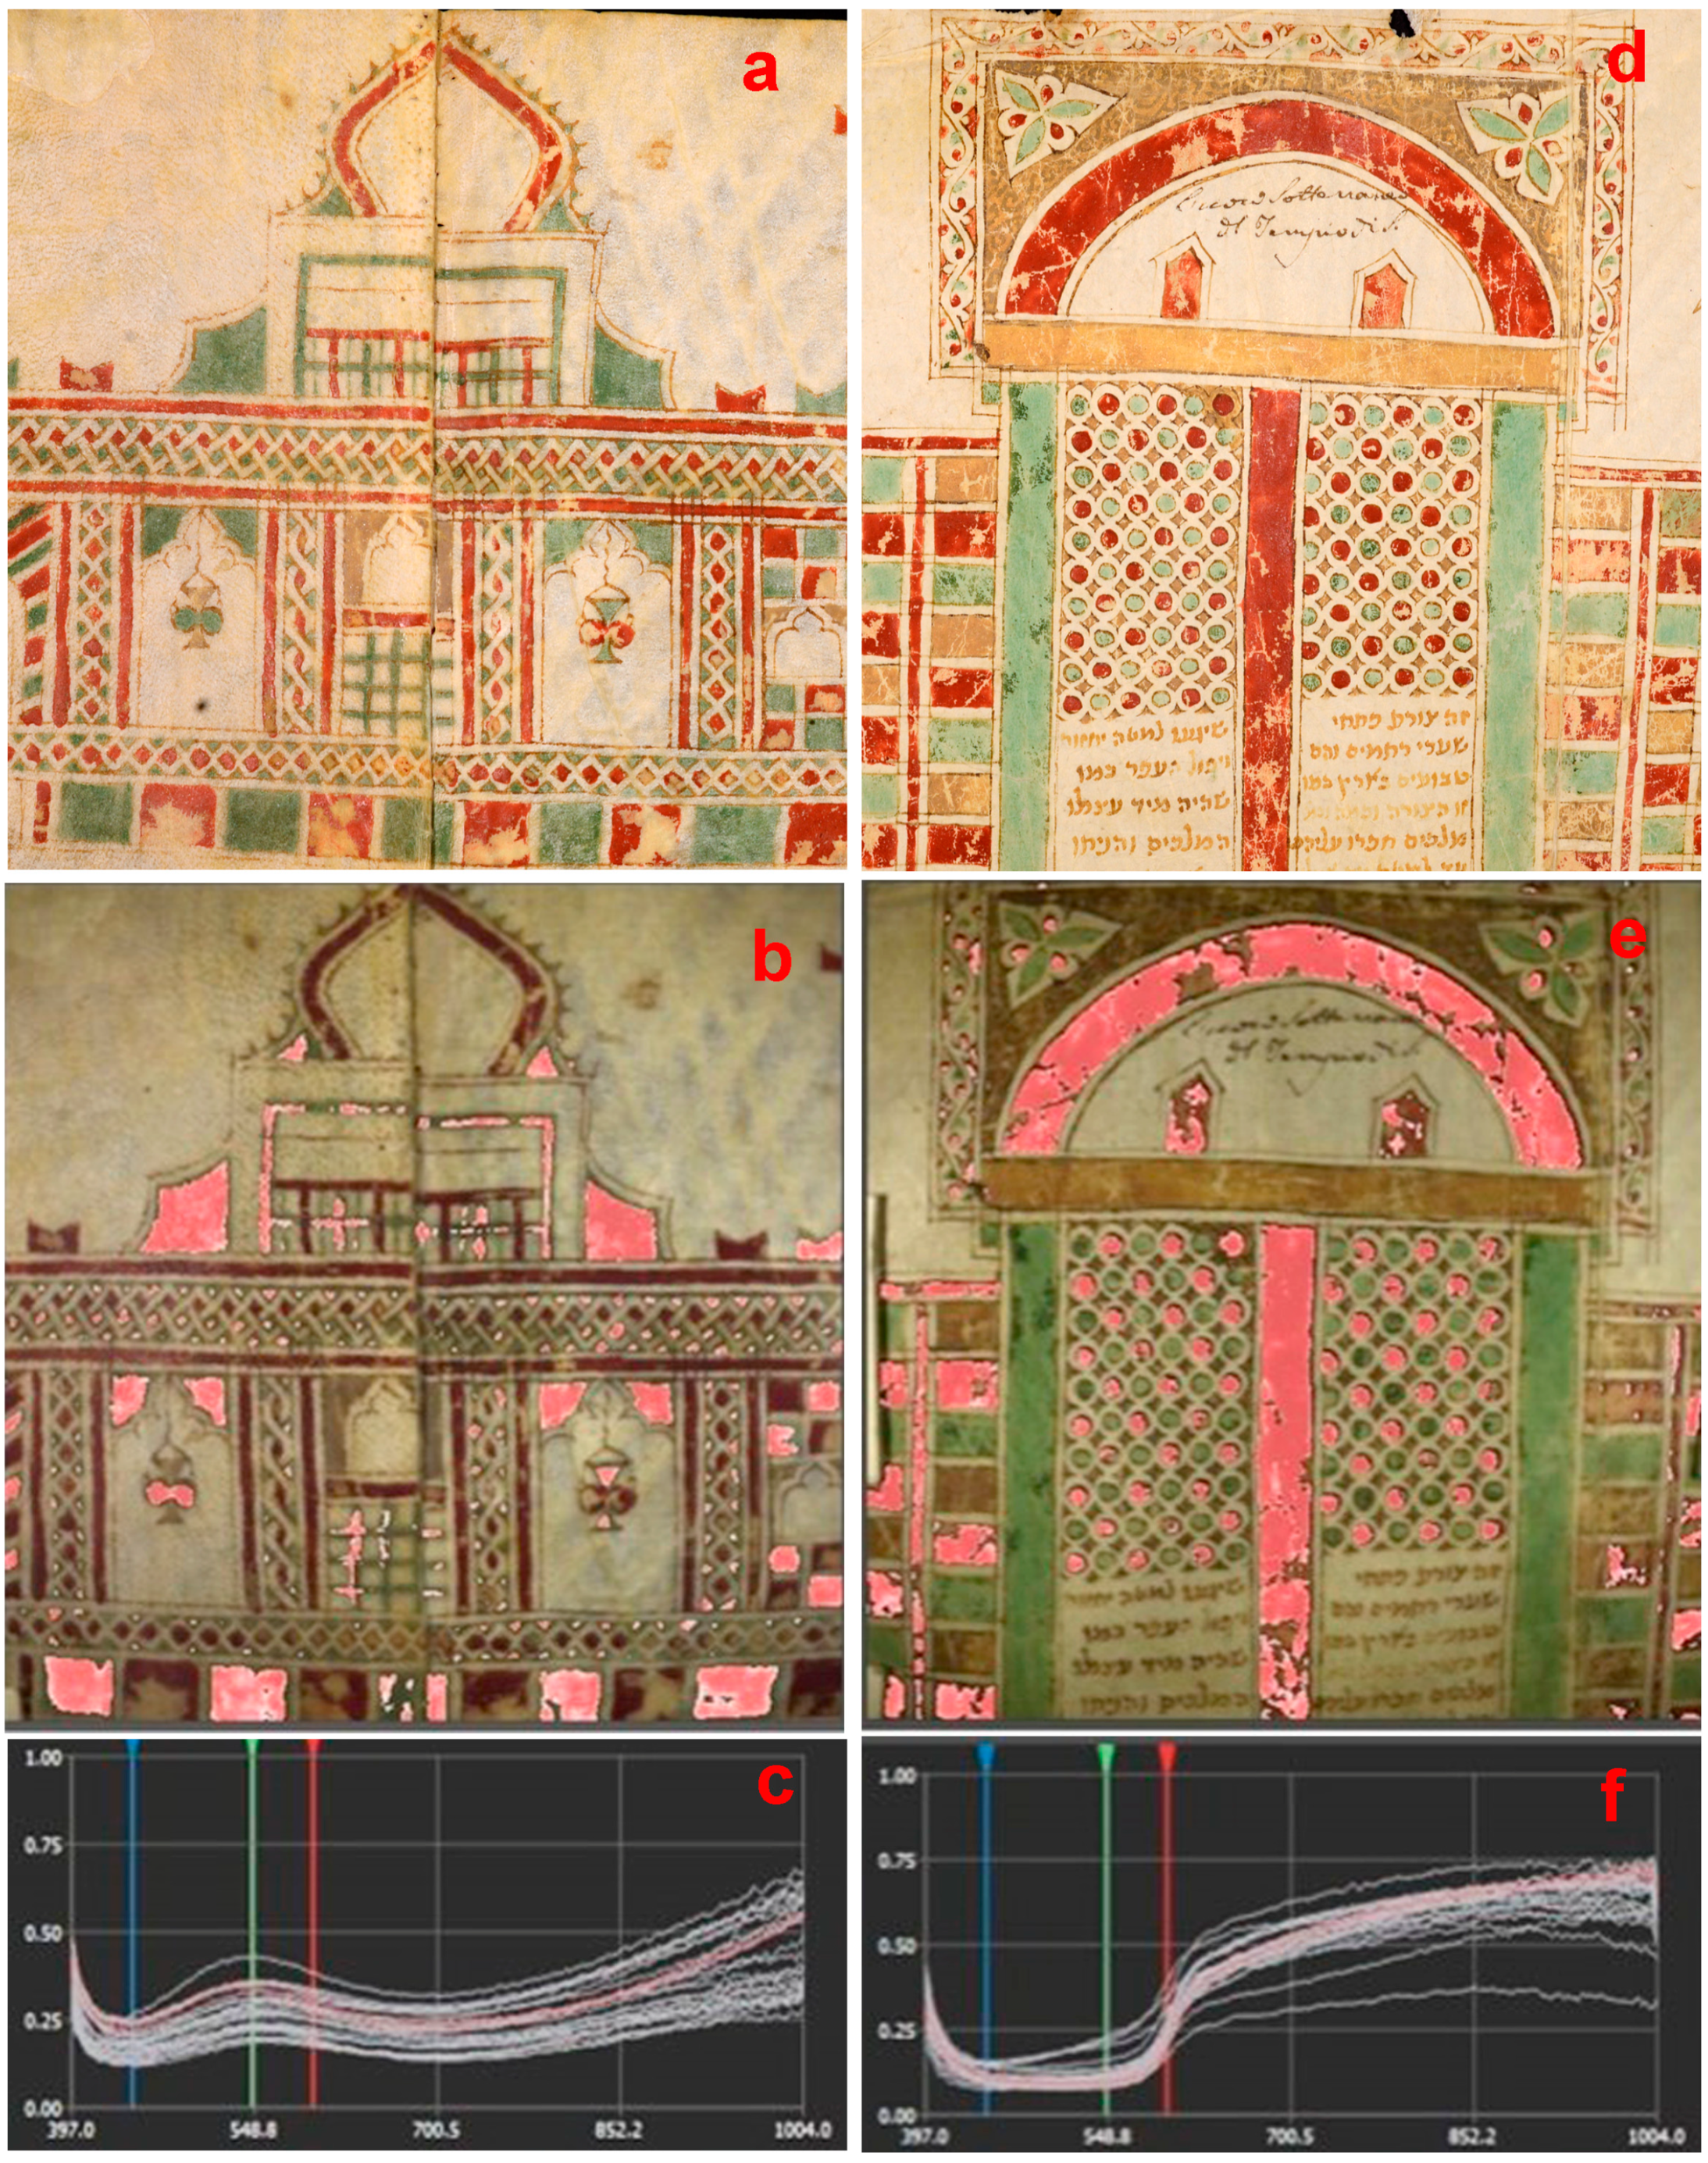
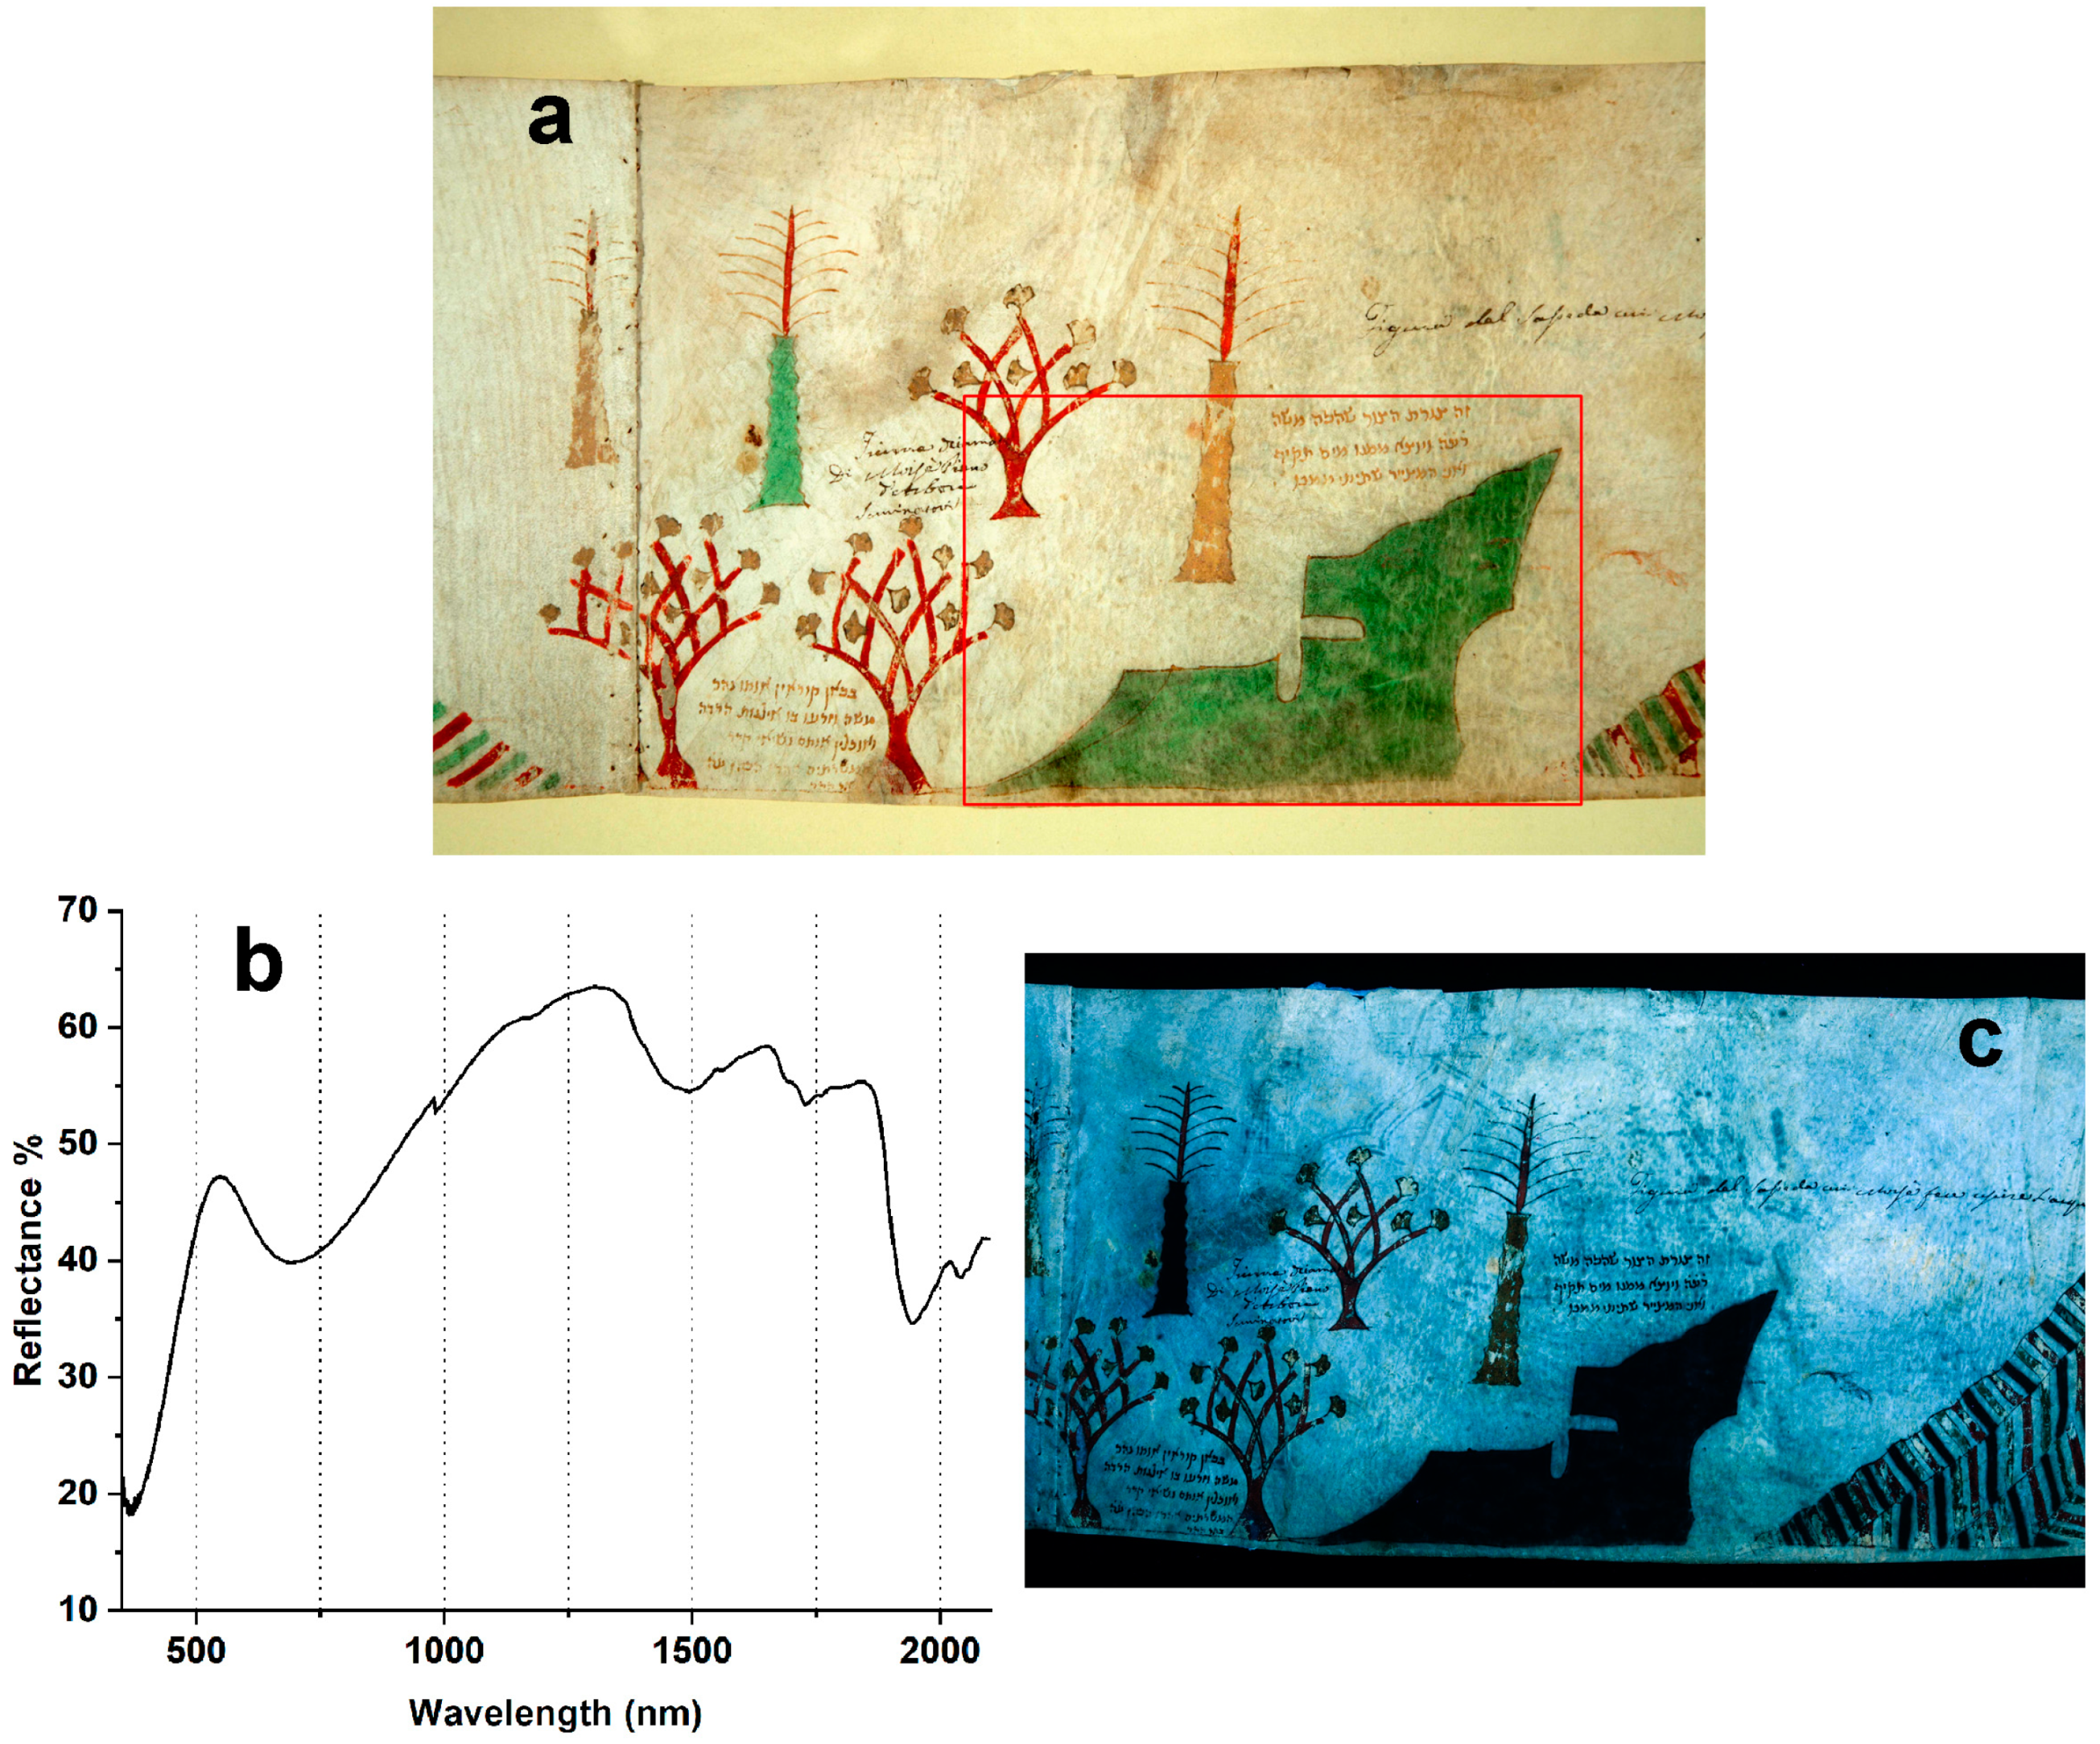
The study of the Scroll made it possible to identify the pictorial materials present. FORS measurements allowed for the green areas to be identified as having been painted with a Cu-based pigment due to its broad absorption band centered at around 750 nm and extending in the NIR to about 1200 nm. The shape of the FORS spectra could indicate that verdigris is present, according to what is reported in reference spectral databases and in the bibliography (
Figure 4b) [
23,
24,
25]. This finding was in agreement with the UVL imaging, as these green areas showed a strong quenching effect of the luminescence, resulting in almost black (
Figure 4c) [
26]. However, the pigment could not be identified more precisely, since FORS technique is unable to discriminate between different types of Cu-based green pigments [
27,
28,
29]. The presence of Cu was also confirmed by MA-XRF analysis. FT-IR and Raman allowed the presence of malachite to be excluded. Furthermore, only two weak bands at 320 and 950 cm
−1 were recorded in the Raman spectra, attributable to a verdigris pigment (Cu(CH
3COO)
2∙H
2O) [
14,
30].
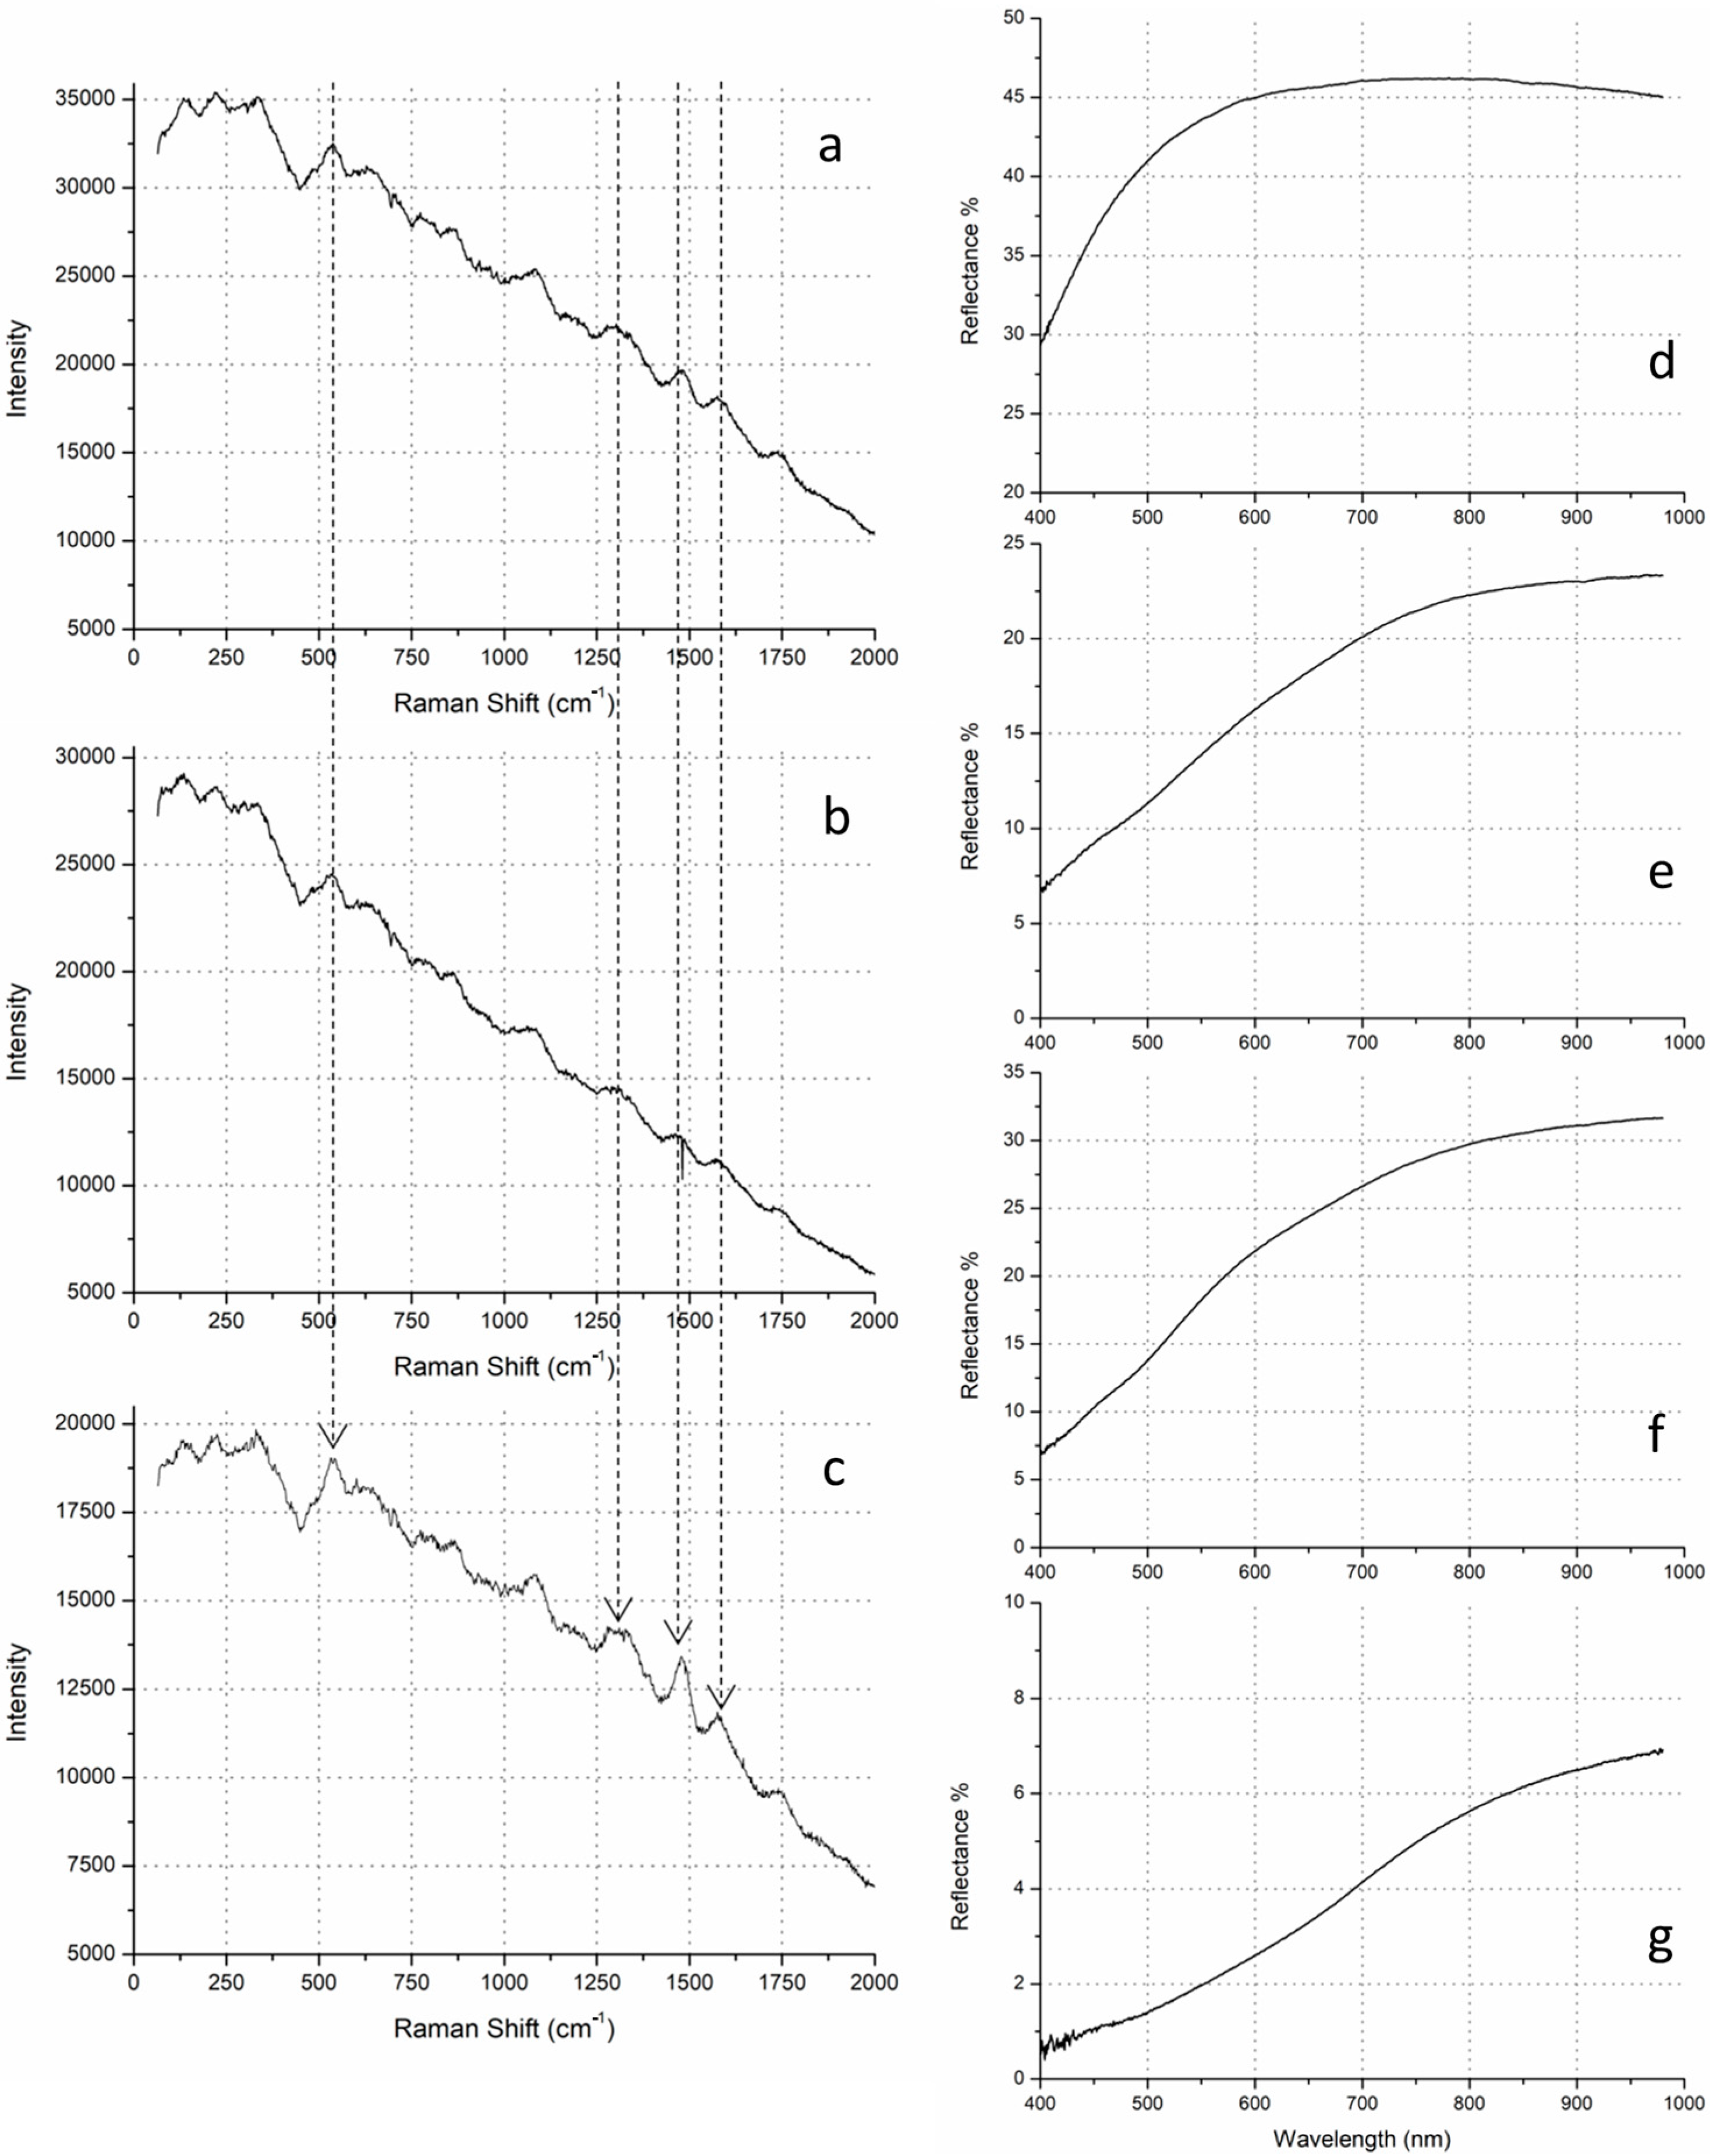
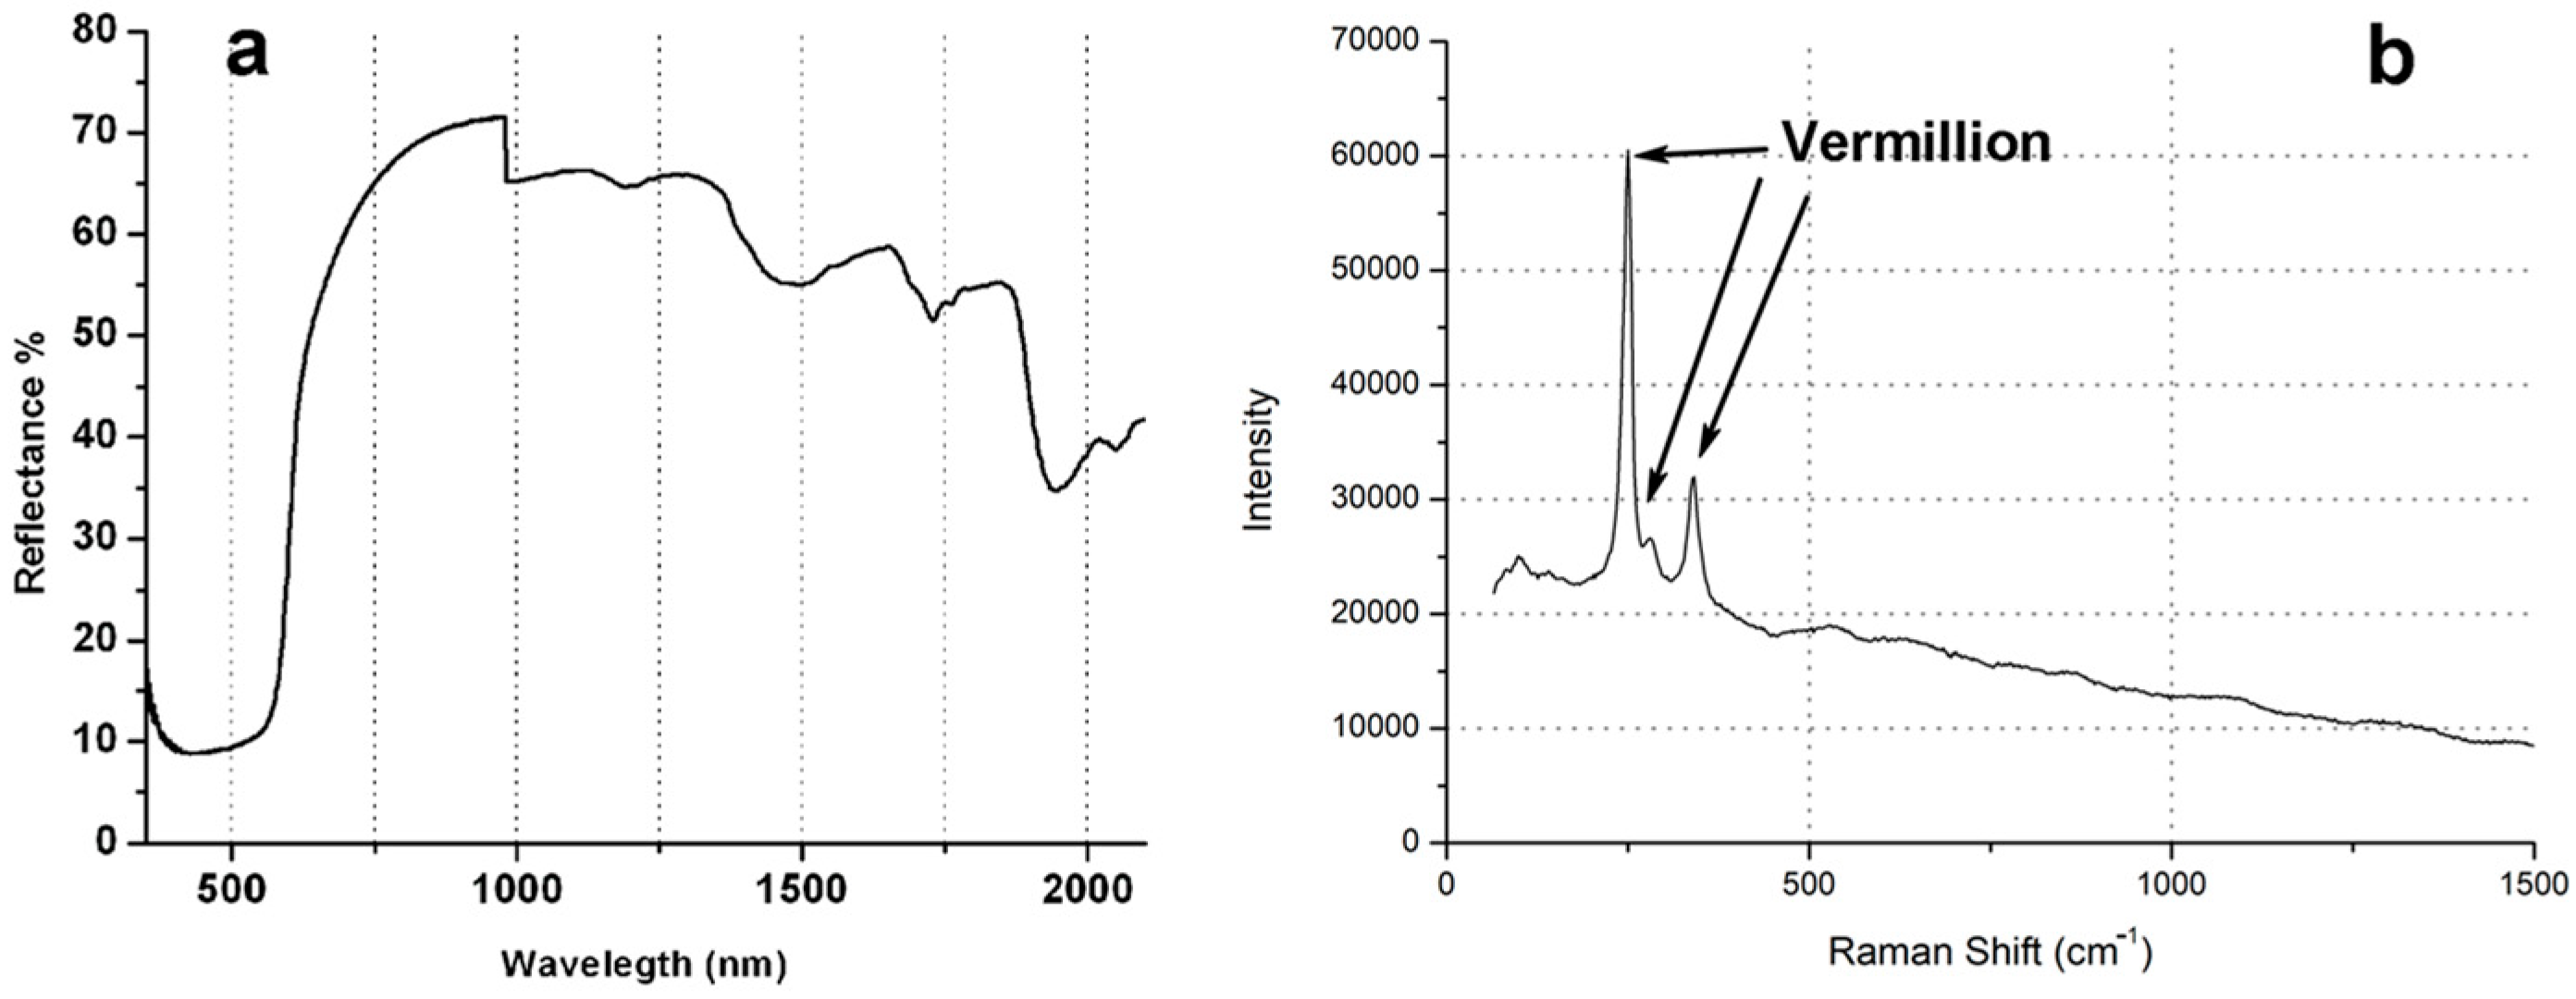
Concerning the red pigment, its identification was certain, through the coupling of the data provided by FORS, MA-XRF, and µRaman techniques. The FORS spectra of red areas show an S-shape trend with a strong absorption in UV-VIS (λ < 550 nm) and an inflection point (first derivative) at about 600 nm (
Figure 5a). These features are typical of vermilion (HgS) [
20,
27]. This identification was also confirmed by the Raman spectra, which show the vermillion characteristic peaks at 250, 280, and 340 cm
−1 (
Figure 5b) [
13,
14,
15,
30,
31]. Again, XRF confirmed the presence of vermillion with Hg and S as the main elements detected.
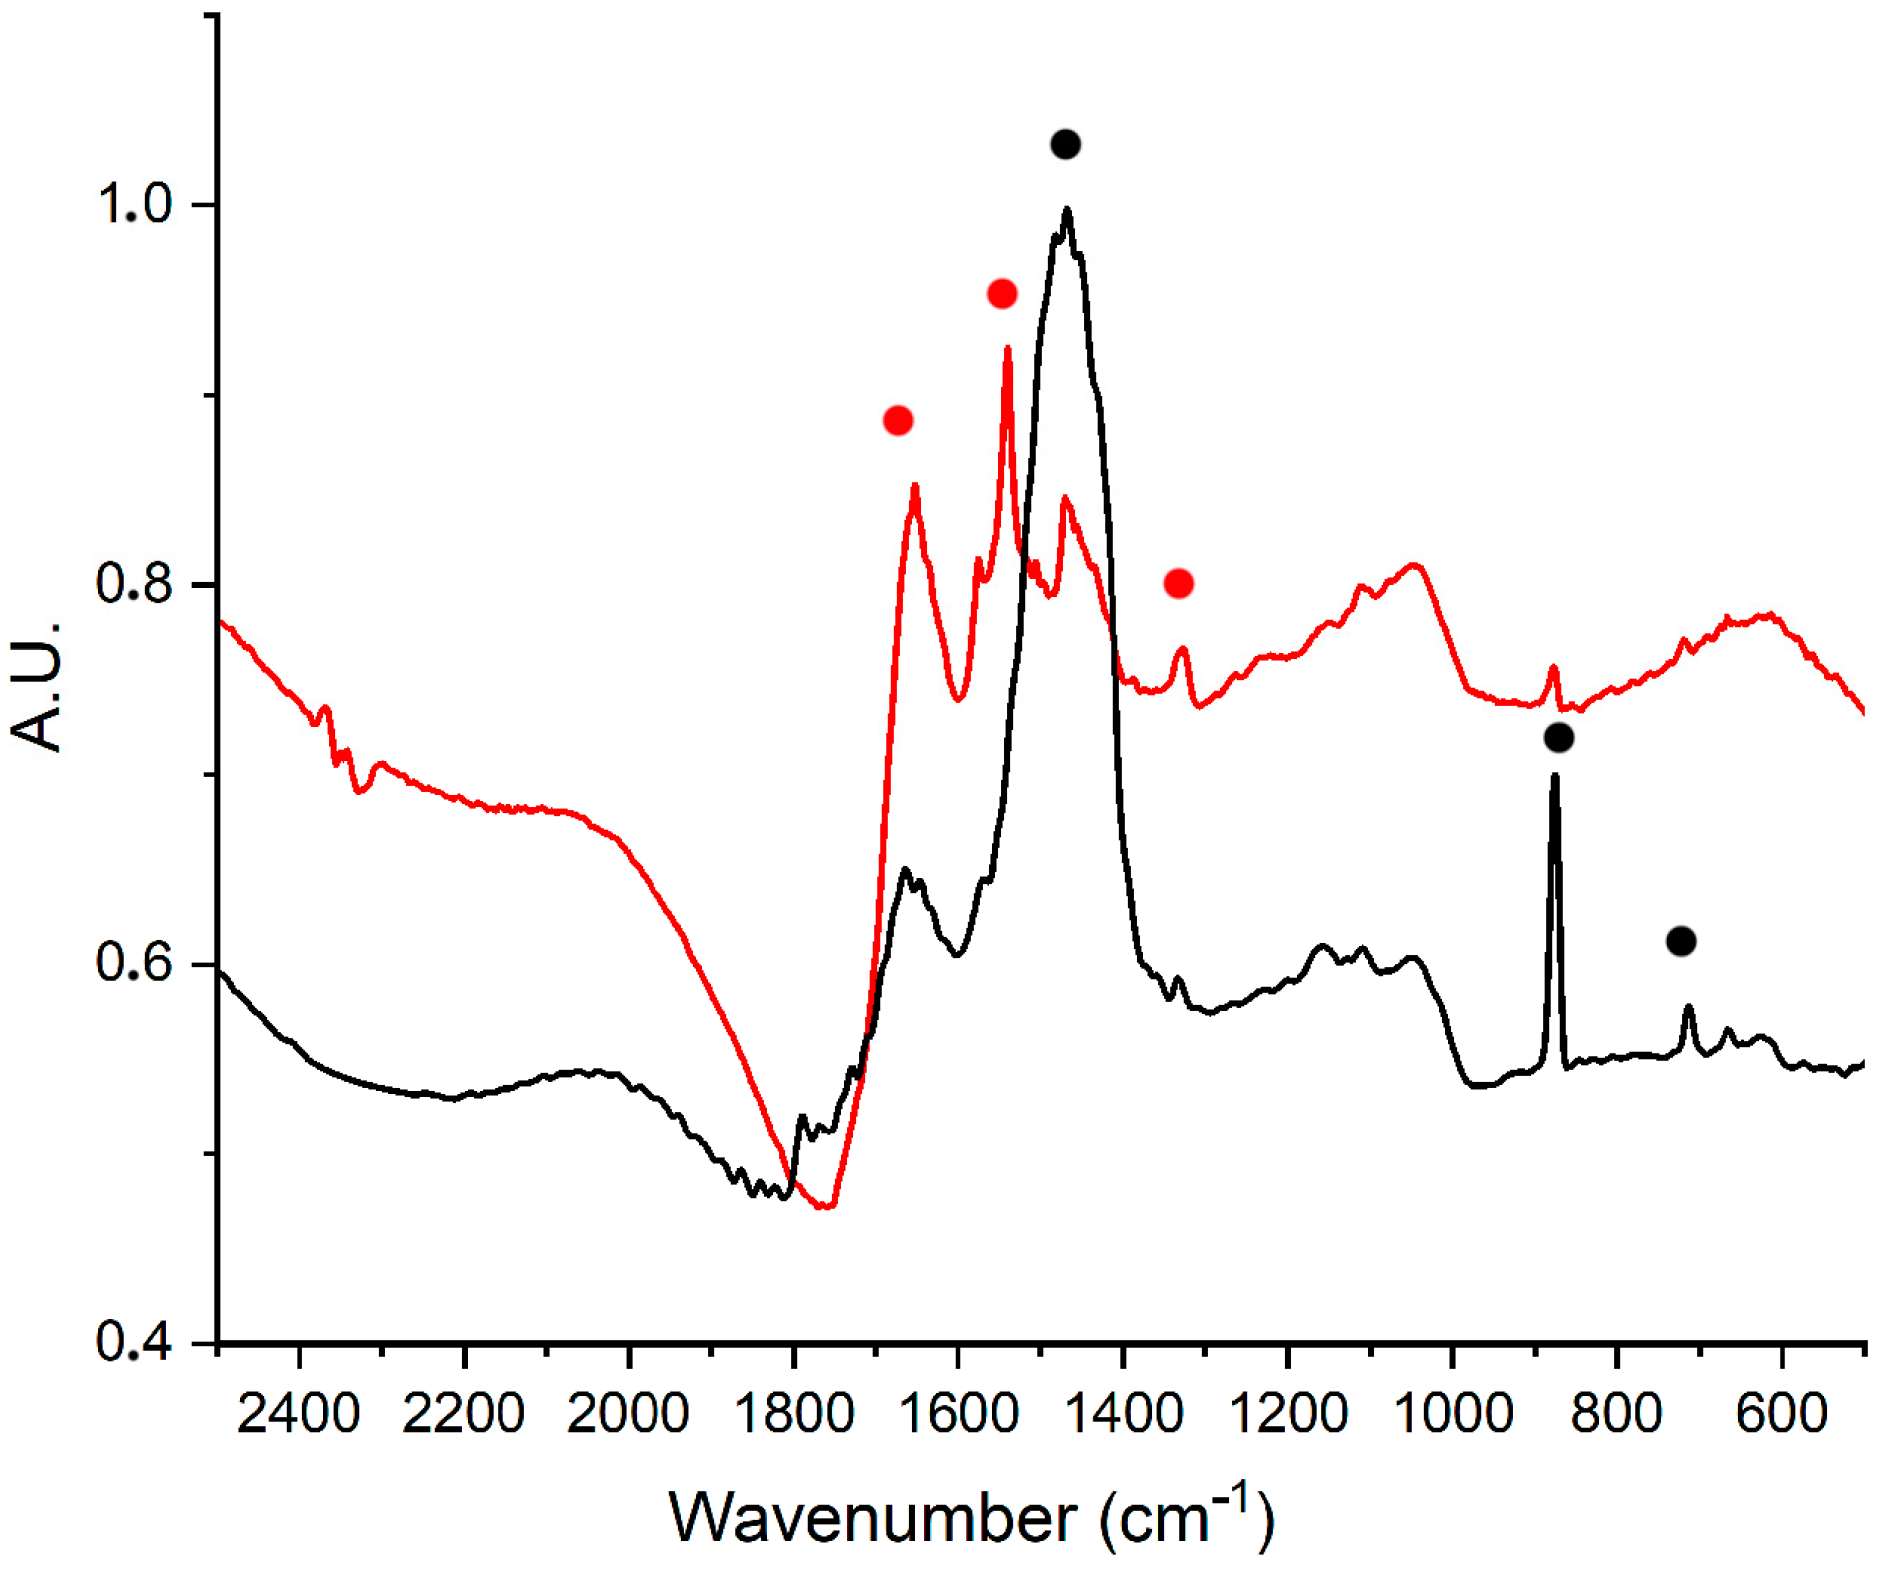
FT-IR spectra acquired on the red areas did not show the presence of other types of red pigments, thus indirectly confirming the prevalence of vermilion, which has no absorption bands in the investigated IR spectral range [
27,
32]. Furthermore, IR spectra showed bands at 5772 (1st overtone ν(CH
2)), 5150 (ν(OH) + δ(OH)), 4880 (νs (NH) + δ(NH)), 4591 (1st overtone ν(CO) amide I + amide II), 4330 (νa (CH2)+δ(CH2)), 4257 (νs (CH
2) + δ(CH
2)), 1652 (C=O stretching, amide I), 1540 (NH bending, amide II), and 1470 cm
−1(C-N amide stretching) that are attributable to a proteinaceous product, such as an animal glue. [
12,
18,
20,
33,
34,
35,
36,
37]. These absorptions are quite surely attributable to the binder since, in the IR spectra recorded on the unpainted parchment, the bands due to proteins were almost completely invisible, covered by calcite bands (
Figure 6).
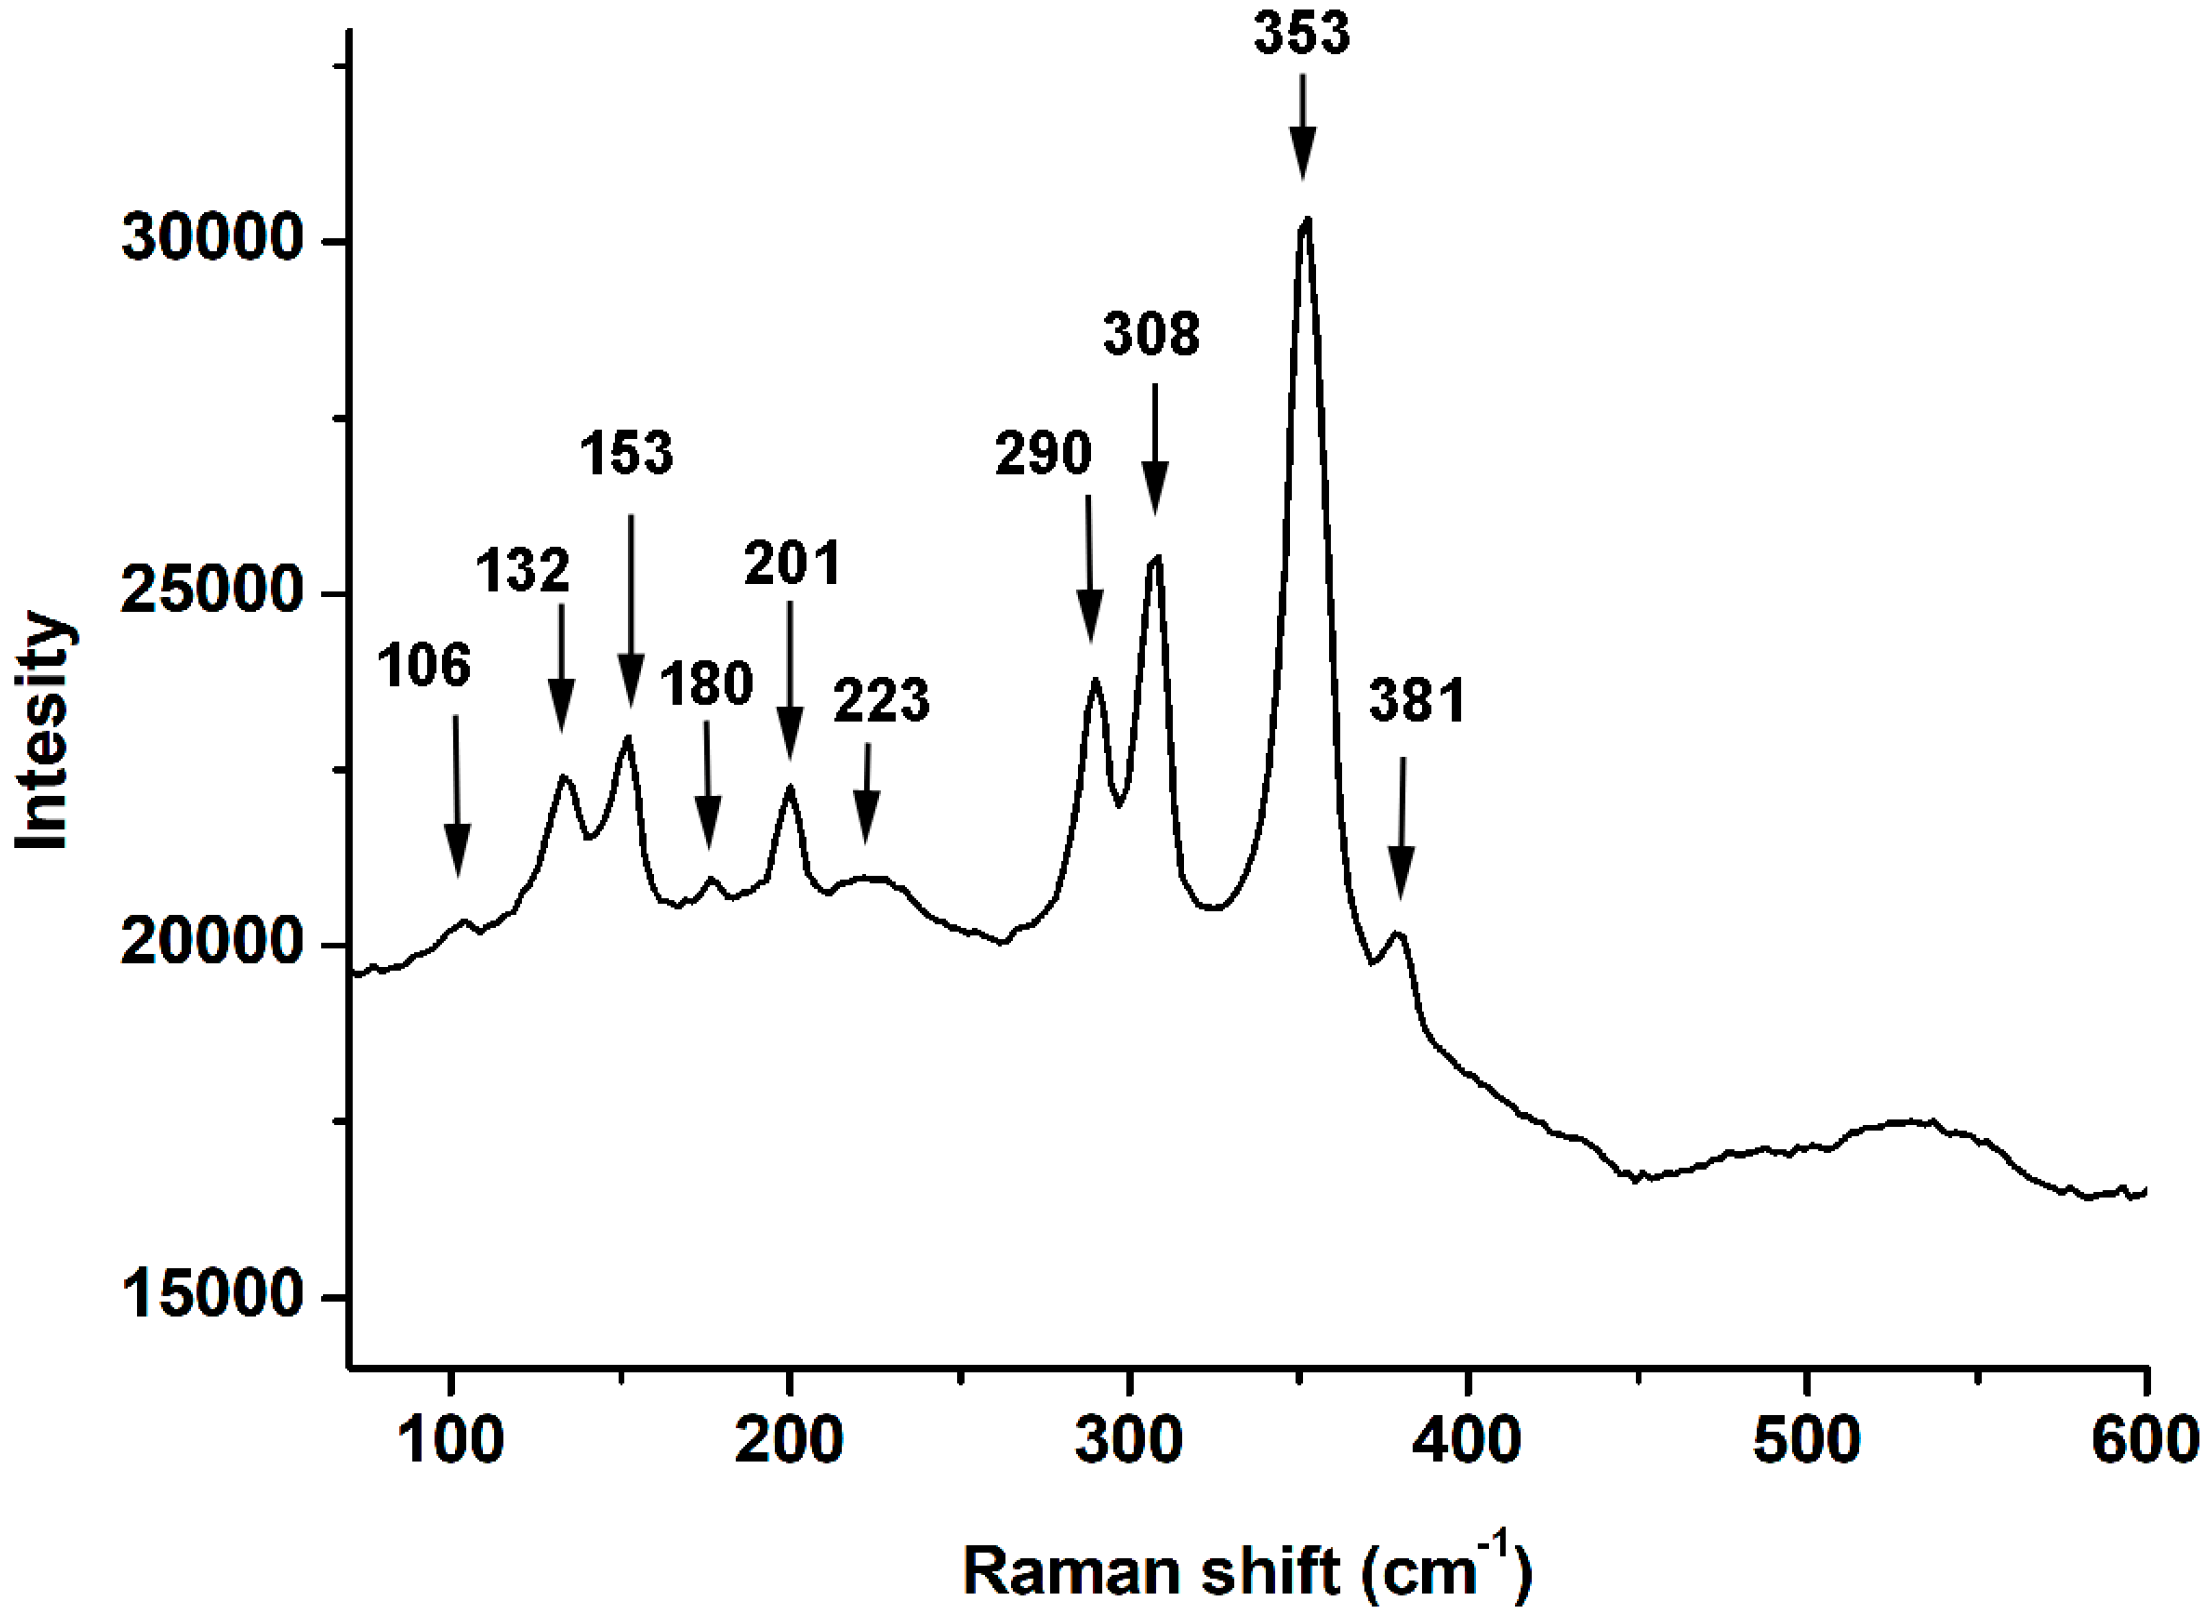
The yellow-gold pigment was identified as orpiment (As
2S
3), mainly via micro-Raman technique. The characteristic peaks of this yellow pigment at 106, 132, 153, 180, 201, 223, 290, 308, 353, and 381 cm
−1 were detected in all of the Raman spectra (
Figure 7) [
14,
30].
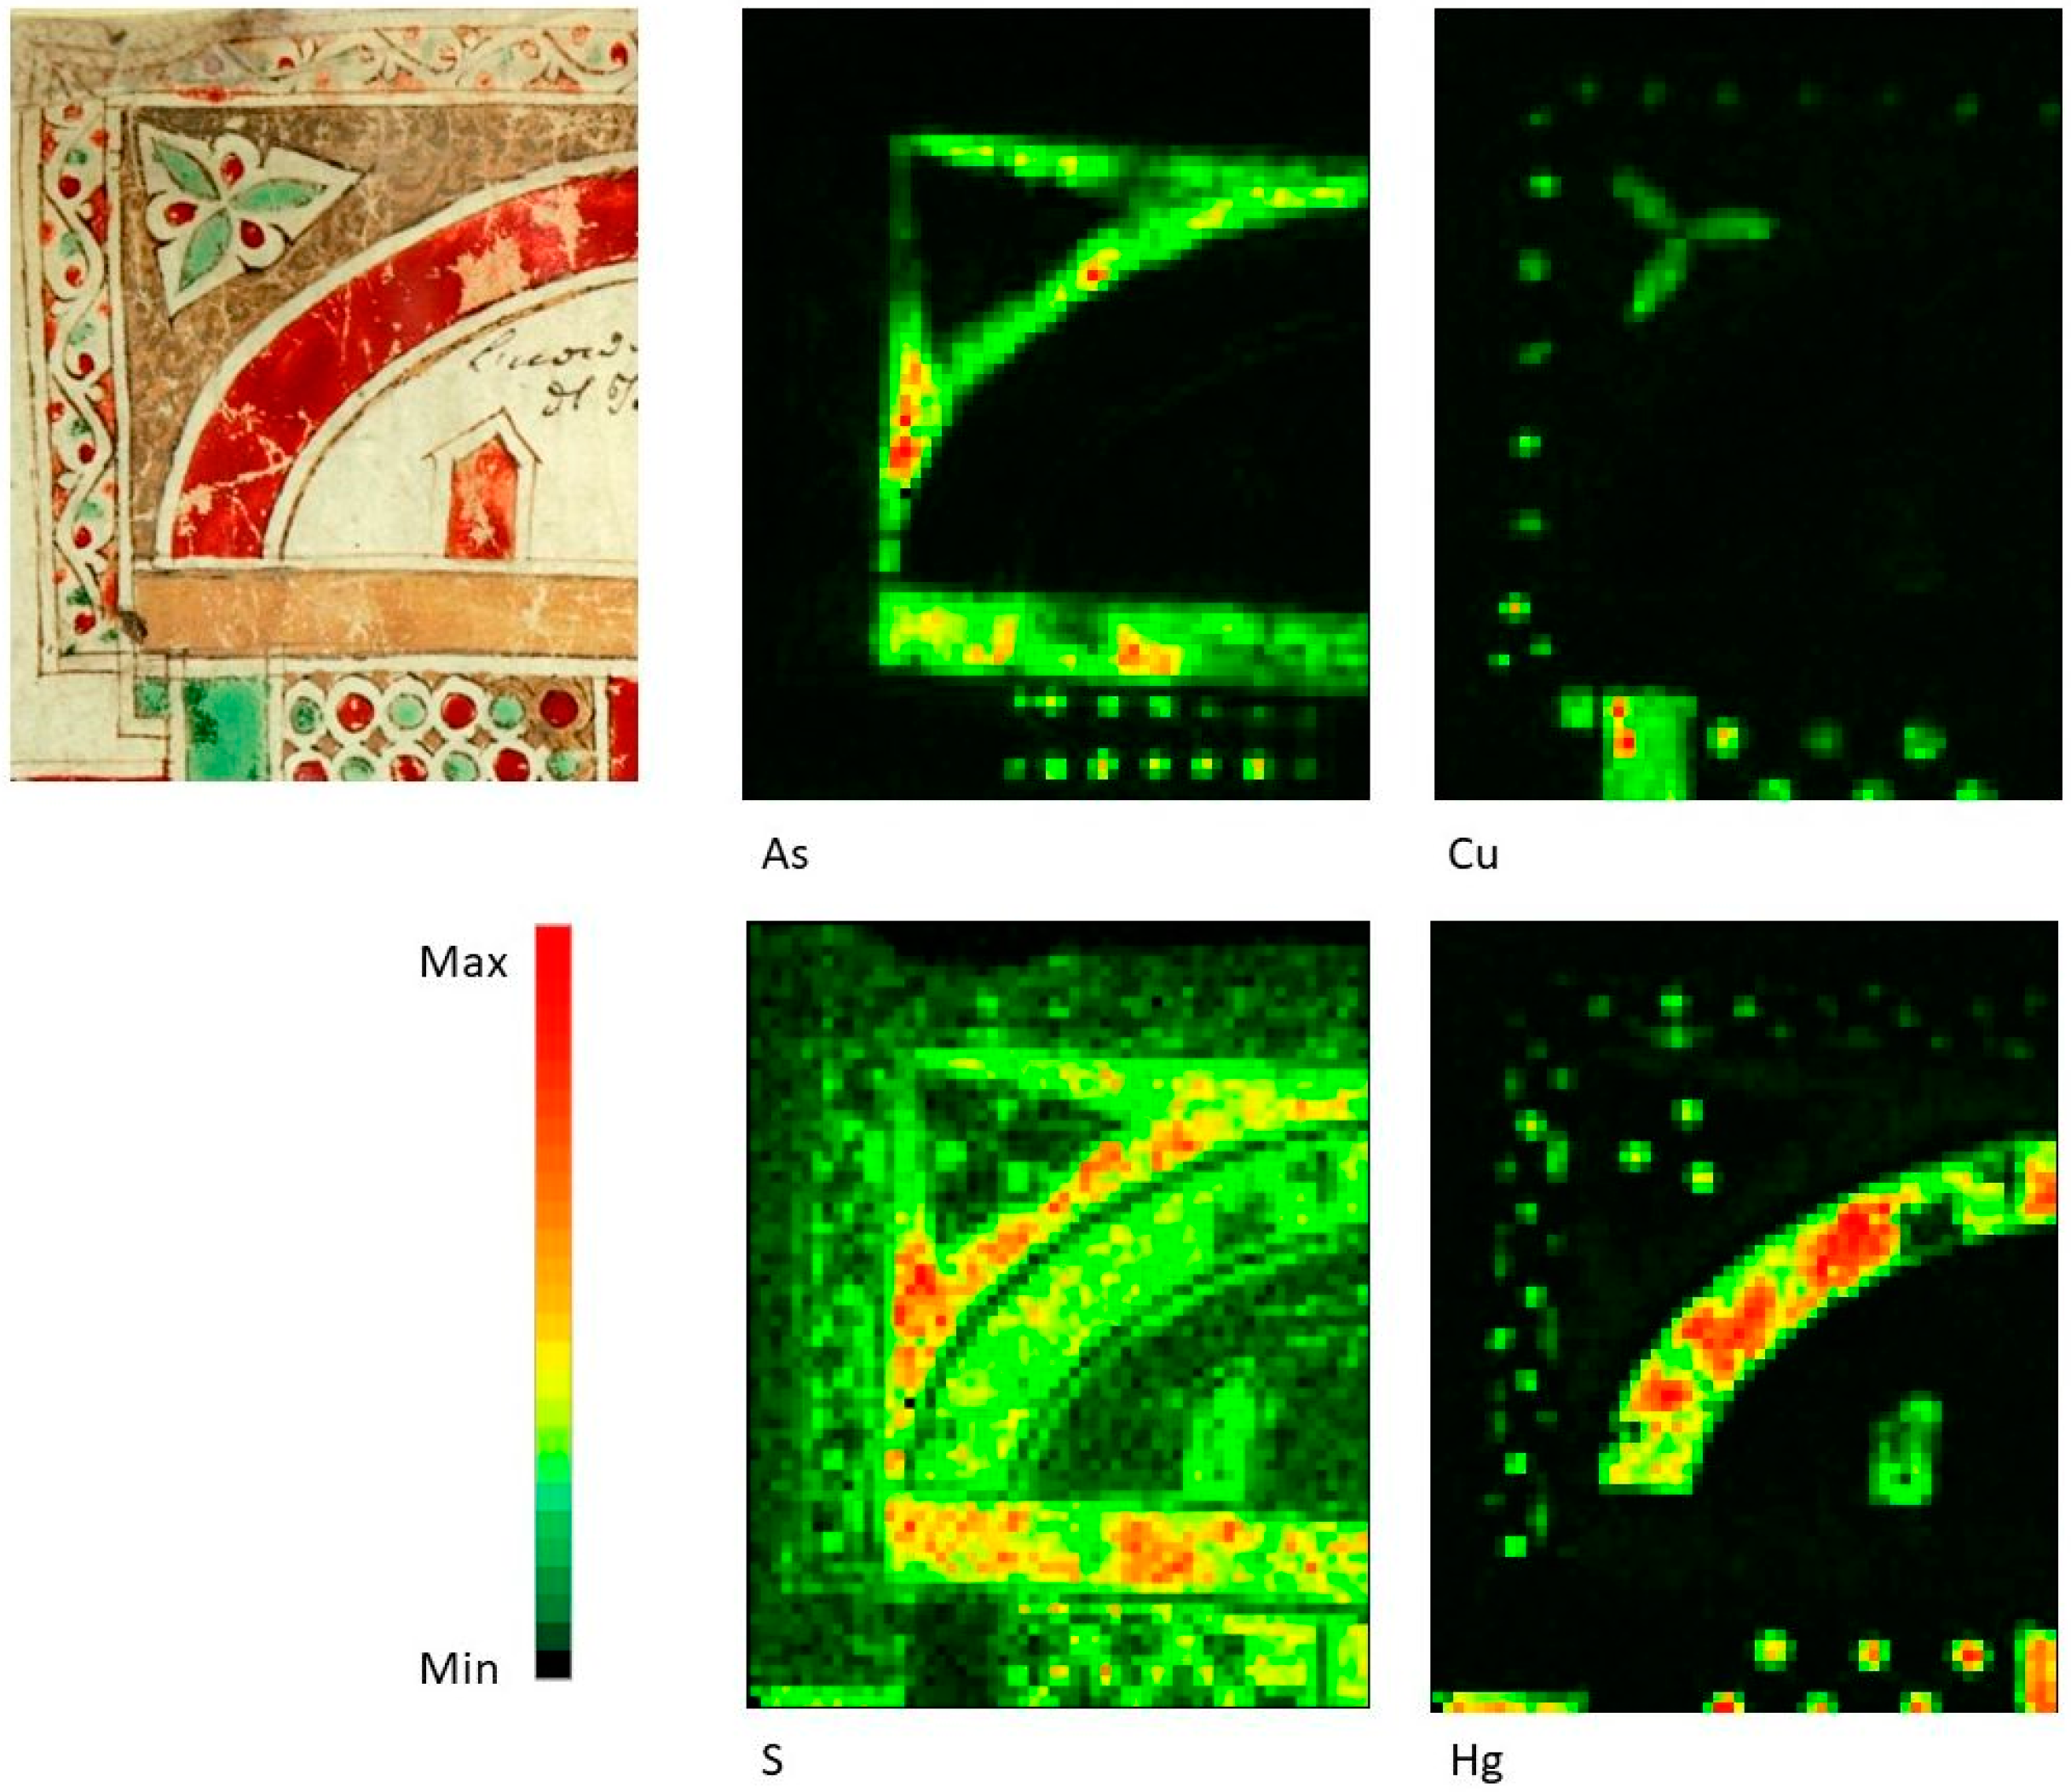
MA-XRF analyses agree with the Raman data on yellow areas, showing As and S as the main elements, plus traces of Hg (
Figure 8). The association of Hg traces with orpiment has been found in other works [
13].
Furthermore, the FT-IR spectra showed the presence of absorption bands at 1185, 1144, 1086, 855, 808, 646, and 619 cm
−1, whose attribution is still unclear. Considering their positions, these bands could be attributable to a sulfate [
32,
38]. However, no further clues for a certain identification of the material/s present along with the orpiment could be obtained from the available data.
All diagnostic and analytical techniques provided consistent results regarding the artists’ materials, with data highlighting that the same pigments were used to paint the different scenes from the beginning to the end of the Scroll decoration.
This consideration was further confirmed by the HSI data, which allowed the spot information to be extended to large areas of the Scroll by using the SAM algorithm. This aspect was confirmed by the HSI data elaboration, when the SAM (Spectral Angle Mapping) algorithm was applied. This algorithm is a non-automated classification method for directly comparing the spectra of HSI data with a reference spectrum (which can be internal or external to the analyzed dataset). This method treats the entire set of spectra as vectors and calculates the angle between the reference and the others. The result of SAM classification is an image that shows the best match between the unknown and reference spectra in each pixel [
39].
As an example,
Figure 9 shows the SAM classification maps of the pigments verdigris and vermilion in Zones 11 and 19, respectively. In each HSI data, the representative spectrum of one of the two pigments was extracted and used as a reference to map the distribution of verdigris (
Figure 9b, MA = 0.1209) and vermilion (
Figure 9e, MA = 0.1379) over the investigated area, respectively. As can be seen, the selected areas almost completely cover the green and red paints in the two images. The areas of green and red coloration not highlighted in the two distribution maps were found to be those where the pictorial film had fallen off, in which the halo of the hue remained but no longer the pigment.
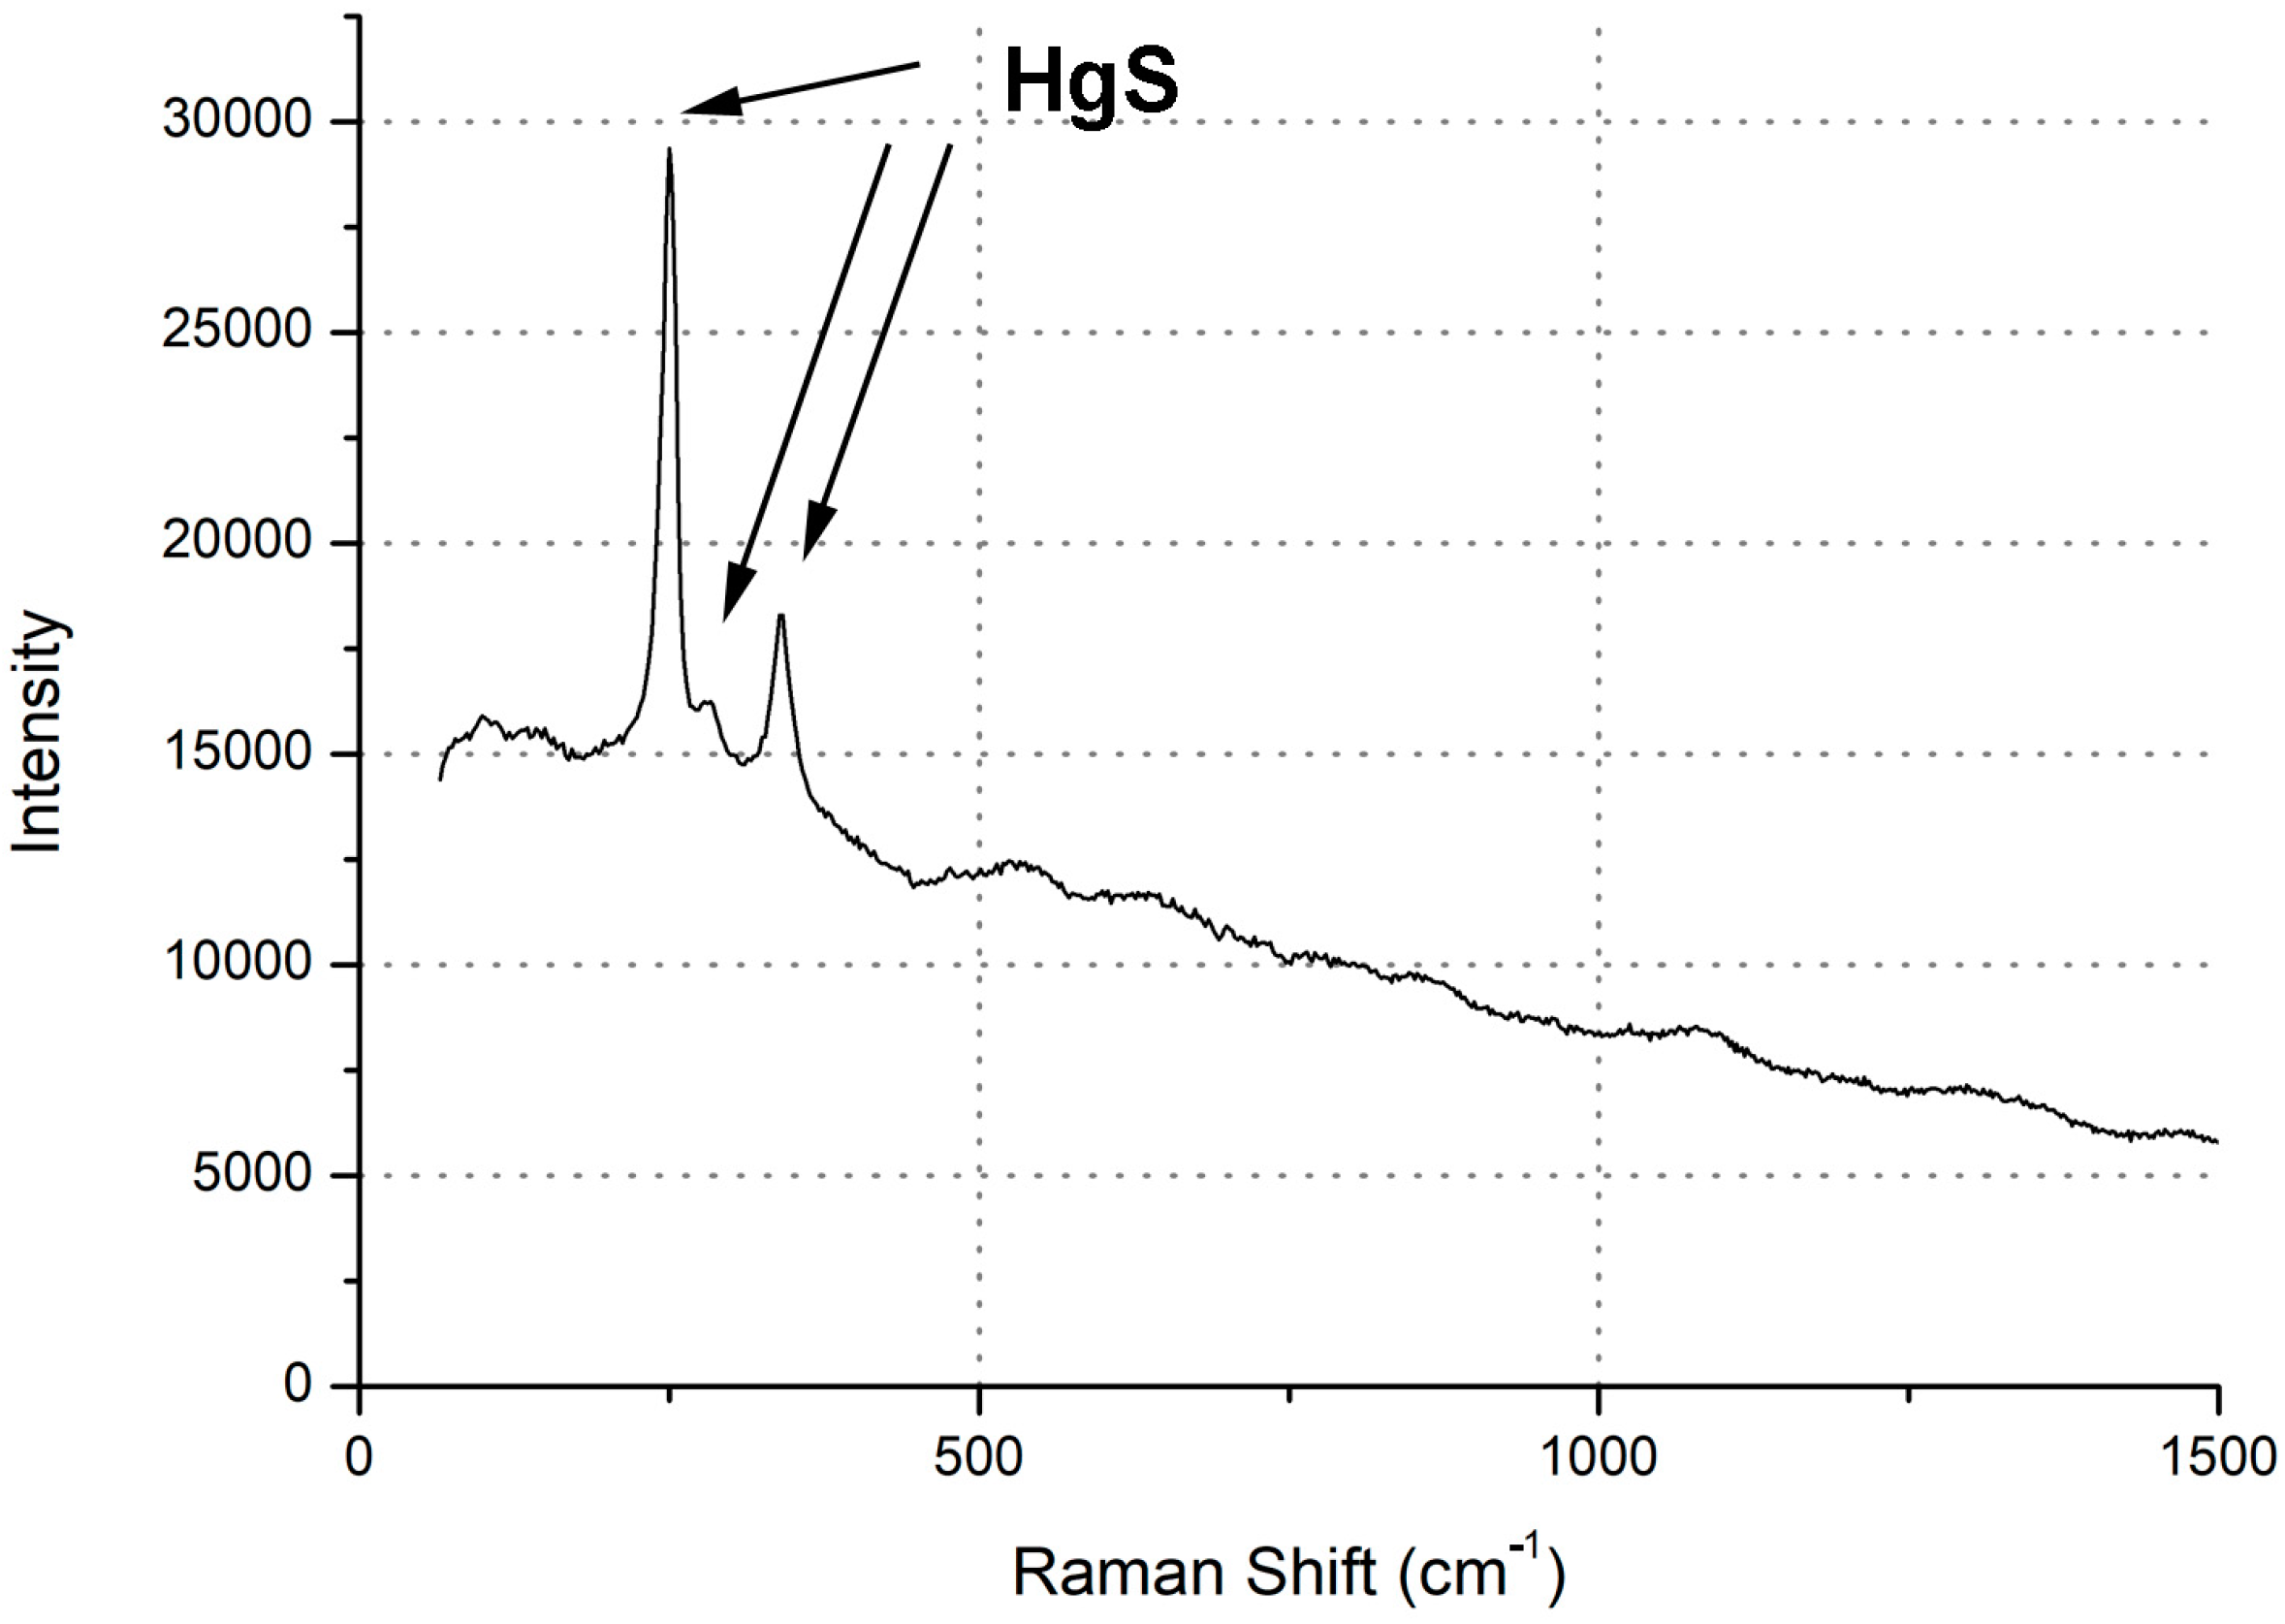
Regarding the text, as mentioned, different types of inks were employed for the notes on the Scroll, from red ink to various shades of brown and black inks. Red ink was only detected in specific notes within Zone 37, while brown and black inks were used extensively throughout the Scroll. A light brown ink was used for the Hebrew notes and outlines of the illustrations, which can be considered the original one. A second type, also light brown, was used for the Italian notes and can be traced back to when the Scroll arrived in Italy, which is assumed to be in the mid-14th century. Finally, a dark brown ink was used for some Hebrew notes in Zone 37. One letter in these notes partially overlaps with a Hebrew text in red and is therefore considered a more recent inscription. This consideration can be supported by Raman data because Raman peaks characteristic of IGI appear sharper and more defined than those of other Raman measurements on similar inks. Different black inks were used for the Hebrew notes, the Italian notes, and the Arabic words written in Hebrew characters (
Figure 10).
The red ink was identified by micro-Raman spectra, in which the typical peaks of cinnabar were detected (
Figure 11) [
13,
14,
15,
30,
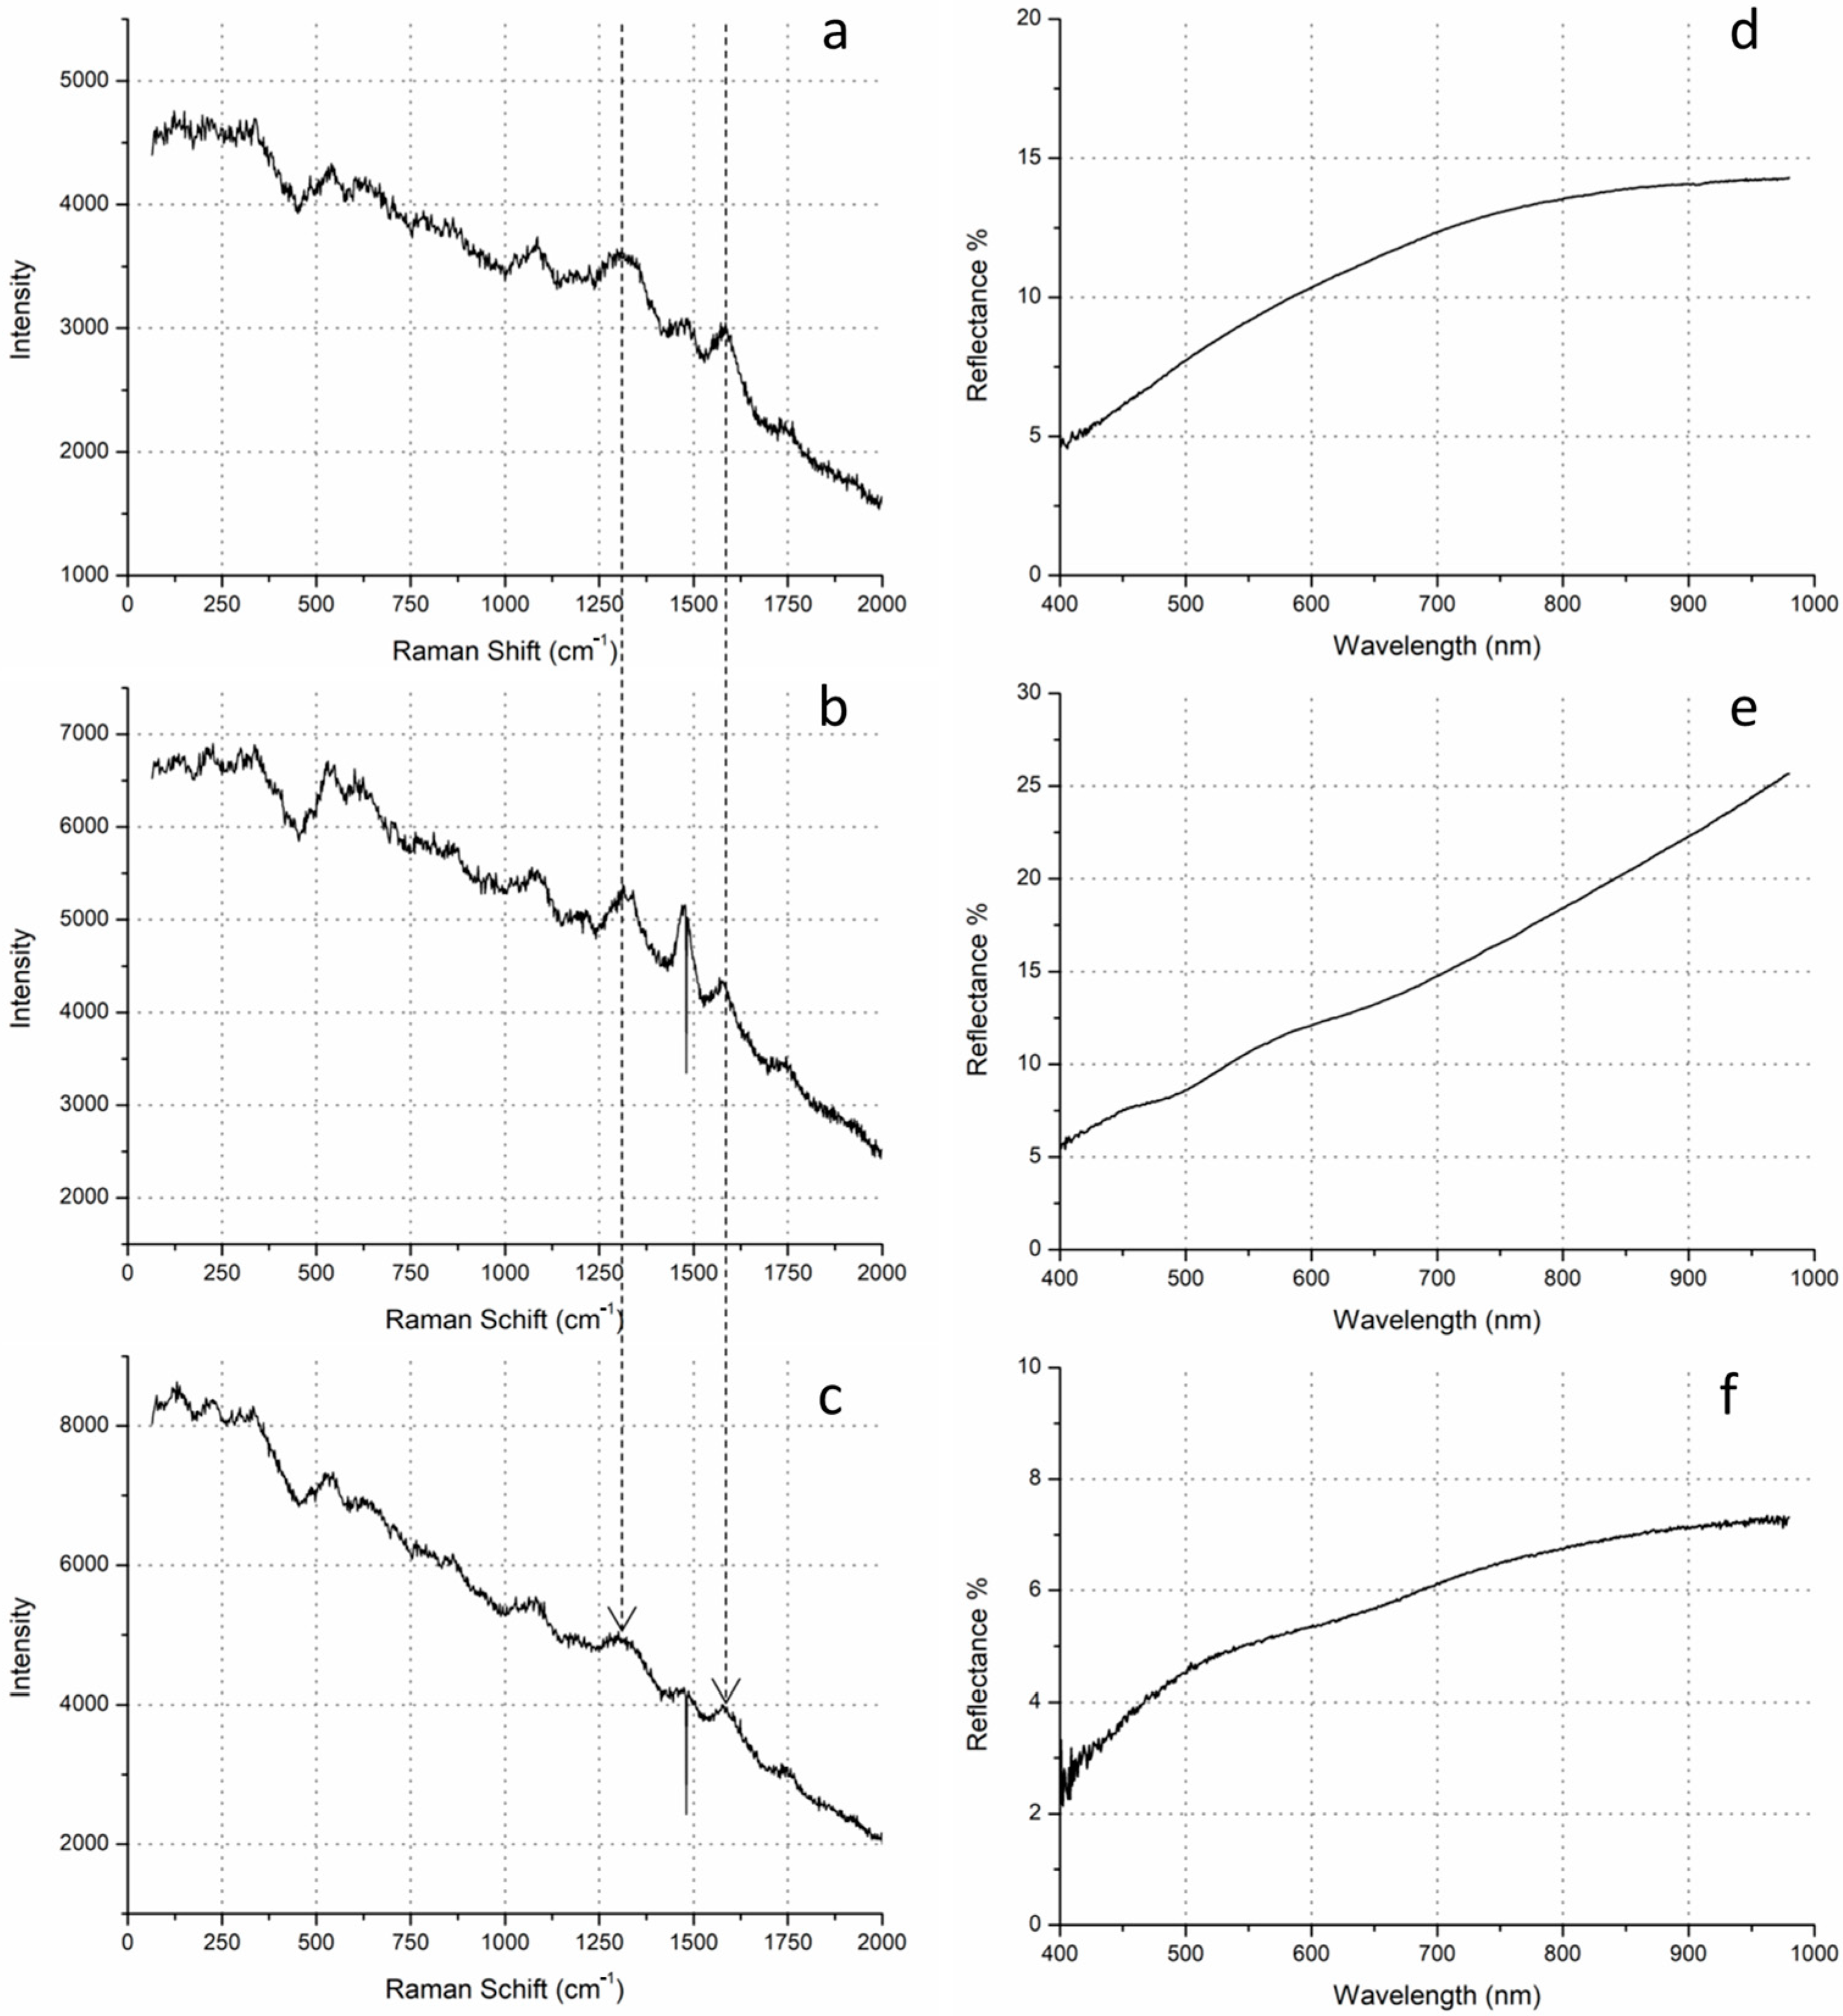
31]. All brown inks were identified as Iron Gall Ink (IGI) by Raman measurements in which the most intense IGI peaks were detected at 540, 1310, 1480, and 1580 cm
−1 (
Figure 12) [
8,
13,
14,
15,
30,
31,
40,
41]. Regarding the Raman data, the differences between the three types of brown inks are mainly due to the peak around 1300 cm
−1. In fact, by observing the Raman spectra it was possible to divide the spectra into three groups according to the amplitude-shape of this peak, which covers the ranges 1310–1320, 1290–1310, and 1280–1330 cm
−1 for the light brown Hebrew, light brown Italian, and dark brown Hebrew inks, respectively. The consideration that the dark brown text is more recent than the light brown Hebrew text, as reported earlier, can also be supported with Raman data. Indeed, in these the characteristic peaks of the IGI appear sharper and more defined than in other Raman measurements on similar inks. FORS spectra are generally influenced by the contribution of the parchment and the inhomogeneity of the coverage of the texts analyzed. However, they showed absorption at shorter wavelengths of about 500 nm (strongly attenuated by the spectral component of the parchment) with an inflection point around 700 nm (
Figure 12) [
8].
FORS and micro-Raman techniques indicated that carbonaceous material was added to the black iron gall inks, maybe to obtain a darker coloring. Indeed, the trend of FORS spectra showed a significant decrease in the reflectance in the NIR [
8,
42]. In Raman spectra the carbonaceous materials produced two peaks, one at 1320 cm
−1 and one at around 1580 cm
−1 which overlap two peaks of the IGI, increasing their intensity (
Figure 13) [
14,
30,
41,
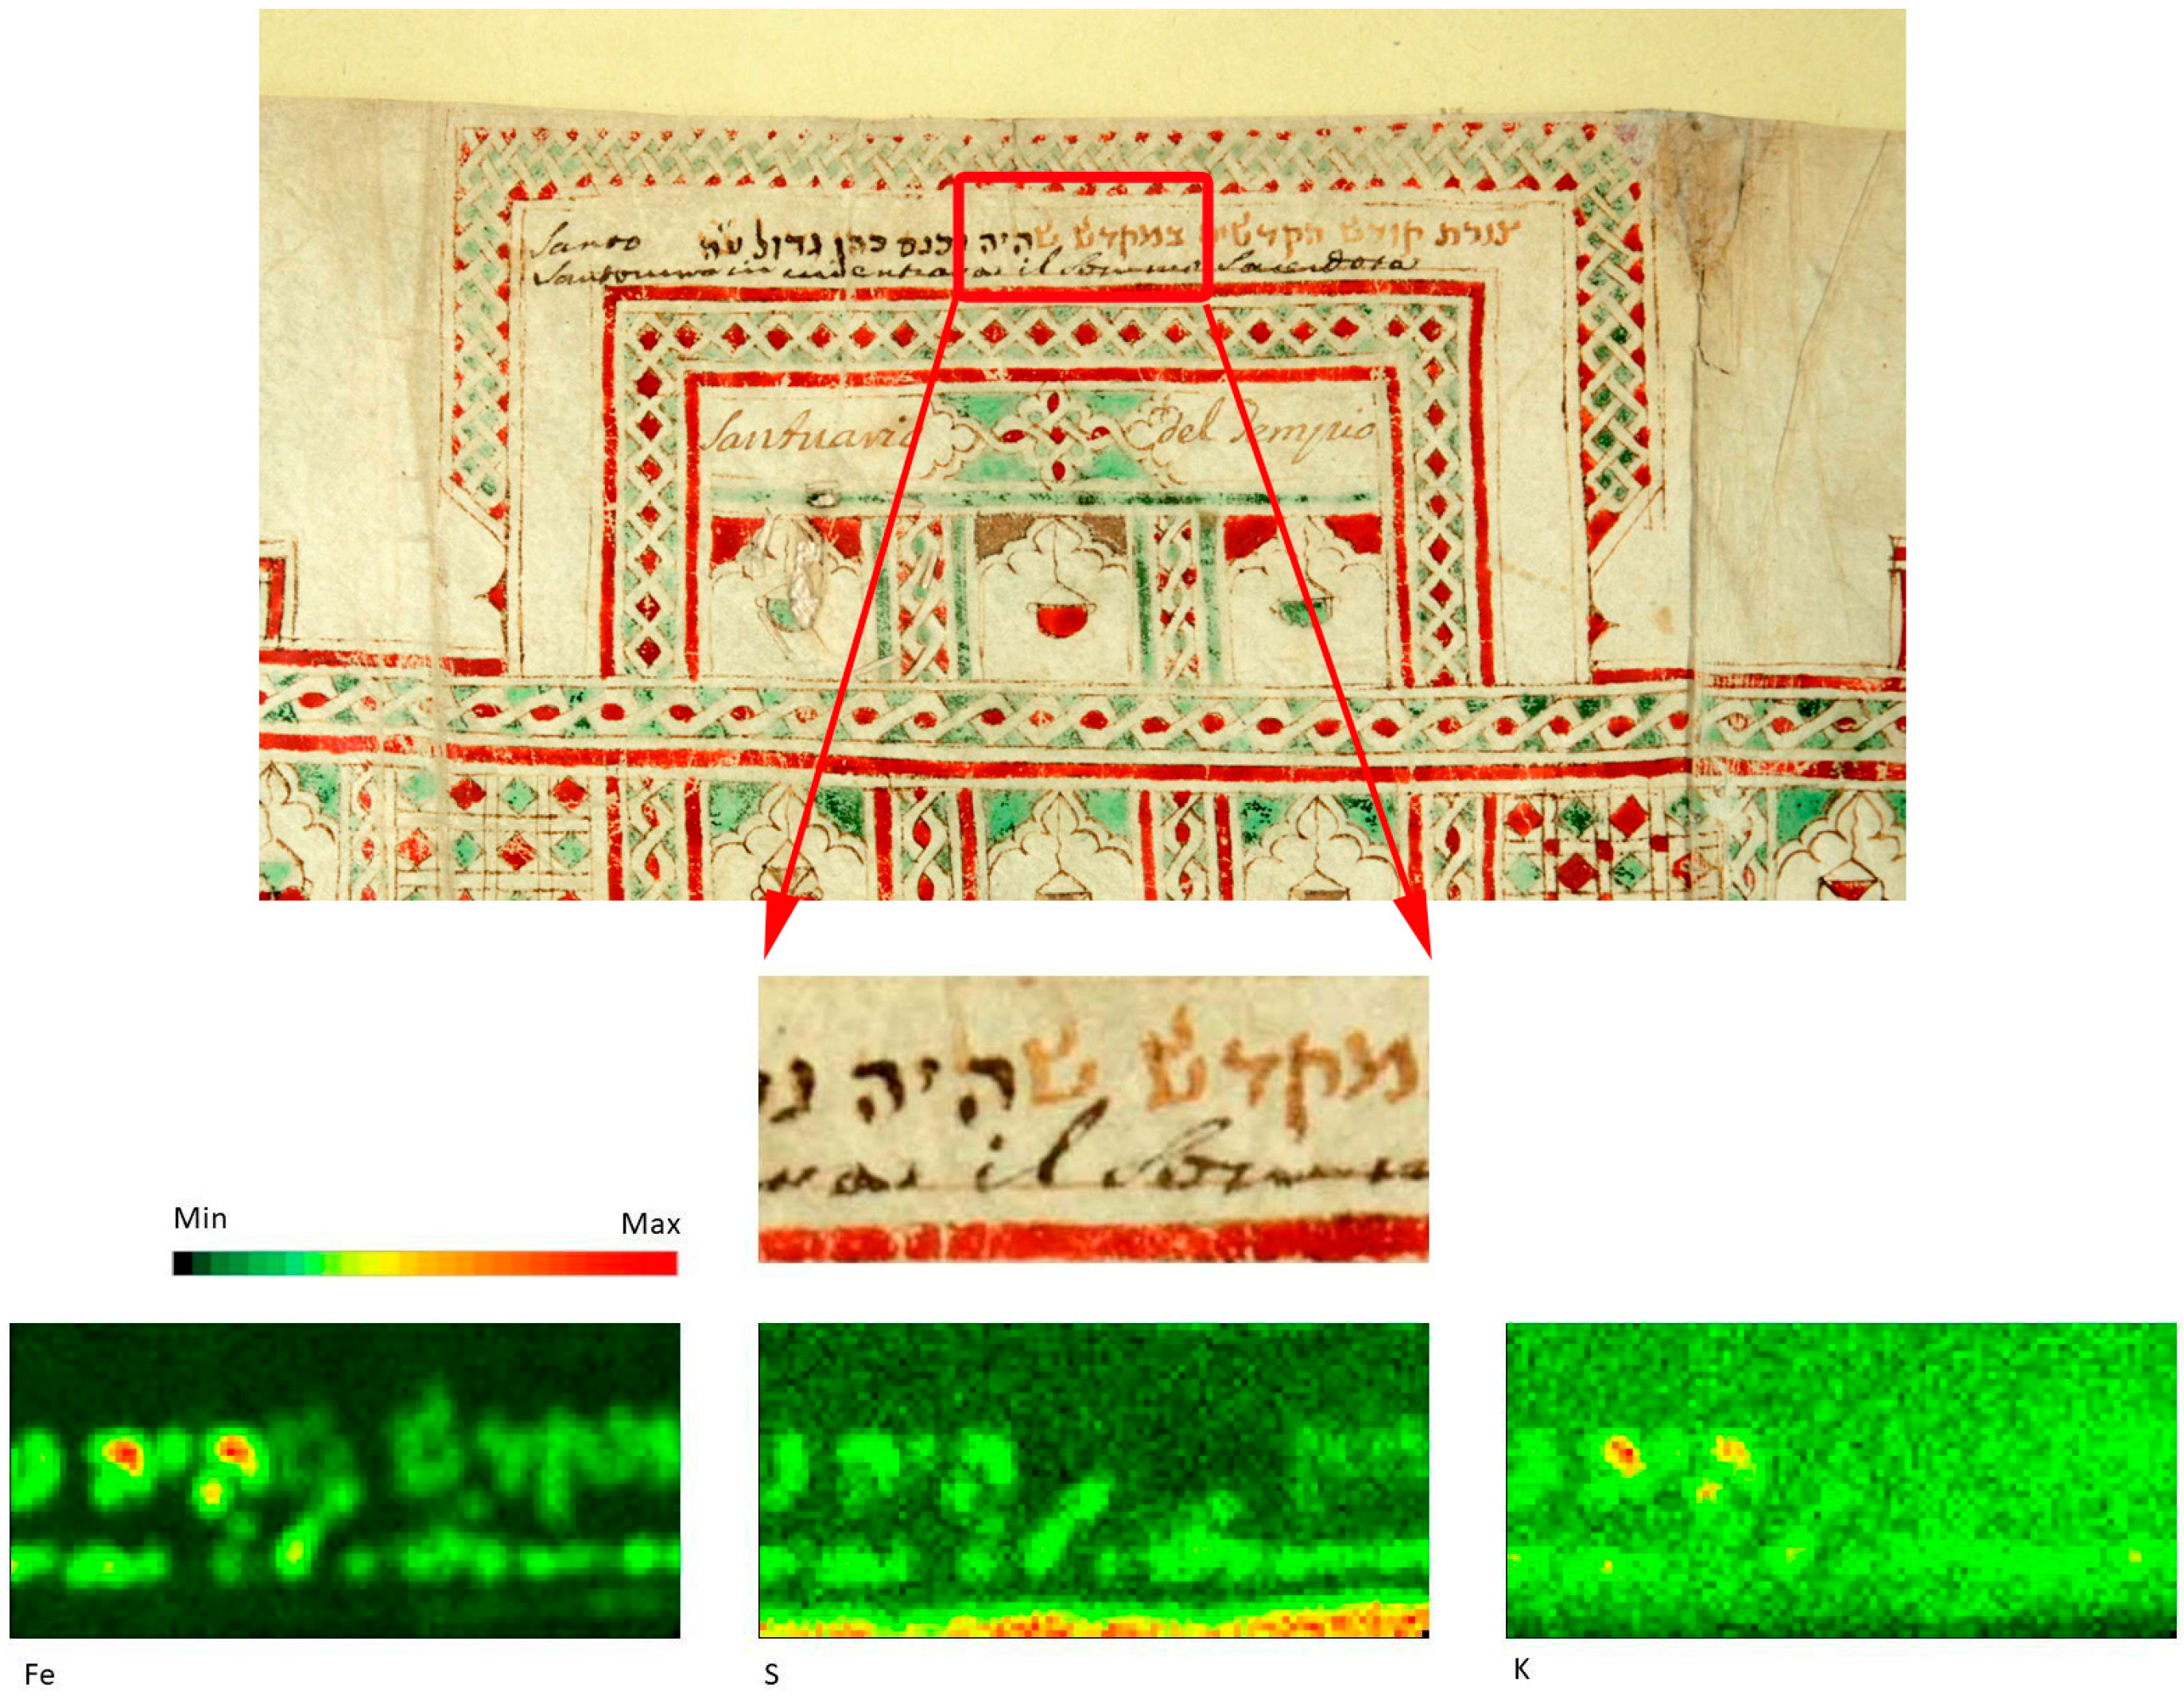
43]. Most of the XRF measurements showed Fe and S as the principal elements present, as consistent with IGI (
Figure 14). Although all inks analyzed are IGI and thus share a similar composition, MA-XRF detected relatively variable X-ray counts of the main components (Fe and S). K is also detected in brown and black inks, a common component in IGI inks likely related to Arabic gum (
Figure 14) [
44,
45]. As and Cu traces were also randomly found, probably due to contamination from other areas of the scroll.
6. Conclusions
Following recent paleographic analysis and documentary studies, the Hebrew Scroll of the BNCF has been recognized as an important and valuable textual document. Its historical importance also lies in the fact that it is a rare, illustrated record depicting typical holy sites of pilgrimages from Egypt to Lebanon.
The comprehensive yet fully non-invasive diagnostic and analytical campaign, carried out in view of the public exhibition in 2021 at the Israel Museum, provided new documentation and information about the constitutive materials (parchment, pigments, binder, and inks), in most cases allowing their certain identification. The materials identified are compatible with the proposed dating of the Scroll based on paleographic and stylistic studies [
2,
3].
Visible and UVL imaging techniques were used to digitize the whole Scroll, providing updated documentation on its state of conservation. Also, the high-resolution images were made accessible through the creation of a viewer, available online, thus enabling dissemination to the larger public of this precious artefact.
Transillumination and UVL imaging techniques provided information on the status of the support, highlighting situations of inhomogeneity related to the different thicknesses of the parchment and its processing. The parchment was also studied through specific spectroscopic techniques, including the FT-IR in ER mode, which led to the hypothesis that it was produced in the Western style, with a calcite preparation. Based on the light color of the parchment and its calcite-based treatment, the Scroll could be traced back to a Western production. This result agrees with the previous studies that indicated that the artist was Egyptian [
2,
3].
The pictorial palette was characterized. The use of a single green, red, and yellowish-gold pigment for all of the decorations on the Scroll was highlighted. Hyperspectral Imaging through the application of the SAM algorithm made it possible to map the distribution of materials present in the area of the acquisition of the data. The pigments were identified as a copper-based pigment for green, probably verdigris, vermilion for the red, and orpiment for the yellow areas.
As a binder for all of the pigments on the Scroll, an exclusively protein-based material was found, hypothesized as likely an animal glue, based on the FT-IR data and the UV images showing a whitish luminescence.
Regarding the inks, a red ink, and inks of various shades of brown and black, were found. Using FORS, micro-Raman, and XRF techniques, it was possible to characterize the red ink as a vermilion-based ink, the brown ones as Iron Gall ink, and the black ones as Iron Gall ink with additional carbon materials darkening the color.
All of the data acquired lead to the identification of materials that are consistent with the dating (XIV century) and manufacturing area (Egypt) proposed by previous research. Some aspects remain unsolved, thus encouraging further studies. In particular, it could be interesting to analyze the green areas with a different laser for micro-Raman measurements to confirm the presence of verdigris as found with the FORS technique. Lastly, a micro sampling of the yellow paint could help in identifying the unknown material detected by FT-IR.


 ,
, 
