1. Introduction
Underpainting is a broadly defined term referring to any pigment located underneath the visible surface image of a painting [
1,
2,
3,
4,
5]. It can refer to an intentional ground or preparatory layer of paint used to enhance the appearance of a surface layer, or a preliminary sketch upon which the surface image is based. It can also refer to an evolving early version of the painting covered over by the final image, also referred to as a
pentimento. In some cases, an underpainting can represent a recycling or reuse of a substrate such as a painted piece of canvas. In all cases, knowledge of these subsurface details reveals historical and technical information about the painting.
The detection and subsequent investigation of underpaintings is accomplished using many analytical techniques. The initial discovery of hidden images often utilizes imaging techniques, while the investigation may also take advantage of point sensitive techniques. The imaging techniques, such as macro X-ray fluorescence (ma-XRF) [
6], X-ray laminography [
7], reflectance imaging spectroscopy (RIS) in the visible and near infrared [
8], and photoacoustic imaging [
3,
9], are noninvasive. Some point-sensitive techniques cannot see through a surface layer, so paint cross section analysis [
10] is necessary to expose information underneath a surface layer of paint. The wide variety of imaging and point-sensitive techniques provide unique and valuable information to study underpaintings.
Although conventional 9 GHz electron paramagnetic resonance (EPR) spectroscopy [
11] has been used to study paramagnetic pigments in paintings [
12,
13,
14,
15,
16,
17], including underpaintings [
18], the technique is invasive. Small samples are removed from a work of art and nondestructively analyzed. Low frequency EPR (LFEPR) spectroscopy and imaging with the EPR mobile universal surface explorer (MOUSE) [
19] were recently introduced as viable noninvasive and nondestructive methods for identifying single [
20] and mixed [
21] paramagnetic pigments on canvas, as well as their spatial distribution in a painting [
22]. The EPR MOUSE is inherently well suited for studying underpaintings because it has a depth sensitivity of a few millimeters into a surface. Furthermore, at concentrations above the detection limit, the presence of one pigment does not interfere with the ability to detect another.
This paper explores the ability of the EPR MOUSE to study underpaintings. Since the spatial sensitivity of the EPR MOUSE has only been measured pointwise along three orthogonal axes from the MOUSE, the first goal of this investigation was to determine the depth sensitivity. This was accomplished by placing a thin sheet sample of an EPR signal standard parallel to the surface of the MOUSE and incrementally increasing the distance between the sheet and the MOUSE. This data also allowed for the determination of the sensitivity of the EPR MOUSE to different paint thicknesses.
Next, three separate samples of the paramagnetic pigments Han blue, ultramarine blue, and Egyptian blue were prepared in an acrylic binder. These samples were placed under opaque acrylic layers of titanium white and lead white, which are diamagnetic pigments that do not possess EPR signals. Together, these samples were used to test the ability of the MOUSE to perform spectral identification of the blue pigments underneath EPR-inactive layers, and further away from the MOUSE. Including lead white as an overlayer is of particular significance because it is challenging to
see through lead white with X-ray fluorescence [
23,
24,
25,
26]. The same layered measurement scheme was then applied to another difficult case where both the upper and lower layers possessed an EPR signal, in which the Han blue, Egyptian blue, and ultramarine blue samples were used as the two layers. This is a particularly challenging task for some techniques considering that the pigments are similarly colored, and Han blue and Egyptian blue are chemical isomorphs.
Lastly, the spatial imaging capability of the MOUSE to image a hidden underlayer is demonstrated using a sample design printed with the black ferrimagnetic pigment magnetite and covered with a uniform layer of the same pigment.
2. Background
The background of LFEPR spectroscopy for cultural heritage studies was presented previously by our group [
20,
21,
27]; therefore, we offer a shorter version of the essentials here and direct the reader to any one of these references for more detail.
Electron paramagnetic resonance spectroscopy is based on the absorption of photons with Larmor frequency
ν and energy
E by matter with unpaired electrons when placed in an external magnetic field
B. In cultural heritage research, the unpaired electron, and consequently the EPR signal, is associated with pigments with unpaired electrons such as stable free radicals, as is the case with ultramarine and charcoal, or transition metal complexes found in many old-world pigments [
27,
28]. Unless damaged by ultraviolet radiation, organic binders do not contain unpaired electrons and consequently do not contain an EPR signal.
The relationship between ν and
B is given by Equation (1), where β and h are physical constants known respectively as the Bohr magneton and Planck’s constant, and g is the Landé g-factor, an intrinsic constant of the specific paramagnetic matter containing unpaired electrons.
Continuous wave EPR spectra are recorded by sending a fixed ν into the sample while scanning B. A spectral absorption appears when Equation (1) is satisfied. Spectral absorptions appear as the first derivative of an absorption as a function of B because magnetic field modulation at frequency fMod and amplitude BMod, and phase sensitive detection at fMod, are employed to improve the signal-to-noise ratio (SNR) in a spectrum. Other parameters that influence the signal quality are the B field sweep width and rate, number of points in a spectrum (NPTS), and time constant (RC).
The EPR MOUSE [
19] is an extension of a low frequency EPR spectrometer [
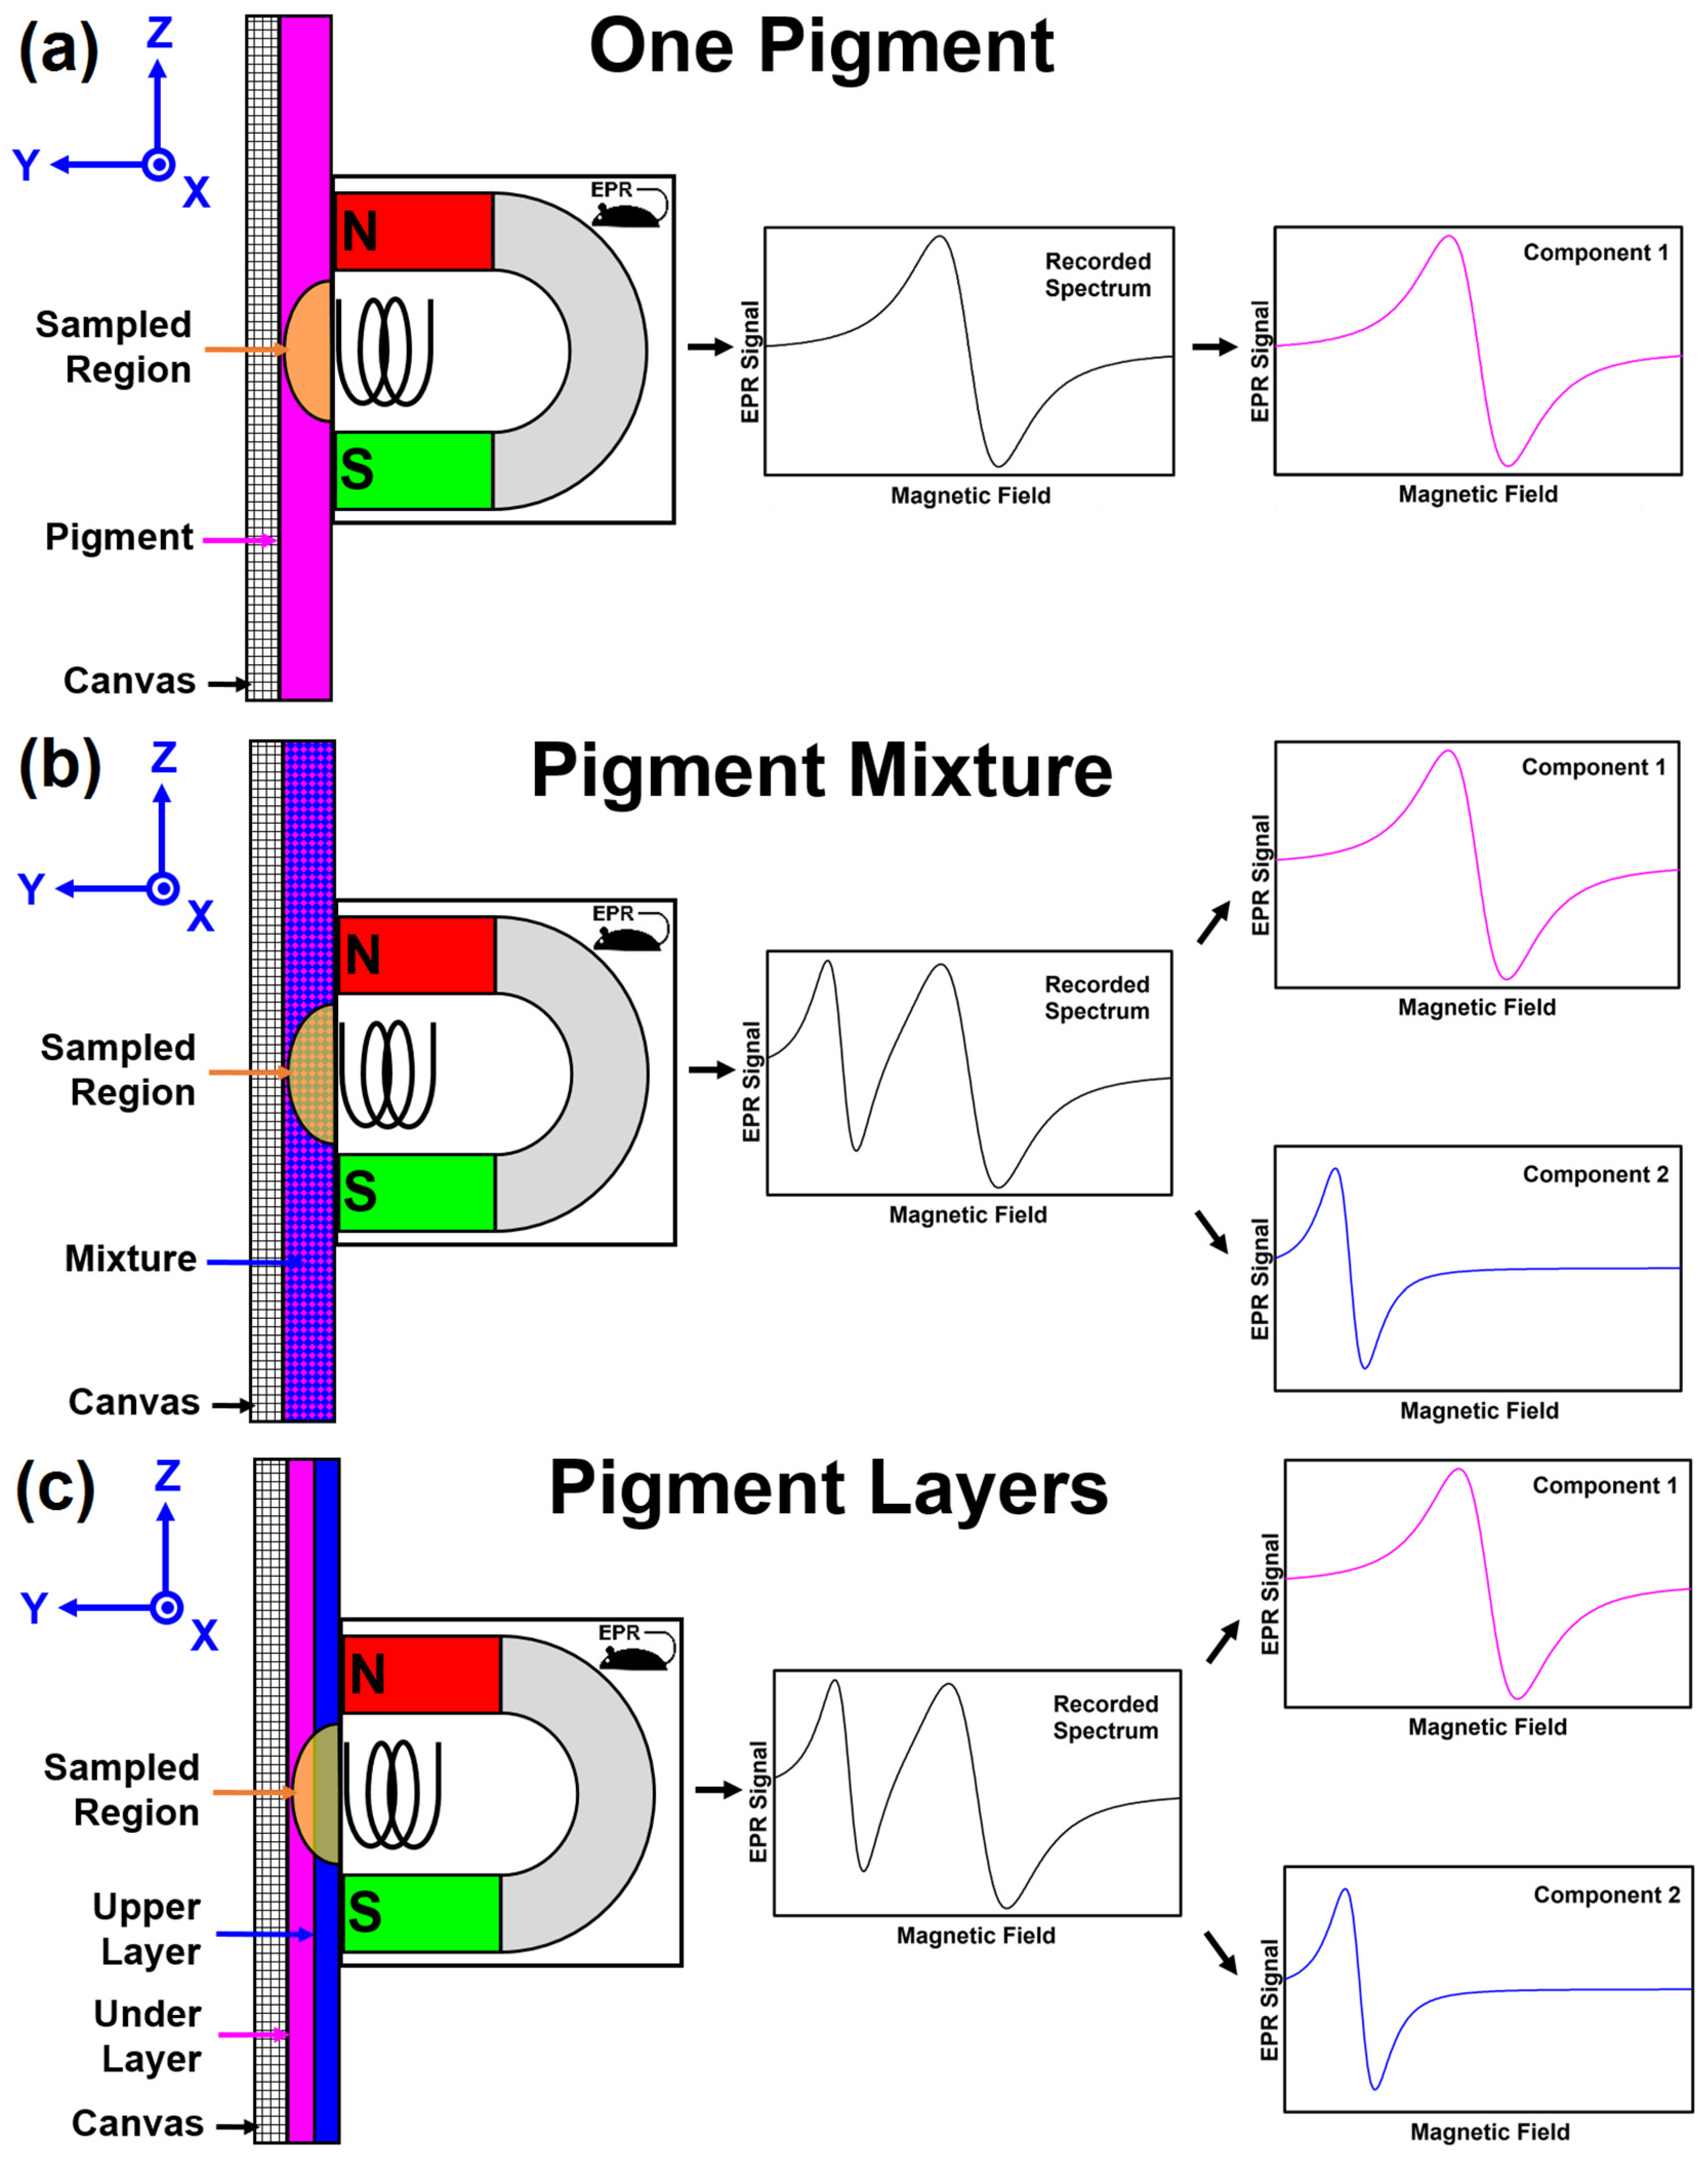
29], which allows EPR spectroscopy to be performed noninvasively on the surface of any sized object and makes an LFEPR instrument more portable. The current MOUSE is approximately 9 cm in diameter, 10 cm long, and connected to the LFEPR by two narrow cables, which can be 1 to 10 m long. The LFEPR spectrometer has a 60 × 75 cm footprint. The concept of the EPR MOUSE is depicted in
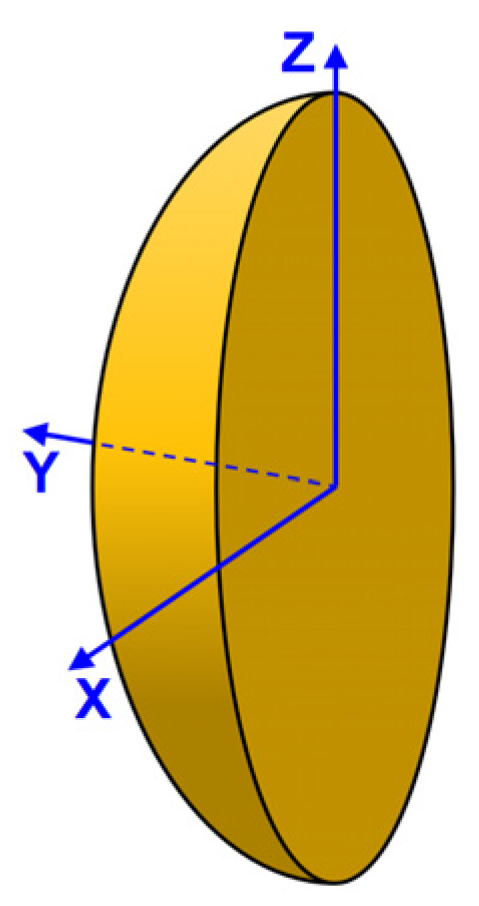
Figure 1. The MOUSE, containing the magnet and radio frequency (RF) transmit and detect surface coil, is placed against the painted surface, such as a piece of canvas. There is a sampled region adjacent to the RF surface coil in the geometric shape of a solid ellipsoidal cap with the flat surface against the MOUSE (See
Figure 2). At the surface of the MOUSE (
Y = 0), the sampled region has the shape of an ellipse with minor and major diameters of 3.5 mm and 5 mm in
X and
Z, respectively [
22]. As distance
Y from the MOUSE surface increases, the size of the elliptical-shaped sampled region decreases.
The approximate depth of the sampled region in Y is 2 mm; however, the exact depth for planar samples parallel to the XZ plane will be determined in this study. The EPR signal from the sampled region as a function of the magnetic field (S(B)) is the EPR spectrum. This recorded spectrum is acquired as the magnetic field that is scanned from 0 to approximately 51 mT. The spectrum is interpreted by visual examination or a computer algorithm to determine the paramagnetic pigment in the paint.
The same MOUSE can be used to examine homogeneous mixtures of pigments in a paint. As presented in
Figure 1b, the MOUSE is now placed against a surface with a paint containing two pigments. An EPR spectrum of the surface is recorded in the same way as with a single pigment. The recorded EPR spectrum now contains the weighted sum of the spectra of the two pigments, with the weighting factor (
fi) of each pigment
i being proportional to the amount in the sampled region. A spectral unmixing algorithm is used to determine the two pigments present in the recorded spectrum.
When the surface contains two layers that lie within the
Y dimension of the sampled region (See
Figure 1c), the recorded spectrum will still be the sum of the spectra from the components in the sample. Now the weighting is not only dependent on the amount of each pigment, but the distance of the pigment from the coil. In other words, the signal is also weighted by the spatial sensitivity of the EPR MOUSE. The same spectral unmixing algorithm is used to determine the two pigments present in the recorded spectrum. Currently, the unmixing cannot be done quantitatively because there are too many unknowns (concentration, layer thickness, and layer depth) in the determination.
The spectral unmixing algorithm was described previously [
21,
22] and summarized here. A library of EPR spectra
Si(
B) as a function of magnetic fields exists for possible pigments
i in a painting. The spectrum for a mixture or layers of pigments
S(
B) is a weighted sum of the
Si(
B) spectra,
An unmixing algorithm finds values for fi that minimize the sum of the squares of the difference between the experimentally recorded spectrum (SExperimental(B)) and the calculated spectrum based on Equation (2) (SCaculated(B)). The algorithm utilizes a least squares approach based on a generalized reduced gradient nonlinear solving method to find the fi values that reproduce an experimental spectrum of a mixture or layered sample. In a homogeneous mixture of two pigments, the weighting factor is proportional to the relative concentrations of the two pigments. In a layered sample, the weighting factor also depends on the distance of the pigment from the surface of the MOUSE. Pigments further away from the EPR MOUSE, such as the underpainting, will possess a smaller fi than those at the surface.
The unmixing algorithm can be applied to a spectrum from a point, thus producing pigment information for a single location [
21], or to a spatial-spatial-spectral data set for a painting, thus producing pigment maps for the painting [
22]. When a painting contains a single pigment with a spatial variation in the concentration, either from under and overlayers or from different concentration applications, the unmixing process is not necessary. The EPR spectrum represents one pigment and the signal at any
B value in the spectrum will be proportional to the amount of pigment. Of course, the B value with the best SNR is preferable.
4. Depth Sensitivity Study
Sensitivity is defined as the amount of signal per unit amount of sample. Since the MOUSE is placed against the sample, depth in the sample and distance from the MOUSE are synonymous. The sensitivity as a function of distance from the EPR MOUSE is the depth sensitivity and determines the ability of the MOUSE to detect a signal from pigment layers beneath the surface layer. The depth sensitivity was determined using a thin sheet standard and a micrometer positioning system. The standard was a 100 μm thick, 1 × 1 cm sheet of the EPR stable free radical DPPH (2,2-diphenyl-1-picrylhydrazyl, MilliporeSigma, Burlington, MA, USA) in epoxy. The sheet was positioned on the micrometer positioning system so that it was always parallel to the surface of the MOUSE and could be moved from 0 to 2.5 mm from the surface of the MOUSE in steps of 100 μm. The spectral acquisition parameters, optimized for DPPH, are presented in
Table 1.
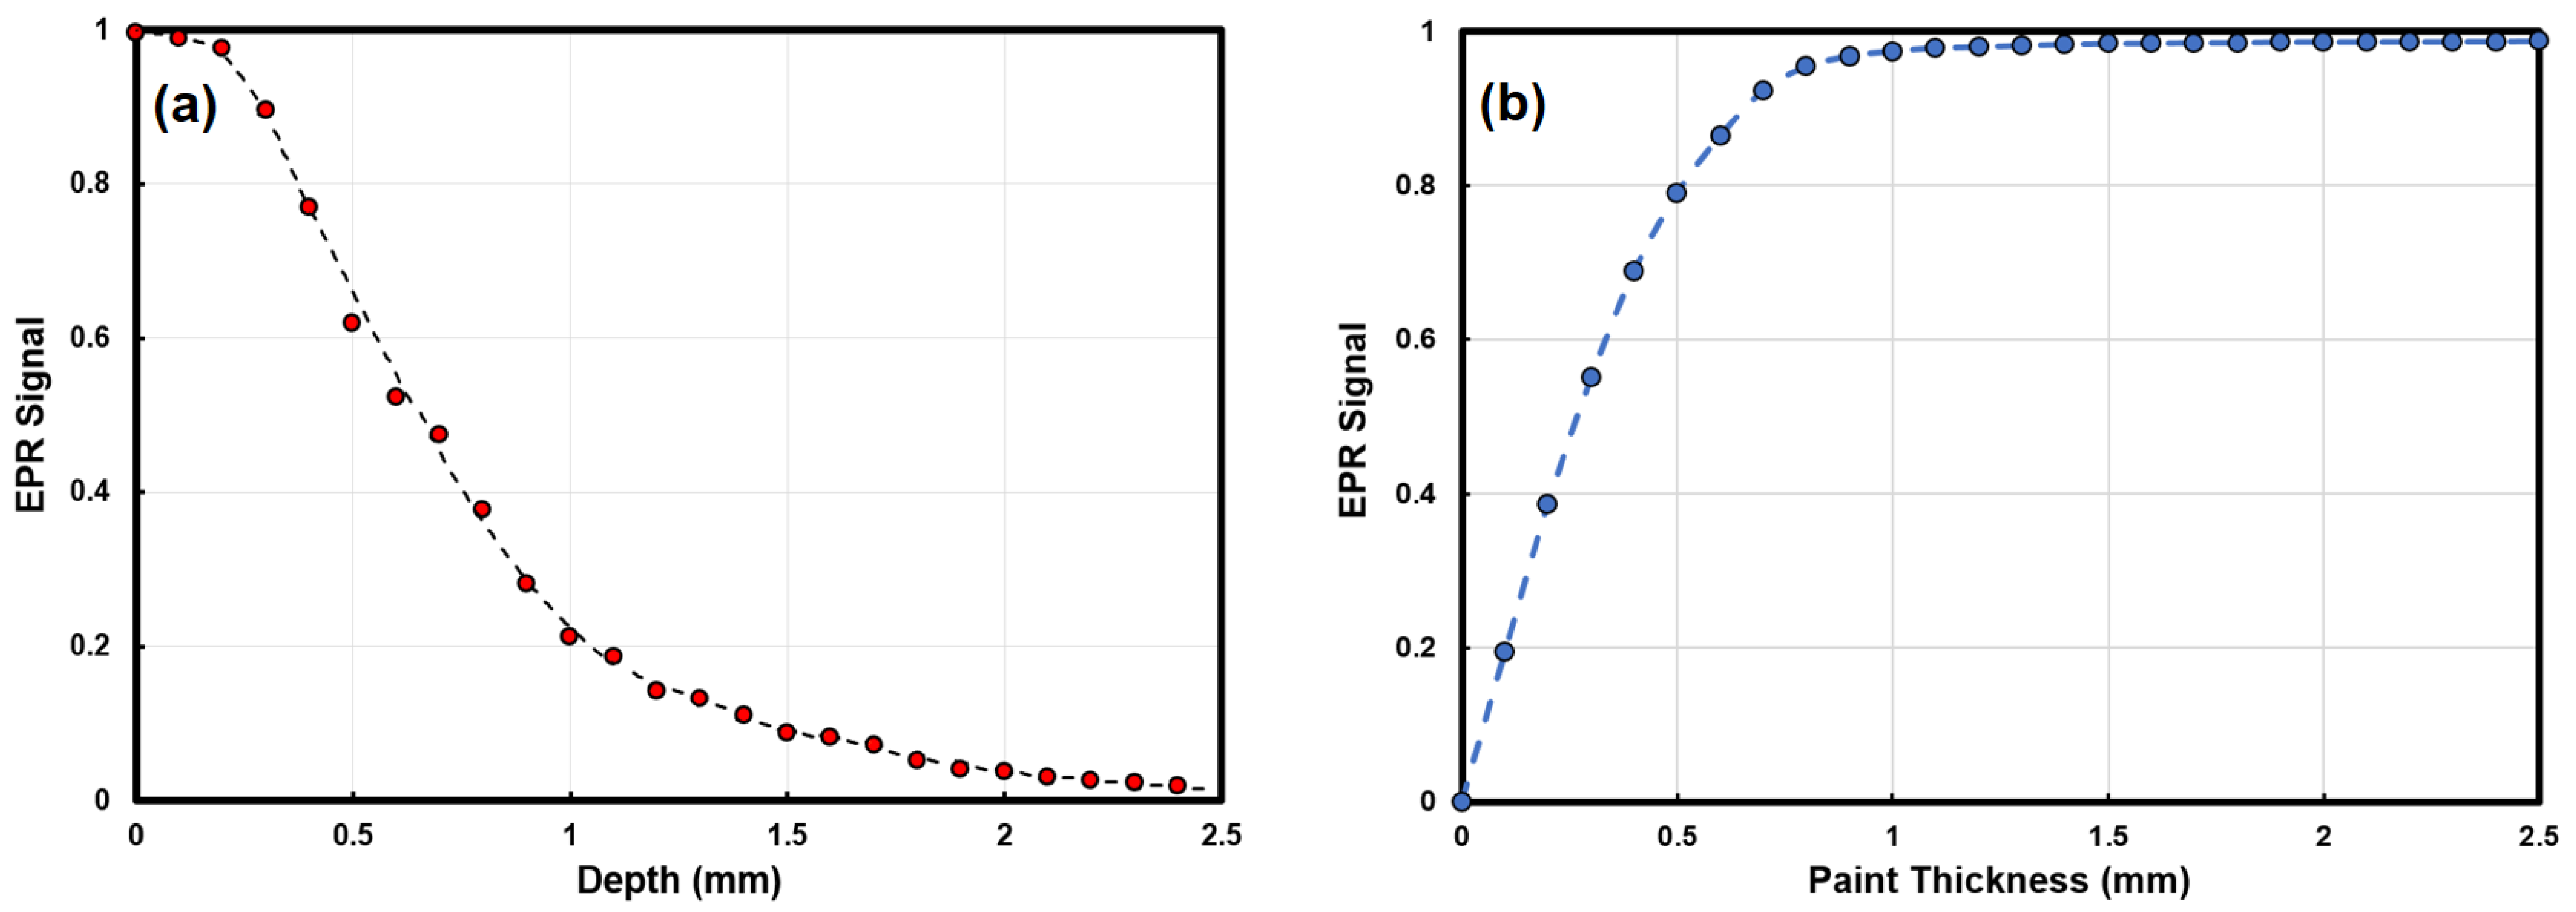
The EPR signal from the DPPH in an epoxy sheet sample, measured as the peak-to-peak amplitude of the first derivative spectral signal, is plotted as a function of the distance of the sheet from the surface of the MOUSE and presented in
Figure 3a. This plot shows the expected decrease in EPR signal with distance from the surface. The shape is to be expected, assuming the signal in this case is proportional to the area defined by the intersection of the thin sheet with the cap at various
Y distances from its base.
This data was used to calculate the predicted EPR MOUSE signal as a function of sheet thickness by summing up the contributions from a range of depths in
Figure 3a corresponding to a given sheet paint thickness (See
Figure 3b). For example, the predicted EPR signal for a 300 μm thick layer of paint is calculated by summing the signals in
Figure 3a from the sheets at depths less than 300 μm. This plot starts at zero, increases, and plateaus by 1 mm, meaning that although the signal can be detected up to 2.5 mm from the MOUSE, paint layers greater than approximately 1 mm do not contribute significantly to the overall signal. It is worth noting that
Figure 3a can also be used to predict the relative signals from two different thickness layers of paint at different Y distances from the MOUSE.
Therefore, the EPR signal varies with pigment concentration in a paint layer, the thickness of the paint layer, and the distance of the paint layer from the EPR MOUSE. Because of these dependencies, the EPR MOUSE is a qualitative analytical technique for studying underpaintings.
When two pigment layers are present, it is possible to identify the pigment associated with the upper and lower layers by recording EPR spectra as a function of distance between the MOUSE and the surface. The EPR signal that decreases to zero first is the lower layer.
5. Spectral Identification Study
The purpose of the spectral identification study was to investigate the ability of the MOUSE and the unmixing algorithm to identify the pigments in an over and underlayer.
There were two groups of pigments chosen for this mock-up study. The first group possessed no EPR signal and consisted of micronized titanium white (TiO
2, MakingCosmetics) and lead white (2PbCO
3·Pb(OH)
2, Rublev). The second group, possessing an EPR signal, was ultramarine blue (Na
8Al
6Si
6O
24S
3, Rublev), Egyptian blue (CaOCuO(SiO
2)
4, Kremer), and Han blue (BaOCuO(SiO
2)
4, Kremer). A thin sheet of paint was made by mixing a pigment with an acrylic medium (Liquitex), casting it on glass between thickness spacers, and peeling it off once cross linked and set. The acrylic binder was chosen over the linseed oil used in our previous studies because it polymerizes faster than linseed oil, and like linseed oil, it also does not possess an EPR signal.
Table 2 summarizes the composition of the sheets and their thickness. The composition is presented as the mass fraction of pigment in the pigment plus acrylic mixture. Although every effort was made to homogenize the paint before spreading it to set, small variations in concentration and thickness did exist in the set sheets.
Different pairwise combinations of the five pigments were studied. Sheets were placed on the MOUSE, and pressure was applied with an acrylic arm to keep the sheets in close contact during spectral acquisition. This arrangement mimicked two layers of paint and allowed the same samples to be used for an under and overlayer. Spectral acquisition parameters are listed in
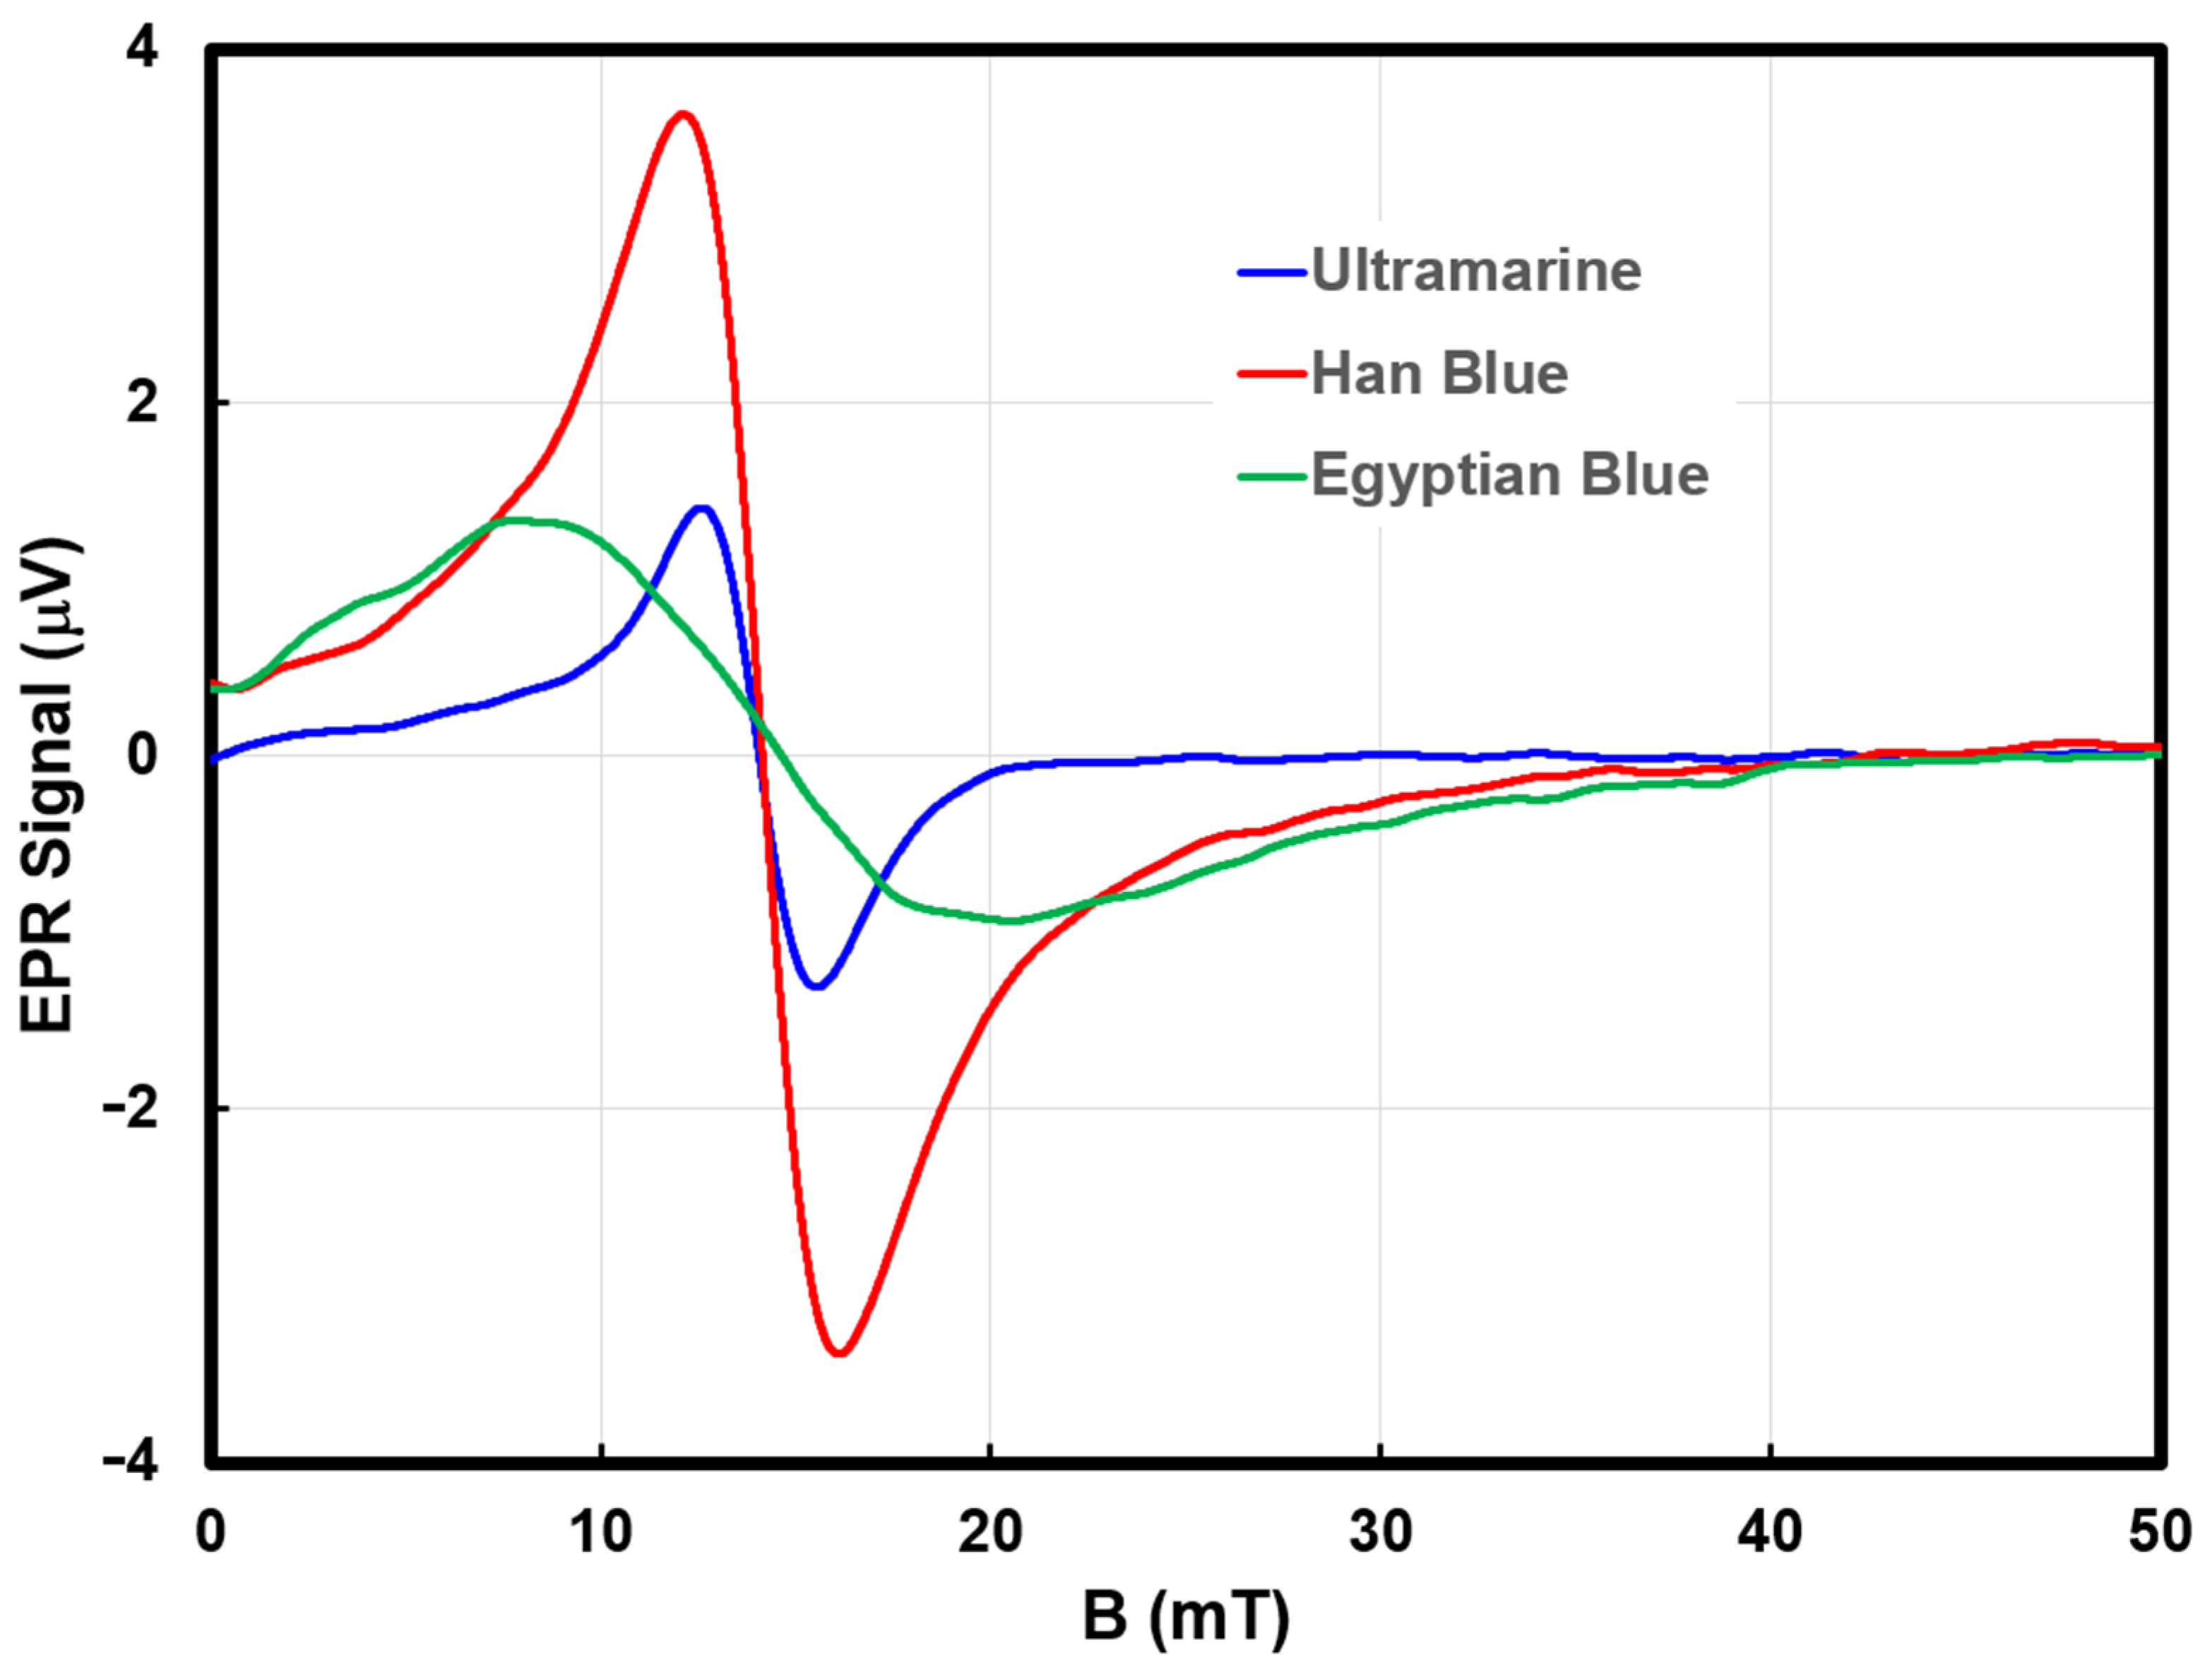
Table 3. The 3 s time constant was selected to minimize high frequency noise while increasing SNR. This choice can affect the observed g factor, thus sample and library spectra were recorded with the same acquisition parameters. The library spectra for the blue pigments are presented in
Figure 4.
The spectral unmixing algorithm was implemented in Microsoft Excel and used the Solver add-in, seeded consistently with
fi = 0 values for Han blue, Egyptian blue, and ultramarine blue. The best fit for the spectrum of a sample is reported as
EPR spectra of each pigment sheet was recorded and analyzed with the spectral unmixing algorithm as a test of the algorithm. This analysis returned only the pigment in the sheet as being present; thus, the correct operation of the algorithm was confirmed (See
Table 4). The effect of spectral noise on the fit was determined by fitting EPR spectra from lead white, a pigment without an EPR signal. In all cases, the amount of each library spectrum needed to achieve a best fit was less than 0.03, establishing the accuracy of the determinations with the current spectrometer SNR.
The next configurations analyzed were sheets of titanium white and lead white over a sheet of a blue pigment. Both the titanium white and lead white pigments do not possess an EPR signal. Therefore, this configuration moved the signal containing sheet 250 to 300 μm from the MOUSE. In all cases, as presented in
Table 4, the algorithm returned the correct underlayer pigment as the primary component in the spectrum for this configuration. The fraction of the library spectrum needed to reproduce the experimental spectrum was less than one, indicating that the underlayer was further away from the MOUSE than the overlayer immediately against the MOUSE. In the case of titanium white over Han blue, the algorithm needed 71% of the Han blue library spectrum and 3% of the Egyptian blue library spectrum to achieve the best fit. This small amount of Egyptian blue changed the fit from 0.0018 to 0.0015 and produce an indiscernible visual difference in the fit spectrum.
The final configuration examined was one where both the over and underlayers possessed an EPR signal. The six pigment combinations are presented in the bottom six rows of
Table 4. In all six combinations, the pigment with the largest
fi value corresponded to the surface layer, and the next smaller
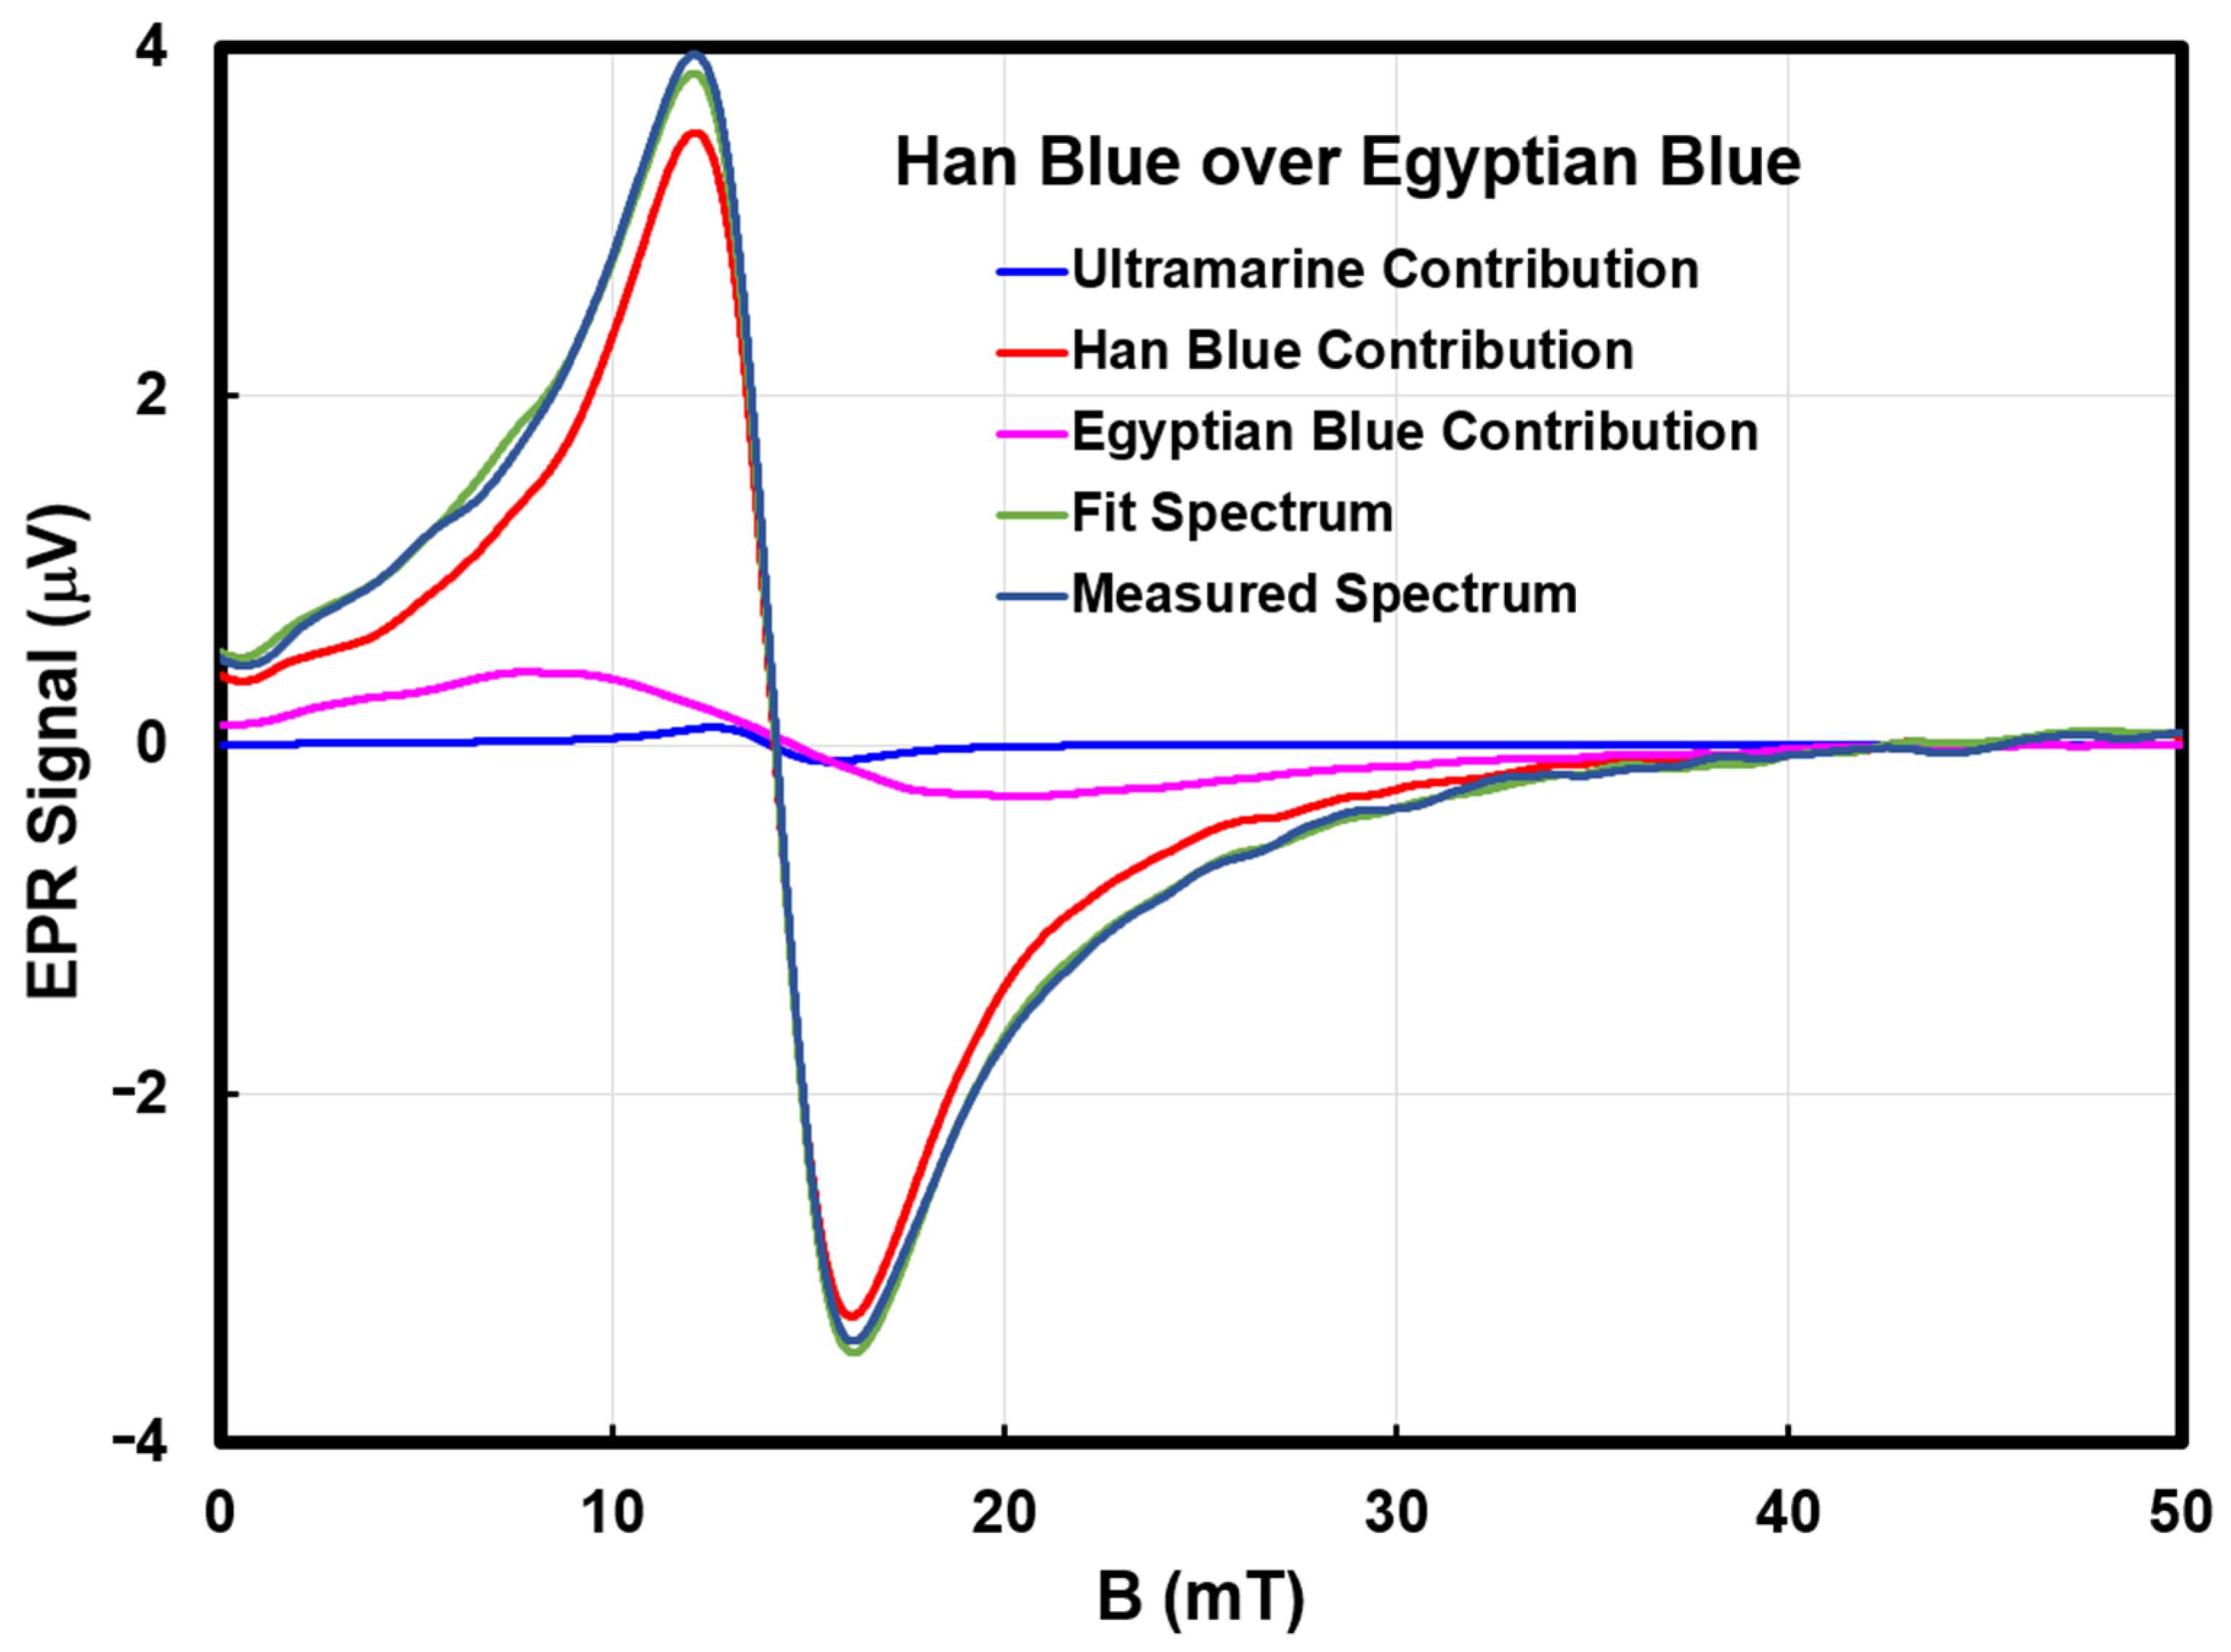
fi corresponded to the underlayer. In all but two cases, the third component choice was zero. The two exceptions were Han blue over Egyptian blue, where the algorithm required 7% of the ultramarine blue spectrum, and ultramarine blue over Han blue, where the algorithm required 2% of the Egyptian blue spectrum. We attribute both to spectral noise from baseline drift and plan to address this in a later hardware upgrade. We present the worst-case scenario of the two (Han blue over Egyptian blue) experimental, calculated, and component spectra as an example in
Figure 5. The contribution from ultramarine blue is small on the scale compared to the other two pigment contributions.
When the surface layer has the same thickness and concentration as the library sample, the fi value for the surface layer should approximately equal one. Deviations are attributed to small variations in the sheet thickness and pigment concentration. Because fi is the amount of the library spectrum and not the amount of the pigment, it is possible to have fi > 1 with other samples. With more precise knowledge of the three-dimensional sensitivity of the MOUSE, it may be possible to represent fi as an actual concentration.
Single point data acquisition would generally not be used searching for an underpainting. Instead, data for an entire image would be acquired, creating a three-dimensional spatial-spatial-spectral image. The spectral unmixing algorithm would then be applied to all points in the spatial dimensions producing images of each pigment. The false presence of small amounts of pigments would appear as background noise in the images.
Although this work addressed a single underlayer, the technique should be applicable to multiple underlayers provided that the EPR signal as predicted in
Figure 3 is greater than the noise.
6. Spatial Imaging Study
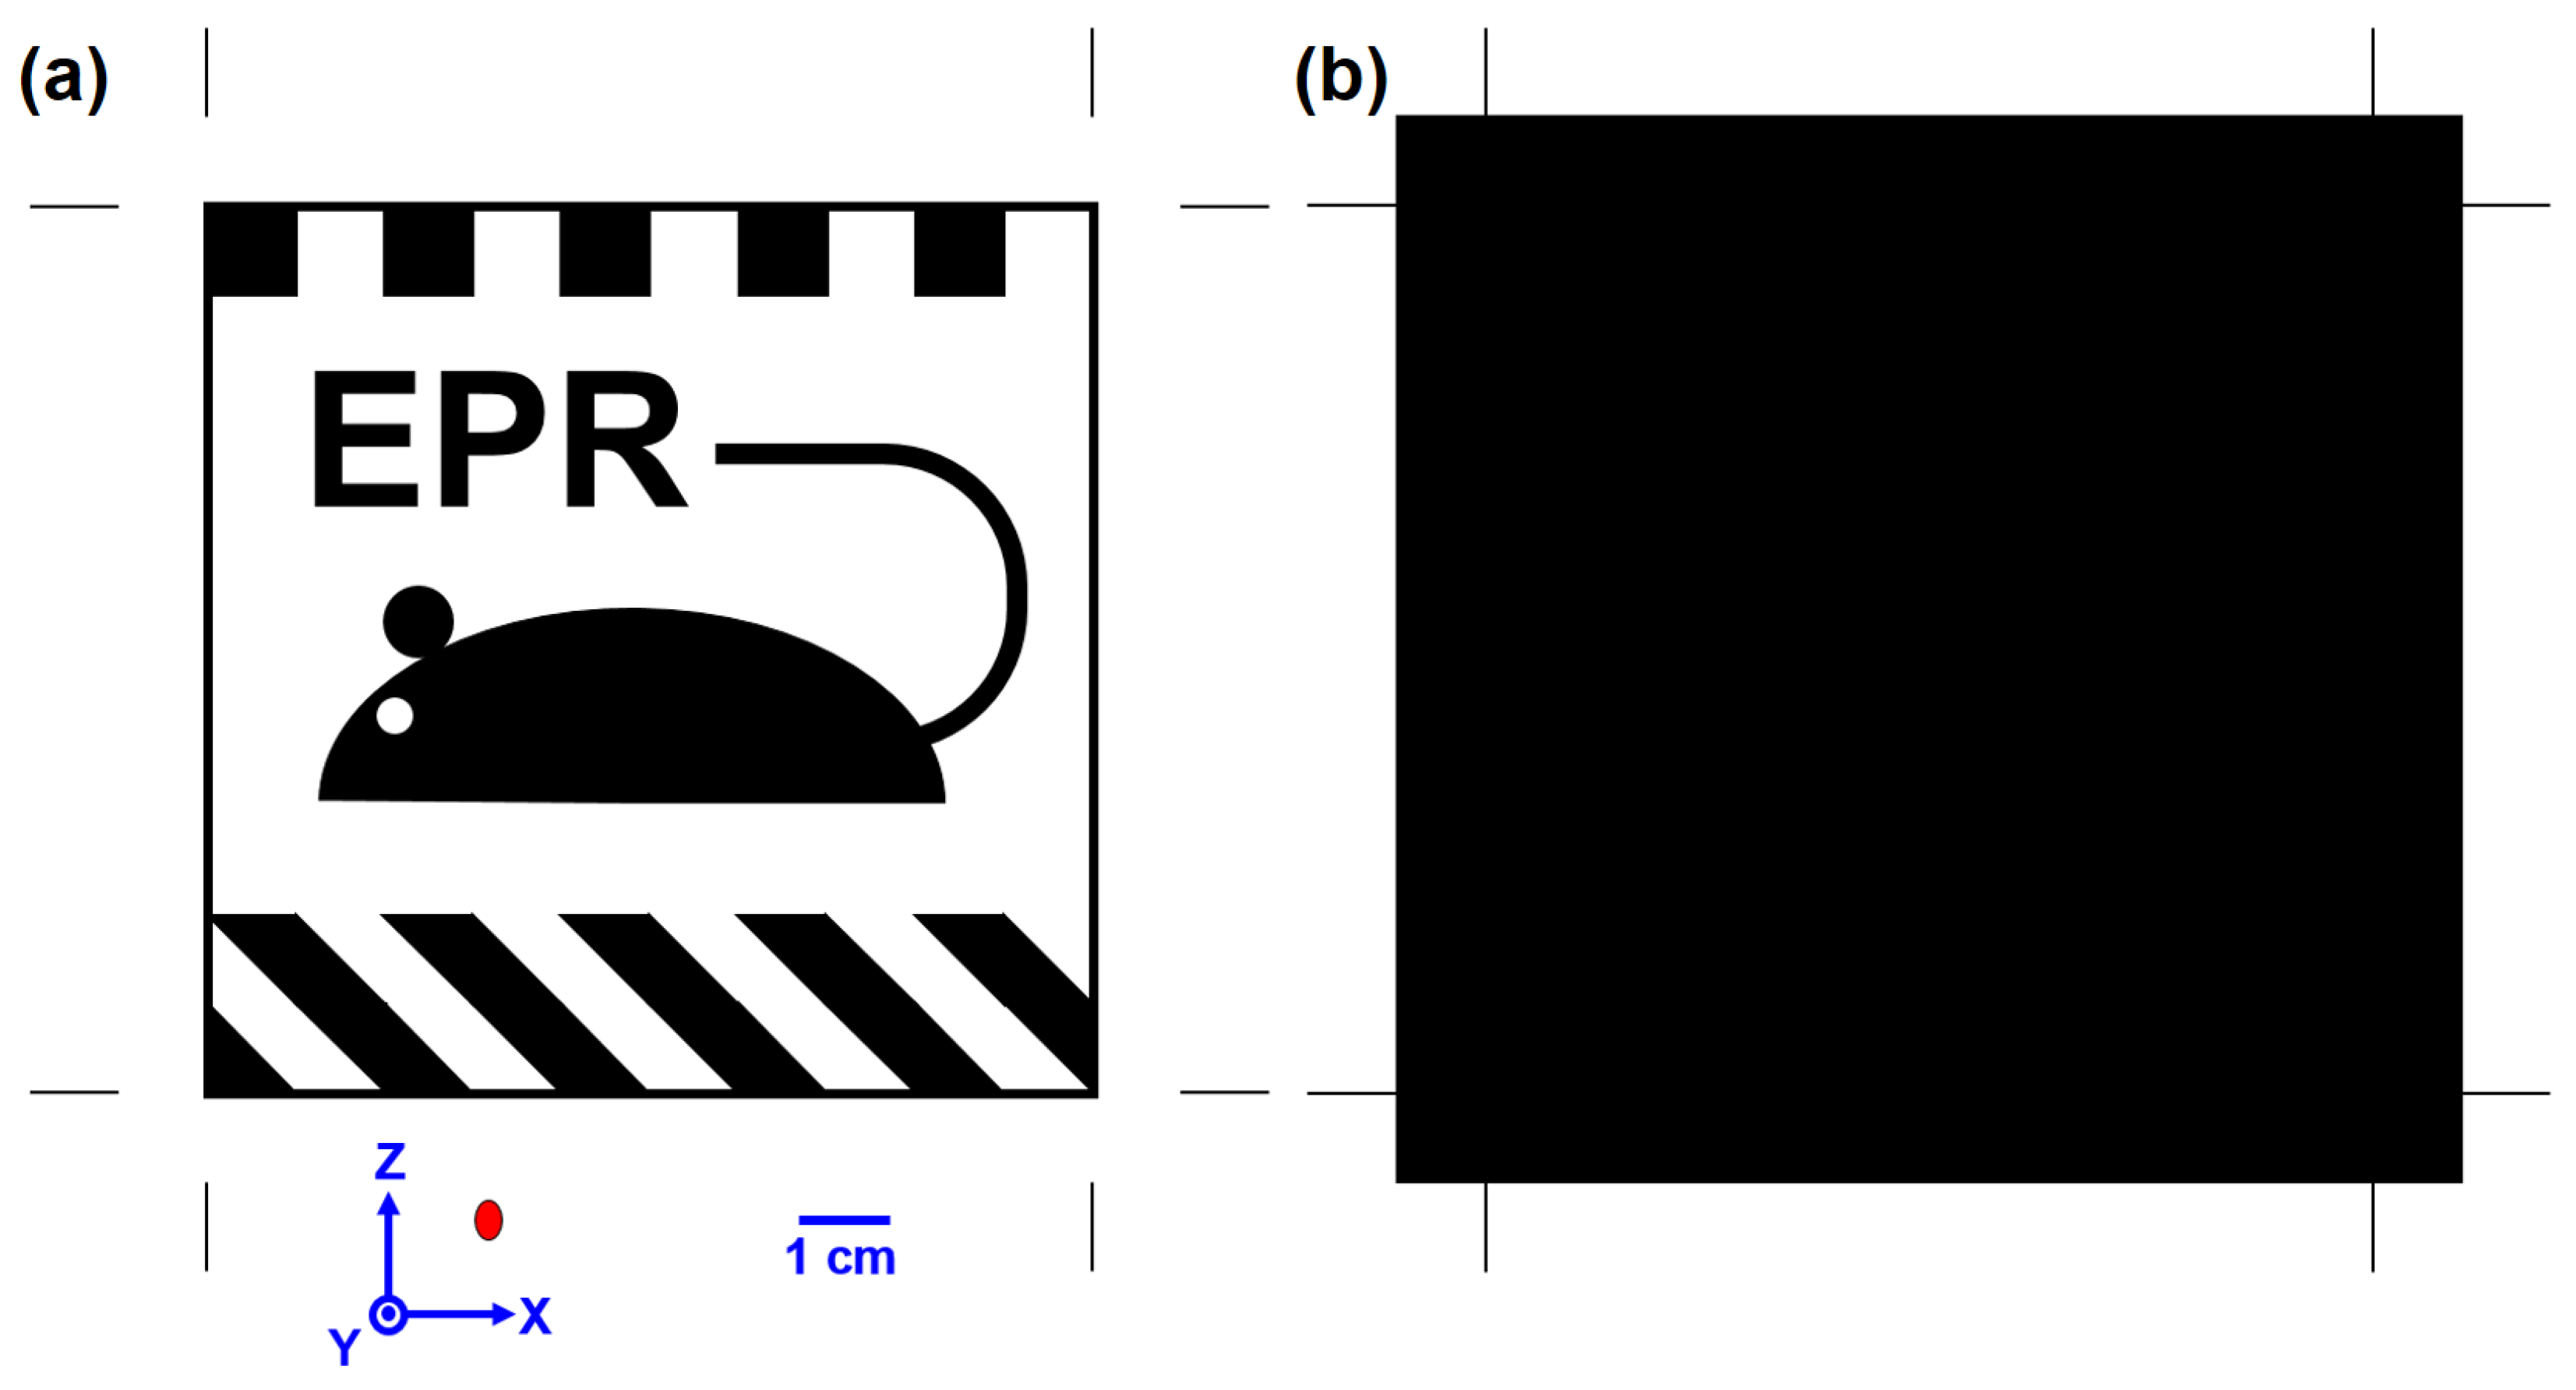
A 10 × 10 cm test image was designed to assess the ability of the EPR MOUSE to image an underpainting. It consisted of vertical and diagonal 1 cm wide patterns and an insignia of the EPR MOUSE. The insignia had 15 mm high Arial font letters with a 3 mm wide line weight. The smallest insignia features were the 2.2 mm wide mouse tail and the 1 mm wide box line around the outlining. The smallest void in the pattern was a 4.2 mm diameter circle of the mouse eye (See
Figure 6).
The test print on paper was created by electrophotographically printing the image on the paper using an HP P1102w LaserJet printer. This type of printer utilizes magnetic brushes and a fine powder of magnetite black (Fe
3O
4) particles in polyethylene [
31]. The printing process leaves a 5–10 μm thick layer of the pigment fused to the paper with polyethylene. A second identical print was made and then covered with a 12 × 12 cm square layer of fused toner. This print represented a magnetite underpainting covered with a uniform thickness overpainting of magnetite.
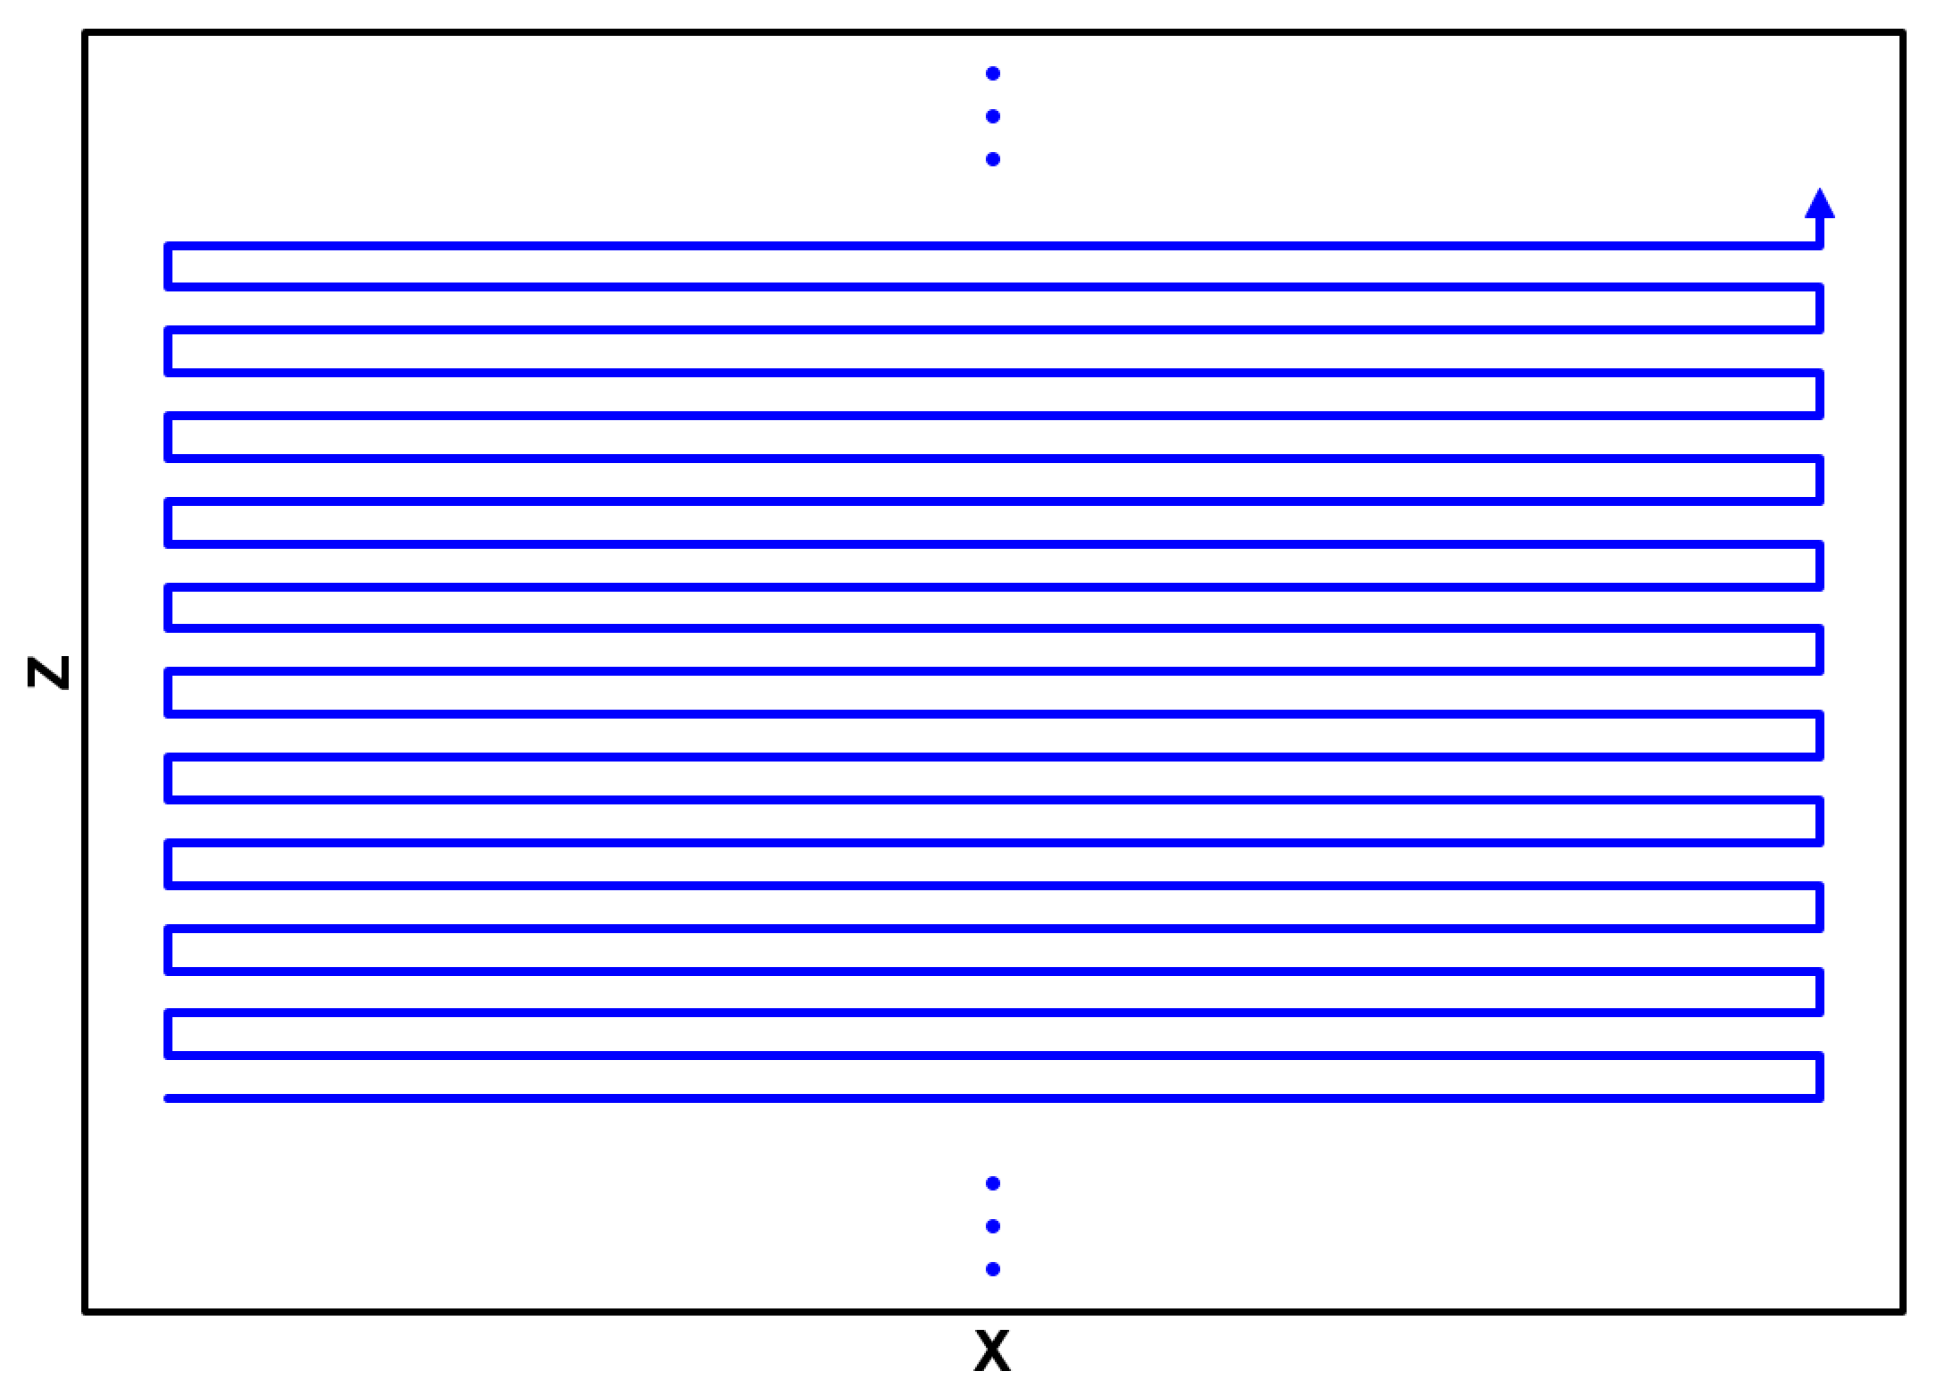
A two-axis micrometer-based positioning system was utilized to move the painting relative to the EPR MOUSE so that the print was scanned in the raster pattern depicted in
Figure 7.
Figure 6a presents the orientation of the print on the EPR MOUSE and coordinate system of the positioning system. Also presented at the bottom of
Figure 3a is a red oval indicating the size and orientation of the region sampled by the MOUSE. The
X-axis was driven with a stepper motor at a uniform rate, back and forth across the painting, while the
Z-axis was advanced manually after each scan in the
X direction. The scanning process was similar to that described previously [
19], except for the utilization of the stepper motor to drive the
X direction. The ferrimagnetic signal from magnetite on the EPR spectrometer is broad and featureless [
16], implying that the EPR signal was insensitive to the exact
B value. A magnetic field of 18 mT was used to record the signal because it presented a strong signal without the need to drive the magnet at full current for the duration of the imaging. The EPR acquisition parameters are listed in
Table 5.
The individual scans in
X were processed by a MATLAB (MathWorks) program that flipped the direction of the even-numbered rows and registered all rows. The Point spread function (PSF) [
27] of the imaging system has a 3.5 × 5 mm oval shape, mirroring that of the sensitive region. Therefore, the test target was over sampled 19× in the X direction and 5× in Y.
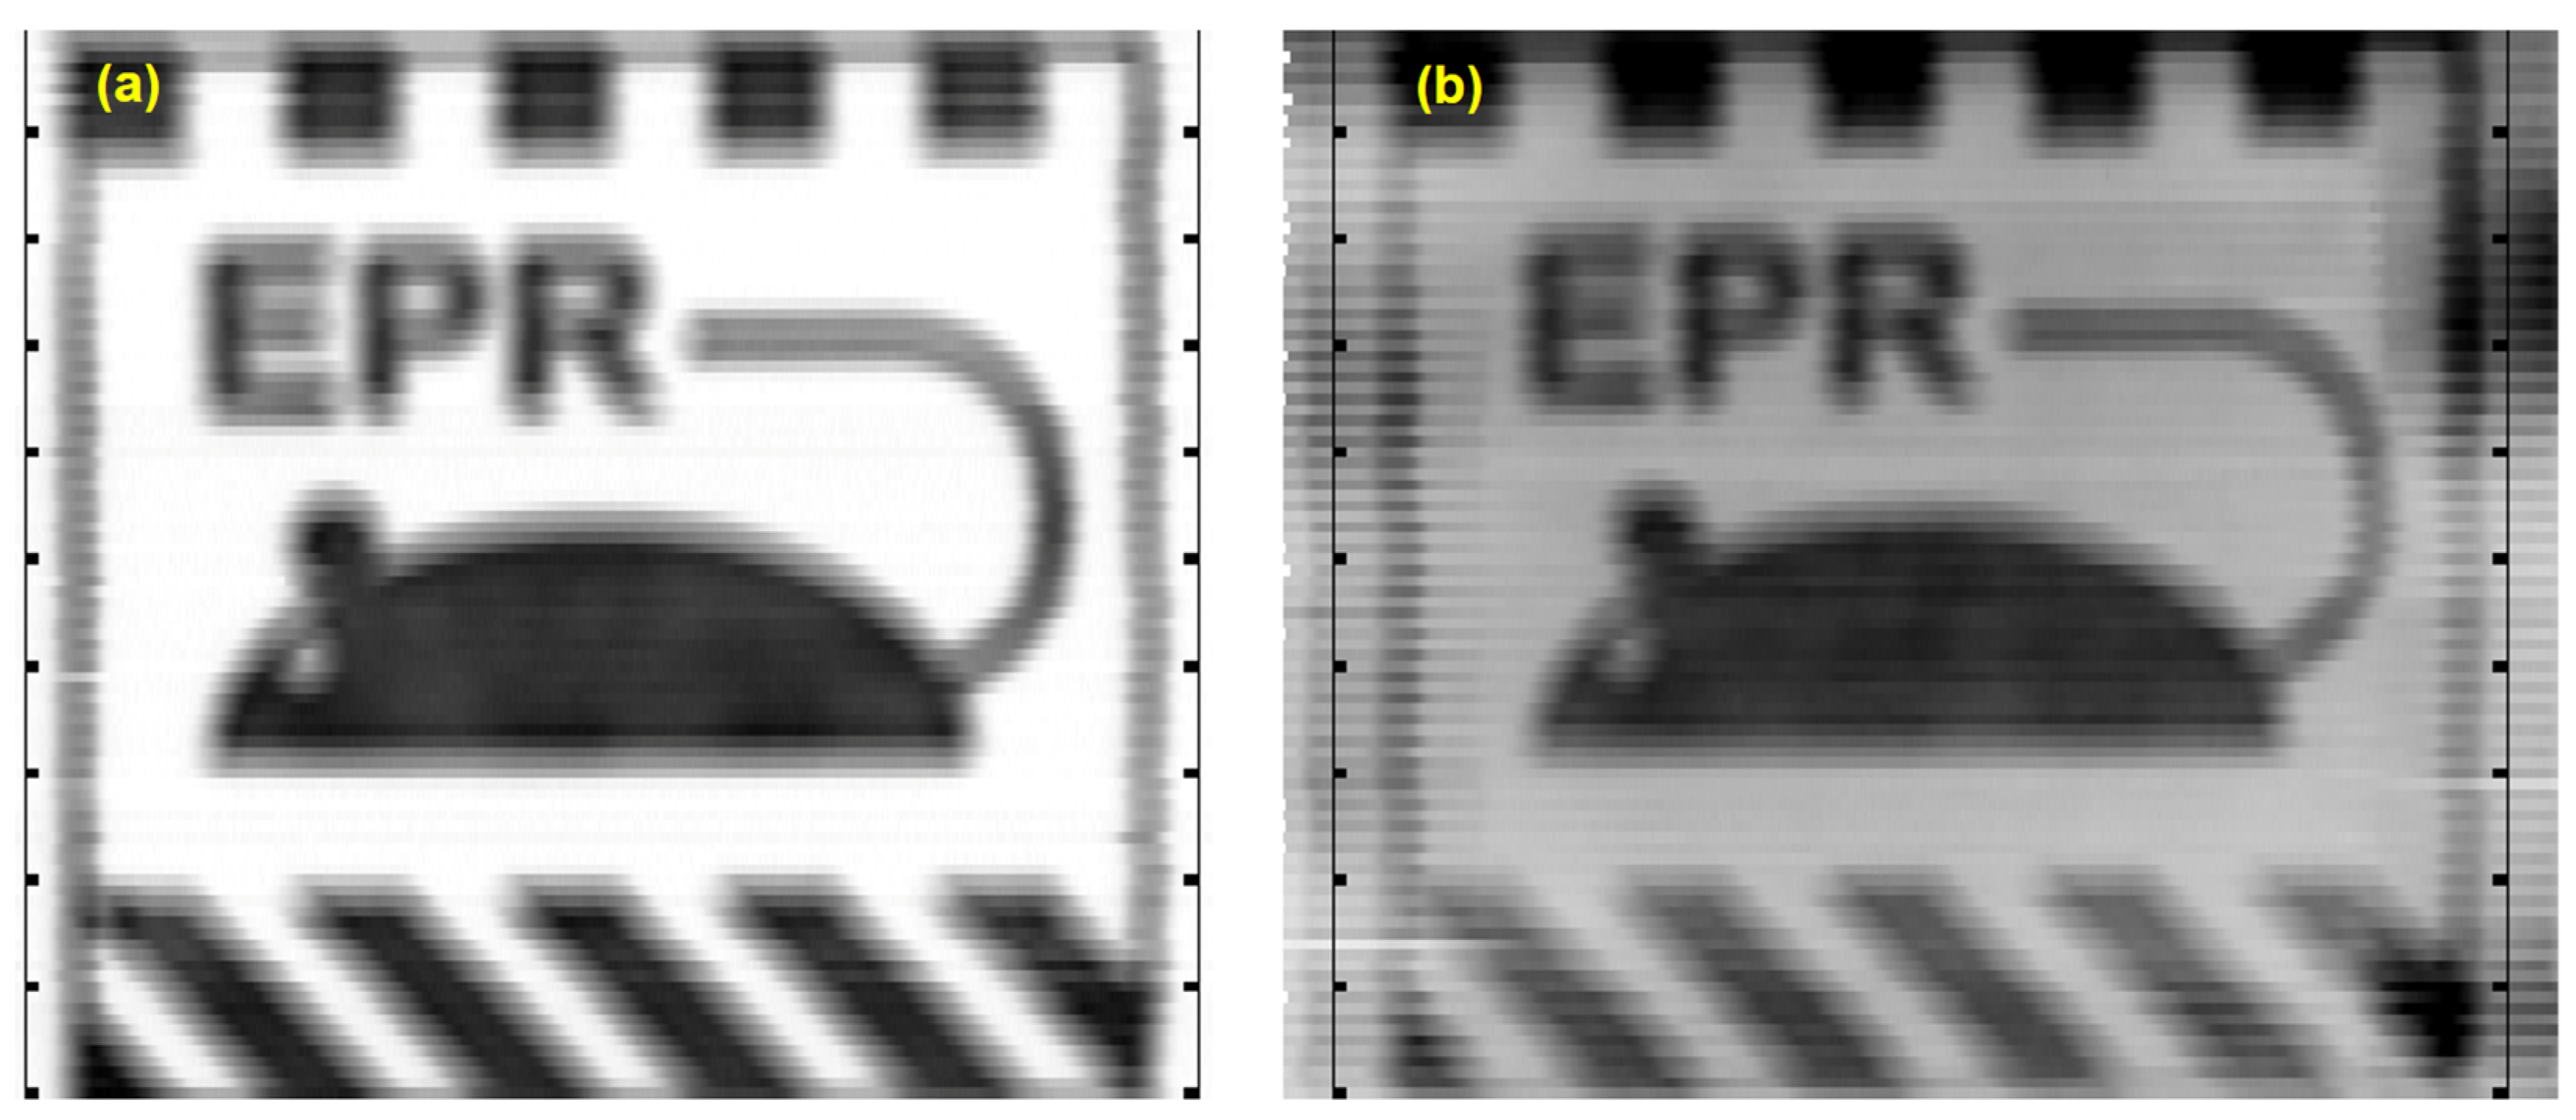
The EPR image of the spatial distribution of the 5–10 μm thick, black magnetite pigment in the 10 × 10 cm print is presented in
Figure 8a. The rulers to the left and right of the image were added in post-processing as a reference. The window and level (brightness and contrast) values were adjusted to display signals above the background noise threshold.
Figure 8a is the optimal image of the print, because the MOUSE is directly against the surface of the print without any overlayer. The image compares favorably to the optical image of the pigment presented in
Figure 6a, considering the size of the PSF is a 3.5 × 5 mm oval.
Figure 8b is the EPR image of the print covered with a 5–10 μm thick uniform layer of the magnetite in polyethylene pigment. There were two general signal intensities in the data. A lower intensity one for a single layer of magnetite pigment where there was a surface layer over a paper background, and a higher one for two layers comprised of overlayer and underlayer prints. The window and level values were adjusted to display EPR signal intensities approximately greater than that of the surface layer.
The image of the print under the uniform overpainting is degraded compared to the test target image (
Figure 6a) and the EPR image of the underprint (
Figure 8a), but is clearly visible. The intensity of the pigment across the image is more uniform in the print without the overpainting than in the print with the overpainting layer. Since the underpainting print is the same in both cases, we attribute signal intensity variations to variations in the pigment density resulting from the overprinting process. Although laser printers are capable of printing multiple times on the same side of a sheet of paper, they were not designed to do so. This may lead to variations in the surface density of the toner.
All the small features in the print, such as the 1.0, 2.2, and 3.0 mm lines and the 4.2 mm diameter eye, were blurred but visible in both the print without the overpainting and the print with the overpainting layer. This is reasonable as the point spread function is a 3.5 × 5 mm oval.
Figure 8b demonstrates the ability of the EPR MOUSE to image an underpainting covered with a layer of the same pigment. This is a relatively straightforward task for the EPR MOUSE. Paintings with an under and overlayer consisting of multiple paramagnetic pigments will require spectral data at more than a single
B value. Multiple
B values will be necessary for minimally overlapping spectral absorptions such as the example presented in
Figure 1c. For significantly overlapping spectra absorptions, as presented in
Section 5, an entire EPR spectrum will be needed at each
XZ location in the image, as was done by McCarthy for a surface image with the MOUSE [
11].
