1. Introduction
Terahertz (THz) radiation refers to the range of frequencies in the far-infrared region between 3 and 300 cm
−1, or, in terms of wavelength, between 3 mm and 30 μm [
1]. In heritage material studies, this radiation is particularly appreciated for providing a safe and non-invasive method for analyzing objects without posing long-term risks to their chemical stability. In fact, it is non-ionizing and can penetrate many materials that are opaque in the visible and near-infrared frequencies [
2,
3,
4]. When employed with imaging or tomography devices, THz time domain (THz-TD) can enable the investigation of the internal structure of objects and provide information related to their conservation conditions in a completely non-invasive manner [
1,
5,
6].
To the best of our knowledge, and as already reported in a recent paper by Picollo and co-authors [
7], the THz-TD technique has been largely employed to investigate virtual cross-sections and discriminate details such as paint stratigraphy; however, it has never been used in combination with spectroscopy mapping. This work proposes, for the first time, the application of a combined strategy to treat THz-TD image data and retrieve spectral characterization on a real artwork surface, facing the limitations imposed by the technique and inherited by the broad-band spectroscopic approach.
A significant advantage of employing THz radiation is, in fact, the utilization of a broad-band source and simple acquisition procedures for spectroscopic analysis. The characterization of spectra at far-infrared frequencies can yield more specific absorption peaks than those gathered in the mid- and near-infrared regions, as THz waves excite the vibrational modes of molecules and crystalline lattices [
2,
8,
9,
10,
11]. THz-TD spectroscopy provides both signal amplitude and phase spectral information, the former being linked to material absorption, and the latter related to sample thicknesses and density. The complementary determination of these two components of the signal can further enable the direct measurement of the material refractive index.
However, some constraints might limit the method and reduce the technique’s performance. Firstly, the signal-to-noise ratio is one of the primary drawbacks of THz-based technologies, because THz radiation has a high penetration power, and material scattering can significantly reduce the signal [
2,
6,
12]. Secondly, THz spectroscopic analysis is based on the signal normalization from free-path or highly reflecting surfaces, and this causes a well-known limitation in the phase value’s accuracy and, therefore, in the spectrum retrieval. Inherently, the presence of tilting or curvature on the sample surface makes it difficult to extract accurate values of the complex refractive index [
13]. Finally, various additional secondary effects can complicate the analysis of the THz data, such as Fabry–Perot, multiple-scattering, and water vapor in the atmosphere, which pose significant challenges in data pre-processing, particularly when examining heritage artefacts with multiple material layers and uneven surfaces [
4,
14].
In the past 20 years, researchers have been investigating the potential of THz radiation for examining works of art, ranging from oil paintings on canvas to mummies and architectural specimens. One of the earliest applications of THz imaging dates to 2008, when Jackson et al. showed the capability of this technique to uncover graphite underdrawings beneath a lime plaster layer on a mock-up wall painting sample [
14]. In 2010, Fukunaga et al. applied THz imaging to analyze historical mural paintings, comparing the intensity in reflection at far-infrared frequencies with the distribution of pigments determined via Raman and X-ray fluorescence [
3]. Since then, THz imaging has expanded to include the examination of wall painting structure, condition, and hidden depictions [
5,
15,
16,
17,
18]. In 2015, Koch-Dandolo et al. applied THz-TD imaging to an easel painting, investigating its stratigraphy for a suspected hidden portrait vaguely emerged from X-ray radiography [
19]. By employing recursive signal windowing and threshold clipping, the authors clearly isolated the hidden portrait with a good image contrast [
19]. A year later, A. M. Gomez-Sepulveda et al. utilized THz imaging technology on a Mexican work of art to identify concealed paintings beneath the surface and uncover the painting’s history. The researchers used a combination of visible, infrared, X-ray, and THz-TD imaging techniques to conduct a comprehensive analysis of the paintings. THz-TD imaging enabled the identification of three layers at different depths, which correspond to their chronological stratification. This technique also revealed an inscription hidden beneath the current composition, attributing the middle layer to Jose Maria Torrez, thus highlighting its benefits for authentication purposes [
20].
In all these research studies, THz-TD imaging has been applied to obtain virtual cross-sections of inner layers and to uncover signs of previous conservation treatments. While the research conducted so far has thus mainly explored the THz technique in the time-domain, studies on mapping spectral signatures that implicitly tackle the limitations imposed by real art objects have been less frequent. In fact, data obtained by Fourier-transforming THz-TD from a raster-scanned surface constitutes a 3-dimensional hyperspectral cube, where each spectral image is corrupted by blur and noise to an extent that depends on the frequency itself, a consequence of the broad-band nature of the source. The removal of the joint blur and noise issues was proposed only recently by M. Ljubenovic and collaborators [
12]. The authors proposed an approach specifically tailored for broad-band THz-TDI, starting from image restoration methods commonly applied to remote hyperspectral imaging at visible and near-infrared frequencies. The methodology was extended to the acquisition in reflection geometry for opaque objects and demonstrated to effectively cancel the effects of beam shape and reduce noise between 0.25 and 6 THz [
4,
12]. The second problematic condition when dealing with heritage object, i.e., studying uneven surfaces, was tackled by A. Artesani and co-authors in 2023 [
13]. They proposed a self-referenced method to computationally remove surface geometrical curvature and consequently correct the phase value, enabling the determination of more accurate material absorption coefficients [
14,
21].
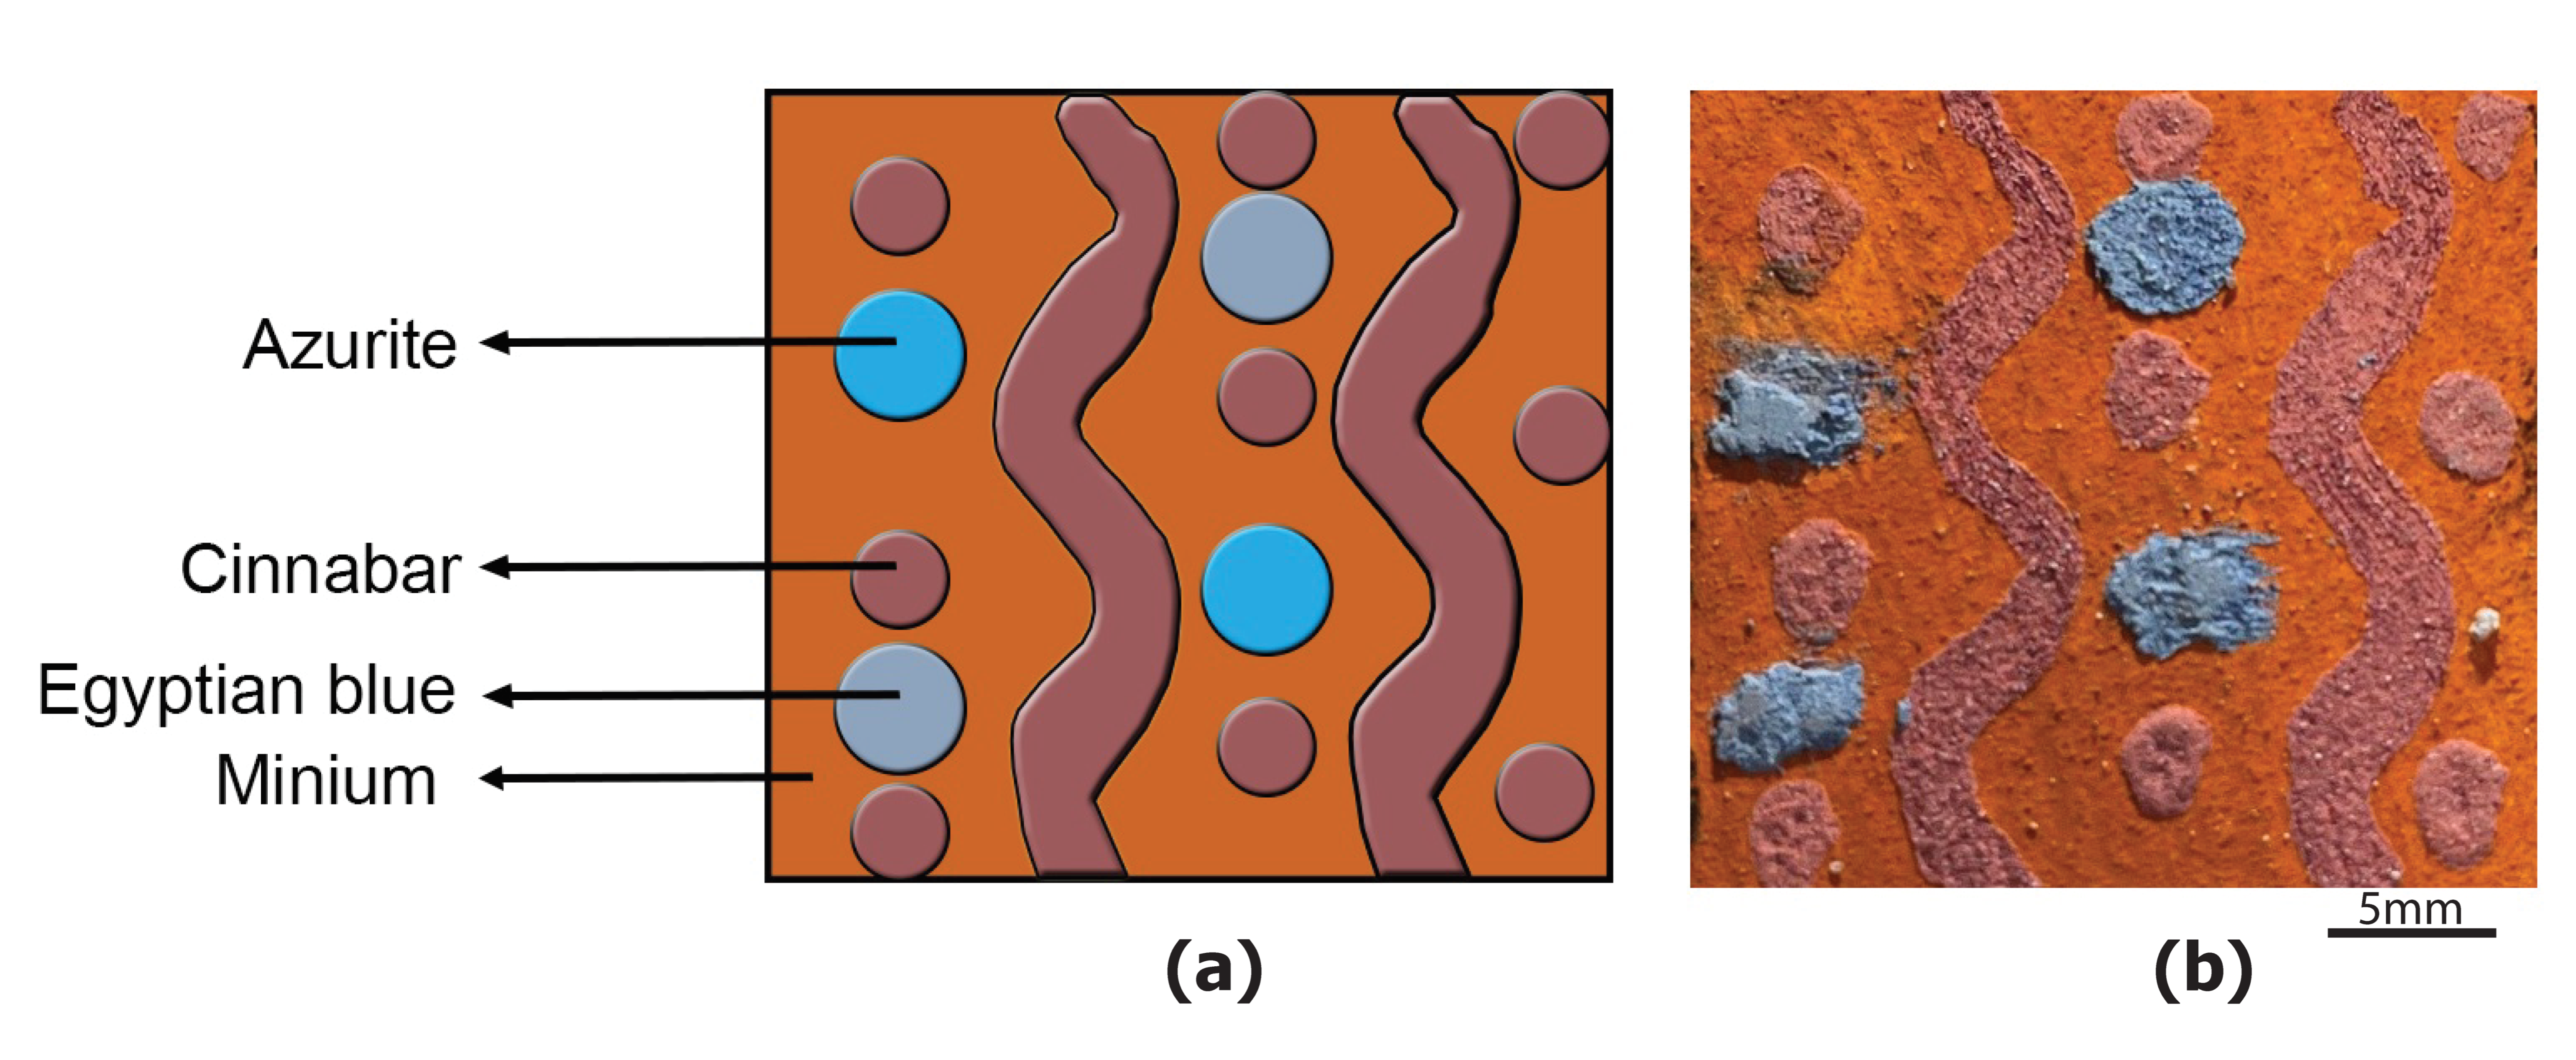
In order to exploit the methods developed so far for THz-TD imaging and spectroscopy, a mock-up sample that mimics an ancient fresco painting was created. The purpose of this mock-up was to illustrate the step-by-step process followed to determine the absorption coefficient value in a pixel-wise characterization and compare the results with point-like measurements performed on mineral pigment pellets [
21]. The pros and cons of the data processing and the strategy used to avoid inaccurate results and determine the spectral signature of the painted surface are presented and critically discussed.
3. Results and Discussion
The first issue to tackle when considering THz-TD back-reflection spectroscopy on a painted object is the surface shape of the sample. The surface geometry of ancient frescoes, for instance, is shaped by the irregularities of the wall and lime plaster underneath. Time domain spectroscopy is inherently affected by these characteristics of the object, as axial misalignment causes a variation of the amplitude and phase of the electric field. Therefore, prior to any spectroscopic analysis, the correction for geometrical distortion must be applied. In this section, the following experimental steps were applied: removal of geometrical distortion of the surfaces, determination of the ToF map of the sample, and calculation of the absorption coefficient in the frequency domain for material identification. This protocol enables the calculation of the spectrum in the far-infrared region associated with the material composition.
3.1. Correction of Geometrical Distortions
The surface of the mock-up sample has several reliefs associated with the paint layers, superimposed to a surface curvature generated by the mortar and lime plaster substrate.
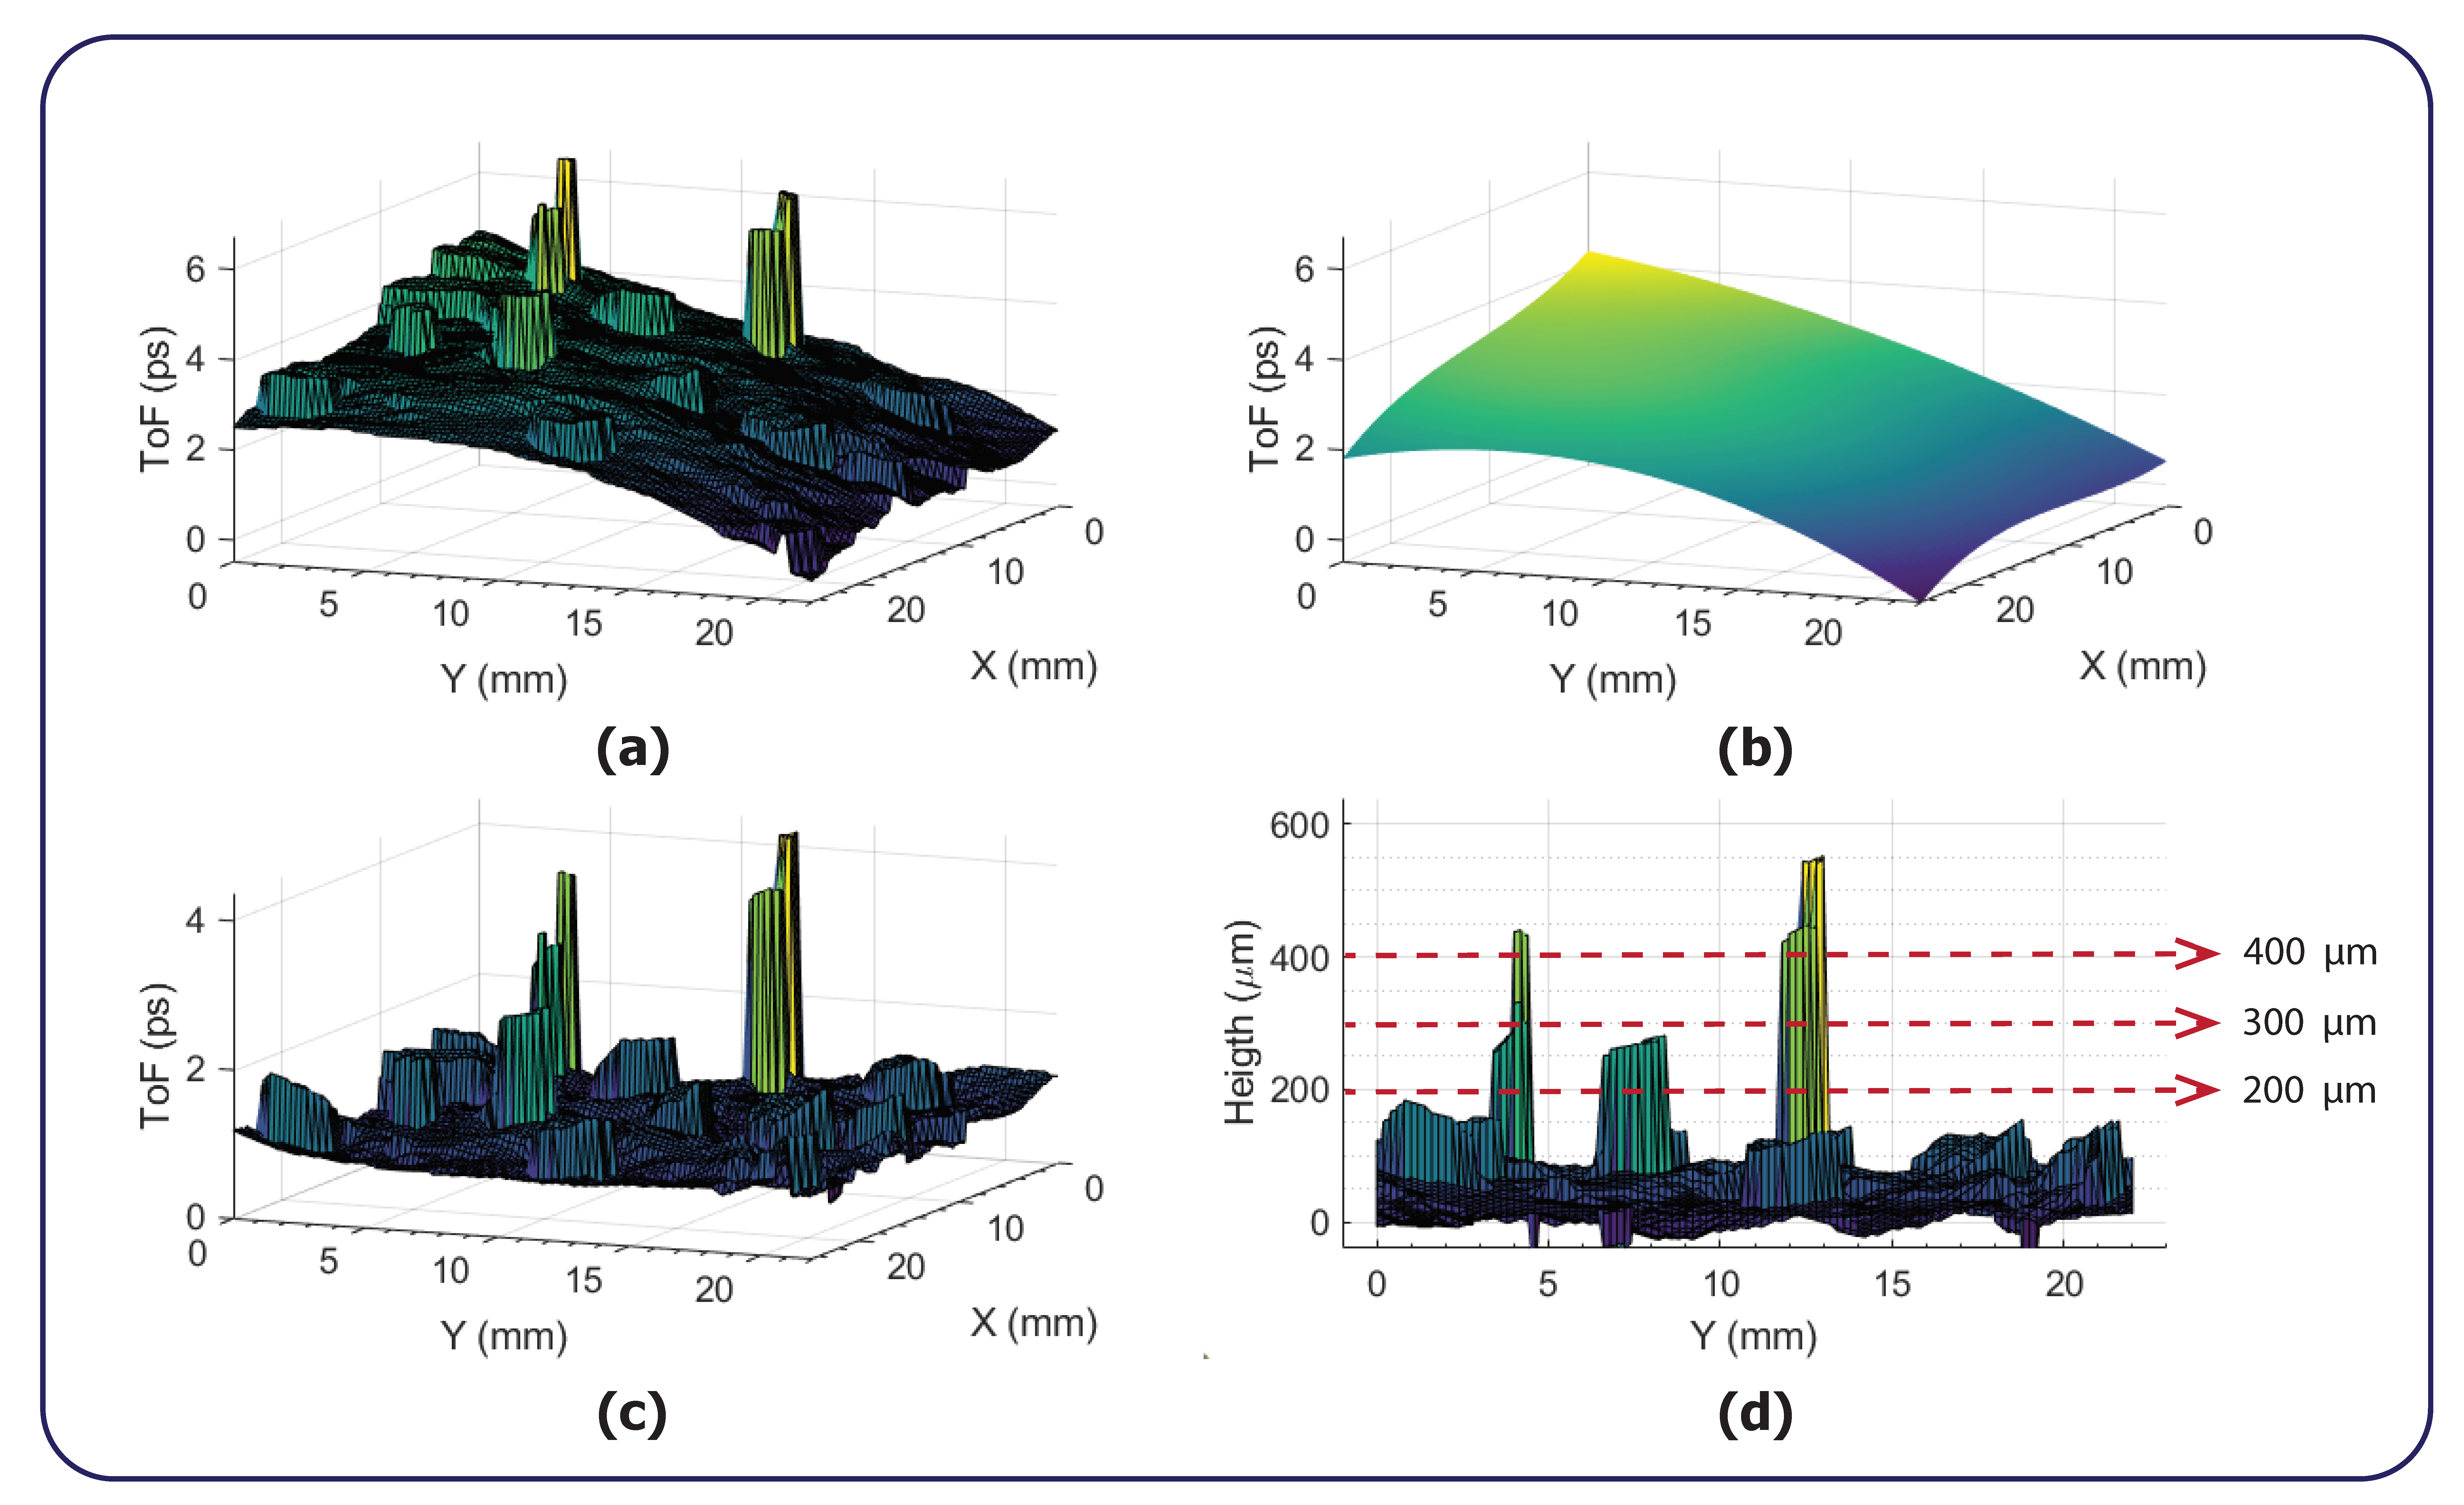
Figure 2a shows the ToF map of the back-reflected signal from raw data. The maximum variation of ToF is about 5 ps, which corresponds to almost 800 μm. The first step of the self-referenced method for geometrical distortion removal consists of determining the surface shape described as a function of the two spatial dimensions. The determination of the object shape (as defined in [
13]) is not always straightforward. It might be that the surface cannot be properly approximated with a polynomial curve, which can represent a limitation for the surface distortion correction. In our case, we could interpolate the surface of the mock-up sample with a second- and third-order polynomial function along the x and y directions, respectively, obtaining an adjusted-R
2 value of 0.896. The result is shown in
Figure 2b. The modelled object shape does not take into account the local geometries, such as local roughness and reliefs generated by the paint layers. This enables us to maintain the overall topography of the surface while removing the unwanted curvature.
The temporal shift of the raw data obtained from the THz back-reflected signal led to the result shown in
Figure 2c, whereas the profile of the corrected surface in spatial dimensions is illustrated in
Figure 2d. The new dataset does not differ from the original THz signal, apart from a zero-padding used to shift the temporal peak position. This zero-padding does not affect the spectroscopic characteristic of the THz signal but has the consequence of restoring the surface flatness. In the specific case of the mock-up sample, the conversion from temporal to spatial profile showed that the corrected object surface delineates an almost flat region, shaped by a roughness of 100 μm in height. On top of it, the
a secco retouches have thicknesses between 100 μm and 200 μm, while three painted spots have higher thicknesses that reach 300 μm and 400 μm.
This pre-processing step is fundamental before proceeding into the analysis of material spectra in the frequency domain, as the surface curvature correction reduces the error induced in the phase. The effects of surface geometrical distortions and curvature correction on the amplitude are limited to a reduction of intensity, which remains below 5% with respect to the focus position if the misalignment is less than 5 ps, as in this work (see
SM, Figures S2 and S3).
3.2. Absorption Coefficient Maps
After correcting for surface curvature, Fourier transform of the data in the temporal domain was calculated to obtain information on the spectral signature in the frequency domain. In contrast to previously published work conducted on pellets of pure pigment powder, in the present investigation, we dealt with a thin paint layer created using pigments dispersed in water as in the fresco technique. This generates an issue related to the amount of material that causes the back-reflection of the signal and introduces secondary effects (such as Fabry–Perot effects) between two consecutive layers. The extension of these limitations was therefore considered.
The value of the absorption coefficient
α(
ω) was calculated in the frequencies ranging between 50 and 120 cm
−1, chosen on the basis of the performance of the adopted instrument.
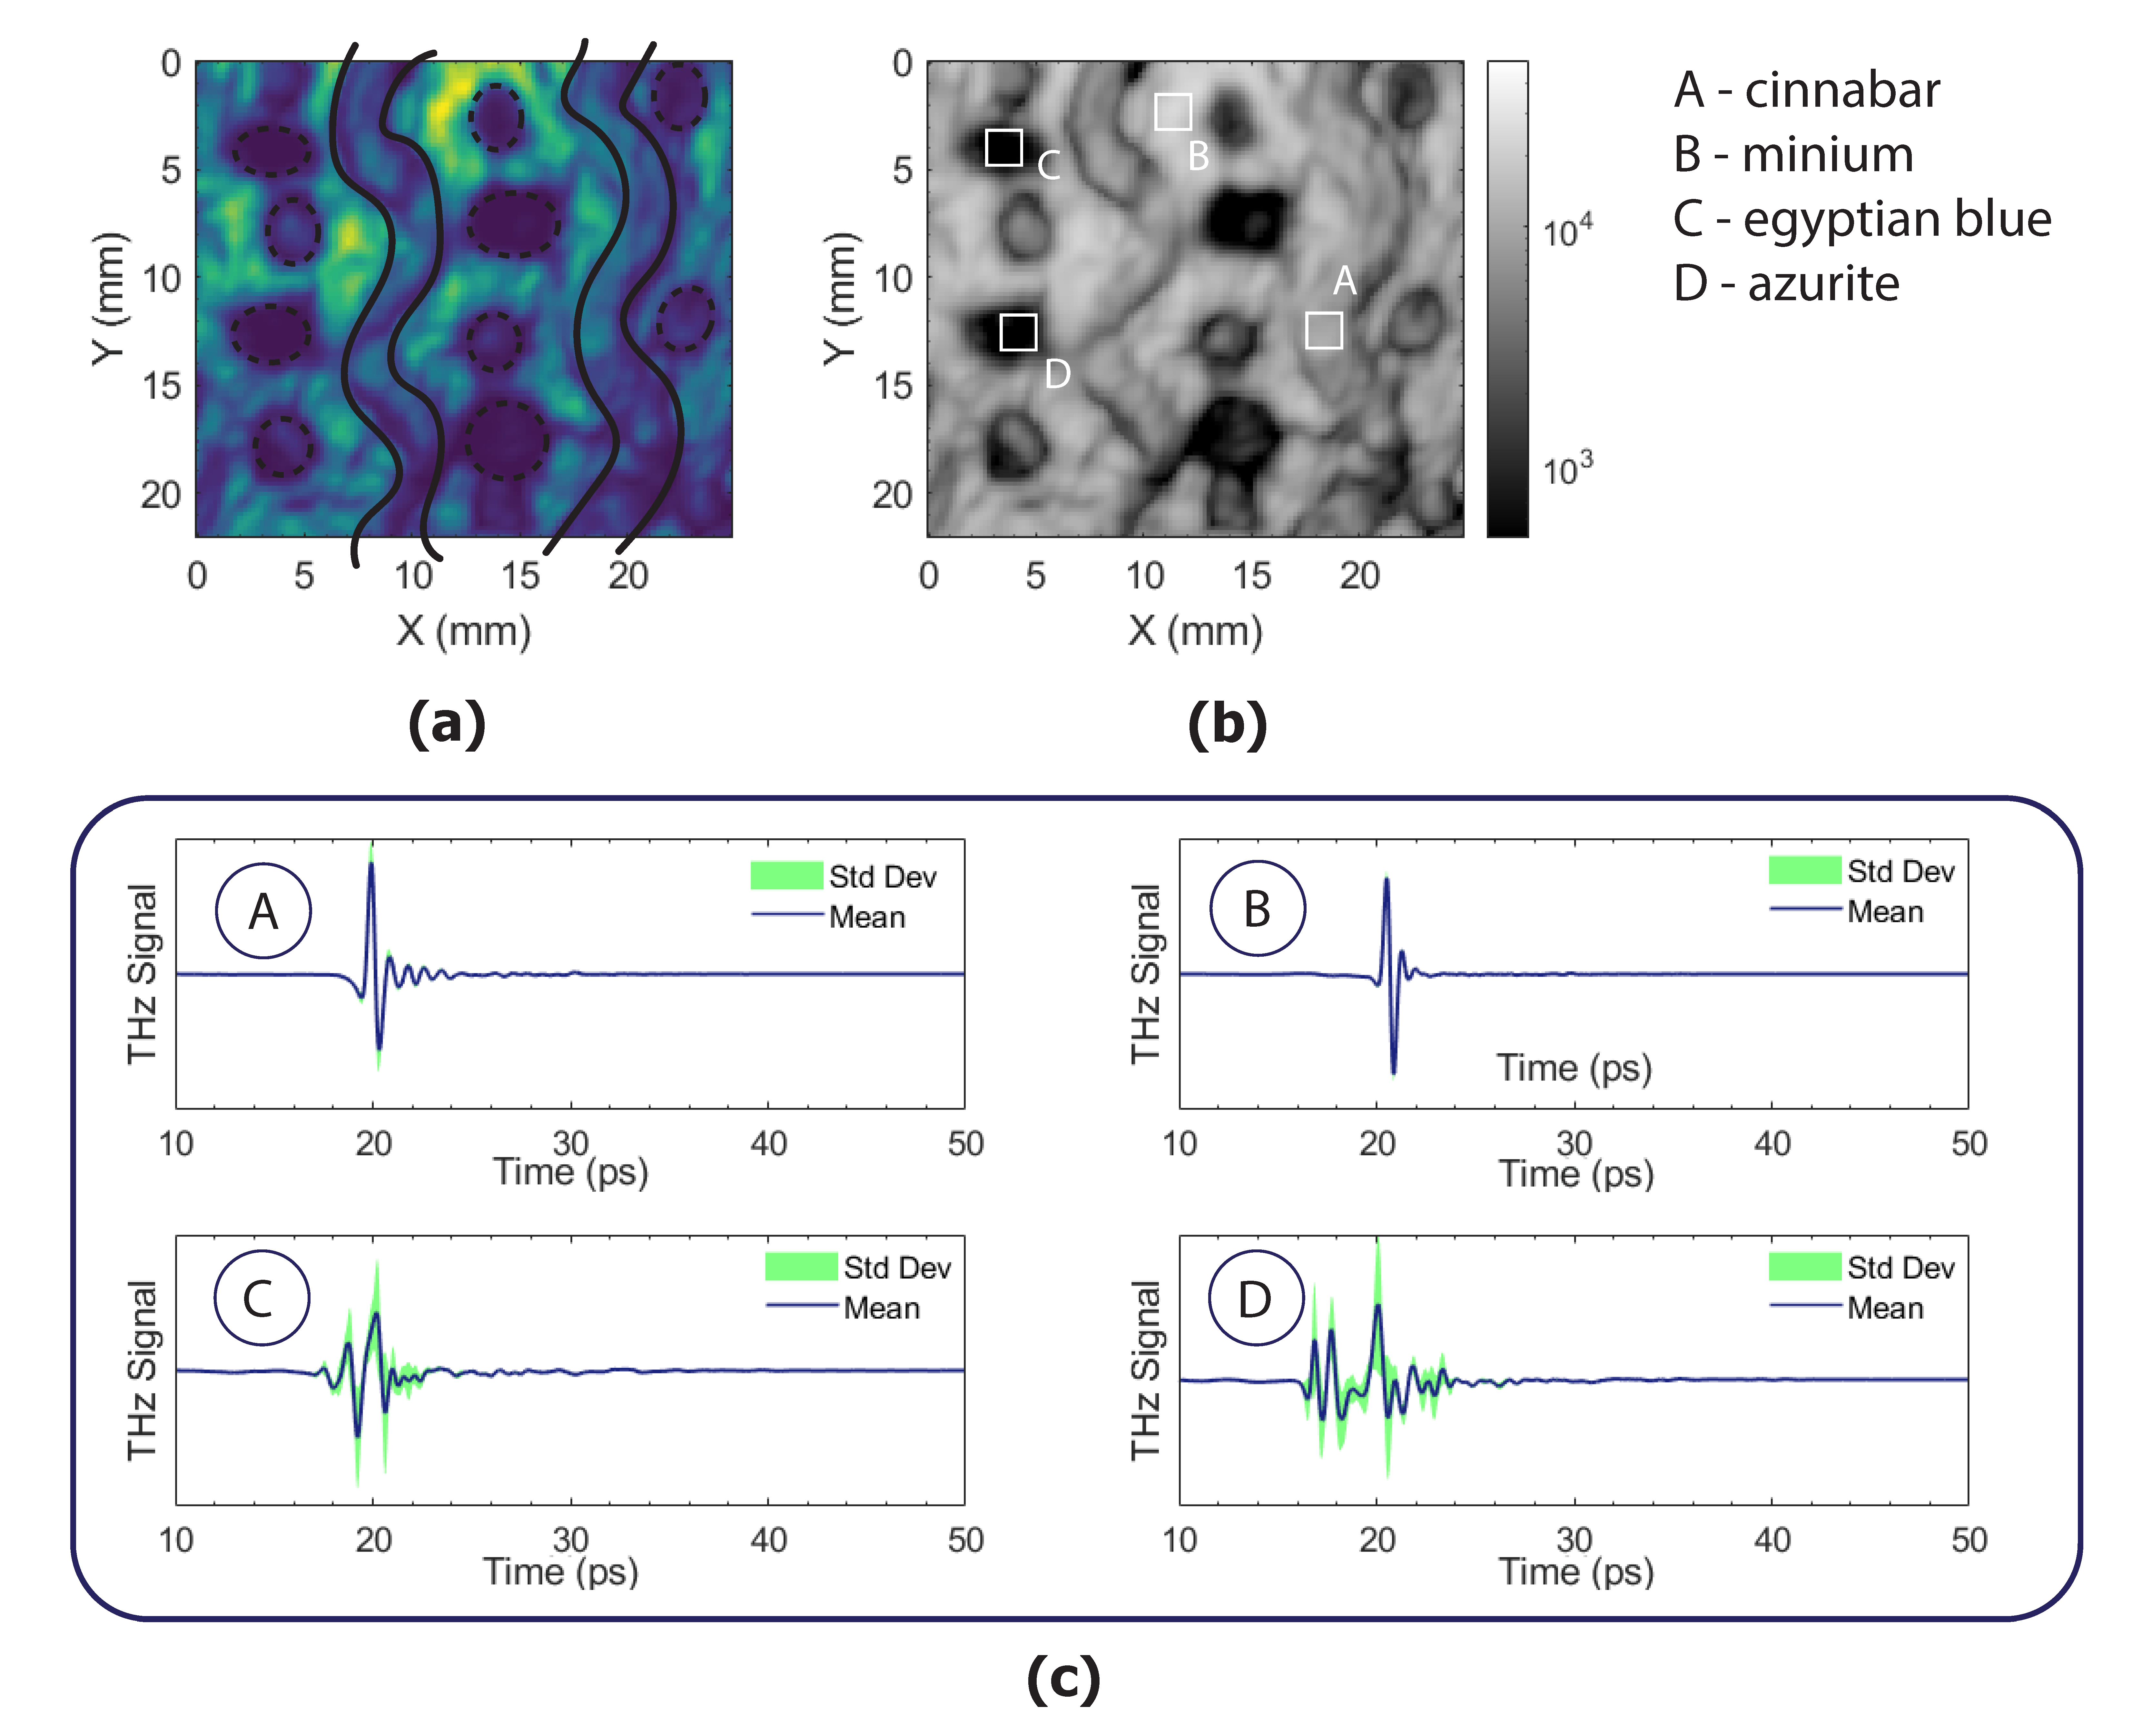
Figure 3a represents the distribution of the absorption coefficient over the entire surface, integrated between 50 and 120 cm
−1. The intensity of
α(
ω) is determined by the specific absorption properties of the material and the topography of the surface. In greyscale,
Figure 3b shows that the darker pixels correspond to less reflective materials with respect to the background. Four regions of interest (ROIs) composed by different material composition and number of painted layers were selected. The ROI-A corresponds to cinnabar, which can be considered as reflective as the ROI-B, the minium and first layer of the entire mock-up surface. Different reflective intensities are instead obtained from Egyptian blue (ROI-C) and azurite (ROI-D), which are associated with darker areas.
Figure 3c shows the average THz-TD signal obtained from each of the selected ROIs. In the same plots, the standard deviation is represented to report the signal variation among each point of the area. First and foremost, there are important differences to underline. The most reflective materials, corresponding to ROI-A and B, have a single and sharp THz peak, usually associated with single back reflection. If there is a contribution from layers underneath, it is negligible. Moreover, the peak distribution over the entire area is highly homogeneous, yielding small standard deviation values. Different results are obtained for ROI-C and D, which are less reflective at THz frequencies. The average THz signal from ROI-C shows a spread signal without any defined peak, possibly caused by the superposition of two back-reflected signals generated by a thin layer on top of another reflective layer. In this case, we could not separate the two contributions and advance any hypothesis on the composition of the material. In the last example, the ROI-D shows two broad but separated THz signals, although they are still too close and weak to exclude one from the another with a signal filtering process. It turns out that the presence of multiple layers and weakly reflective materials might highly complicate the spectral analysis of a painted surface, even if one can properly calculate the absorption coefficient for each point of the sample surface. For this reason, we suggest considering the temporal signal before any spectroscopic analysis.
The absorption coefficient spectra of the strong reflective ROIs were compared with the spectra obtained from pure pellet samples (as shown previously [
21]).
Figure 4 illustrates the spectra obtained from ROI-A and B, which correspond to cinnabar and minium, two red pigments, respectively. Cinnabar (HgS) exhibits A
2 and E lattice vibrations in the THz region, with absorption peaks at 39.0, 41.4, and 88.0 cm
−1. On the mock-up sample, the first two peaks around 40 cm
−1, which are the most intense (
Figure 4a), were clearly identified. Their peaks position greatly corresponds to those detected in the pellet sample in the previous work. Similarly, in the far-infrared region, the absorption peaks of minium (Pb
3O
4), as depicted in
Figure 4b, were detected. This pigment has an intense peak at the signals 65.4 cm
−1 and a small peak at 57.0 cm
−1, both due to translations of O and Pb atoms along the crystallographic b-axis. A peak at 74.5 cm
−1 was also detected and assigned to translation along the c-axis, while another less intense absorption peak at 84 cm
−1, with no assignment, was found. However, multiple reflections prevented us from detecting any spectroscopic signals that were expected from the analysis of the pure pigment, as the superimposed back-reflected signals from two layers in time-domain were not sufficiently far apart to apply filtering or other signal separation procedures and thus retrieve their individual contributions.
3.3. Temporal Deconvolution
As discussed in the previous sections, the THz-TD signals should be characterized by peaks corresponding to the interfaces included in the material stratigraphy. While the first peak is usually well defined, as it is much more intense, the reflection from layers underneath is less appreciable, especially when there is high signal absorption and scattering and small thicknesses. In the case of the sample considered here, we showed that, depending on the material composition, the back-reflected signals are characterized by a well-shaped peak corresponding to the first interface, or by multiple superimposed peaks if the first layer is not thick or absorbing enough. Even less information can be retrieved from the inner structure, as the signal-to-noise ratio drops at higher temporal shift.
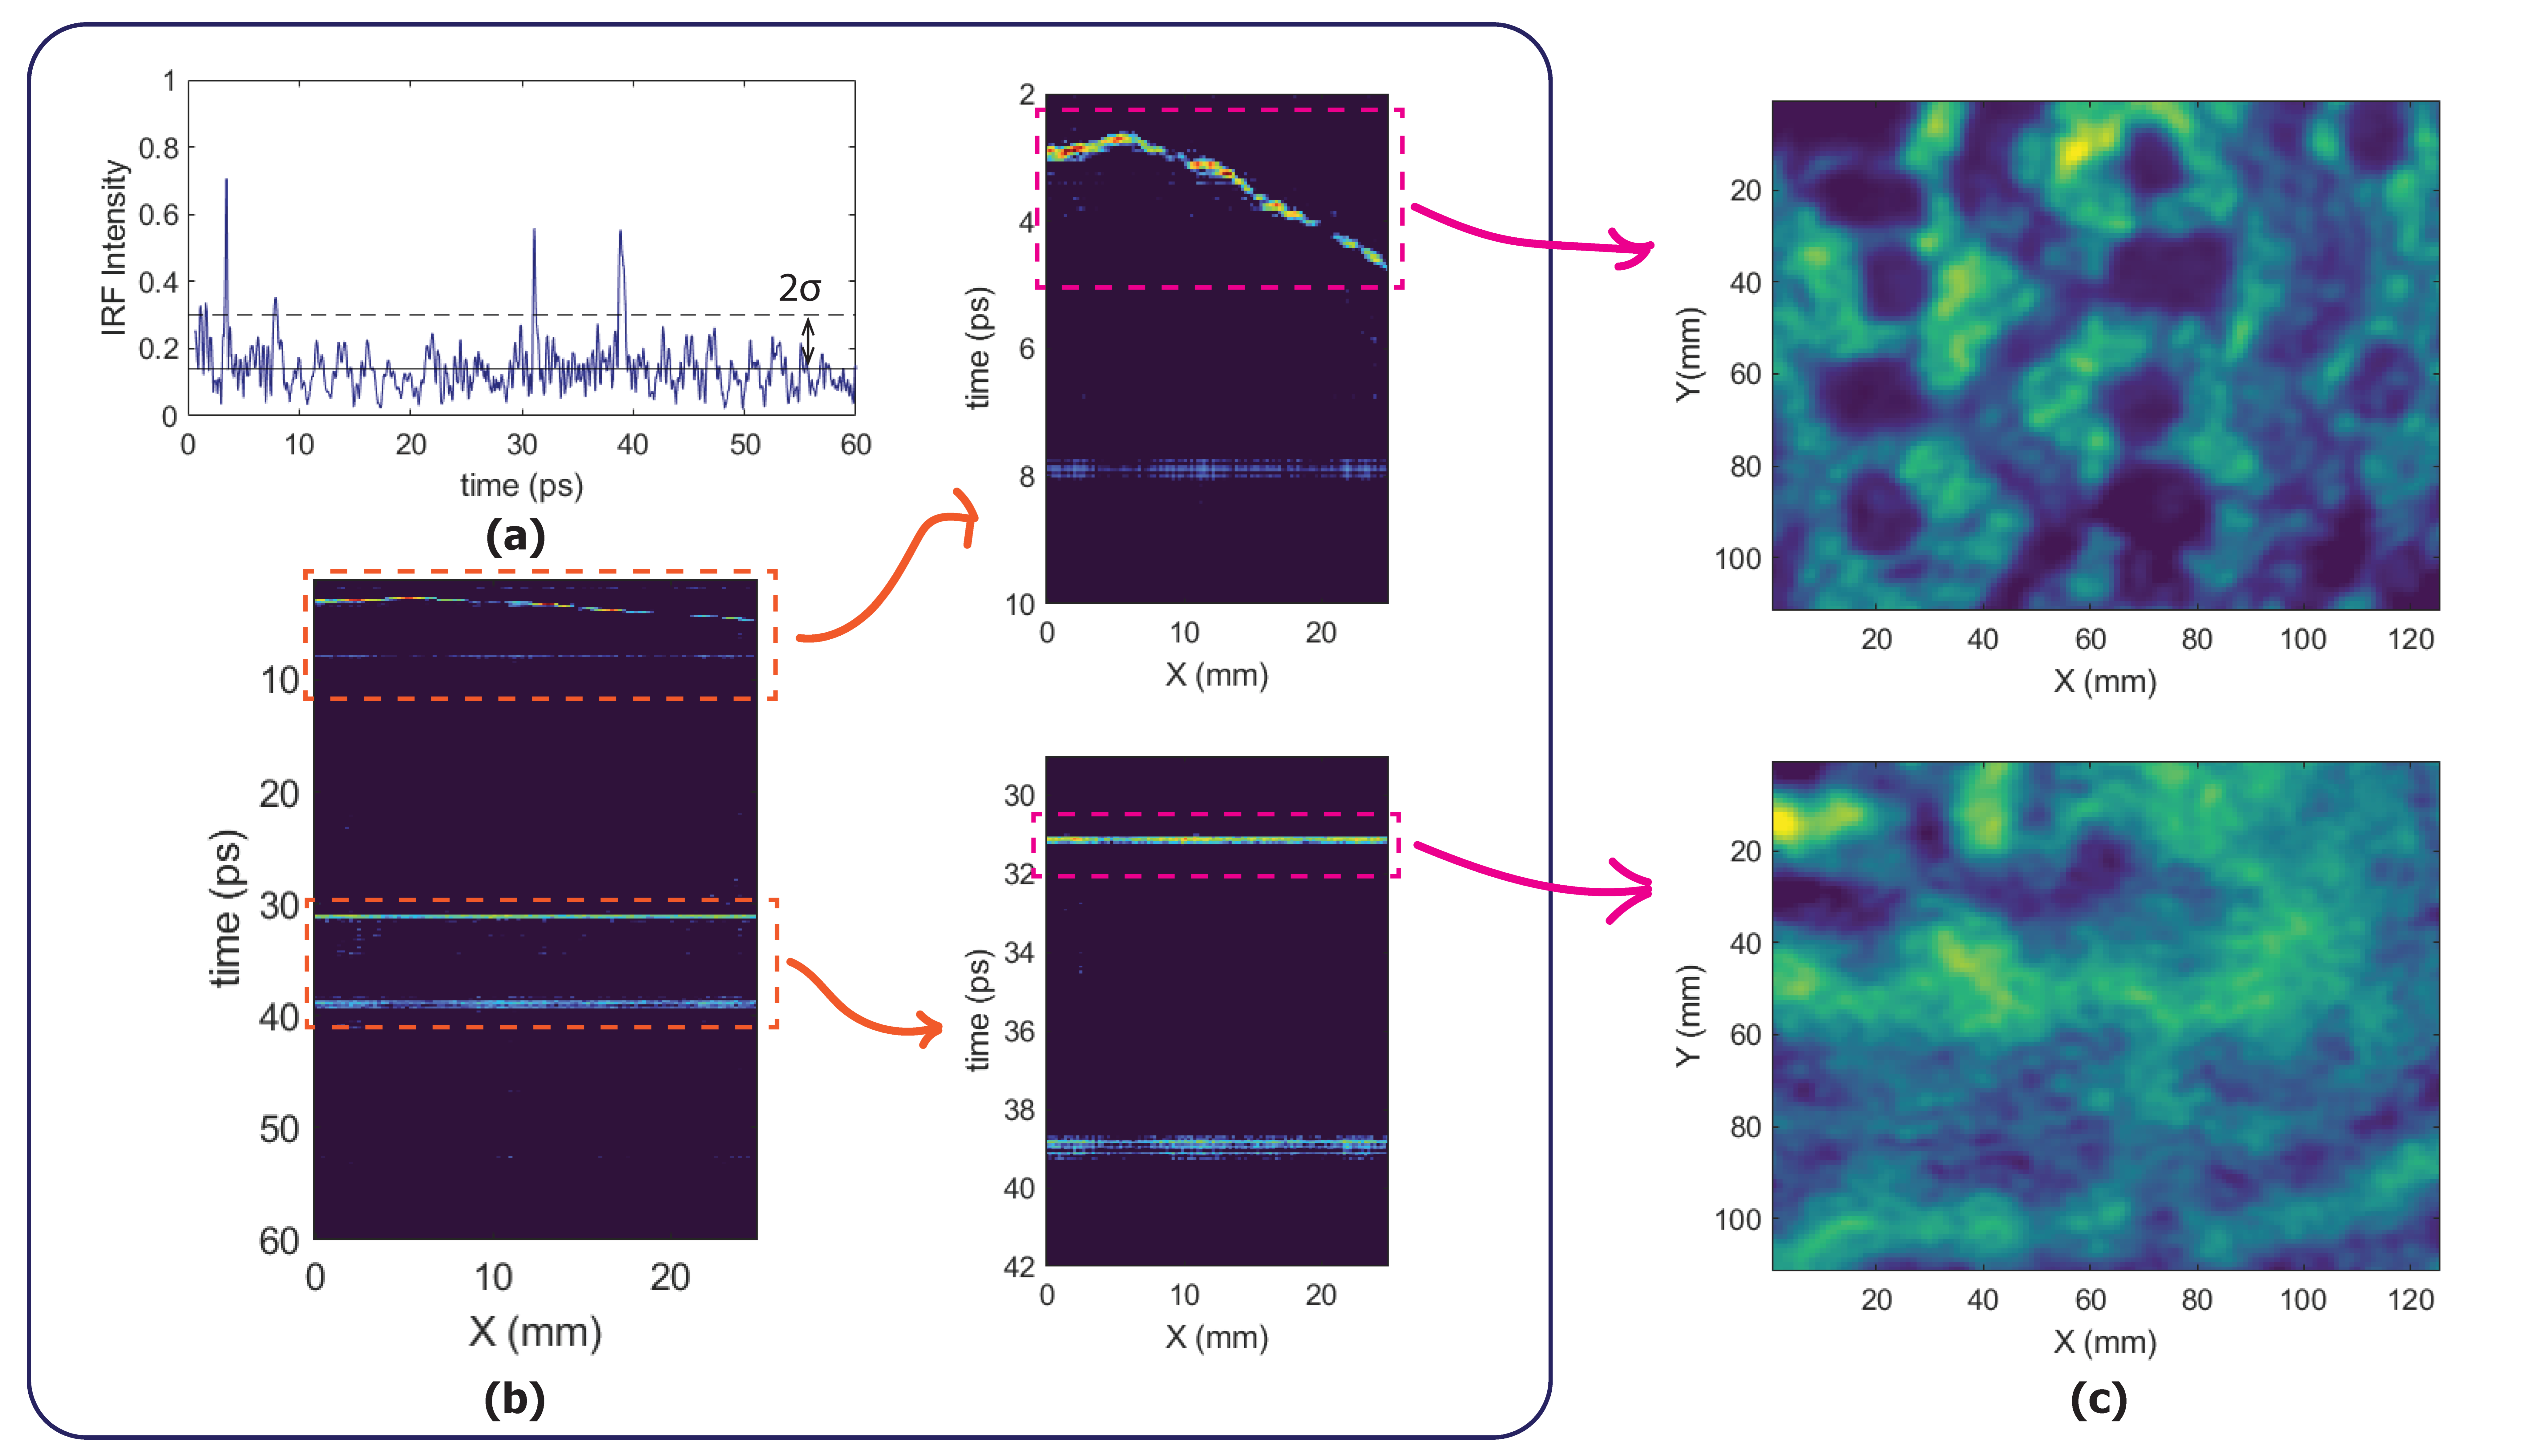
To retrieve the impulse response function (IRF) of the THz signal, and thus remove the contribution of the temporal profile of the exciting pulse, temporal deconvolution on the uncorrected data was employed. The resulting B-scan profile of the IRF is showed in
Figure 5b. In detail, the figure shows the IRF across the line x = 11.8 mm, after imposing a lower thresholding to the intensity signal to exclude noise fluctuations and better enhance peaks position. The threshold used was determined by calculating the mean and standard deviation of the IRF over the entire profile, with the threshold value corresponding to the mean plus two times the standard deviation. In this way, a difference of at least 2σ between the average noise and IRF peaks was ensured.
An example of the IRF profile at one point of the raster-scanned surface is provided in
Figure 5a. The IRF shows four peaks, conceivably corresponding to different interfaces. The peaks are consistently found in every IRF profile along the selected line, as illustrated by the B-scan map. An inset is provided for a better description of the first and third peaks, which lie around 3 ps and 30 ps, respectively. As depicted on the right side of
Figure 5b, the first layer is not flat and has a rough shape, while the inner peaks delineate a different and more linear profile. The first peak is associated with the air–paint interface, the second (weak) peak could be associated with the interface between the painted layer and the
intonachino. In fact, according to the fresco painting tradition, the
intonachino was not completely dried at the time the paint layer is applied, and thus pigment particles are incorporated in the underlying layer. The third peak could thus be associated with the interface between
intonachino and
arriccio. It is worth noting that the temporal distances between the detected interfaces correspond to the optical thicknesses of the layers and differ from the physical thicknesses, depending on the refractive index of the material. Therefore, IRF peaks with higher distances does not necessarily correspond to a higher thickness of the layer.
The maximum intensity projection to retrieve the topography of the inner surface was also performed. First, we calculated the maximum intensity projection on the outer surface to ensure that the detected surface is associated with the first layer. As illustrated in
Figure 5c on top, the image of the first surface is confirmed to be that of the paint layers. The maximum intensity projection of the inner surface instead presents a more irregular geometry (
Figure 5c, bottom), not showing any specific structure but overall shaped by hills and valleys, as could be associated with a mortar base. Nevertheless, the proper identification of the layers could be confirmed only by cross-section of the painted stratigraphy.
4. Conclusions
While THz imaging has primarily been applied for studying virtual cross-sections of painted artworks or determining the spectral signature in the far-infrared frequencies from point-like measurements, the simultaneous integration of imaging and spectroscopic mapping has never been proposed before due to inherent limitations in processing THz signals. In this study, a laboratory-designed approach that combines imaging acquisition and spectroscopic analysis was proposed to explore the potential advantages and limitations of THz-TD on real artworks. To achieve this, we addressed issues related to axial misalignments and electric field drift, and subsequently determined the absorption coefficient map between 20 and 120 cm−1.
In the specific case of the sample investigated here, the presence of a non-flat surface—with approximately 800 µm of height difference between the lower and upper parts—could have potentially resulted in an inaccurate determination of phase values, making it impossible to calculate the frequency-dependent absorption coefficient. Nevertheless, we have successfully demonstrated that, by removing this unwanted curvature, an accurate correction of the phase signal and the surface topography was successfully achieved. This crucial correction has enabled us to obtain more precise absorption coefficient values and retrieve real spectroscopic signatures from painted materials when they exhibit absorption in the THz region of frequencies. In general, THz-TD can identify and discriminate metal oxides in a contactless and non-ionizing manner, ensuring a safer analysis of cultural heritage surfaces.
However, a potential limitation in the relatively low reflecting power of certain painting materials must be considered. Particularly, the presence of thin layers of paint composed of Egyptian blue and azurite, alongside highly reflective pigments, presented challenges for the system in accurately detecting their spectra. It is important to take this aspect into consideration for future studies involving real artwork.
Virtual cross-section imaging remains one of the significant advantages of THz-TD. Temporal deconvolution enables the detection of inner interfaces and the visualization of internal layer shapes. This method proves particularly advantageous when investigating suspicious pre-treatments and when a high-resolution imaging device with millimeter depth of field is required.
Undoubtedly, the utilization of far-infrared electromagnetic radiation offers significant advantages. The integration of THz-TD and the different working modality of THz-TD (i.e., imaging and spectroscopy) further advances the capabilities of this technique, making it highly beneficial for routine analysis of cultural heritage.


