Article

The Watermark Imaging System: Revealing the Internal Structure of Historical Papers

1
Department of Electrical and Computer Engineering, University of Wisconsin-Madison, Madison, WI 53706, USA
2
Lens Media Lab, Yale University, New Haven, CT 06520, USA
3
Arista Networks, Santa Clara, CA 95054, USA
*
Author to whom correspondence should be addressed.
Heritage 2023, 6(7), 5093-5106; https://doi.org/10.3390/heritage6070270
Submission received: 1 June 2023 / Revised: 16 June 2023 / Accepted: 29 June 2023 / Published: 1 July 2023

Abstract

:
This paper introduces the Watermark Imaging System (WImSy) which can be used to photograph, document, and study sheets of paper. The WImSy provides surface images, raking light images, and transmitted light images of the paper, all in perfect alignment. We develop algorithms that exploit this alignment by combining several images together in a process that mimics both the “surface image removal” technique and the method of “high dynamic range” photographs. An improved optimization criterion and an automatic parameter selection procedure streamline the process and make it practical for art historians and conservators to extract the relevant information to study watermarks. The effectiveness of the method is demonstrated in several experiments on images taken with the WImSy at the Metropolitan Museum of Art in New York and at the Getty Museum in Los Angeles, and the results are compared with manually optimized images.

1. Introduction

Watermarks have been an essential part of art historical study for decades. In the field of art conservation, watermarks can provide concrete information about the manufacture of the paper and its (approximate) date of production and can be used to understand how paper mills produced and distributed paper across different regions and over time. By locating identical watermarks, which indicate that the papers were made from the same papermaking mold, they can provide physical evidence of the dating of the paper. Watermarks can be traced back to the 13th century when papermakers began using them as unique symbols to identify their paper mills. As the use of paper increased in Europe, papermakers began to incorporate more elaborate designs such as crests, emblems, animals, and flora. Today, art historians and conservators can use watermarks to study the production and circulation of paper during different periods, and they can be used to help understand an artist’s studio practice and to assign approximate dates to the paper (and hence to the artwork itself).
Despite the importance of watermarks in art history and conservation, they can be challenging to study. Watermarks can be faint, damaged, or even invisible to the naked eye. Watermarks are often covered by drawings, markings, or stains on the paper, which can make detailed study challenging.
To overcome these challenges, researchers have developed various techniques. Manual tracing, a historical method that involves copying the watermark pattern onto tracing paper, has been used to create watermark catalogs. To enable more precise study, radiographic techniques such as beta radiography and X-ray radiography have been applied [1,2,3], but they have drawbacks such as limited accessibility for many organizations, long exposure times, and safety issues. Alternatively, backlighting images (transmitted light images) have been proposed, which only require a digital camera and a light source, making them easier to obtain. Combining the transmitted light image with the surface image and then applying appropriate image enhancement techniques can produce a new image that primarily shows the paper structure [4]. Backlighting is a promising technique due to its simplicity, and several watermark studies have utilized this technique. For example, ref. [5] is a web catalog containing watermarks obtained from backlit paper, ref. [6] used transmitted light images to locate watermarks, refs. [7,8] combined transmitted light images with surface images to study the papers of Leonardo and Dürer. These studies have demonstrated the effectiveness of backlighting images as a reliable and accessible method for watermark analysis.
This paper introduces the Watermark Imaging System (WImSy), which captures surface images, raking light images, and transmitted light images of sheets of paper, all in perfect alignment. The hardware is augmented with algorithms that exploit this alignment to extract further information about the internal structure of the paper, including watermarks, chain lines, and laid lines. The algorithms combine the “surface image removal” method of [9] with the techniques of “high dynamic range” (HDR) photographs [10]. Automation of the method is achieved by using an improved optimization criterion and an automatic parameter selection procedure, making it practical for art historians and conservators to extract the relevant information from the captured photographs. We demonstrate the effectiveness of the method in several experiments on images taken with the WImSy, comparing the results of the automated process with manually optimized images.

2. Materials and Methods

This section begins by describing the hardware that we have developed for imaging the internal structure of paper. Complementing this are the algorithms that we have developed and implemented, which process the images in order to decrease the noise and enhance the legibility of the resulting images.

2.1. The WImSy Machine and the Dataset

The WImSy, shown in Figure 1, is a specialized system developed for photographing small works on paper up to 8 by 11 (20.3 cm by 28 cm), such as prints and drawings. It consists of a portable photographic stand, multiple LED lighting options, a flat light plate, a camera, a hardware interface to control the lights, and software to sequence the capture of multiple images. One of the unique features of WImSy is that it incorporates three different light positions to capture different aspects of the artwork.
WImSy uses the Sony Alpha a7R IV mirrorless camera, which incorporates a 61-megapixel CMOS sensor. For each exposure the camera is configured to output a jpeg (compressed, lossy) and an uncompressed RAW image. Files sizes are approximately 45 MB and 117 MB, respectively. Image resolution is 9504 × 6336 pixels, resulting in 280 × 280 pixels per cm 2 on the subject, providing sufficient resolution for imaging laid lines. The camera is fitted with a Sony FE 50 mm f/2.8 macro lens. The camera autofocuses using reflected light and holds that focus through the stack of subsequent raking and transmitted light images.
WImSy incorporates three light positions: (1) surface illumination is made with two LED light strips positioned on either side of the object; (2) raking illumination is made with a single, low angle, LED light strip; (3) transmitted light is achieved using an electroluminescent light sheet. Light strips measure 18 (45.7 cm) in length and incorporate 72 LEDs per 12 inches (30.5 cm) with color temperature 6000 k, operating at 24 volts direct current (24 V DC). The light sheet operates at 12 V DC and is specified to output 200 lux/ m 2 . The sheets are swappable with 11 × 17 (28 cm × 43 cm) proving most useful for general use with a smaller 8.5 × 14 (21.5 cm × 35.5 cm) sheet sometimes needed depending on the mounting configuration the subject. A two-second WImSy capture involves exposure intensity of approximately 3440 lux or 1.9 lux/h, roughly the equivalent of 2.5 min of display time at 50 lux/h. Given the rapid cycling of the lights, heat output is negligible. Lights are operated through a custom designed DMX-compliant controller for on/off sequencing and intensity control.
The camera and LEDs are mounted to an armature composed of 1 (2.5 cm) extruded aluminum. With LED mounts folded inward for more compact shipping, the armature measures 27 height × 9 width × 18 depth (68.5 cm H × 22.9 cm W × 45.7 cm D). Experience indicates the present prototype could be shorter by about 4 (10 cm), potentially making future models even more compact. The camera and light positions are geometrically fixed to ensure repeatable, replicable, results across captures. As configured, a WImSy capture measures approximately 11 × 17 (28 cm × 43 cm) of physical area. Larger works on paper require compositing images across multiple captures.
The camera and lighting functions are controlled using custom software developed in C++ for the Microsoft Windows operating system. The software integrates the Sony Camera Remote API Beta SDK for live view and for setting focus, aperture, shutter speed, ISO, and for controlling file transfer to the computer. The software has two modes: “Developer” options include all camera functions and allows the triggering of three to six transmitted light images, each made using different camera settings to maximize the rendering of paper features typically obscured in conventional transmitted light. Once parameters are optimized, “User” mode prompts for file naming and captures the complete image stack with a single mouse click.
The system is designed to be compact and portable with all components, including a dedicated laptop computer, fitting into a single protective case for travel and shipping. System set-up requires approximately five minutes, mainly involving establishing cable connections between the components. Besides basic art handling experience, no specialized expertise is required to operate the system. Still a prototype, the ultimate system cost should be less than $10,000.
With its ability to provide maximum consistency across image stacks of various lightning positions, the system is ideal for studying and analyzing watermarks and other features in works on paper. In particular, the surface illumination is used to capture the overall surface appearance of the artwork, while raking illumination is used to highlight the texture of the paper. The transmitted light images, of which there are nominally six for each image capture sequence, can be used to investigate subsurface features such as watermarks, chain lines, and laid lines. The exposure and lighting sequence is fully automated, taking about 30 to 45 s to produce an “image stack” that is perfectly registered. By fixing the lights, camera, and other variables, the system enables downstream computational processing to search for patterns within and across datasets.
For our study, we utilized datasets of images captured at the Metropolitan Museum of Art in New York (in October 2022) and at the Getty Museum in Los Angeles (in February 2023). Each artwork is represented by a toplit image, which captures the surface features of the print or drawing, and between three and six transmitted light images, which capture both the surface and subsurface watermark features. Figure 2 provides an example of a surface image and the corresponding transmitted light image. The datasets allow testing and evaluation of the effectiveness of the denoising algorithms.

2.2. “Denoising” Transmitted Light Images Using Surface Subtraction

Transmitted light images often show features relating to the structure and composition of a sheet of paper, though details are often obscured by drawing, writing, or other markings on the surface. Thus transmitted light images often consist of a watermark feature superimposed on the surface features. We call the process of removing these surface features denoising, and it can help to make the internal features more clear and to visually isolate the watermark. Our approach to denoising a single transmitted light image linearly combines the surface and transmitted images based on the method described in [9]. Assuming the two images are perfectly aligned (registered), a weighted grayscale version of the surface image is subtracted from the grayscale version of the transmitted light image. Both of these are readily obtained from the WImSy image stack. The method is extended to exploit multiple transmitted light images in Section 2.3.
Let t r a n s and t o p be registered transmitted light and surface images of the same sheet of paper. The denoised watermark image, d e n o i s e , is
d e n o i s e ( u ) = t r a n s u t o p ,
where u is an adjustable parameter in the range 0 , 1 .
A scaling function S ( · ) is employed after the denoising process to map the pixel values of the resulting image to the range of 0 , 1 , allowing for better visual presentation of the watermark. Specifically, given an input image I, the scaled output image I s is obtained by
I s = S ( I ) = I min ( I ) max ( I ) min ( I ) ,
where min ( I ) and max ( I ) represent the minimum and maximum pixel values in the image I, respectively. Once the denoising process is complete, the scaling function can be applied to the resulting image d e n o i s e ( u ) to obtain a scaled image d e n o i s e s ( u ) = S ( d e n o i s e ( u ) ) .
To denoise a single transmitted light image manually, the value of the regularization parameter u can be adjusted using a slider while visually inspecting the output d e n o i s e s ( u ) . A graphical user interface (GUI) can be used to facilitate this process, as shown in Figure 3.

2.3. Using Multiple Transmitted Light Images in the Denoising Process

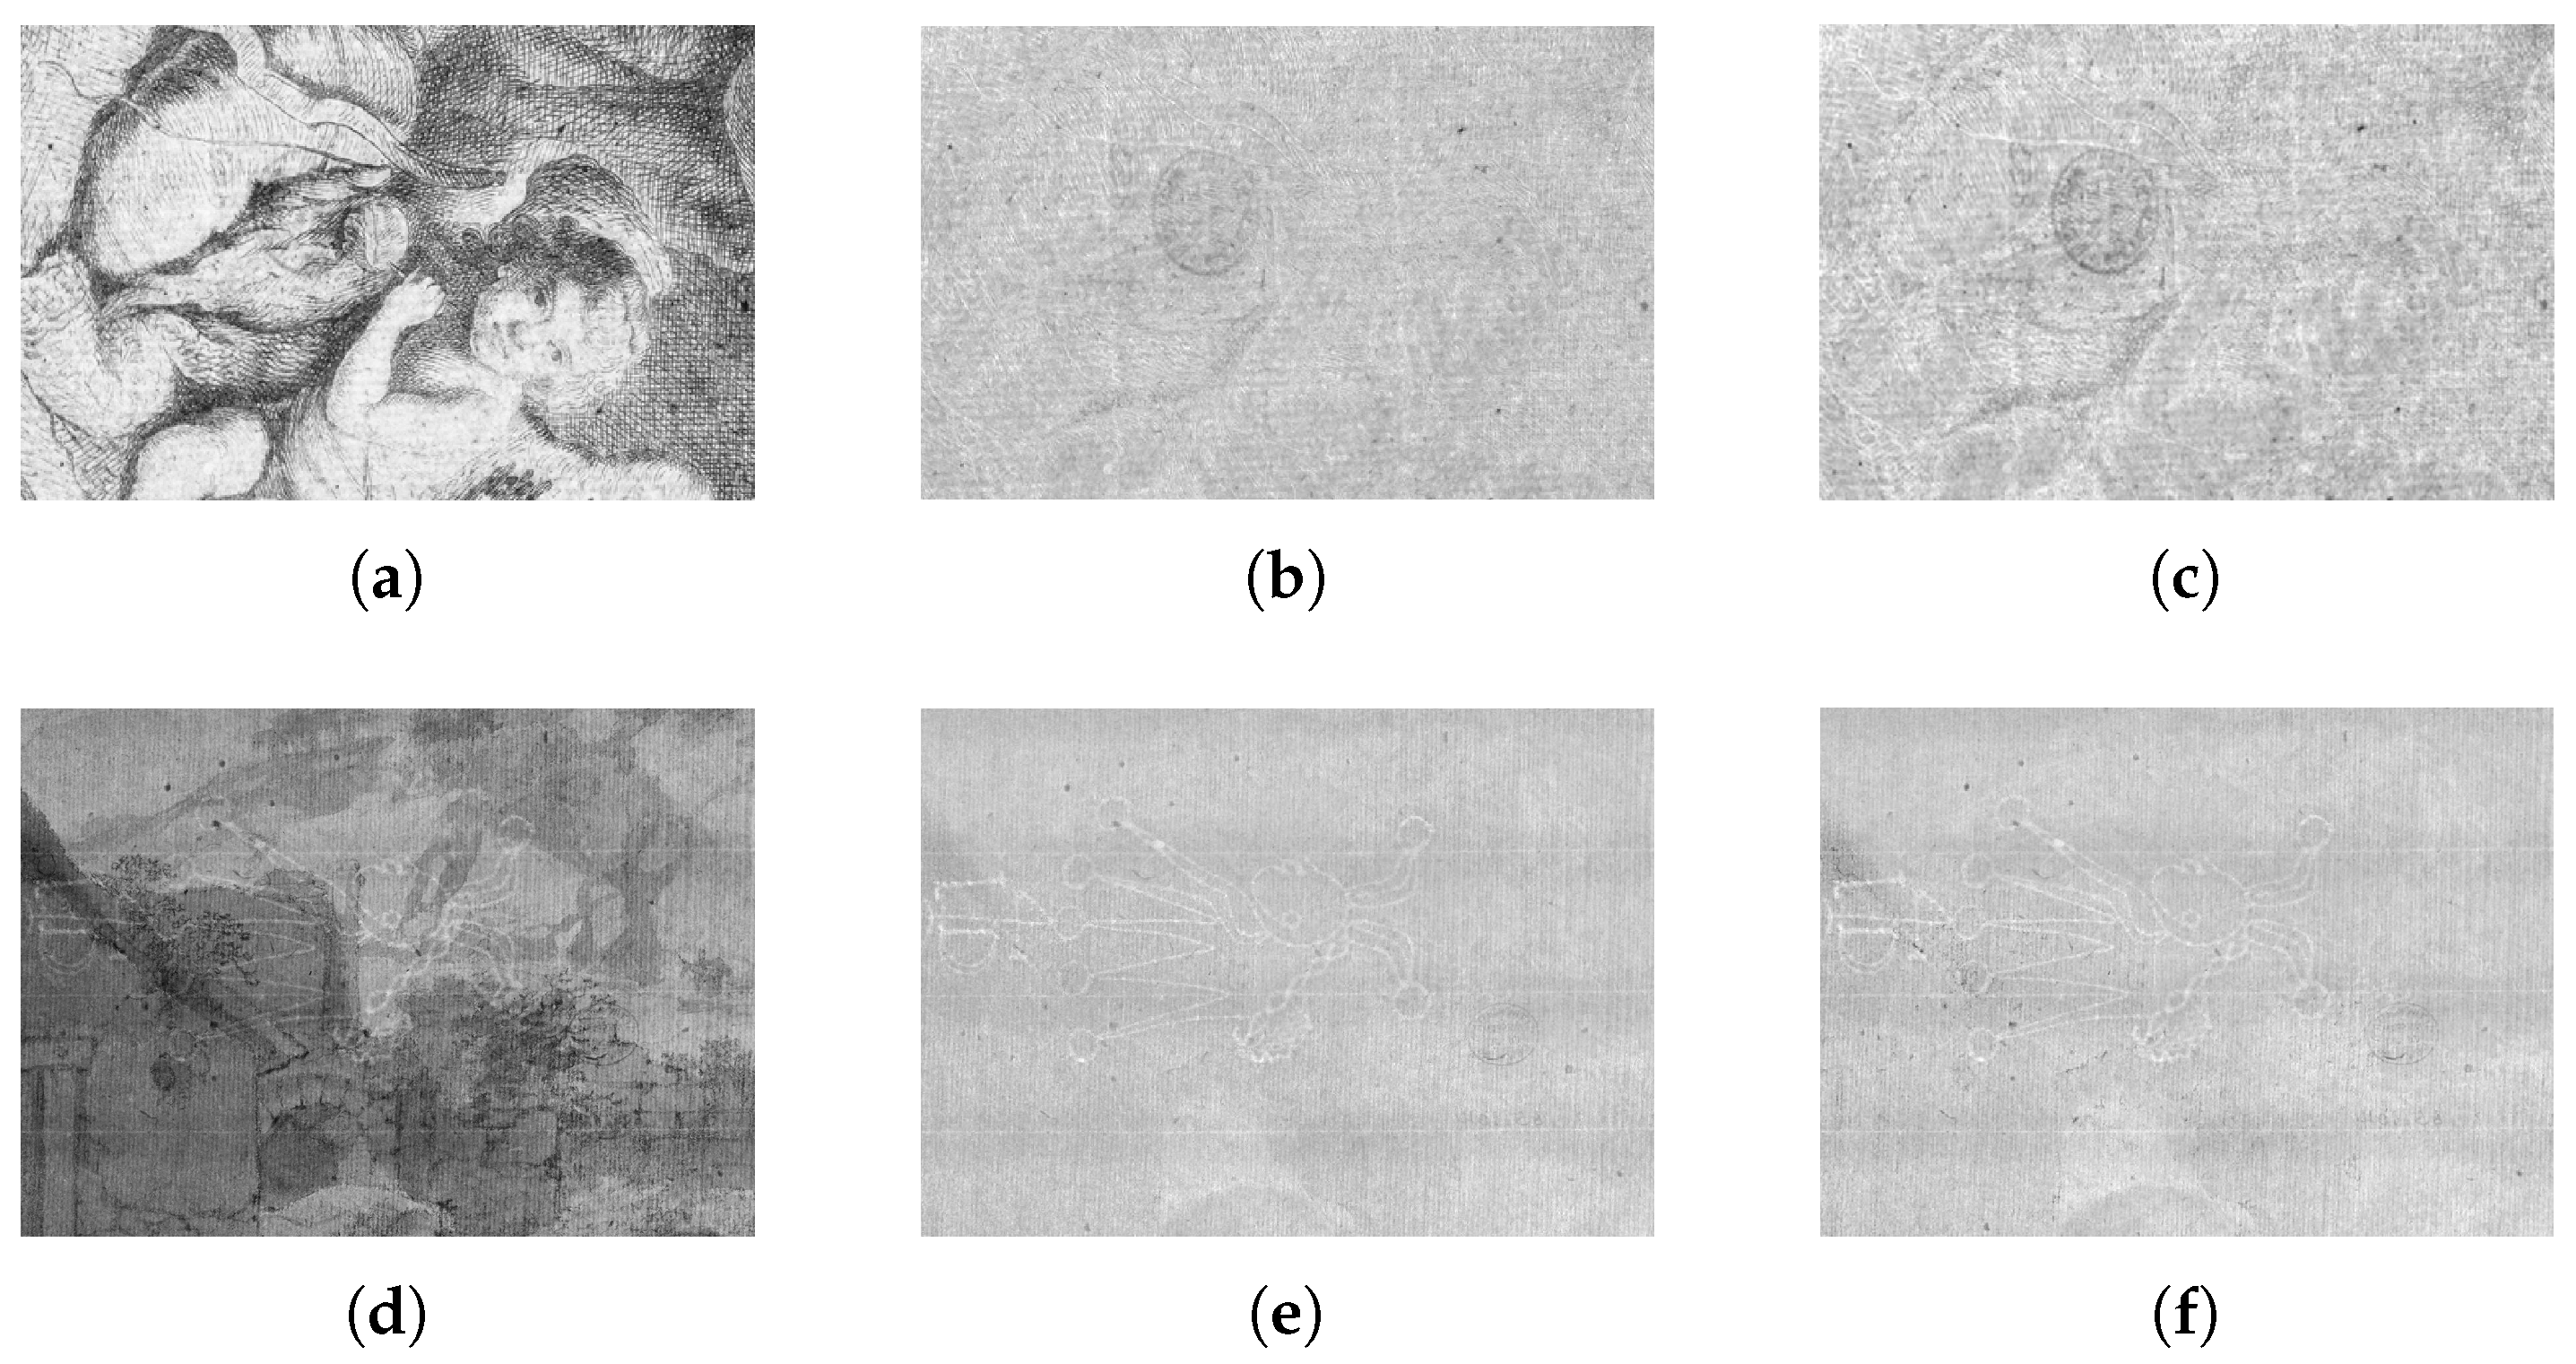
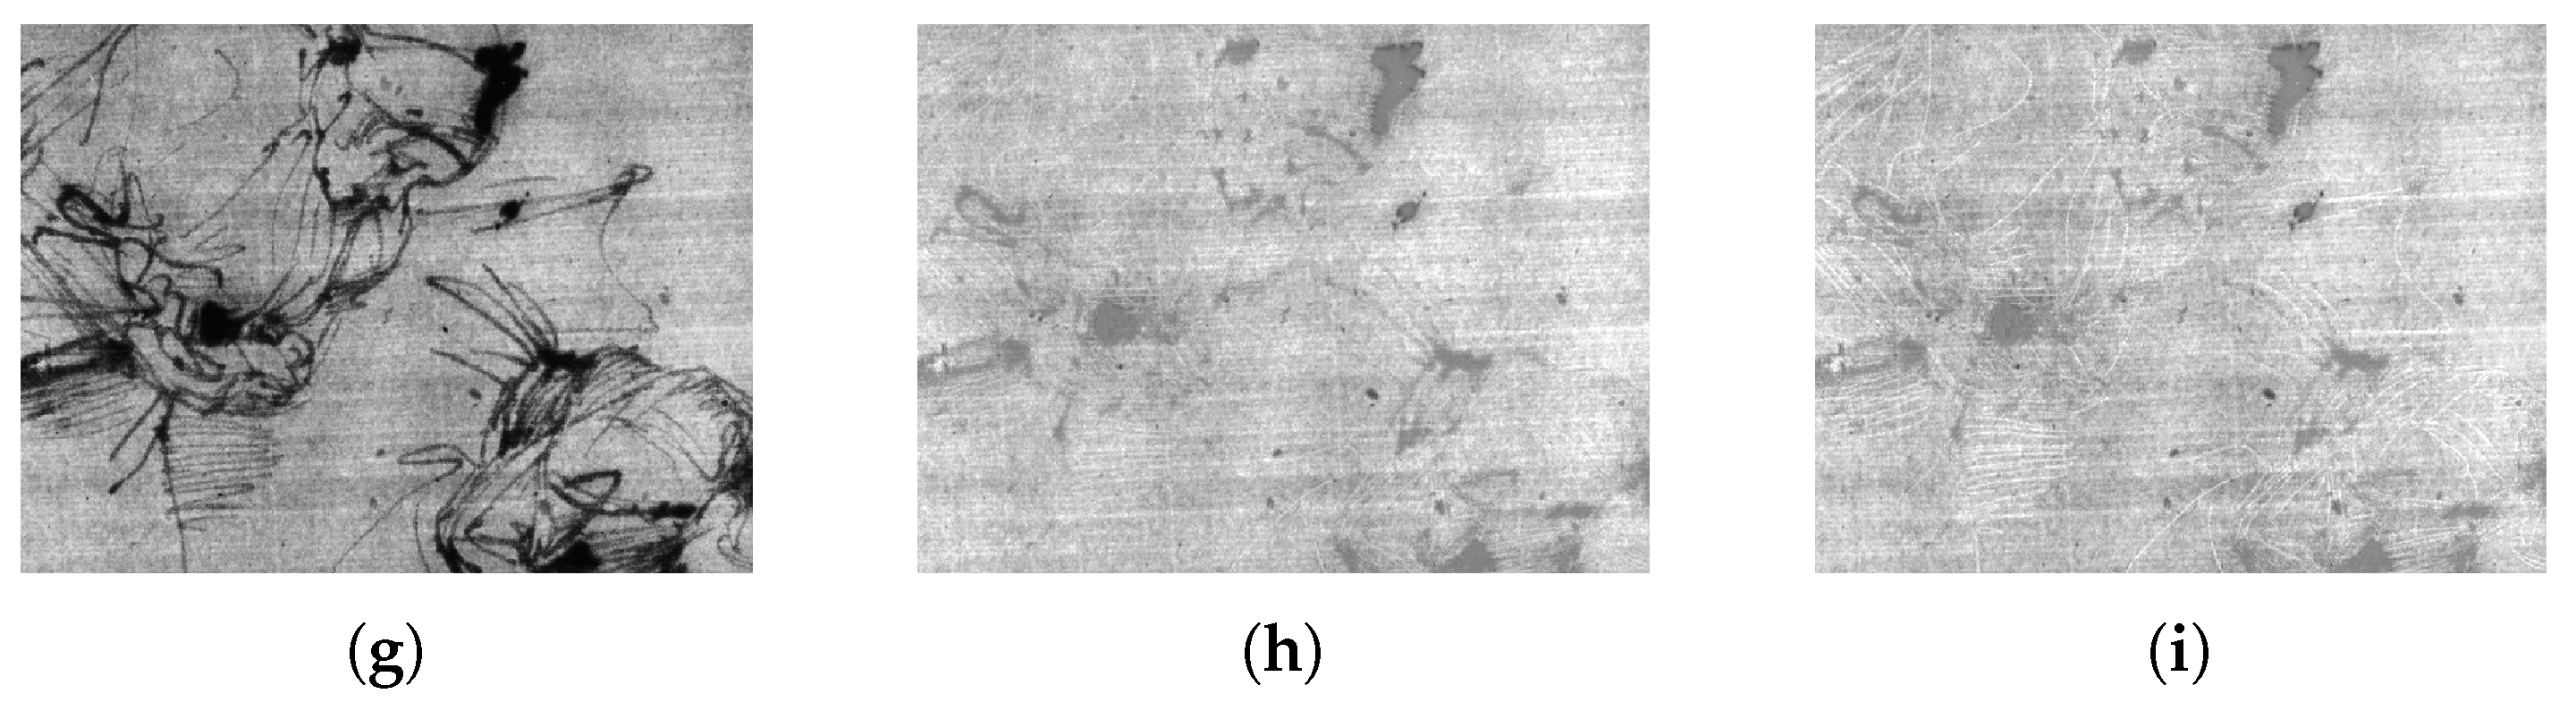
The effectiveness of the denoising process depends significantly on the exposure time of the transmitted light image. If the exposure time is too short, there will be insufficient details present in the image to obtain a clear view of the internal features, whereas if the exposure time is too long, the resulting images will be washed out and lack clarity. To ensure that one or more images are suitable for denoising, WImSy captures several (usually six) different exposures in the image stack. Figure 4 shows three transmitted light images and the corresponding denoised images captured with different exposure times.
In some cases, such as in Figure 3, a single transmitted light image is sufficient for denoising using the method described in Section 2.2. However, it may also happen that no single image displays good features throughout, necessitating the combination of multiple images. There are two possible strategies to accomplish this: denoise the images separately and then combine them via an HDR-like technique, or combine the transmitted light images using HDR-like techniques and then denoise the resulting image. From our experimental results, we have found the latter strategy to be more effective. The rationale for this is that different denoising parameters u can be applied to transmitted light images obtained with varying exposure times.
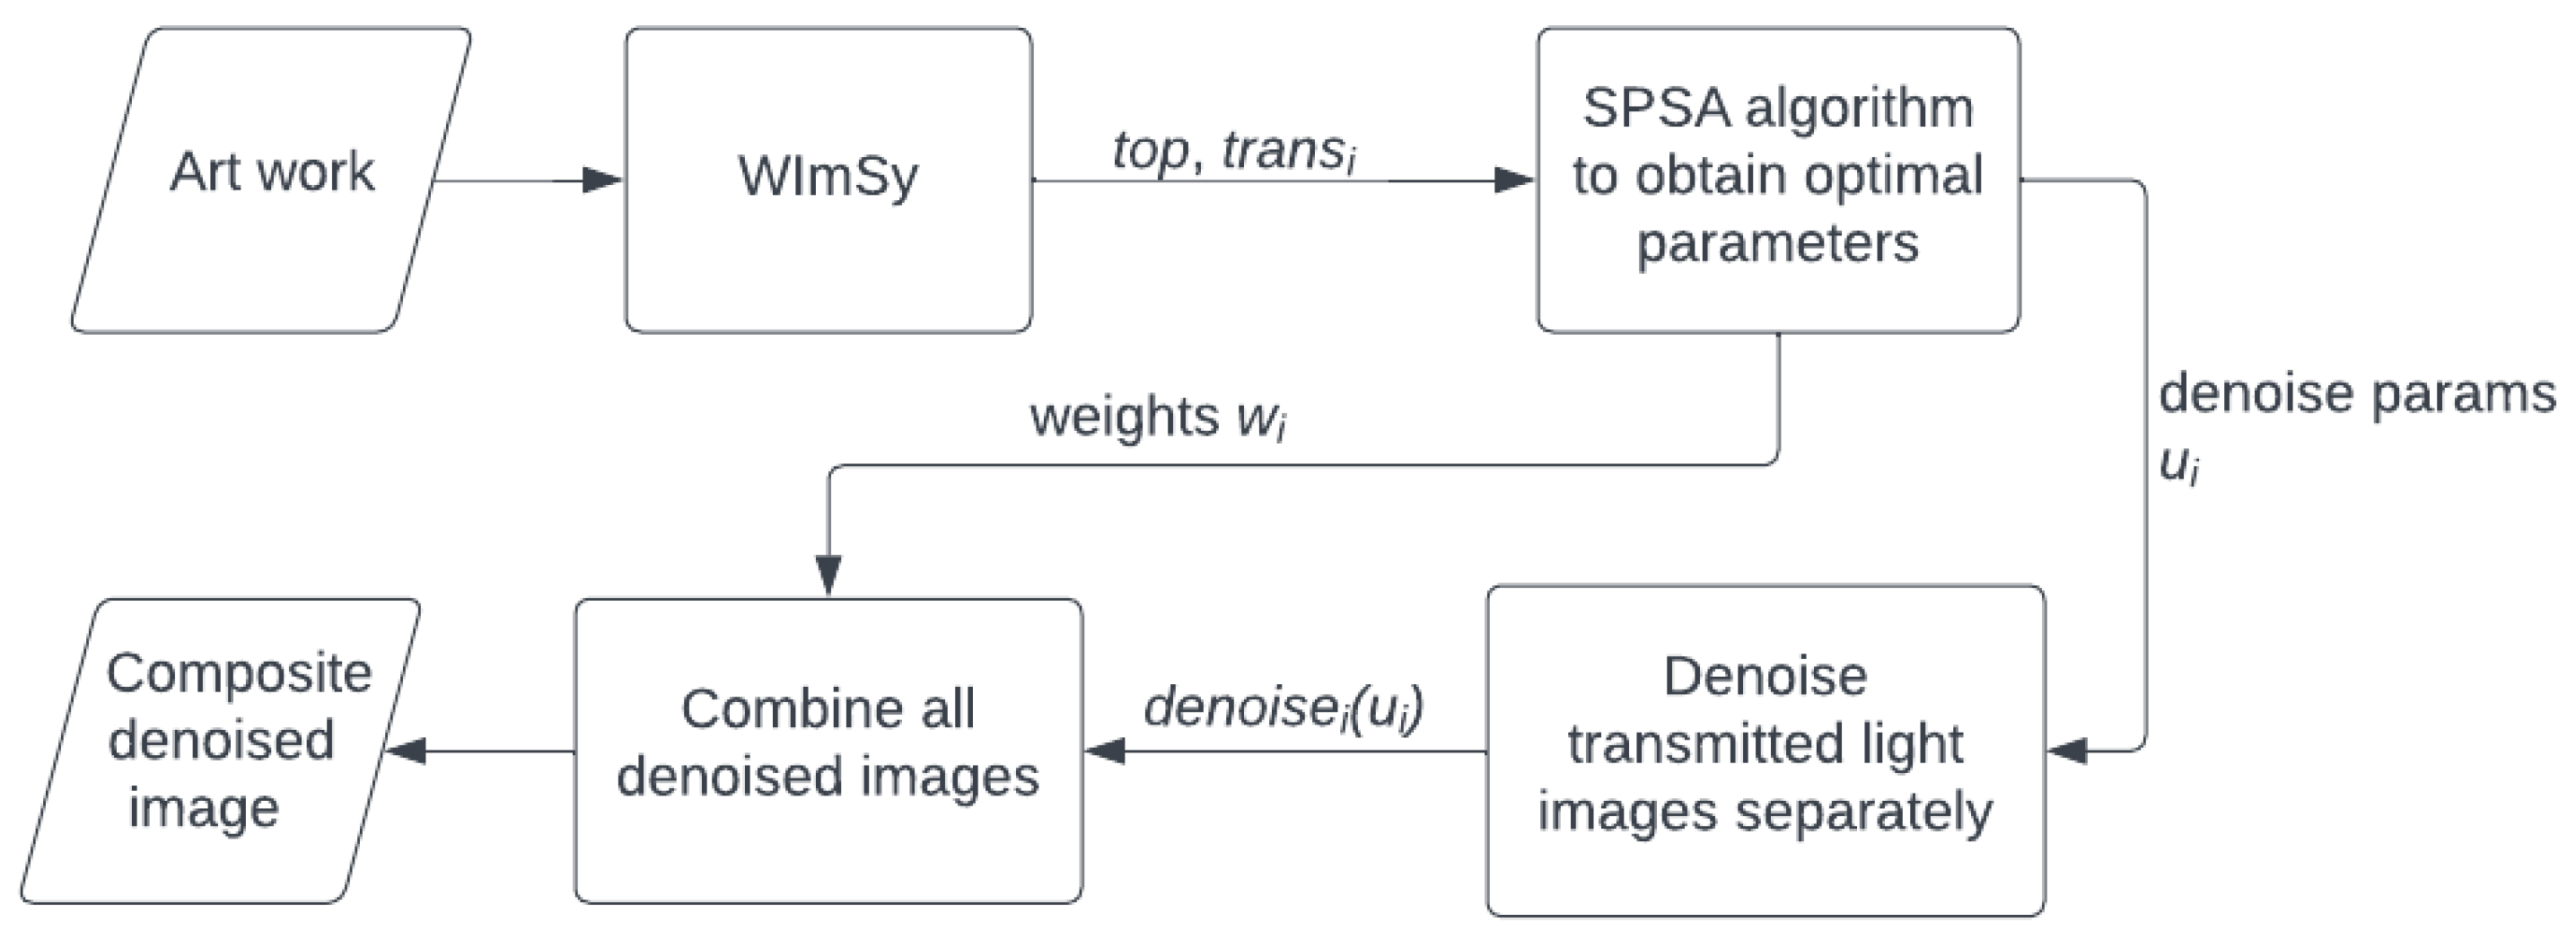
Analogous to the denoising method using a single transmitted light image, as in Section 2.2, we apply a two-step denoising process to a set of multiple transmitted light images using an HDR-like method. Let trans 1 , trans 2 , , trans n be a collection of n transmitted light images, and let t o p be the corresponding surface image. All images are aligned and are the same size. To obtain the denoised images d e n o i s e i corresponding to trans i and t o p , we first denoise each image separately and then combine them using the HDR-like method. The denoised image d e n o i s e i is obtained by subtracting the product of a list of parameters u 1 , u 2 , , u n and t o p from trans i , which can be expressed as follows:
d e n o i s e i ( u ) = trans i u i t o p .
An example of such denoised images are presented in Figure 4.
The denoised images d e n o i s e i ( u ) s are then combined using the weighted sum (4), where w is a weight vector:
d e n o i s e w ( u , w ) = i = 1 n w i d e n o i s e i ( u ) .
To ensure that the resulting image is within the 0 to 1 range, a scaling function S ( · ) , as in Equation (2), is applied:
d e n o i s e s ( u , w ) = S ( d e n o i s e w ( u , w ) ) .
Figure 5 illustrates the combination of denoised images, which yields significantly improved results compared to any single denoised image.
While the proposed method demonstrates effectiveness, the denoising process requires the selection of at least 2 n parameters. Therefore, either the denoising parameters must be manually selected, or an automated algorithm must be designed to select these parameters. The subsequent sections provide further elaboration on the automated selection of denoising parameters.

2.4. Method for Automatic Surface Feature Removal

This section develops an automatic parameter selection mechanism that can help to streamline the denoising process and enhance its practicality when combining multiple transmitted light images. The task of parameter selection can be framed as an optimization problem that seeks to optimize a function that quantifies the effectiveness of the watermark extraction. Subsequent sections describe an approach to the design of an optimization criterion and then propose an algorithm suitable for solving the optimization problem.
A diagram illustrating the complete denoising procedure is presented in Figure 6. The process begins by using the WImSy machine to obtain the surface image t o p along with n transmitted light images t r a n s i with varying exposure times. These images are then passed through an algorithm that estimates the optimal parameters, which are subsequently used with the method outlined in Section 2.4 to generate a composite denoised image.

2.5. An Optimization Criterion for Image Denoising

It is not possible to design the loss function from “first principles” because the goal of the process is to achieve a clear view of the inside of the sheet of paper. Instead, we use a transmitted light image of a blank paper with no surface markings as a “target image”. We selected a sheet from a 1536 edition of De re militari by Vegetius, which we had previously photographed and studied in [11]. The quality of a candidate denoised image can then be assessed by measuring the similarity between it and the target.
Key to this procedure is that a suitable measure of the “distance” or “similarity” must be selected. Pixel-level distance measures are not suitable for this because the images may be of different scales, and will certainly have mis-aligned chain and laid lines. A good candidate is to use a measure of the distance between histograms of the two images. This is useful because it only considers the distribution of pixel brightness and not their specific locations. For example, a poorly denoised image might have a larger percentage of black pixels than the target. By adjusting the denoising parameter λ to make these percentages similar, the image becomes increasingly denoised.
In Figure 7, it can be observed that the shape of the histogram in (b) and (d) are similar but their locations (center of the peaks) are different. This occurs because a denoised image may have different brightness than the target image. Therefore it is necessary to standardize and shift the histograms to ensure that their peaks are aligned. To be concrete, the shifted, denoised image d e n o i s e s h is calculated from the denoised image d e n o i s e s using the mean of the t a r g e t
d e n o i s e s h ( u , w ) = d e n o i s e s ( u , w ) + M e a n ( t a r g e t ) M e a n ( d e n o i s e s ( u , w ) ) ,
where M e a n ( · ) is the average value of all pixels in the image. This shifts the histogram so that the output has approximately the same overall brightness as the target, and the histograms in (f) and (b) have become more similar.
To quantify the difference between histograms, we utilize the Earth Mover’s Distance (EMD) introduced in [12] as a distance measure, which is defined as the minimum cost to transform one histogram to another.
Specifically, given the histogram of the t a r g e t image denoted as t , and the histogram of the denoised image d e n o i s e s h denoted as i , the EMD between t and i is computed as the minimum cost required to transform t into i . This is denoted as E M D ( t , i ) .
Although the EMD loss is generally effective, it may fail to perform well in situations where the image is heavily marked. For example, the overall EMD loss for Figure 8 may be low, but the surface features are not removed completely. To enhance the robustness of the loss function, note that poorly denoised images may exhibit inconsistencies across different regions, whereas well denoised images should have consistent EMD values across all regions. As illustrated in Figure 8, the EMD values for the image vary across four regions. To address this issue, we propose an improvement to the EMD loss by partitioning the image into four regions and selecting the maximum EMD value among them. Hence
E M D 4 ( t , i ) = max ( E M D 4 ( t ,   i 1 ) ,   E M D 4 ( t , i 2 ) ,   E M D 4 ( t , i 3 ) ,   E M D 4 ( t , i 4 ) ) ,
where i k is the histogram of kth part of denoised image.
In addition to optimizing the EMD, it is also helpful to observe that the parameters u and w cannot be arbitrarily large or small. The range of these parameters can be restricted to 0 , 1 by introducing a regularization term R ( · ) , defined as a piecewise function r ( · ) that penalizes values outside this range
r ( x ) = ( x 0.1 ) 2 if x 0.1 0 if 0.1 < x < 0.9 ( x 0.9 ) 2 if x 0.9 . .
When applied to multiple parameters, the regularization term is defined as
R ( u , w ) = i = 1 n r ( u i ) + i = 1 n r ( w i ) .
Combining the robust version of EMD loss and the regularization term gives
L ( u , w ) = E M D 4 ( t , i ) + λ R ( u , w ) ,
where λ is a hyperparameter controlling the effect of the constraint on the range of the parameters.

2.6. Optimizing the EMD

After specifying the loss function L ( u , w ) in Equation (10), the next step is to devise an efficient optimization algorithm that can solve for the optimal parameters. A commonly used method for parameter optimization is grid search, which involves iterating through all possible parameter combinations within a parameter space of 2 n × 2 n and comparing the resulting losses. However, this approach can be extremely slow, particularly when dealing with a large number of parameters, and it can be challenging to determine an appropriate grid size. An alternative method is gradient descent, which relies on calculating the gradient of the loss function with respect to the optimization parameters. However, since the EMD requires calculating histograms, it is not straightforward to compute the gradient directly.
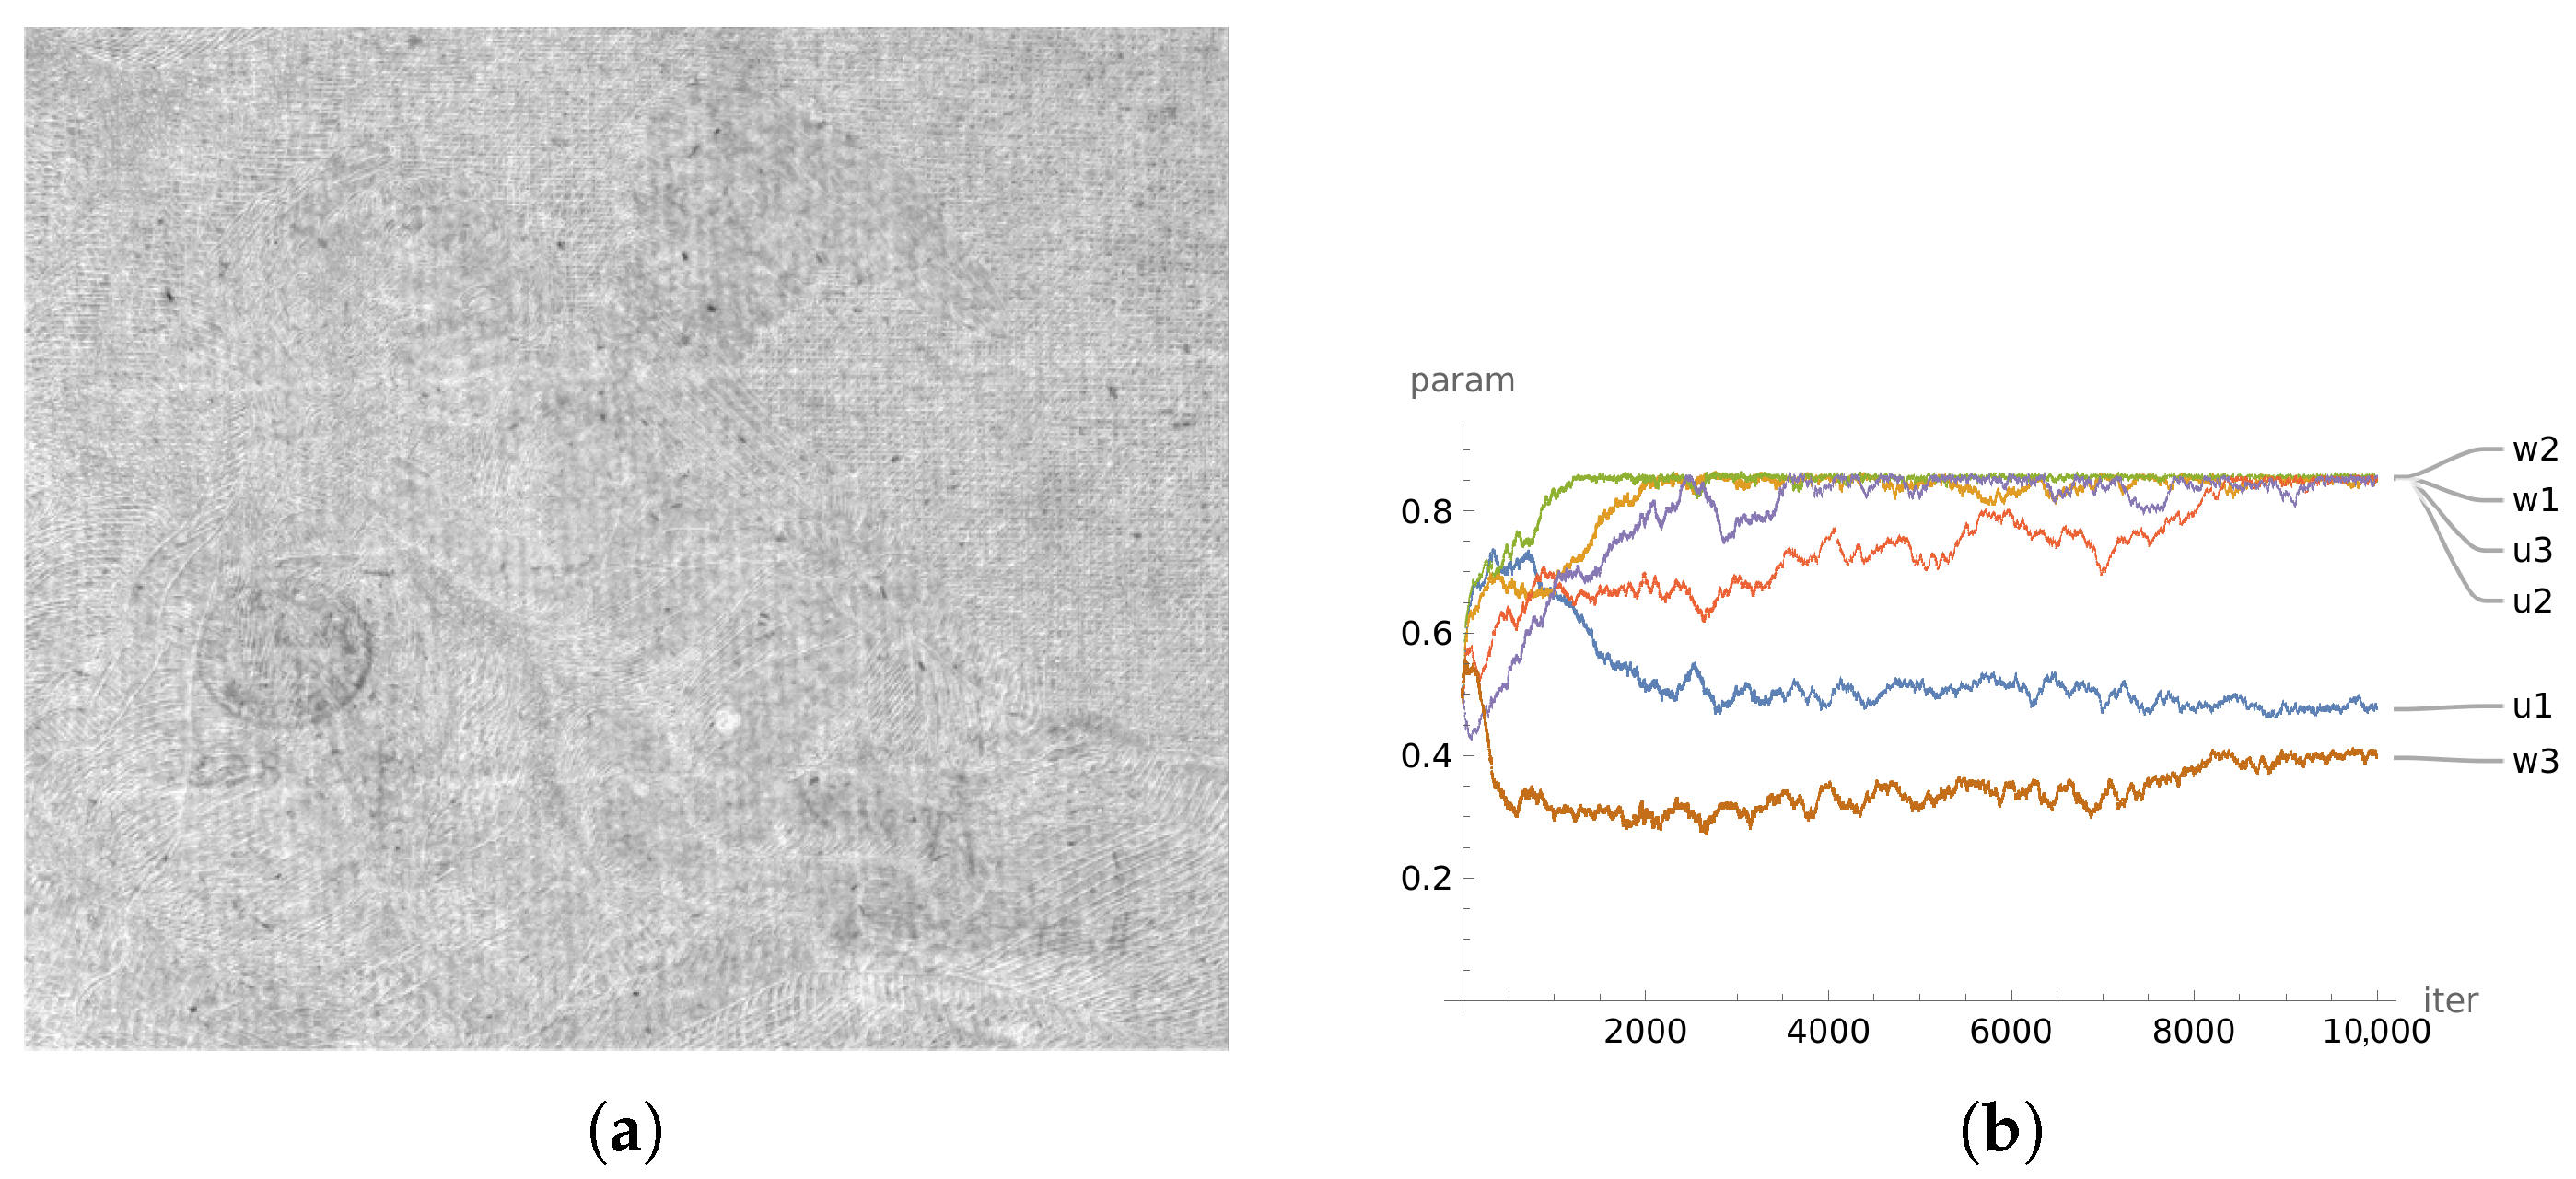
To overcome this challenge, we adopt the Simultaneous Perturbation Stochastic Approximation (SPSA) algorithm as described in Algorithm 1, see [13,14]. SPSA approximates the gradient with a small number of evaluations of the loss function, allowing the parameter estimation to converge in a gradient-like fashion. Another advantage of SPSA is that the computation time need not scale with the number of parameters; even when dealing with multiple transmitted light images, the algorithm remains (almost) as fast as when operating on a single image.
Each iteration of the SPSA algorithm perturbs the parameters in a random direction by a small amount δ , and then estimates the gradient based on the changes in the value of the loss function resulting from these perturbations. The algorithm is:
Algorithm 1 Simultaneous Perturbation Stochastic Approximation (SPSA) Algorithm
Input: 
Initial guess of parameters p ( 0 ) , step size a, perturbation size δ , number of iterations N, current minimum loss L = inf , current minimum parameter θ = p ( 0 )
 1:
  for  k = 0 , 1 , 2 , , N 1  do
 2:
      Choose random perturbation Δ ( k ) with components ± 1
 3:
      Calculate estimated gradient:
 4:
       g ^ j ( k ) = L ( p ( k ) + δ Δ ( k ) ) L ( p ( k ) δ Δ ( k ) ) 2 δ Δ j ( k ) for j = 1 , 2 , , 2 n
 5:
      Update parameters:
 6:
       p ( k + 1 ) = p ( k ) a g ^ ( k )
 7:
      if  L ( p ( k ) ) < L  then
 8:
           L = L ( p ( k ) ) , p = p ( k )
 9:
      end if
  10:
  end for
Output: 
Optimized parameters p
Here, p represents the vector of parameters to be optimized, which is a concatenation of u and w . n is the number of transmitted light images, and L ( p ) is the loss function being minimized defined in Equation (7). The algorithm iteratively updates the parameters by estimating the gradient using random perturbations of the parameter vector. The step size a determines the size of the update, and the perturbation size δ controls the magnitude of the perturbations. The algorithm runs for a fixed number of iterations N, and returns the optimized parameters p .

3. Results

We evaluated the behavior of the denoising algorithm by applying it to images captured using the WImSy. Automatically denoised images obtained using the SPSA algorithm of Section 2.6 implementing the EMD optimization criterion of Section 2.5 were compared with manually denoised images. As there is no explicit “cost function” tied to the denoising process, the generation of these manually denoised images involved adjusting parameters and selecting the best possible outcome based on human judgment.
The hyperparameters used in the SPSA algorithm were: N = 10,000 iterations, perturbation parameter δ = 0.05 , and step size a = 0.5 . Typical learning curves as the parameters evolved during the optimization process are shown in Figure 9b as the number of iterations increased. The stability of all parameters after approximately 8000 iterations demonstrates that the algorithm has converged. Figure 9a displays the denoising results obtained using the optimized parameters.
Throughout our visits to the MET and the Getty, we extensively photographed approximately 120 objects, gaining substantial experience in applying the method. Due to space limitations, we selected a subset of these objects to showcase in the paper. Figure 10 provides examples of the denoising of three artworks and a comparison of the automated algorithmic results and manual denoising. The manual process involves the individual combination of transmitted light images and top image via the selection of parameters u and w through trial and error. The automated denoising uses the same parameters, but with values u and w selected via the SPSA algorithm. As demonstrated in Figure 10, the results obtained with the algorithm are comparable to, though slightly different to, those obtained via manual denoising. It should be noted that the denoising procedure (either automated or manual) is not guaranteeed to work in all cases, particularly when there is not enough information in the transmitted light images, such as might occur when there is too much opaque interference, such as thick ink. For example, in the third art work in Figure 10g–i, dark spots can be observed, which correspond to paper areas covered by heavy ink, leading to a lack of light transmission and making it difficult to reveal the subsurface features.

4. Discussion

This study has investigated the feasibility of utilizing the WImSy machine to reveal watermarks (and other subsurface features) in historical artworks. The availability of both surface and transmitted light images, which are precisely aligned, simplifies the denoising process. We exploited a watermark extraction method that involves the simple subtraction of weighted versions of the surface image from the transmitted light images. When combining information from multiple transmitted light images, the method requires numerous parameters that may be challenging to adjust manually. To address this issue, we have proposed an automatic parameter selection procedure based on the optimization of the EMD distance between the denoised image and a target template that measures the effectiveness of watermark extraction. Optimizing the loss function can be accomplished using an iterative method such as the SPSA algorithm, which estimates the gradient of the loss function without explicitly calculating it, and is independent of the number of transmitted light images.
The proposed denoising algorithm was evaluated on the image dataset obtained from the WImSy, and the automatically denoised images were comparable to those adjusted by hand, indicating the efficacy and practicality of our proposed approach.
There are several directions for future work. Firstly, we plan to investigate the design of a loss function that is better aligned with human perception. We also aim to explore modifications to the SPSA algorithm to achieve a faster running time without sacrificing performance.
Another important aspect of our work is to expand the dataset of artworks. While the particular type of paper does not significantly impact our method, we have tailored our optimization method towards historically laid paper to align with the specific interests of the involved museums. The efficacy of the method is primarily influenced by the characteristics of the surface markings themselves, and challenges arise when dealing with thick ink layers that hinder light penetration. By gathering more diverse artworks, we can increase the robustness and generalizability of our improved algorithm. In addition, in our current method, we only utilize the top images and transmitted light images. In the future, we hope to incorporate raking light images, which can reveal fine details about the surface of the artworks. This may provide more information for the denoising procedure and improve the accuracy of the watermark recovery.

Author Contributions

Conceptualization, P.M. and W.S.; methodology, E.O. and W.S.; algorithm and software, E.O., R.L. and W.S.; hardware design, A.M. and P.M.; writing—original draft preparation, E.O.; writing—review and editing, all; funding acquisition, W.S. and P.M. All authors have read and agreed to the published version of the manuscript.

Funding

This research was funded by The Getty Foundation grant “Computational Characterization of Historic Papers via Watermarks, Chain Lines, and Laid Lines”, MSN252869.

Data Availability Statement

All software discussed in this paper will be released under a Creative Commons license and available at our website at https://leocode.org/?page_id=2509 (accessed on 28 June 2023).

Acknowledgments

The authors would like to thank C. Richard Johnson Jr of Cornell University and Margaret Ellis of New York University, along with the many attendees at the demonstrations of the WImSy held at the MET in October 2022 and at the Getty in February 2023. Additionally, the authors would like to acknowledge the support of the John Pritzker Family Fund.

Conflicts of Interest

The authors declare no conflict of interest. The funders had no role in the design of the study; in the collection, analyses, or interpretation of data; in the writing of the manuscript; or in the decision to publish the results.

Abbreviations

The following abbreviations are used in this manuscript:
EMDEarth Mover’s Distance
HDRHigh Dynamic Range
METMetropolitan Museum of Art
SPSASimultaneous Perturbation Stochastic approximation
WImSyWatermark Imaging System

Notes

1
The artwork St. Peter and St John Healing the Paralytic, MET catalog number 11.85, is used with permission.
2
The artwork Man Leading a Camel, MET catalog number 08.227.36, is used with permission.

References

  1. Ash, N. Recording watermarks by beta-radiography and other means. In The Book and Paper Group Annual; The American Institute for Conservation: Washington, DC, USA, 1982; Volume 1. [Google Scholar]
  2. Zhang, Z.; Ewert, U.; Barrett, T.D.; Bond, L.J. Paper watermark imaging using electron and low energy X-ray radiography. In AIP Conference Proceedings; AIP Publishing LLC: Melville, NY, USA, 2019; Volume 2102, p. 030004. [Google Scholar]
  3. Van Aken, J. An improvement in Grenz radiography of paper to record watermarks, chain and laid lines. Stud. Conserv. 2003, 48, 103–110. [Google Scholar] [CrossRef]
  4. van Staalduinen, M.; van der Lubbe, J.C.; Dietz, G.; Laurentius, T.; Laurentius, F. Comparing X-ray and backlight imaging for paper structure visualization. In EVA-Electronic Imaging & Visual Arts; Pitagora: Florence, Italy, 2006; pp. 108–113. [Google Scholar]
  5. The Memory of Paper. Available online: https://www.memoryofpaper.eu/ (accessed on 10 April 2023).
  6. Boyle, R.D.; Hiary, H. Watermark location via back-lighting and recto removal. Int. J. Doc. Anal. Recognit. (Ijdar) 2009, 12, 33–46. [Google Scholar] [CrossRef]
  7. Ellis, M.H.; Sethares, W.; Johnson, C.R., Jr. A Powerful Tool for Paper Studies: The Computational Coding of Watermarked Papers in Leonardo’s Codex Leicester and Codex Arundel. Q. J. Br. Assoc. Pap. Hist. 2021, 119, 1–18. [Google Scholar]
  8. Campbell, A.; Johnson, C.R., Jr.; Sethares, W. From Rags to Riches: Pursuing the Connection between Albrecht Durer’s Linen Papers and the Fugger Family’s Mercantile Trademark. Q. J. Br. Assoc. Pap. Hist. 2022, 124, 1–10. [Google Scholar]
  9. Sethares, W.A.; Ellis, M.H.; Johnson, C.R. Computational Watermark Enhancement in Leonardo’s Codex Leicester. J. Am. Inst. Conserv. 2020, 59, 87–96. [Google Scholar] [CrossRef]
  10. Artusi, A.; Richter, T.; Ebrahimi, T.; Mantiuk, R.K. High Dynamic Range Imaging Technology [Lecture Notes]. IEEE Signal Process. Mag. 2017, 34, 165–172. [Google Scholar] [CrossRef] [Green Version]
  11. Gorske, S.F.; Johnson, C.R.; Ellis, M.H.; Sethares, W.A.; Messier, P. Moldmate identification in pre-19th-century European paper using quantitative analysis of watermarks, chain line intervals, and laid line density. Int. J. Digit. Art Hist. 2021, 5, 6–14. [Google Scholar] [CrossRef]
  12. Rubner, Y.; Tomasi, C.; Guibas, L.J. The earth mover’s distance as a metric for image retrieval. Int. J. Comput. Vis. 2000, 40, 99. [Google Scholar] [CrossRef]
  13. Spall, J.C. Multivariate Stochastic Approximation Using a Simultaneous Perturbation Gradient Approximation. IEEE Trans. Autom. Control 1992, 37, 332–341. [Google Scholar] [CrossRef] [Green Version]
  14. Spall, J.C. A One-Measurement Form of Simultaneous Perturbation Stochastic Approximation. Automatica 1997, 33, 109–112. [Google Scholar] [CrossRef]
Figure 1. WImSy at work: (a) depicts the WImSy machine illuminating and photographing the surface of the paper, while (b) shows it capturing the transmitted light image with the bottom light sheet illuminated. The resulting images are shown in Figure 2.
Heritage 06 00270 g001
Figure 2. WImSy was introduced at the MET on 10 October 2022 and 50 works of art were photographed and documented over the course of an afternoon. (a) Surface image of St. Peter and St John Healing the Paralytic, MET Catalog number 11.85. Used with permission of the MET. (b) Transmitted light image of St. Peter and St John Healing the Paralytic from (a).
Heritage 06 00270 g002
Figure 3. Graphical user interface allowing user to combine surface and transmitted light images using a single slider to control the amount of denoising. Looking closely at the denoised image reveals a clear watermark, chain lines, and laid lines, even in the parts of the image previously occluded by the drawing. (a) Grayscale version of surface image from Figure 2. (b) Denoised image showing the results of the manual denoising process in which the user adjusts the “Remove” slider until the watermark appears as clearly as possible.
Heritage 06 00270 g003
Figure 4. Denoising using several transmitted light images. The artwork Cupid Resting (copy), MET catalog number 17.3.853, is used with permission. (a) Grayscale version of the surface/top image. (b) Transmitted light image with exposure time 1/4 s and f/11. (c) Denoised image from (b) with u = 0.6 . (d) Transmitted light image with exposure time 1 s and f/8. (e) Denoised image from (d) with u = 0.9 . (f) Transmitted light image with exposure time 16/5 s and f/8. (g) Denoised image from (f) with u = 0.4 .
Heritage 06 00270 g004
Figure 5. Denoising results using a combination of transmitted light images with different camera settings, as shown in Figure 4, with the proposed method.
Heritage 06 00270 g005
Figure 6. Pipeline of automatic surface feature removal system.
Heritage 06 00270 g006
Figure 7. Target image, denoised image1, shifted denoised image, and their corresponding histograms. (a) Target image. (b) Target image histogram. (c) Denoised image. (d) Denoised image histogram. (e) Denoised image after histogram shifting. (f) Denoised image histogram after shifting.
Heritage 06 00270 g007
Figure 8. This image2 displays the EMD losses obtained by partitioning into four parts, with the corresponding values of 0.0462184, 0.0380154, 0.072014, and 0.0452574, arranged from top left to bottom right.
Heritage 06 00270 g008
Figure 9. Results and learning curve of parameters while there are three transmitted light images. The artwork is Cupid Resting (copy), with MET catalog number 17.3.853. (a) Denoising algorithm result. (b) Learning curve of parameters.
Heritage 06 00270 g009
Figure 10. Comparison between original pictures (a,d,g), manually denoised pictures (b,e,h) and denoised pictures with our proposed algorithm (c,f,i). Images are cropped from MET Cupid Resting (copy) (17.3.853), Landscape with Ruins (65.104), Two Studies of a Woman Reading (29.100.932), respectively. All are used with permission.
Heritage 06 00270 g010aHeritage 06 00270 g010b
Disclaimer/Publisher’s Note: The statements, opinions and data contained in all publications are solely those of the individual author(s) and contributor(s) and not of MDPI and/or the editor(s). MDPI and/or the editor(s) disclaim responsibility for any injury to people or property resulting from any ideas, methods, instructions or products referred to in the content.

