Article

Change Detection between Retrospective and Contemporary 3D Models of the Omega House at the Athenian Agora

by
Antigoni Panagiotopoulou
1,2,
Colin Allan Bruce Wallace
3,
Lemonia Ragia
1,* and
Dorina Moullou
4
1
Information Management Systems Institute, Athena Research Center, 15125 Marousi, Greece
2
Department of Surveying and Geoinformatics Engineering, University of West Attica, 12243 Egaleo, Greece
3
Department of Geography, University of Waterloo, Waterloo, ON N2L 3G1, Canada
4
Hellenic Ministry of Culture and Sports, 10682 Athens, Greece
*
Author to whom correspondence should be addressed.
Heritage 2023, 6(2), 1645-1679; https://doi.org/10.3390/heritage6020088
Submission received: 9 December 2022 / Revised: 29 January 2023 / Accepted: 1 February 2023 / Published: 4 February 2023
(This article belongs to the Special Issue 3D Modeling for Cultural Heritage and Applications)

Abstract

:
Archaeological monuments all over the world face problems of conservation and maintenance due to natural events and processes as well as human intervention, all of which lead to their alteration and deterioration. In particular, monuments and sites that have been excavated and left exposed to the elements experience decay, which would have taken centuries prior to excavation, in just a few years when left unprotected. Thus, the necessity to detect and observe changes over time becomes paramount. Legacy data and, in particular, retrospective photogrammetric modeling, are vital tools in this process. In this work we compare two photogrammetric 3D models of the Omega House, in the Athenian Agora, to assess how much the site has changed between the time of its first excavation in 1972 and its current state. Constructive Solid Geometry (CSG) is utilized to perform Boolean operations. Additionally, distance and volume calculations are performed. The software CloudCompare was used for this work. Overall, the state of Omega House monument proves to have been preserved from 1972 to 2017, except for certain differences that are highlighted as follows: The central north part of the monument in the model 2017 presents increased volume per 7.86% in comparison with the model 1972. The northeast part of the monument in the 2017 model shows decreased volume per 5.11% when compared to the model 1972. Moreover, the calculated distances between the two models from 1972 and 2017 present the greatest values in the case of the southwest and northwest parts of the monument, ranging between −17 cm to 5 cm.

1. Introduction

Archaeological sites, heritage buildings, and artefacts across the globe constitute vulnerable aspects of our cultural heritage, whichencounter various and ongoing challenges. Natural threats, with extreme events like earthquakes and storms, natural processes such as erosion and vegetation, as well as human intervention including excavation without preservation, pollution, uncontrolled urbanization and tourist development, give rise to significant problems in presentation and preservation [1]. Human actions that affect archaeological sites are known as cultural formation processes, while how nature affects the survival of archaeological evidence is called natural formation processes. Therefore, in everyday protocols preventative measures are required as an essential means of preserving these sites and artefacts. The surfaces of monuments experience material changes that can lead to biological alteration, material exfoliation and decay [2], as well as structural issues [3]. With the intention of surveying deterioration and monitoring the general condition of monuments, multidisciplinary approaches have been presented in the literature, notably, multiple sensors and non-destructive testing (NDT) techniques [4,5]. In fact, accurate digital 3D models of monuments [6] can serve to monitor the condition of the subject through algorithmic processing of change detection.
In the past two decades, photogrammetric 3D modeling of archaeological sites has become common place and is increasingly required in excavation projects. Such modeling was virtually impossible or financially prohibitive in the time of analogue photography. In recent years, however, methods of extracting data from archival materials to create 3D models have been developed [7,8,9,10]. The re-use of archival materials in retrospective photogrammetry allows us to take a fresh look at the past condition of archaeological sites as they were when first excavated, employing those materials in ways that their creators may never have imagined. In creating 3D modeling of sites as they were in the past, researchers are now able to look at the excavations and structures from perspectives that were never photographed. The question that this paper addresses is the ability to use retrospective models in comparison to contemporary models for the purpose of assessing deterioration relative to time, preservation, and natural processes. Two 3D models of a site, a retrospective and a contemporary, will be used as a case study.
The two models that have been constructed are of Omega house: a luxurious residential complex of the Roman period in the Athenian Agora. The first model is as it was when excavated in 1972, and the second is of the site after 45 years in 2017 [6,7].
Omega house was chosen for the retrospective aspect of this project based on the thoroughness of documentation during its excavation. For retrospective photogrammetry to succeed, broad views of the location need to have been photographed. Some archaeological sites do not lend themselves to retrospective techniques if the photographer or site director has chosen to focus too closely on individual elements. Understandably, at that time film, processing, printing and even photographic setup were limiting factors. In the case of Omega house, site director John Camp and photographer Craig Mauzy not only photo-documented the site in great detail, but also captured a significant number of all-encompassing photos thatallow elements to be joined together in a contiguous model. In addition, not only were such photographs taken throughout the dig as well as during site cleanup, but serendipitously J. Wilson Myers and Eleanor Emlen Myers were photographing Greek archaeological sites using a blimp at that time and documented Omega house from the air. While this was definitely a factor in the successful modeling of the 1972 version of the site, it is not a limiting factor in other digs. Detailed site plans can be incorporated into the modeling to unify disparate images. Contributing to the purpose-made photographs and site plans, documentation done with paintings, surveys and even amateur snapshots can all be employed in creating more cohesive retrospective models. Moreover, “gaps” in the photographic record can be augmented in cases where the surrounding elements are known to be stable and filler from contemporary photographs can be used.
In this paper, we compare the two models using Constructive Solid Geometry (CSG) operations [11,12,13,14,15,16] for performing Boolean operations on the Omega House models; additionally, distance and volume calculations are performed. Omega House monument can show the way that natural processes affect an exposed archaeological site. The 3D photogrammetric models of the site dated in 1972 and 2017 (Figure 1) enable the examination and measurement of the site aspects. The Boolean operation of difference can reveal if and to what extent the contemporary model has changed in comparison with the retrospective model. The Boolean operation of intersection can give the common portion of the two models; thus, it can disclose the monument parts that have not been altered throughout the time of 45 years. The volume calculations can reveal whether material decay has occurred or not. Regarding the distance calculations performed, they can indicate variations in the terrain during the time of intercomparison. This work is organized into five sections: The literature on 3D change detection is presented in Section 2. The methodology of comparing the Omega House 3D models is described in Section 3, whilst the obtained results are given in Section 4. Discussion of the study is presented in Section 5, and the Conclusions are drawn in Section 6.

2. Literature on 3D Change Detection

2.1. Monumental Conservation

Remote sensing methodologies and particularly change detection algorithms are favourable approaches in the documentation and monitoring of monuments and archaeological sites. Change detection aims at recognizing and evaluating differences on a surface over time. Essentially, a map of changes is constructed by processing two or more images or maps of the same area having been acquired at different times [5,17,18]. In this work [5], change detection algorithms are applied to high-resolution RGB orthophotos and to dense image matching 3D point clouds of the site. Moreover, a set of different NDT and low-cost techniques are combined for further recognizing the occurrence of alterations. Multivariate alteration detection, maximum autocorrelation factor algorithms that are often applied to remotely sensed images, have proven to be successful for small-scale application to buildings. A 3D analysis has been carried out to supplementally integrate and complete the previously mentioned results. The proposed approach could prove useful for monitoring frescoes, paintings and artefacts in general thatare exposed to deterioration. The particular study results in the data interpretation are not always explicit, and thus a validation is required through iterative refinement and cross-checking with different data types. In the study [17] a novel methodology of combining change detection algorithms with photogrammetry for documentation and monitoring of a painted surface restoration is presented. A 3D study is also used to assess the Byzantine icon geometric features before and after the restoration procedure. Specifically, a shape analysis of the wooden support is performed for the recognition of obscure deformation patterns. A digital methodology was adopted, where firstly a photogrammetric survey is carried out, leading to the point cloud and orthophoto generation. Afterwards, 2D as well as 3D detection of changes through time, regarding eleven orthophotos, takes place. The final stage consists of the data interpretation. The study pointed out the significance of correct light setup and the necessity of constant and uniform illumination to avoid radiometric artefacts. Additionally, the correct alignment of image datasets is of paramount importance. The presented approach could find broad applicability in the heritage science domain, in case of exposition to decay due to incorrect conservation conditions.Furthermore, Ref. [18] investigates the prospective usefulness of Terrestrial Laser Scanning (TLS) and of the Multiscale Model to Model Cloud Comparison (M3C2) surface change detection method for surveilling and conserving ancient earthen architecture. All-inclusive site monitoring programs following UNESCO periodic reporting guidelines are also generated. The approach in [18] is evaluated on 3-D TLS datasets over a period of six years to account for the deterioration of mud brick structures at Catalhöyük, Turkey. The goal is to find out material loss in walls and buildings, recognize possible basic causes as well as to organize a plan for future physical interventions. Change patterns which are detected show the risk of deterioration for certain wall features appearing to be more prone to decay. In fact, this particular methodology could prove useful for enhancing site monitoring and applying preventative on-site interventions at large earthen sites in the Mediterranean, Middle East, Africa, Europe, and the Americas. The number of scans varied throughout the years of survey to produce a more accurate, 3-D documentation of the case study including variables. The fluctuations in number of scans and resulting difference in point density during each year get compensated by filter processing. Thus, fairly homogenous data were finally obtained for the point cloud comparison and analysis.
A methodological framework for the detection and monitoring of archaeological sites by means of autonomous service drones is proposed in [19]. RGB, depth, and thermal cameras are mounted on an autonomous drone for low-altitude data acquisition. A user interface is eventually designed to monitor the inspected regions over time. A novel mosaicking algorithm for the alignment and aggregation of the acquired images is presented, where a novelty lies in the Artificial Intelligence (AI)-based change detection algorithm. A pretrained YOLO model detects built cultural heritage within the orthomosaics that are generated by the video mosaicking algorithm. Then, the detected cultural heritage structures are post-processed by a segmentation tool. The latter serves tocreate a 3D representation of the detected built heritage. Overall, the mosaicking and alignment functionalities of commercial photogrammetry software have been resourcefully reproduced. Simultaneously, a novel depth-relying modality and increasing flexibility have been introduced where the proposed methodology can identify the suitable time in which any thermal anomalies in the ground present more chromatic evidence on the images.
Furthermore, how terrestrial 3D laser scanning can be employed for the detection and monitoring of changes to the Okotoks Erratic “Big Rock” Provincial Historic Resource in Alberta, Canada, during the time interval of 7 years from 2013 to 2020 is demonstrated in [20]. The CloudCompare software is used. This study results in movement or repositioning of rocks around the base of the erratic appearance of “off the record” paths, as well as changes to interpretive trails and fencing. This is the first study that utilizes terrestrial laser scanning for change detection analysis on a heritage site over a time interval as long as 7 years. The results presented here depend on the accuracy of the terrestrial LiDAR data. A network of TLS instrument locations that maximize the coverage of the main boulders is set up. The small rocks which are detected to present obvious offsets all have alike levels of coverage across the two data sets being compared. In a similar manner, vegetation occlusions could influence TLS coverage and thus accuracy for smaller rocks and boulders. Nevertheless, vegetation was manually removed from the point cloud prior to processing. Moreover, no important offsets were noted on other smaller rocks with higher levels of vegetation occlusion and poorer coverage. Finally, while filtering was used on the Okotoks data sets as they were too large to process, all the point clouds were down sampled with the same strategy and to the same resolution. Concluding, the offsets which were identified in this study were due to factors of erosion and human/animal activity.

2.2. General Applicability

Since modeling software is getting broadly utilized and specifically 3D models are becoming more composite and need input from more users, there arises the issue of preserving large scenes over time. Moreover, different versions of 3D models resulting from a location edited inparallel by various users, may need to be merged. The work [21] presents the open-source tool, 3D Diff, that supports differentiating and merging of 3D models. Initially, differences between the 3D models are automatically recognized by noting correspondences and discrepancies between them. Then, merging is done using an interactive tool that selects between the detected changes. A user study conducted indicates the 3D Diff to be an effective way of merging 3D models. Moreover, building 3D models of the environment is often encountered in robotics since they are required for a broad range of applications. In the case of a notable change in the environment, existing models must be renewed. It is preferable that repeating the whole mapping process is avoided and the mapping is focused on possible regions that have altered;consequently, the true recognition of locations that have changed in a 3D model is significant. In the work [22], a new methodology to identify geometric changes between the present-day states of site environment and 3D modeling based on the site’s former state, by means of a short sequence of images, is proposed. The changes in the images are identified by means of their re-projection onto each other, passing through the 3D model. The inconsistencies from multiple pairs of images are fused to remove the ambiguities about potential changes. Then, the locations of changes can be recognized via a mean 3D point and a covariance matrix. The experimentation carried out demonstrates that the proposed approach faithfully identifies the changes in the environment with only five images, whilst the total computational time is smaller than 2 s.
Additionally, the work [23] gives a multi-temporal underwater photogrammetric survey of a reef patch situated in Moorea, French Polynesia, designed to detect a coral growth of 10–15 mm/year. Structure-from-Motion photogrammetry and underwater imagery allow the 3D quantification of the reef structures along with their ecologically associated characteristics. The final accuracies of photogrammetric reconstructions are in the order of 1 cm and few millimeters for the 2017 and 2018 monitoring campaigns, correspondingly. The straight comparison of the two subsequent point clouds helps to evaluate trends in growth and perform morphometric analyses. For precise quantitative assessment of any local changes, an analysis of 2D profiles that are easily produced from the point clouds can be followed. Furthermore, digital maps are normally provided by National Mapping Agencies in most countries. These maps need to be regularly updated, where traditional change detection is difficult because of intense noise resulting from temporal changes. The study [24] presents a technique to detect changes between two time points utilizing 2.5D data and then to apply these interpretations to a digital map. A machine-learning model, whichrelies on gradient boosting, gets trained with features being collected from the input data for every polygon in the map. The area of study is Haarlem in the Netherlands. The proposed methodology proves effective regarding the number of detected changes as well as the subsequent assistance of the manual updating of the map.
Promising comparison outcomes would be obtained through the application of artificial intelligence-based techniques [25,26] when intercomparing monuments. The 3D change detection relying on deep learning is a powerful tool to be exploited in the area of archaeological monuments monitoring [27].

3. Materials and Methods

3.1. Accuracy Assessment

In this paper we compare two 3D models: the 1972 retrospective and the contemporary 2017. The models that are used are already georeferenced. The 1972 retrospective 3D model is based on archival photographs, drawings, and plans, and is georeferenced using reference points on features common to many photographs. The tool used was AgisoftPhotoscan [6]. At that time camera calibration was not possible, and for some archival photos there is no information or metadata about the camera used. To draw a conclusion about the accuracy of the model is not a trivial problem. However, by incorporating plans and drawings of retrospective 3D modeling as though they are all photographs, geometries within a digital model can be “pulled together”, leading to greater accuracy. The contemporary 3D model was produced with close-range photogrammetry, and the resulting model error is below 1 cm. In this case we cannot compare the two models because the 1972 model accuracy is unknown, but the model with high accuracy can be used as a reference to find out the relative accuracy of the old one. Table 1 and Table 2 present the computations of Accuracy terms. More specifically, for a total of 20 checkpoints of the Omega House model, Table 1 gives the Easting, Northing and Elevation residuals in meters, where the differences of the 1972 model from the 2017 model have been calculated. The corresponding accuracy terms, namely mean, standard deviation and RMSE values, are presented in Table 2. According to Geospatial Positioning Accuracy Standards [28], 20 points are enough for the calculation of the relative accuracy of the retrospective model regarding the contemporary model.
The positional accuracy RMSEris equal to the horizontal radial RMSE [29]. It is calculated as the square root of the sum RMSEx2 + RMSEy2 and presents the value of 0.483 m. To evaluate the accuracy, among the various accuracy assessment methodologies that have been used in the literature, ASPRS standard has gained wide diffusion and acceptance [29]. According to the ASPRS standard, the horizontal accuracy named Accuracyr is calculated as follows:Accuracyr = 1.7308 × RMSEr and presents the value of 0.836 m. The vertical accuracy in non-vegetated terrain, which is our study case, is calculated as follows Accuracyz [NVA] = 1.96 × RMSEz and presents the value of 3.518 m. These are the accuracies in the 95% confidence level, which means that 95% of the positions in the 1972 dataset will have an error to the groundtruth positions 2017 that is equal to or smaller than the reported accuracy.

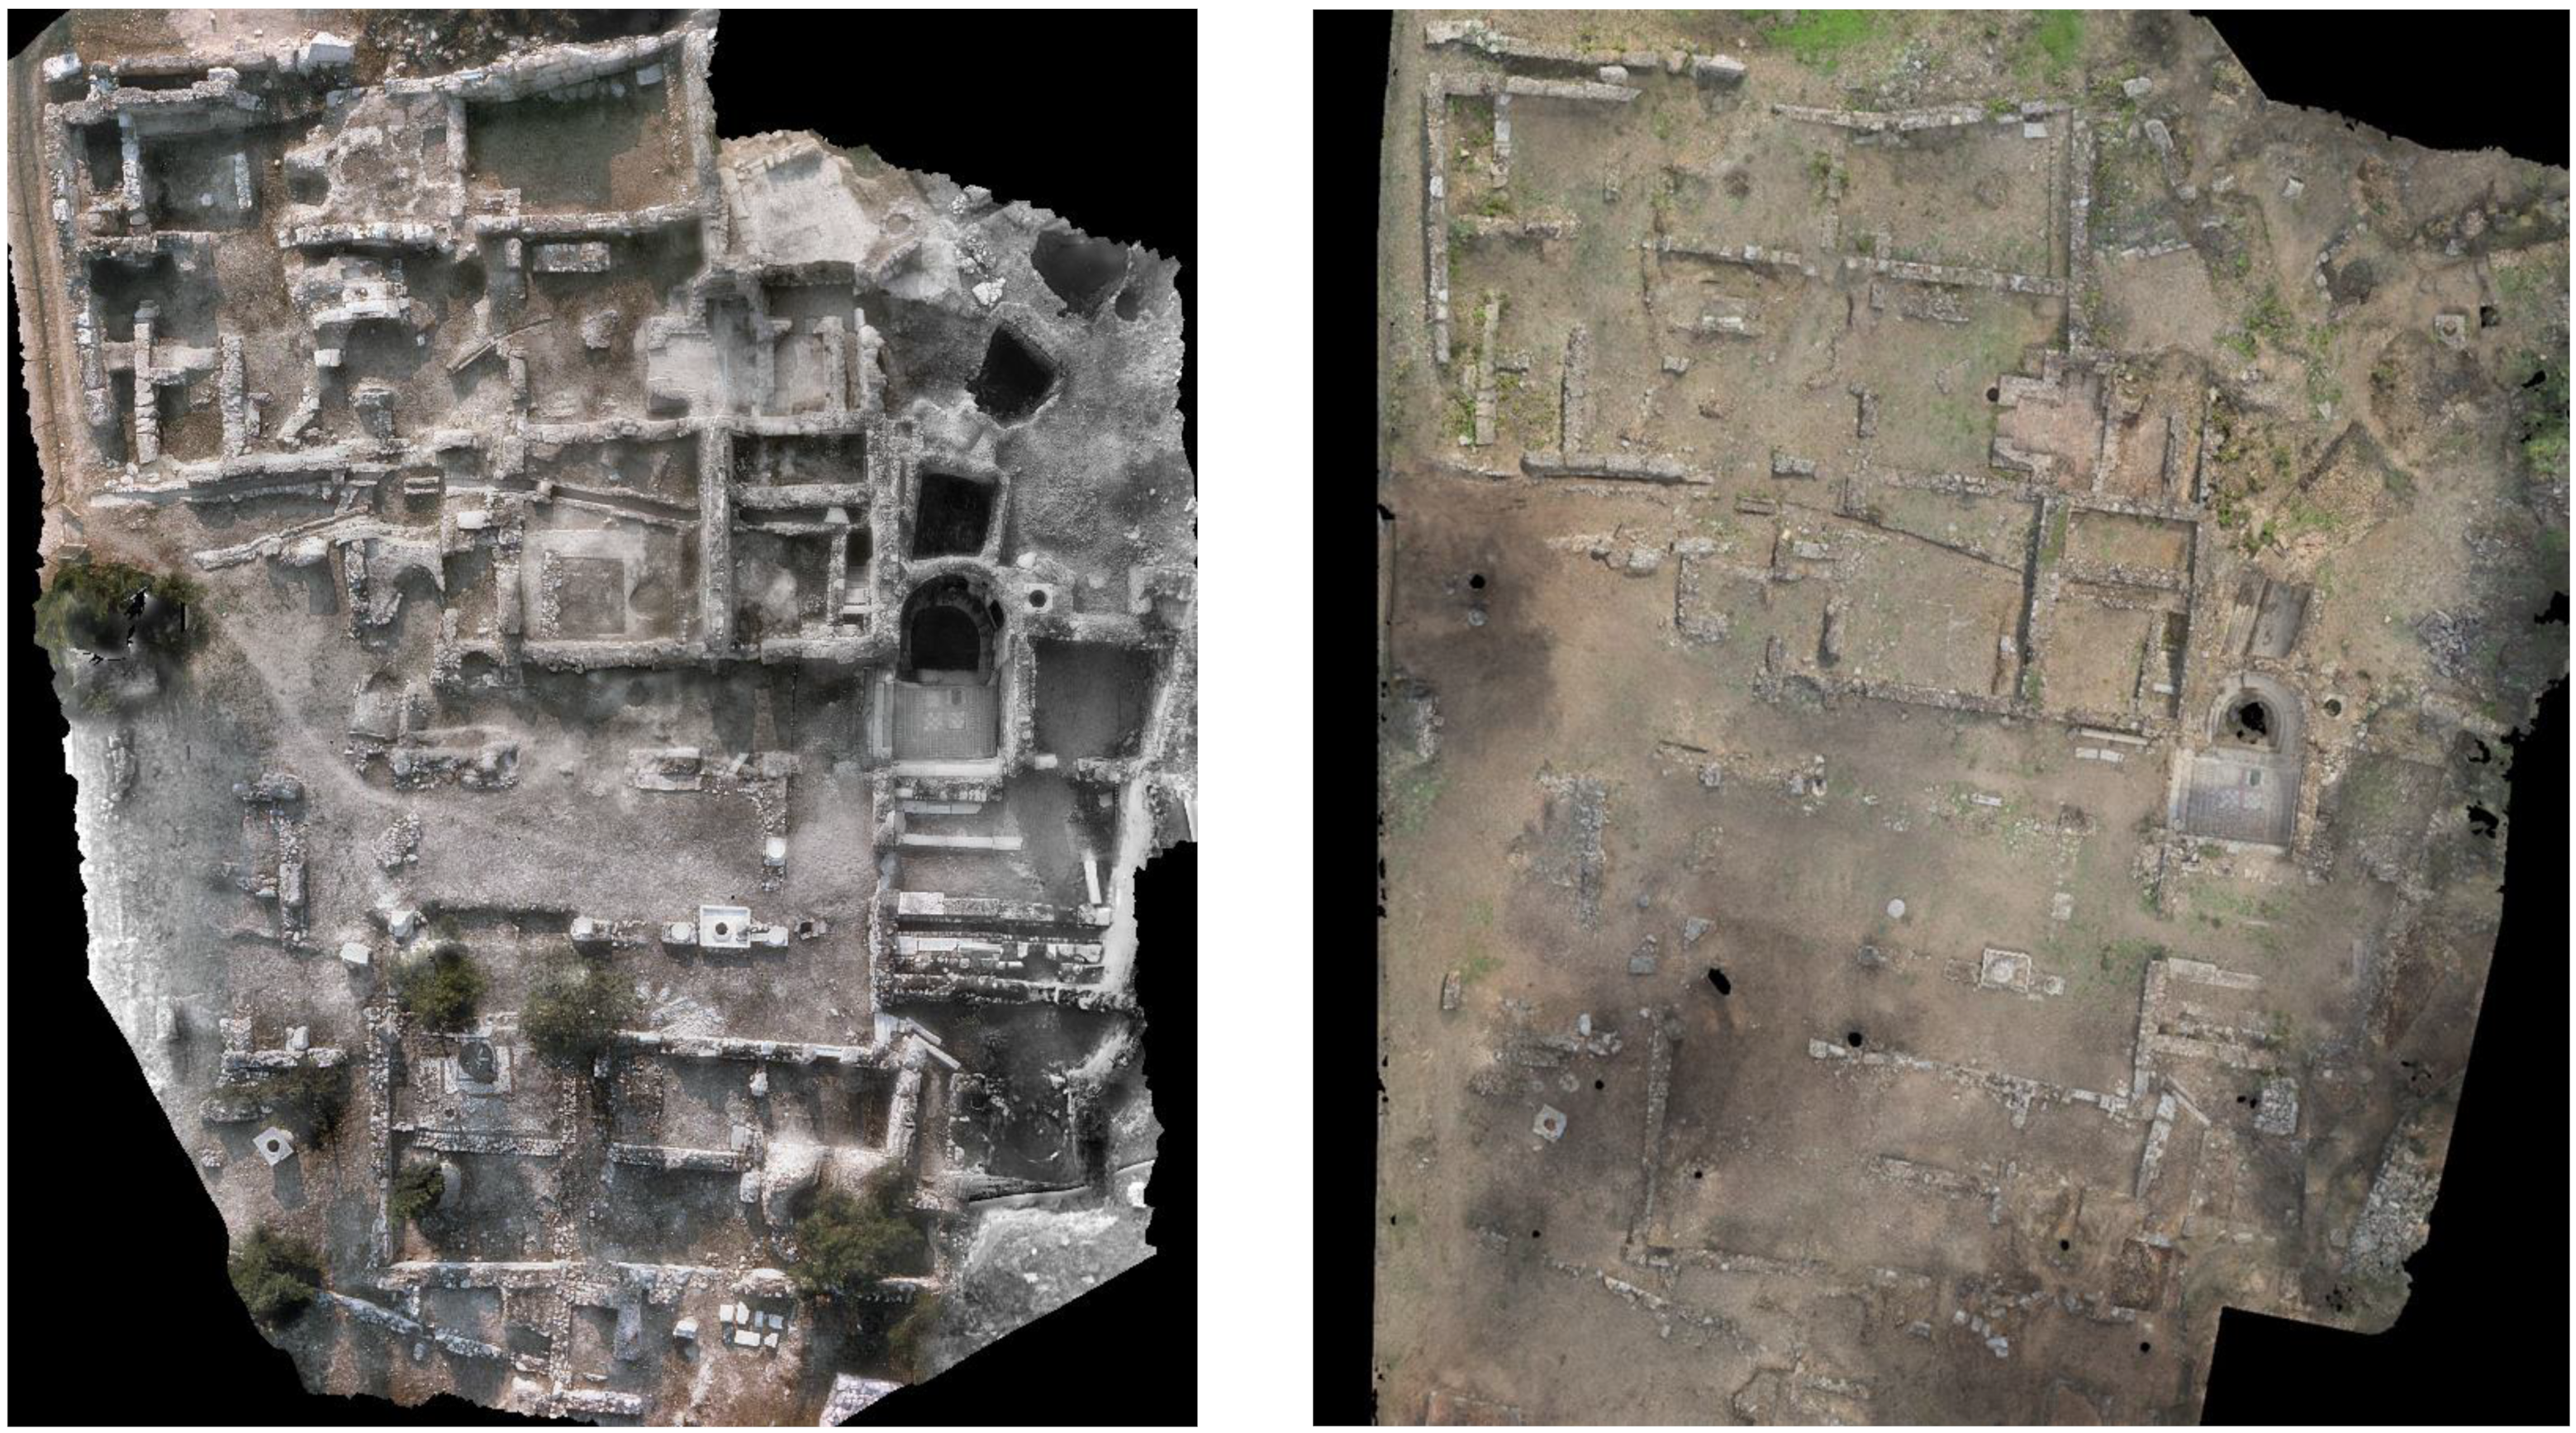
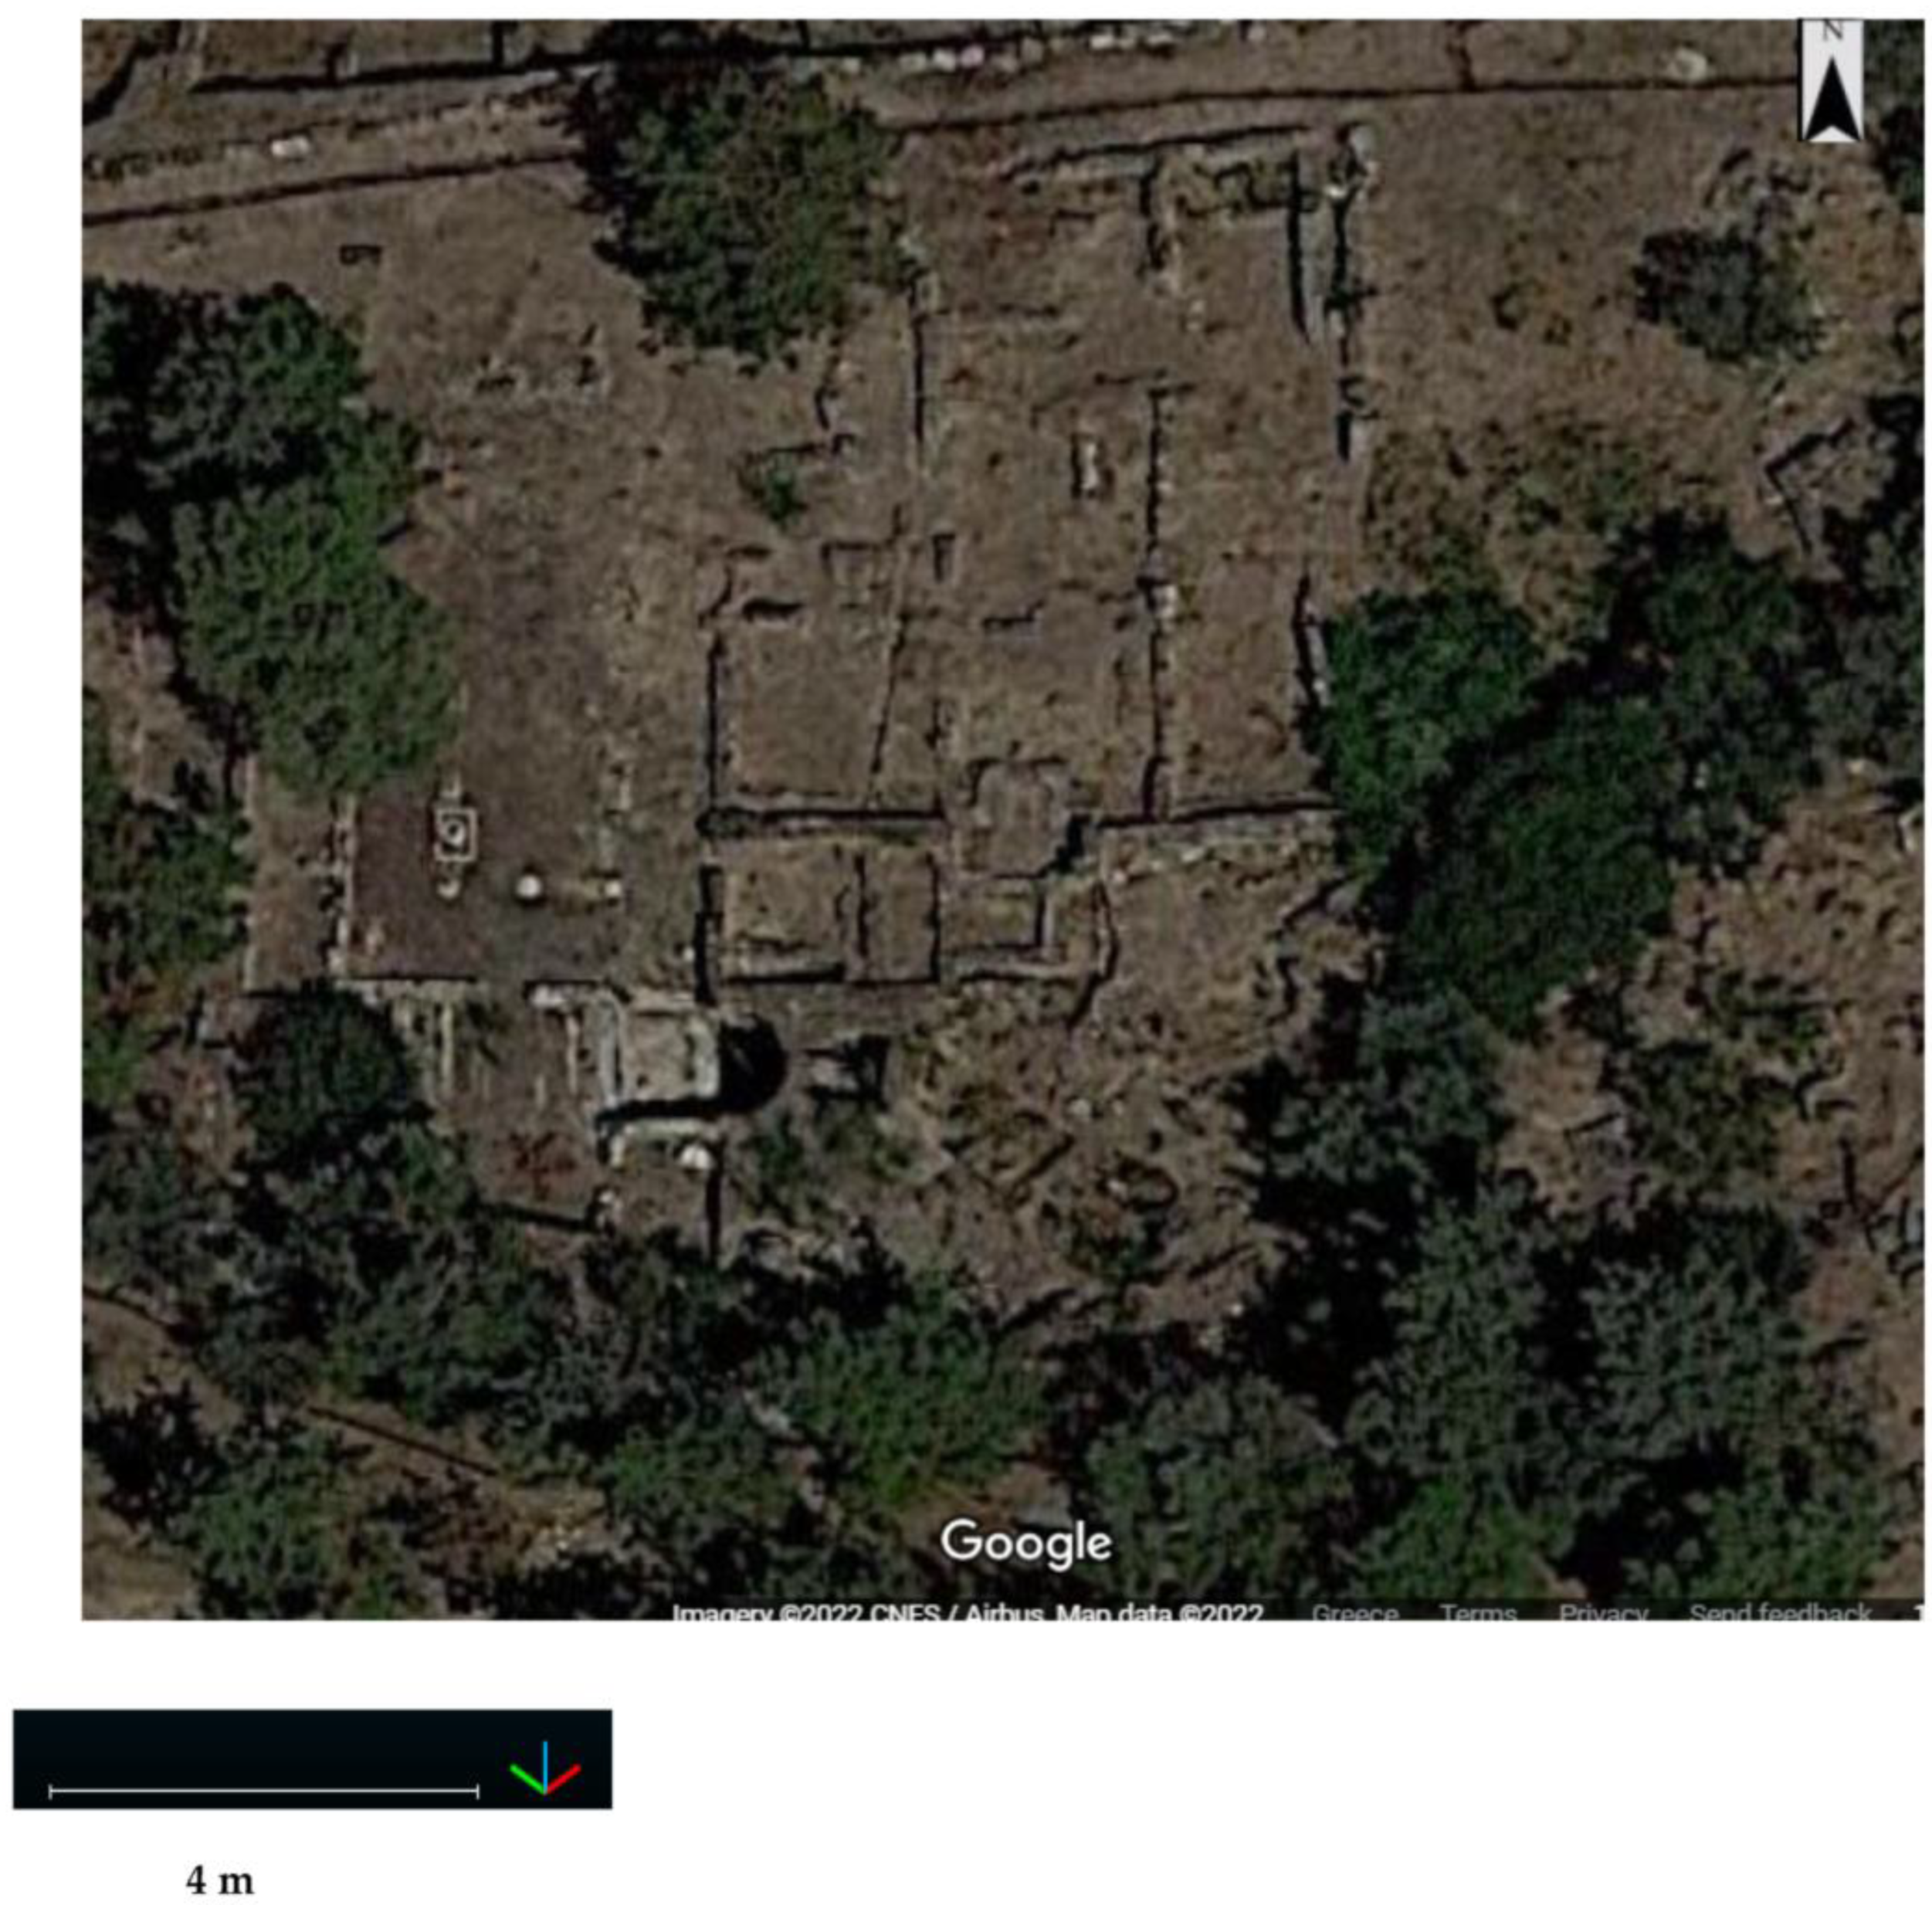
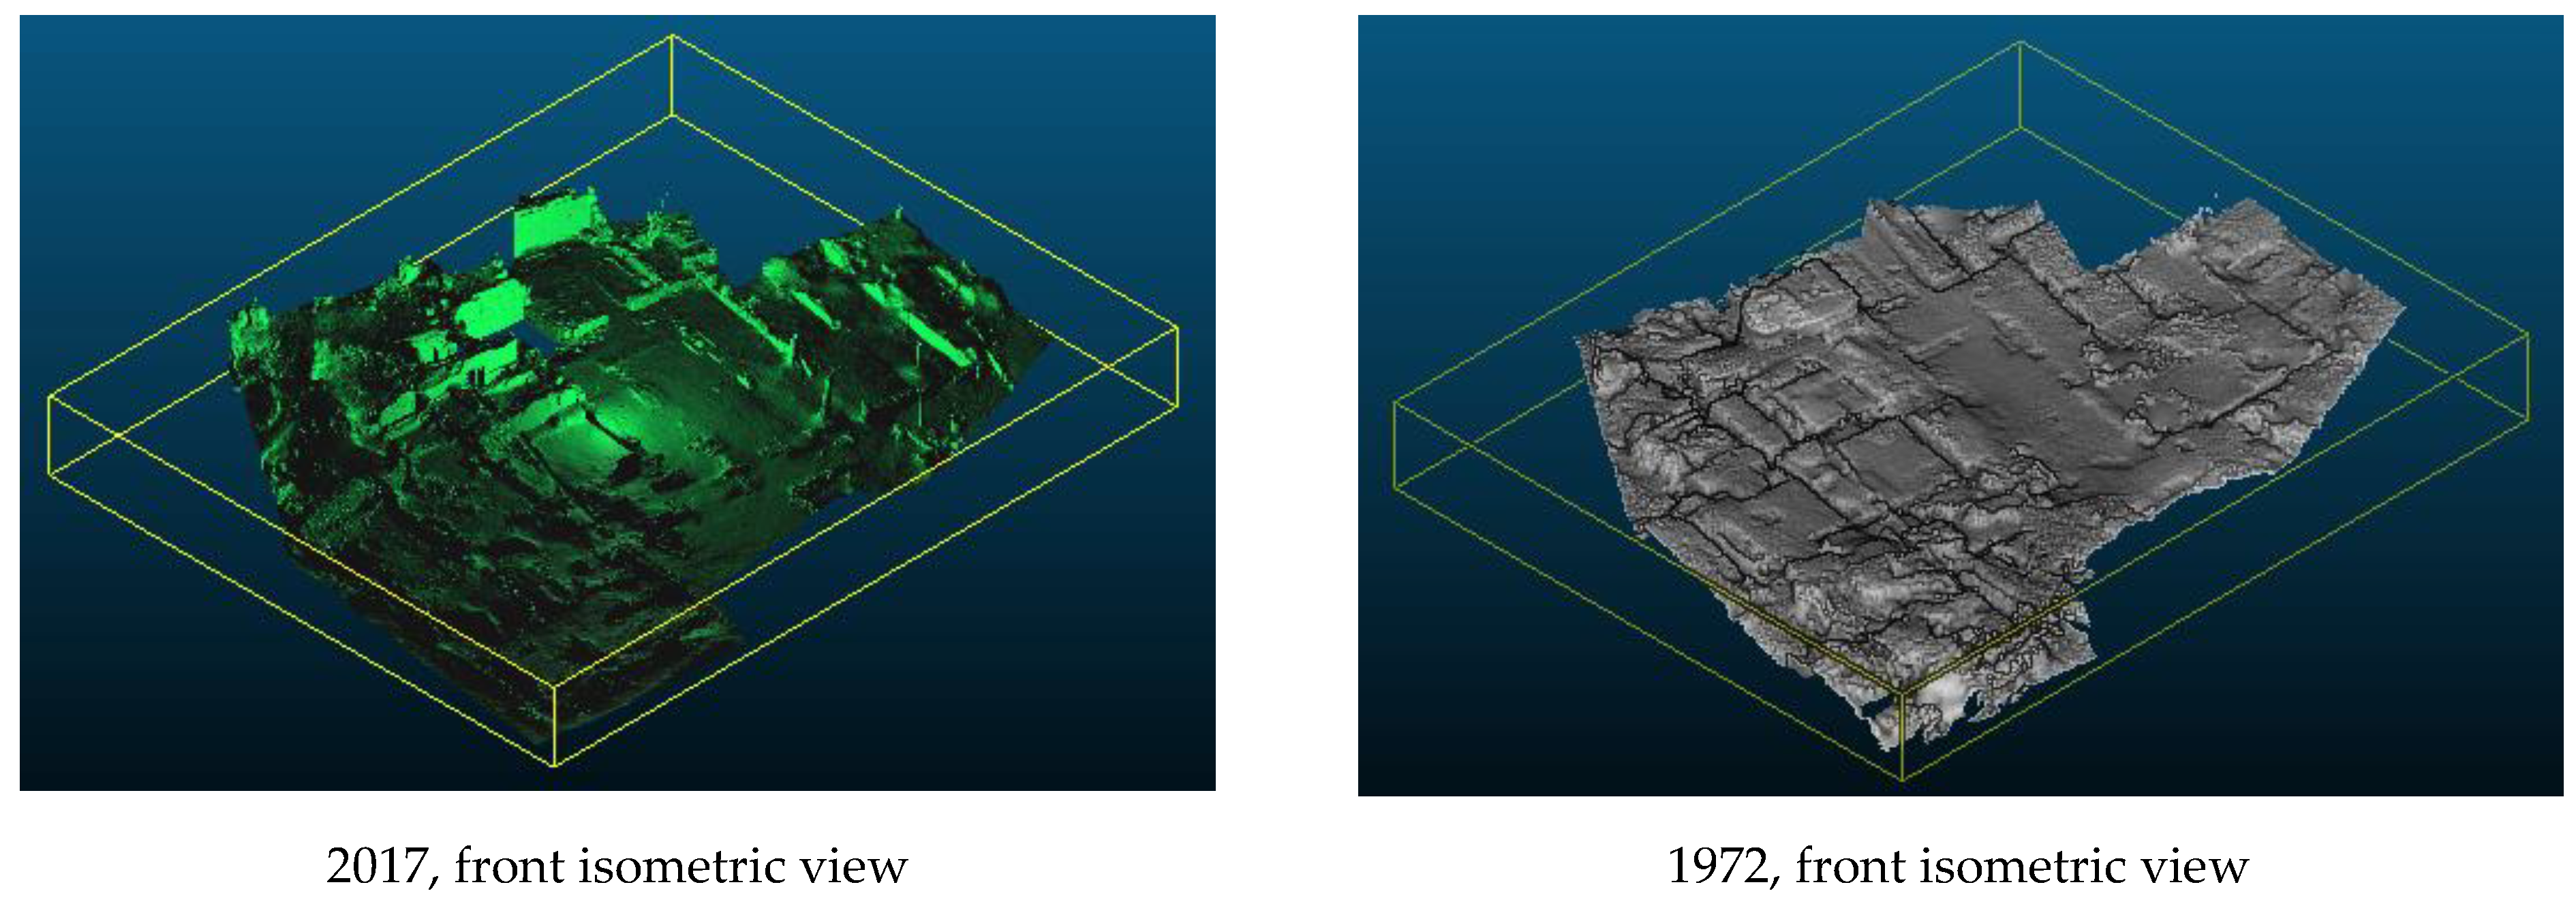
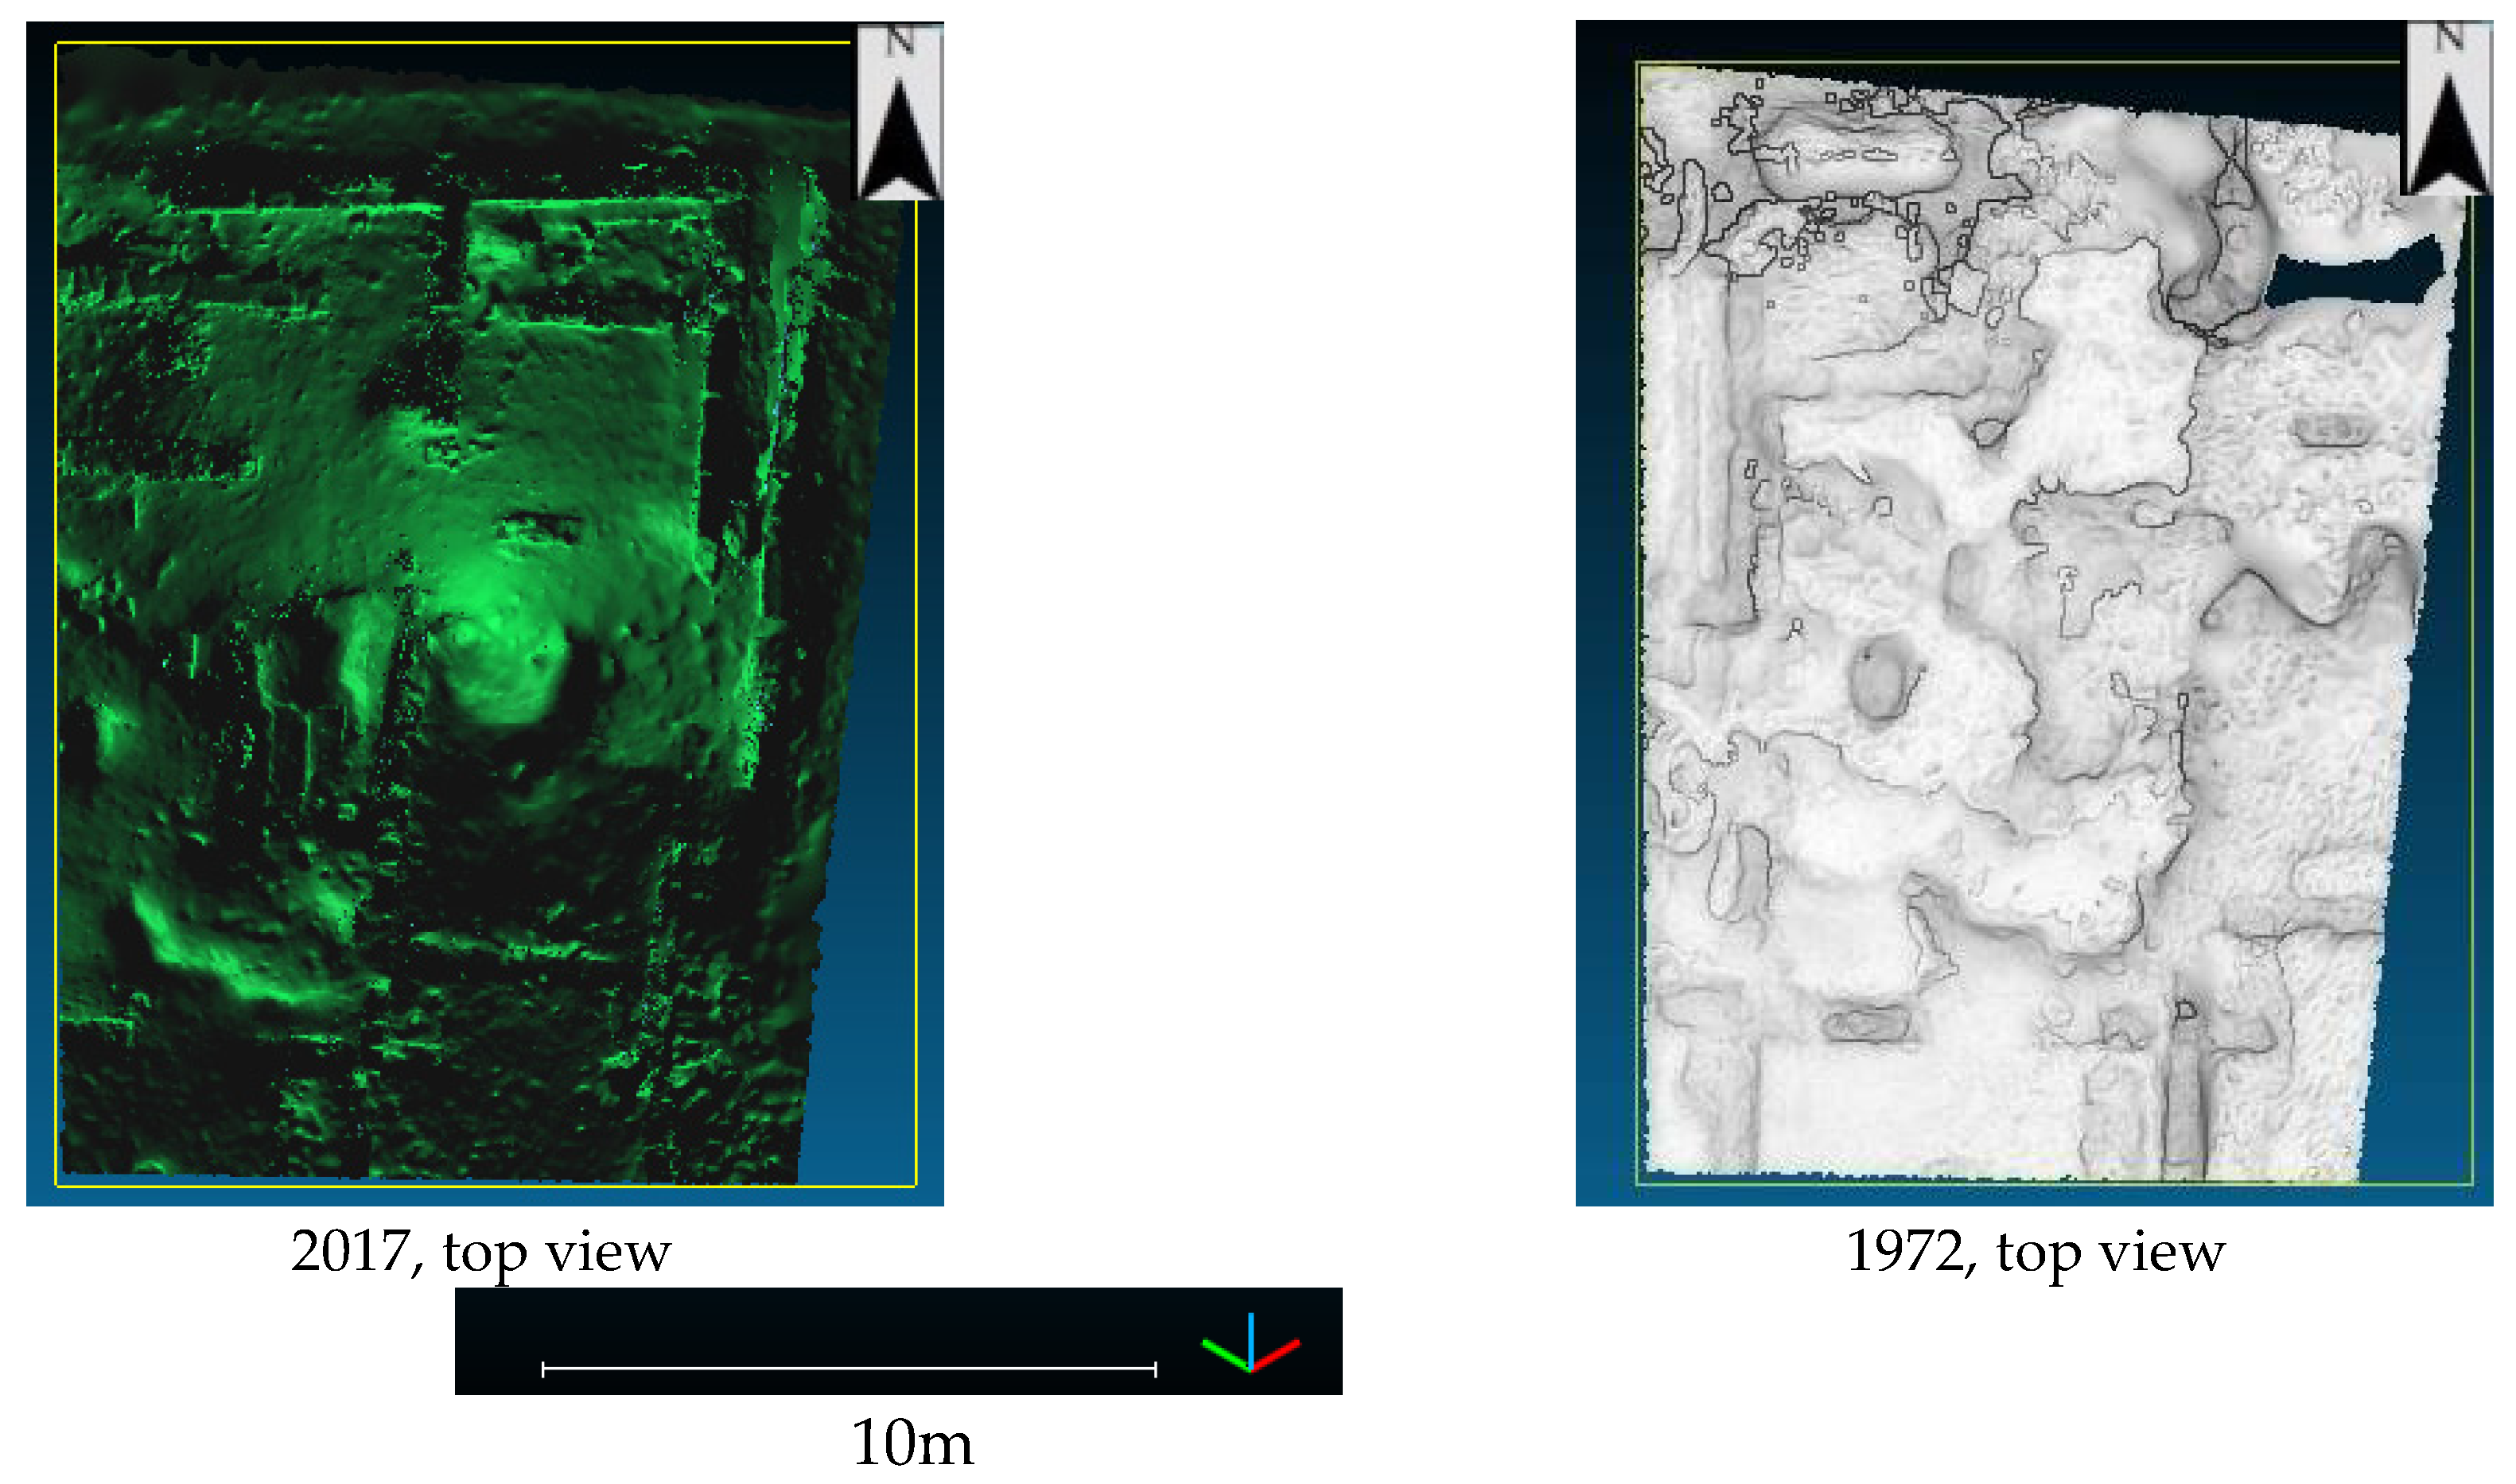
3.2. Omega House 3D Modeling

Omega House is an extensive residence, thought to have been one of the private Athenian philosophical schools of late antiquity. The house was built during the 4th century A.D. and experienced an extensive remodeling during the 5th and 6th centuries. It presents a spacious plan of approximately 1800 m2 with 30 rooms, expanded in three facets and grouped around peristyle courtyards. All activities of the private, professional, and social life of its owners were held in these rooms. The most breathtaking feature of the house is the Nymphaeum room complex thatis located at the southeast corner of the central peristyle courtyard. The eastern part of the house is not as well maintained and encompasses smaller rooms that are thoughtto have hosted the private apartments. Furthermore, a plentiful collection of Greek and Roman sculptures embellished the house. Most of the sculptures were carefully hidden in two wells whilst the ones kept above ground were intentionally decapitated [6].
Omega House is an exceptional example of how natural processes act upon an exposed archaeological site when kept intact but inaccessible to visitors for decades. In the summer of 2017, a high intensity 3D modeling study of Omega House was undertaken by C. Wallace, D. Moullou and Studio727 from Bratislava, Slovakia, with the assistance of ASCSA architect James Herbst and the collaboration of the Ephorate of the City of Athens. A survey of 12 points was completed utilizing locations certain to be undisturbed since the time of first excavation of the site. However, the survey was based on Greek military markers, and due to seismic activity [30] and subsidence [31] their coordinates create uncertainty in the modeling. Similarly, solid features of the site (walls) may show variation between the contemporary and retrospective models due to earthquakes and subsidence. The coordinates were then applied to both the contemporary and retrospective models.
The contemporary 3D model from 2017 was produced using a Nikon D800E and a Nikon D810; each with 36.3 megapixels and varying between Nikon 20 mm f/1.8, 24 mm f/1.4 and 14–24 mm f/2.8 lenses. A total of 37,150 photographs out of the total 43,571 were used in the modeling, which produced a finished model consisting of 3.9 million polygons. The model processing time was five days using Capturing Reality software on a Titan2computer: Intel i7-5820K, 64GB RAM, 4 × 1TB RAID0 SSD, 2 × 4TB RAID0 HDD, 2 × NVidia GTX 980. During fieldwork, the base photographic distance ranged from 0.5 m to 2 m while the elevated photographic distance was from 2 m to 7 m. The median Ground Sample Distance (GSD) was equal to 0.04 cm/pixel. For application of survey-produced georeferencing, AgisoftPhotoscan was used. The final model was processed in normal mode downscale 2 to a GSD of 0.8 mm/pixel. The resulting model error is below 1 cm. The contemporary model produced enables the ex-amination and measurement of every aspect of the site. Any features that may eventually deteriorate, can now be reconstructed with high accuracy [6].
The geographical location of Omega House and its orientation, as it is provided by Google Maps, is depicted in Figure 2. The geographical coordinates of Omega House are the 37°58′22.60″ B 23°43′25.56″ E. The dimensions of Omega House are 60 by 30 m (approximately 1800 m2). The contemporary and retrospective models are shown in Figure 2. Two wells were removed from the contemporary model for the comparison needs of the current study. The particular wells are absent from the retrospective model due to the technological difficulties of taking photographs of the interior of the well back in 1972. In fact, the blank part at the Nymphaeum on the 2017 model in Figure 3 indicates a removed well. A northeast selected part of the model is depicted in Figure 4. The specific model part is analyzed in the following sections. Similarly, other parts of the model have been selected and their analysis is also given below in the current paper. The attributes of the contemporary and retrospective models are described in Table 3. Specifically, the number of points, the number of faces and the number of edges of the models are given.

3.3. Methodology

The 3D photogrammetric models of Omega House go through processing to detect changes that have arisen from 1972 to 2017. The initial version of the models, dated 1972 and 2017, has been provided from the source [6,7]. Processing has been performed by means of the 3D point cloud processing software named CloudCompare [32].
In this work, CSG is applied on the Omega House models [12,13,14,15,16,32] to calculate the Boolean operations thatare named difference and intersection. CSG is a technique to define a complex surface as the result of several set operations on solid regions of space: union, intersection, set difference, symmetric difference, complement. Commonly, CSG libraries represent the inputs and outputs to these operations in an implicit manner. The solid A is defined as the open set of points x for which some function a(x) gives true value. The surface of this shape is the closure of all points x in A. A typical CSG library might only keep explicit base-case representations of canonical shapes such as half-spaces and quadrics.
For the calculation of the distances between the two models for 1972 and 2017, the distance computation algorithm called Iterative Closest Point (ICP) is applied, and the octree and Cloud-to-Mesh (C2M) distances are employed [33]. In C2M procedure, distances to triangles instead of distances to another cloud are calculated [34]. The algorithm relies on a gridding technique, where the triangles are intersected with a regular 3D grid. In each cell of the grid pointers are stored to the intersecting triangles. The computed distances are signed with the triangle normal. With regard to the model volume calculation that is adopted, it relies on rasterization or gridding of the clouds under comparison [32]. Figure 5 presents the methodological approach which is used in the present work.

4. Results

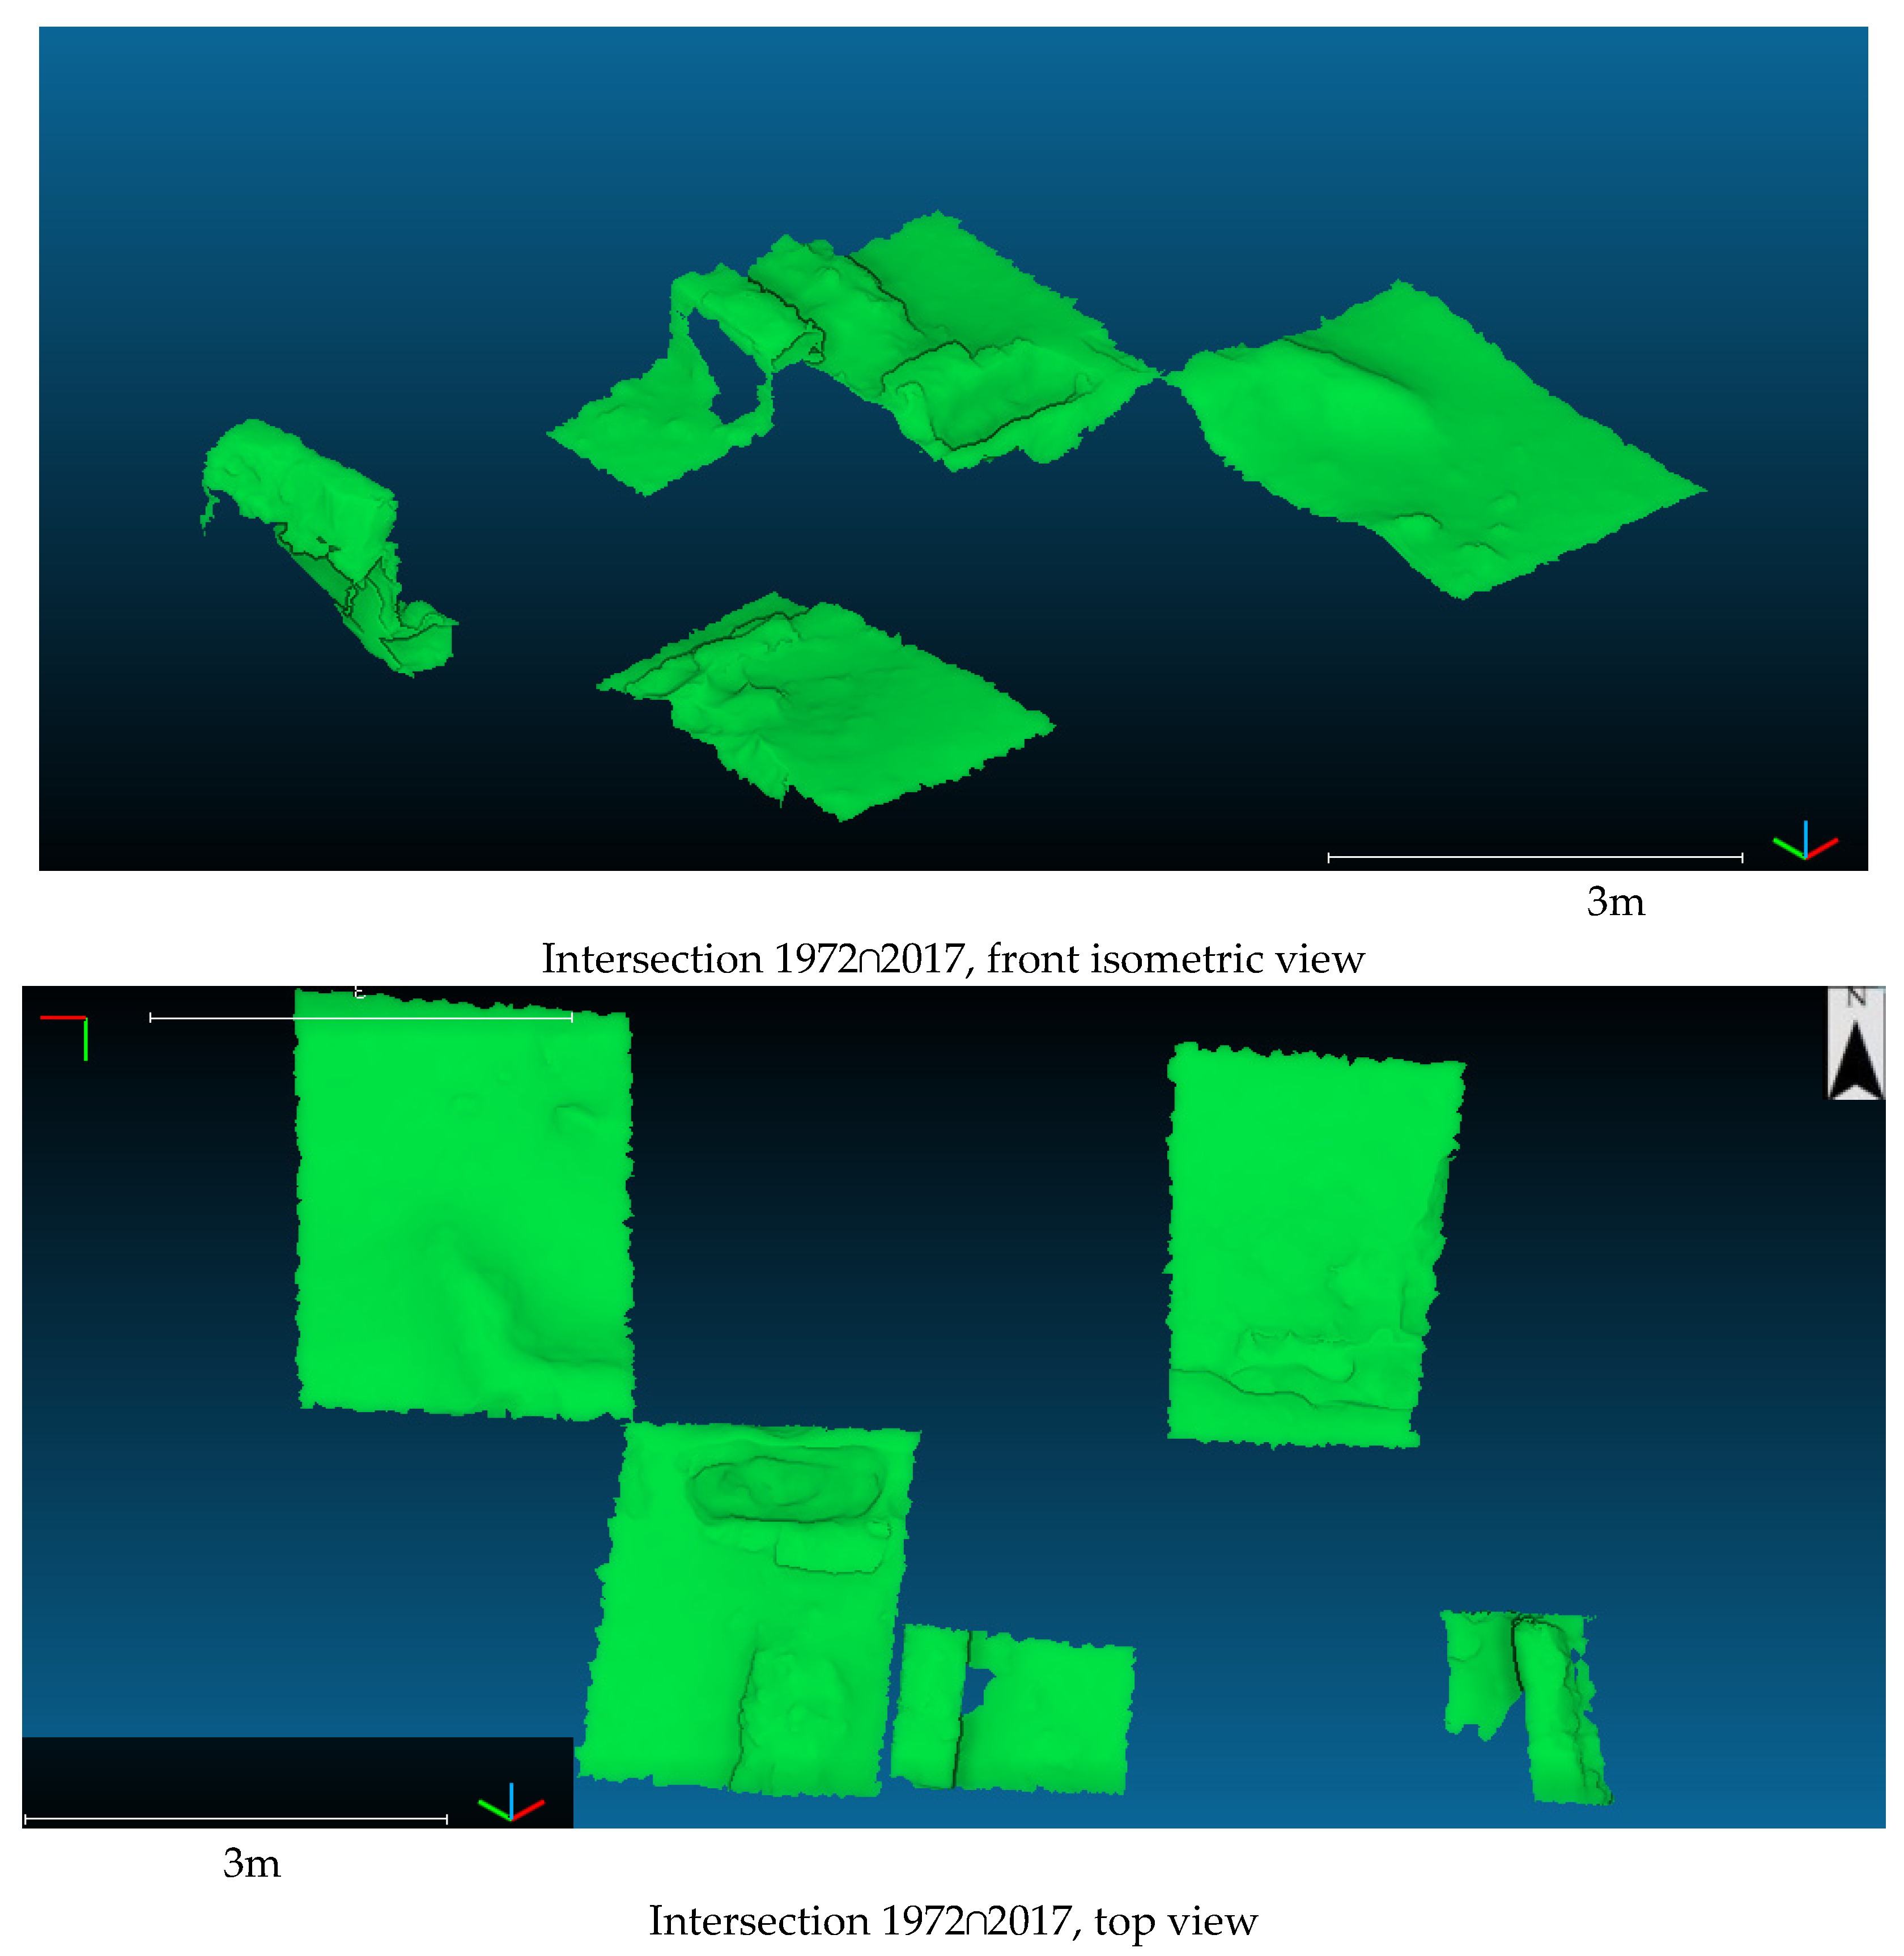
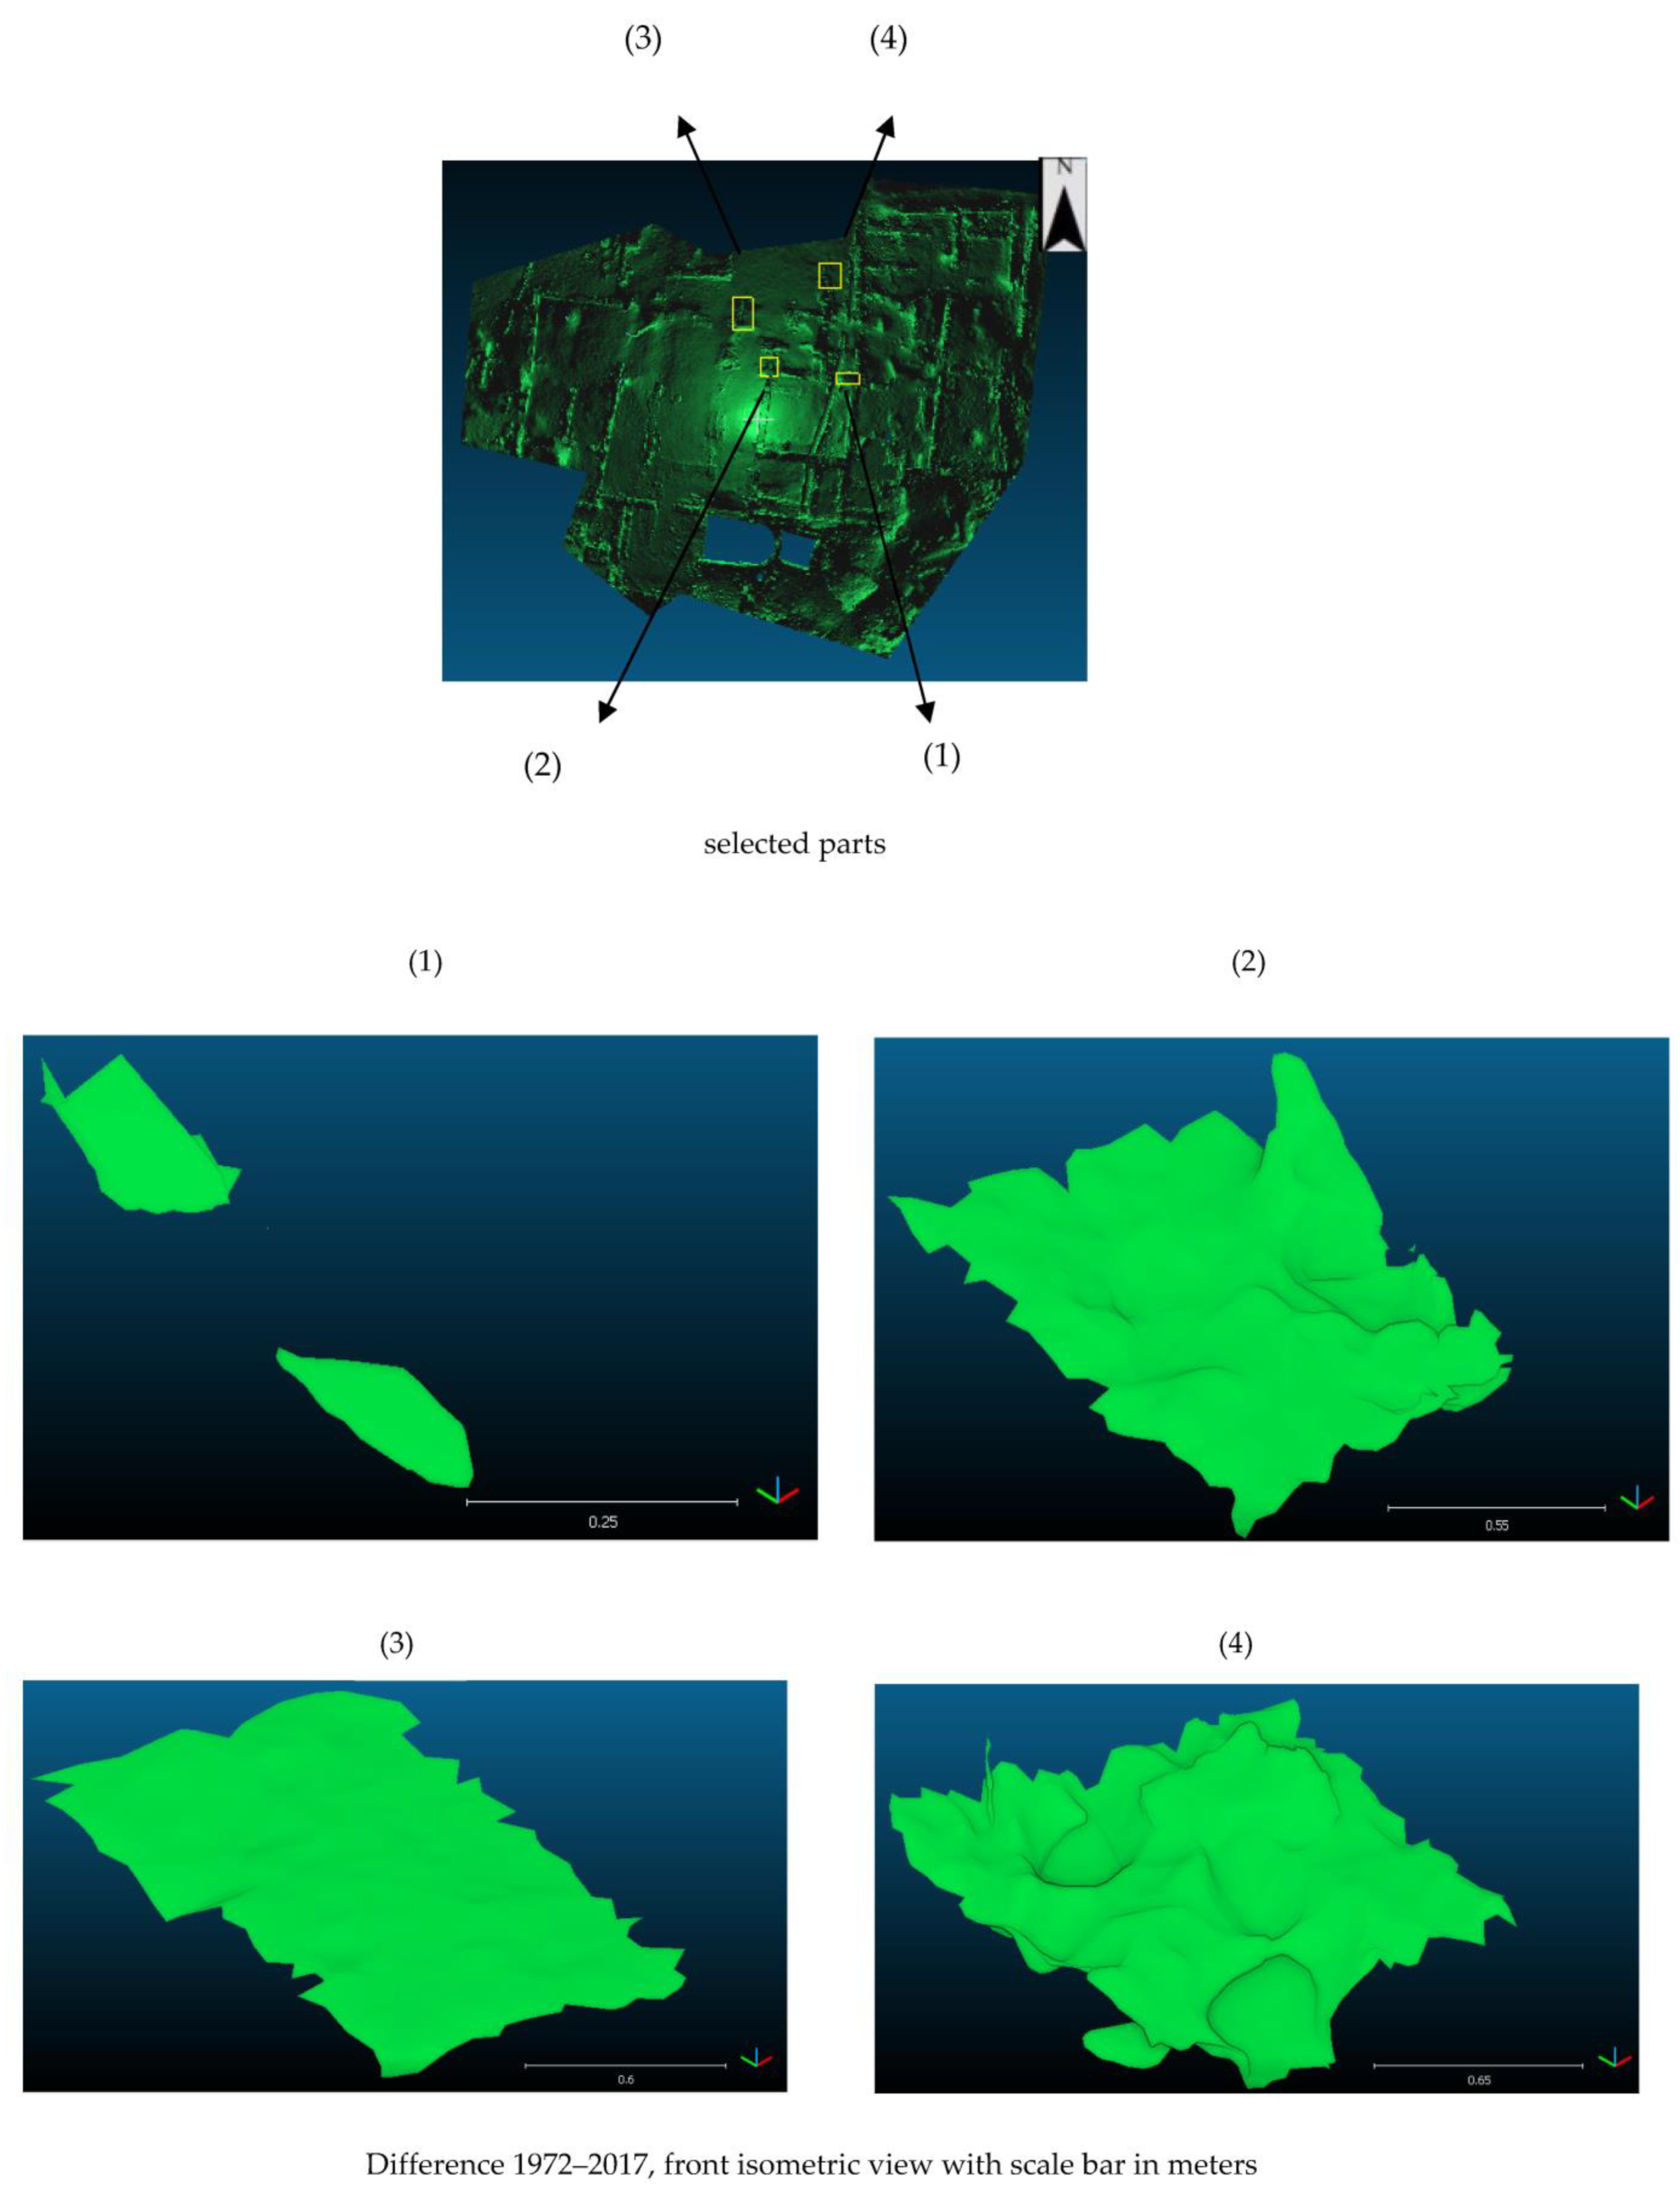
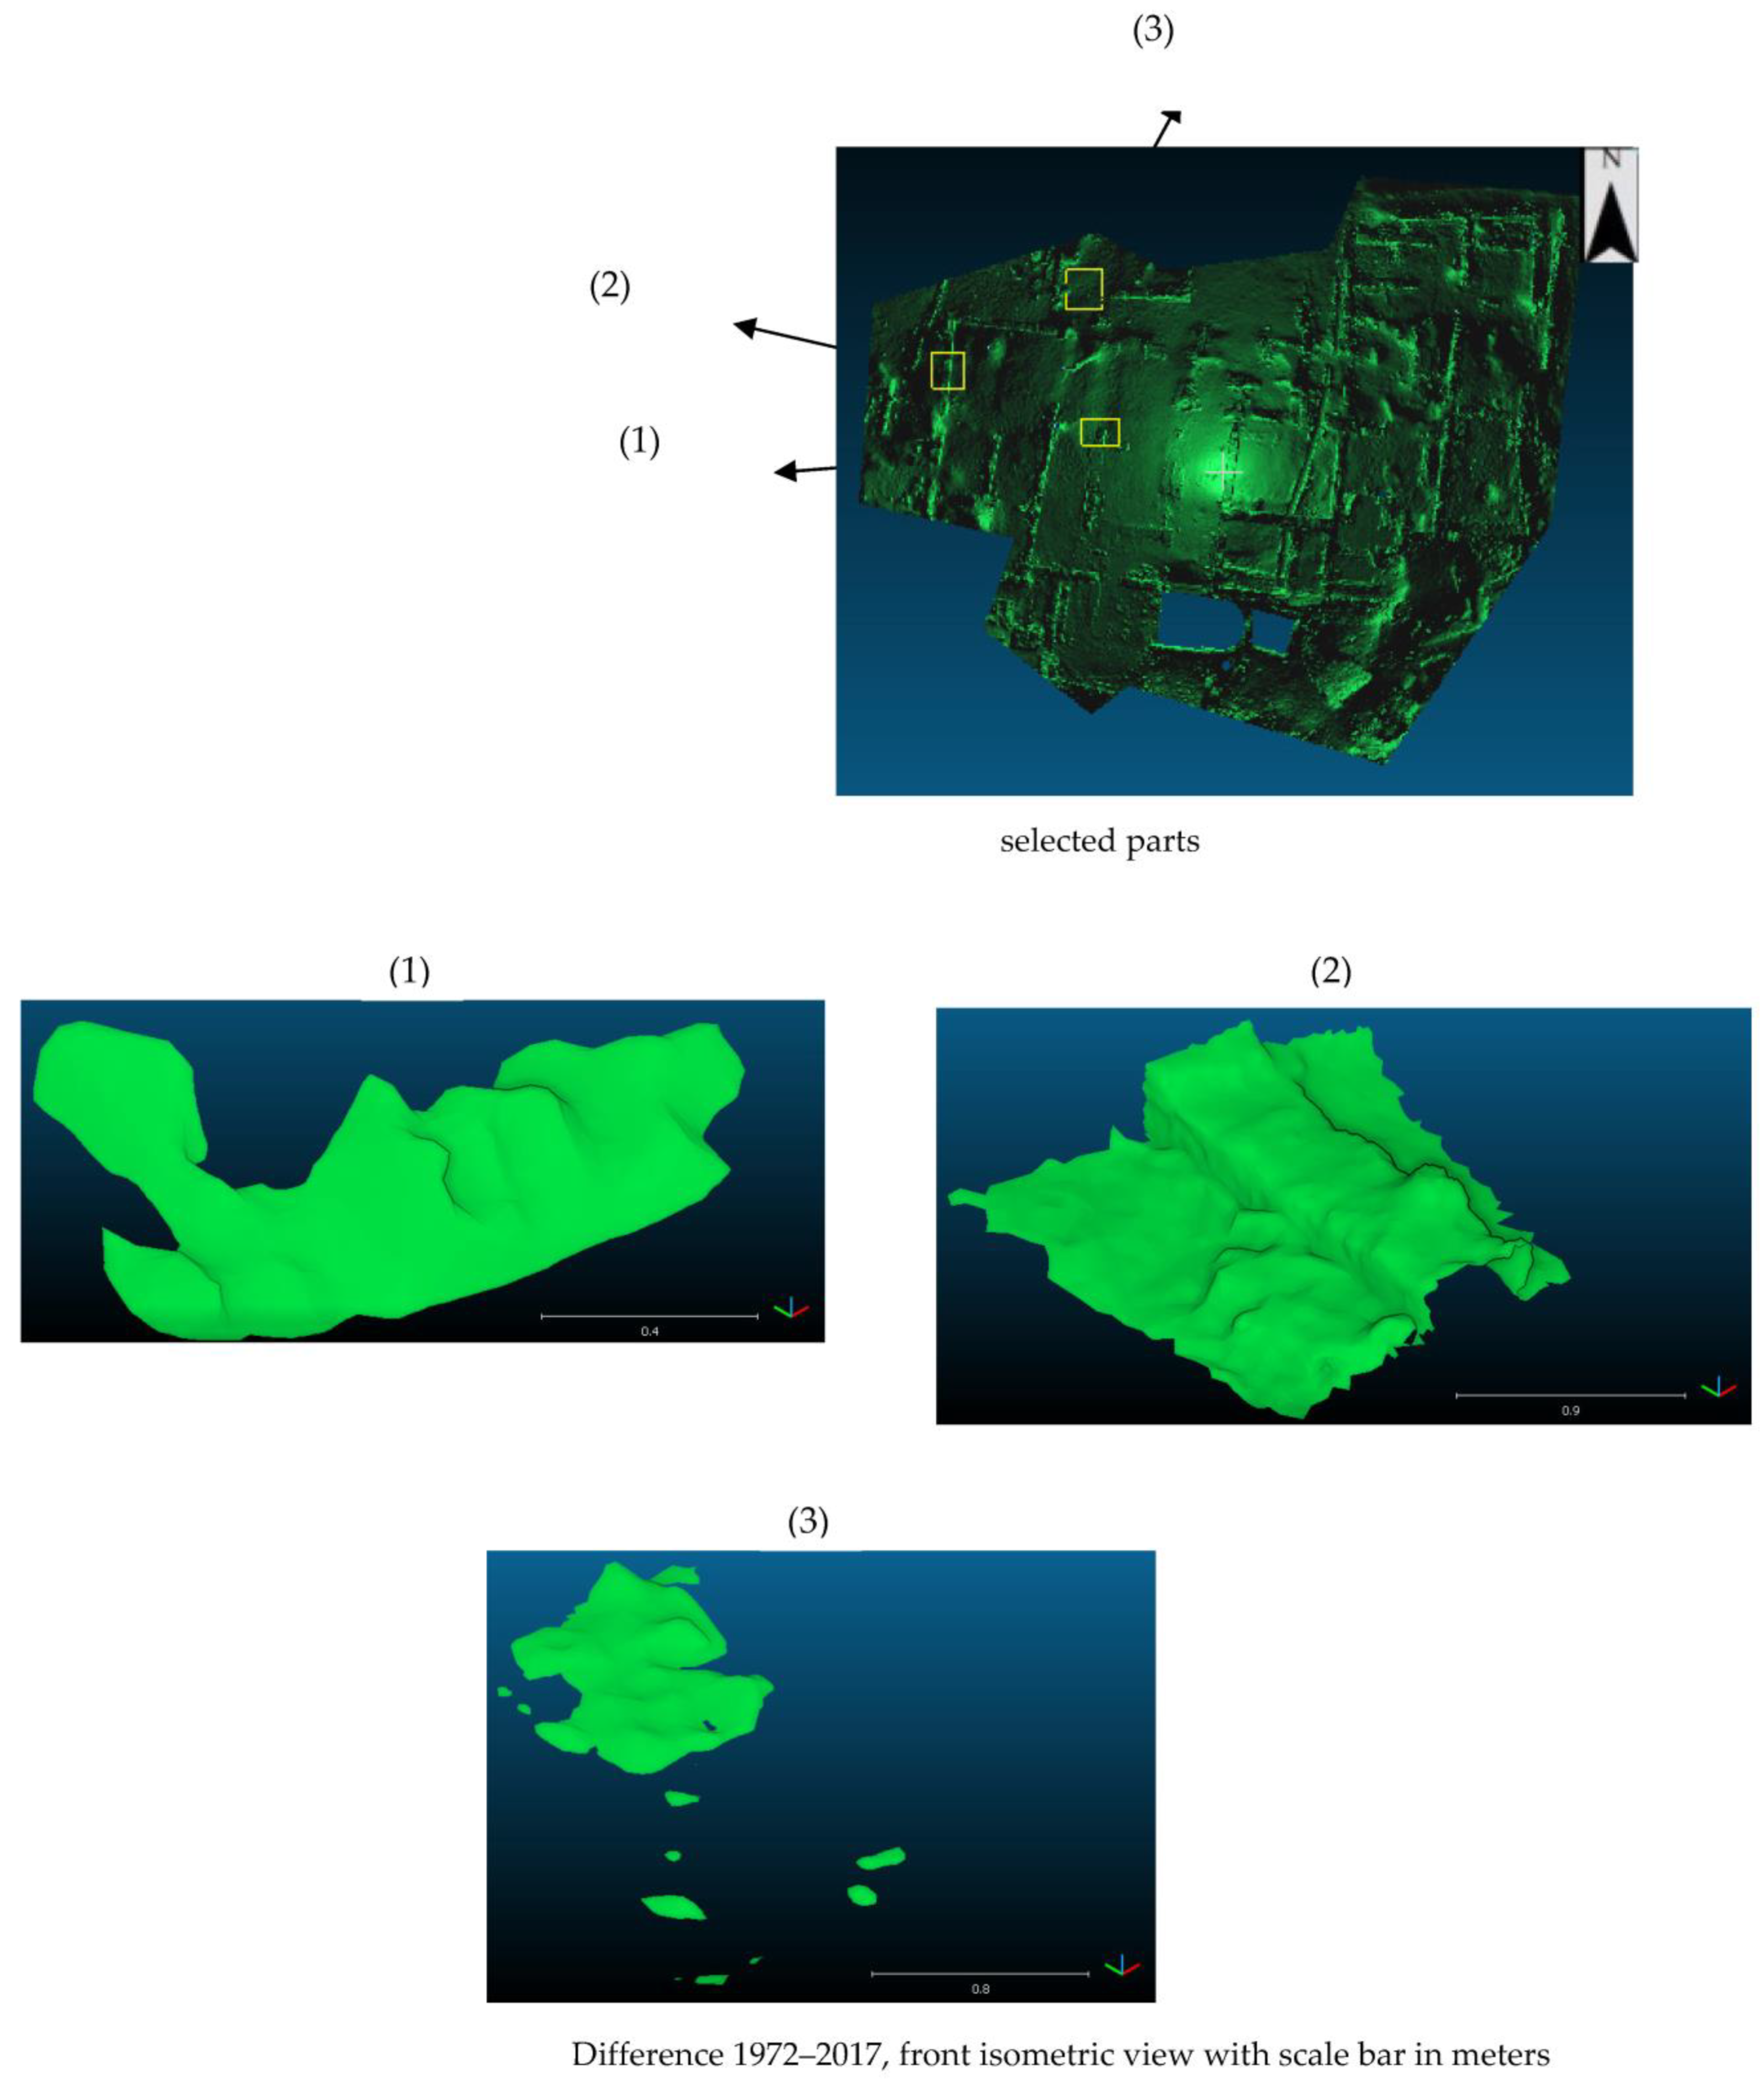
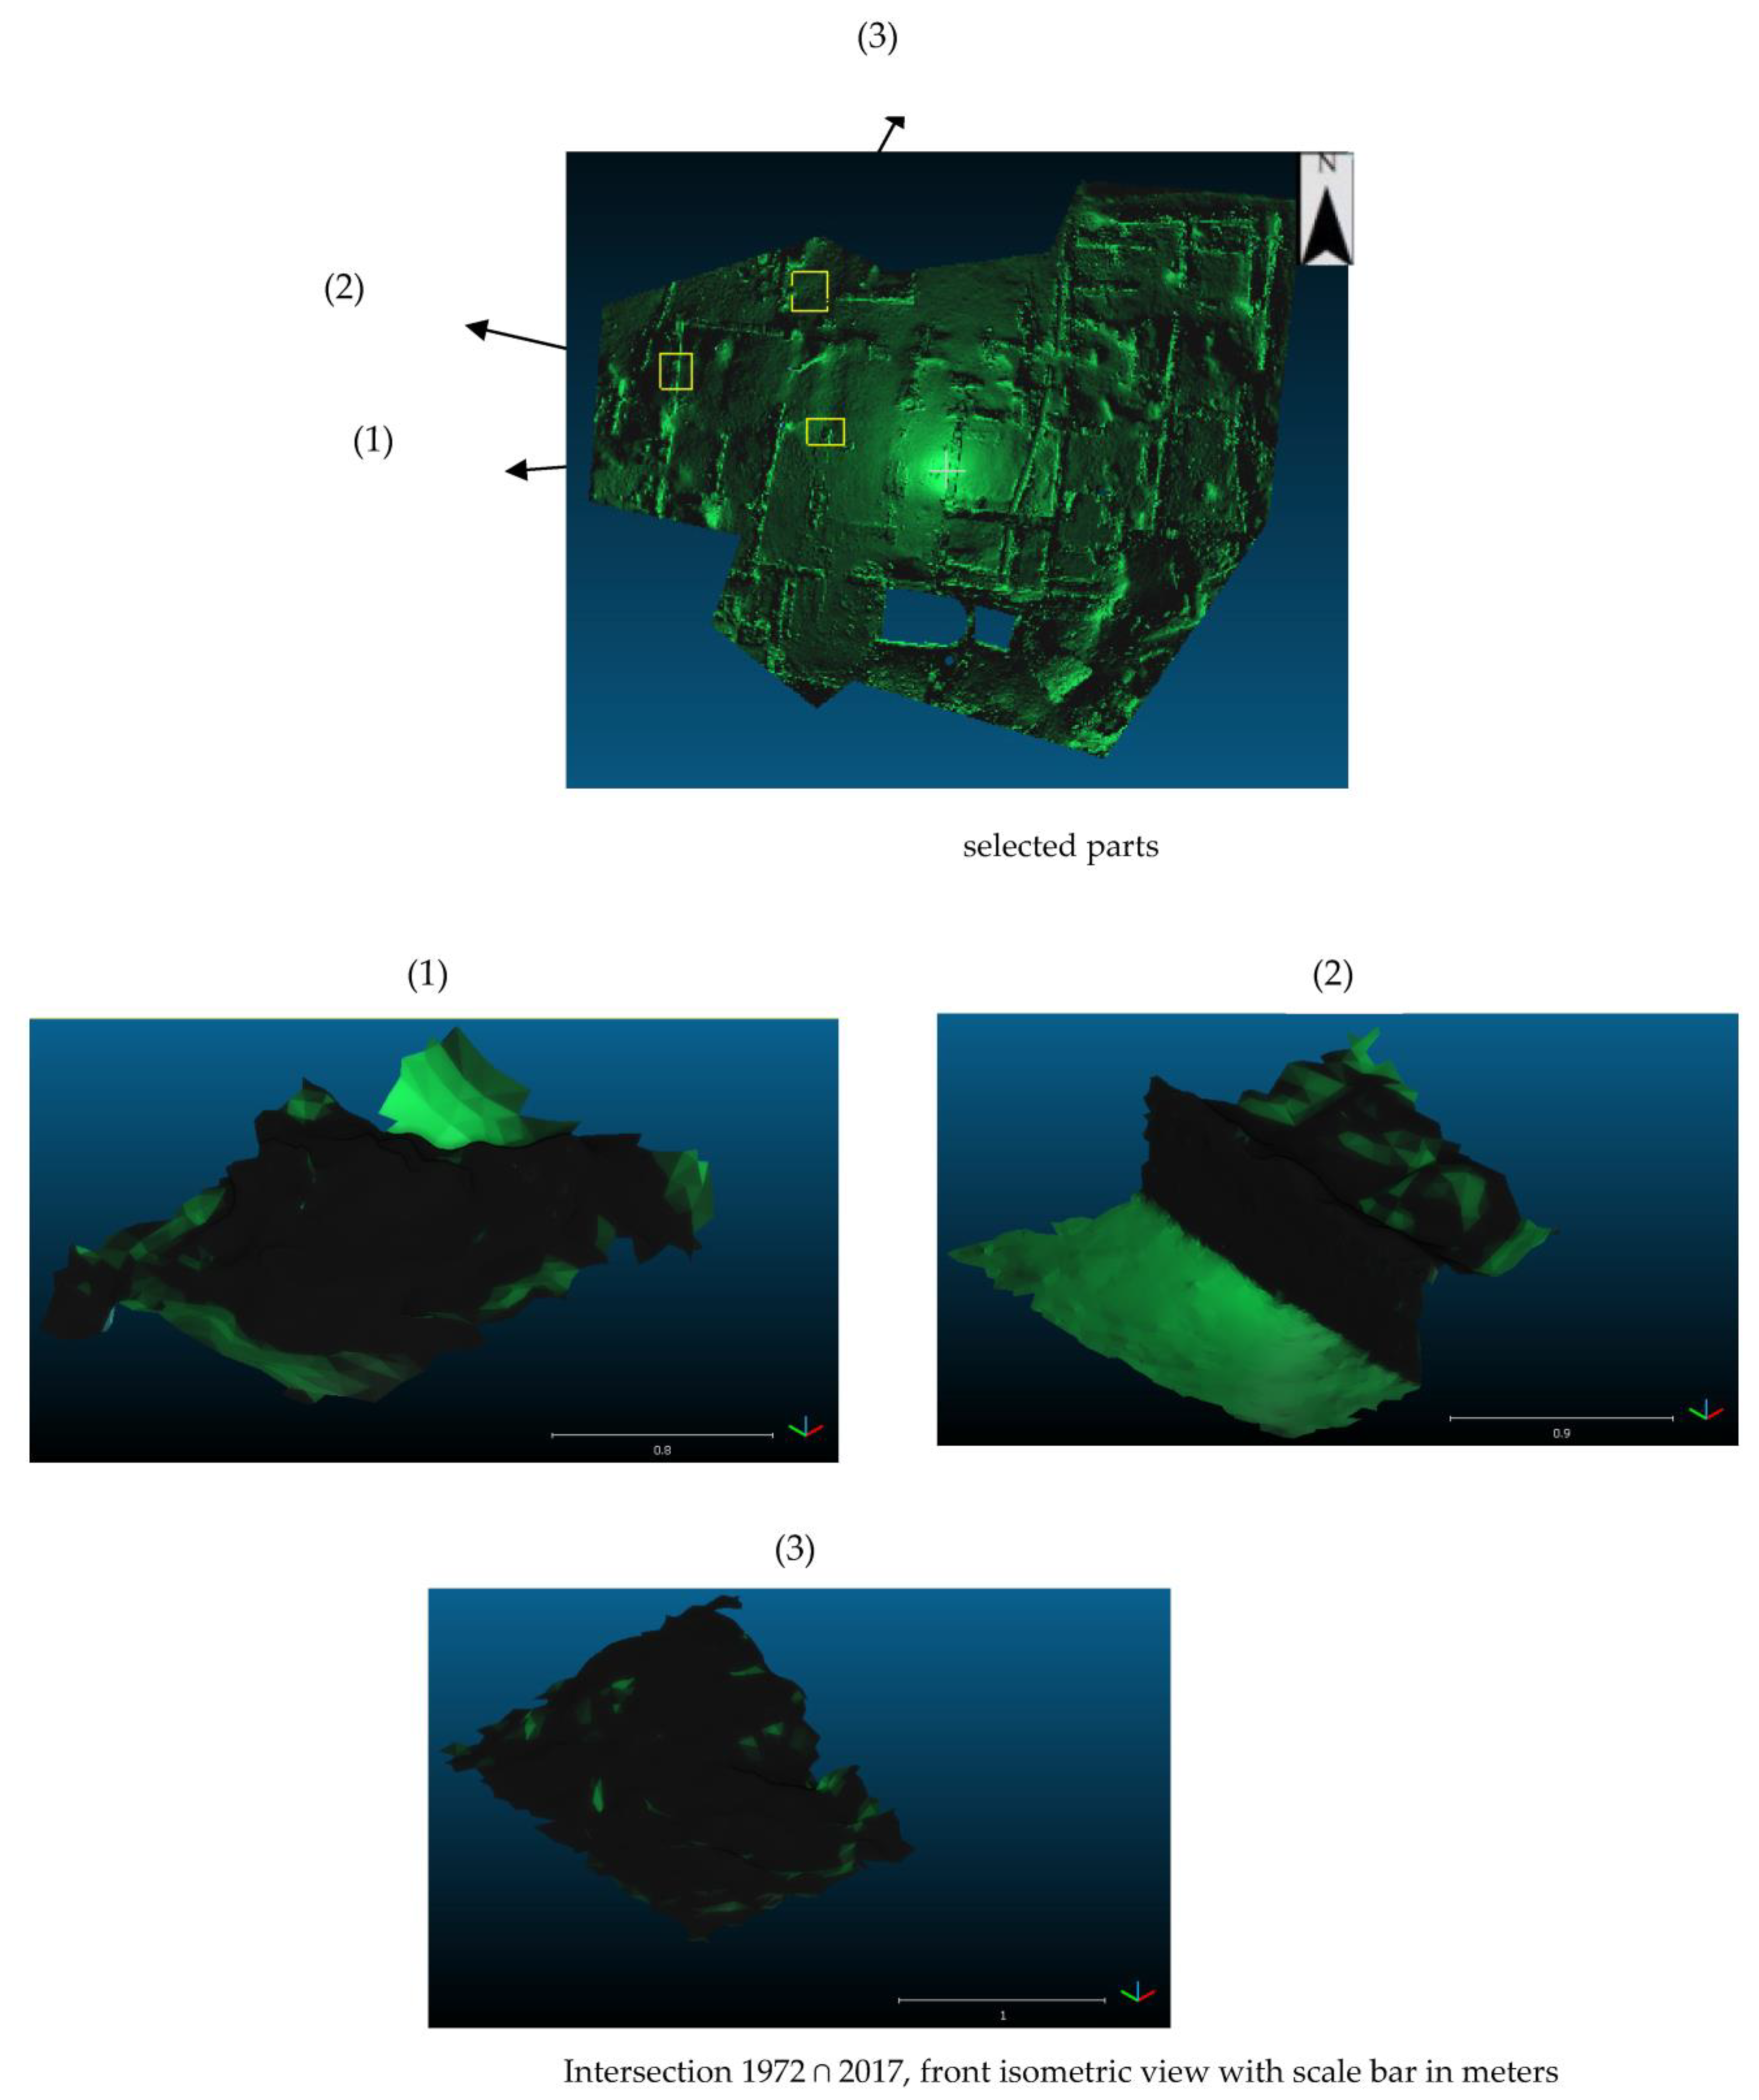
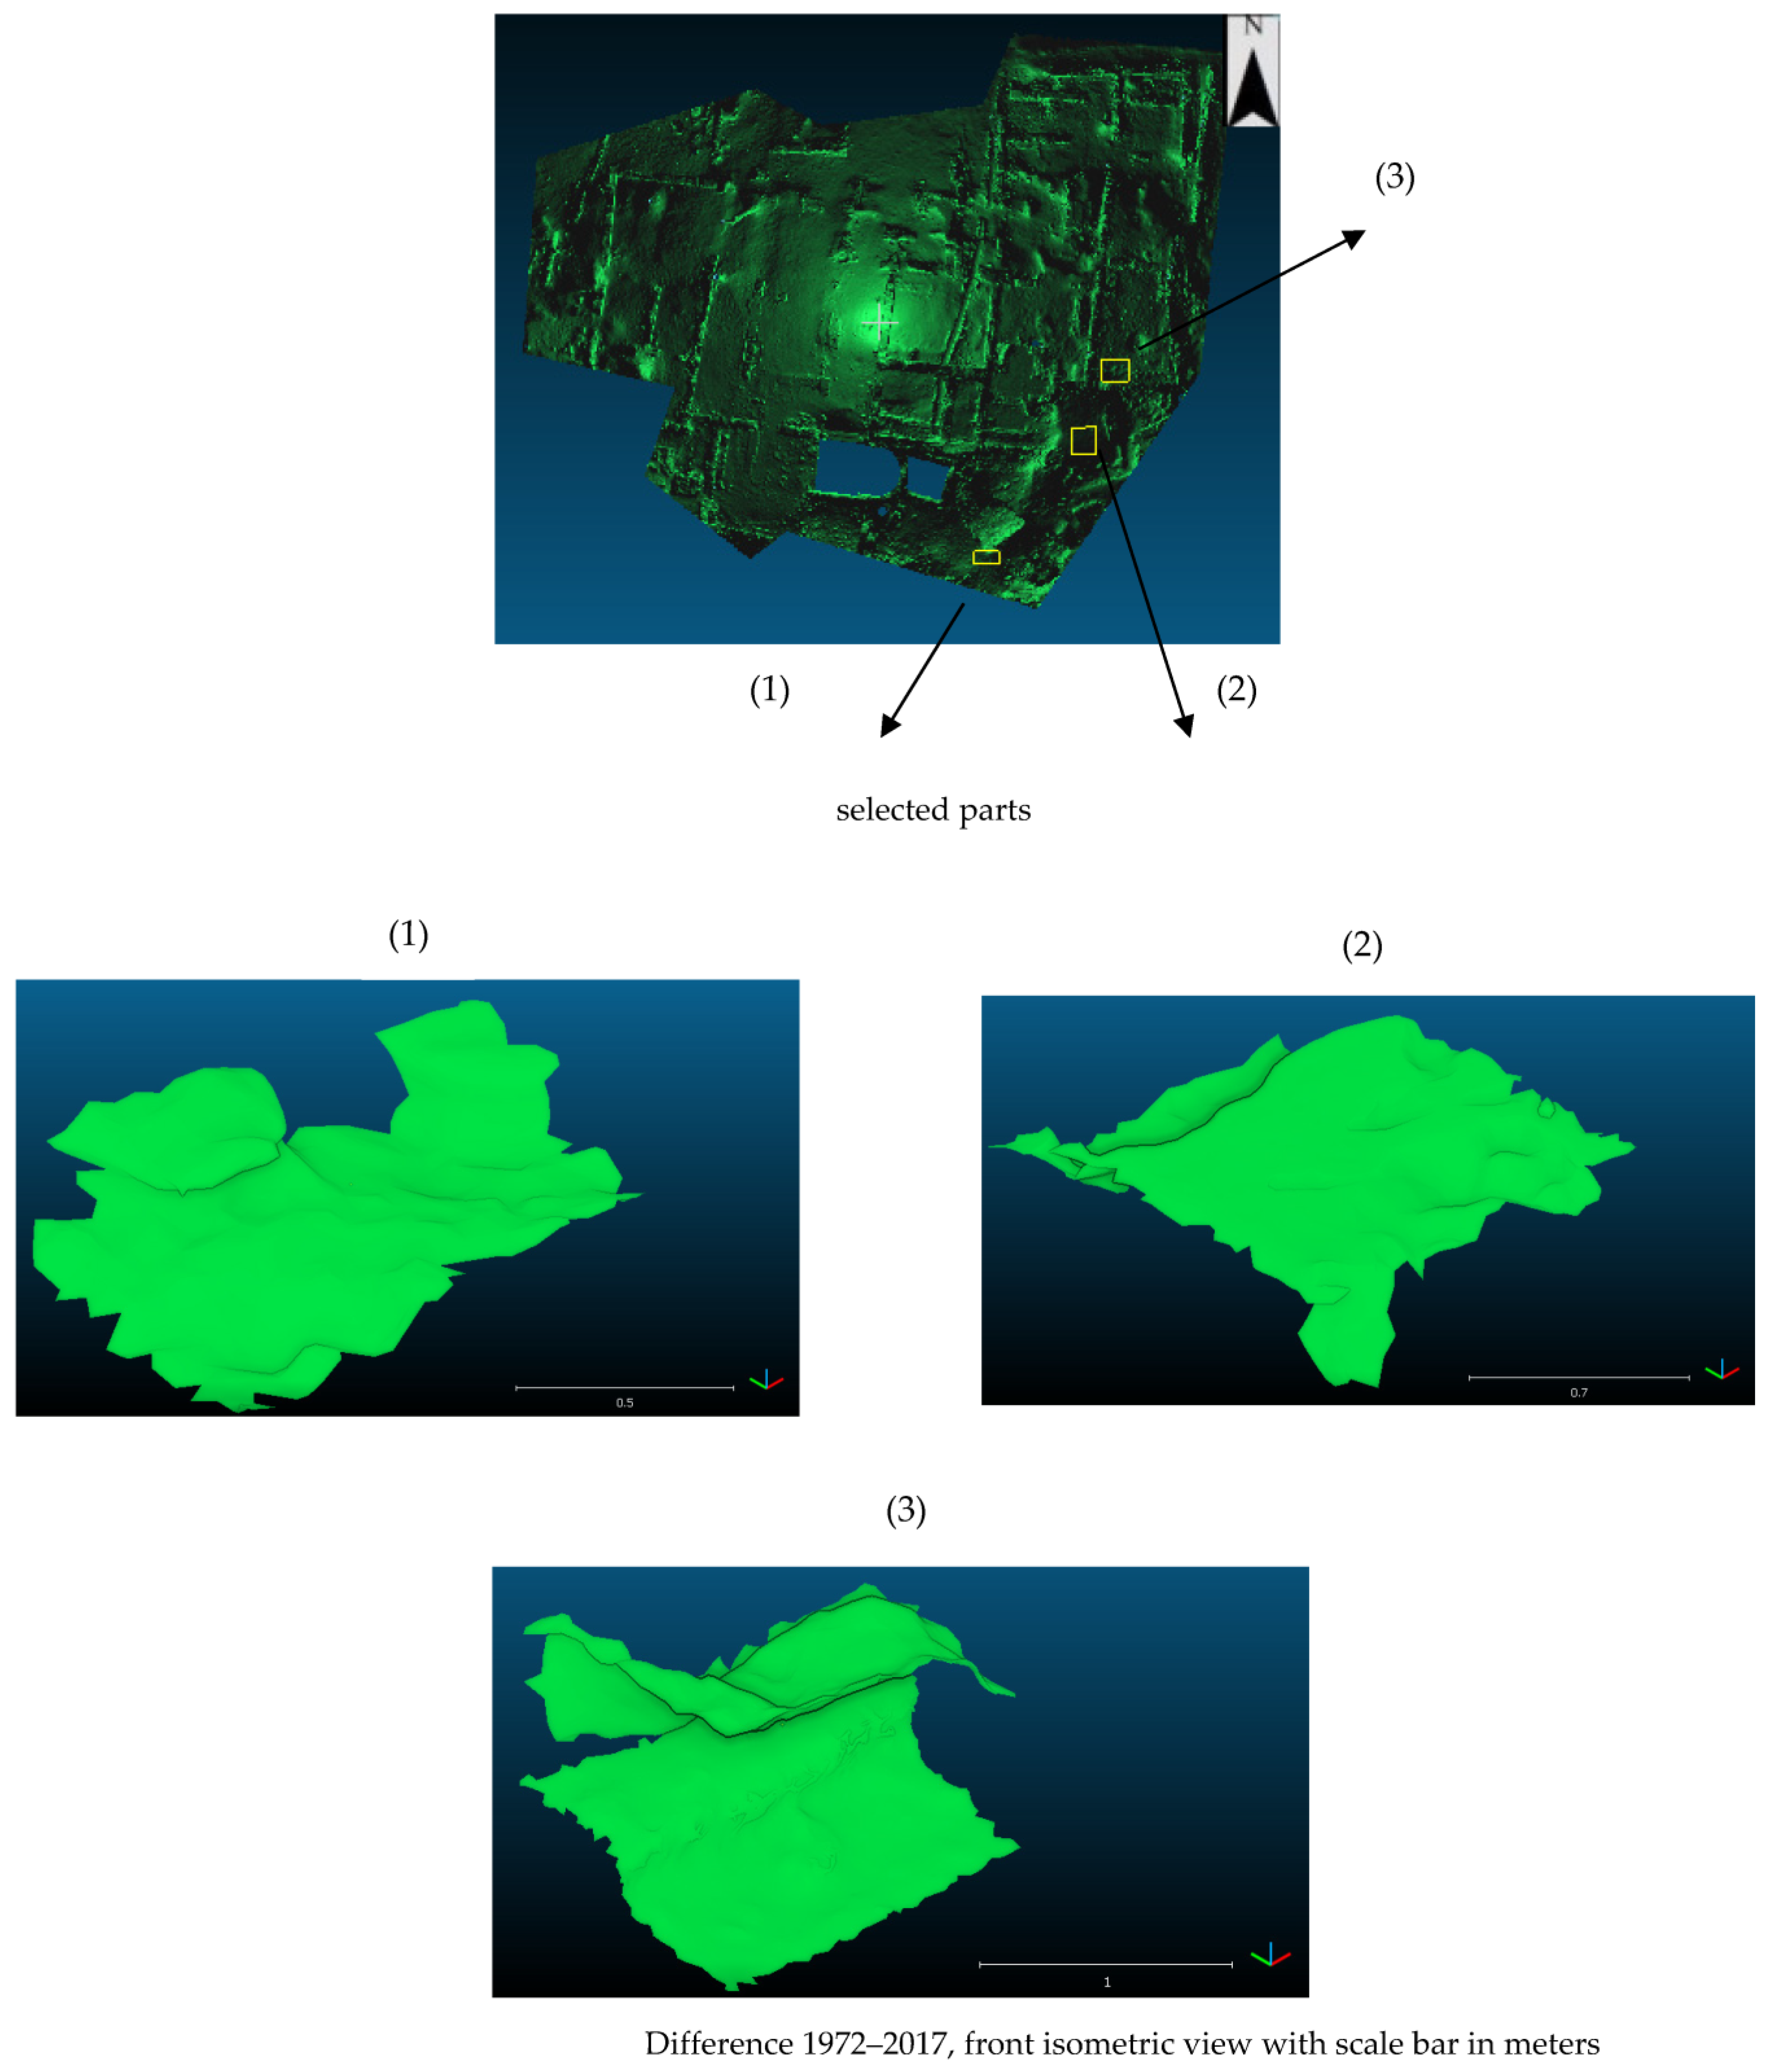
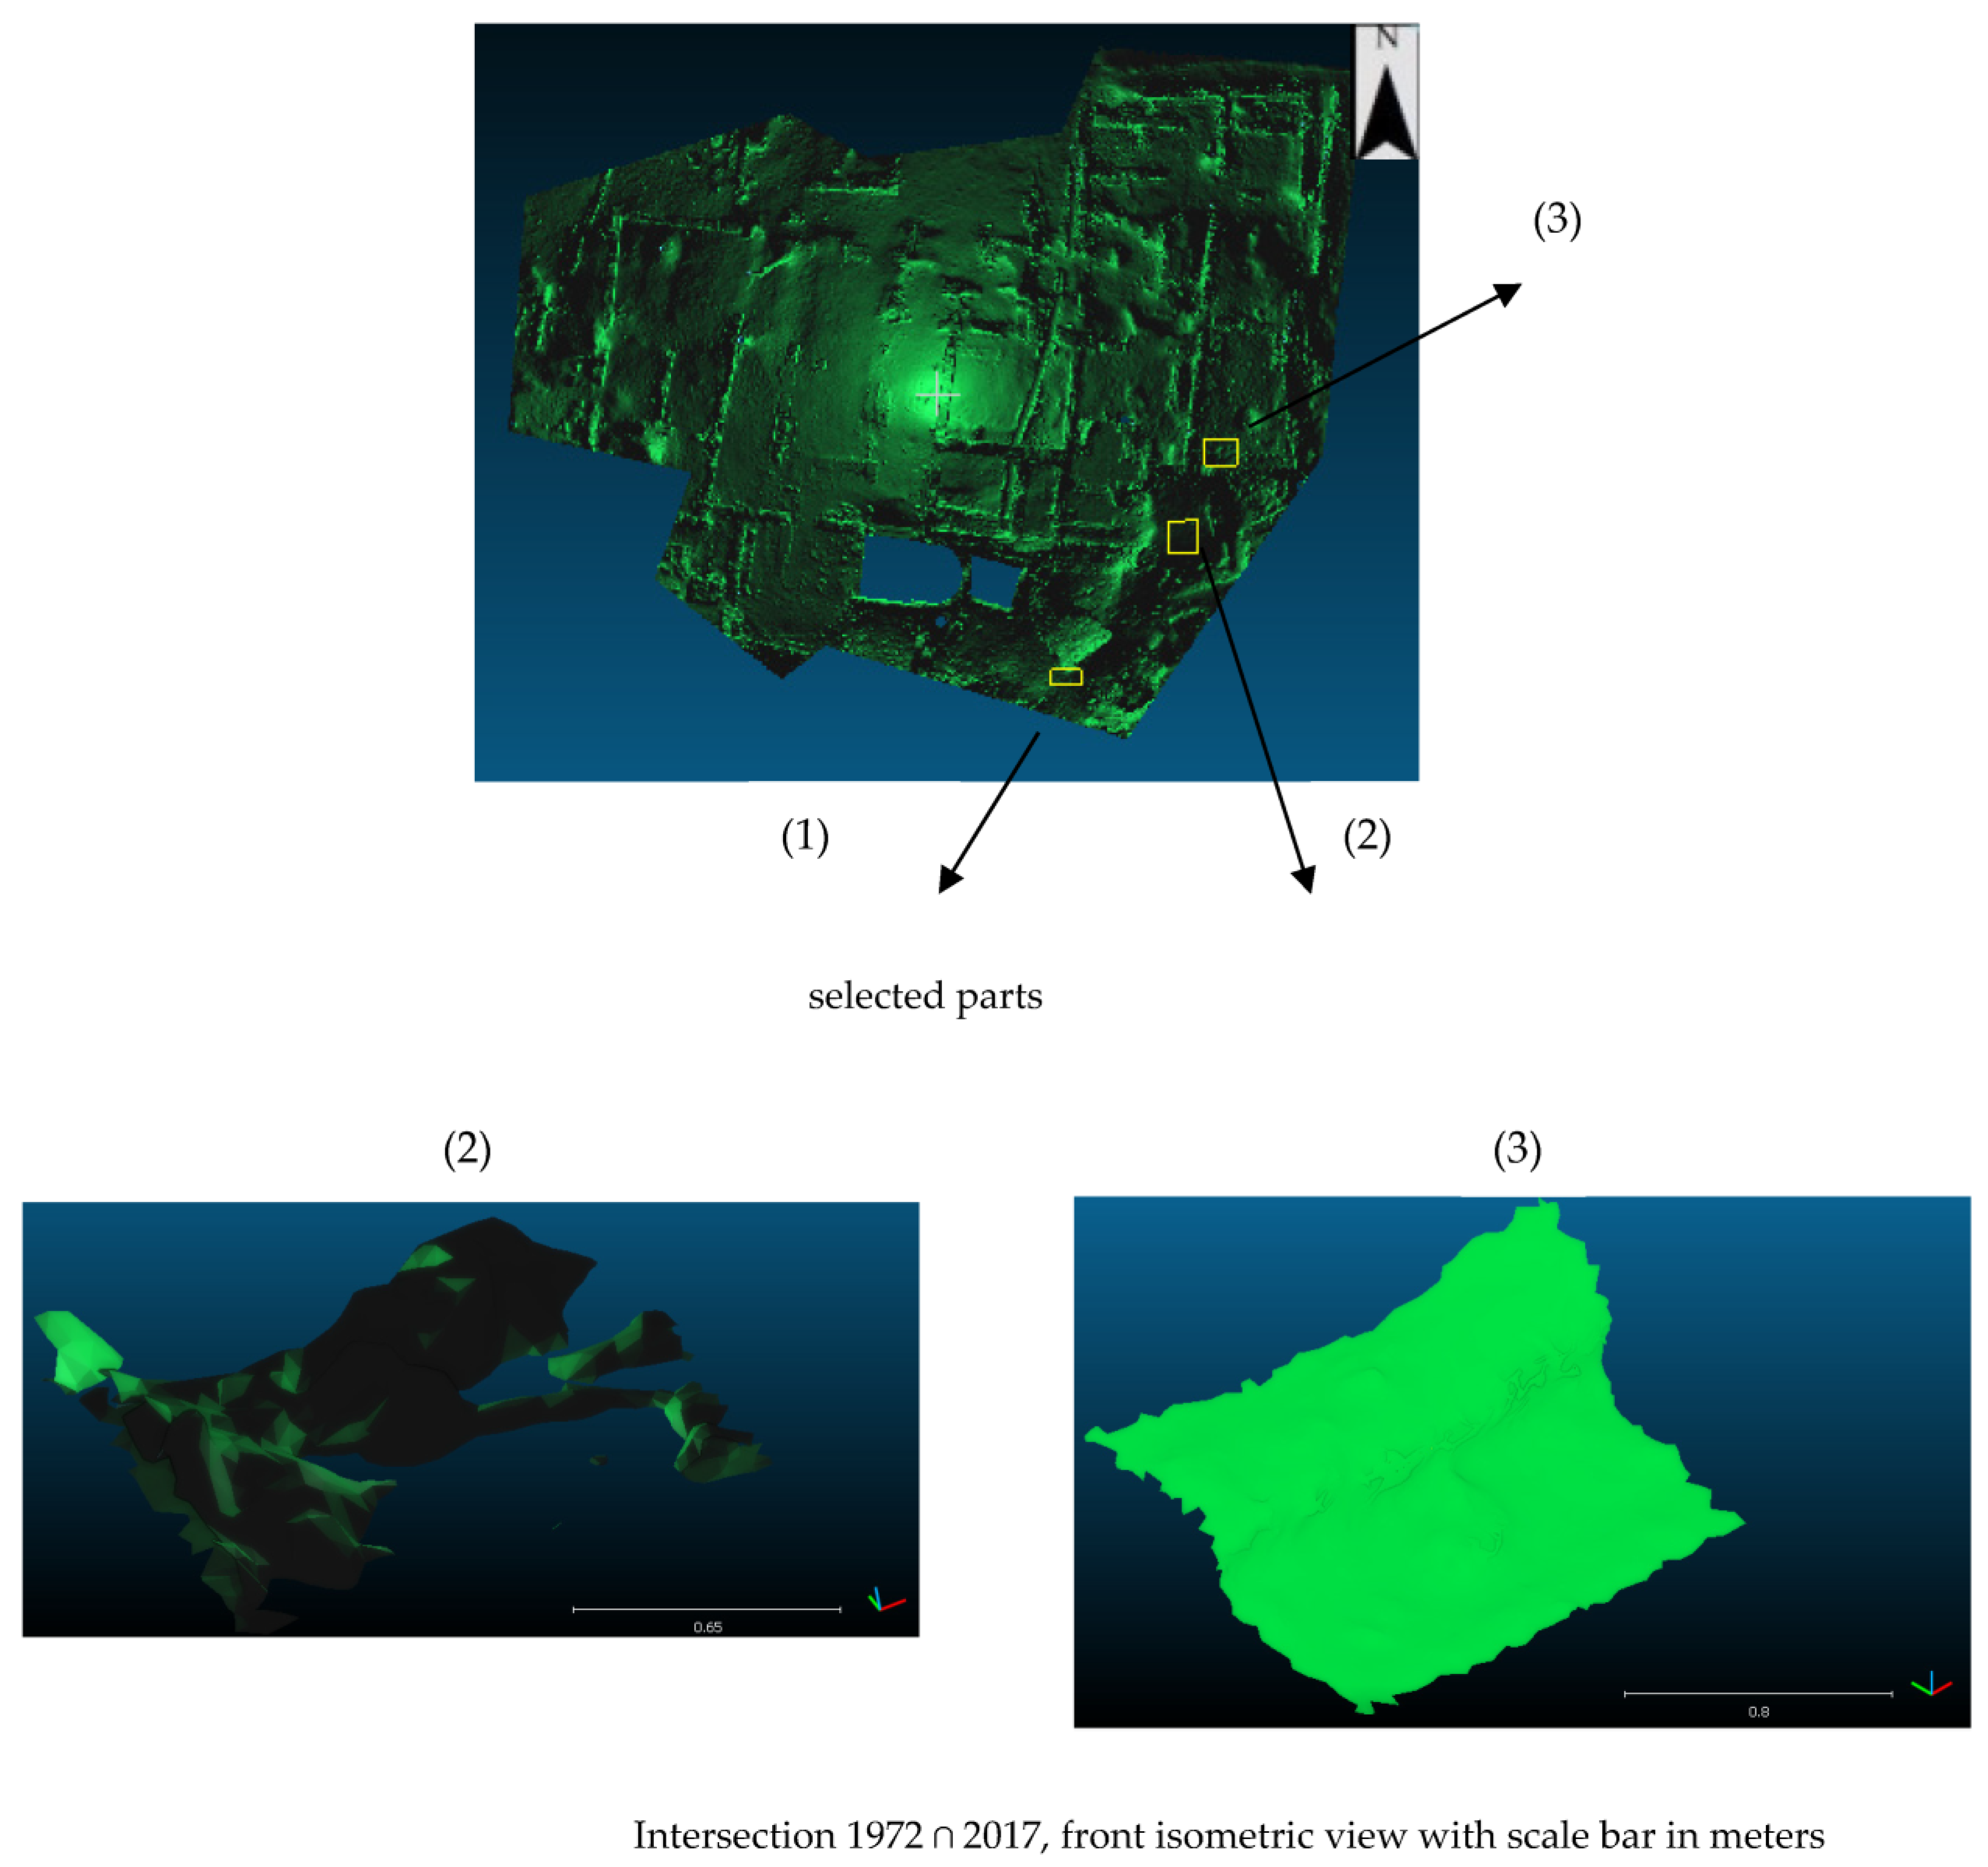
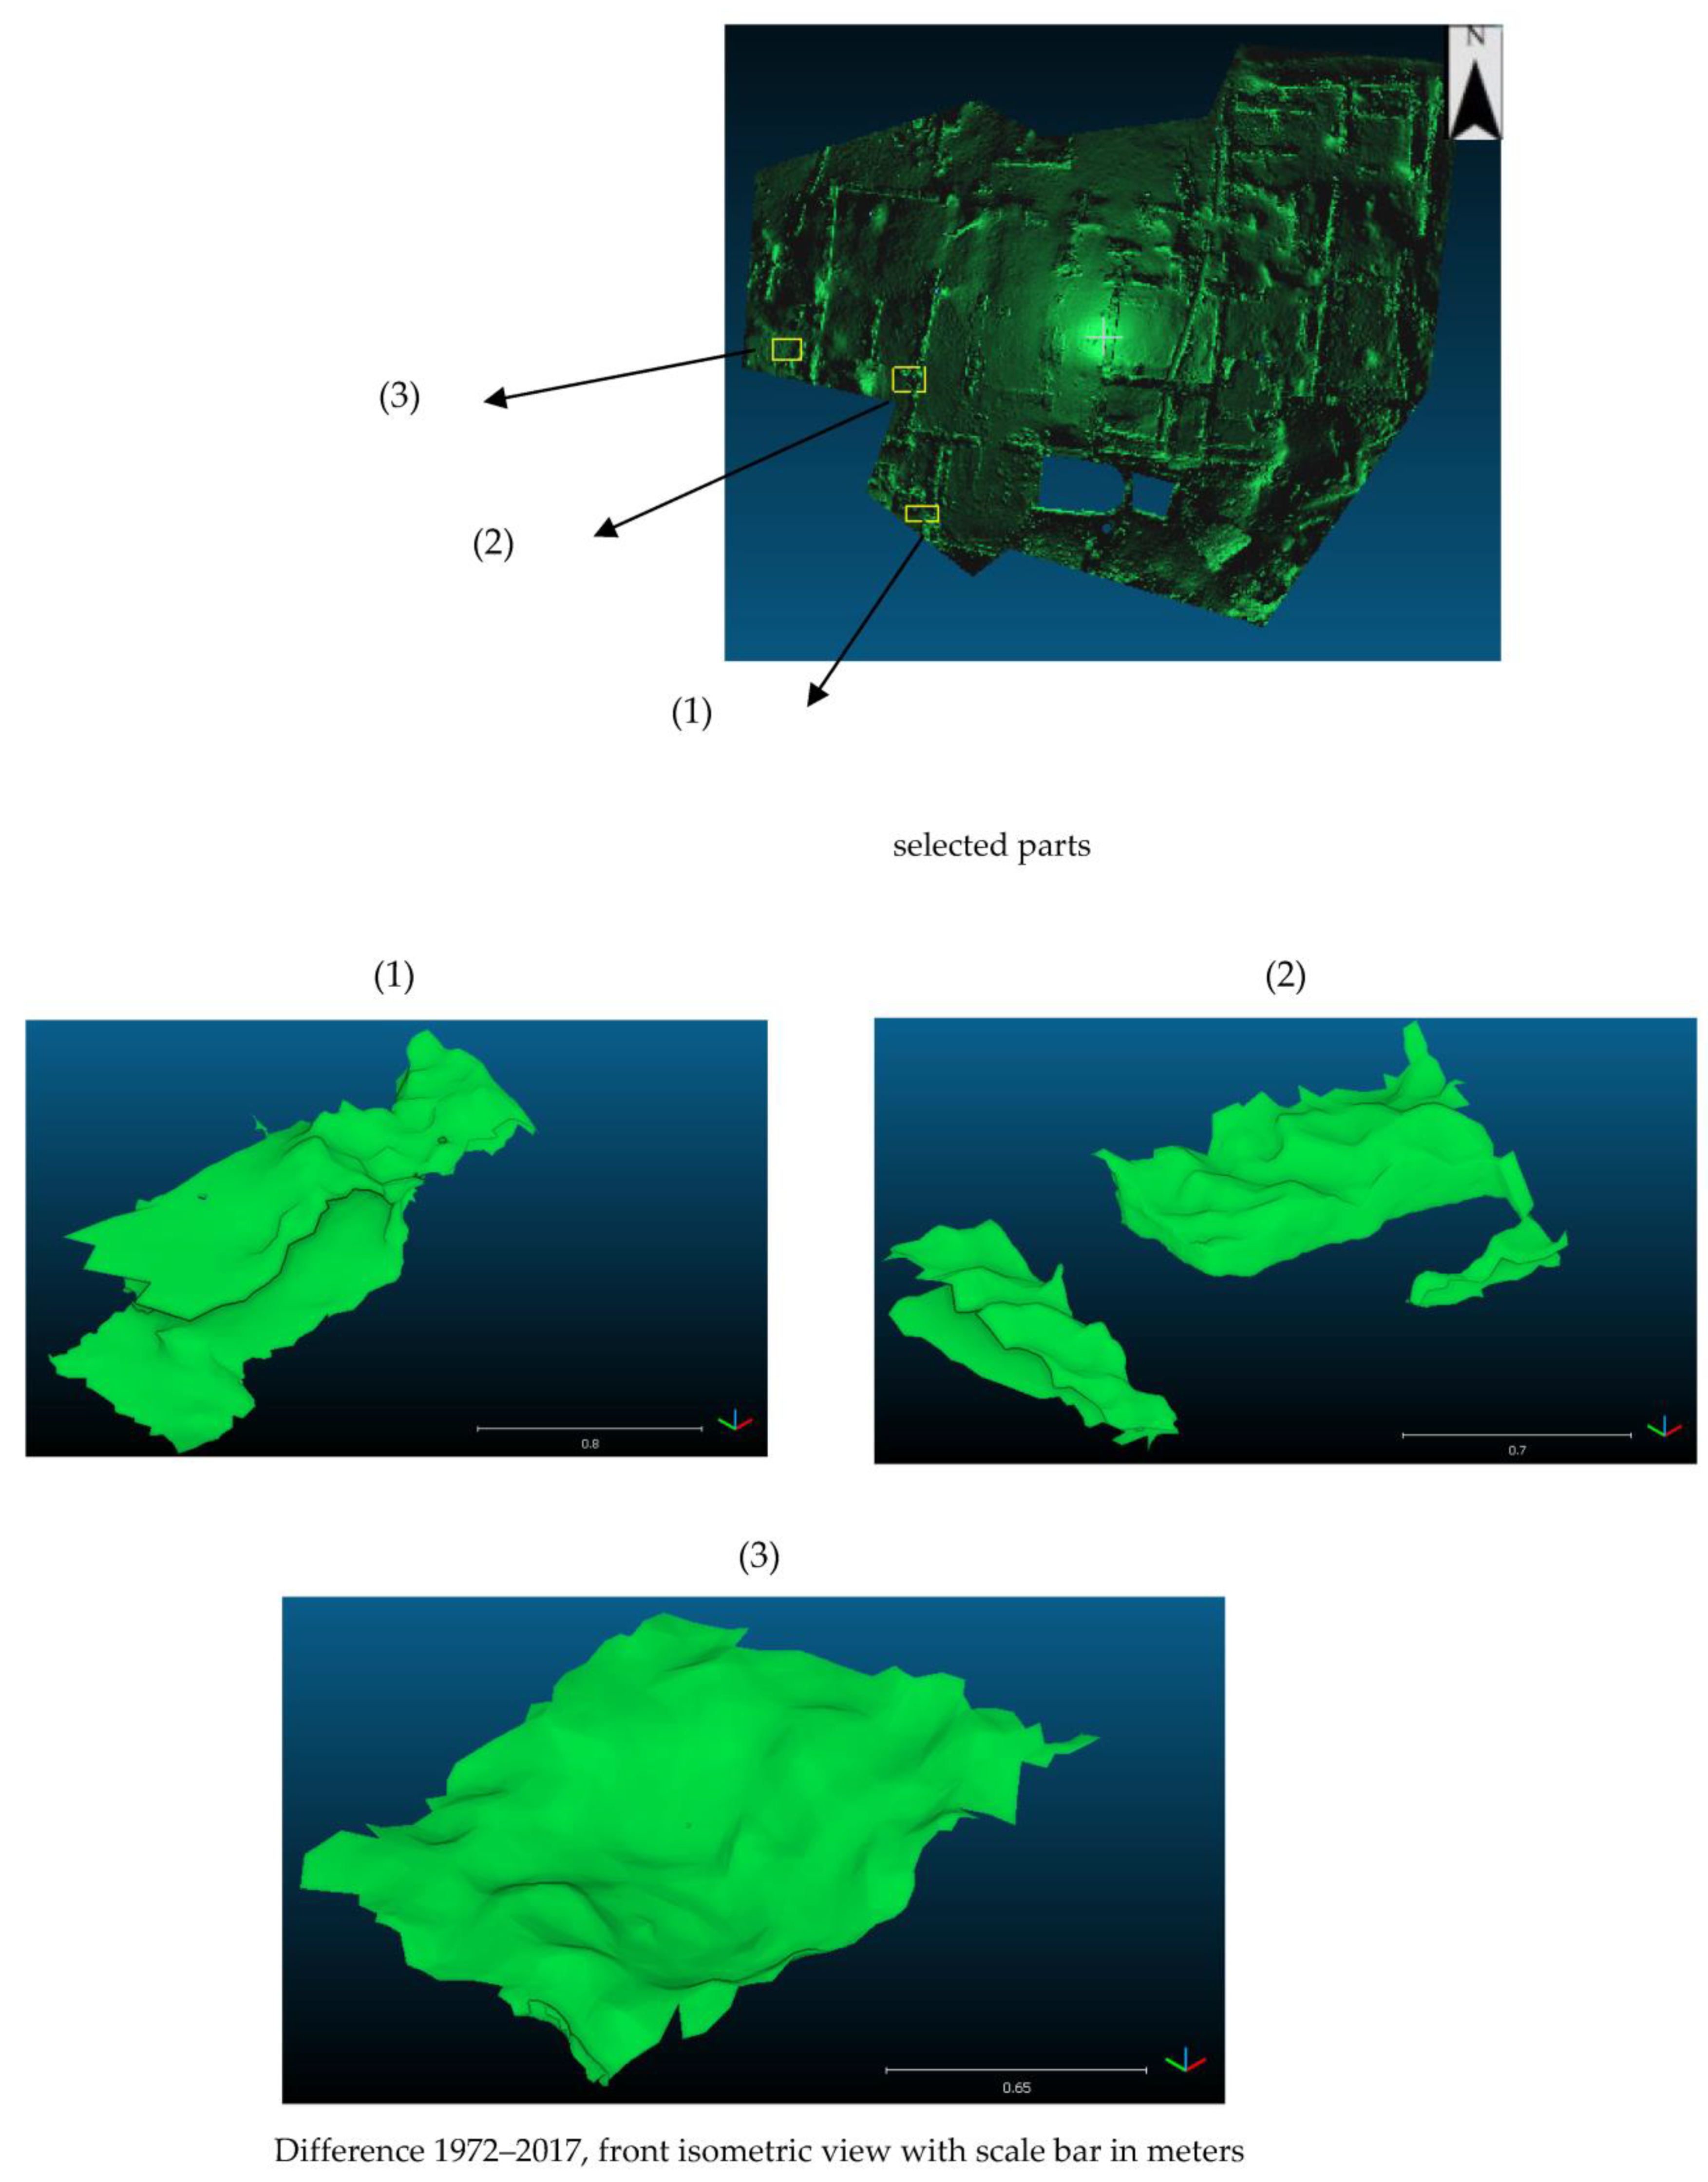
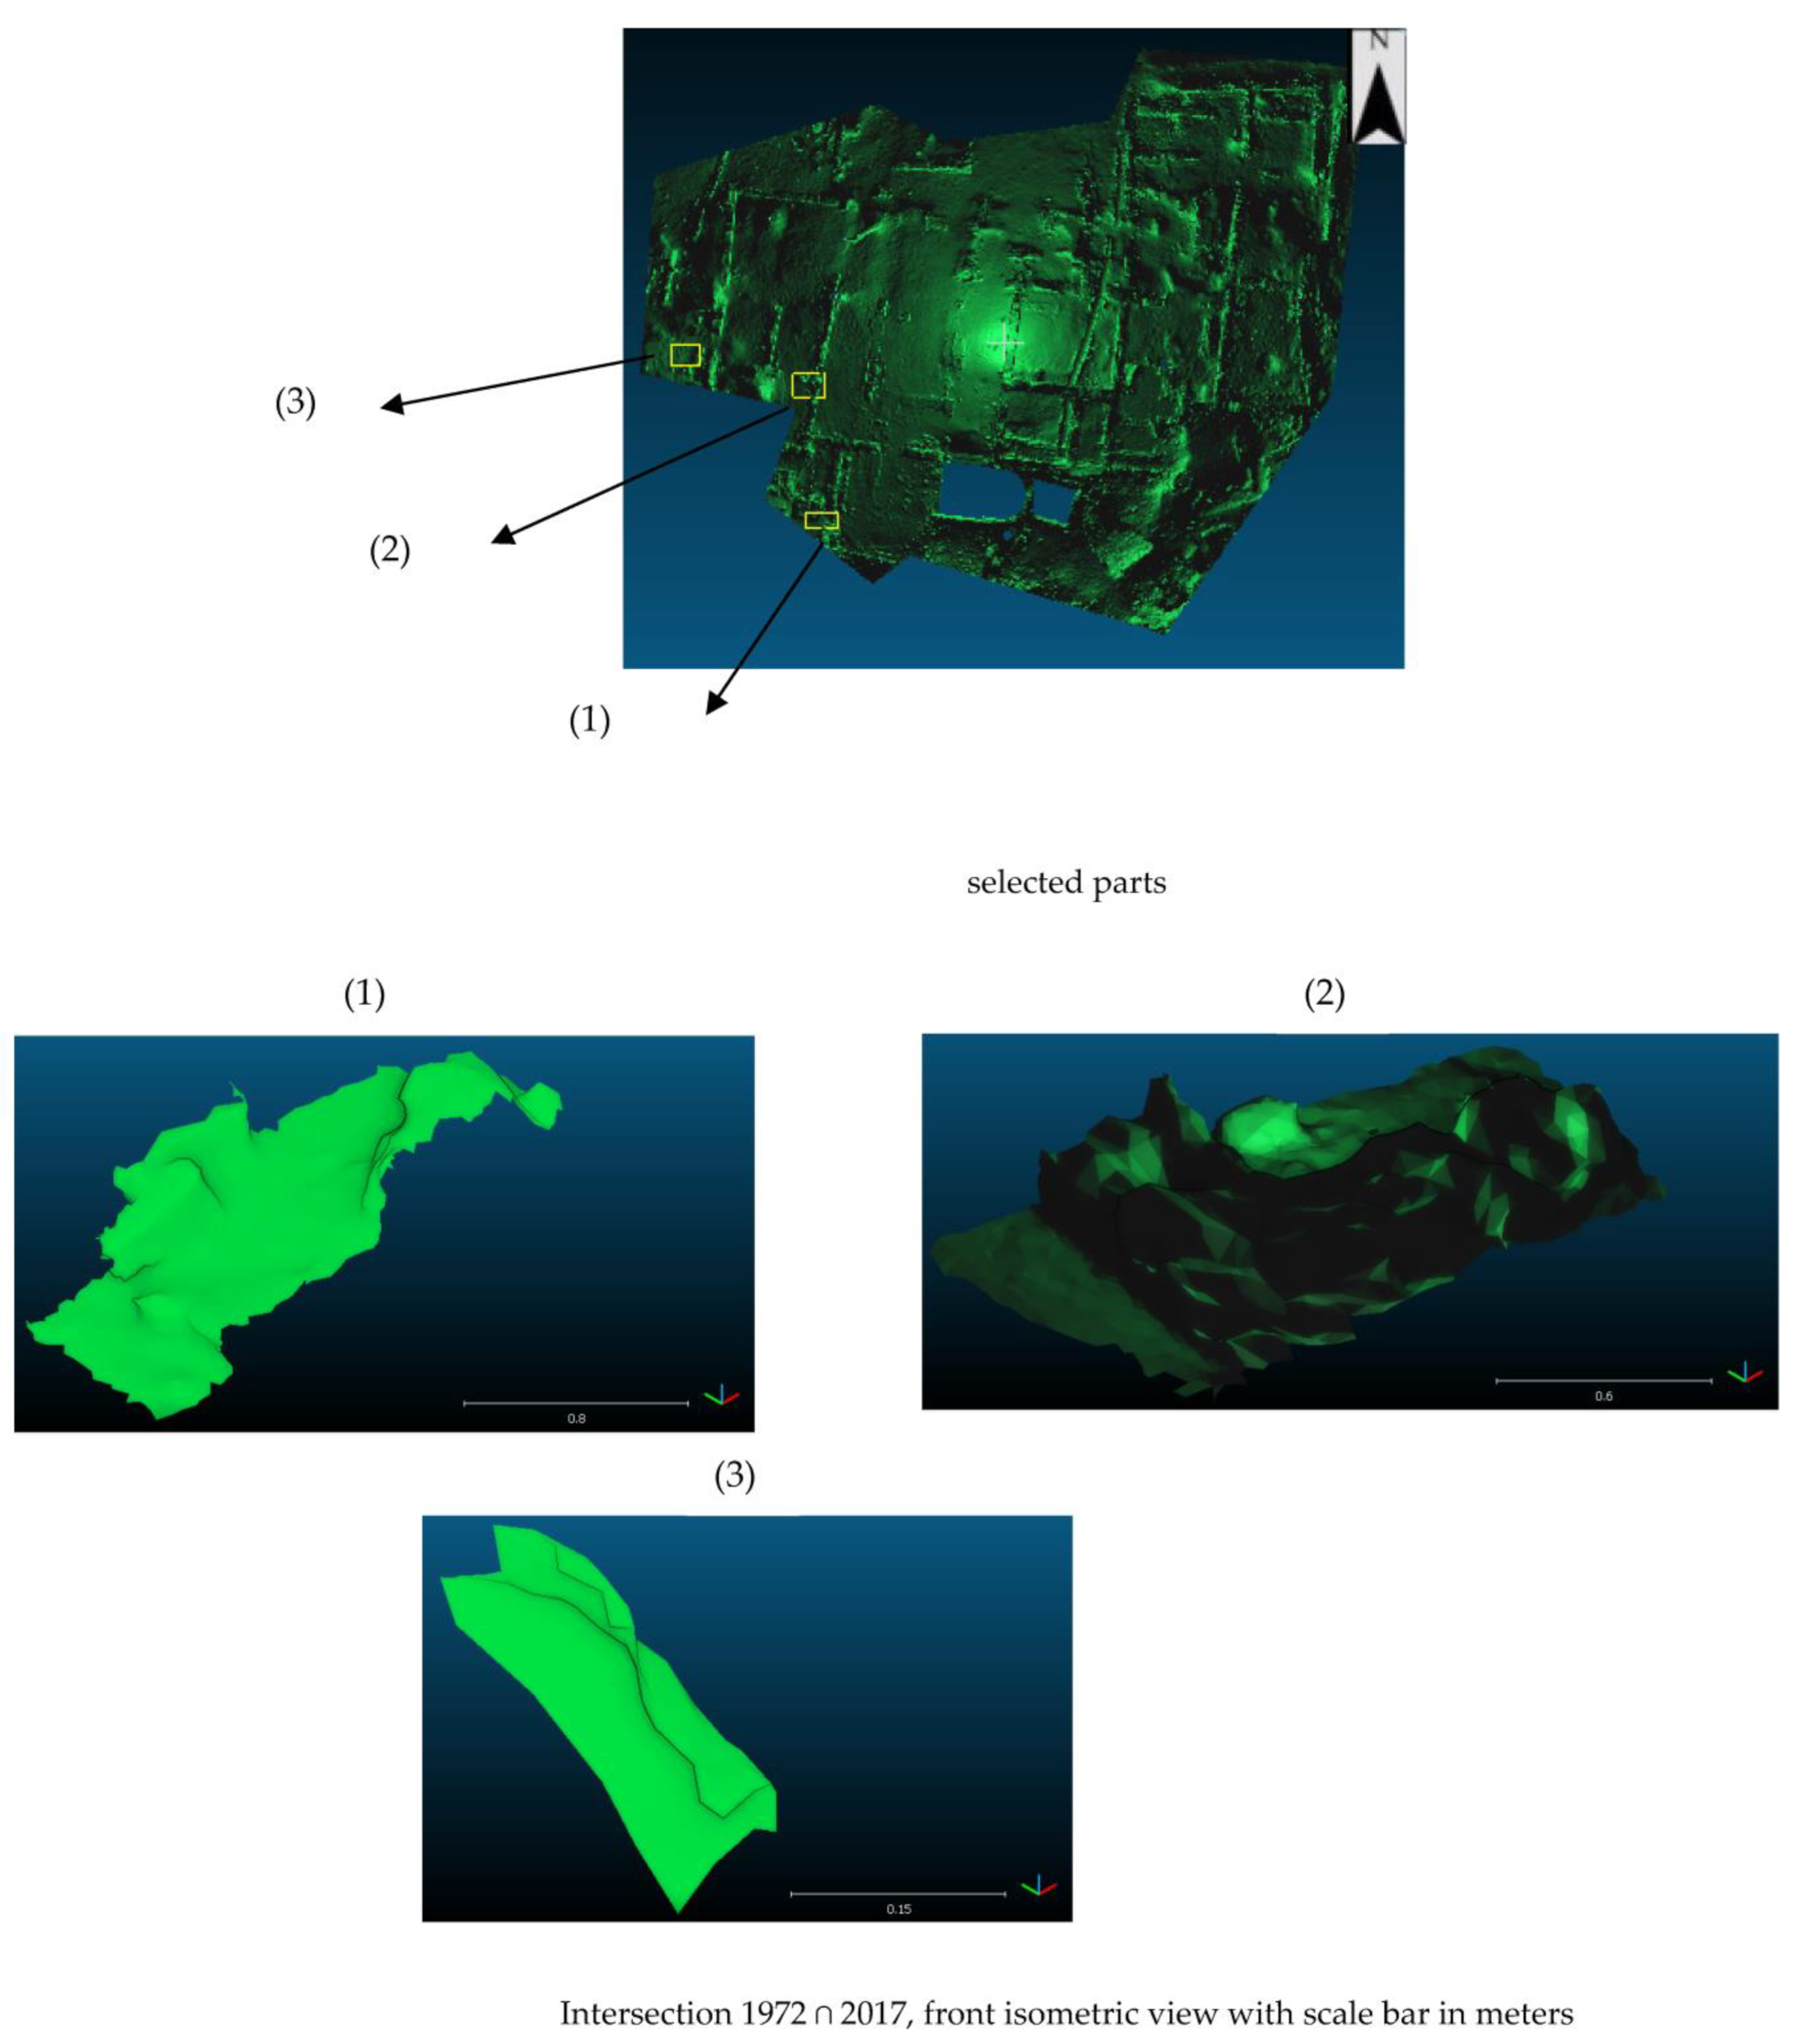
4.1. Boolean Operations Difference and Intersection

The 2016 (Figure 6) and 1972 (Figure 7) photos illustrate how 44 years of exposure to the elements and human interaction can not only deteriorate a site, but also redistribute volumes of rock and soil through erosion, sedimentation, collapse and backfilling.
The difference model and the intersection model of the initial models, in top and front isometric 3D views, are depicted in Figure 8, Figure 9, Figure 10, Figure 11, Figure 12, Figure 13, Figure 14, Figure 15, Figure 16 and Figure 17. The intersection model depicts the portion which is common to both contemporary and retrospective models. It could demonstrate the site features that have remained untouched since the time of excavation intersects as well as any flaws or inaccuracies in the retrospective version.
The Boolean operation of the difference from 1972–2017 at selected parts in the northeast Omega House region is given in Figure 8. The Boolean operation intersection 1972∩2017 at selected parts in the northeast model region is depicted in Figure 9. The intersection model parts are compact in contradiction with the difference model parts, where the latter present departmental nature. The Boolean operations of difference and intersection, respectively, at selected model parts in the central north part of Omega House areshown in Figure 10 and Figure 11. In part (1), the intersection model supersedes that of difference which indicates that the two models are mostly alike. However, in parts (2), (3) and (4) the opposite is true. Specifically, in parts (2) and (4) the body of the intersection models is smaller than that of the difference models. For part (3) no intersection model could be calculated. The Boolean operations difference and intersection at selected model parts in the northwest part of the monument are depicted in Figure 12 and Figure 13. In parts (1) and (2) the two models are more similar than different. Moreover, in part (3) the intersection model supersedes that of difference, so the 1972 and 2017 models are veryalike. The selected parts in the southeast part of Omega House are demonstrated in Figure 14 and Figure 15. In part (1) the two models are mostly different, and no intersection model could be calculated. In parts (2) and (3), the models under comparison present the depicted differences as well as a common portion as is illustrated in Figure 12. The Boolean operations difference and intersection of model parts in the southwest region of the monument are shown in Figure 16 and Figure 17. In part (3) the models are mostly different and not alike. In parts (1) and (2) the two models are not only differing but are also presenting a common portion as is depicted in Figure 17.

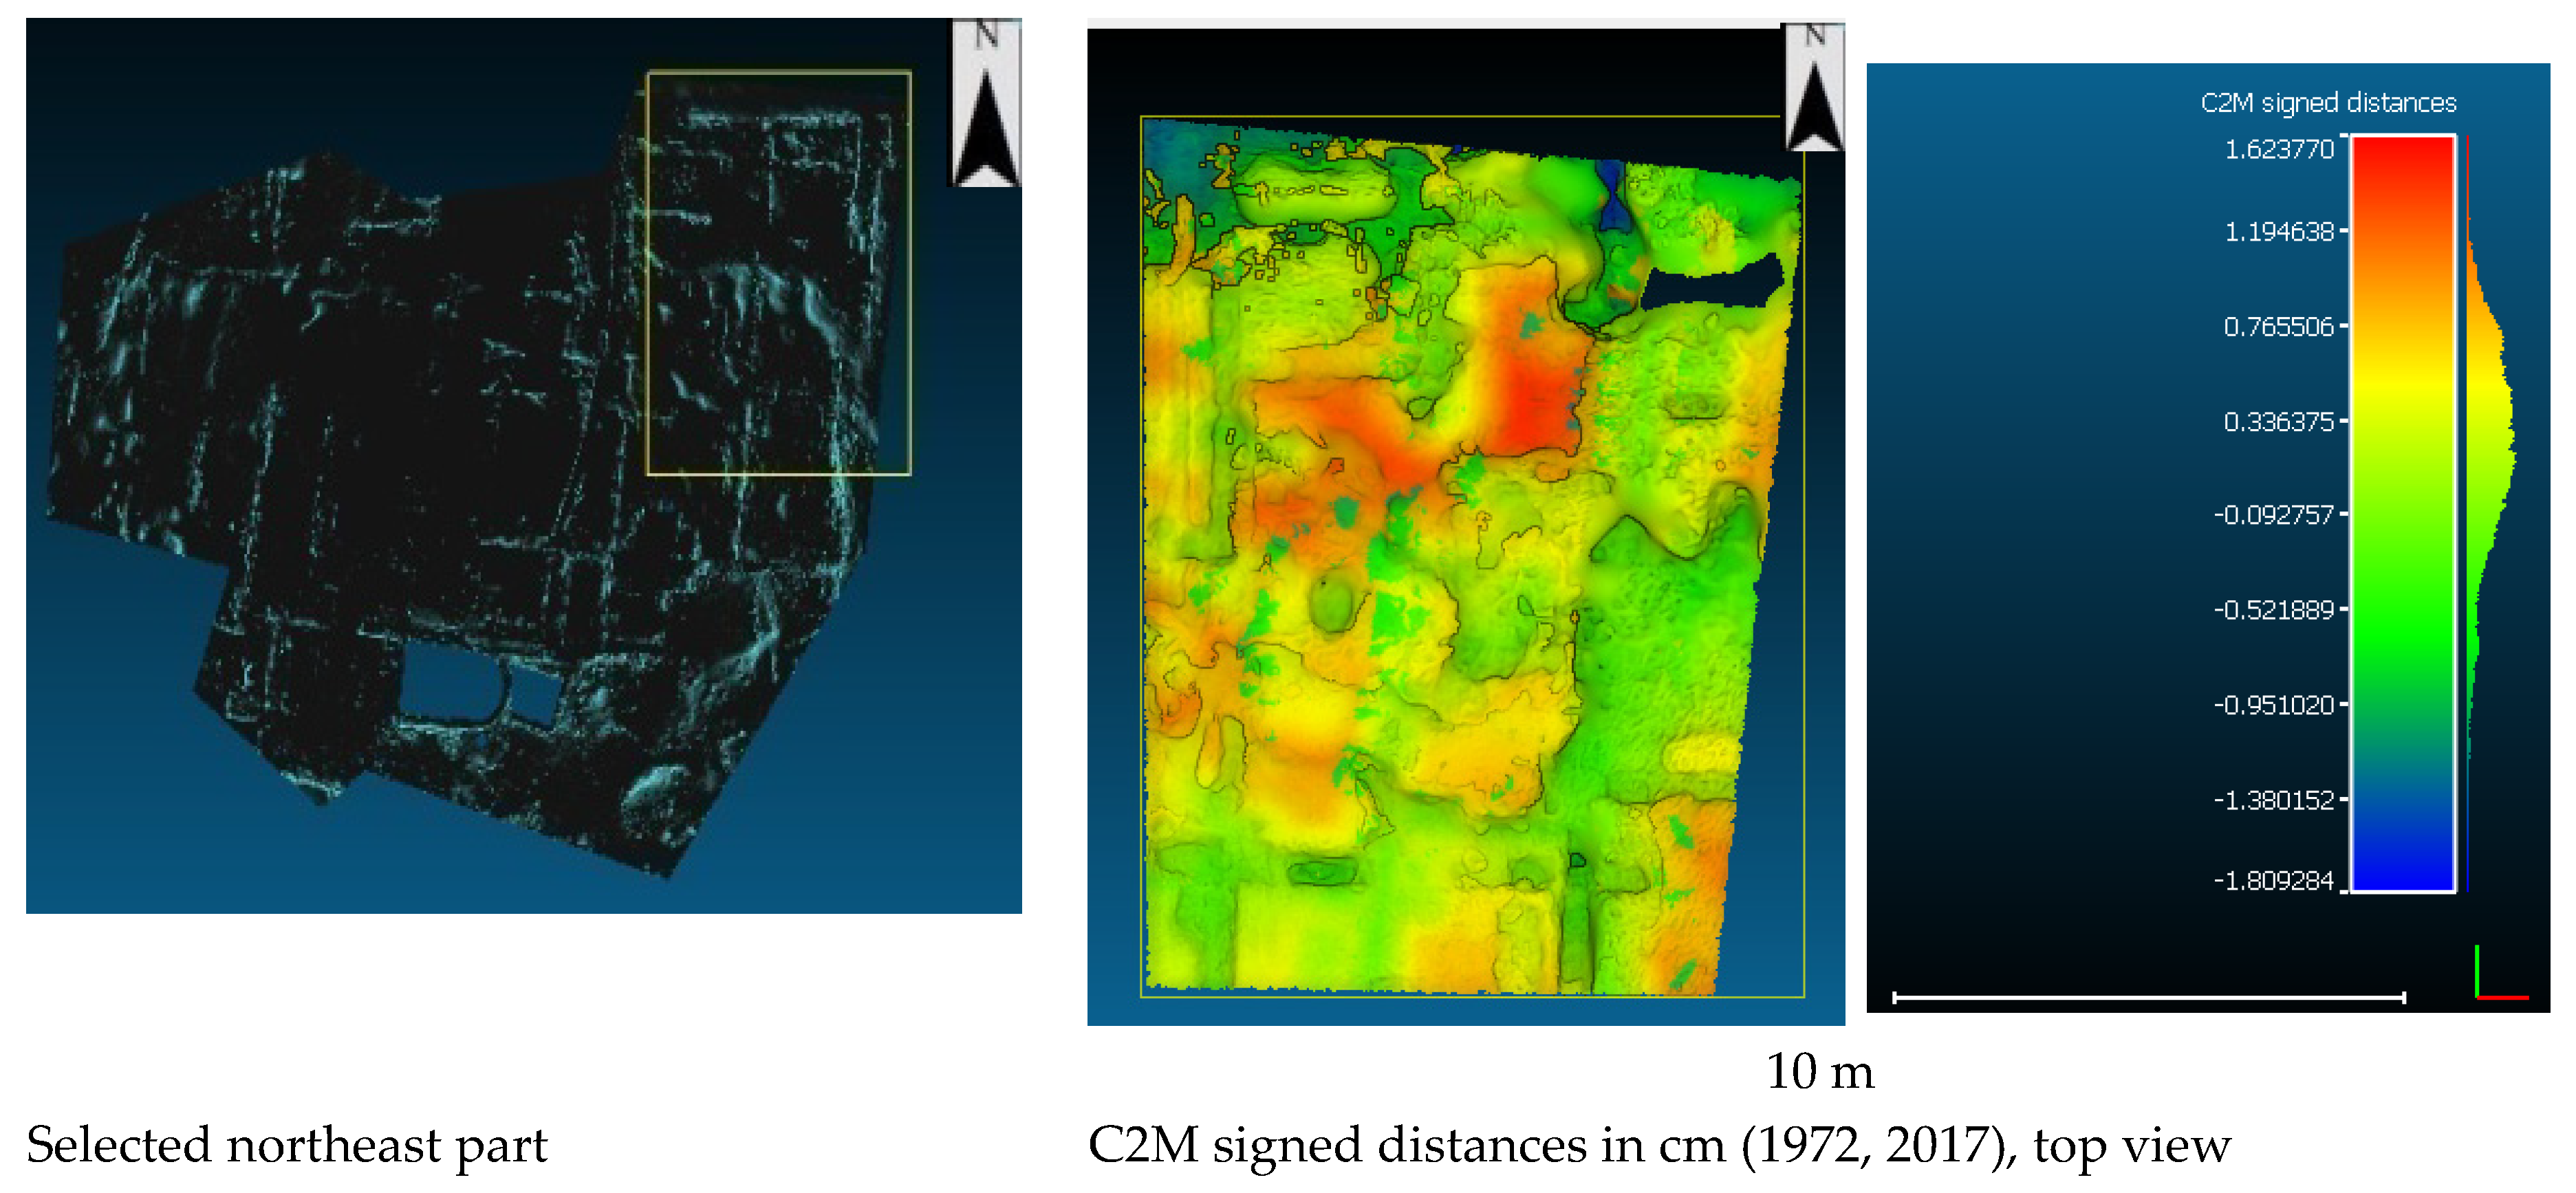
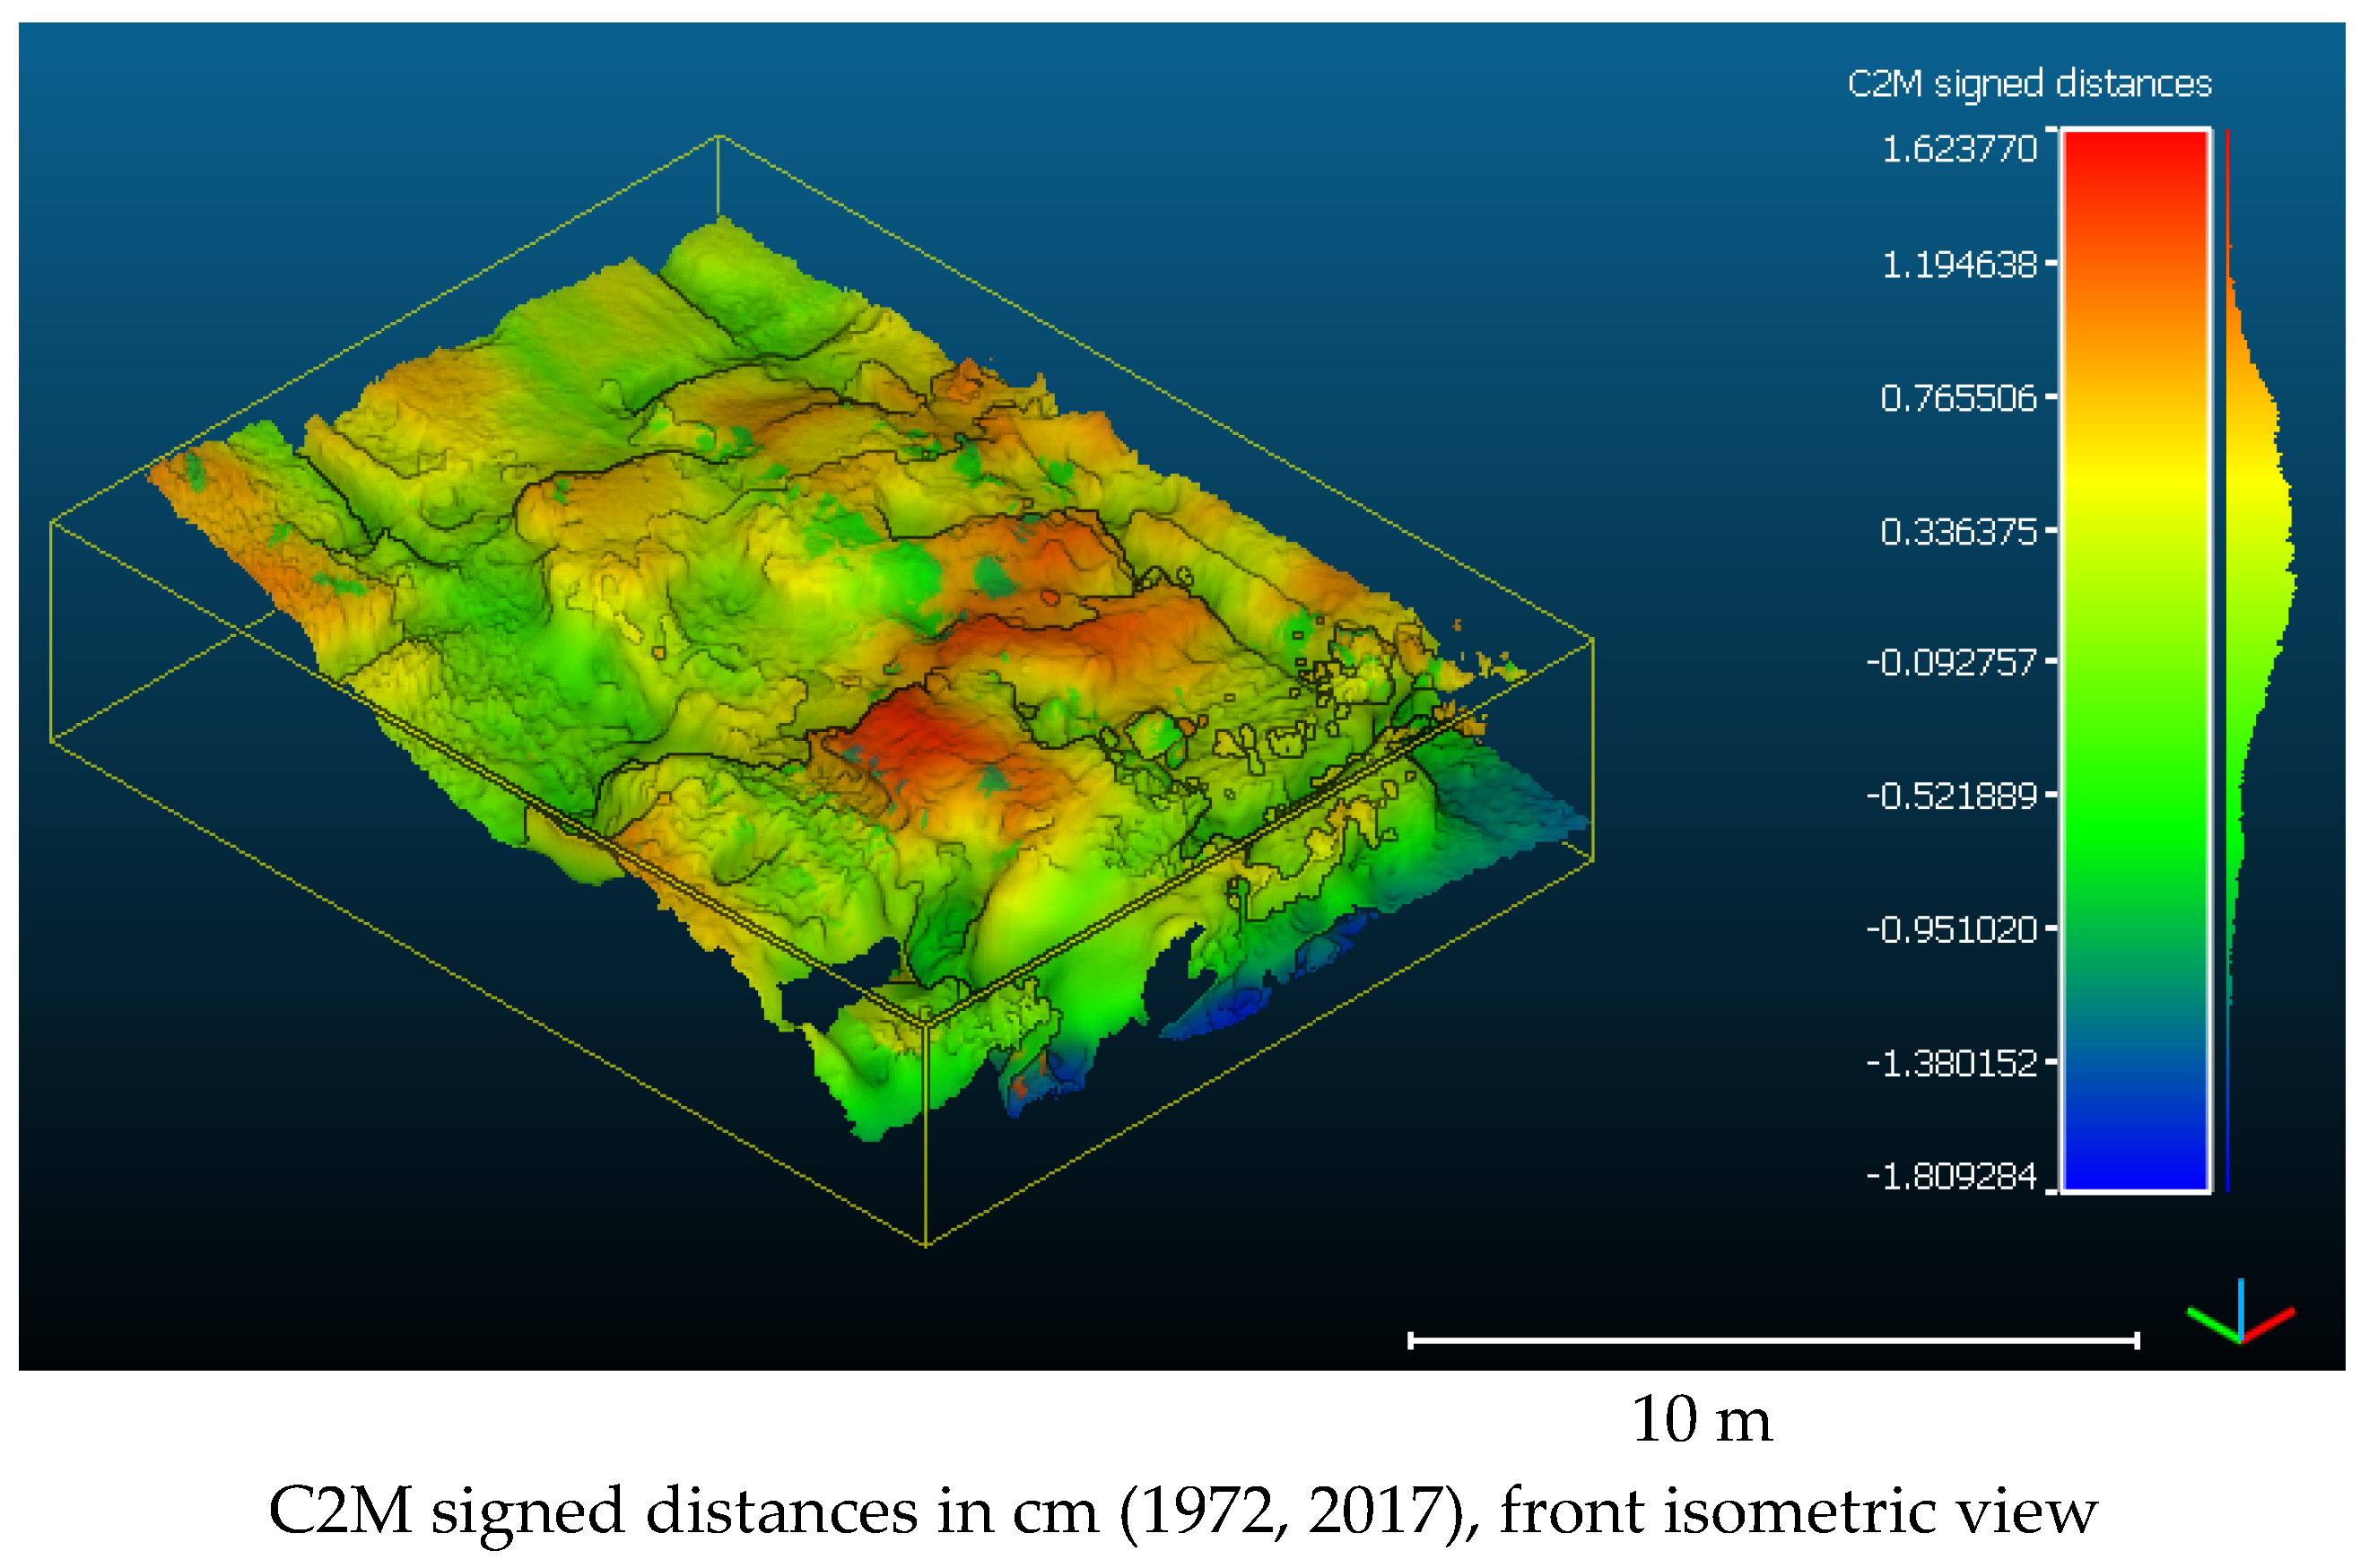
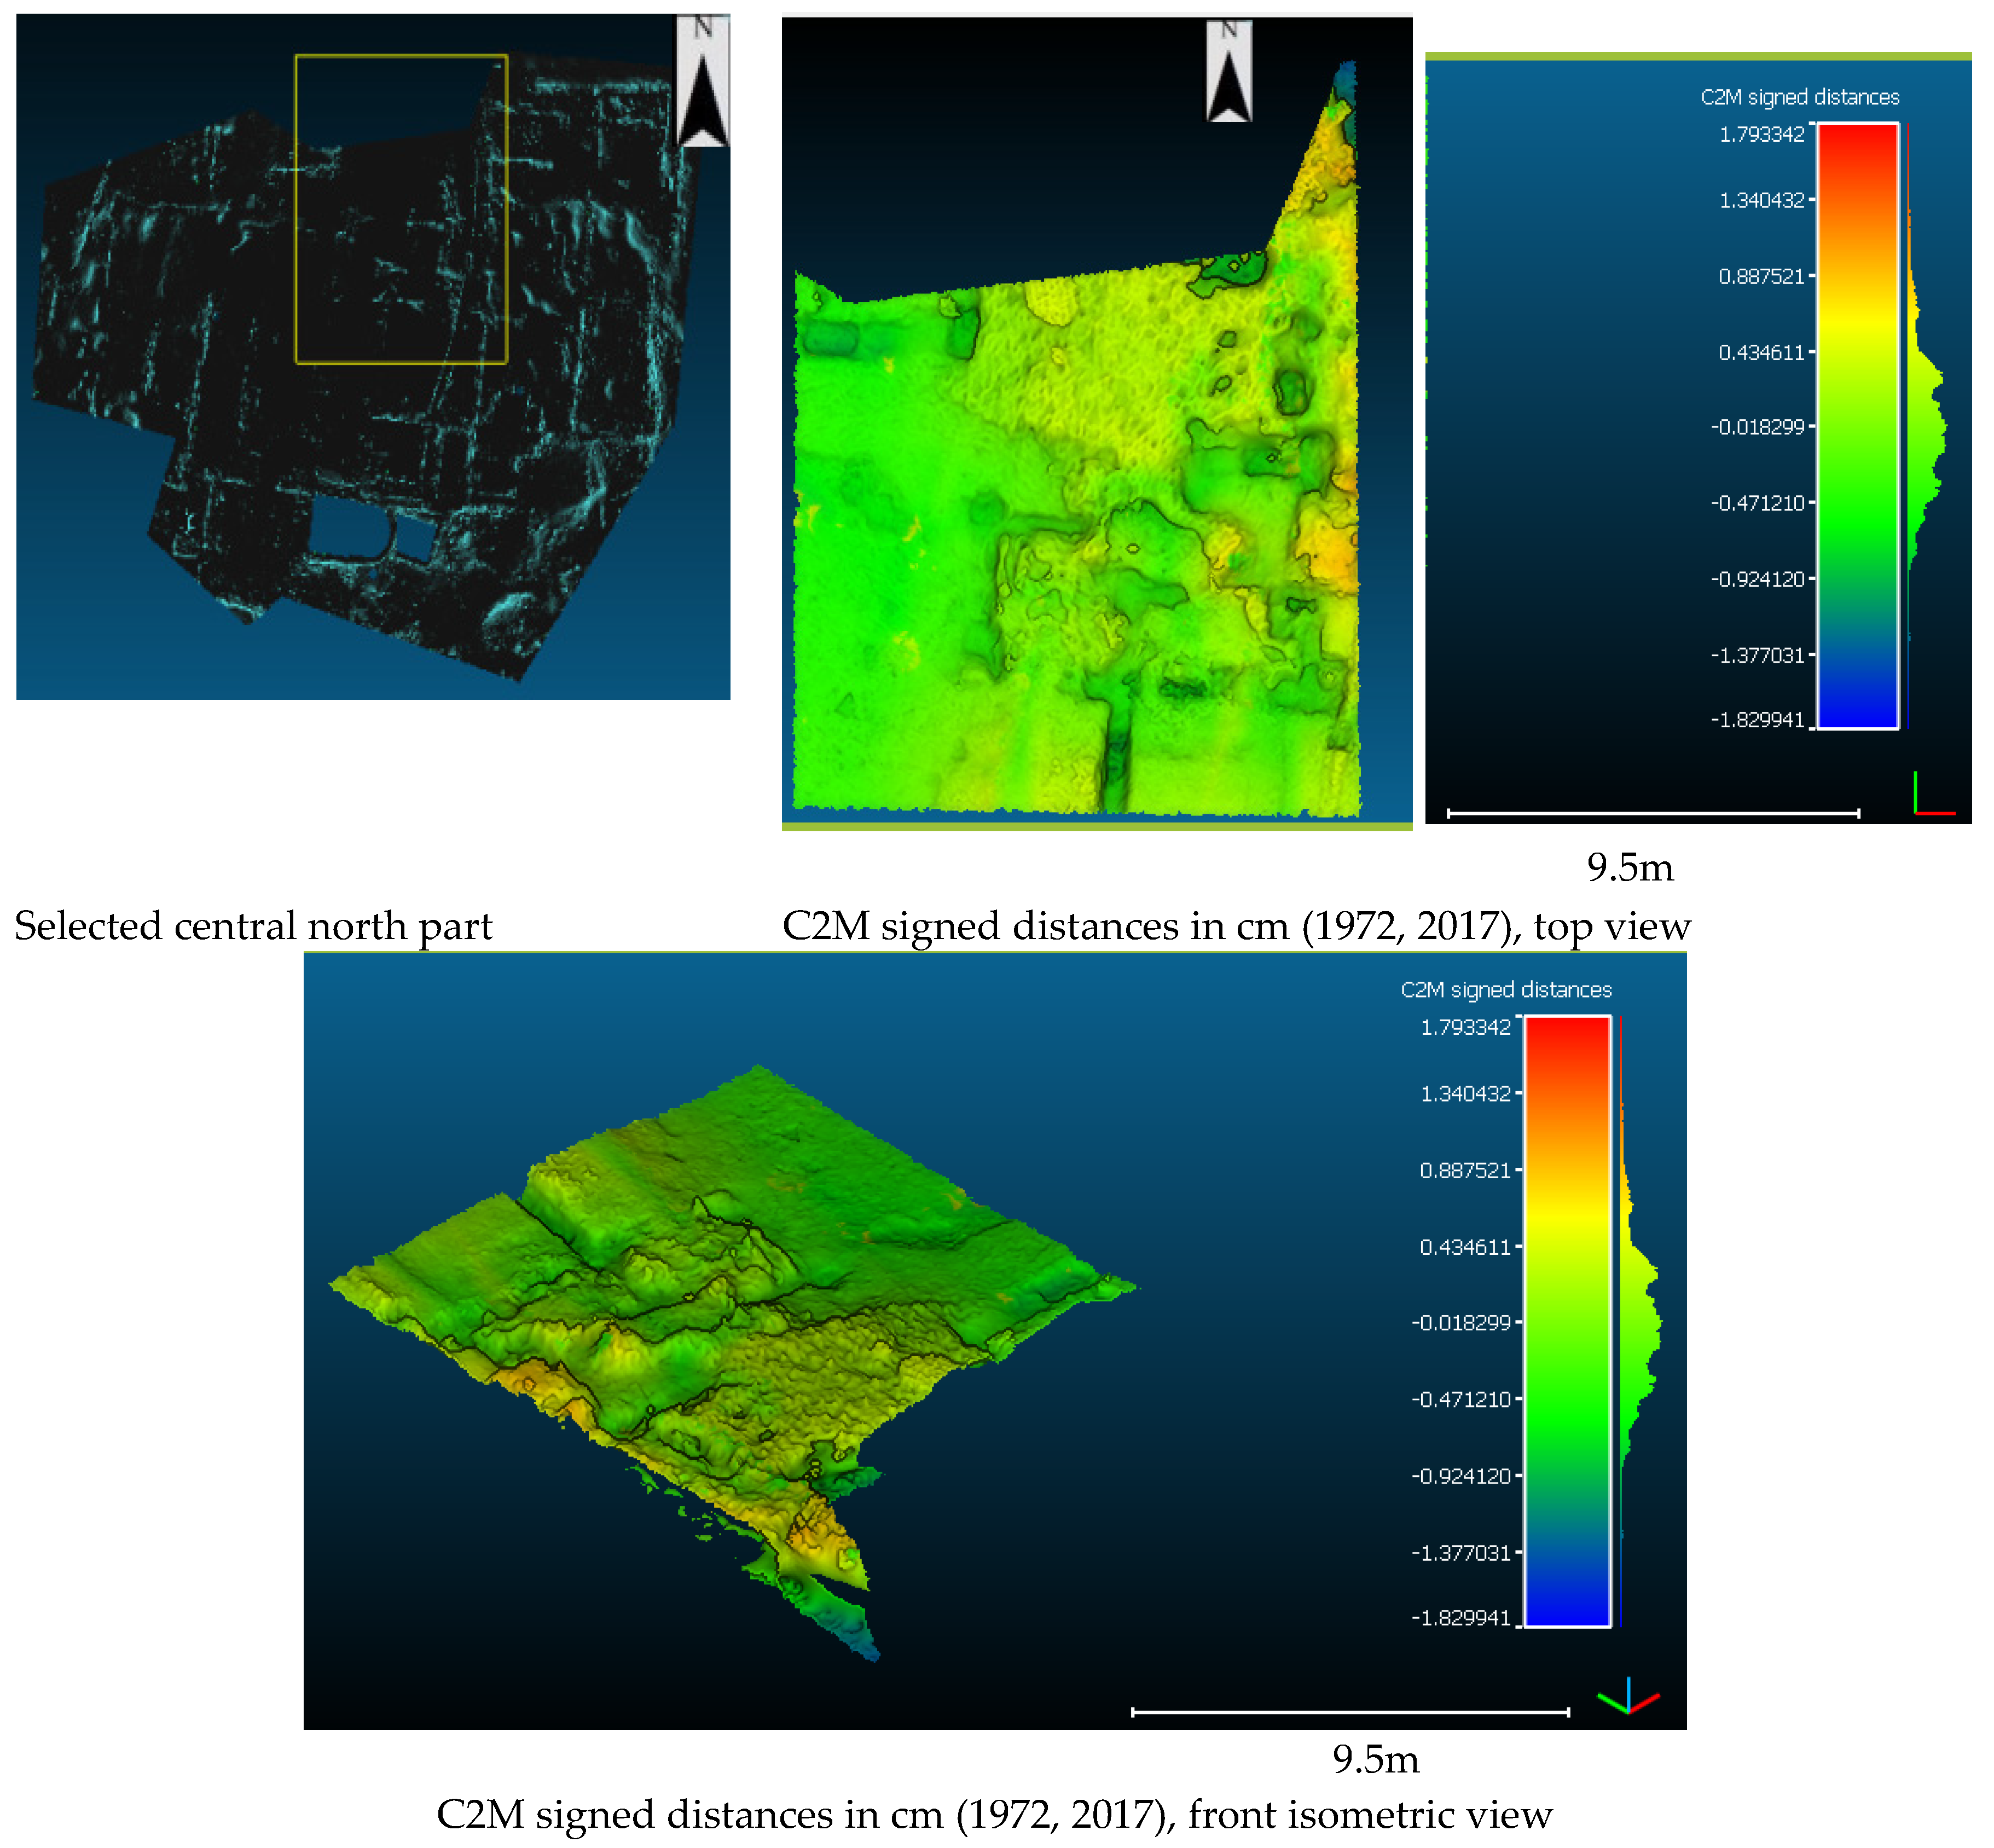
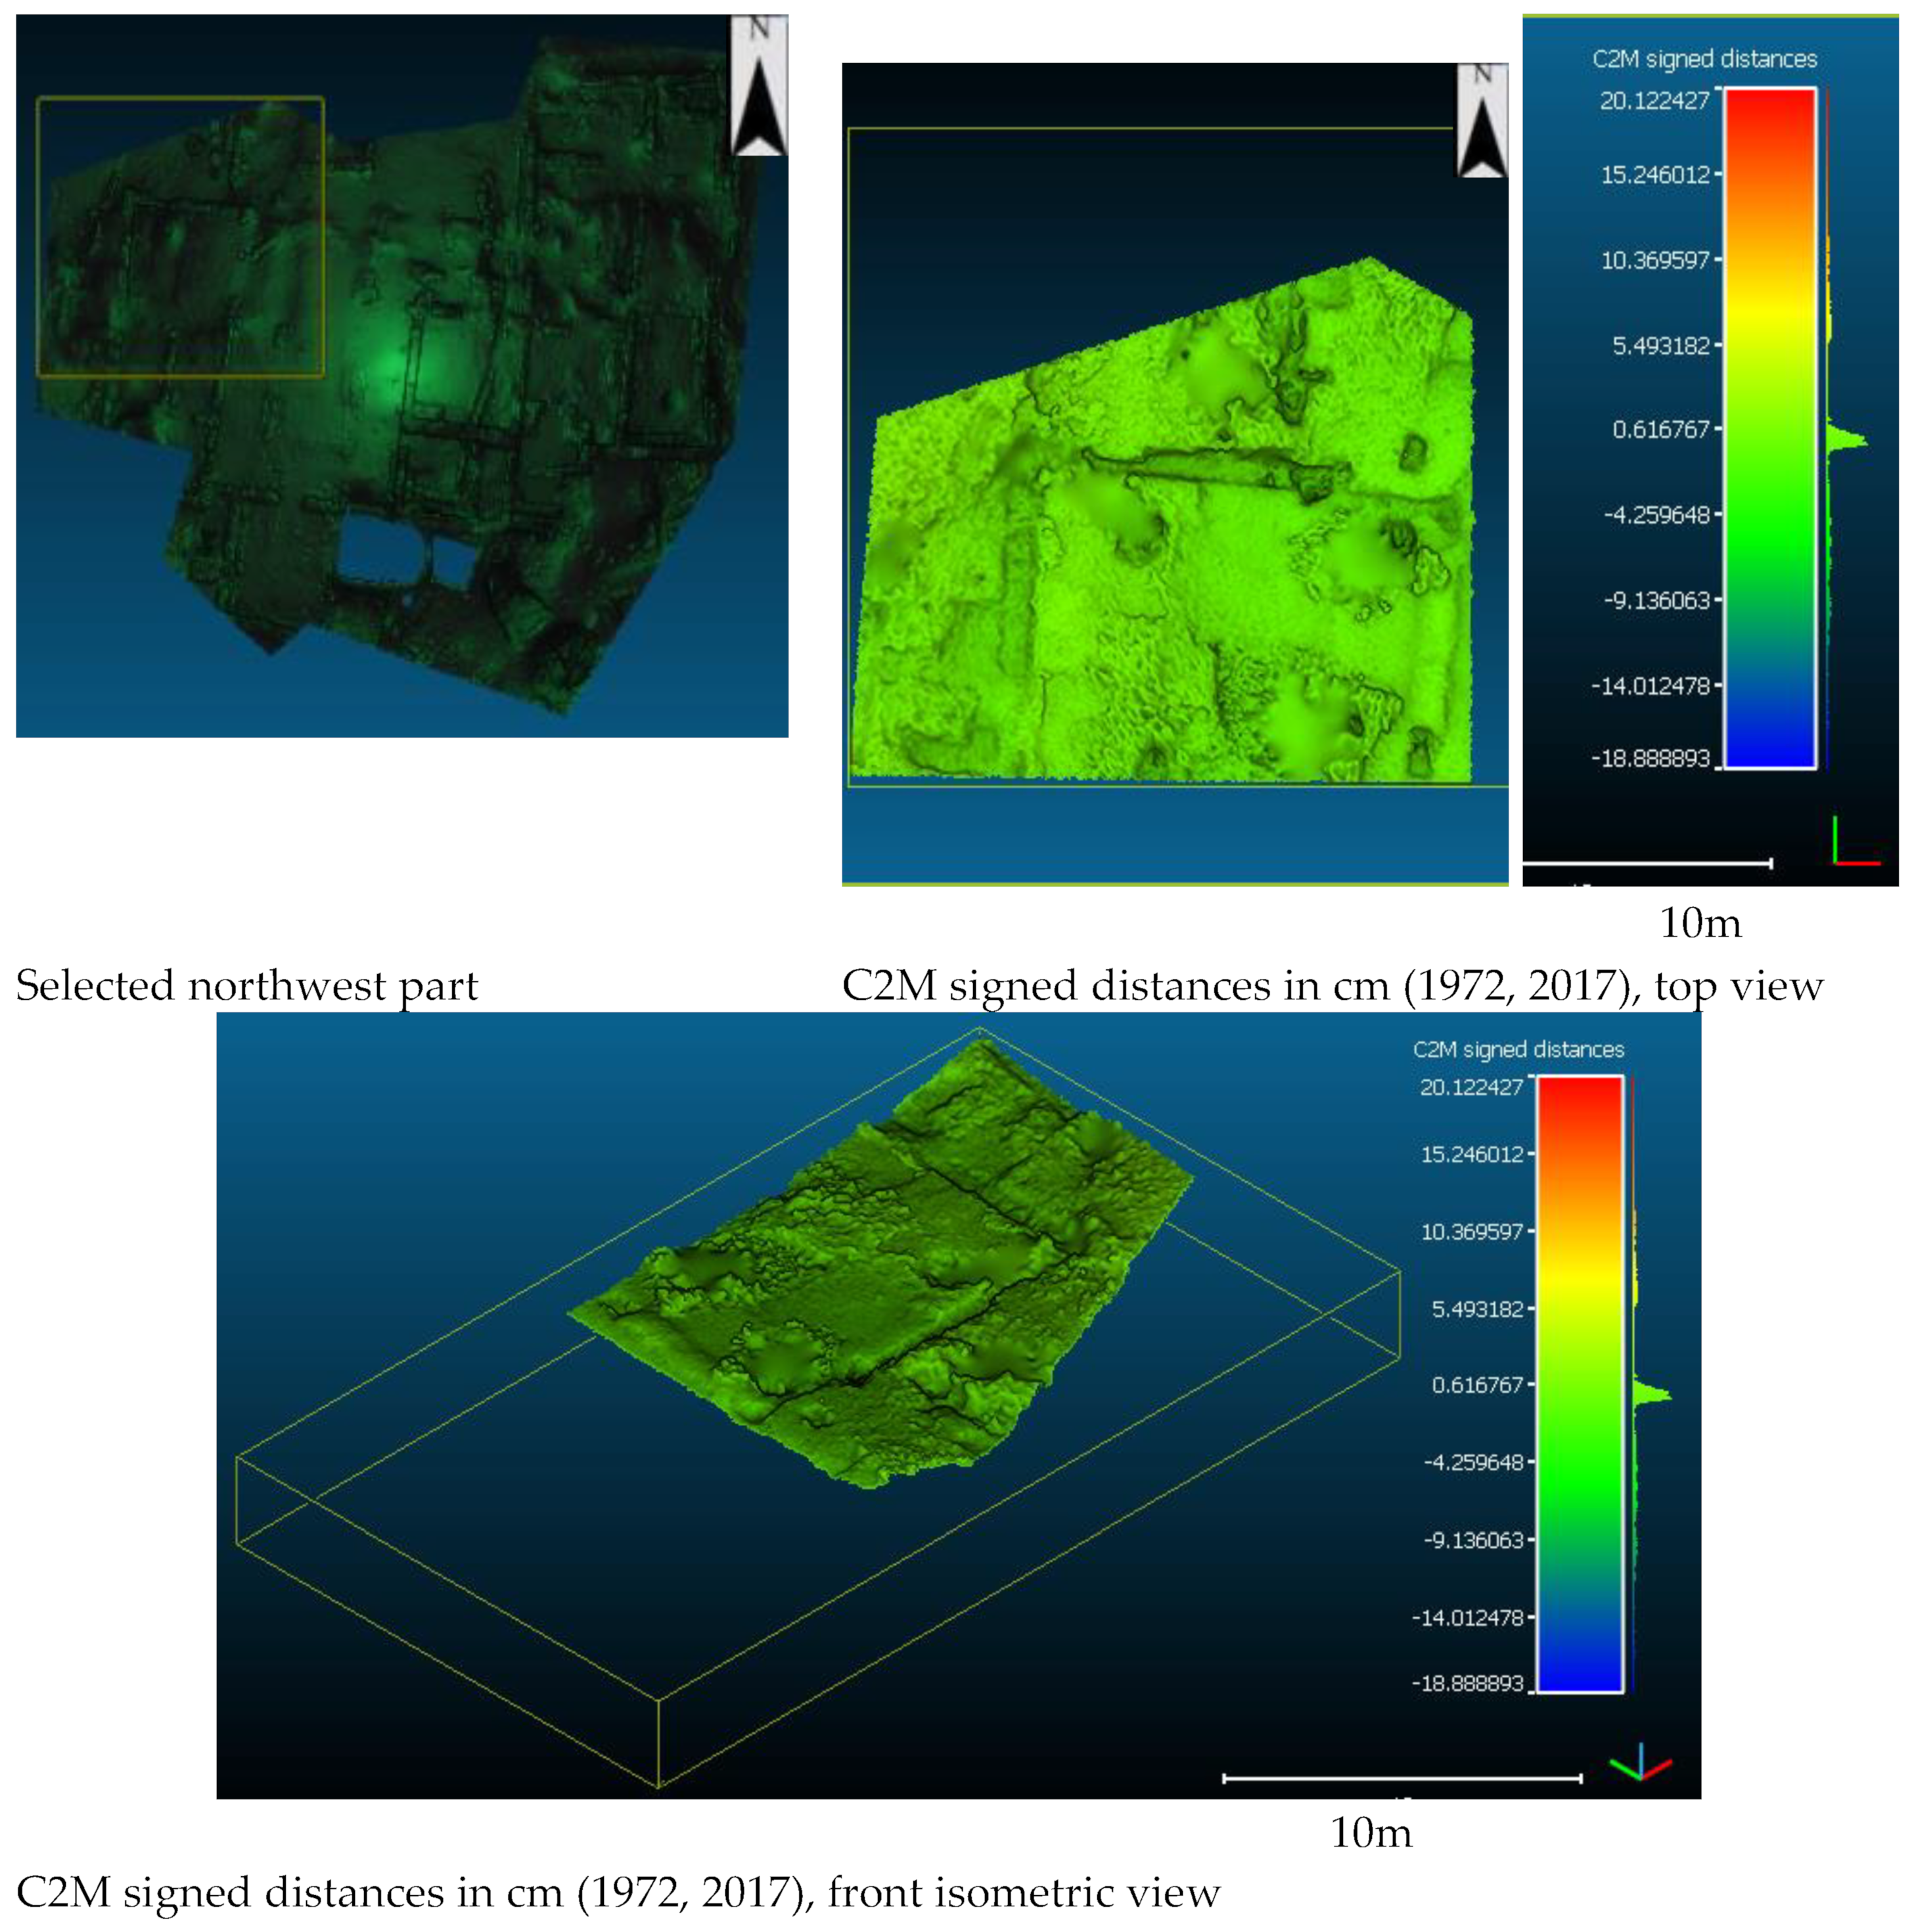
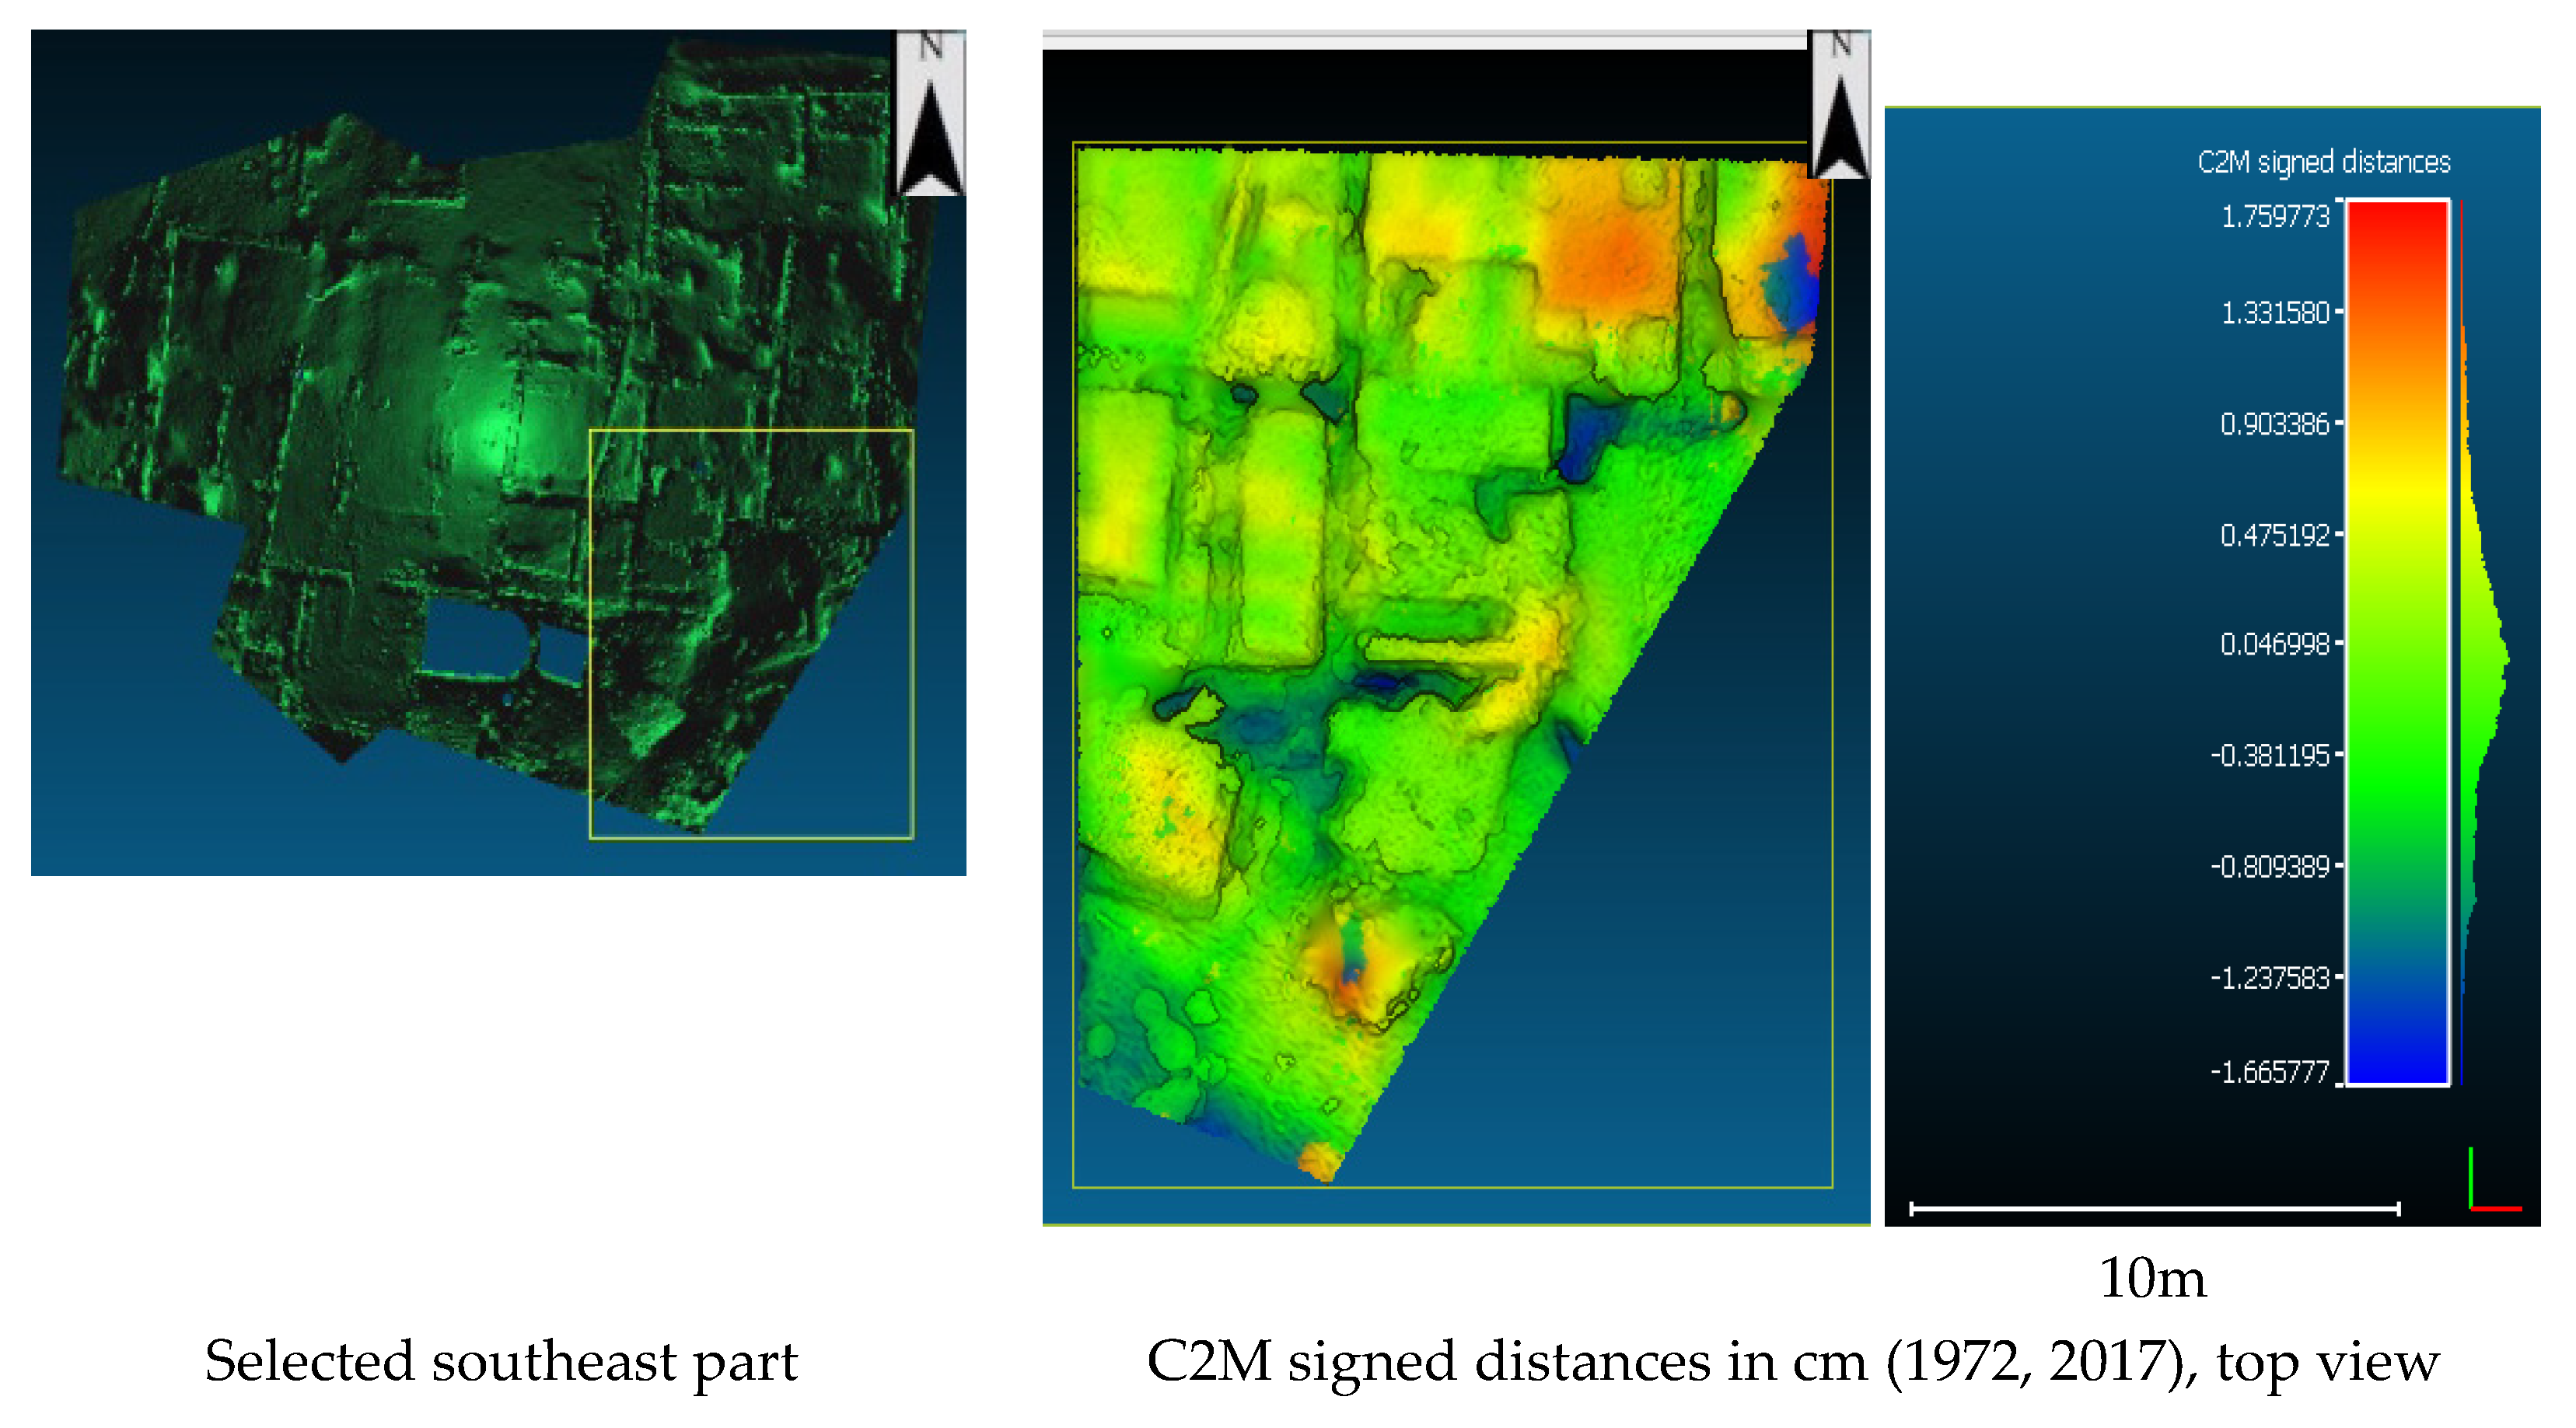
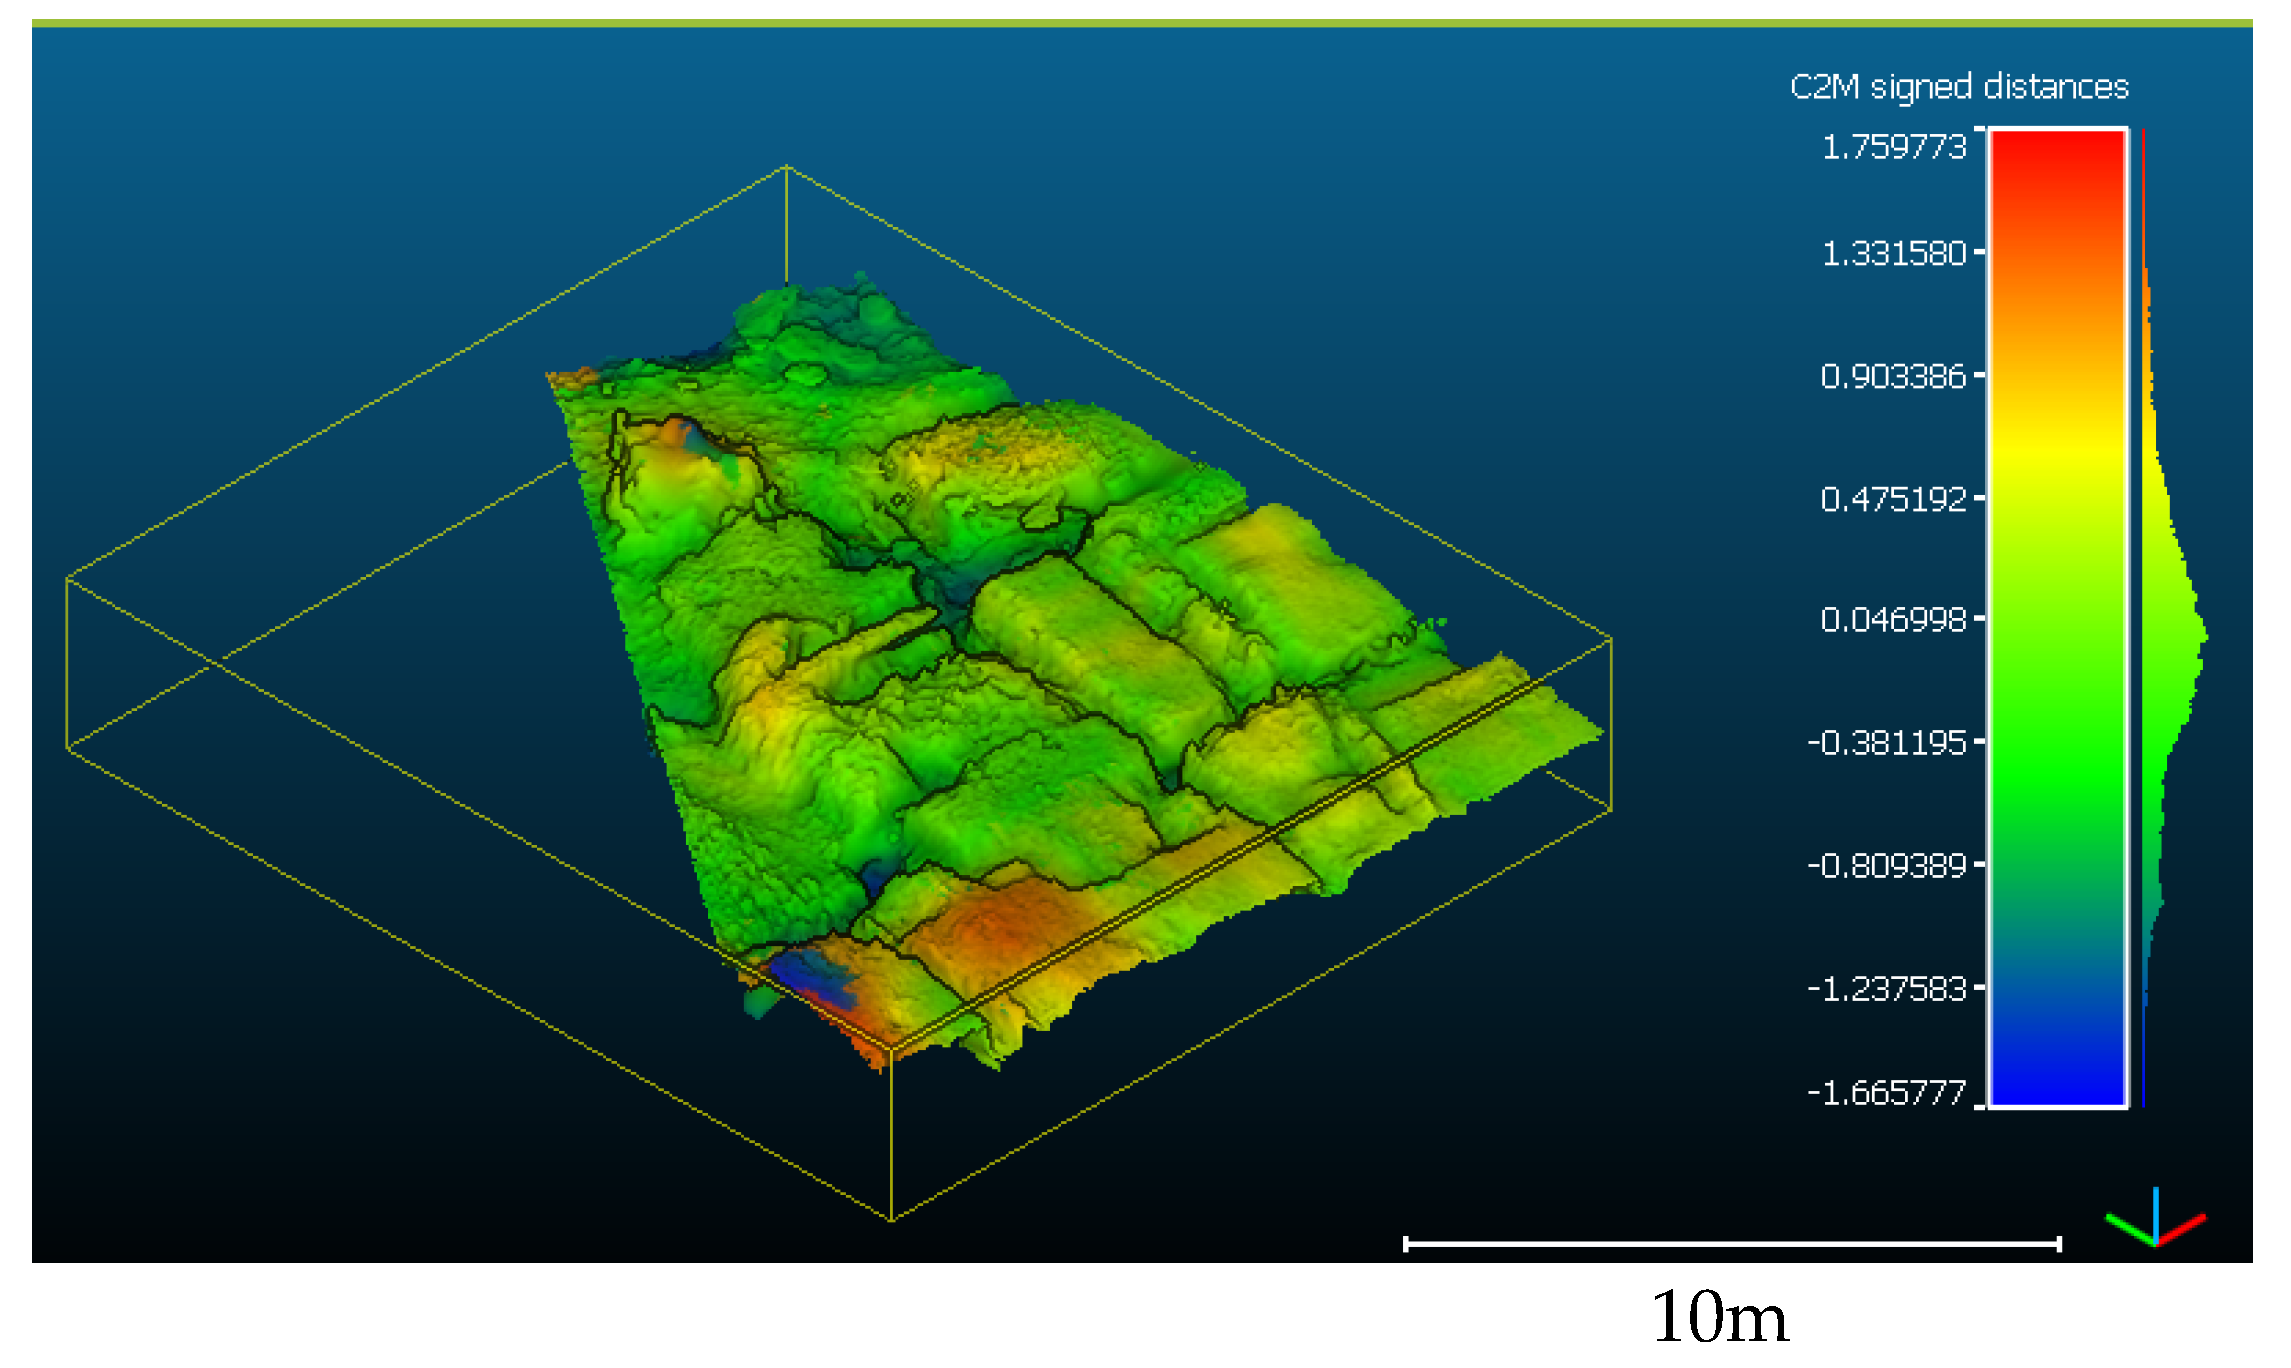
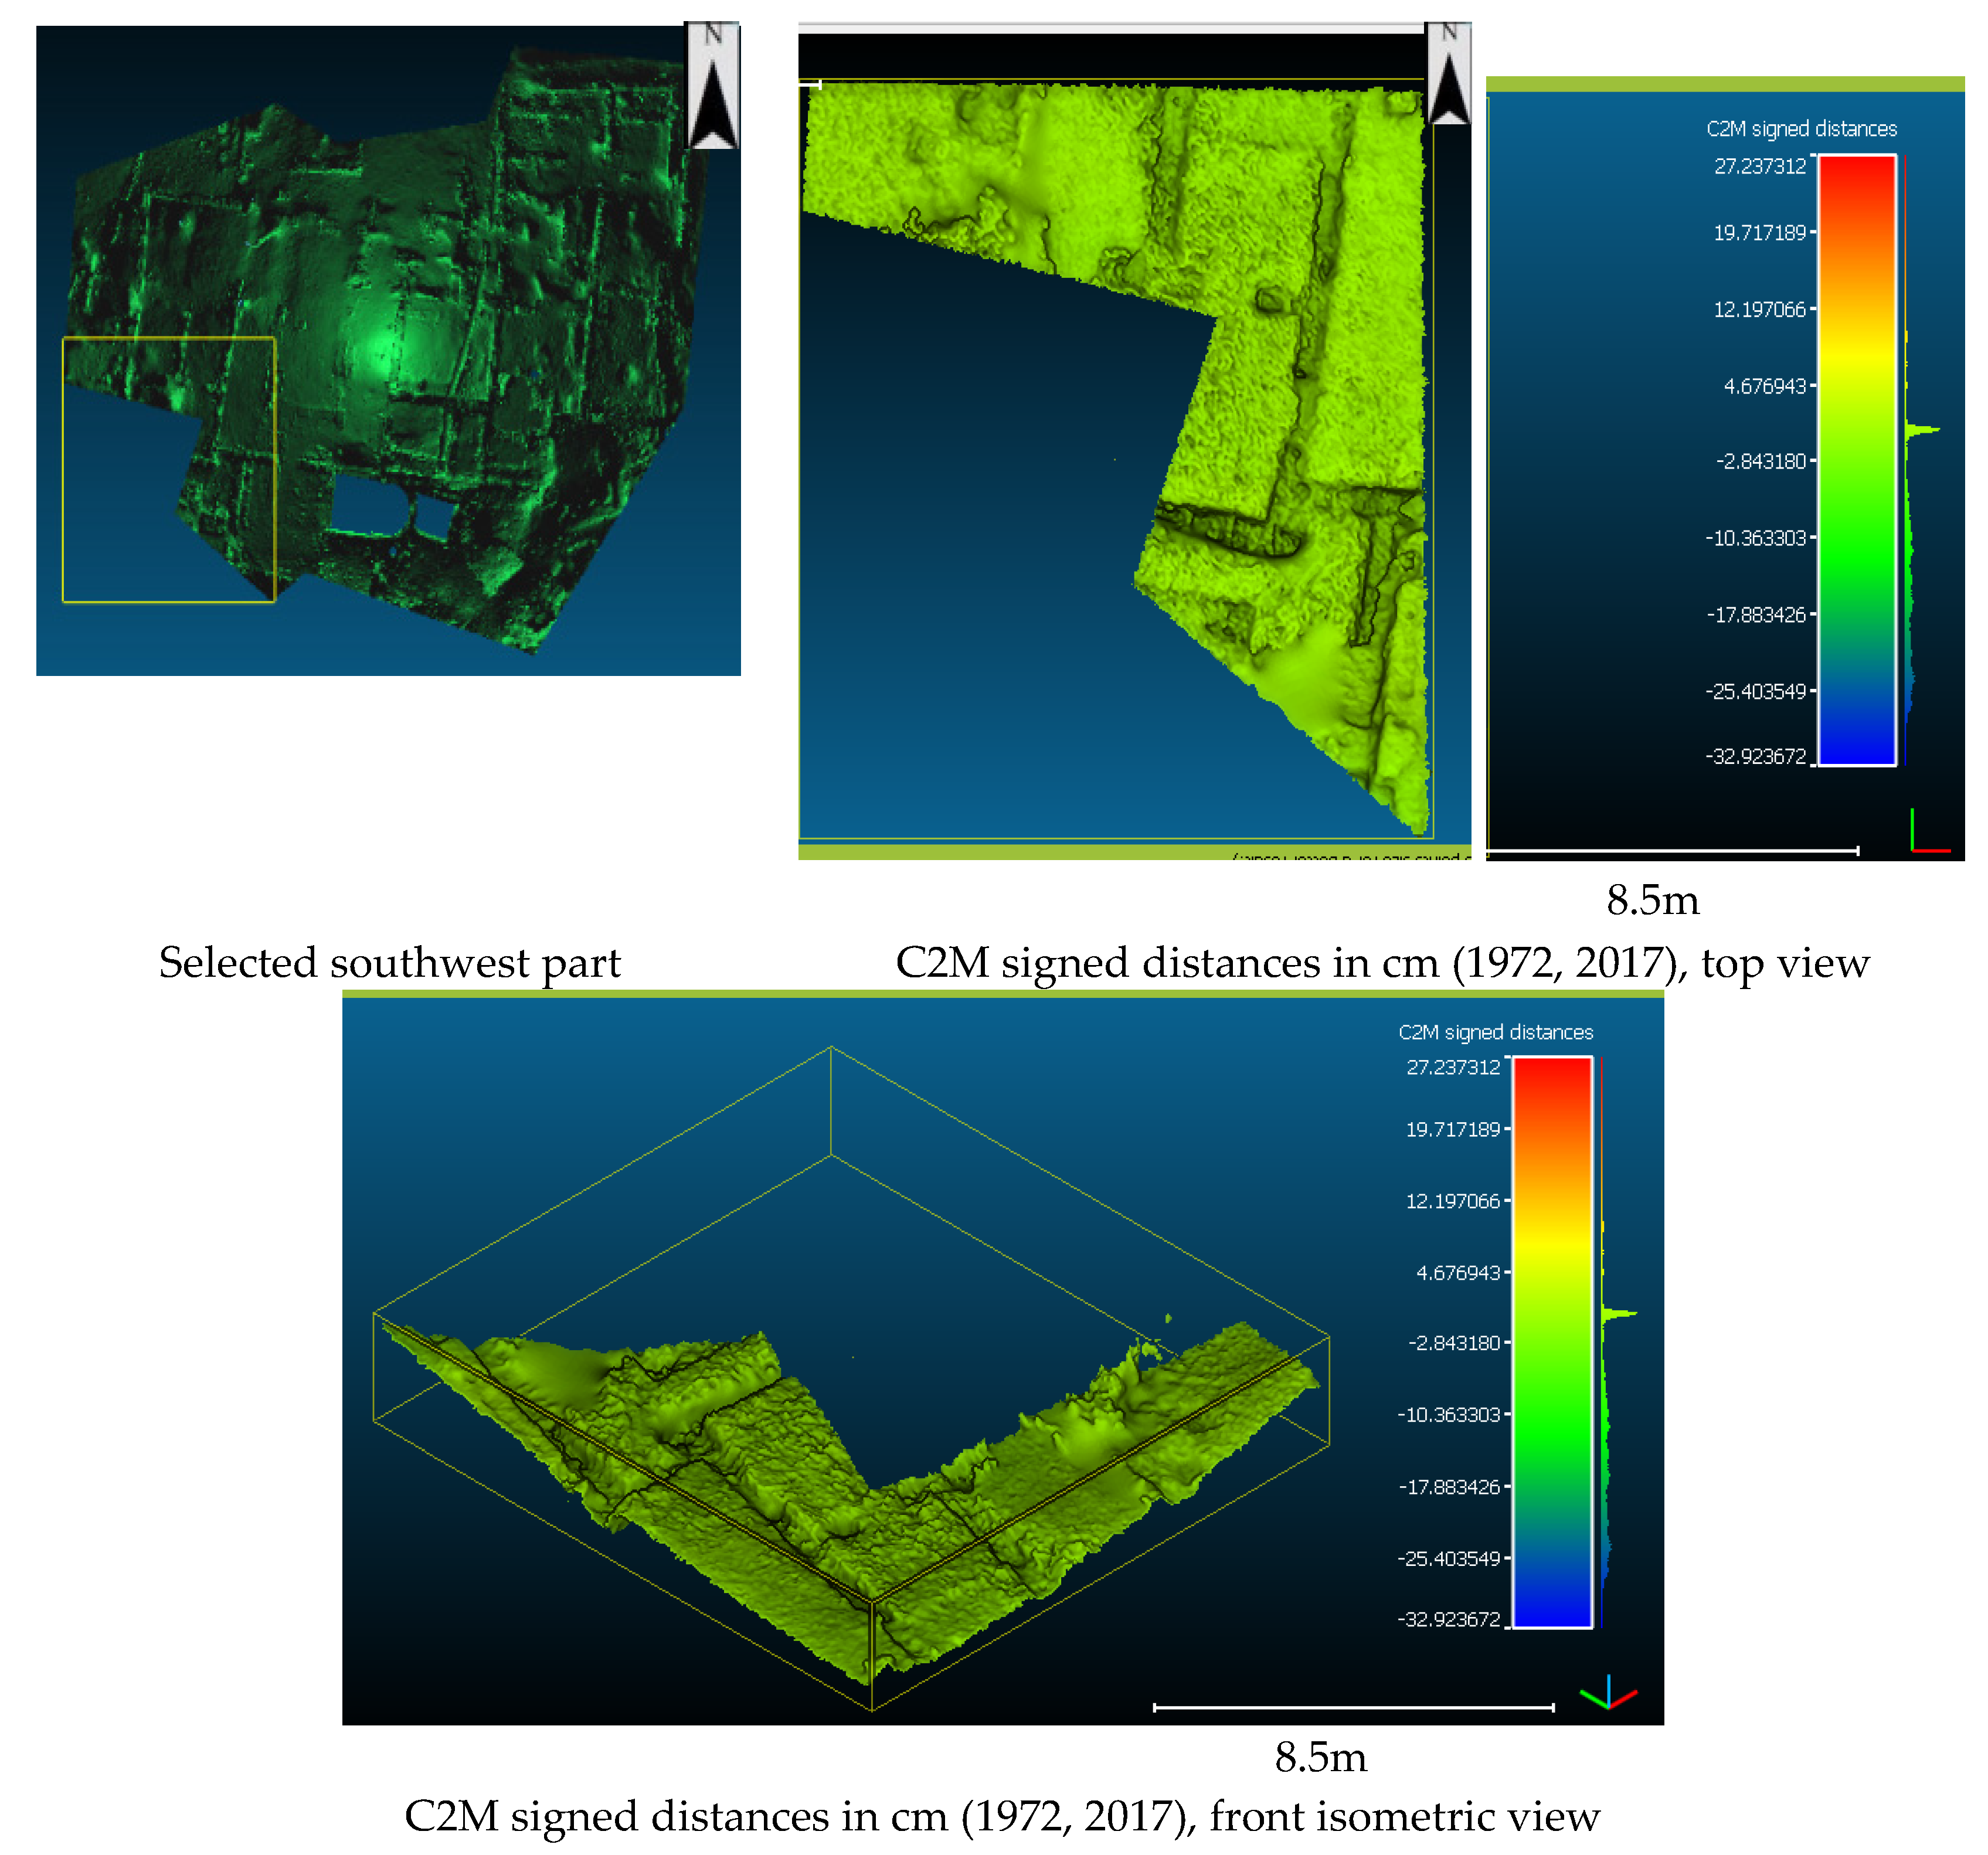
4.2. Distance Computation

Quantitative comparison of the original 1972 and 2017 models also takes place by calculating distances among them. The C2M distances that have been calculated with reference tothe 2017 Omega House model are shown in Figure 18, Figure 19, Figure 20, Figure 21 and Figure 22. The vertices of the compared model from 1972 are considered, and the distances for each of them are computed relative to the reference model 2017. The distances are computed relatively to the reference model polygons. All points have their true distance computed. No threshold value of maximum distance is utilized for the calculations. The south and north, respectively, of the west parts of Omega House are shown in Figure 20 and Figure 22. There, the distances between the models’ present minimum variability but are not alike, so in the northwest part the distances lie in the range −9 cm to 5 cm. In the southwest part the distances lie in the range −17 cm to 5 cm. The central north part of Omega House is considered in Figure 19. The specific distances present variability from −1.83 cm to 0.9 cm, where most of them lie in the range −0.9 cm to 0.4 cm. The south and north, respectively, of the east part of Omega House are shownin Figure 18 and Figure 21, where the calculated distances present the greatest variability. In the northeast part, the disparity in distances ranges between −1.81 cm and 1.62 cm. In the southeast part, the distances are in the range of values −1.67 cm to 1.76 cm. Overall, the south and northeast parts of the two models present the smallest variances, while the calculated distances are also small in the case of the central north part. Greater differences appear in the northwest part. The greatest differences in measurement distances have been calculated at the southwest part of the monument.
Figure 23 illustrates a map with the overlap of available photographs in the 1972 archival data. As stated, the central south portions of the modeling represent the least disparity between old and new models, which becomes clear when we look at the amount of camera overlap in this region. The east and northeast have the least overlap in historical photographs and result in a greater disparity in measurements between the two sets of models.

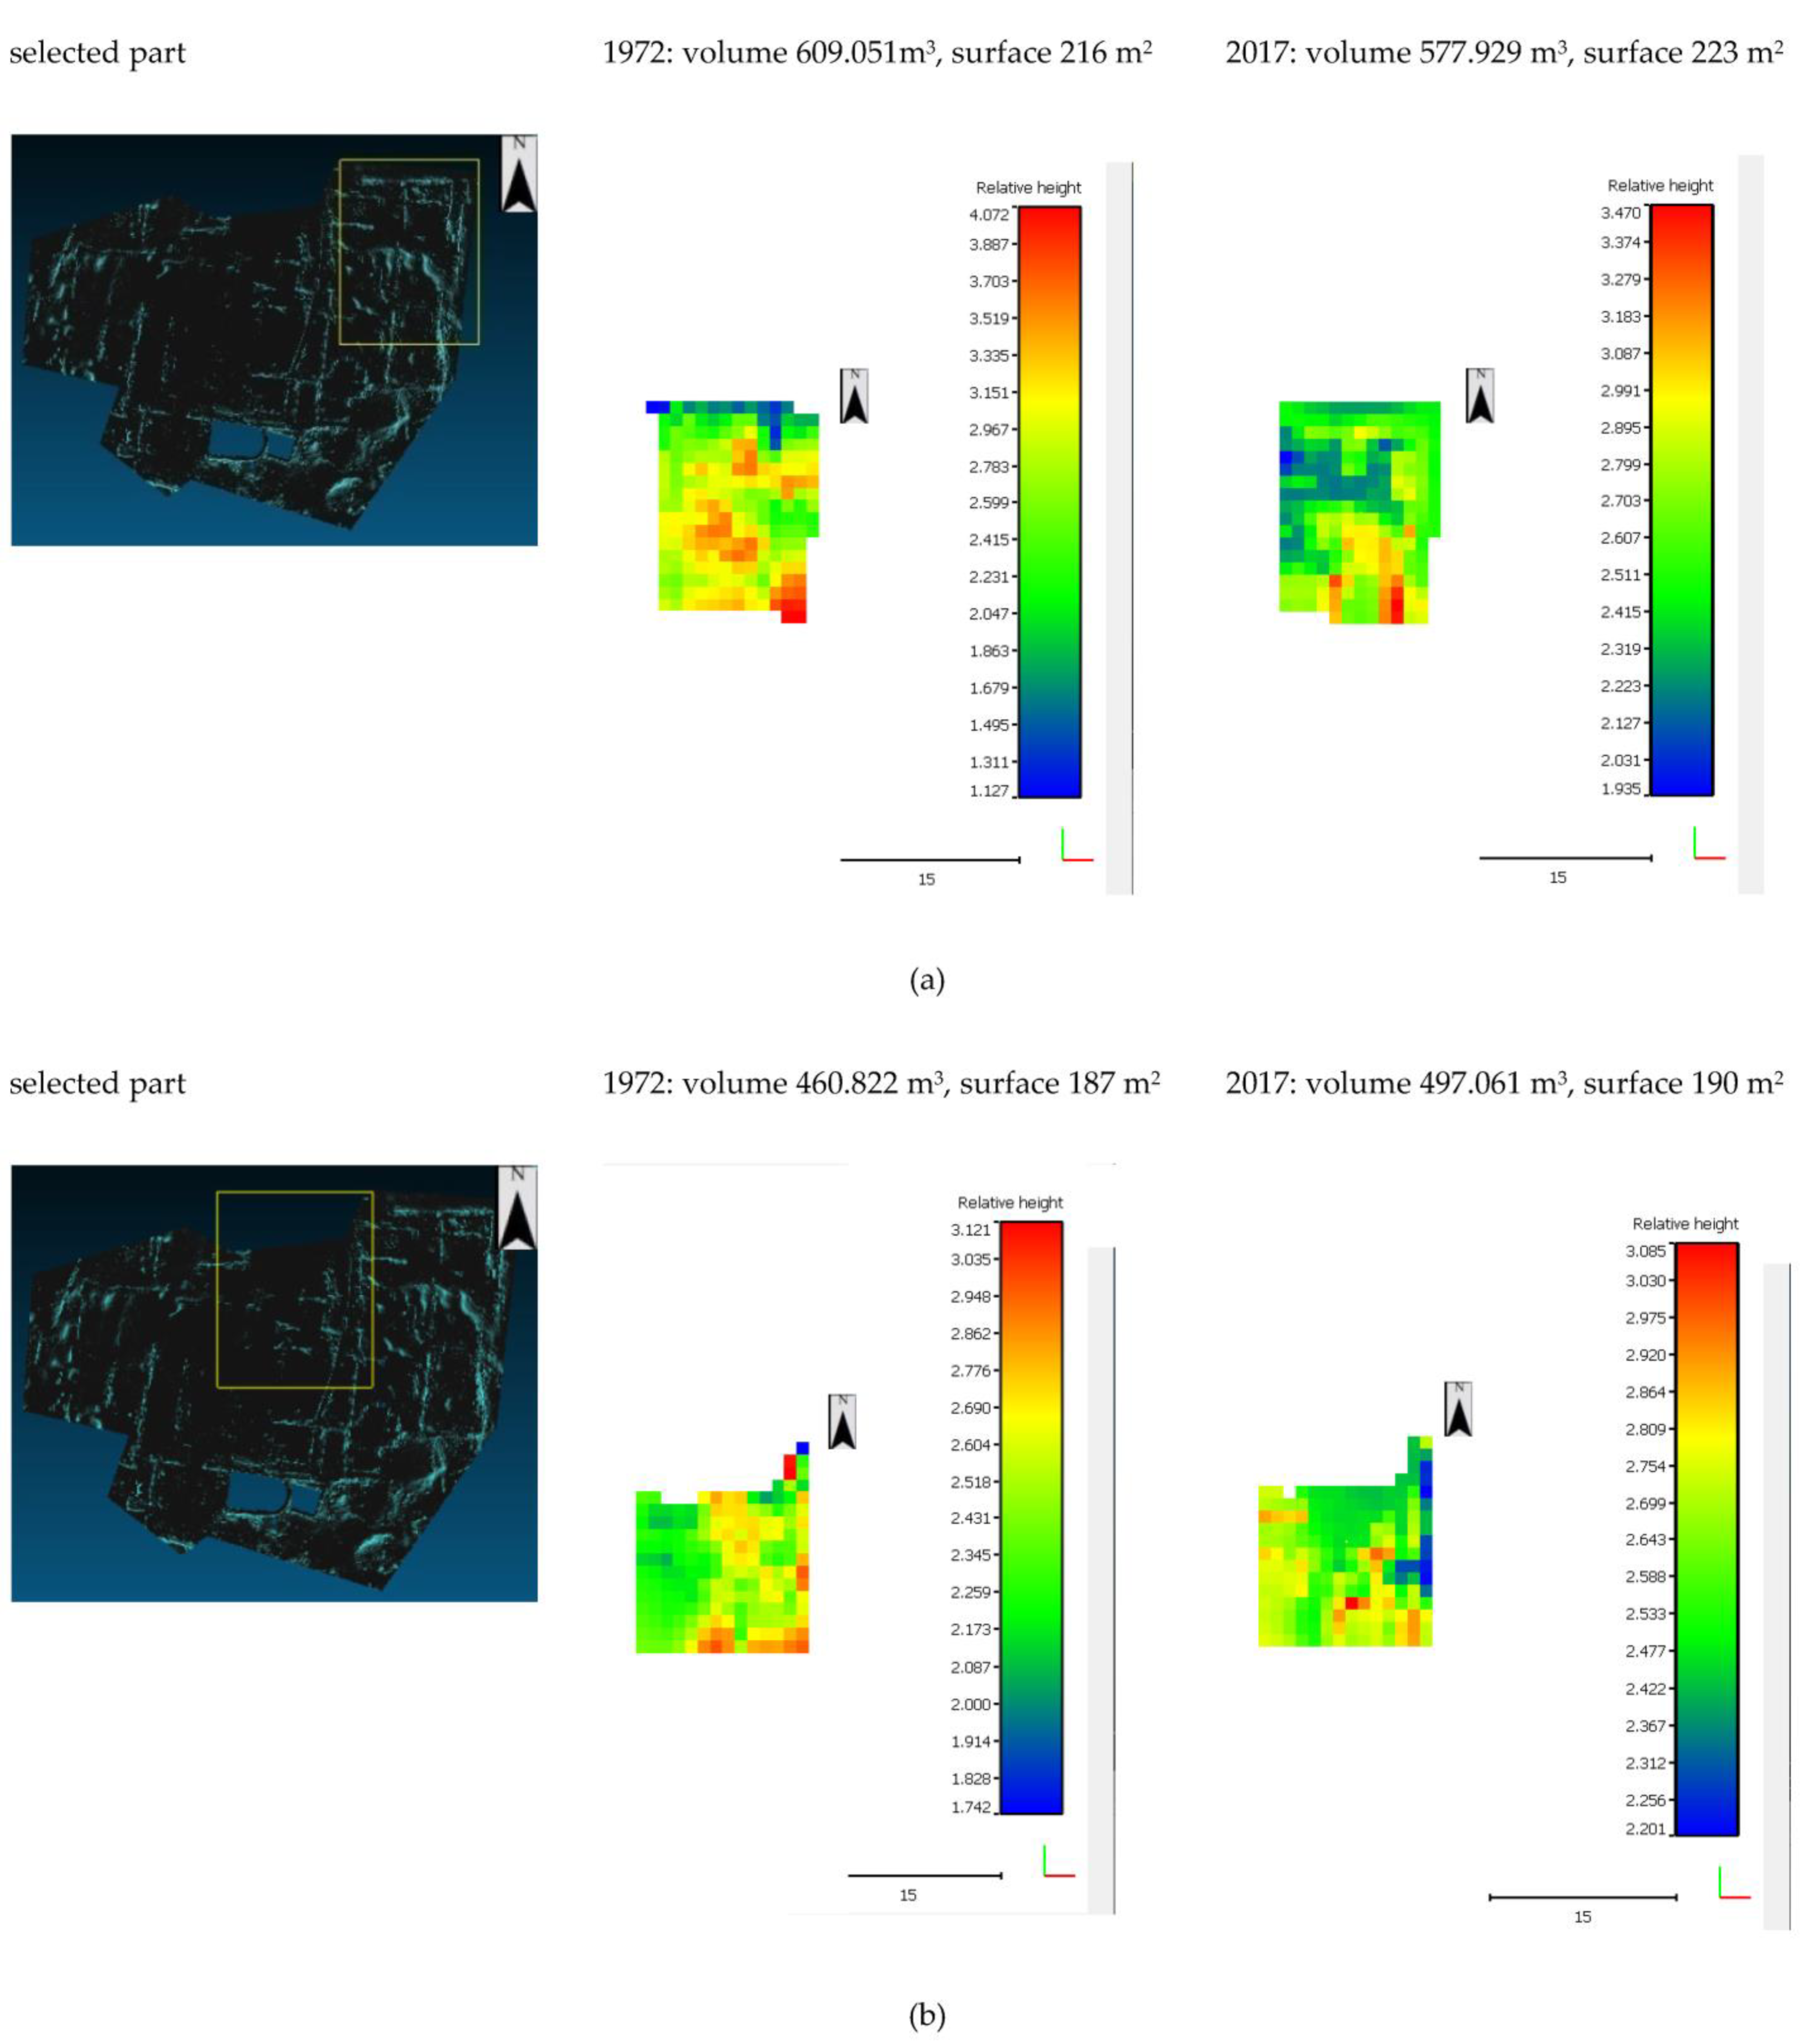
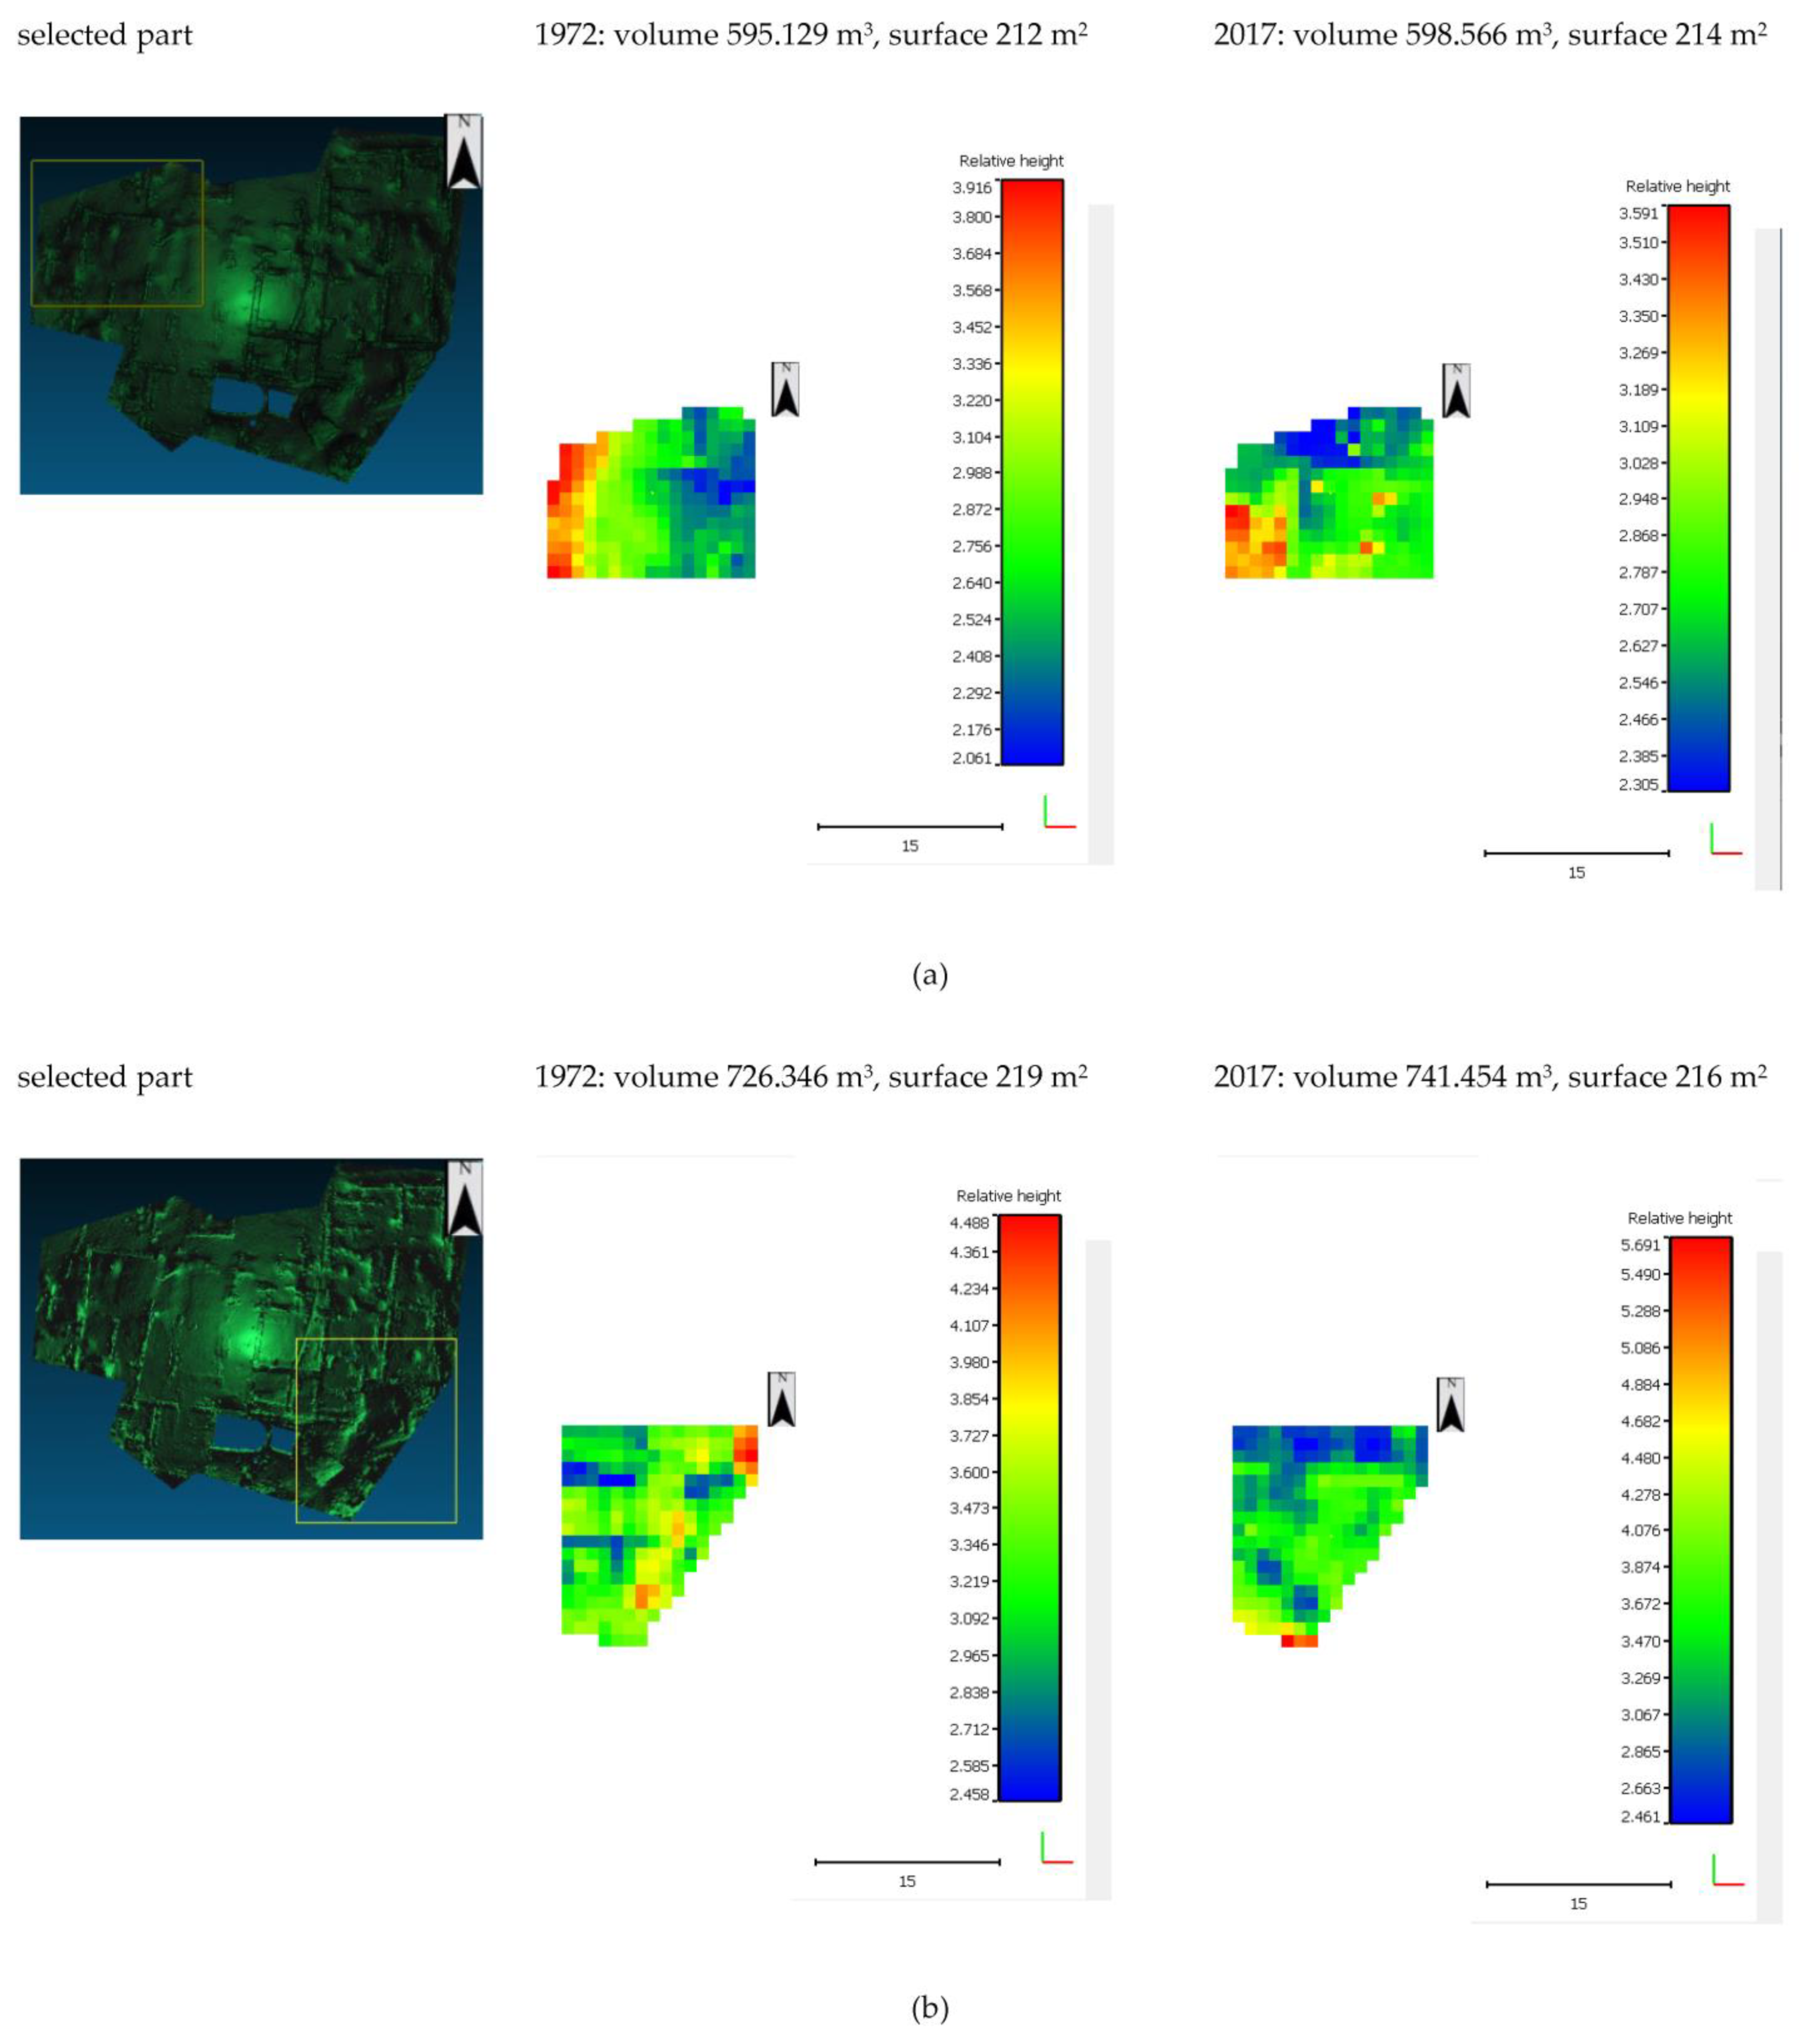
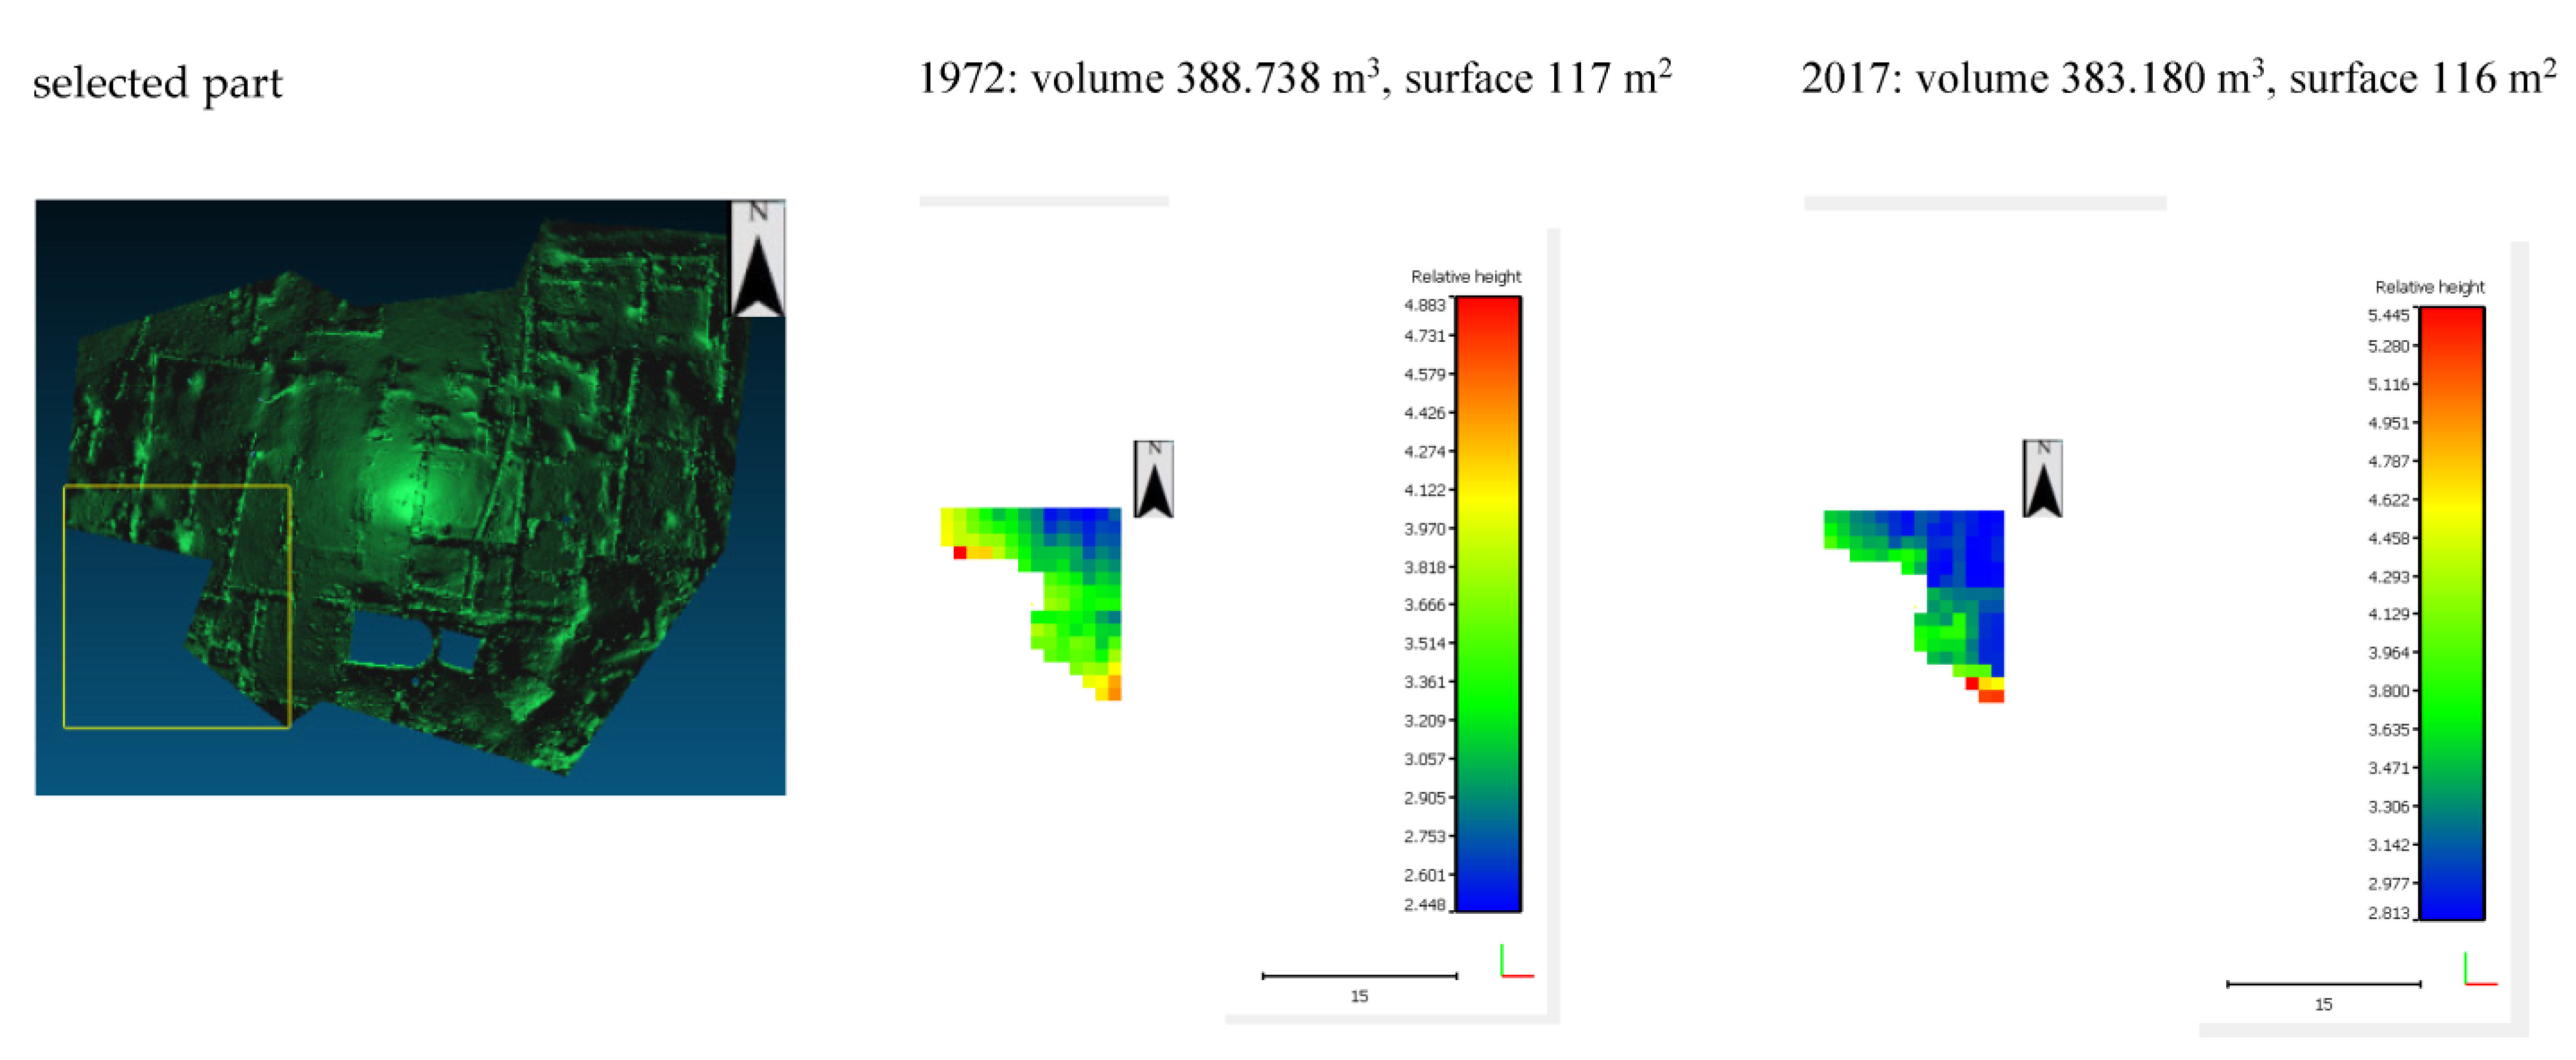
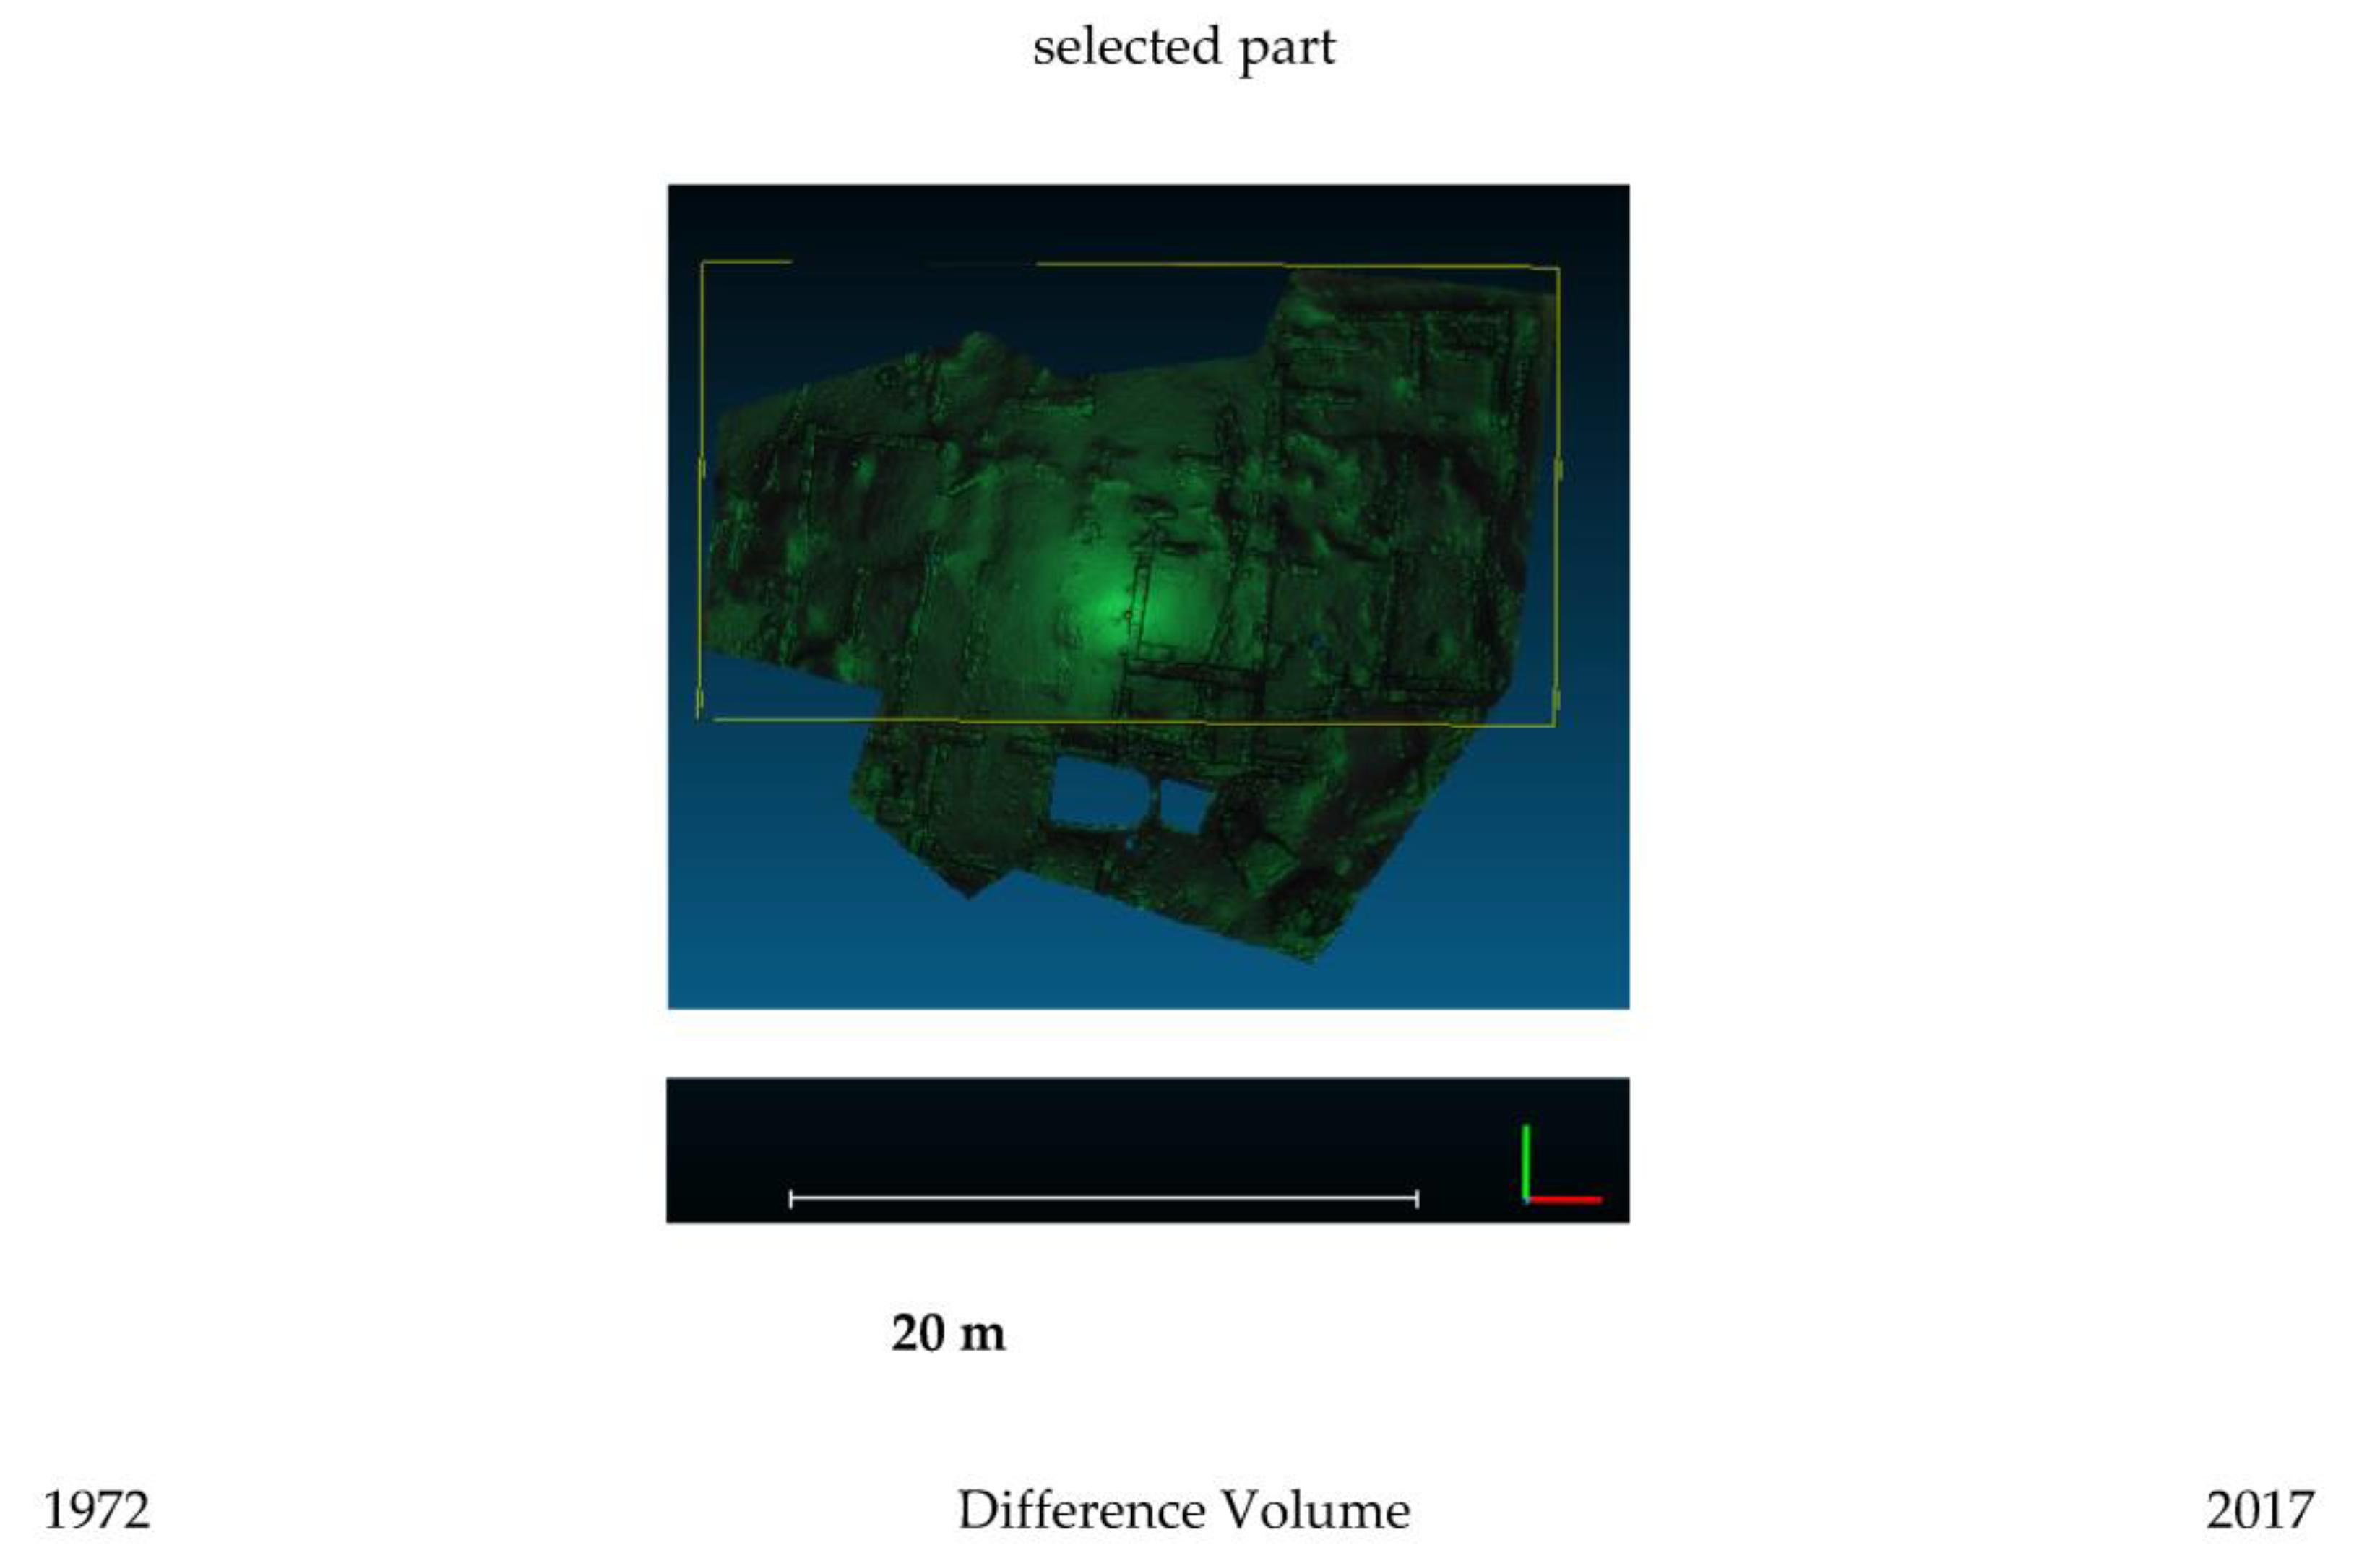
4.3. Volume Calculation

Regarding quantitative comparison, the volume of the two 3D models, old and new ones, has been also calculated. The surface and volume calculation for the different parts of the model are presented in Figure 24, Figure 25 and Figure 26. Apart from the numerical values of surface and volume, there is also shown the relative height throughout the monument in the 2017 and in the 1972 models. The northeast part of the model is shown in Figure 24a. In the 2017 model the volume has decreased per 5.11%. The relative height of the model part is also shown. The central north part of Omega House is represented in Figure 24b. Here, the volume in the 2017 model has increased per 7.86%. The northwest part of the model, where the volume in 2017 has slightly increased per 0.58%, is examined in Figure 25a. Regarding the southeast part of the monument, Figure 25b, the volume in 2017 has increased per 2.1%. As far as the southwest part of the monument is concerned, Figure 26, the 2017 model, presents decreased volume per 1.43%. Thereafter, the volume has almost not changed in the northwest part of the model. In the central north and southeast parts of the model the volume in 2017 has increased, where in the central north part the greatest increase is observed. Concerning the southwest part, the 2017 model presents slightly decreased volume, while the northeast part gives more decreased volume than the southwest part. Regarding the selected Omega House part that is shown in Figure 27, the model of 2017 presents decreased volume per 15.11% in comparison with the 1972 model.

4.4. Overall Assessment

It is proven that the overall state of Omega House monument has been preserved from 1972 to 2017, apart from certain exceptions that are highlighted as follows: The central north part of the monument in the model 2017 presents increased volume per 7.86% in comparison with the model 1972. The northeast part of the monument in the model 2017 shows decreased volume per 5.11% when compared to the model 1972. Moreover, the calculated distances between the two models 1972 and 2017 present the greatest values in the case of the southwest and northwest parts of the monument, lying in the range −17 cm to 5 cm. In fact, this comparison can contribute to the evaluation of what sort of deterioration occurs by natural processes over 45 years. Table 4 and Table 5 give a summary of the comparison results. From an archaeological point of view, the observed transformations could be due to material decay, debris and terrain variations during the time of intercomparison, and additionally, during cleanup of the site collapse debris may have been removed. Some walls show significant loss of material.

5. Discussion

The contemporary 2017 model of the Omega House is a composite of several individual models [7]. After the qualitative and quantitative comparisons and calculations that are carried out, it is assessed that the 1972 model is a valuable precursor of the 2017 model. In addition, it should be consideredthat human intervention, vegetation, erosion and subsidence might also have contributed to the calculated distance and volume differences between the two models of the Omega House during the time period of 45 years.
While it has been shown that at the extremities of a site there is a predictable reduction in overlapping photographs in the archival records, we can take comfort in the fact that the most interesting and important features of sites did receive greater attention, resulting in more accurate modeling when compared to contemporary modeling. The quantitative variation between the core areas of the two models is minimal, and an encouraging factor for future comparative studies of aging archaeological sites.
Within an archaeological context of a site this size and given the variations in the terrain over time noted in this paper, the comparative measurements of the two models are more than acceptable for their purposes. Our results confirm that retrospective photogrammetry proves to be an excellent tool for documentation, conservation, and restoration as well as monitoring site degradation over time. This kind of evidence can be used to encourage early site preservation, advise on the need to backfill, and require preservation and maintenance of sites as a fundamental requirement of excavation.
Legacy data, sitting latent in archives for decades, has the opportunity with new methodologies to contribute to the ongoing study and preservation of archaeological sites and monuments. It allows us to analyze not only how excavations were done, but also the condition that they were in at that time and compare to current conditions. It can show us flaws in the original recording of data, as well as using that data to resurrect sites and demonstrate the vital importance of preservation and restoration if we want these antiquities to continue to contribute to the understanding of our past.
The comparison that is carried out in the current work elaborates on legacy data usefulness and utility for monitoring the Omega House condition. The type of investigation proposed in this work proves that the legacy data role in archaeology can be strengthened through comparison, and particularly through change detection techniques. Indeed, archaeologists should apply automated change detection on legacy data and present-day 3D models.

6. Conclusions

In this work the retrospective 1972 model and the contemporary 2017 model of the Omega House at the Athenian Agora are compared to assess the monument’s changes during the time interval of 45 years. Overall, the state of the monument is shown to have been preserved from 1972 to 2017, except for certain differences thatare noted in the preceding sections. The southwest and northwest parts of Omega House present the greatest differences in distance between the two models from 1972 and 2017, where the latter lie in the range −17 cm to 5cm. The vertices of the compared model 1972 are considered, and the distances for each of them are computed relative to the reference model 2017. The distances are computed relative to the reference model polygons. Regarding the volume of the monument, it has remained unchanged in the northwest part. The central north part of the monument in 2017 presents increased volume per 7.86%. The northeast part shows decreased volume per 5.11%. No wells have been considered during the intercomparisons. In future work, flaws or inaccuracies of the 3D models are to be investigated further.
The archival resources of many archaeological sites are an untapped resource that has potential in many emerging interdisciplinary methods, including retrospective photogrammetry. This paper shows that retrospective photogrammetry is a viable method of extracting new information from archaeological sites with minimal inaccuracies when compared to contemporary modeling. To be able to observe in retrospect what kinds of deterioration have happened, as well as how this could have been prevented, is essential in our ongoing efforts to conserve our mutual cultural heritage and develop new strategies for future archaeological excavations to prevent or reduce such deterioration.

Author Contributions

Conceptualization, A.P., C.A.B.W., L.R. and D.M.; Data curation, A.P., C.A.B.W., L.R. and D.M.; Formal analysis, A.P., C.A.B.W., L.R. and D.M.; Investigation, A.P., C.A.B.W., L.R. and D.M.; Methodology, A.P., C.A.B.W., L.R. and D.M.; Software, A.P., C.A.B.W., L.R. and D.M.; Validation, A.P., C.A.B.W., L.R. and D.M.; Visualization, A.P., C.A.B.W., L.R. and D.M.; Writing—original draft, A.P., C.A.B.W., L.R. and D.M. All authors have read and agreed to the published version of the manuscript.

Funding

This research received no external funding.

Data Availability Statement

The data presented in this study are available on request from the corresponding author. The data are not publicly available due to privacy restrictions.

Conflicts of Interest

The authors declare no conflict of interest.

References

  1. Fatorić, S.; Seekamp, E. Are Cultural Heritage and Resources Threatened by Climate Change? A Systematic Literature Review. Clim. Change 2017, 142, 227–254. [Google Scholar] [CrossRef]
  2. Hamilton, R.; Kucera, V.; Tidblad, J.; Watt, J. (Eds.) The Effects of Air Pollution on Cultural Heritage; Springer: New York, NY, USA, 2009. [Google Scholar]
  3. Lemos, V.J. Discrete Element Modeling of Masonry Structures. Int. J. Archit. Herit. 2007, 1, 190–213. [Google Scholar] [CrossRef]
  4. Moropoulou, A.; Labropoulos, K.C.; Delegou, E.T.; Karoglou, M.; Bakolas, A. A Non-destructive Techniques as a Tool for the Protection of Built Cultural Heritage. Constr. Build. Mater. 2013, 48, 1222–1239. [Google Scholar] [CrossRef]
  5. Abate, D. Built-Heritage Multi-temporal Monitoring through Photogrammetry and 2D/3D Change Detection Algorithms. Stud. Conserv. 2018, 64, 423–434. [Google Scholar] [CrossRef]
  6. Wallace, C.O.L.I.N.; Dedík, L.; Minaroviech, J.; Moullou, D. 3D Modeling and Virtual Access of Omega House in the Athenian Agora. In Proceedings of the 22nd International Conference on Cultural Heritage and New Technologies, Vienna, Austria, 10–12 November 2017. [Google Scholar]
  7. Wallace, C. Retrospective Photogrammetry in Greek Archaeology. Stud. Digit. Herit. 2017, 1, 607–626. [Google Scholar] [CrossRef]
  8. Falkingham, P.L.; Bates, K.T.; Farlow, J.O. Historical Photogrammetry: Bird’s Paluxy River Dinosaur Chase Sequence Digitally Reconstructed as It Was prior to Excavation 70 Years Ago. PLoS ONE 2014, 9, e93247. [Google Scholar] [CrossRef]
  9. Discamps, E.; Muth, X.; Gravina, B.; Lacrampe-Cuyaubère, F.; Chadelle, J.-P.; Faivre, J.-P.; Maureille, B. Photogrammetry as a tool for integrating archival data in archaeological fieldwork: Examples from the Middle palaeolithic sites of Combe-Grenal, Le Moustier, and Regourdou. J. Archaeol. Sci. Rep. 2016, 8, 268–276. [Google Scholar] [CrossRef]
  10. Peppa, M.V.; Mills, J.; Fieber, K.D.; Haynes, I.; Turner, S.; Turner, A.; Douglas, M.; Bryan, P.G. Archaeological Feature Detection from Archive Aerial Photography with a SfM-MVS Image Enhancement Pipeline. Int. Arch. Photogramm. Remote Sens. Spat. Inf. Sci. 2018, XLII-2, 869–875. [Google Scholar] [CrossRef]
  11. Bernstein, G.; Fussel, D. Fast, exact, linear Booleans. In Proceedings of the Eurographics Symposium on Geometry Processing, Berlin, Germany, 15–17 July 2009. [Google Scholar]
  12. Campen, M.; Kobbelt, L. Exact and robust (self-)intersections for polygonal meshes. Comput. Graph. Forum 2010, 29, 397–406. [Google Scholar] [CrossRef]
  13. Nehring-Wirxel, J.; Trettner, P.; Kobbelt, L. Fast exact Booleans for iterated CSG using octree-embedded BSPs. Comput. Aided Des. 2021, 135, 103015. [Google Scholar] [CrossRef]
  14. De Araújo, B.R.; Lopes, D.S.; Jepp, P.; Jorge, J.A.; Wyvill, B. A survey on implicit surface polygonization. ACM Comput. Surv. 2015, 47, 1–39. [Google Scholar] [CrossRef]
  15. Trettner, P.; Kobbelt, L. Sampling from Quadric-Based CSG Surfaces. Comput. Graph. Forum 2021, 40, 41–56. [Google Scholar] [CrossRef]
  16. Chen, Z.; Tagliasacchi, A.; Zhang, H. Learning Mesh Representations via Binary Space Partitioning Tree Networks. IEEE Trans. Pattern Anal. Mach. Intell. 2021, 6, 1. [Google Scholar] [CrossRef]
  17. Abate, D. Documentation of paintings restoration through photogrammetry and change detection algorithms. Herit. Sci. 2019, 7, 7–13. [Google Scholar] [CrossRef]
  18. Lercari, N. Monitoring earthen archaeological heritage using multi-temporal terrestrial laser scanning and surface change detection. J. Cult. Herit. 2019, 39, 152–165. [Google Scholar] [CrossRef]
  19. Dawson, P.; Brink, J.; Farrokhi, A.; Jia, F.; Lichti, D. A method for detecting and monitoring changes to the Okotoks Erratic-“Big Rock” provincial historic site. J. Cult. Heritage Manag. Sustain. Dev 2022. ahead-of-print. [Google Scholar] [CrossRef]
  20. Khelifi, A.; Ciccone, G.; Altaweel, M.; Basmaji, T.; Ghazal, M. Autonomous service drones for multimodal detection and monitoring of archaeological sites. Appl. Sci. 2021, 11, 10424. [Google Scholar] [CrossRef]
  21. Dobos, J.; Steed, A. 3D Diff: An interactive approach to mesh differencing and conflict resolution. In Proceedings of the SIGRAPH ASIA 2012, Singapore, 28 Nonember–1 December 2012. [Google Scholar]
  22. Palazzolo, E.; Stachniss, C. Fast Image-Based Geometric Change Detection Given a 3D Model. In Proceedings of the IEEE International Conference on Robotics and Automation, Brisbane, Australia, 21–25 May 2018. [Google Scholar] [CrossRef]
  23. Rossi, P.; Castagnetti, C.; Capra, A.; Brooks, A.J.; Mancini, F. Detecting change in coral reef 3D structure using underwater photogrammetry: Critical issues and performance metrics. Appl. Geomat. 2020, 12, S3–S17. [Google Scholar] [CrossRef]
  24. Dahle, F.; Ohori, K.A.; Agugiaro, G.; Briels, S. Automatic change detection of digital maps using aerial images and point clouds. In Proceedings of the ISPRS Congress 2021, Nice, France, 4–10 July 2021. [Google Scholar] [CrossRef]
  25. Ragia, L.; Sarri, F.; Mania, K. Precise photorealistic visualization for restoration of historic buildings based on tacheometry data. J. Geogr. Syst. 2018, 20, 115–137. [Google Scholar] [CrossRef]
  26. Bacharidis, K.; Sarri, F.; Ragia, L. 3D building façade reconstruction using deep learning. ISPRS Int. J. Geo-Inf. 2020, 9, 322. [Google Scholar] [CrossRef]
  27. Nagy, B.; Kovacs, L.; Benedek, C. ChangeGAN: A deep network for change detection in coarsely registered point clouds. IEEE Robot. Autom. Lett. 2021, 6, 8277–8284. [Google Scholar] [CrossRef]
  28. Geospatial Positioning Accuracy Standards Part 3: National Standard for Spatial Data Accuracy. Available online: https://www.fgdc.gov/standards/projects/accuracy/part3/chapter3 (accessed on 7 January 2023).
  29. ASPRS Accuracy Standards for Digital Geospatial Data. Photogramm. Eng. Remote Sens. 2013, 12, 1073–1085.
  30. LINZ. Available online: https://www.linz.govt.nz/data/geodetic-system/geodetic-control-network-development-maintenance-and-protection/disturbed (accessed on 21 February 2022).
  31. Kaitantzian, A.; Loupasakis, C. Preliminary Investigation of the Land Subsidence Phenomena Occurring at the Industrial-Commersial Area of Eleonas, Athens, Greece. Bull. Geol. Soc. Greece 2017, 50, 1703–1710. [Google Scholar] [CrossRef]
  32. Cloud Compare: 3D Point Cloud and Mesh Processing Software. Available online: https://www.cloudcompare.org/ (accessed on 16 October 2022).
  33. Girardeau-Montaut, D.; Roux, M.; Marc, R.; Thibault, G. Change detection on points cloud data acquired with a ground laser scanner. In Proceedings of the ISPRS Workshop, Laser Scanning 2005, Enschede, The Netherlands, 12–14 September 2005. [Google Scholar]
  34. Cignoni, P.; Rocchini, C.; Scopigno, R. Metro: Measuring error on simplified surfaces. Comput. Graph. Forum 1998, 17, 167–174. [Google Scholar] [CrossRef] [Green Version]
Figure 1. Orthophotos of the 1972 (left) and 2017 (right) 3D models of the Omega House.
Heritage 06 00088 g001
Figure 2. The geographical location of the Omega House at the Athenian Agora, as it is provided by Google Maps.
Heritage 06 00088 g002
Figure 3. Omega House 1972 and 2017, 3D models in different views.
Heritage 06 00088 g003aHeritage 06 00088 g003b
Figure 4. The northeast part of Omega House 1972 and 2017, 3D models in different views.
Heritage 06 00088 g004aHeritage 06 00088 g004b
Figure 5. Schematic representation of the methodological approach.
Heritage 06 00088 g005
Figure 6. The 2016 photos.
Heritage 06 00088 g006
Figure 7. The 1972 photos.
Heritage 06 00088 g007
Figure 8. The Boolean operation difference 1972–2017 of Omega House 3D models in different views, regarding the selected northeast model parts.
Heritage 06 00088 g008aHeritage 06 00088 g008b
Figure 9. The Boolean operation intersection 1972∩2017 of Omega House 3D models in different views, regarding the selected central east model parts.
Heritage 06 00088 g009aHeritage 06 00088 g009b
Figure 10. The Boolean operation difference 1972–2017 of Omega House 3D models in front isometric view, regarding the selected central north model parts.
Heritage 06 00088 g010
Figure 11. The Boolean operation intersection 1972∩2017 of Omega House 3D models in front isometric view, regarding the selected central north model parts.
Heritage 06 00088 g011
Figure 12. The Boolean operation difference 1972–2017of Omega House 3D models in front isometric view, regarding the selected northwest model parts.
Heritage 06 00088 g012
Figure 13. The Boolean operation intersection 1972∩2017 of Omega House 3D models in front isometric view, regarding the selected northwest model parts.
Heritage 06 00088 g013
Figure 14. The Boolean operation difference 1972–2017of Omega House 3D models in front isometric view, regarding the selected southeast model parts.
Heritage 06 00088 g014
Figure 15. The Boolean operation intersection 1972∩2017of Omega House 3D models in front isometric view, regarding the selected southeast model parts.
Heritage 06 00088 g015
Figure 16. The Boolean operation difference 1972–2017of Omega House 3D models in front isometric view, regarding the selected southwest model parts.
Heritage 06 00088 g016
Figure 17. The Boolean operation intersection 1972∩2017 of Omega House 3D models in front isometric view, regarding the selected southwest model parts.
Heritage 06 00088 g017
Figure 18. The Cloud to Mesh distances, with reference to the model 2017, in different views regarding the selected northeast model part.
Heritage 06 00088 g018aHeritage 06 00088 g018b
Figure 19. The Cloud to Mesh distances, with reference to the model 2017, in different views regarding the selected central north model parts.
Heritage 06 00088 g019
Figure 20. The Cloud to Mesh distances, with reference to the model 2017, in different views regarding the selected northwest model parts.
Heritage 06 00088 g020
Figure 21. The Cloud to Mesh distances, with reference to the model 2017, in different views regarding the selected southeast model parts.
Heritage 06 00088 g021aHeritage 06 00088 g021b
Figure 22. The Cloud to Mesh distances, with reference to the model 2017, in different views regarding the selected southwest model parts.
Heritage 06 00088 g022
Figure 23. Map of camera overlap in 1972 modeling.
Heritage 06 00088 g023
Figure 24. Volume and surface calculation for the models of 1972 and 2017, concerning the selected (a) northeast and (b) central north model parts.
Heritage 06 00088 g024
Figure 25. Volume and surface calculation for the models of 1972 and 2017, concerning the selected (a) northwest and (b) southeast model parts.
Heritage 06 00088 g025
Figure 26. Volume and surface calculation for the models of 1972 and 2017, concerning the selected southwest model part.
Heritage 06 00088 g026
Figure 27. Difference volume and surface calculation for the models of 1972 and 2017, concerning the selected model part in the absence of wells.
Heritage 06 00088 g027aHeritage 06 00088 g027b
Table 1. Easting, Northing and Elevation residuals of model 1972 from model 2017.
Point IDΔΕ (m)ΔΝ (m)ΔH (m)
10.0440.239−1.862
20.4470.2281.246
3−0.077−0.011−0.793
40.785−0.0400.015
50.1640.5817.099
6−0.0530.0820.410
7−0.1730.1391.013
8−0.3450.2060.224
9−0.0470.0110.251
10−0.4950.0780.460
11−0.0530.244−1.291
120.1310.0250.095
13−0.0110.3091.082
14−0.558−0.6640.177
150.3390.048−0.494
160.298−0.0320.390
17−0.104−0.2270.090
180.3380.304−1.610
19−0.0981.0030.883
200.162−0.297−0.461
Table 2. The accuracy terms Mean, Standard Deviation and RMSE for the residuals of Table 1.
ResidualMean (m)StDev (m)RMSE (m)
ΔΕ0.0570.3420.339
ΔΝ0.1110.3330.344
ΔH0.3461.8071.795
Table 3. Attribute values of the Omega House 3D models.
AttributeModel 1972Model 2017
Points Number360,1661,435,084
Faces Number715,8572,920,753
Edges Number1,075,4944,384,396
Table 4. Summary of model comparisons regarding C2M distances.
Part of Omega HouseC2M Distances Range
Northwest−9 cm to 5 cm
Southwest−17 cm to 5 cm
Central North−1.83 cm to 0.9 cm
Northeast−1.81 cm to 1.62 cm
Southeast−1.67 cm to 1.76 cm
Table 5. Summary of model comparisons regarding volume.
Part of Omega HouseVolume Effect
in 2017 Model
NortheastDecrease per 5.11%
Central NorthIncrease per 7.86%
NorthwestIncrease per 0.58%
SoutheastIncrease per 2.1%
SouthwestDecrease per 1.43%
Selected Part in Figure 24Decrease per 15.11%
Disclaimer/Publisher’s Note: The statements, opinions and data contained in all publications are solely those of the individual author(s) and contributor(s) and not of MDPI and/or the editor(s). MDPI and/or the editor(s) disclaim responsibility for any injury to people or property resulting from any ideas, methods, instructions or products referred to in the content.

