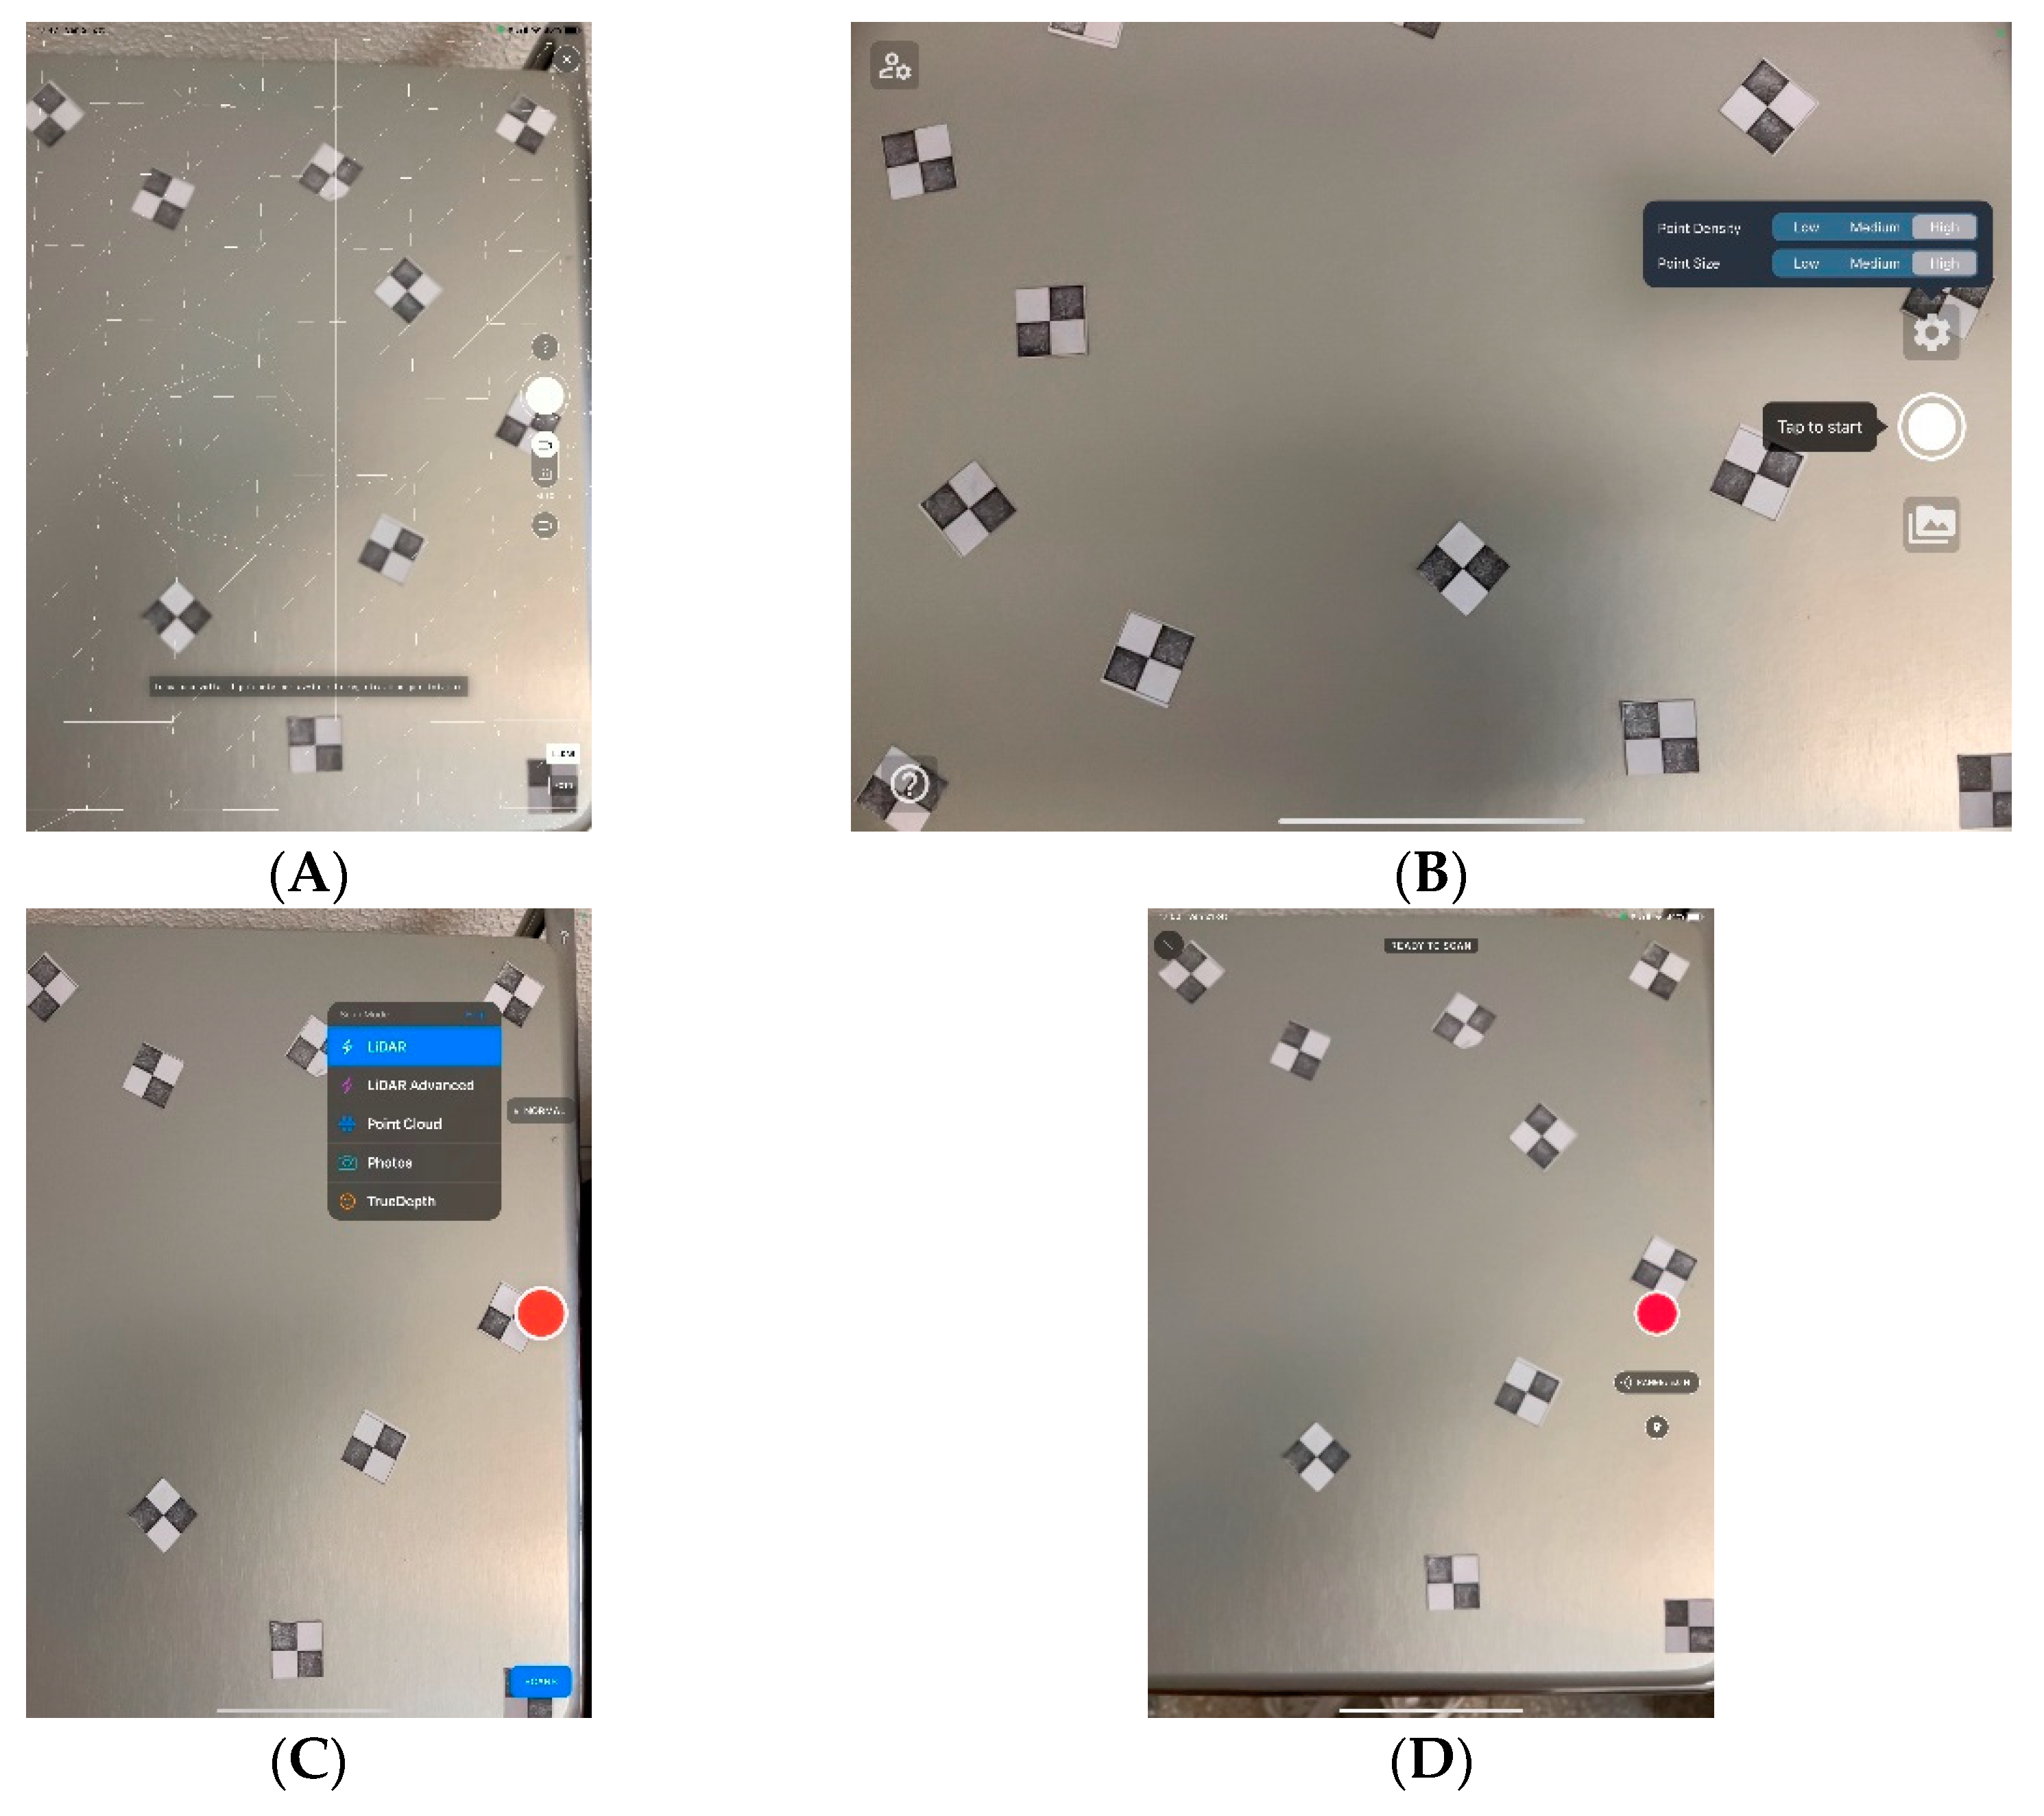
Figure 1.
Used apps: (A) Polycam; (B) Sitescape; (C) 3D Scanner; (D) Scaninverse.
Figure 1.
Used apps: (A) Polycam; (B) Sitescape; (C) 3D Scanner; (D) Scaninverse.
Figure 2.
Vault of the Santa Maria del Monte Church.
Figure 2.
Vault of the Santa Maria del Monte Church.
Figure 3.
Column in the Department of Architecture.
Figure 3.
Column in the Department of Architecture.
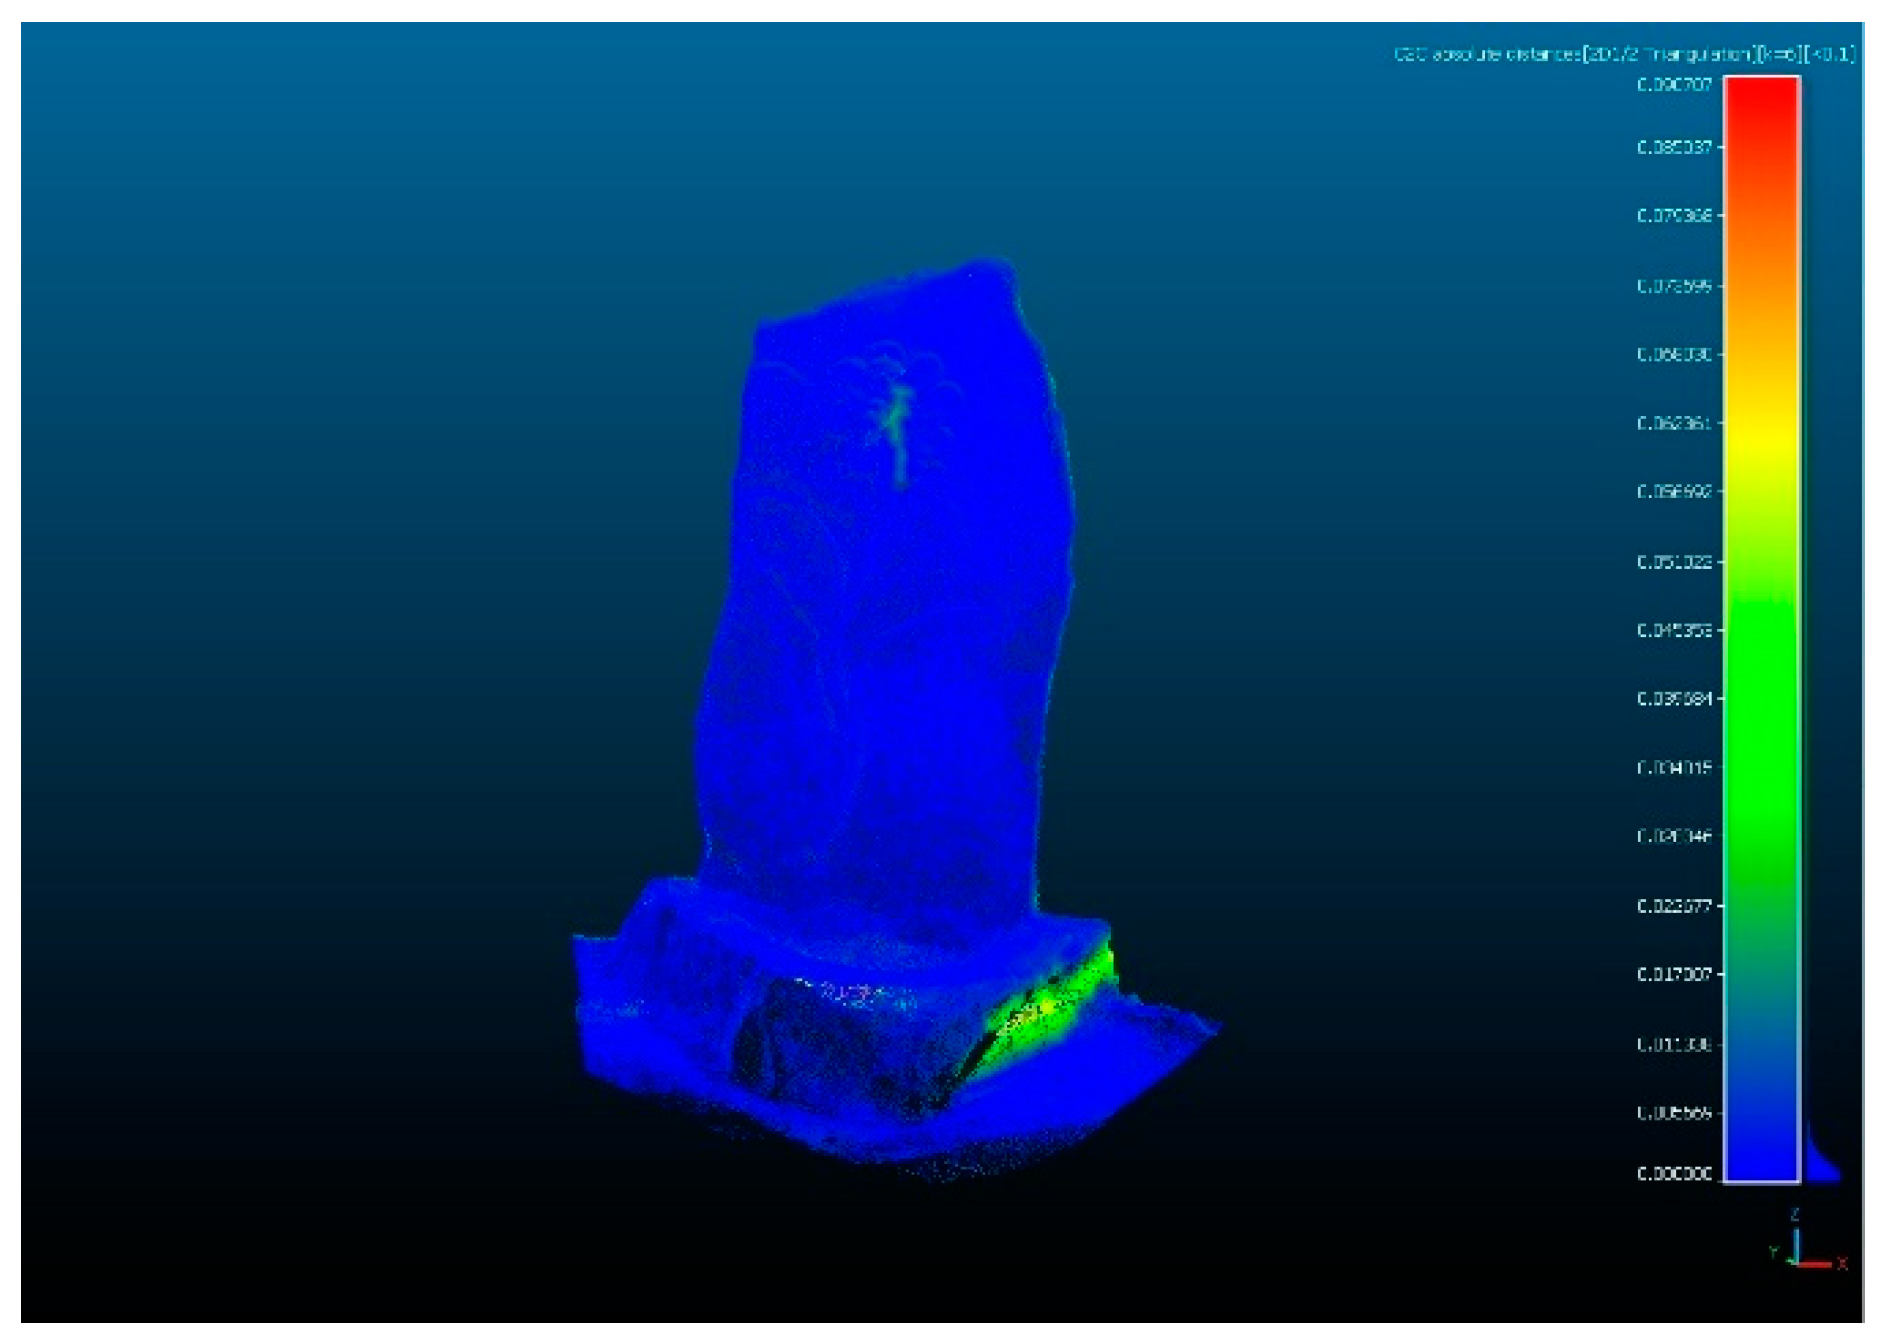
Figure 5.
Stone fountain.
Figure 5.
Stone fountain.
Figure 7.
Point clouds of the vault: (A) HDS7000; (B) Polycam; (C) Sitescape; (D) 3D Scanner; (E) Scaninverse.
Figure 7.
Point clouds of the vault: (A) HDS7000; (B) Polycam; (C) Sitescape; (D) 3D Scanner; (E) Scaninverse.
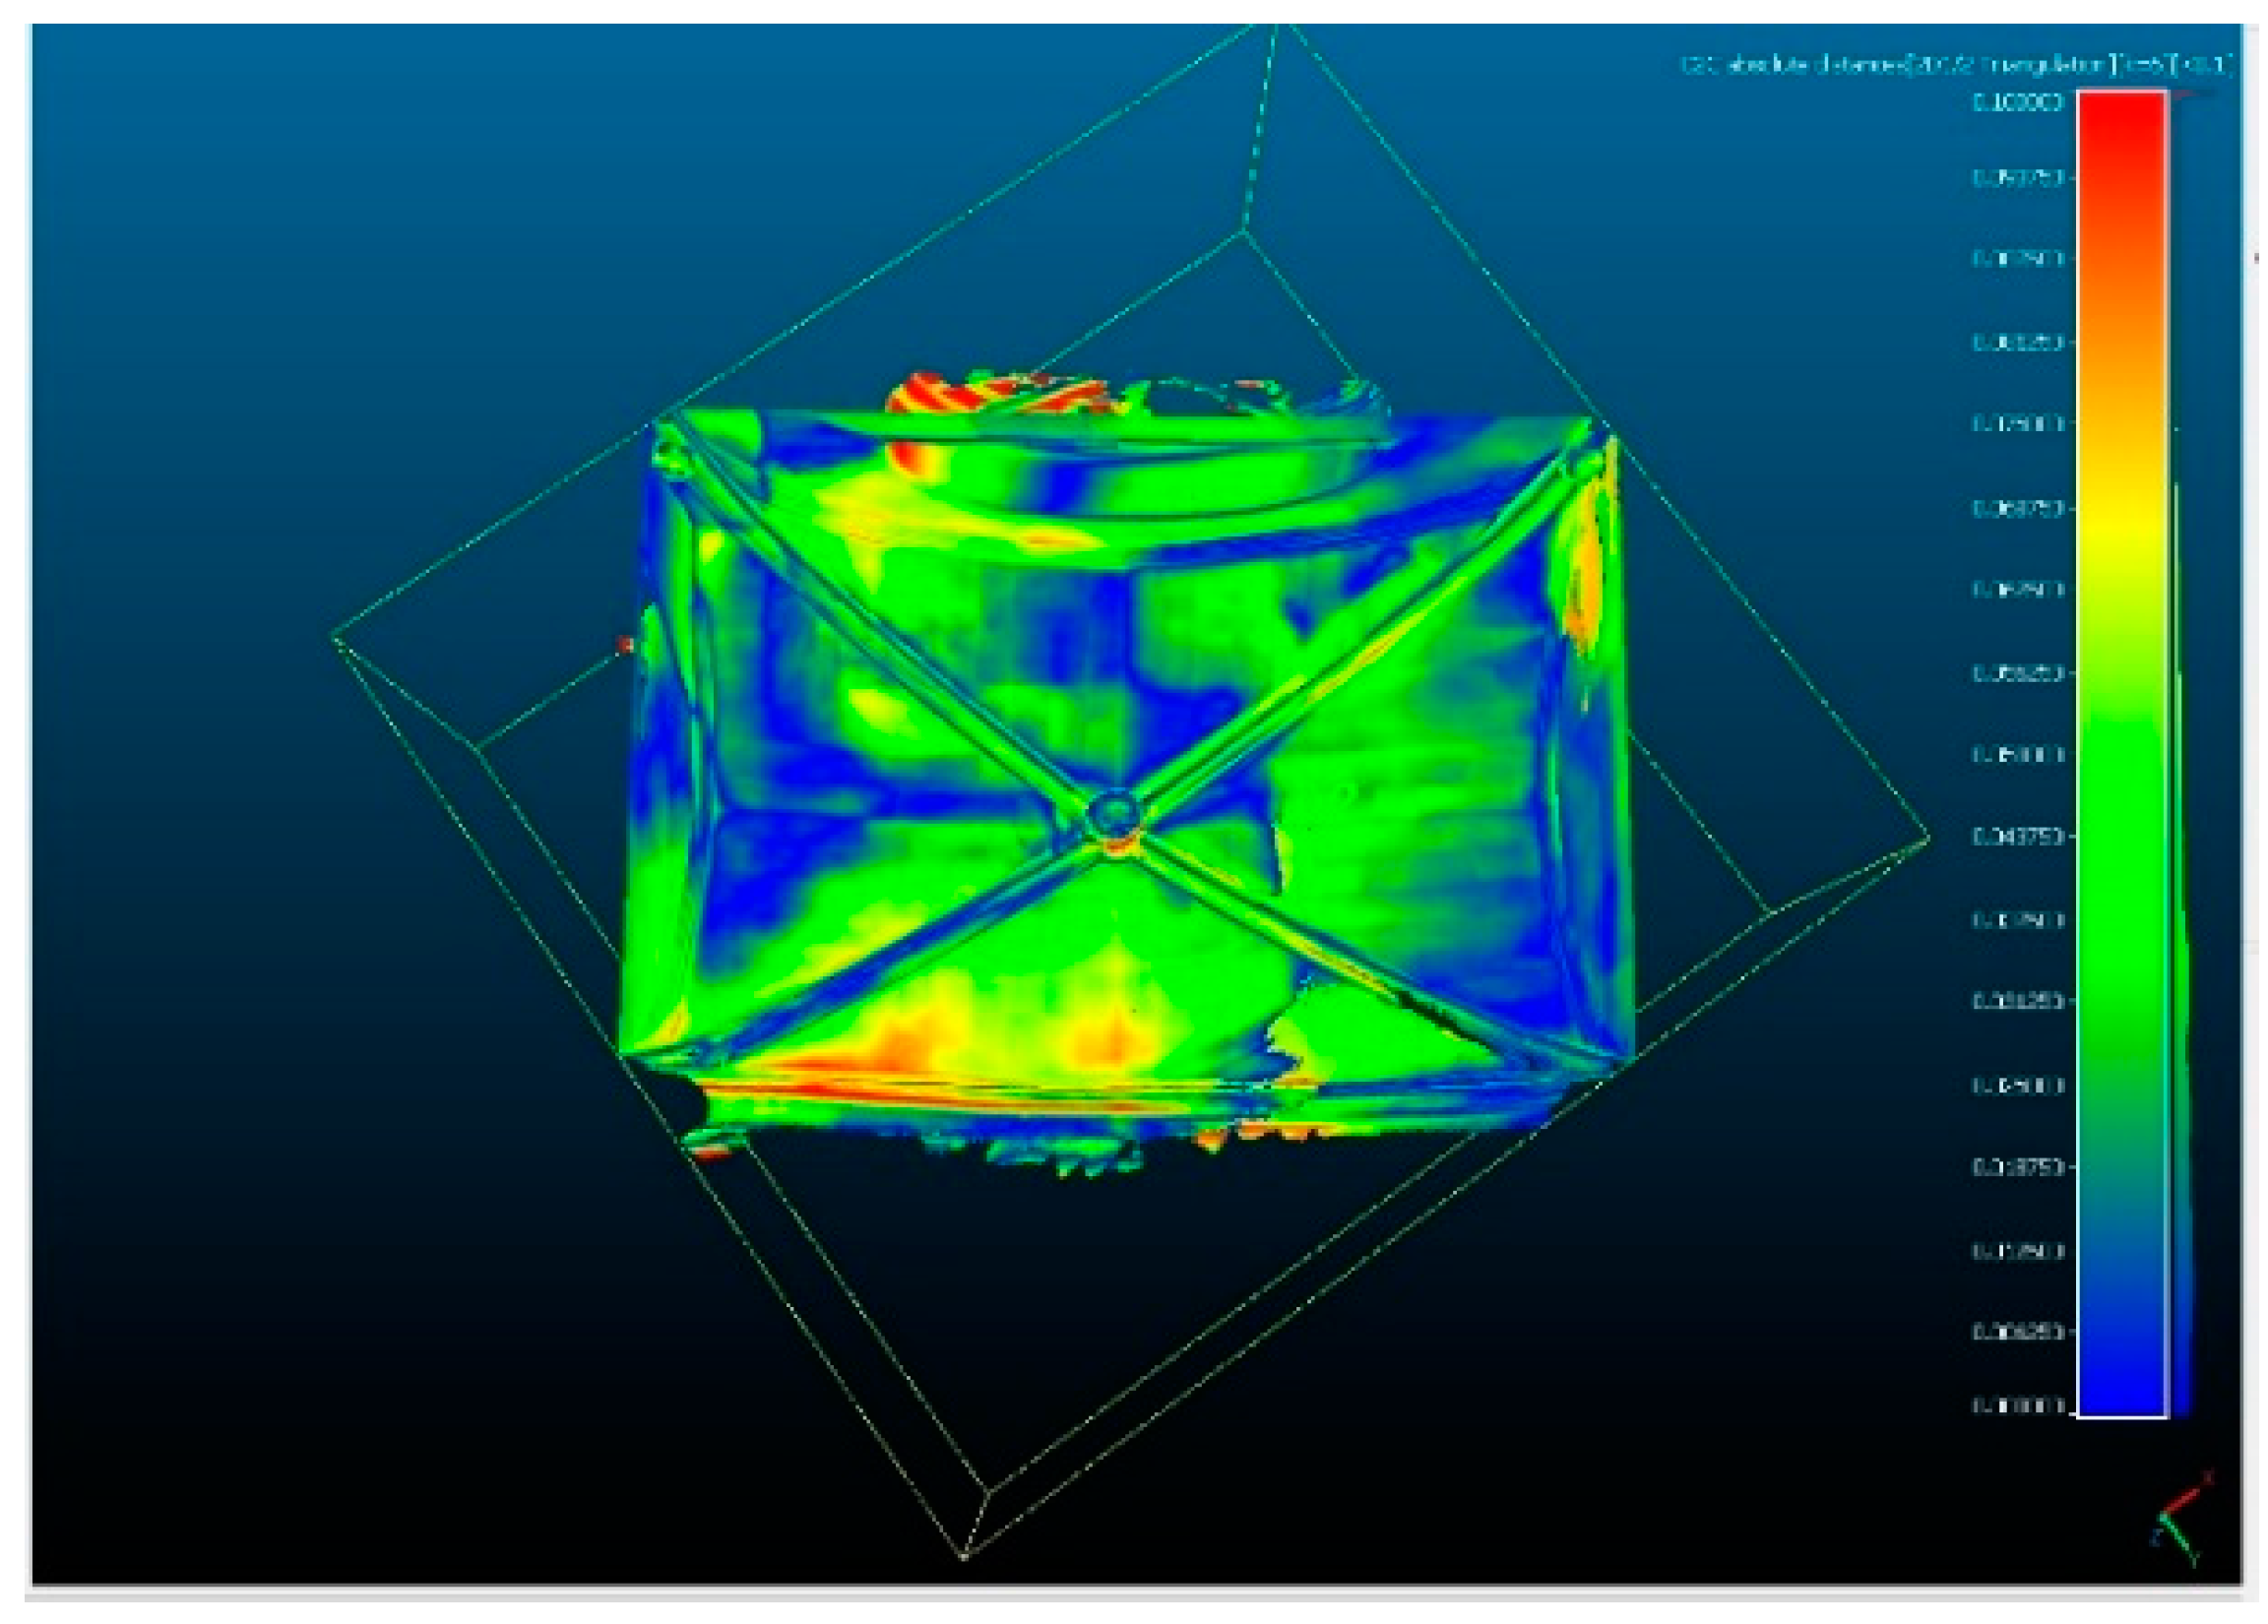
Figure 8.
Discrepancy (m) map between TLS’ and Polycam’s point clouds.
Figure 8.
Discrepancy (m) map between TLS’ and Polycam’s point clouds.
Figure 9.
Discrepancy (m) map between TLS’ and Sitescape’s point clouds.
Figure 9.
Discrepancy (m) map between TLS’ and Sitescape’s point clouds.
Figure 10.
Discrepancy (m) map between TLS’ and 3D Scanner’s point clouds.
Figure 10.
Discrepancy (m) map between TLS’ and 3D Scanner’s point clouds.
Figure 11.
Discrepancy (m) map between TLS’ and Scaninverse’s point clouds.
Figure 11.
Discrepancy (m) map between TLS’ and Scaninverse’s point clouds.
Figure 12.
Point clouds of the column: (A) Focus 3D; (B) Polycam; (C) Sitescape; (D) 3D Scanner; (E) Scaninverse.
Figure 12.
Point clouds of the column: (A) Focus 3D; (B) Polycam; (C) Sitescape; (D) 3D Scanner; (E) Scaninverse.
Figure 13.
Discrepancy (m) map between TLS’ and Polycam’s point clouds.
Figure 13.
Discrepancy (m) map between TLS’ and Polycam’s point clouds.
Figure 14.
Discrepancy (m) map between TLS’ and Sitescape’s point cloud.
Figure 14.
Discrepancy (m) map between TLS’ and Sitescape’s point cloud.
Figure 15.
Discrepancy (m) map between TLS’ and 3D Scanner’s point clouds.
Figure 15.
Discrepancy (m) map between TLS’ and 3D Scanner’s point clouds.
Figure 16.
Discrepancy (m) map between TLS’ and Scaninverse’s point clouds.
Figure 16.
Discrepancy (m) map between TLS’ and Scaninverse’s point clouds.
Figure 17.
Column sections.
Figure 17.
Column sections.
Figure 18.
Section 1 (the lowest).
Figure 18.
Section 1 (the lowest).
Figure 21.
Section 4 (the highest).
Figure 21.
Section 4 (the highest).
Figure 22.
Detail of the Sitescape point cloud.
Figure 22.
Detail of the Sitescape point cloud.
Figure 23.
Facade point clouds: (A) Focus 3D; (B) Polycam; (C) Sitescape; (D) 3D Scanner; (E) Scaninverse.
Figure 23.
Facade point clouds: (A) Focus 3D; (B) Polycam; (C) Sitescape; (D) 3D Scanner; (E) Scaninverse.
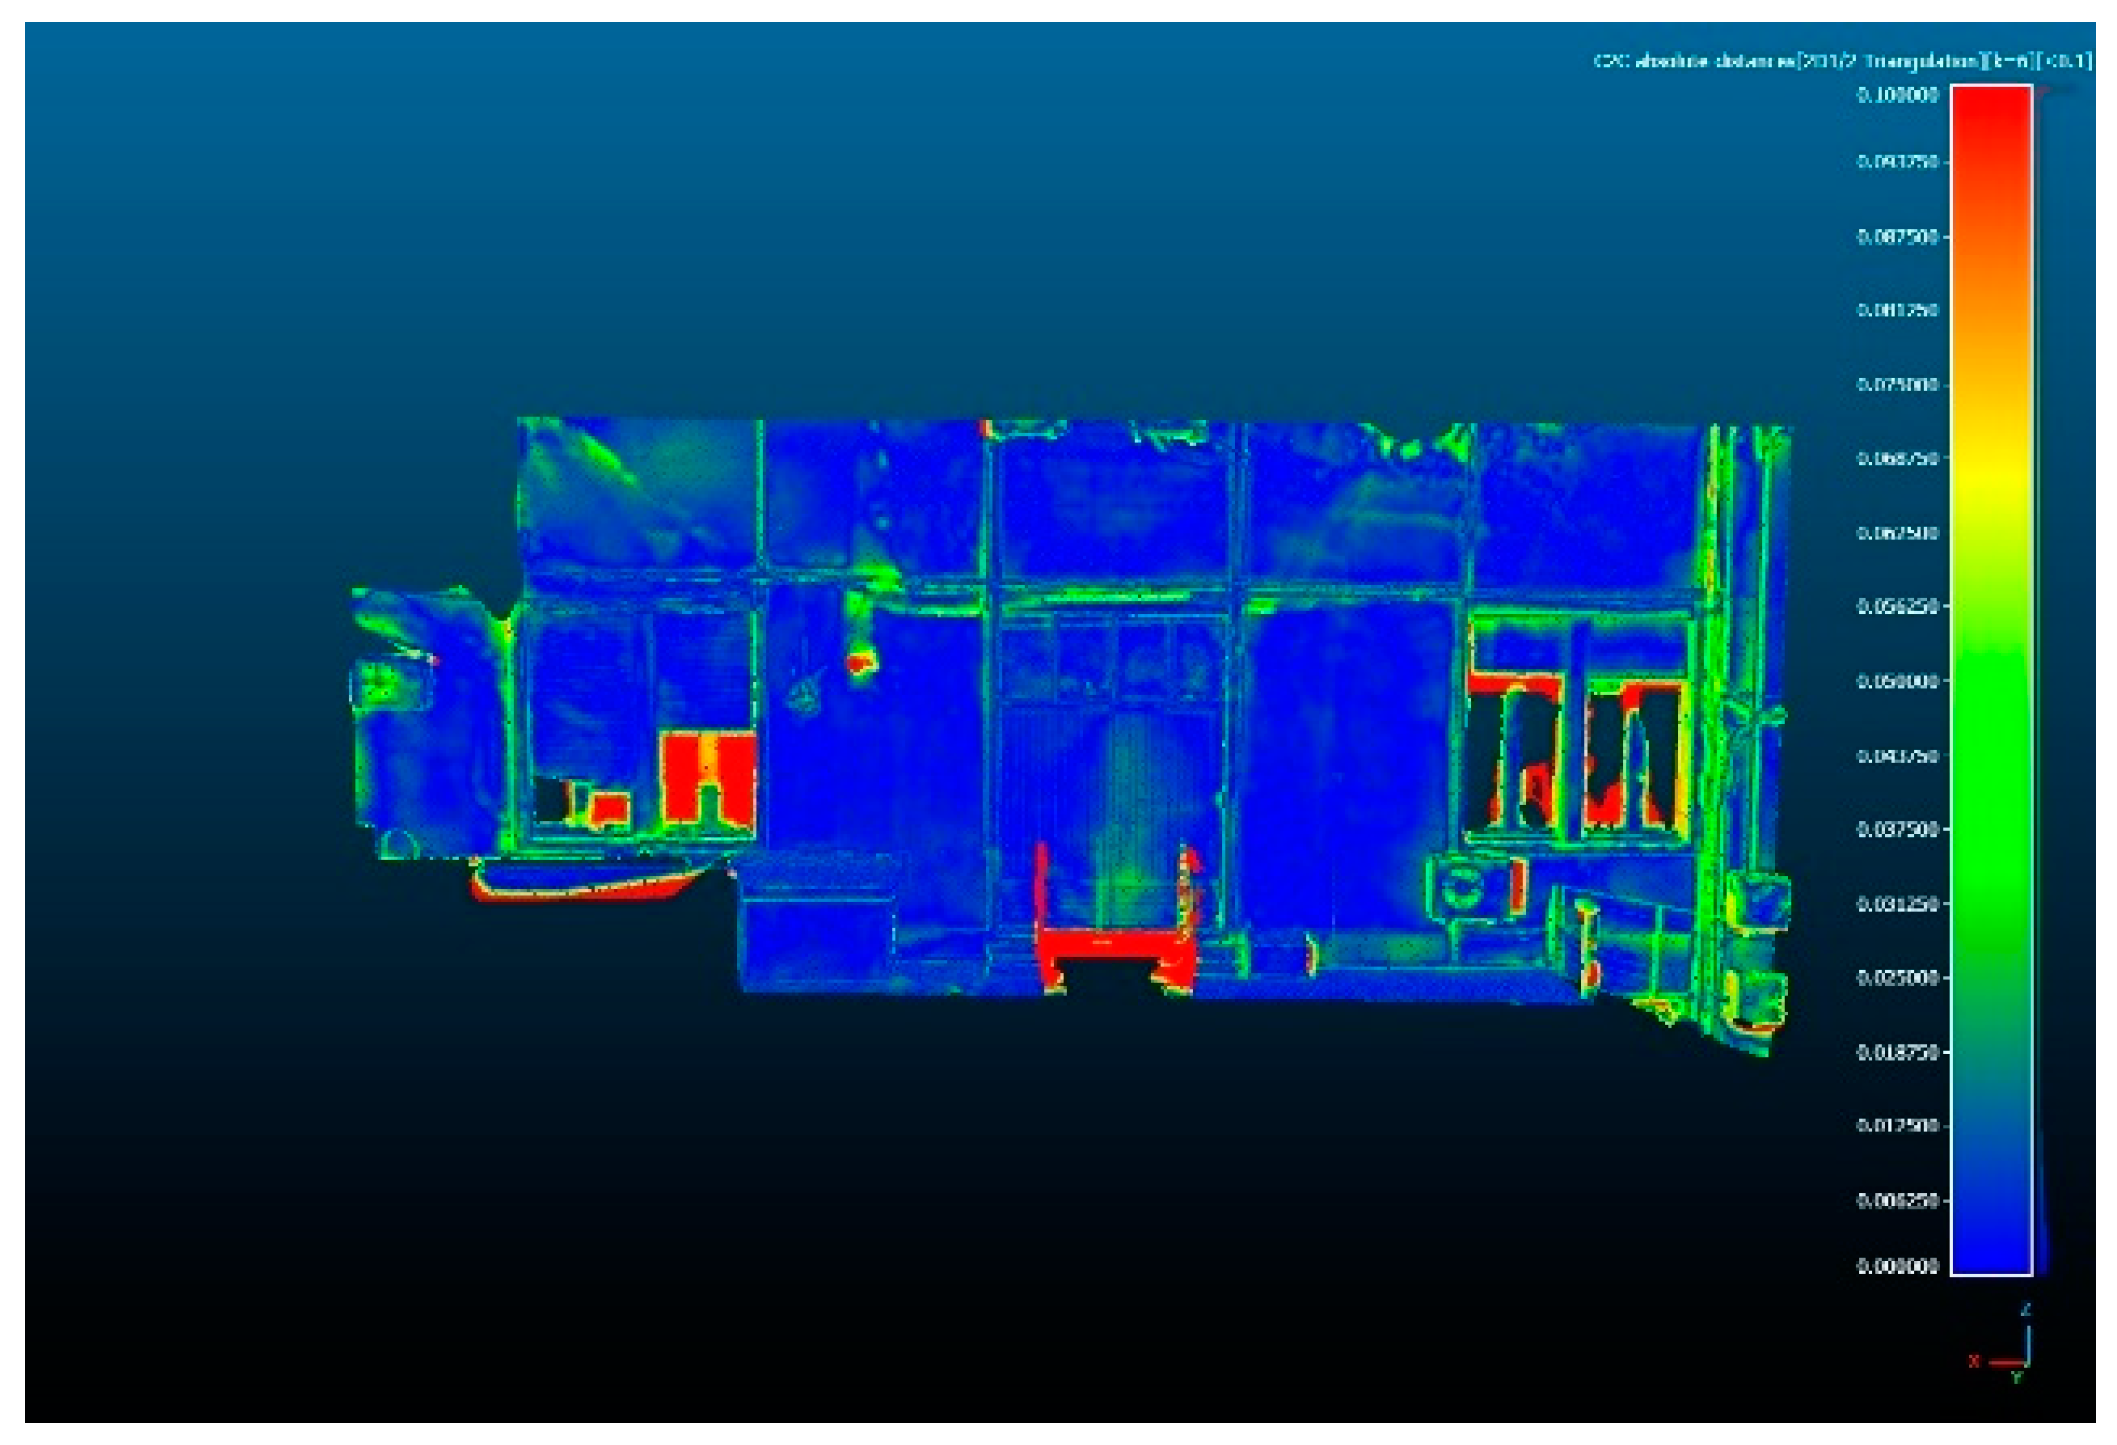
Figure 24.
Discrepancy (m) map between TLS’ and Polycam’s point clouds.
Figure 24.
Discrepancy (m) map between TLS’ and Polycam’s point clouds.
Figure 25.
Discrepancy (m) map between TLS’ and Sitescape’s point clouds.
Figure 25.
Discrepancy (m) map between TLS’ and Sitescape’s point clouds.
Figure 26.
Discrepancy (m) map between TLS’ and 3D Scanner’s point clouds.
Figure 26.
Discrepancy (m) map between TLS’ and 3D Scanner’s point clouds.
Figure 27.
Discrepancy (m) map between TLS’ and Scaninverse’s point clouds.
Figure 27.
Discrepancy (m) map between TLS’ and Scaninverse’s point clouds.
Figure 28.
Point clouds of the fountain: (A) HDS7000; (B) Polycam; (C) Sitescape; (D) 3D Scanner; (E) Scaninverse.
Figure 28.
Point clouds of the fountain: (A) HDS7000; (B) Polycam; (C) Sitescape; (D) 3D Scanner; (E) Scaninverse.
Figure 29.
Discrepancy (m) map between TLS’ and Polycam’s point clouds.
Figure 29.
Discrepancy (m) map between TLS’ and Polycam’s point clouds.
Figure 30.
Discrepancy (m) map between TLS’ and Sitescape’s point clouds.
Figure 30.
Discrepancy (m) map between TLS’ and Sitescape’s point clouds.
Figure 31.
Discrepancy (m) map between TLS’ and 3D Scanner’s point clouds.
Figure 31.
Discrepancy (m) map between TLS’ and 3D Scanner’s point clouds.
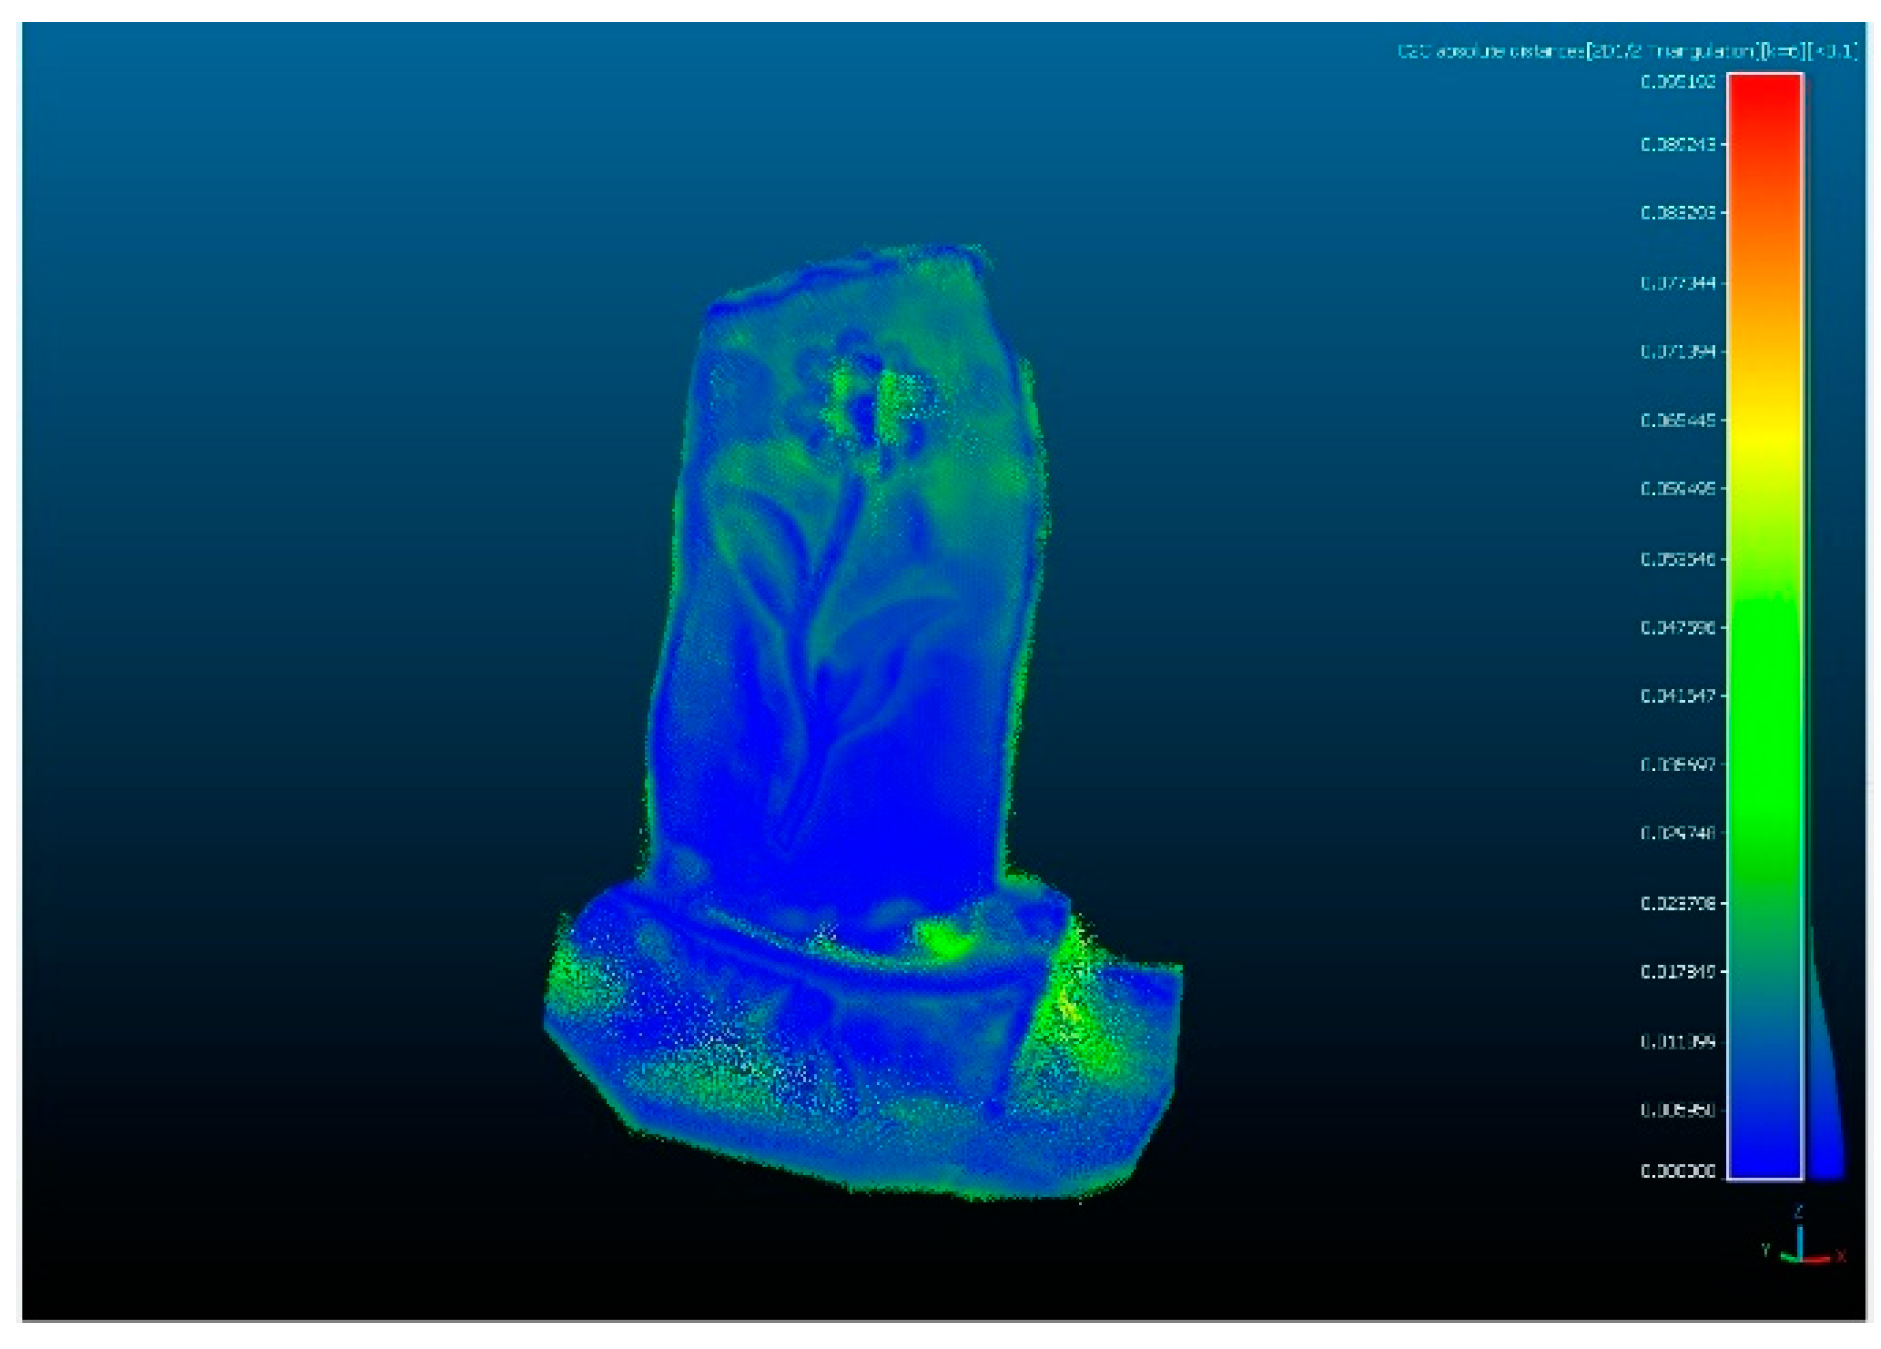
Figure 32.
Discrepancy (m) map between TLS’ and Scaninverse’s point clouds.
Figure 32.
Discrepancy (m) map between TLS’ and Scaninverse’s point clouds.
Figure 33.
Point clouds of the violin: (A) Focus 3D; (B) Polycam; (C) Scaninverse.
Figure 33.
Point clouds of the violin: (A) Focus 3D; (B) Polycam; (C) Scaninverse.
Figure 34.
Discrepancy (m) map between TLS’ and Polycam’s point clouds.
Figure 34.
Discrepancy (m) map between TLS’ and Polycam’s point clouds.
Figure 35.
Discrepancy (m) map between TLS’ and Scaninverse’s point clouds.
Figure 35.
Discrepancy (m) map between TLS’ and Scaninverse’s point clouds.
Table 1.
Features of the four apps used.
Table 1.
Features of the four apps used.
| Name | License | Price | Point Cloud | Mesh | File Formats | Version |
|---|
| Polycam | Free/By charge | 6.99 $/month | Yes | Yes | .ply, .las and others | 2.3.9 |
| SiteScape | Free/By charge | 49.99 $/month | Yes | Yes | .ply
E57
and others | 1.6.8 |
| 3D Scanner App | Free | | Yes | Yes | xyz; ply; pts; las; and others | 2.0.8 |
| Scaninverse | Free | | Yes | Yes | .ply, .las and others | 2.0.3 |
Table 2.
Number of points of the point clouds for the vault.
Table 2.
Number of points of the point clouds for the vault.
| Dataset | N° of Points |
|---|
| HDS | 20,686.478 |
| Polycam | 2353.90 |
| Sitescape | 8774.849 |
| 3D Scanner App | 3198.208 |
| Scaninverse | 245.556 |
Table 3.
C2C analysis—statistical parameters of the comparisons between the TLS and the apps’ point clouds.
Table 3.
C2C analysis—statistical parameters of the comparisons between the TLS and the apps’ point clouds.
| App | Polycam | SiteScape | 3D Scanner | Scaninverse |
|---|
| Min (m) | 0 | 0 | 0 | 0 |
| Max (m) | 0.239 | 0.412 | 0.215 | 0.227 |
| Mean (m) | 0.014 | 0.032 | 0.018 | 0.034 |
| Dev. Stand (m) | 0.030 | 0.042 | 0.032 | 0.040 |
Table 4.
C2C analysis—percentages of points in the different distance ranges.
Table 4.
C2C analysis—percentages of points in the different distance ranges.
| App | Polycam | SiteScape | 3D Scanner | Scaninverse |
|---|
| <1 cm | 26% | 11% | 25% | 12% |
| 1 cm–3 cm | 40% | 25% | 34% | 25% |
| 3 cm–5 cm | 25% | 27% | 24% | 16% |
| 5 cm–10 cm | 7% | 27% | 16% | 33% |
| >10 cm | 2% | 10% | 1% | 14% |
Table 5.
Number of points in the point clouds for the column.
Table 5.
Number of points in the point clouds for the column.
| Dataset | N° of Points |
|---|
| Focus 3D | 804.275 |
| Polycam | 386.238 |
| Sitescape | 7322.792 |
| 3D Scanner App | 108.361 |
| Scaninverse | 1094.006 |
Table 6.
Statistical parameters of the comparisons between the TLS data and the apps’ point clouds.
Table 6.
Statistical parameters of the comparisons between the TLS data and the apps’ point clouds.
| App | Polycam | SiteScape | 3D Scanner | Scaninverse |
|---|
| Min (m) | 0 | 0 | 0 | 0 |
| Max (m) | 0.474 | 0.498 | 0.534 | 0.791 |
| Mean (m) | 0.025 | 0.030 | 0.037 | 0.008 |
| Dev. Stand (m) | 0.060 | 0.037 | 0.026 | 0.026 |
Table 7.
C2C analysis—percentages of points in the different distance ranges.
Table 7.
C2C analysis—percentages of points in the different distance ranges.
| App | Polycam | SiteScape | 3D Scanner | Scaninverse |
|---|
| <1 cm | 52% | 19% | 22% | 59% |
| 1 cm–3 cm | 26% | 29% | 48% | 35% |
| 3 cm–5 cm | 7% | 25% | 13% | 5% |
| 5 cm–10 cm | 7% | 23% | 7% | 0.6% |
| >10 cm | 8% | 4% | 10% | 0.4% |
Table 8.
Number of points of the point clouds for the facade.
Table 8.
Number of points of the point clouds for the facade.
| Dataset | N° of Points |
|---|
| Focus 3D | 2638.166 |
| Polycam | 1145.667 |
| Sitescape | 8161.379 |
| 3D Scanner App | 2941.878 |
| Scaninverse | 244.293 |
Table 9.
Statistical parameters of the comparisons between the TLS data and the apps’ point clouds.
Table 9.
Statistical parameters of the comparisons between the TLS data and the apps’ point clouds.
| App | Polycam | SiteScape | 3D Scanner | Scaninverse |
|---|
| Min (m) | 0 | 0 | 0 | 0 |
| Max (m) | 1.084 | 1.085 | 0.829 | 0.791 |
| Mean (m) | 0.019 | 0.024 | 0.033 | 0.023 |
| Dev. Stand (m) | 0.070 | 0.066 | 0.071 | 0.065 |
Table 10.
C2C analysis—percentages of points in the different distance range.
Table 10.
C2C analysis—percentages of points in the different distance range.
| App | Polycam | SiteScape | 3D Scanner | Scaninverse |
|---|
| <1 cm | 58% | 29% | 21% | 26% |
| 1 cm–3 cm | 24% | 41% | 35% | 48% |
| 3 cm–5 cm | 6% | 17% | 22% | 14% |
| 5 cm–10 cm | 6% | 8% | 14% | 6% |
| >10 cm | 6% | 5% | 8% | 6% |
Table 11.
Number of points of the point clouds for the fountain.
Table 11.
Number of points of the point clouds for the fountain.
| Dataset | N° of Points |
|---|
| HDS | 898.939 |
| Polycam | 237.075 |
| Sitescape | 3428.060 |
| 3D Scanner App | 21.169 |
| Scaninverse | 472.280 |
Table 12.
Statistical parameters of the comparisons between the TLS data and the apps’ point clouds.
Table 12.
Statistical parameters of the comparisons between the TLS data and the apps’ point clouds.
| App | Polycam | SiteScape | 3D Scanner | Scaninverse |
|---|
| Min (m) | 0 | 0 | 0 | 0 |
| Max (m) | 0.088 | 0.099 | 0.081 | 0.088 |
| Mean (m) | 0.006 | 0.008 | 0.009 | 0.003 |
| Dev. Stand (m) | 0.013 | 0.010 | 0.013 | 0.004 |
Table 13.
C2C analysis—percentages of points in the different distance ranges.
Table 13.
C2C analysis—percentages of points in the different distance ranges.
| App | Polycam | SiteScape | 3D Scanner | Scaninverse |
|---|
| <1 cm | 81% | 64% | 68% | 92% |
| 1 cm–3 cm | 13% | 32% | 24% | 5% |
| 3 cm–5 cm | 4% | 2% | 6% | 2% |
| 5 cm–10 cm | 2% | 2% | 2% | 1% |
| >10 cm | 0% | 0% | 0% | 0% |
Table 14.
Number of points of the point clouds for the violin.
Table 14.
Number of points of the point clouds for the violin.
| Dataset | N° of Points |
|---|
| Focus 3D | 81.795 |
| Polycam | 118.828 |
| Scaninverse | 275.054 |
Table 15.
Statistical parameters of the comparisons between the TLS data and the apps’ point clouds.
Table 15.
Statistical parameters of the comparisons between the TLS data and the apps’ point clouds.
| App | Polycam | Scaninverse |
|---|
| Min (m) | 0 | 0 |
| Max (m) | 0.020 | 0.012 |
| Mean (m) | 0.005 | 0.001 |
| Dev. Stand (m) | 0.001 | 0.001 |
Table 16.
C2C analysis—percentages of points in the different distance ranges.
Table 16.
C2C analysis—percentages of points in the different distance ranges.
| App | Polycam | Scaninverse |
|---|
| <1 cm | 83% | 100% |
| 1 cm–3 cm | 17% | 0% |
| 3 cm–5 cm | 0% | 0% |
| 5 cm–10 cm | 0% | 0% |
| >10 cm | 0% | 0% |
