


Giving a New Status to a Dyes Collection: A Contribution to the Chromotope Project

Abstract
1. Introduction
2. Materials and Methods
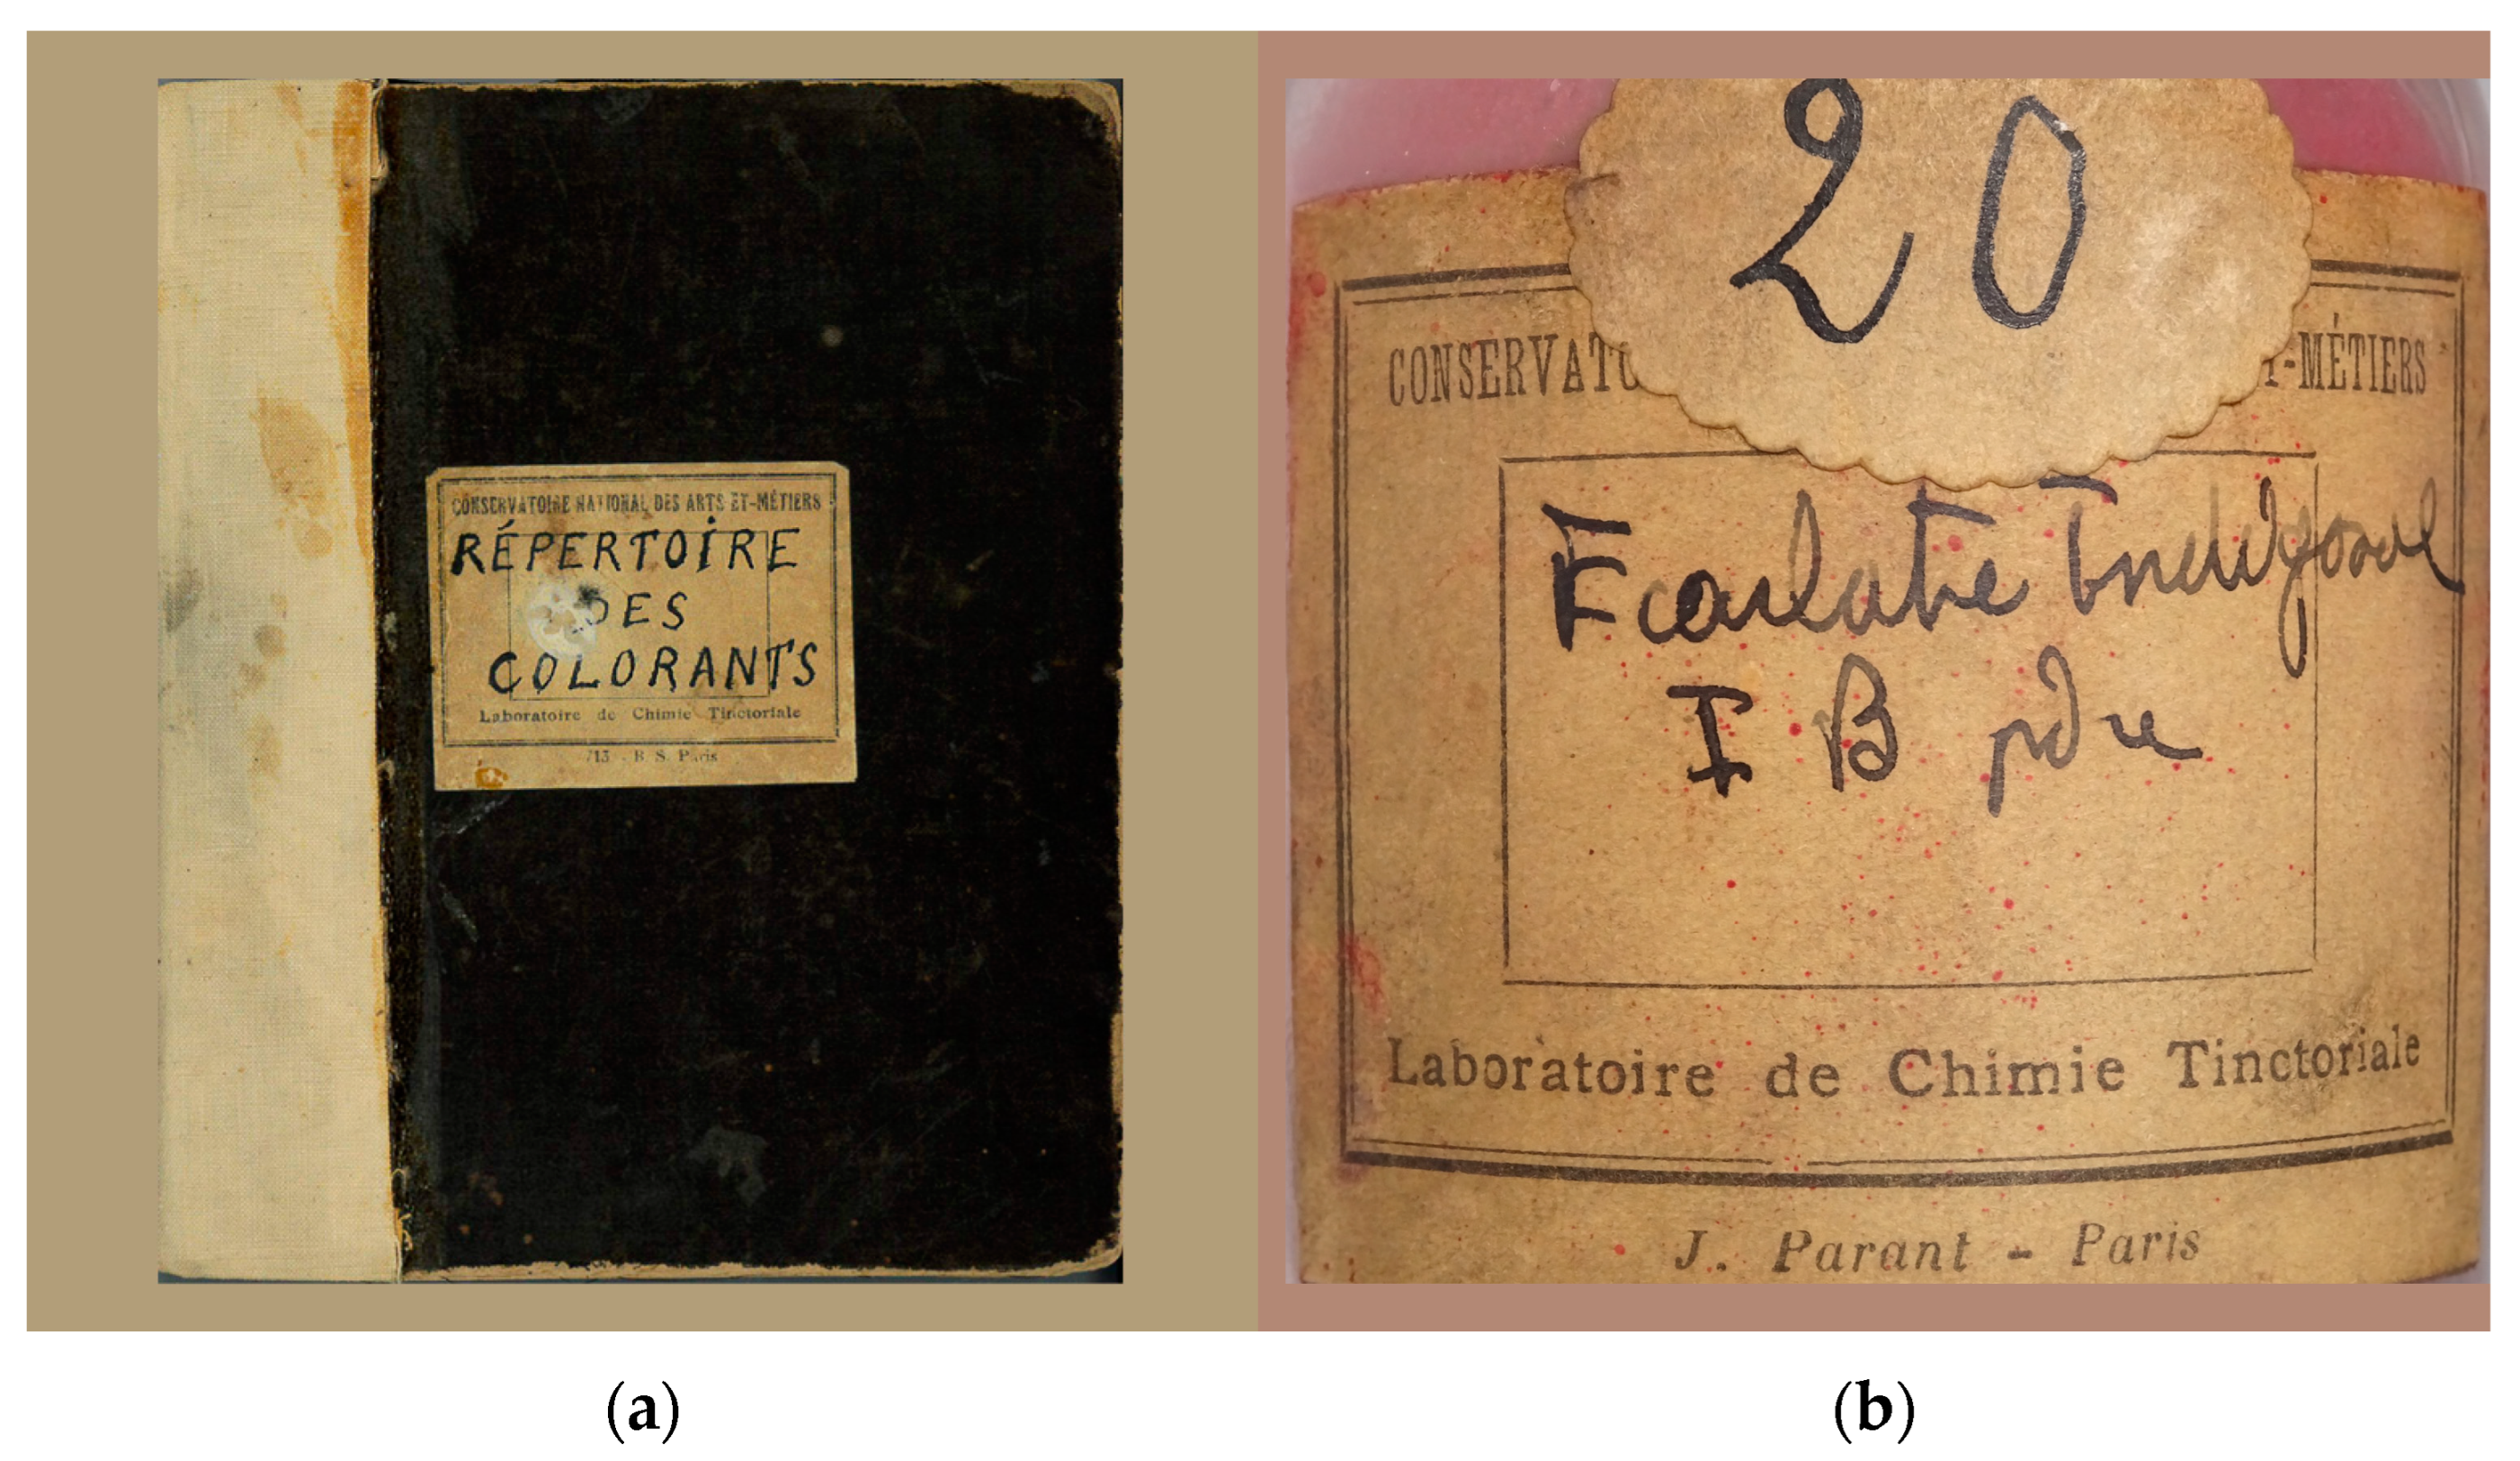
2.1. Inventory Work and Bibliographical Research on Dyes
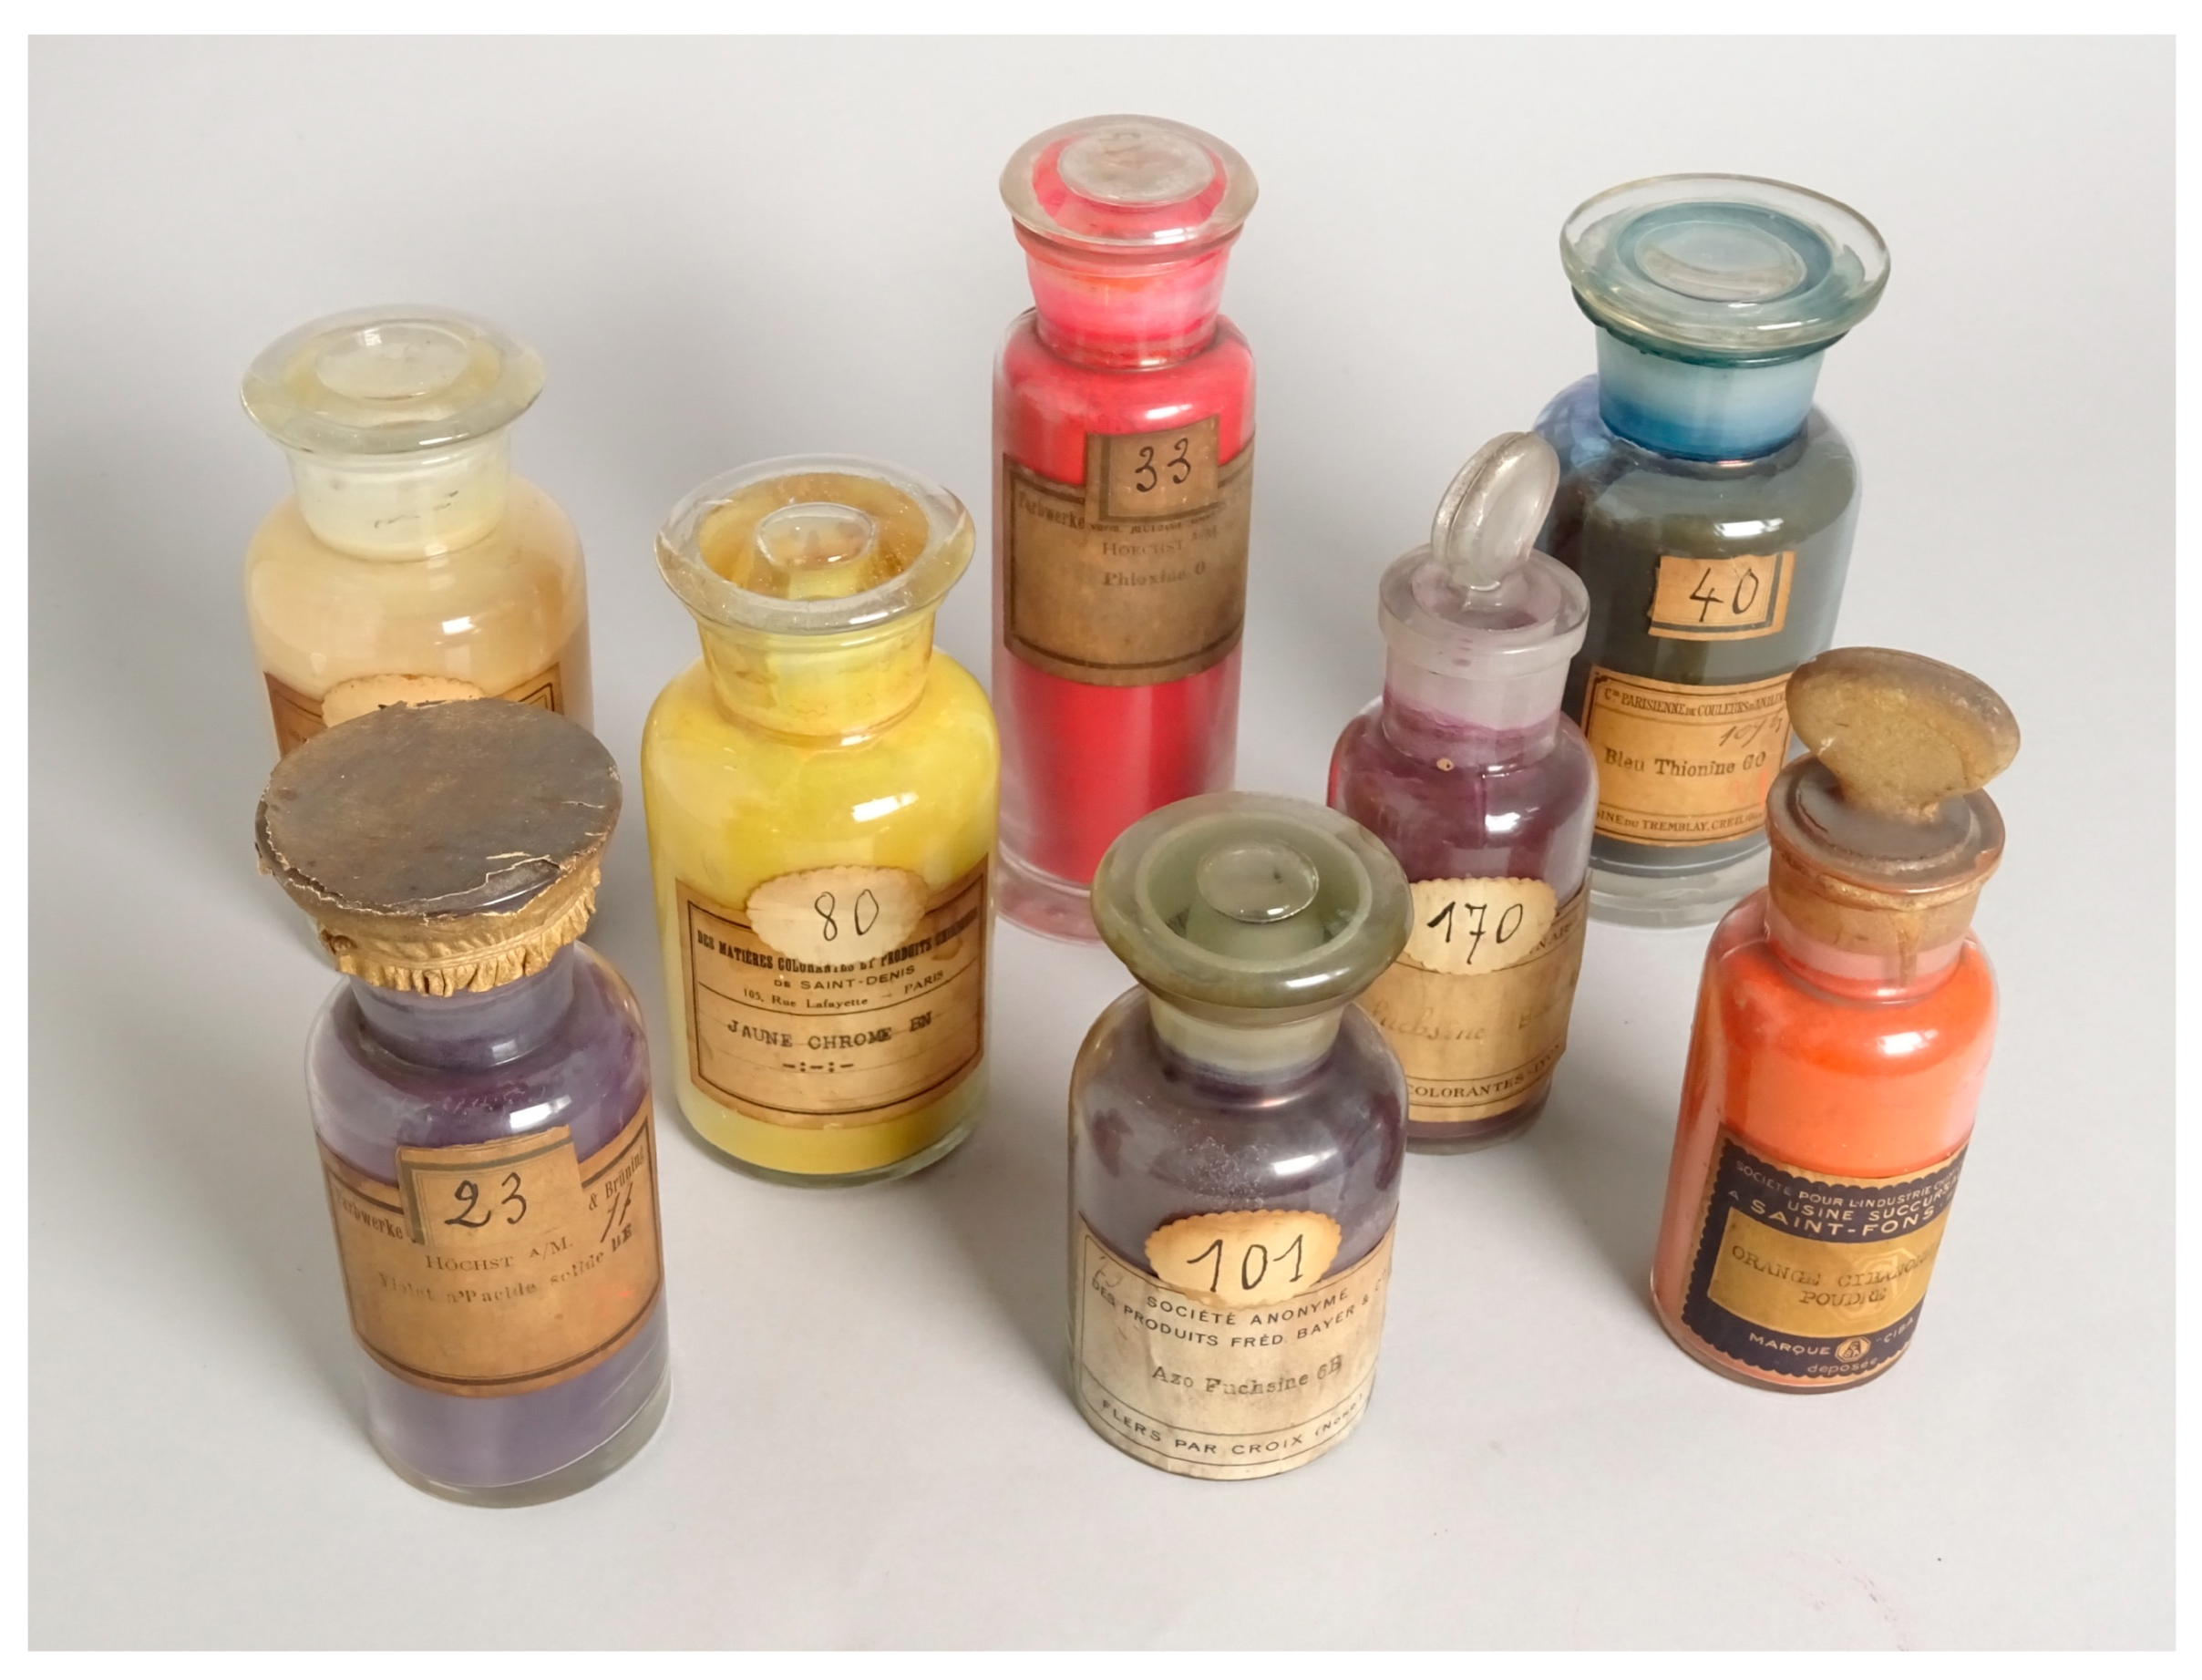
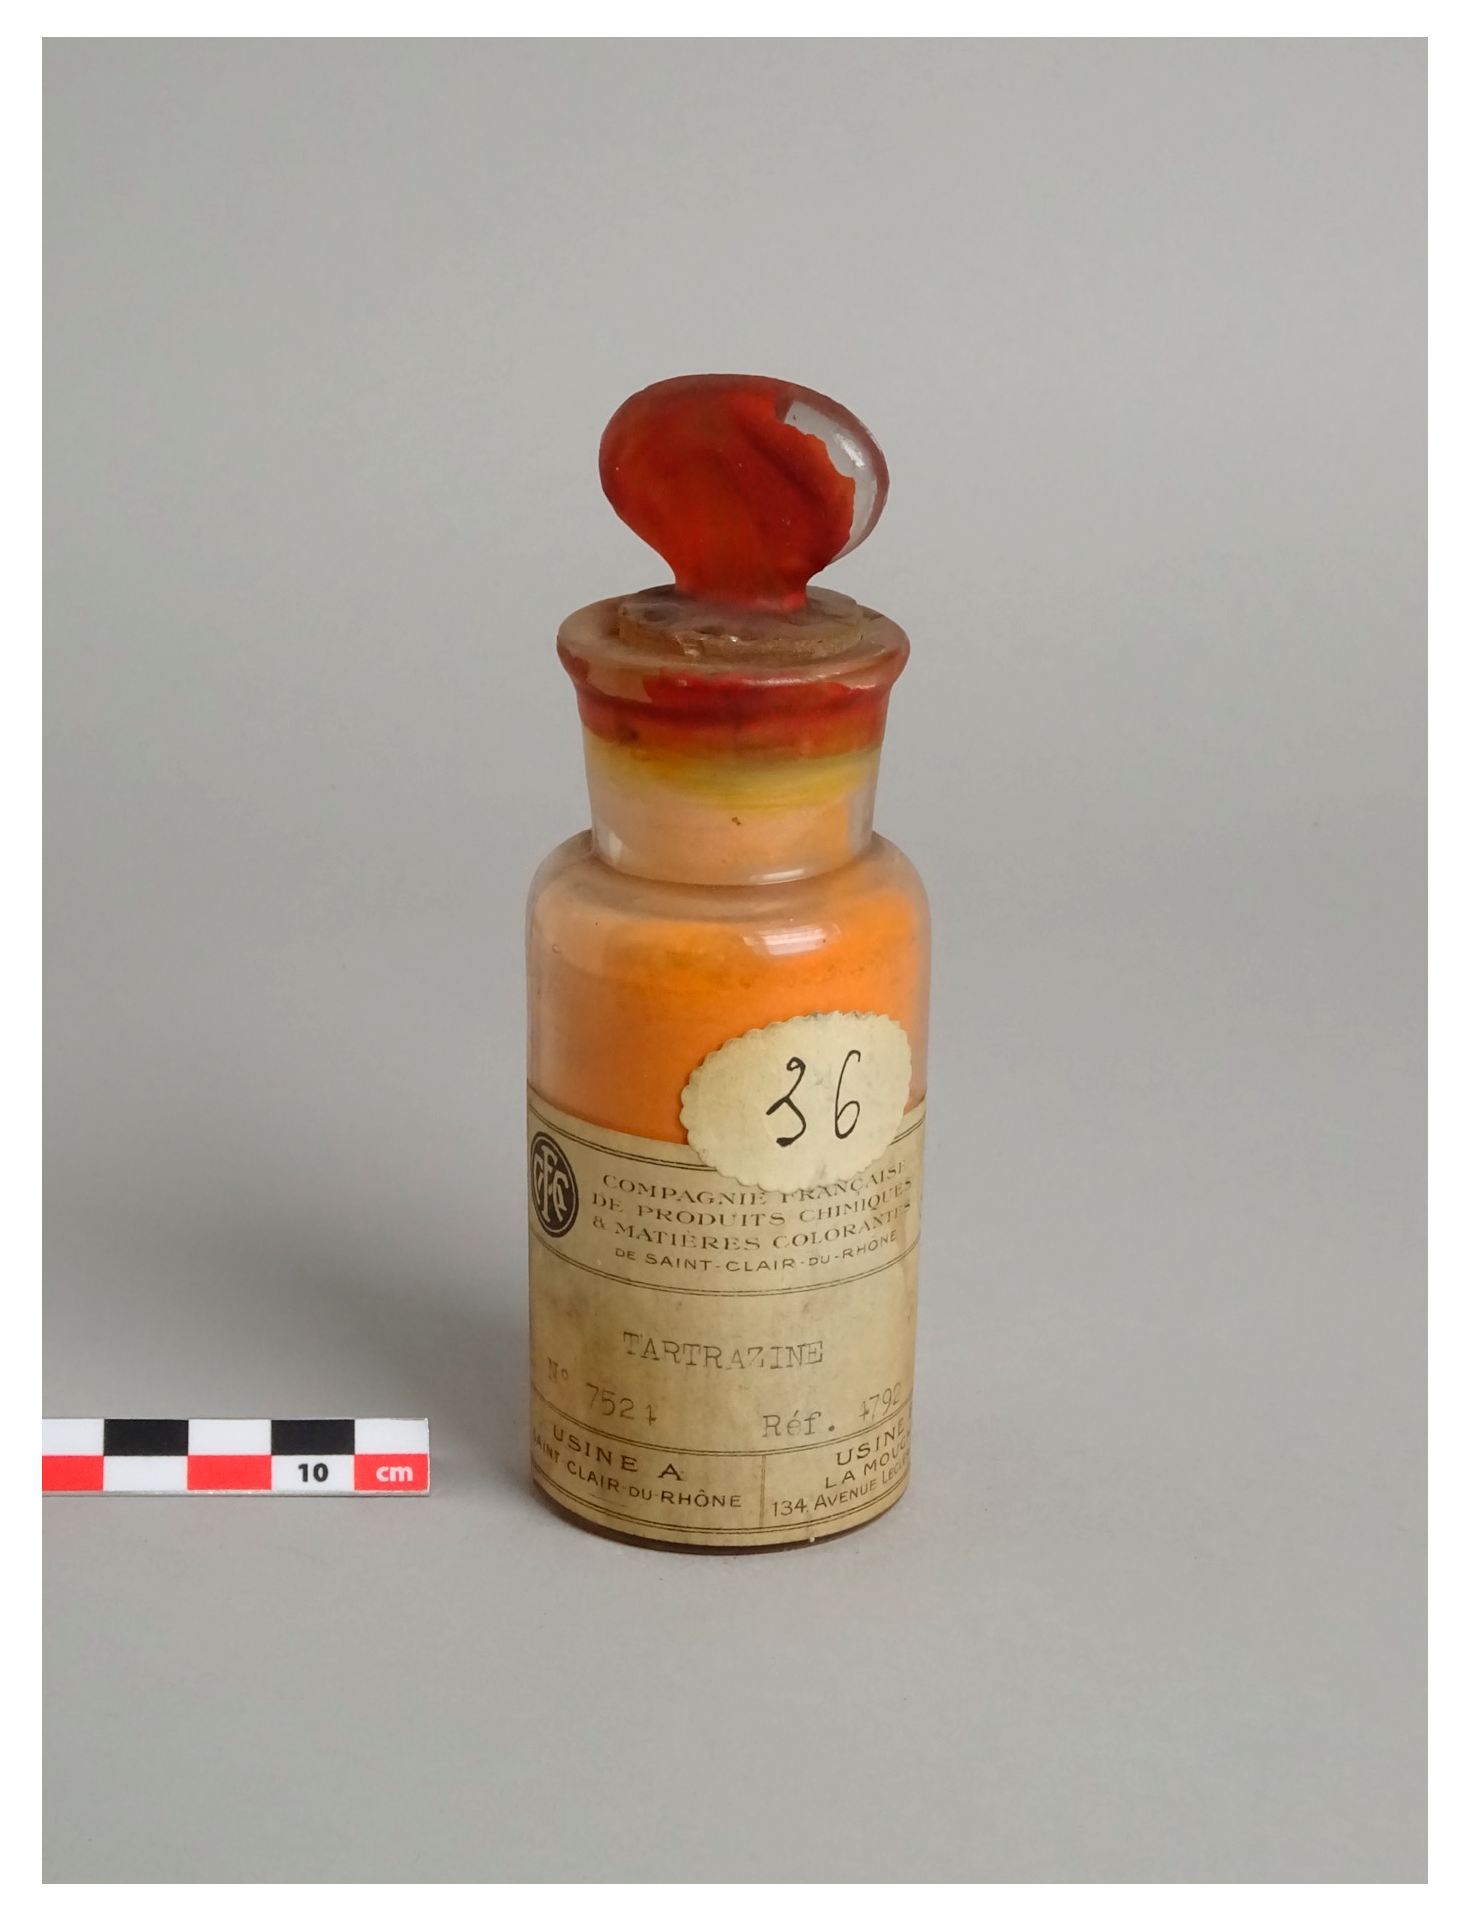
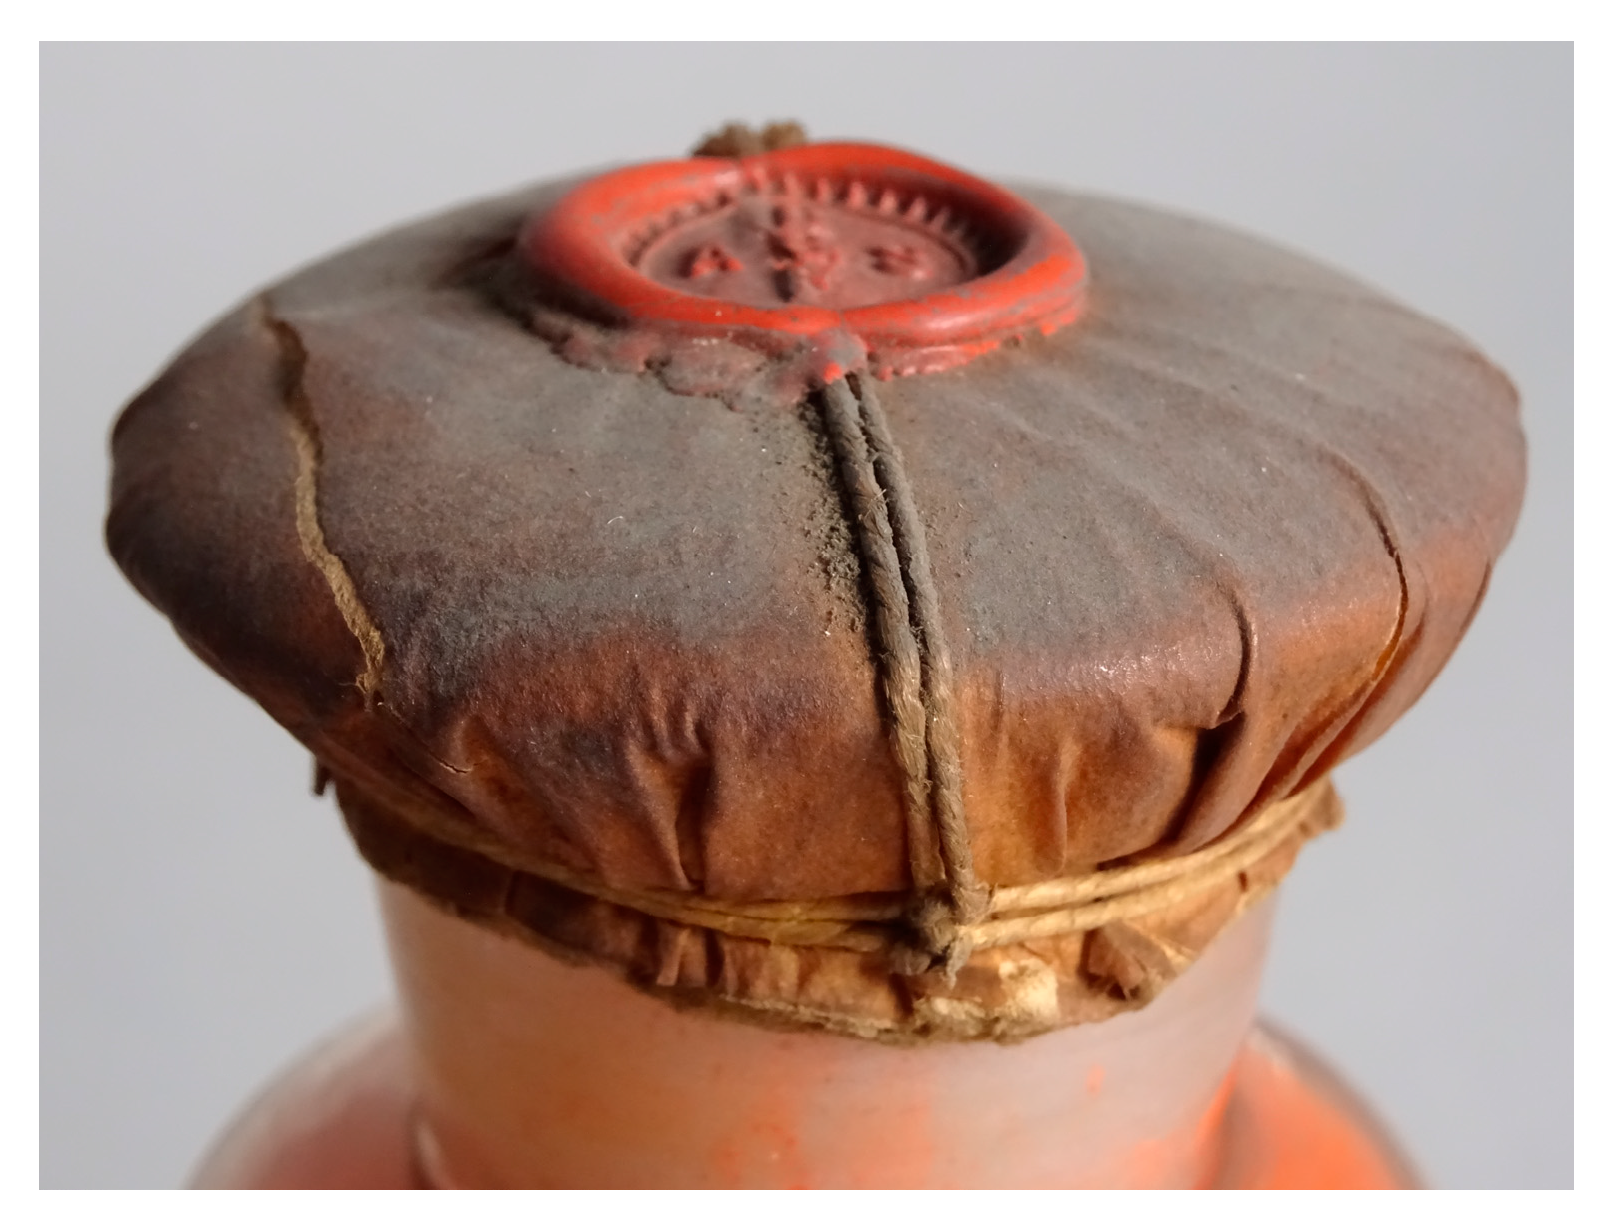
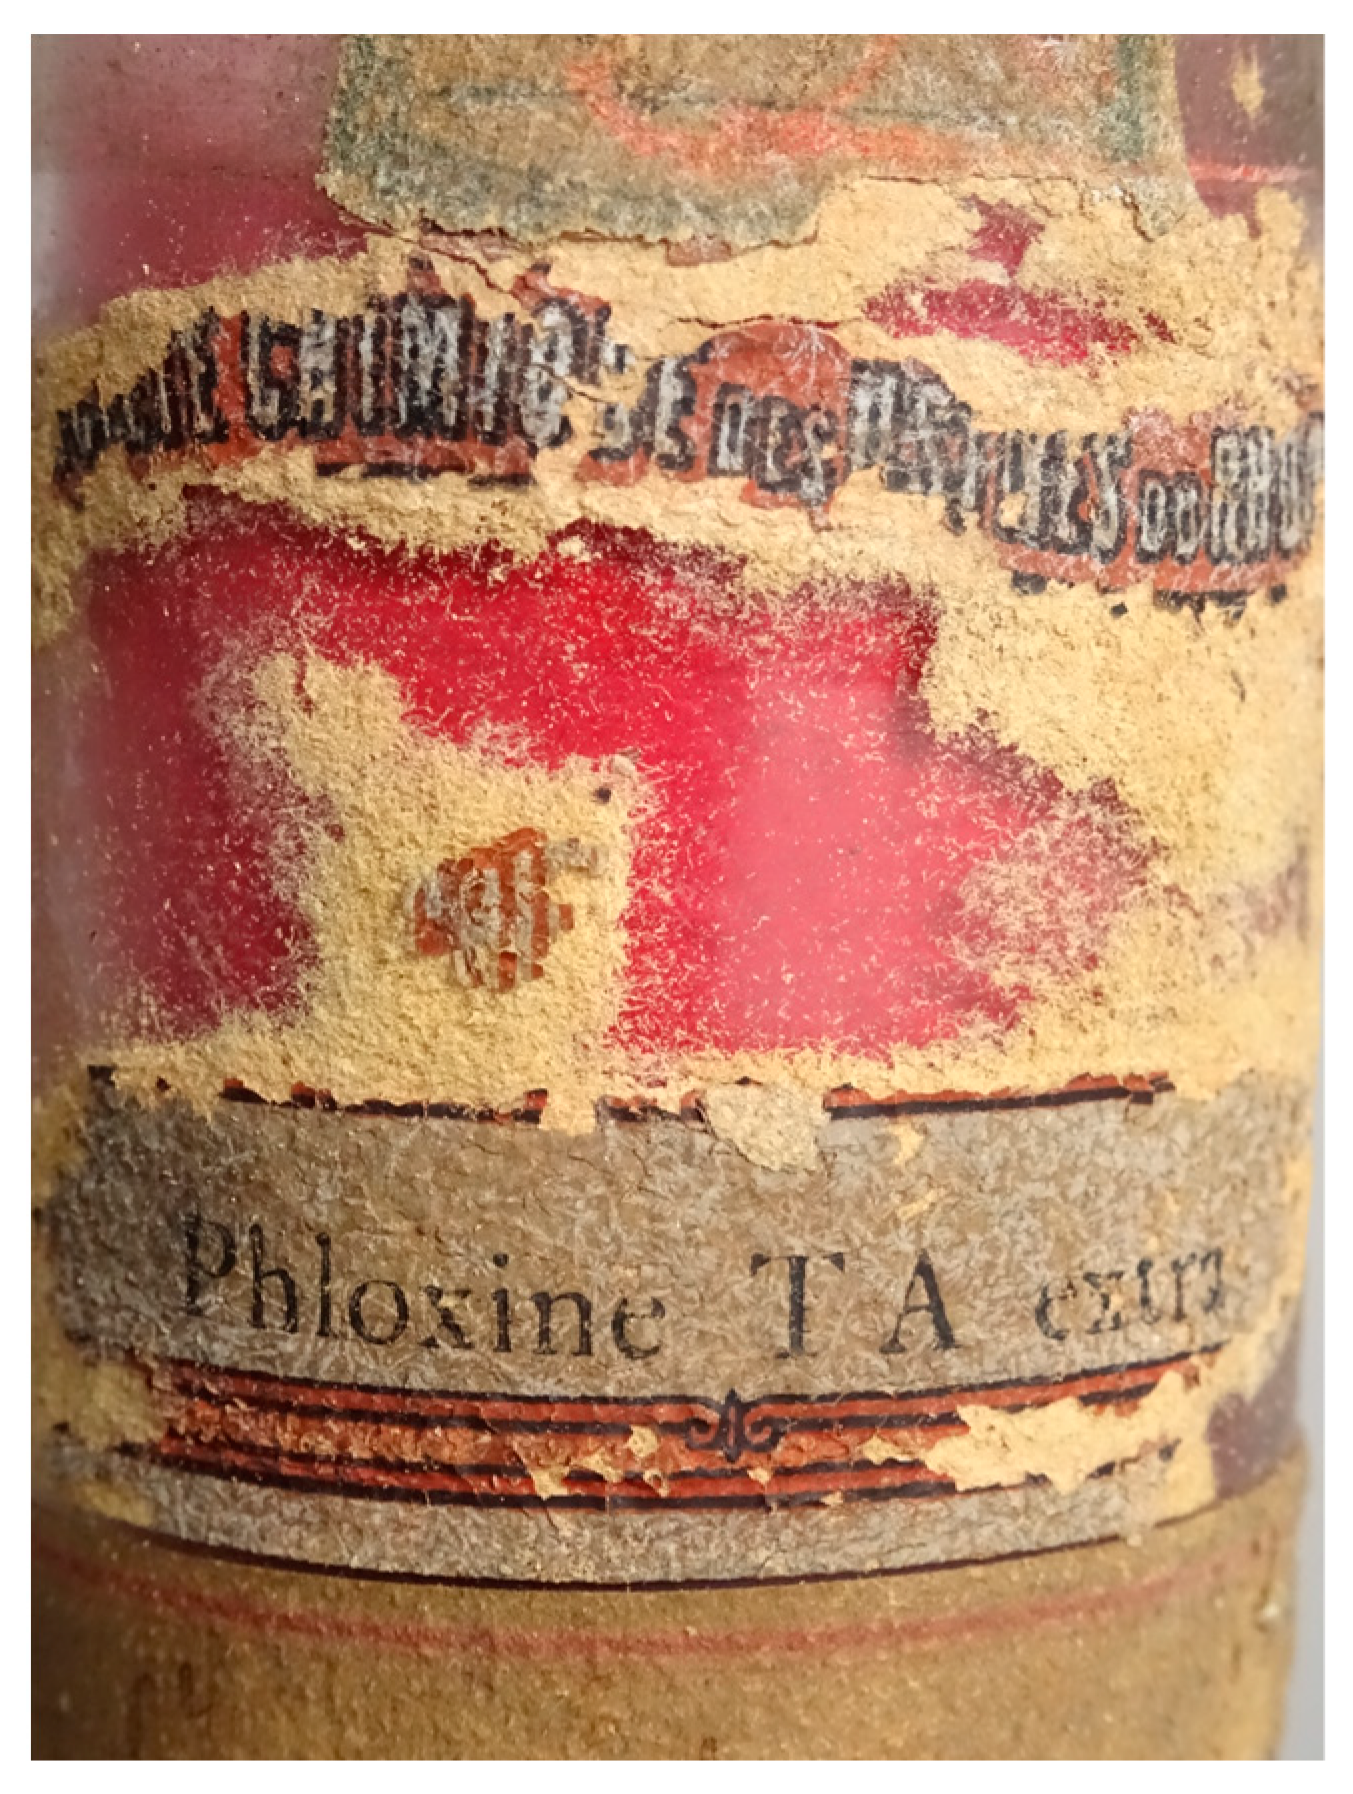
2.2. The Collection and the Analysed Samples
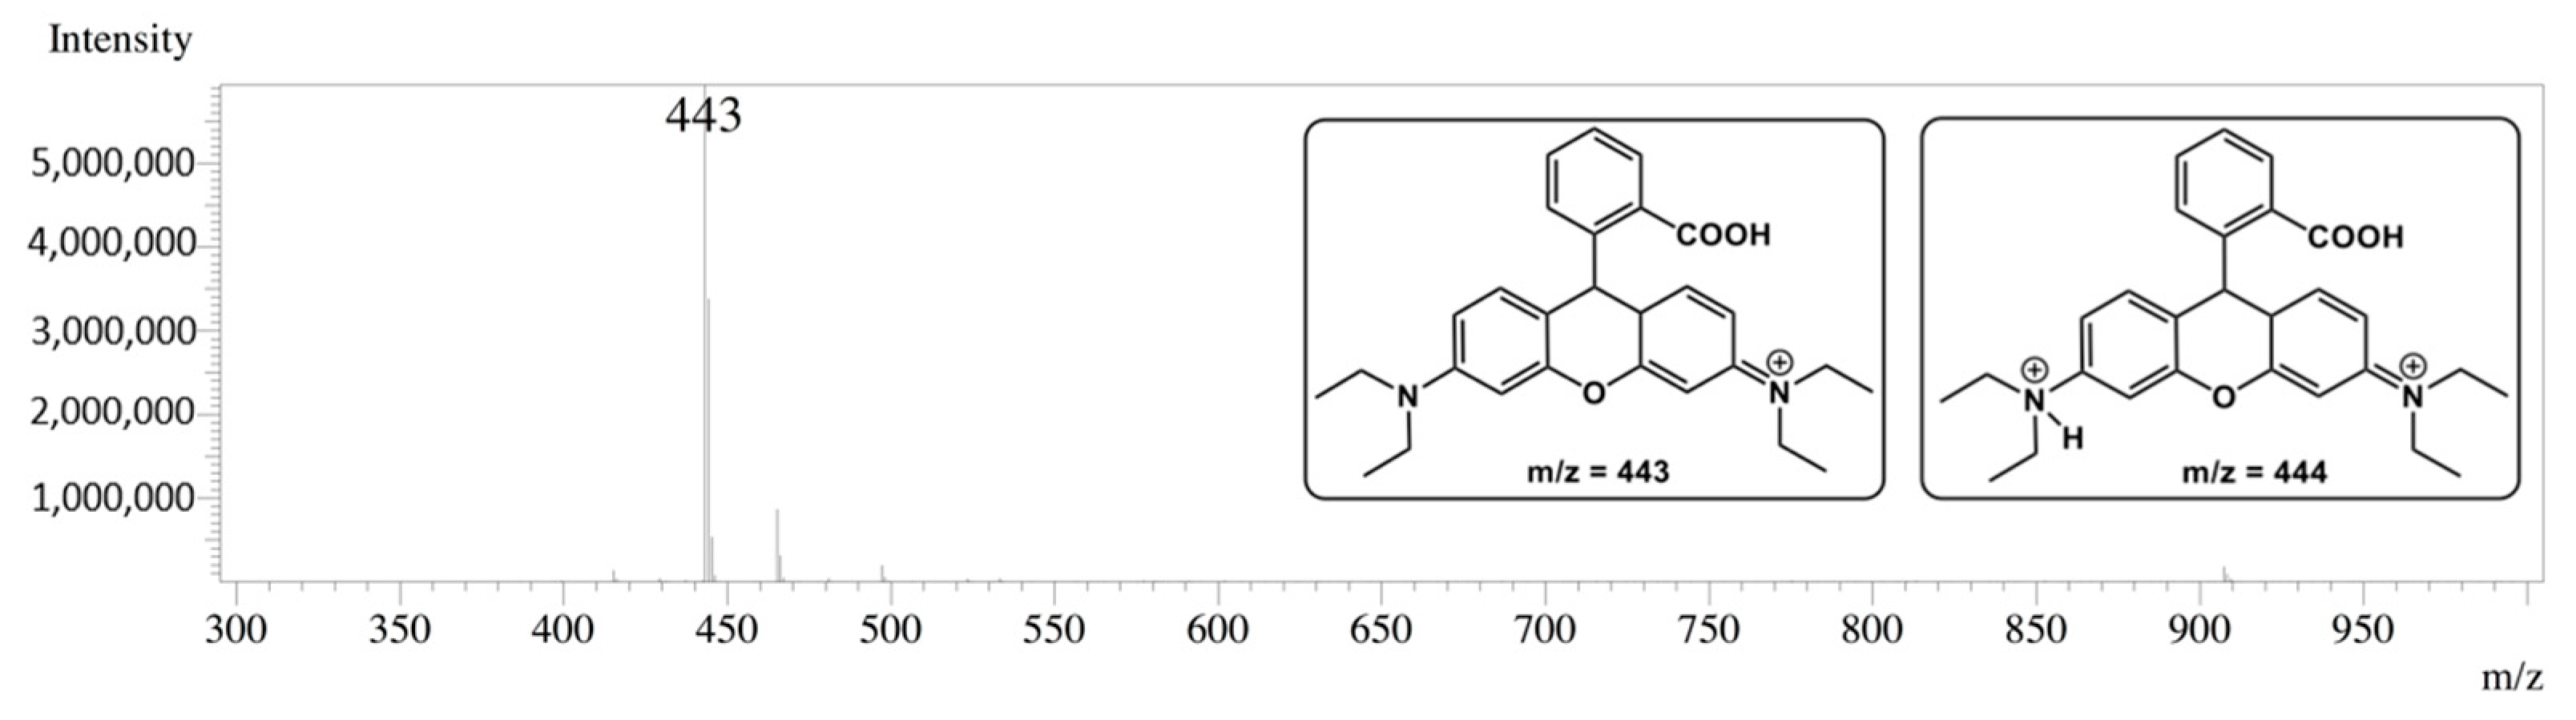
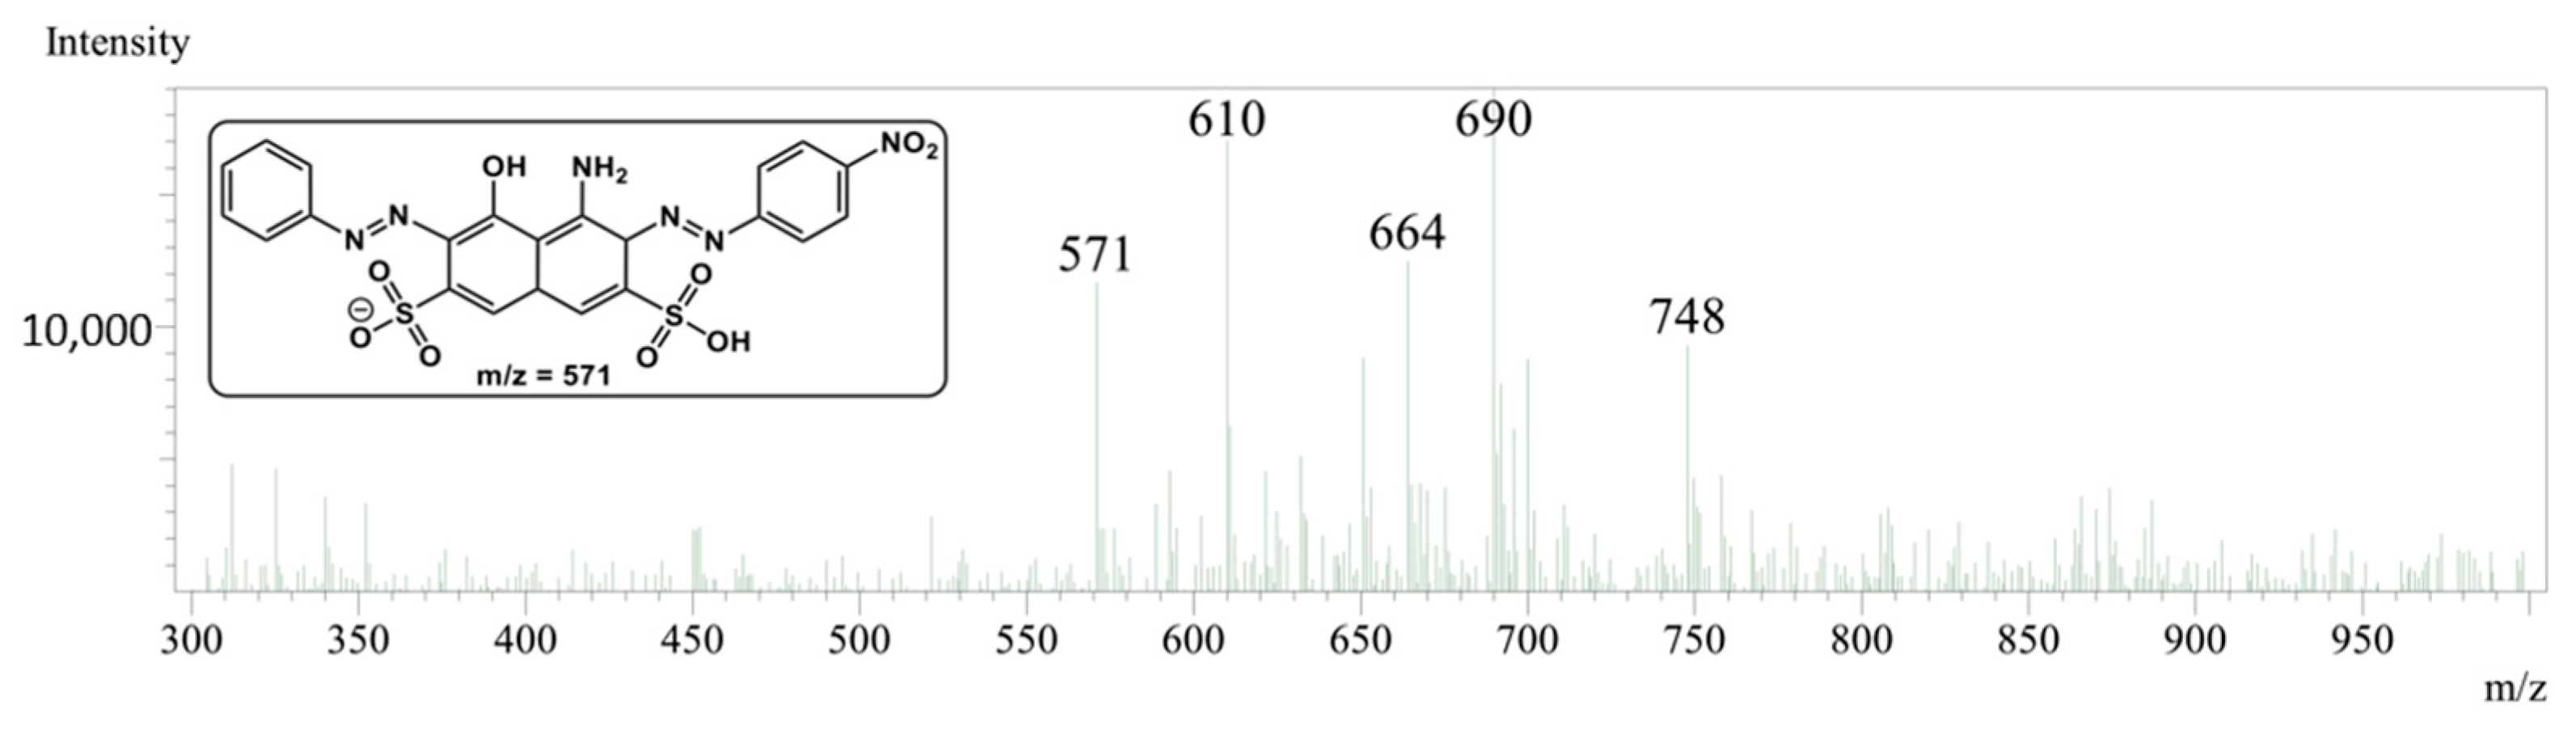
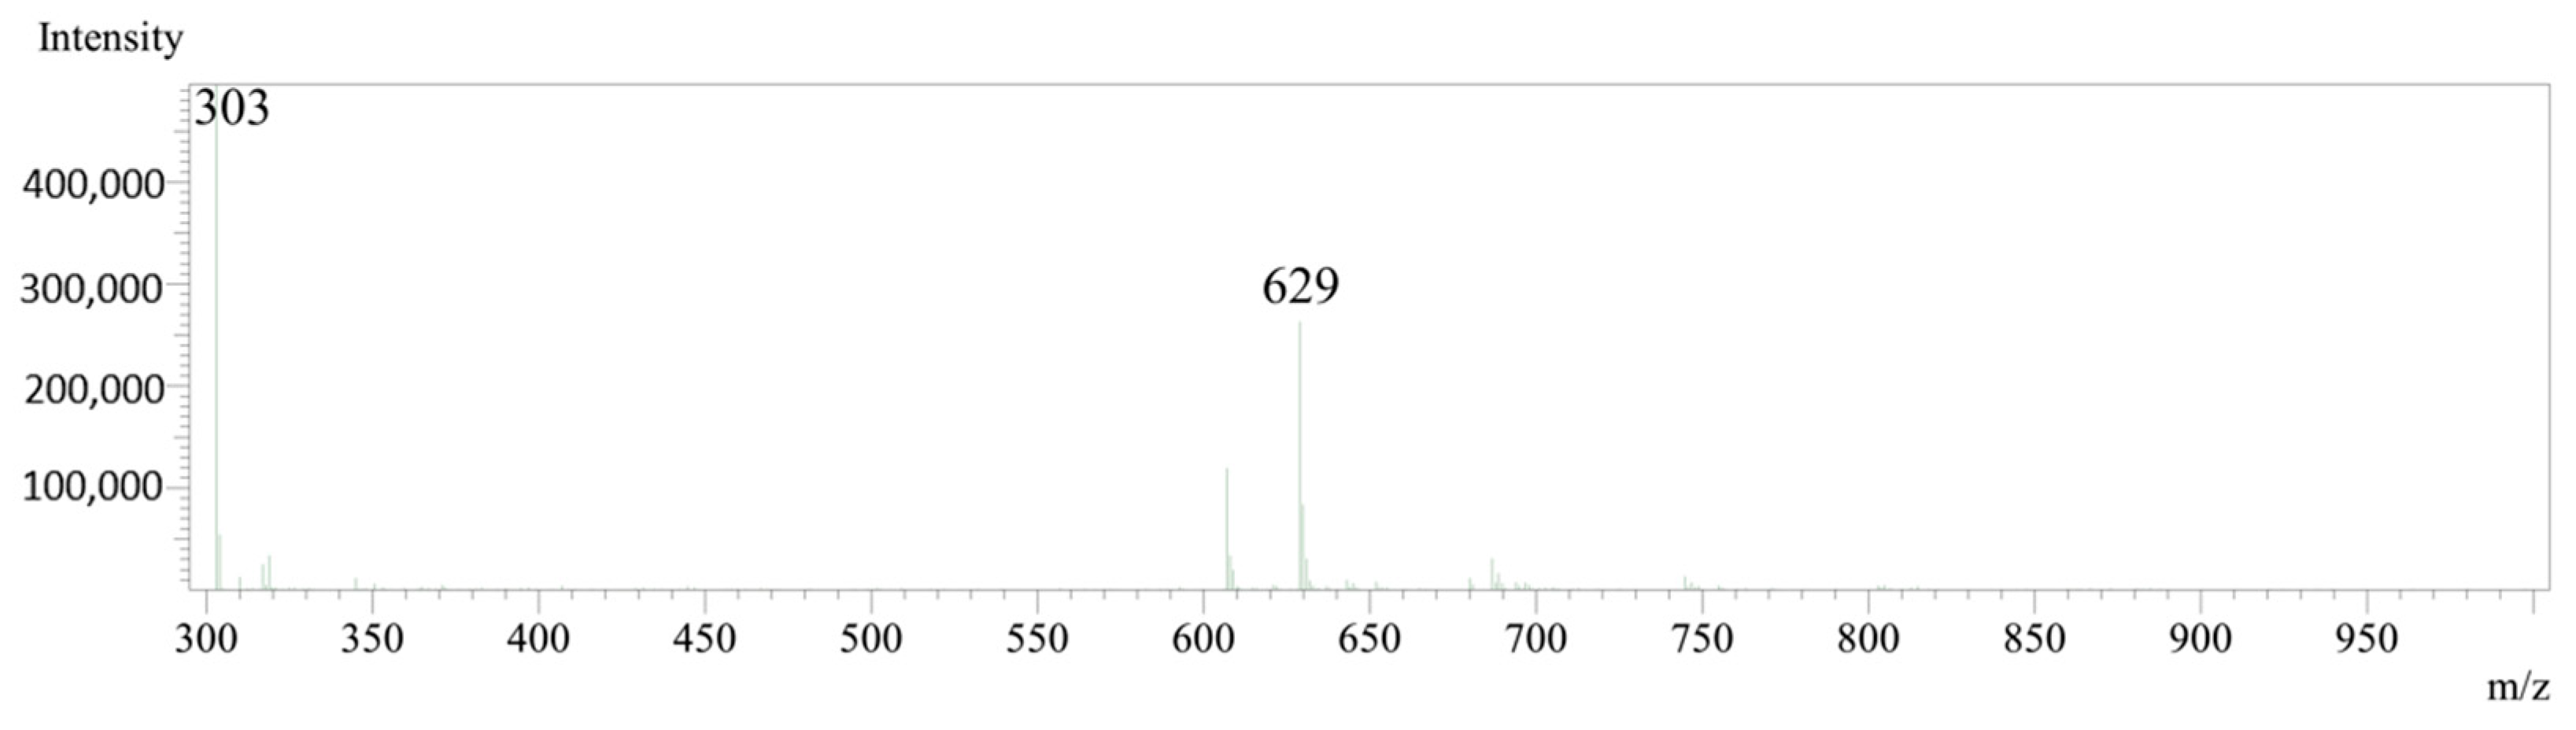
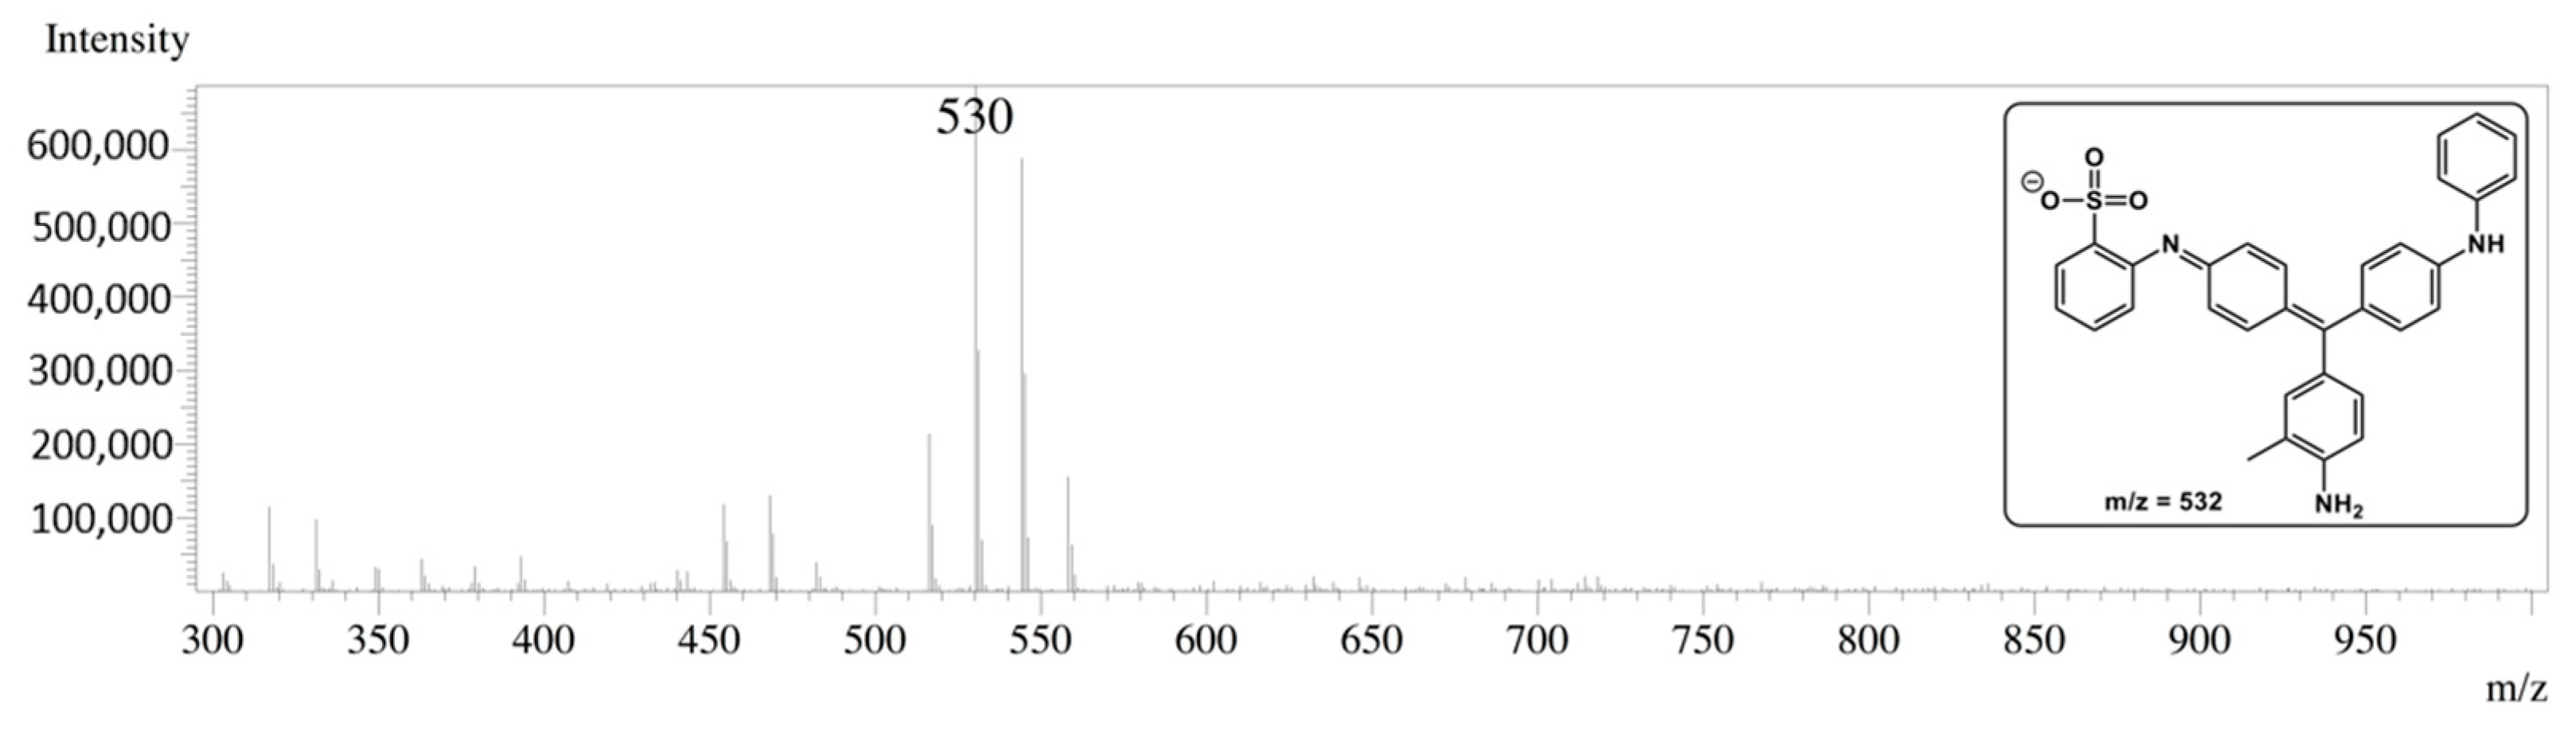
2.2.1. ESI-Mass Spectrometry
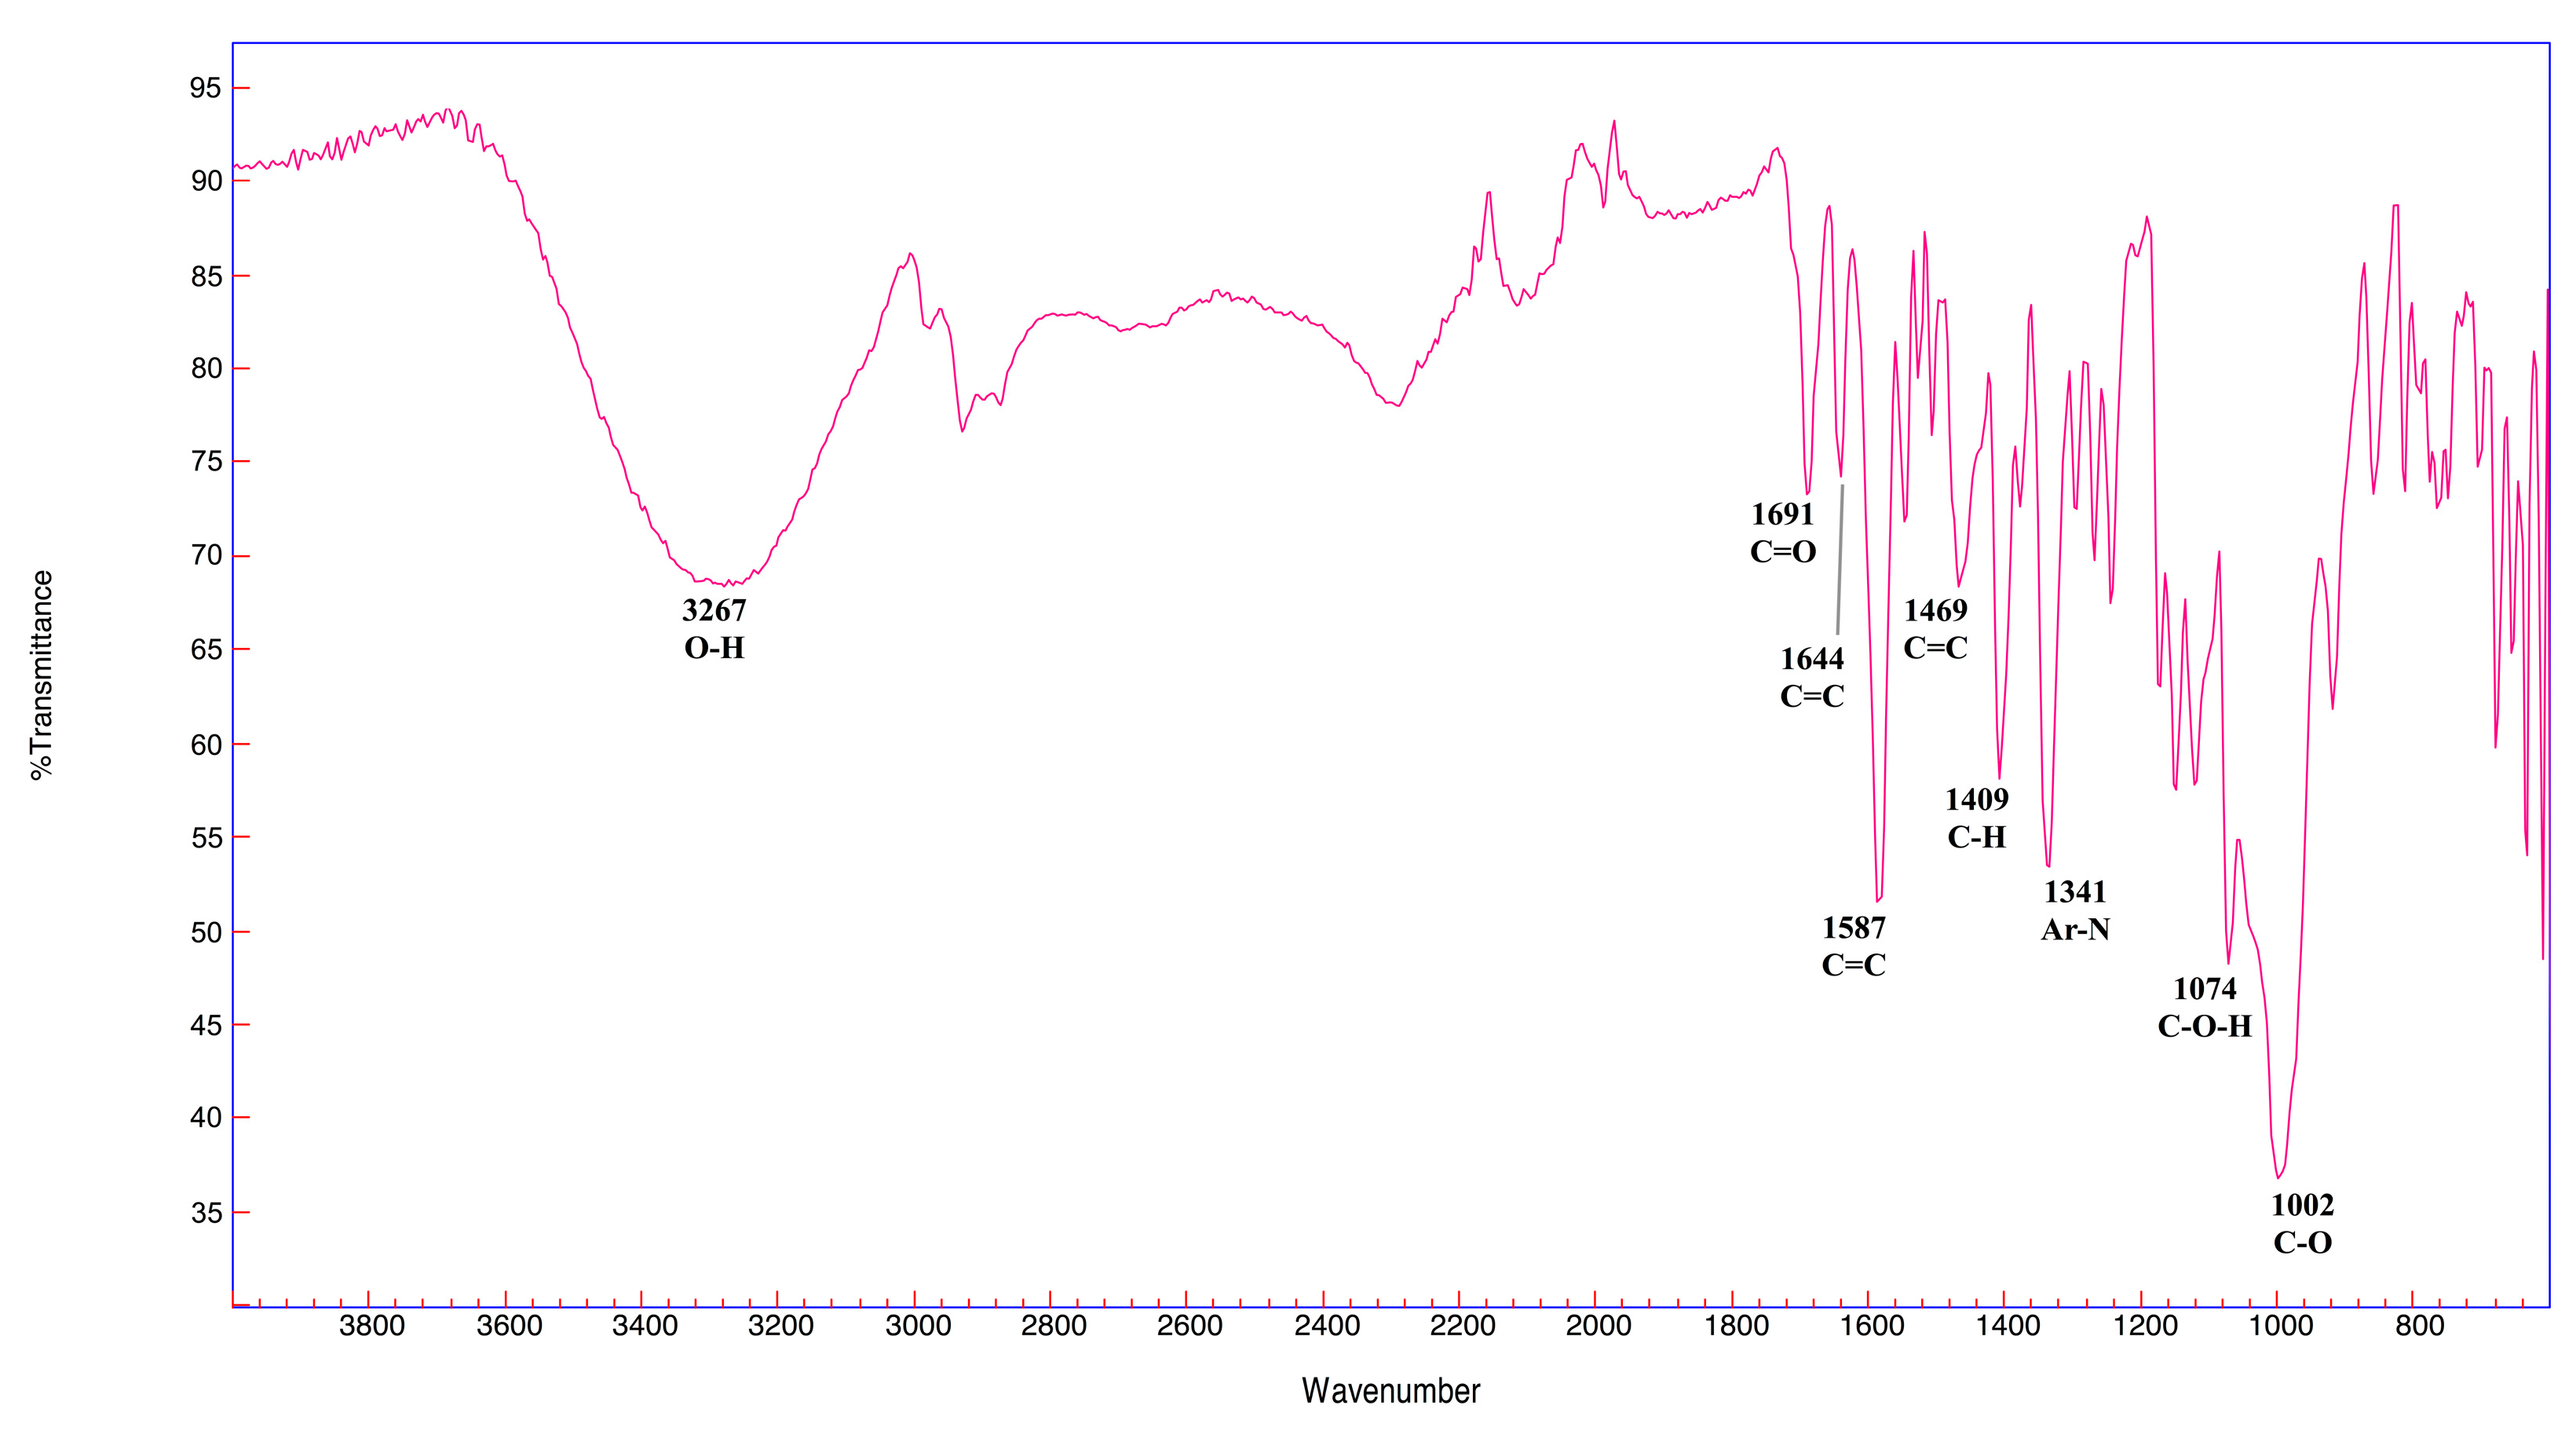
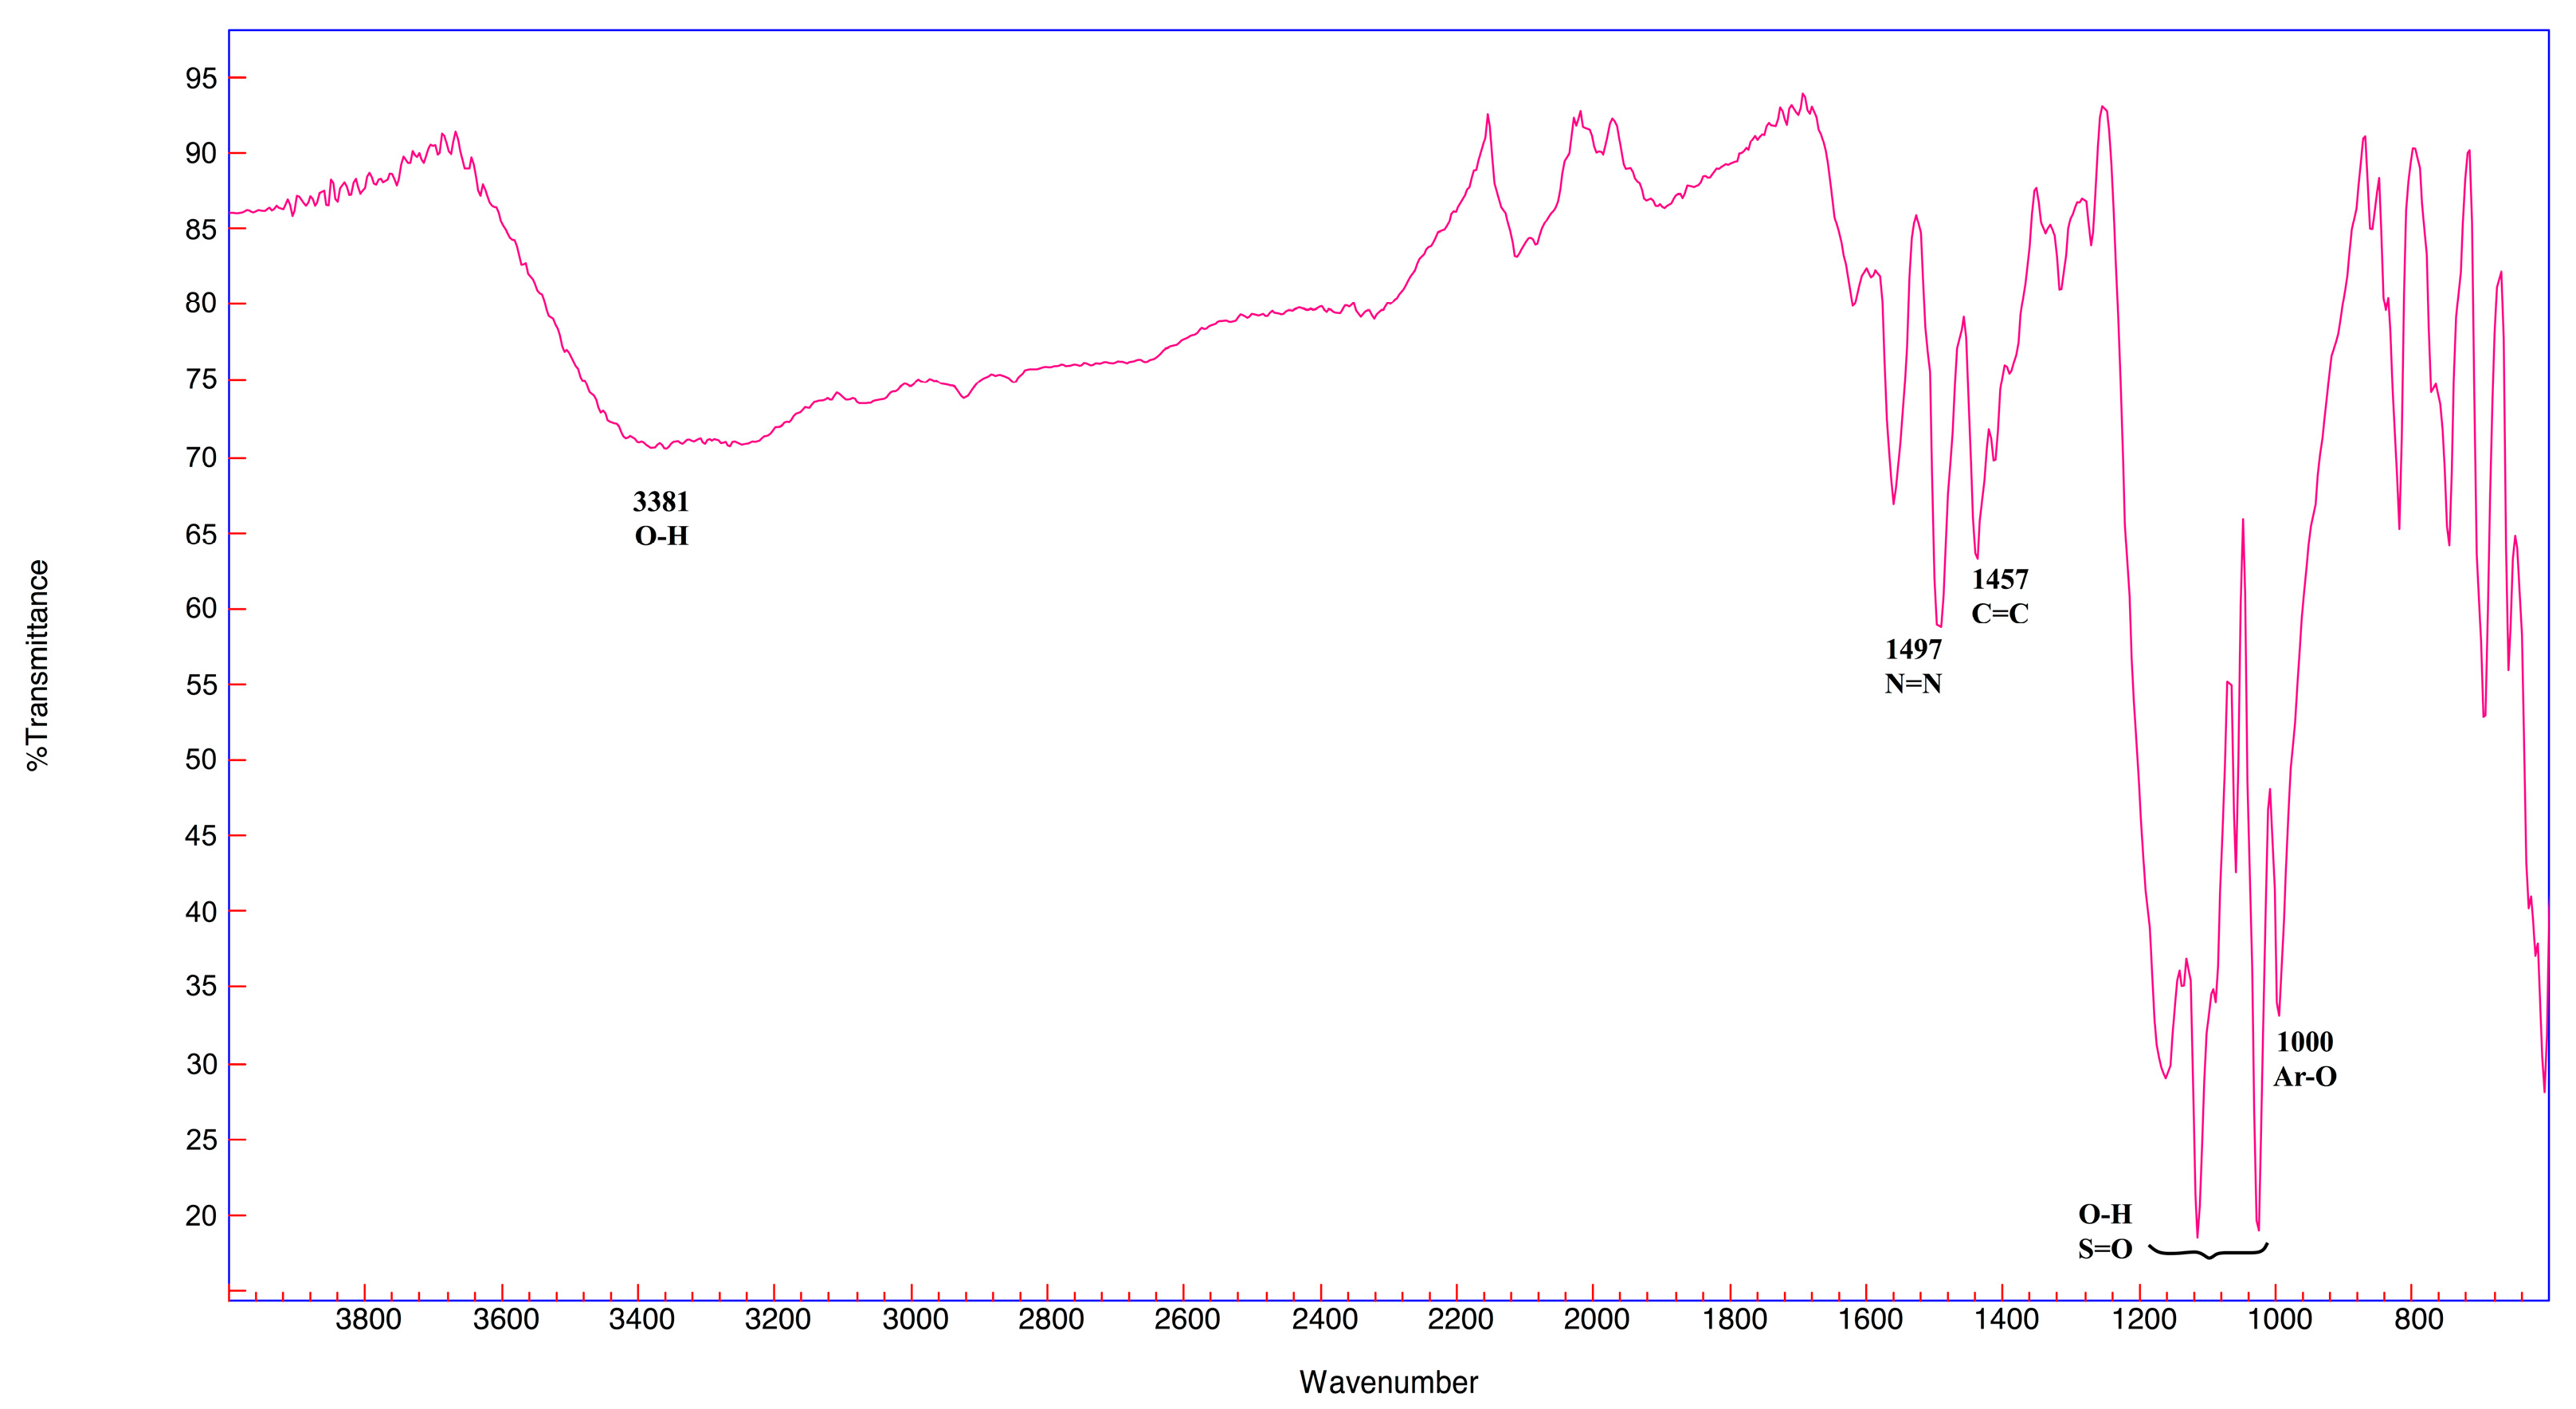
2.2.2. FTIR Spectroscopy
3. Analytical Results
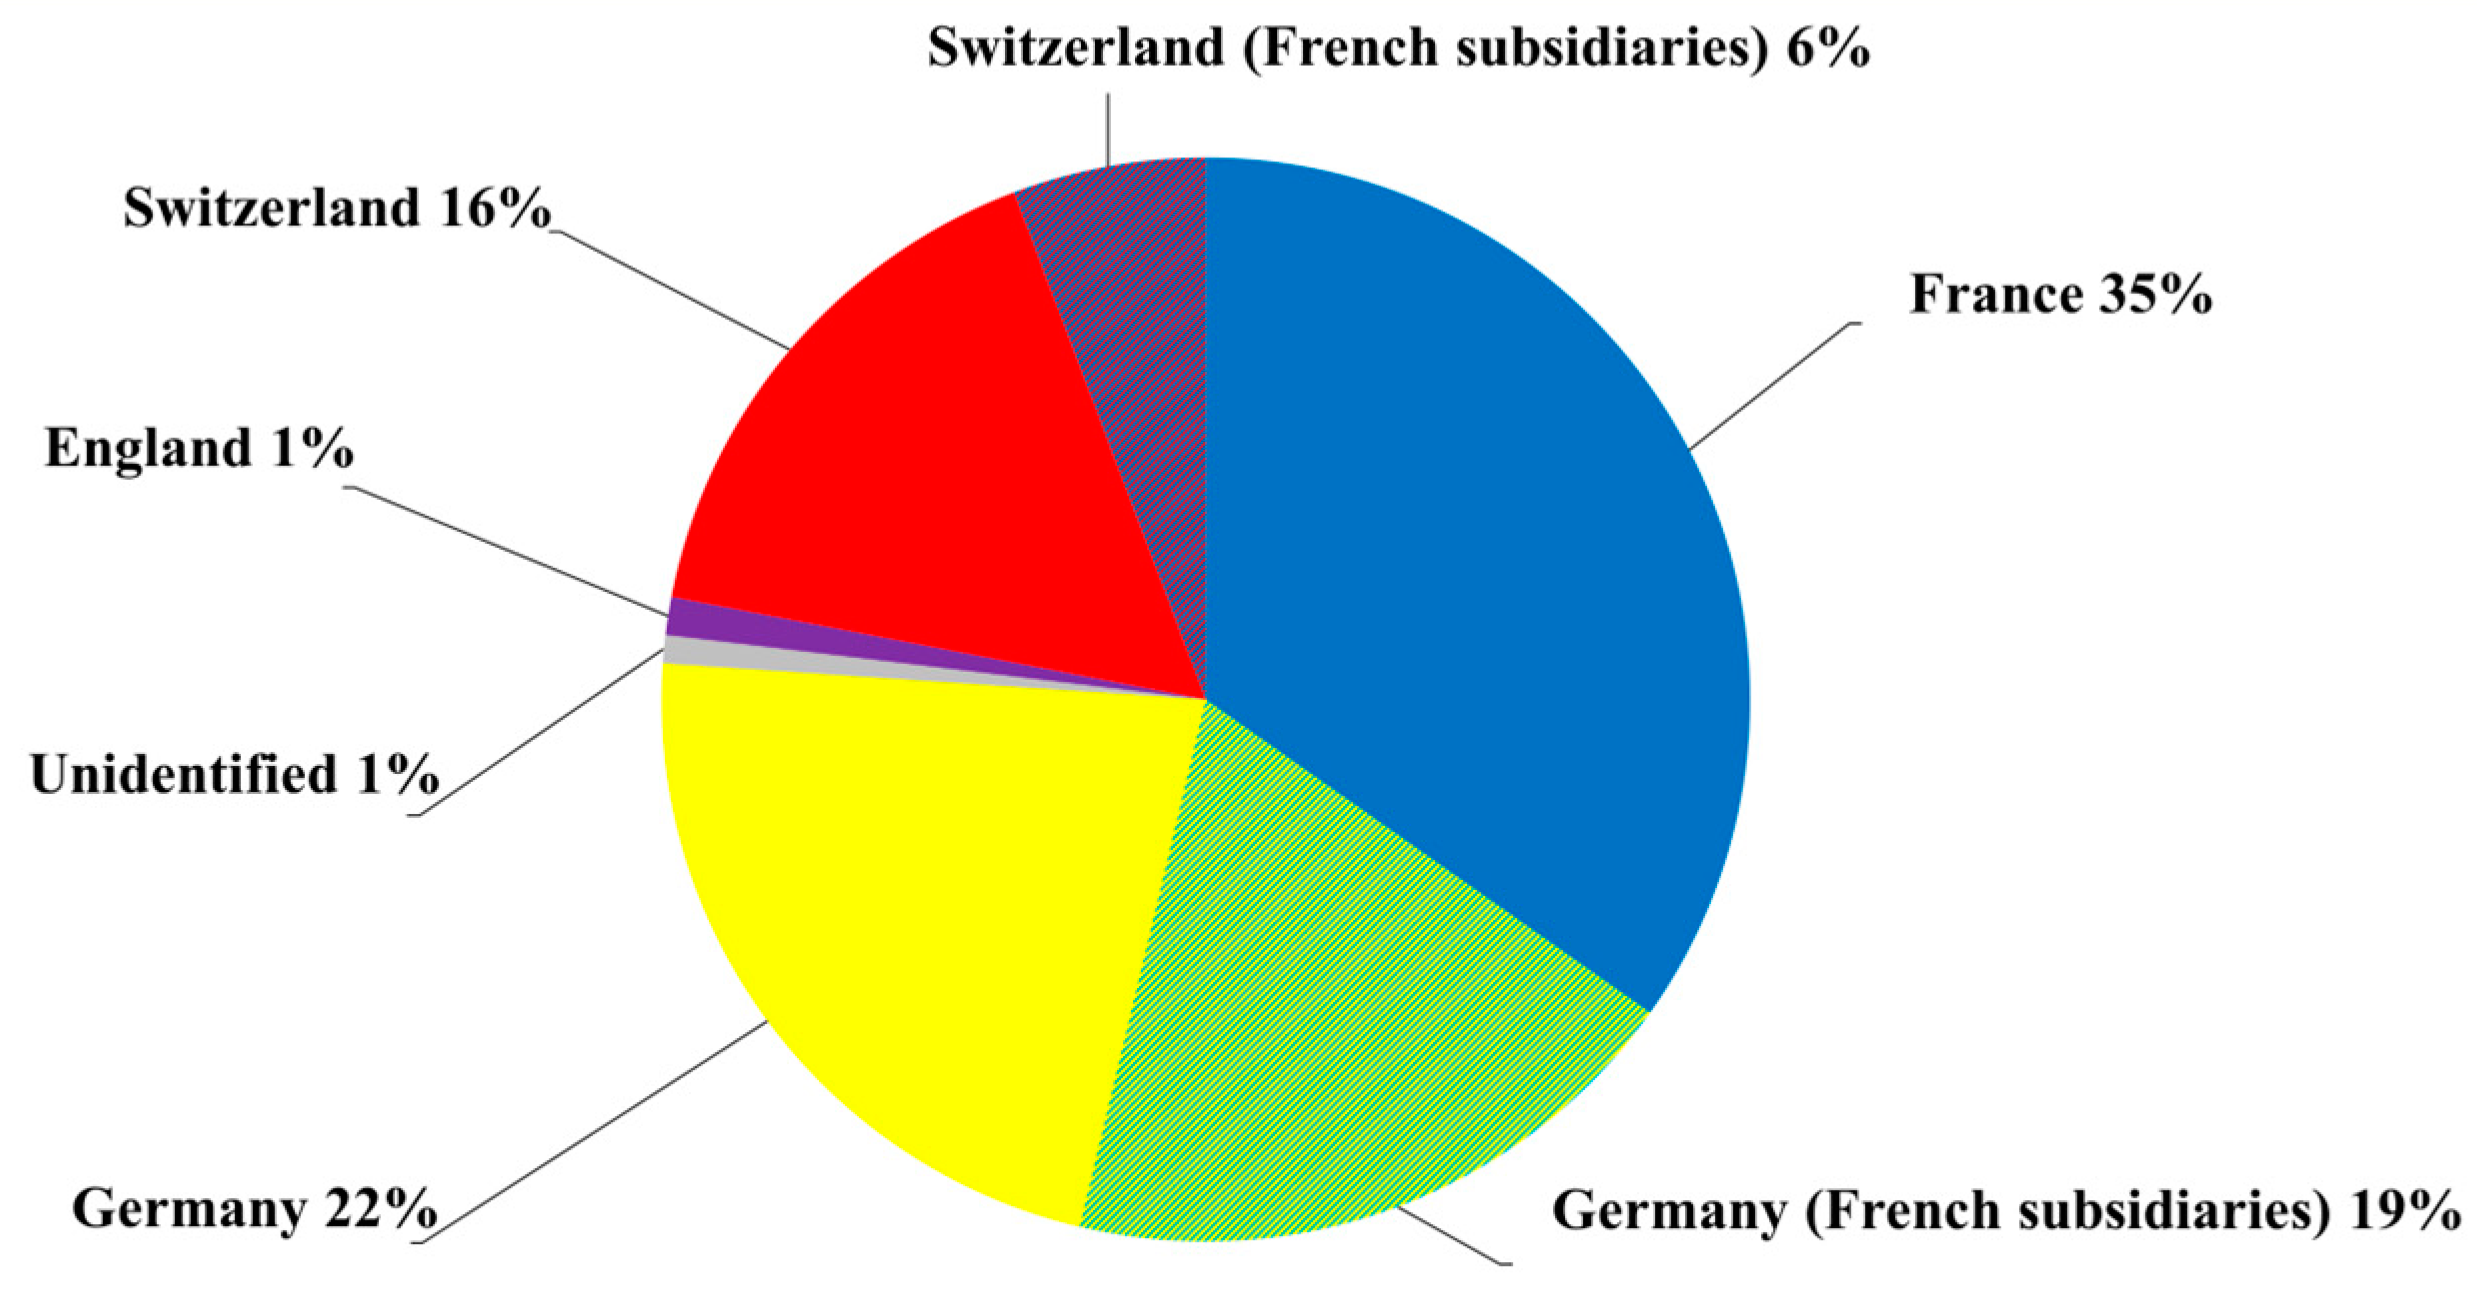
3.1. The Collection
3.2. The Analytical Data
3.2.1. Xanthene Dyes
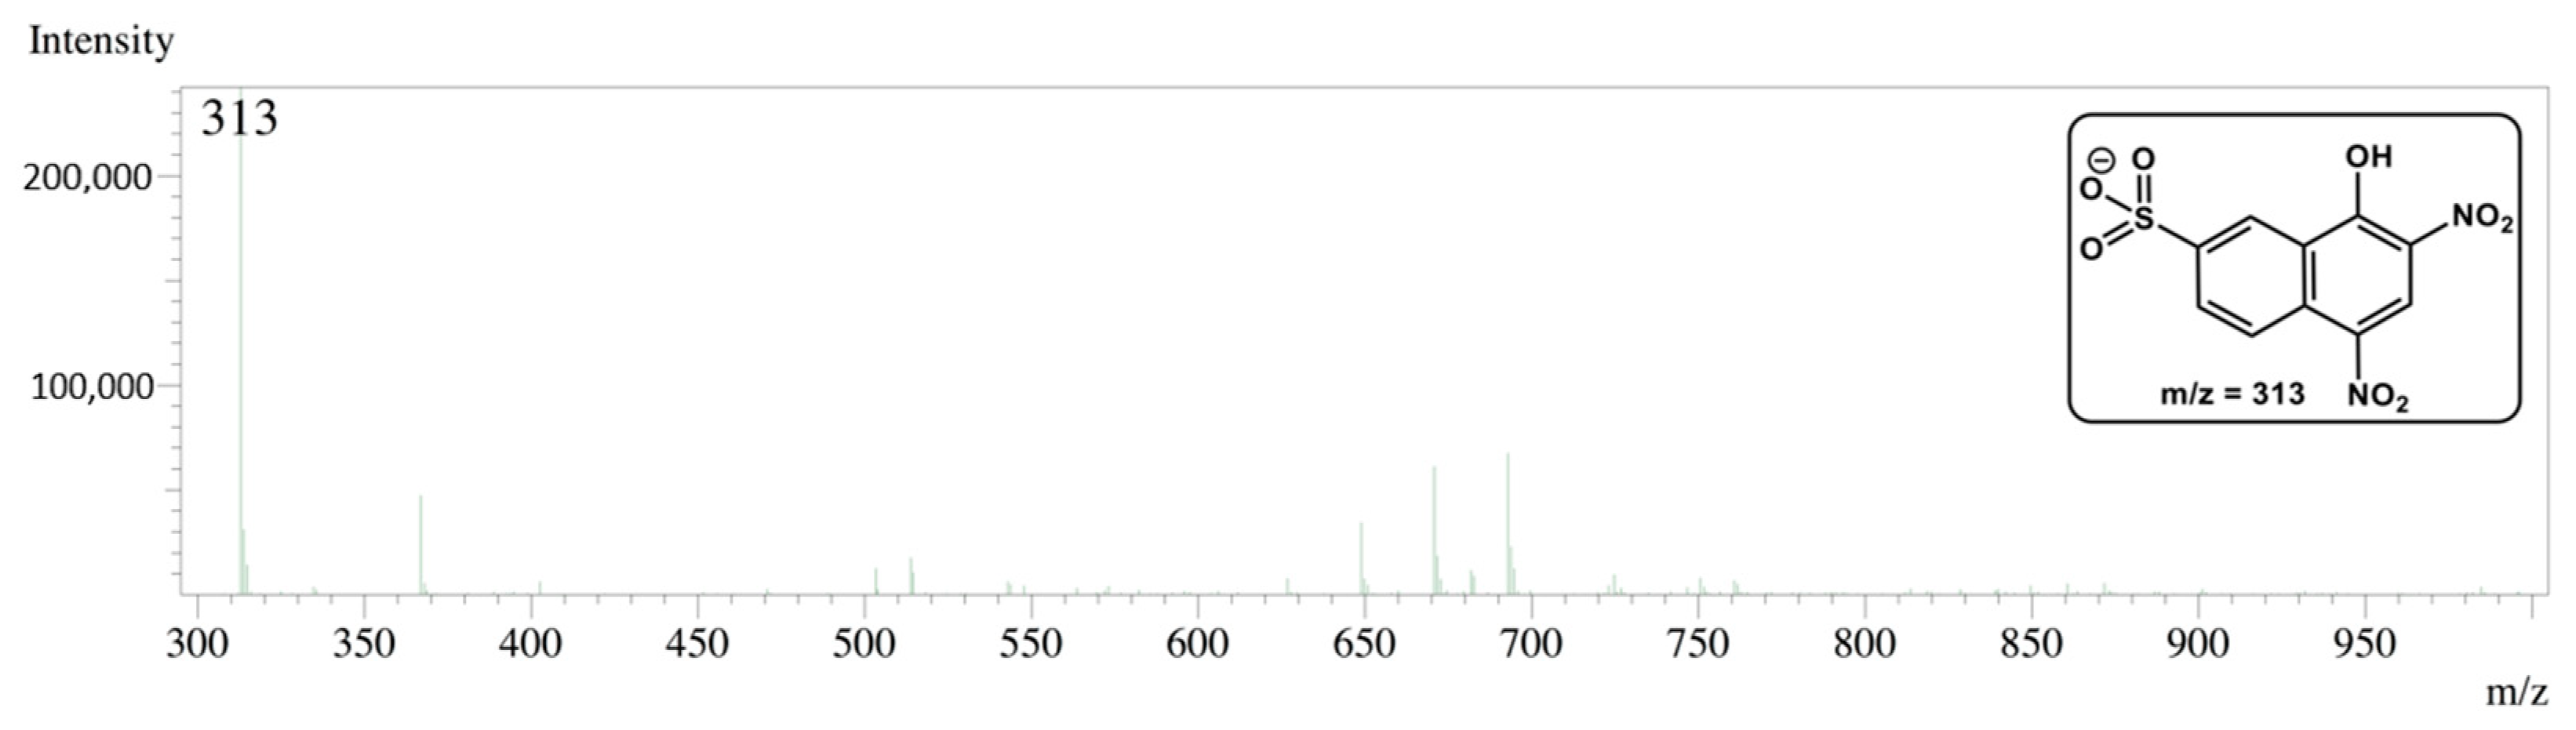
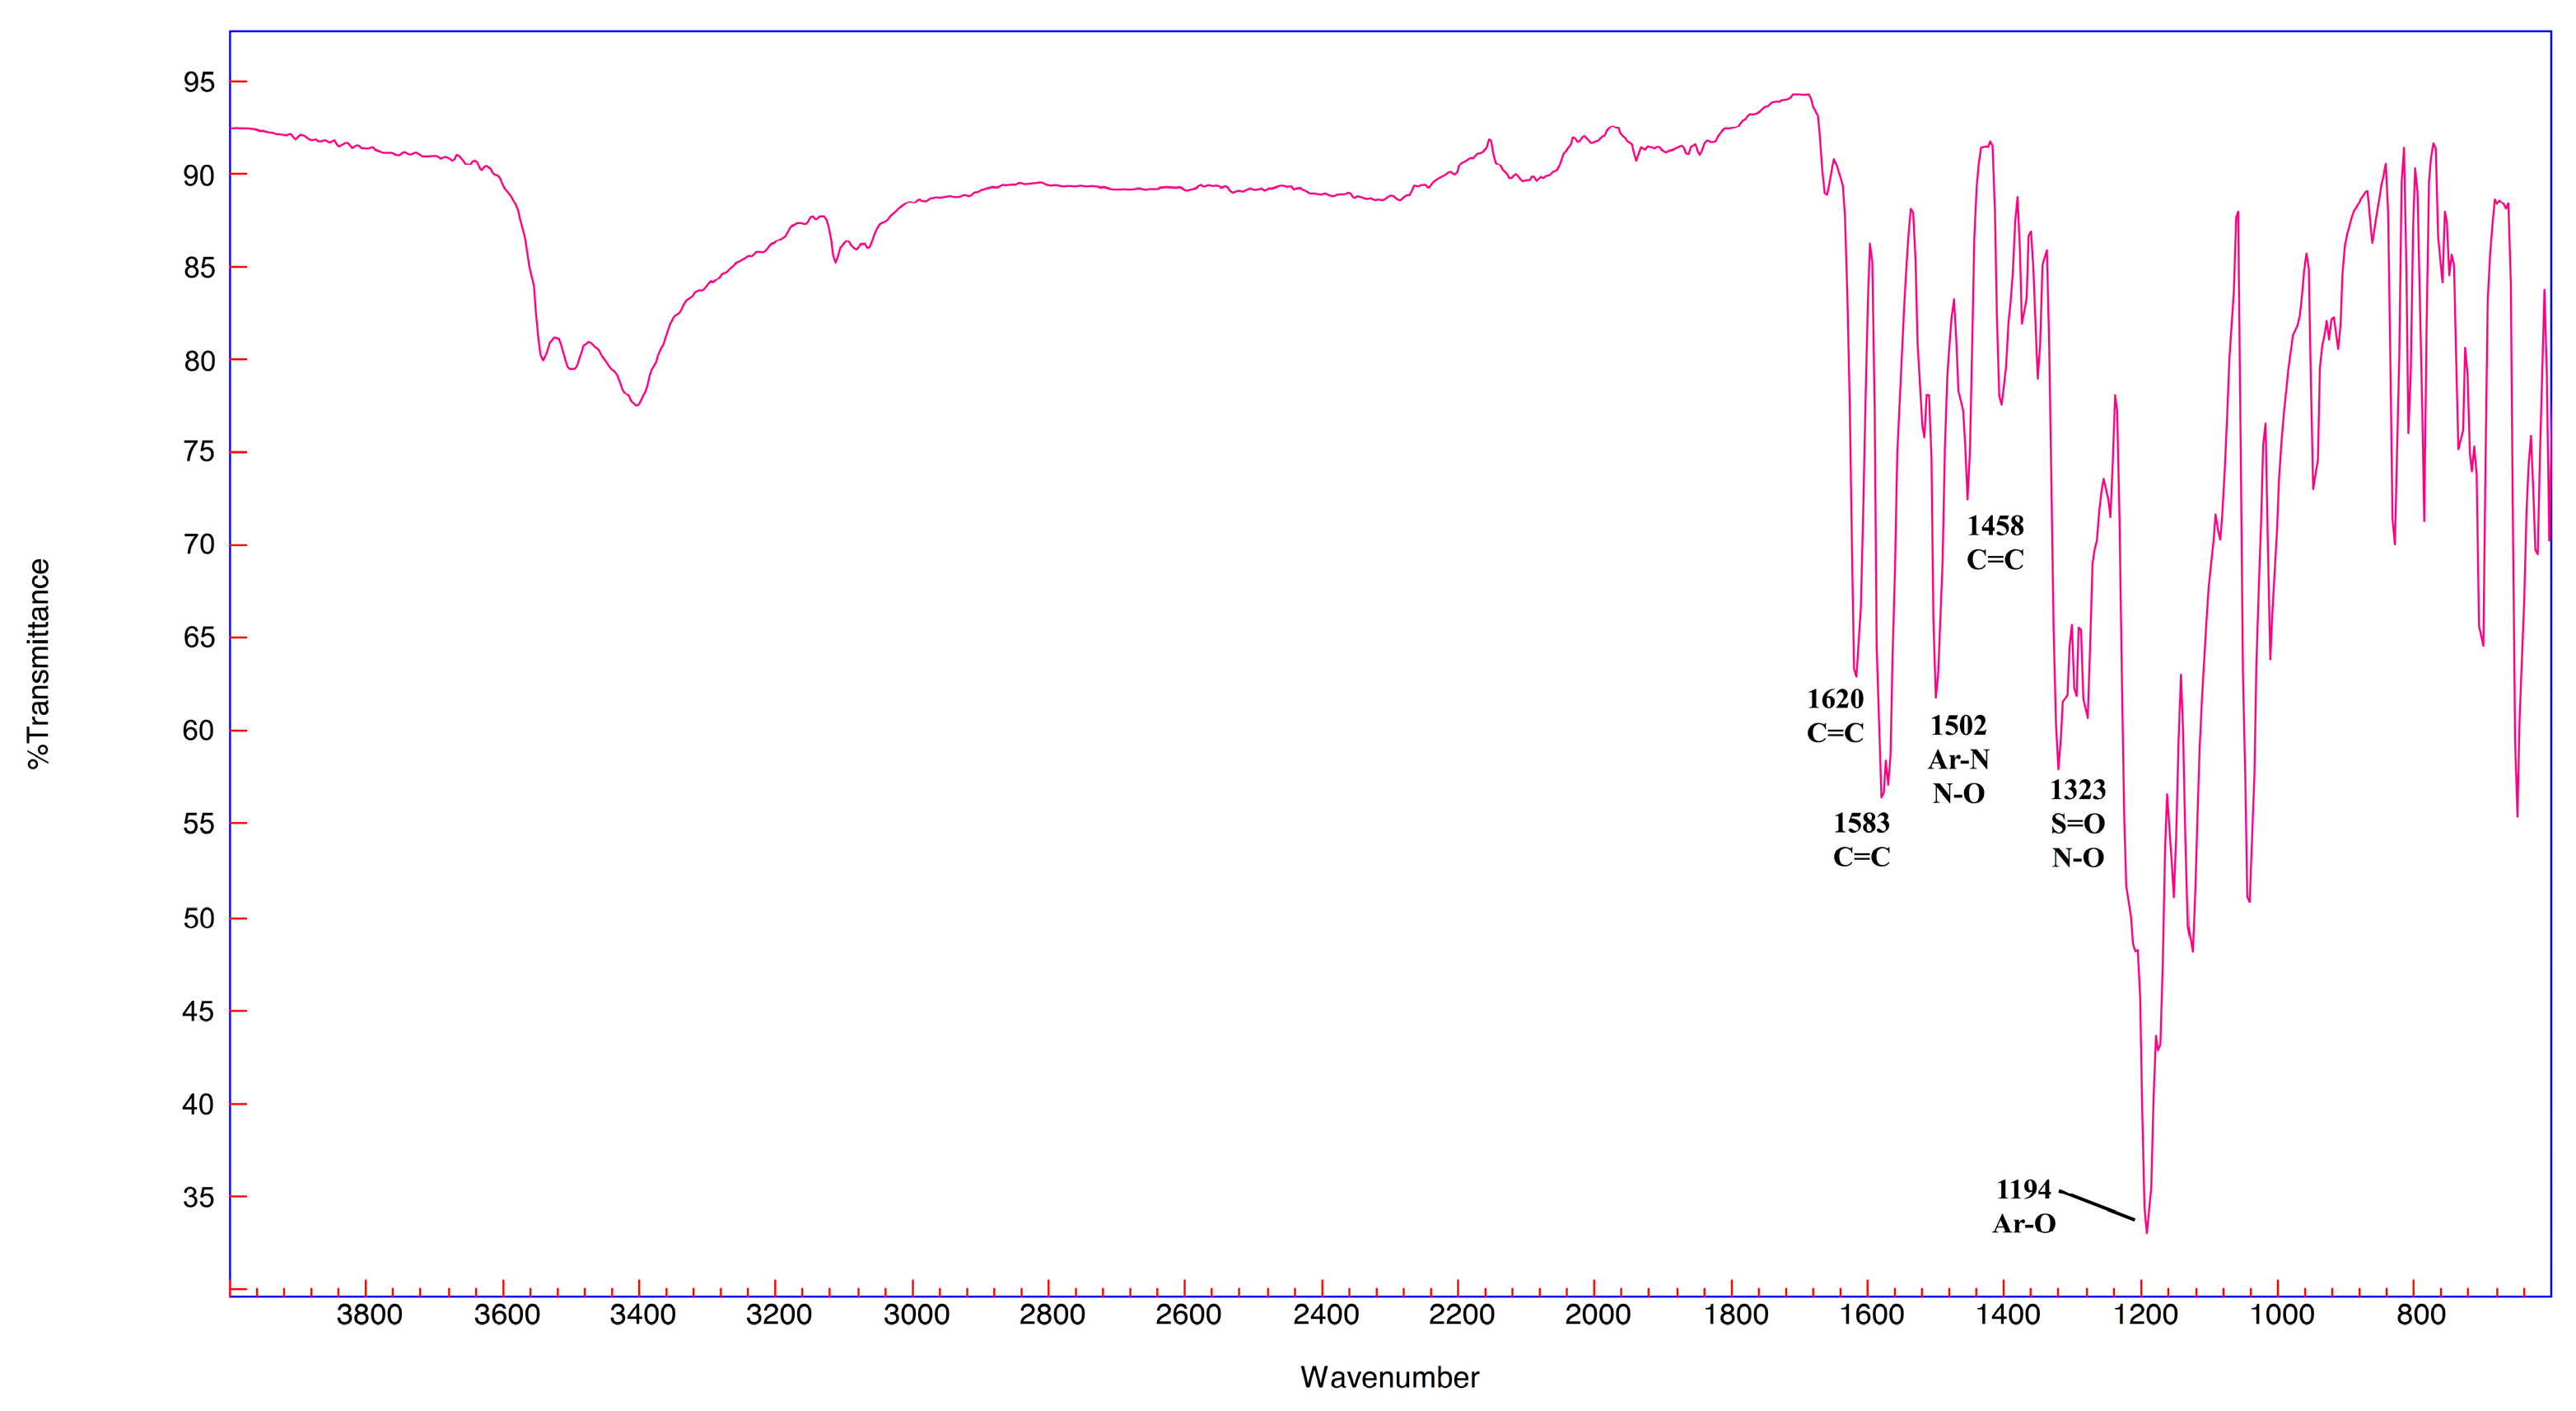
3.2.2. Nitro Dyes
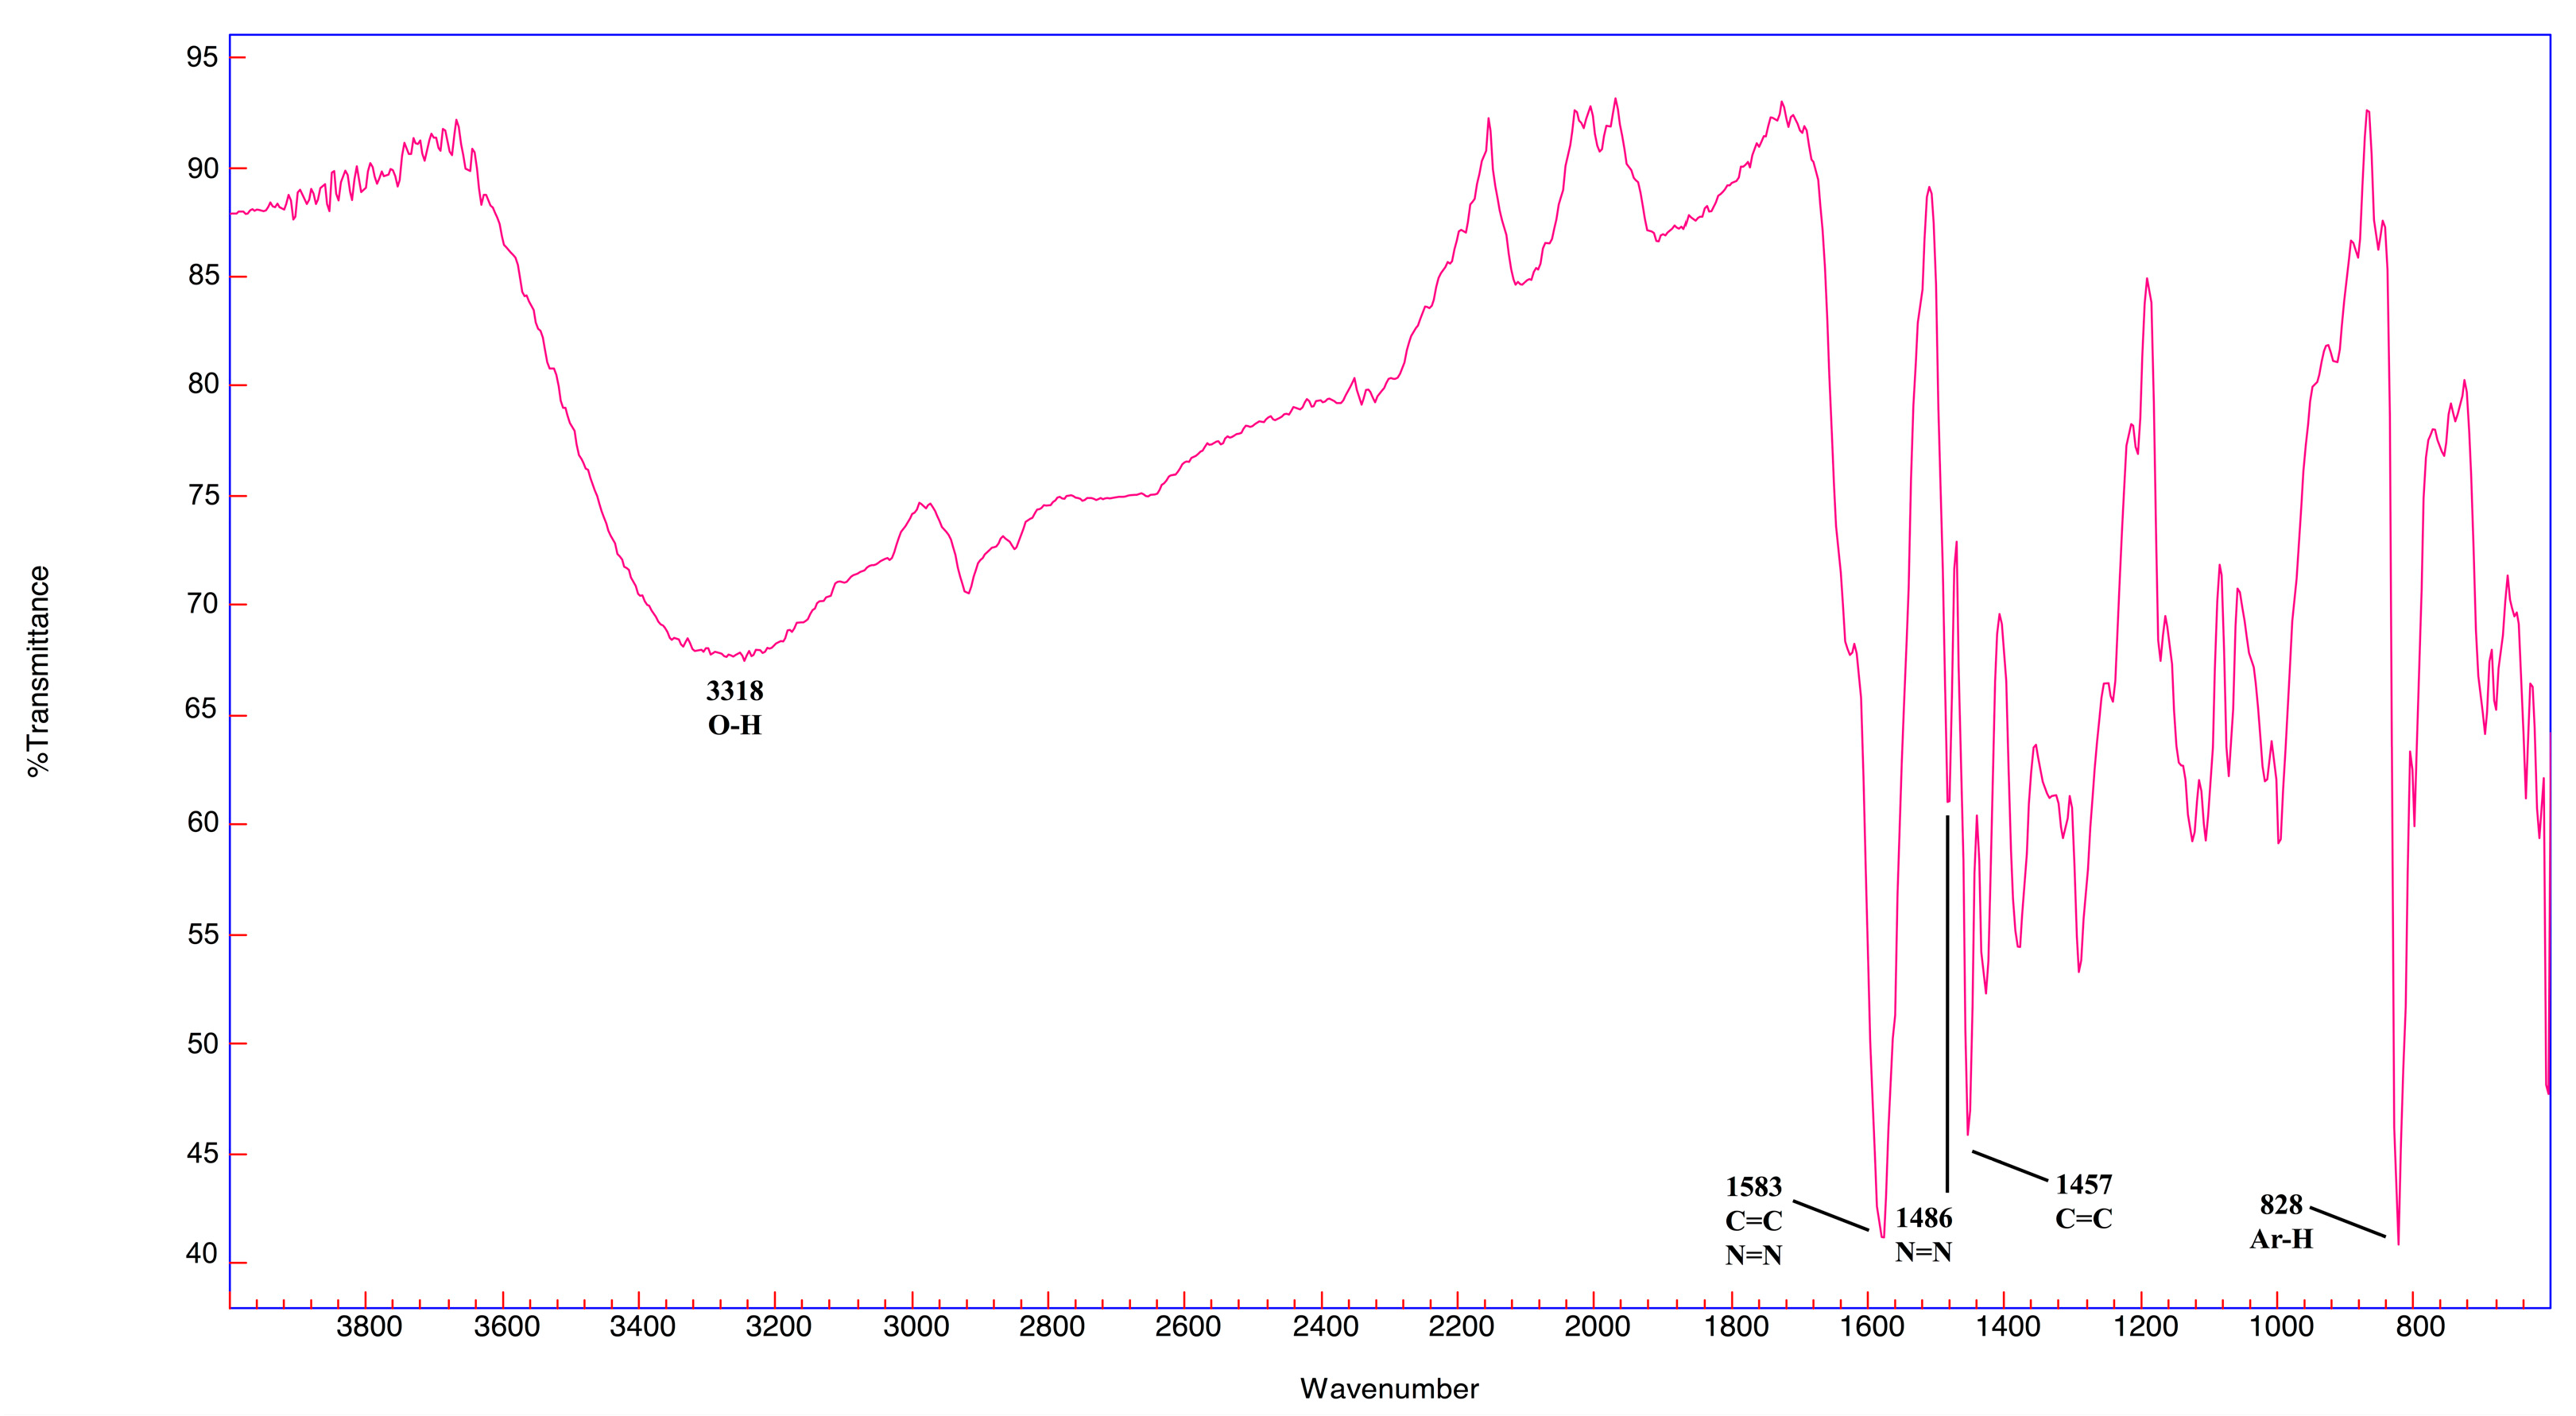
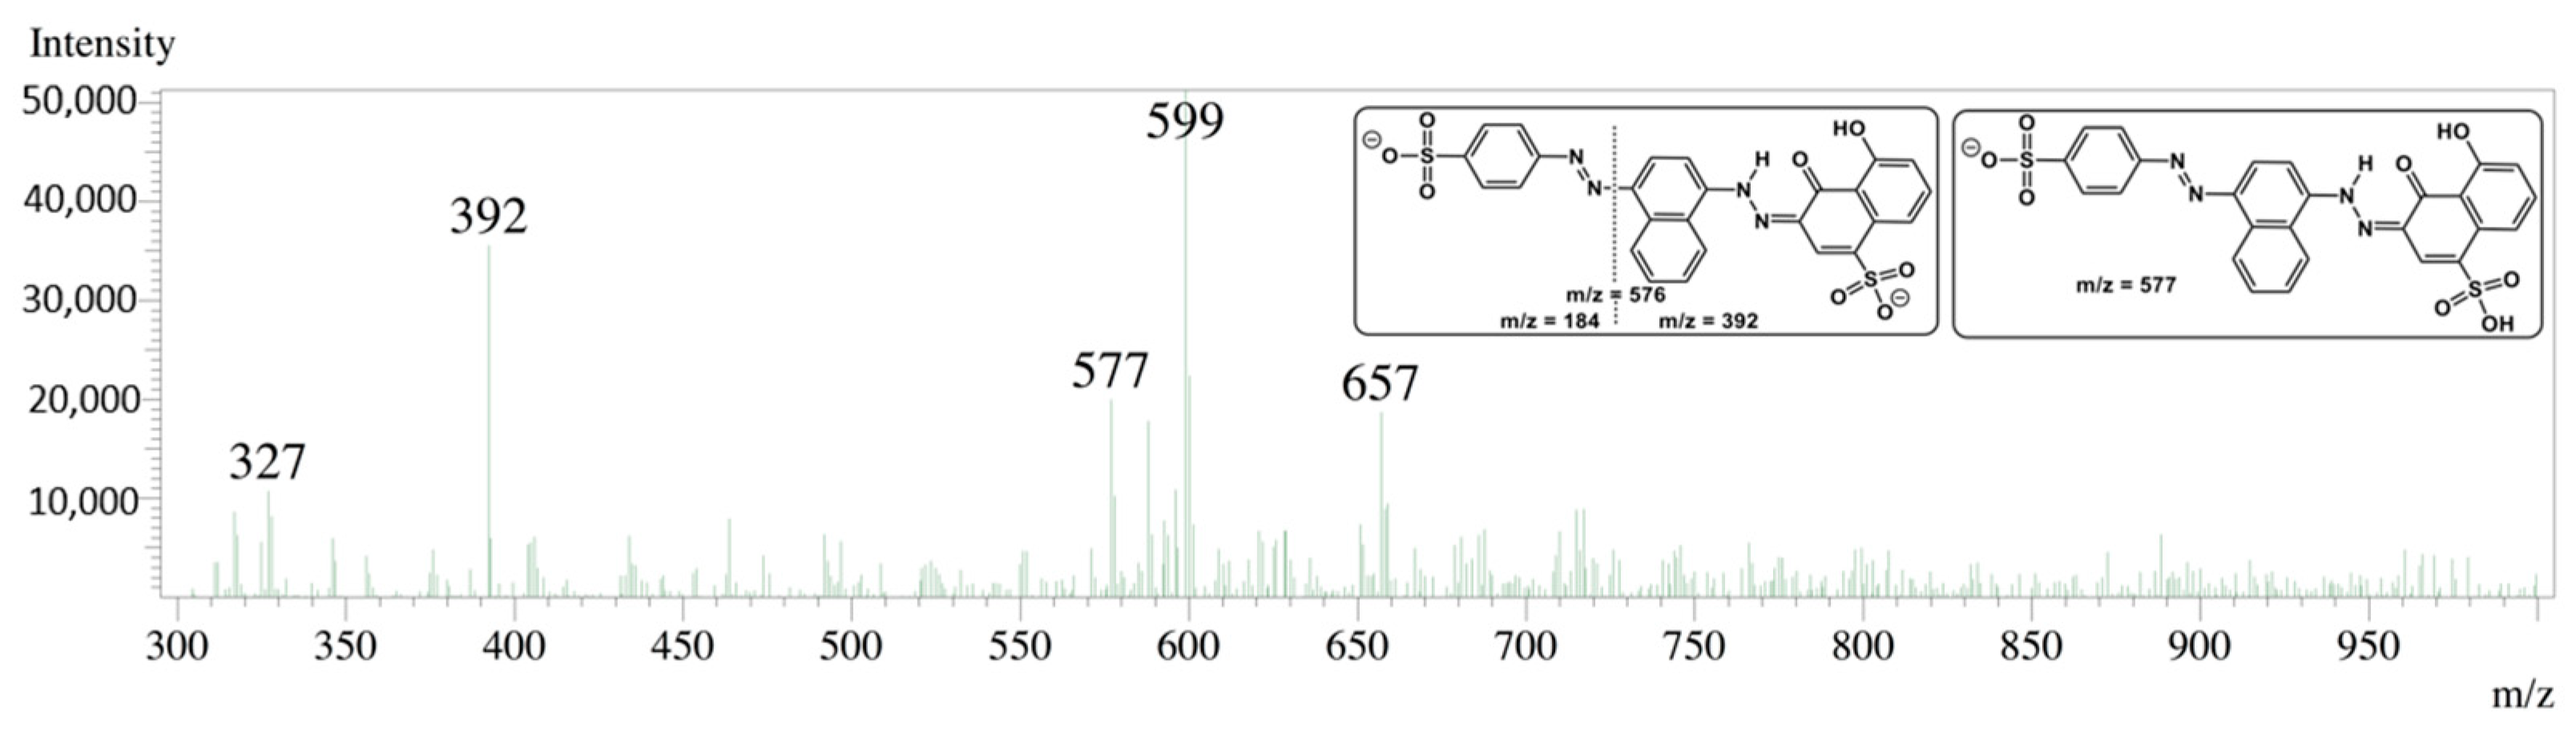
3.2.3. Azo Dyes
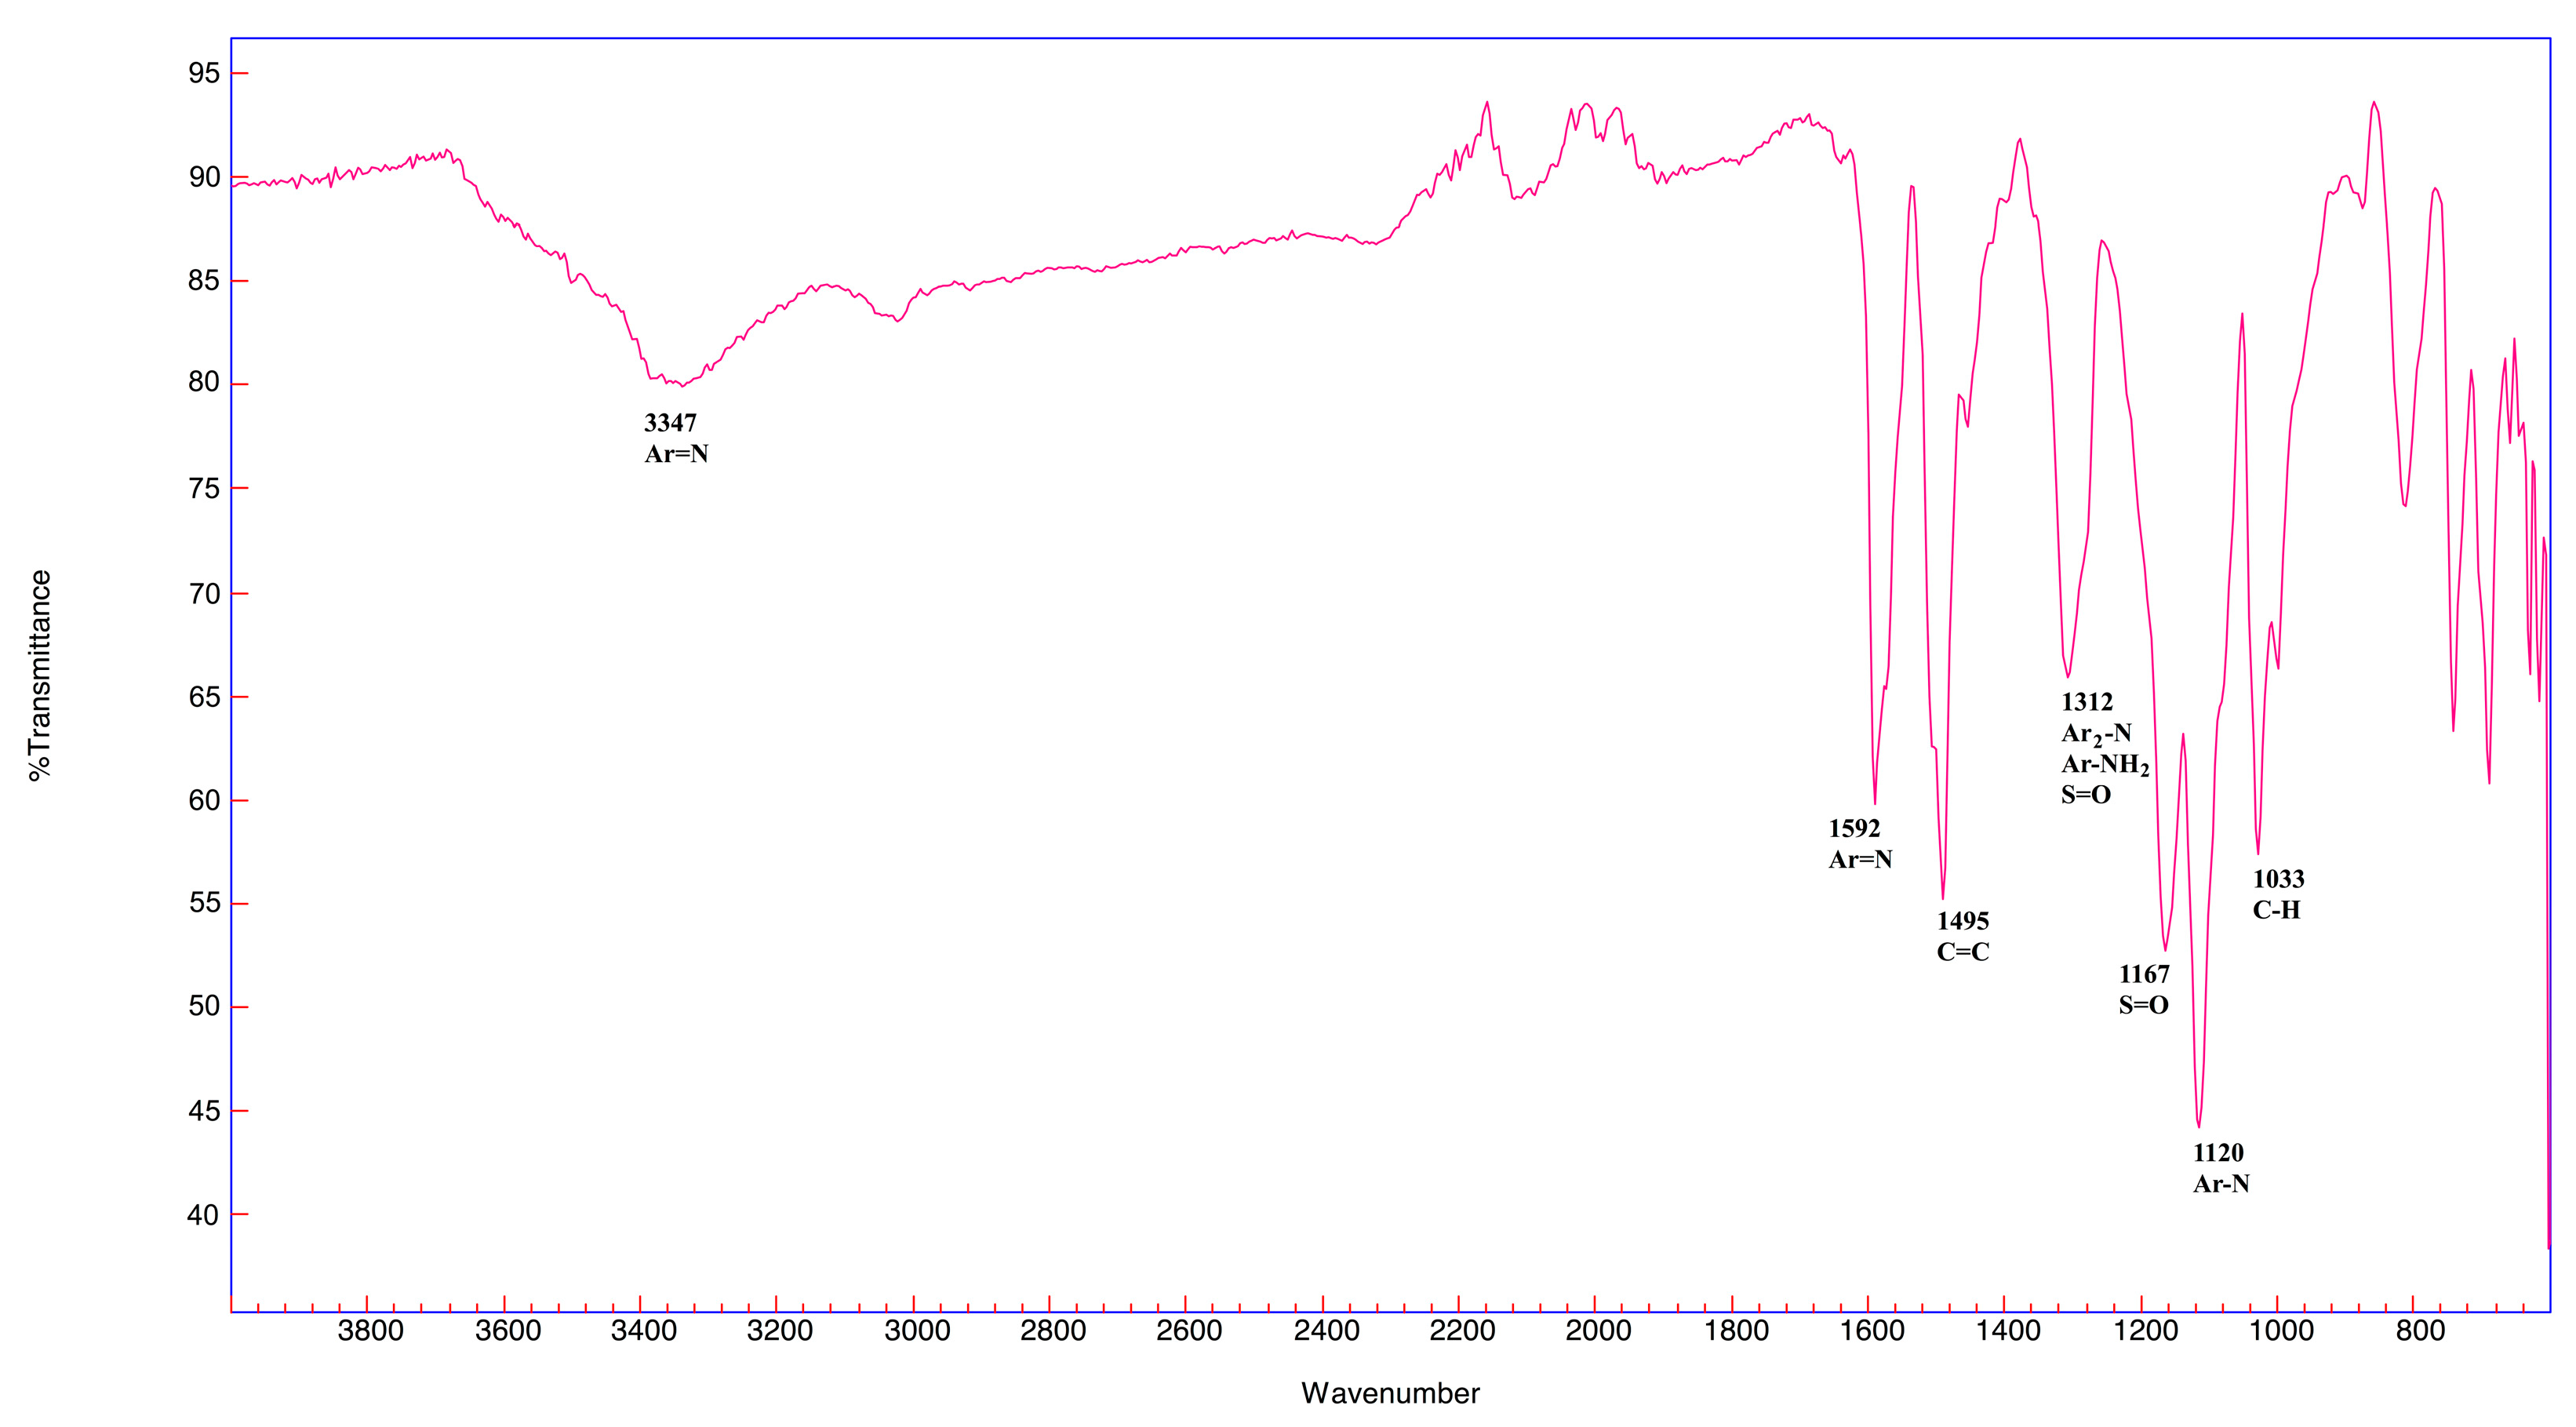
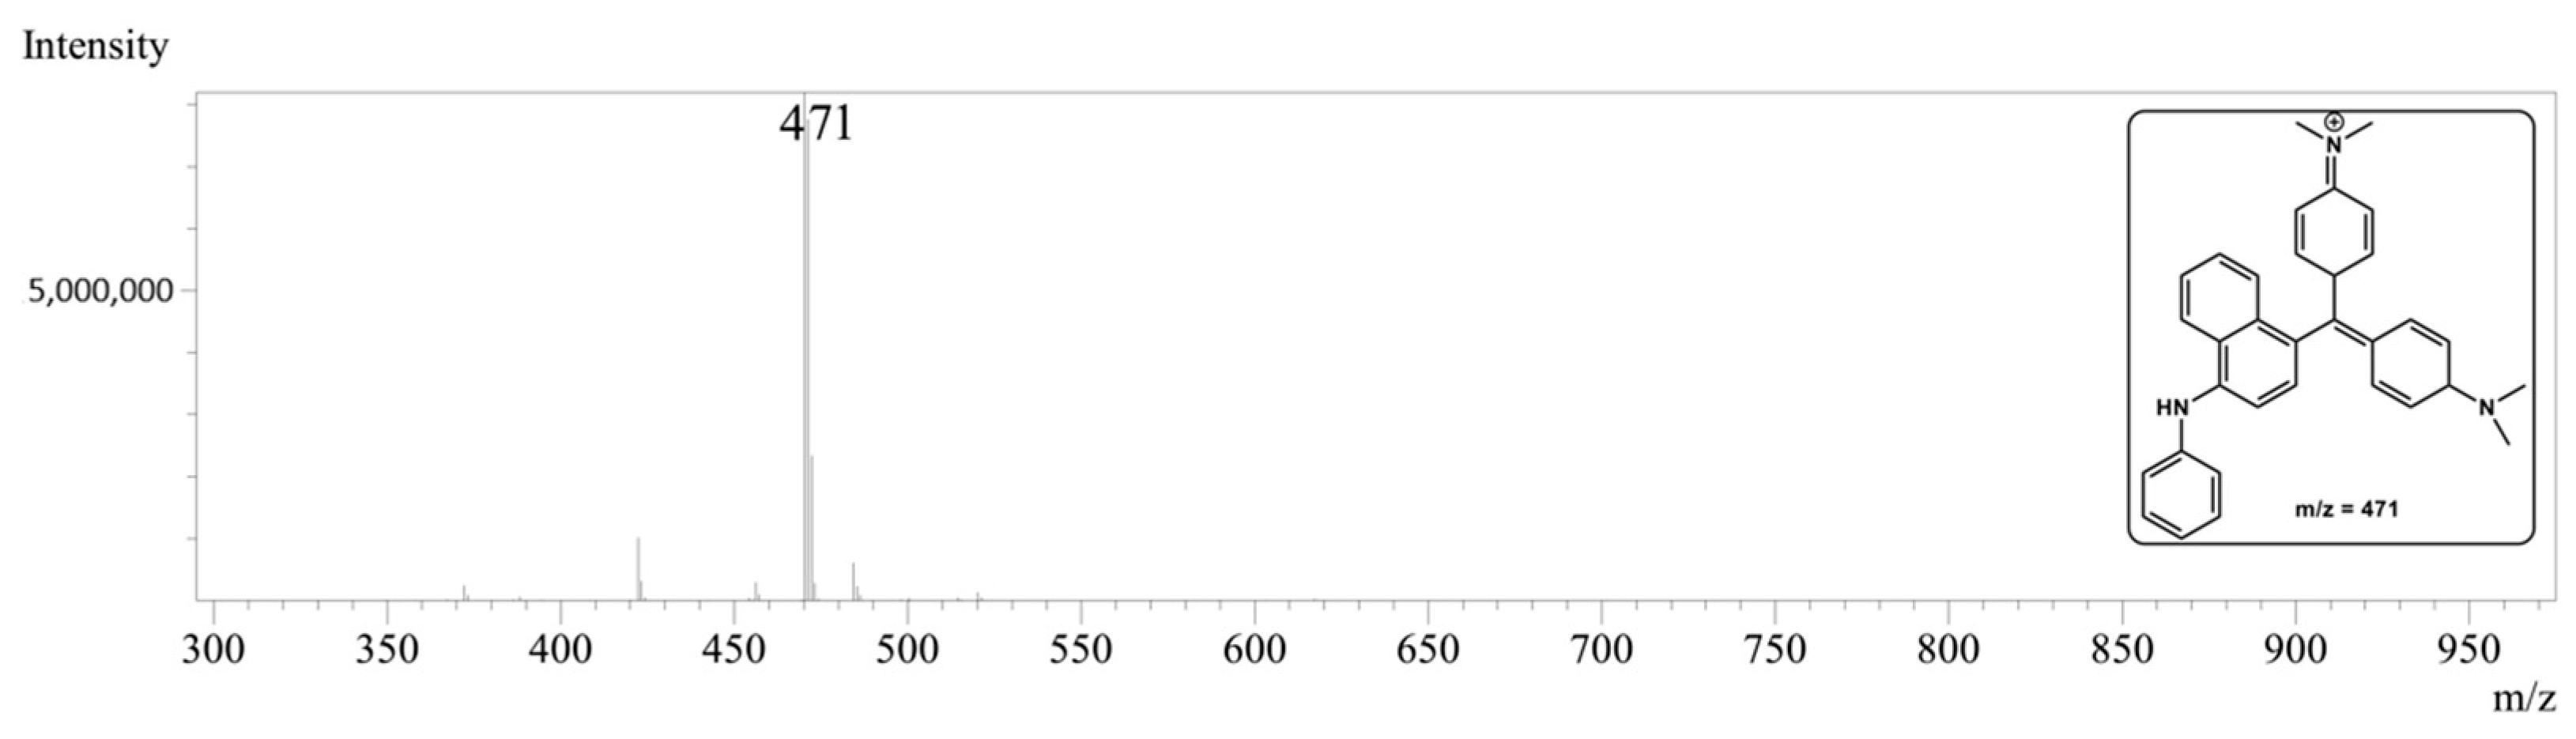
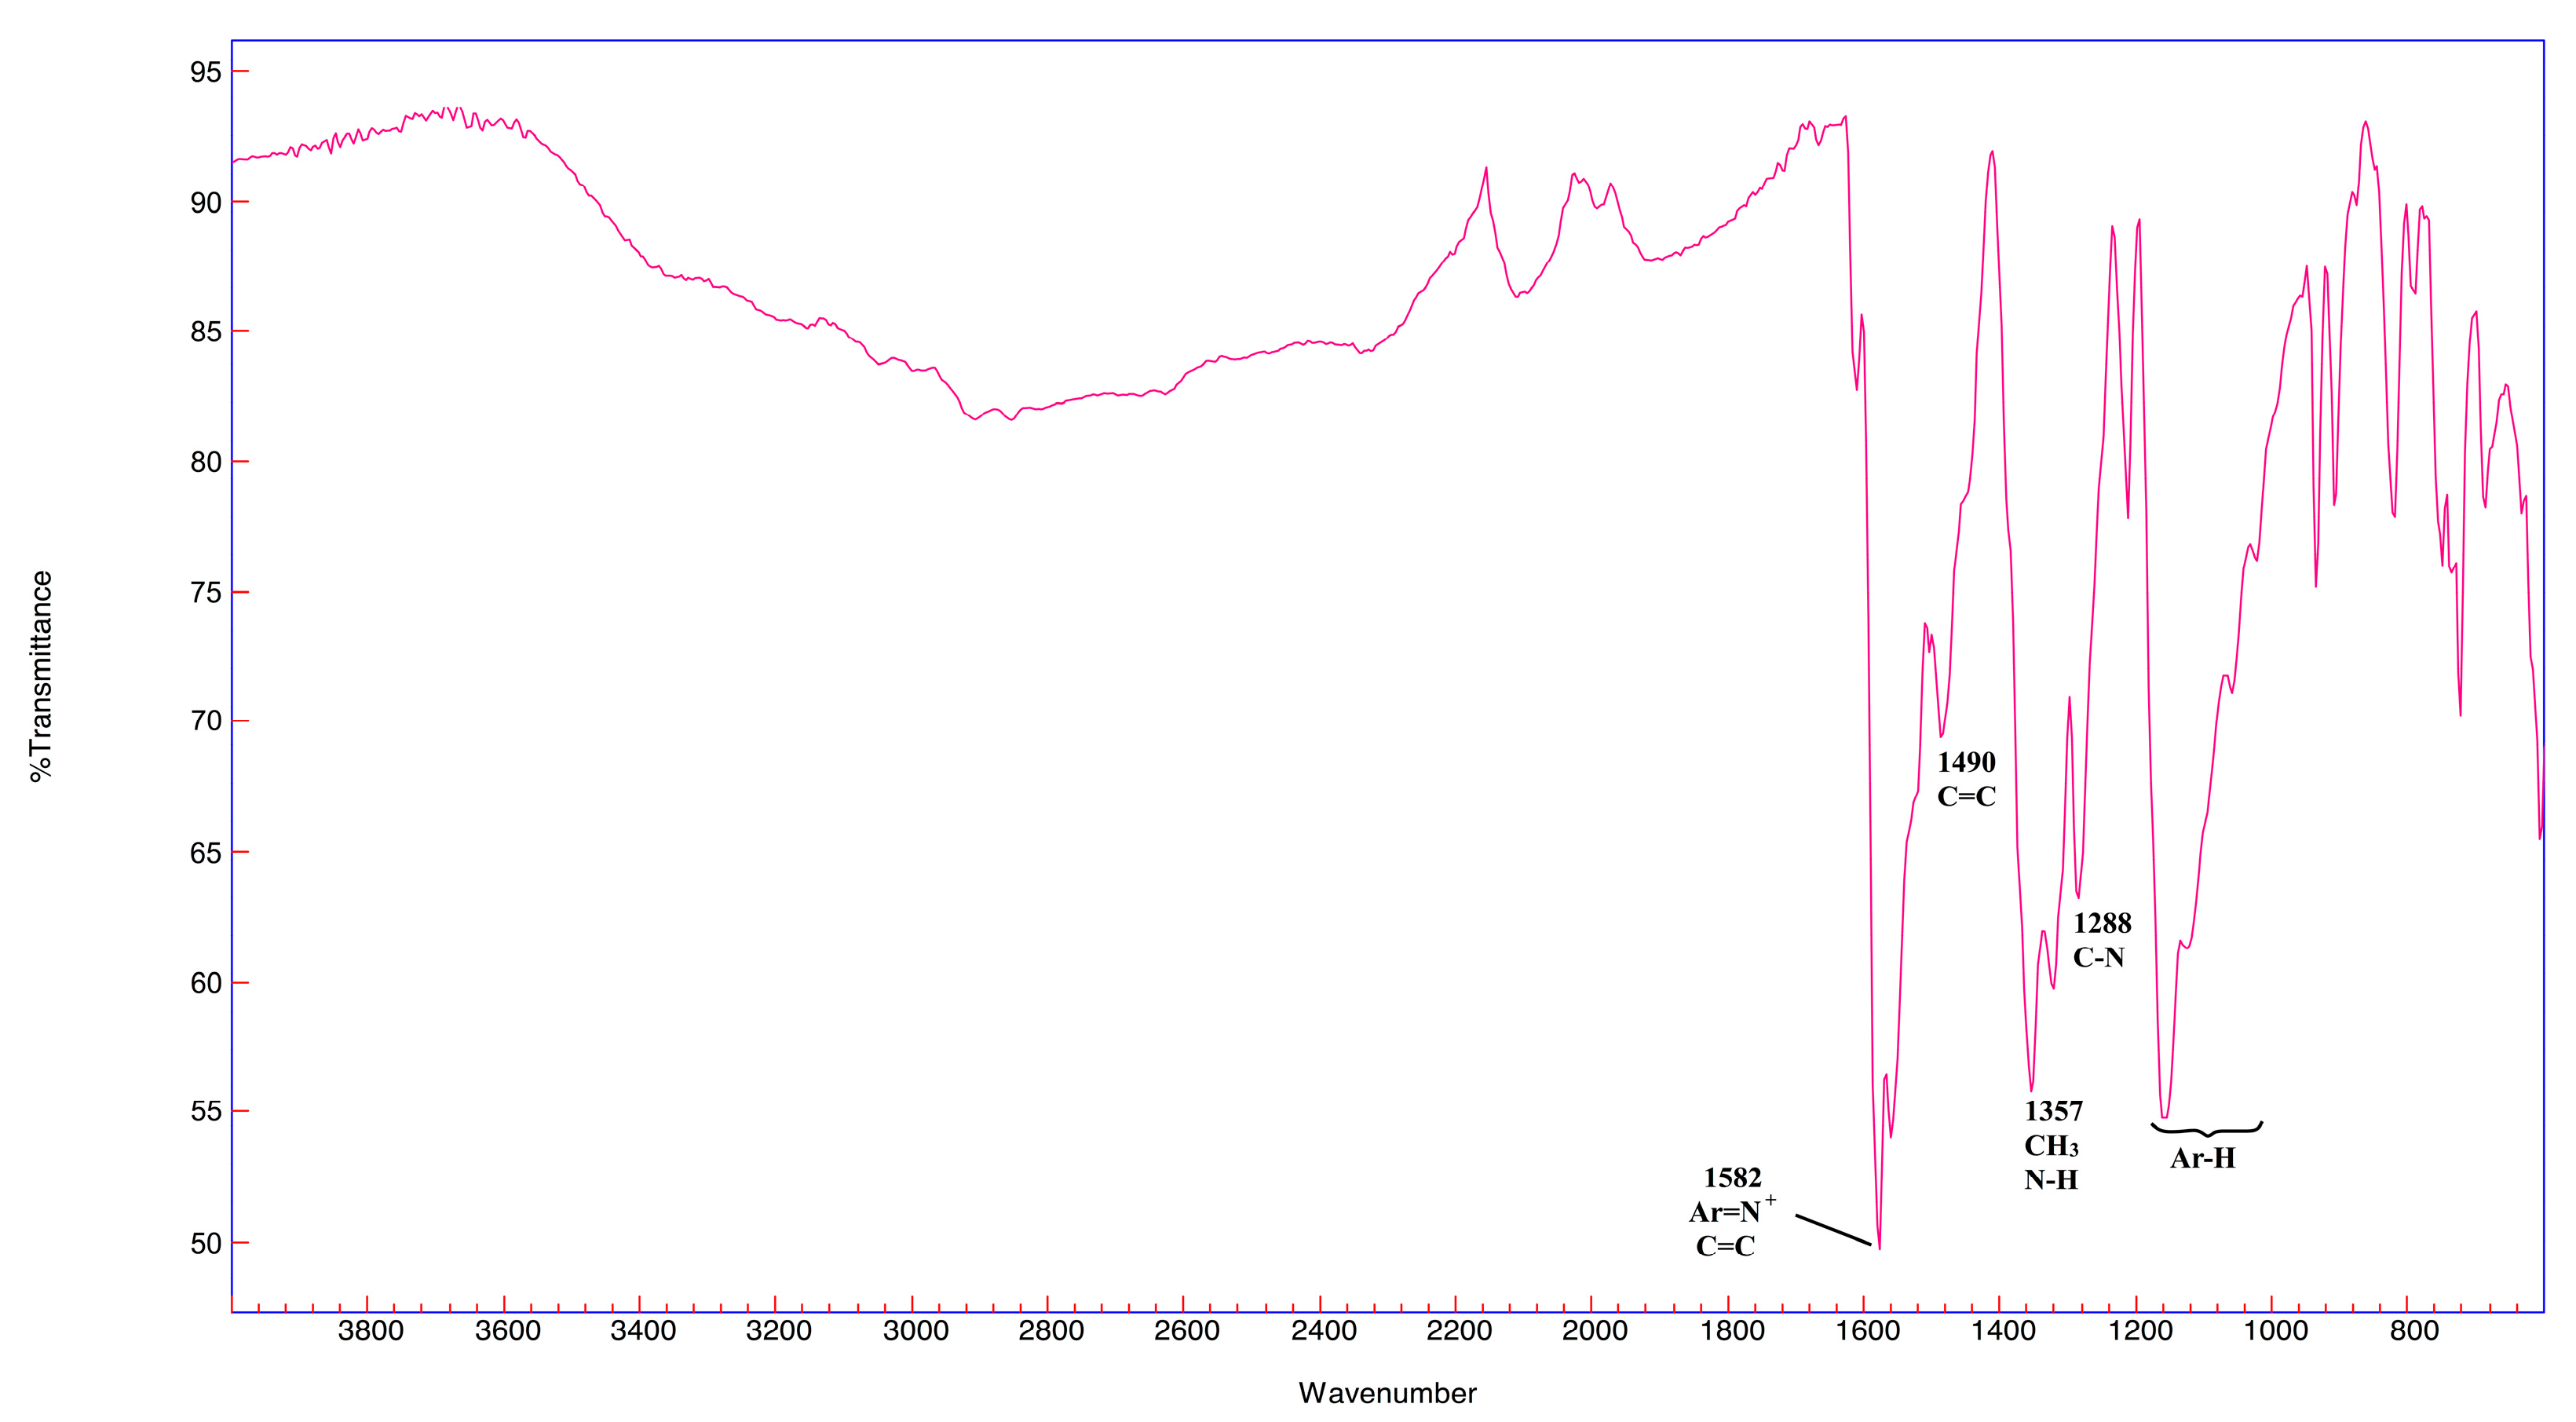
3.2.4. Triarylmethine Dyes
4. Conclusions
Author Contributions
Funding
Data Availability Statement
Acknowledgments
Conflicts of Interest
References
- Project Chromotope, the 19th Century Chromatic Turn Home Page. Available online: https://chromotope.eu (accessed on 4 November 2022).
- Bensaude-Vincent, B.; Stengers, I. La bataille des colorants. In Histoire de la Chimie; Bensaude-Vincent, B., Stengers, I., Poche, Eds.; La Découverte: Paris, France, 2011; pp. 231–240. [Google Scholar]
- Persoz, J.-F. Traité Théorique et Pratique de L’impression sur Étoffes; Masson: Paris, France, 1846; 4 volumes and one atlas. [Google Scholar]
- Déré, A.-C. La chaire des colorants. In 1794–1994: Le Conservatoire des Arts et Métiers au Cœur de Paris; DAAP: Paris, France, 1994; pp. 108–113. [Google Scholar]
- Bilbao Zubiri, I.; Carré, A.-L.; Meynard, A. Des colorants à l’étude: Une participation du musée des Arts et Métiers au projet Chromotope. Coré 2023, 6. [Google Scholar]
- Zvenigorodski, O. André Wahl. In Les Professeurs du Conservatoire National des Arts et Métiers. Dictionnaire Biographique 1794–1955; Fontanon, C., Grelon, A., Eds.; INRP: Paris, France, 1994; Volume 2, pp. 667–676. [Google Scholar]
- Rowe, F.-M. The Colour Index, 1st ed.; Society of Dyers and Colourists: Bradford, UK, 1924. [Google Scholar]
- Service des Musées de France de la Direction Générale des Patrimoines et de L’architecture. Inventorier et Récoler les Collections des Musées de France, Ministère de la Culture Web Page. Available online: https://www.culture.gouv.fr/Thematiques/Musees/Pour-les-professionnels/Conserver-et-gerer-les-collections/Gerer-les-collections/Inventorier-et-recoler-les-collections-des-musees-de-France (accessed on 18 January 2023).
- Zaffino, C.; Passaretti, A.; Poldi, G.; Fratelli, M.; Tibiletti, A.; Bestetti, R.; Saccani, I.; Guglielmi, V.; Bruni, S. A Multi-Technique Approach to the Chemical Characterization of Colored Inks in Contemporary Art: The Materials of Lucio Fontana. J. Cult. Herit. 2017, 23, 87–97. [Google Scholar] [CrossRef]
- Chieli, A.; Sanyova, J.; Doherty, B.; Brunetti, B.G.; Miliani, C. Chromatographic and Spectroscopic Identification and Recognition of Ammoniacal Cochineal Dyes and Pigments. Spectrochim. Acta Part A Mol. Biomol. Spectrosc. 2016, 162, 86–92. [Google Scholar] [CrossRef] [PubMed]
- Pirok, B.W.J.; Den Uijl, M.J.; Moro, G.; Berbers, S.V.J.; Croes, C.J.M.; van Bommel, M.R.; Schoenmalers, P.J. Characterization of Dye Extracts from Historical Cultural-Heritage Objects Using State-of-the-Art Comprehensive Two-Dimensional Liquid Chromatography and Mass Spectrometry with Active Modulation and Optimized Shifting Gradients. Anal. Chem. 2019, 91, 3062–3069. [Google Scholar] [CrossRef]
- Liu, J.; Zhou, Y.; Zhao, F.; Peng, Z.; Wang, S. Identification of Early Synthetic Dyes in Historical Chinese Textiles of the Late Nineteenth Century by High-performance Liquid Chromatography Coupled with Diode Array Detection and Mass Spectrometry. Color. Technol. 2016, 132, 177–185. [Google Scholar] [CrossRef]
- Souto, C. Analysis of Early Synthetic Dyes with HPLC-DAD-MS: An Important Database for Analysis of Colorants Used in Cultural Heritage. Master’s Thesis, Universidade Nova de Lisboa, Lisbon, Portugal, 2010. [Google Scholar]
- Petroviciu, I.; Vanden Berghe, I.; Cretu, I.; Albu, F.; Medvedovici, A. Identification of natural dyes in historical textiles from Romanian collections by LC-DAD and LC-MS (single stage and tandem MS). J. Cult. Herit. 2012, 13, 89–97. [Google Scholar] [CrossRef]
- Degano, I.; Sabatini, F.; Braccini, C.; Colombini, M.P. Triarylmethine dyes: Characterization of isomers using integrated mass spectrometry. Dye. Pigment. 2019, 160, 587–596. [Google Scholar] [CrossRef]
- Soltzberg, L.J.; Hagar, A.; Kridaratikorn, S.; Mattson, A.; Newman, R. MALDI-TOF mass spectrometric identification of dyes and pigments. J. Am. Soc. Mass Spectr. 2007, 18, 2001–2006. [Google Scholar] [CrossRef]
- Gulmini, M.; Idone, A.; Diana, E.; Gastaldi, D.; Vaudan, D.; Aceto, M. Identification of Dyestuffs in Historical Textiles: Strong and Weak Points of a Non-Invasive Approach. Dye. Pigment. 2013, 98, 136–145. [Google Scholar] [CrossRef]
- Montagner, C.; Bacci, M.; Bracci, S.; Freeman, R.; Picollo, M. Library of UV-Vis-NIR Reflectance Spectra of Modern Organic Dyes from Historic Pattern-Card Coloured Papers. Spectrochim. Acta Part A Mol. Biomol. Spectrosc. 2011, 79, 1669–1680. [Google Scholar] [CrossRef]
- Vandenabeele, P.; Moens, L.; Edwards, H.G.M.; Dams, R. Raman Spectroscopic Database of Azo Pigments and Application to Modern Art Studies. J. Raman Spectrosc. 2000, 31, 509–517. [Google Scholar] [CrossRef]
- Pozzi, F.; Leona, M. Surface-Enhanced Raman Spectroscopy in Art and Archaeology. J. Raman Spectrosc. 2016, 47, 67–77. [Google Scholar] [CrossRef]
- Doherty, B.; Gabrieli, F.; Clementi, C.; Cardon, D.; Sgamellotti, A.; Brunetti, B.; Miliani, C. Surface enhanced Raman spectroscopic investigation of orchil dyed wool from Roccella tinctoria and Lasallia pustulata. J. Raman Spectrosc. 2014, 45, 723–729. [Google Scholar] [CrossRef]
- Sessa, C.; Weiss, R.; Niessner, R.; Ivleva, N.P.; Stege, H. Towards a Surface Enhanced Raman Scattering (SERS) Spectra Database for Synthetic Organic Colourants in Cultural Heritage. The Effect of Using Different Metal Substrates on the Spectra. Microchem. J. 2018, 138, 209–225. [Google Scholar] [CrossRef]
- Cesaratto, A.; Luo, Y.B.; Smith, H.D.; Leona, M. A Timeline for the Introduction of Synthetic Dyestuffs in Japan during the Late Edo and Meiji Periods. Herit. Sci. 2018, 6, 22. [Google Scholar] [CrossRef]
- Cañamares, M.V.; Reagan, D.A.; Lombardi, J.R.; Leona, M. TLC-SERS of Mauve, the First Synthetic Dye. J. Raman Spectrosc. 2014, 45, 1147–1152. [Google Scholar] [CrossRef]
- Serafini, I.; Ciccola, A. Nanotechnologies and Nanomaterials: An Overview for Cultural Heritage. In Nanotechnologies and Nanomaterials for Diagnostic, Conservation and Restoration of Cultural Heritage; Lazzara, G., Fakhrulli, R.F., Eds.; Elsevier: Amsterdam, The Netherlands, 2018; pp. 325–380. [Google Scholar]
- Baker, R.M. Nineteenth Century Synthetic Textile Dyes. Their History and Identification on Fabric. Ph.D. Thesis, University of Southampton, Southampton, UK, September 2011. [Google Scholar]
- Bonacini, I.; Gallazzi, F.; Espina, A.; Cañamares, M.V.; Prati, S.; Mazzeo, R.; Sanchez-Cortes, S. Sensitive ‘on the Fiber’ Detection of Synthetic Organic Dyes by Laser Photoinduced Plasmonic Ag Nanoparticles. J. Raman Spectrosc. 2017, 48, 925–934. [Google Scholar] [CrossRef]
- Serafini, I.; Lombardi, L.; Vannutelli, G.; Montesano, C.; Sciubba, F.; Guiso, M.; Curini, R.; Bianco, A. How the extraction method could be crucial in the characterization of natural dyes from dyed yarns and lake pigments: The case of American and Armenian cochineal dyes, extracted through the new ammonia-EDTA method. Microchem. J. 2017, 134, 237–245. [Google Scholar] [CrossRef]
- Lombardi, L.; Serafini, I.; Guiso, M.; Sciubba, F.; Bianco, A. A new approach to the mild extraction of madder dyes from lake and textile. Microchem. J. 2016, 126, 373–380. [Google Scholar] [CrossRef]
- Serafini, I.; Lombardi, L.; Fasolato, C.; Sergi, M.; Di Ottavio, F.; Sciubba, F.; Montesano, C.; Guiso, M.; Costanza, R.; Nucci, L.; et al. A New Multi Analytical Approach for the Identification of Synthetic and Natural Dyes Mixtures. The Case of Orcein-Mauveine Mixture in a Historical Dress of a Sicilian Noblewoman of Nineteenth Century. Nat. Prod. Res. 2017, 33, 1040–1051. [Google Scholar] [CrossRef]
- Goodpaster, J.V.; Liszewski, E.A. Forensic Analysis of Dyed Textile Fibers. Anal. Bioanal. Chem. 2009, 394, 2009–2018. [Google Scholar] [CrossRef] [PubMed]
- Kuckova, S.; Nemec, I.; Hynek, R.; Hradilova, J.; Grygar, T. Analysis of organic colouring and binding components in colour layer of art works. Anal. Bioanal. Chem. 2005, 382, 275–282. [Google Scholar] [CrossRef] [PubMed]
- Longoni, M.; Gavazzi, M.; Monti, D.; Bruni, S. Early synthetic textile dyes of the late 19th century from the «Primo Levi» Chemistry Museum (Rome): A multi-technique analytical investigation. J. Cult. Herit. 2023, 59, 131–139. [Google Scholar] [CrossRef]
- Gillard, R.D.; Hardman, S.M.; Thomas, R.G.; Watkinson, D.E. The detection of dyes by FTIR. Stud. Conserv. 1994, 39, 187–192. [Google Scholar]
- Sato, M.; Sasaki, Y. Studies on ancient Japanese silk fibres using FT-IR microscopy. In Proceedings of the AHRB Research Centre for Textile Conservation and Textile Studies, First Annual Conference: Scientific Analysis of Ancient and Historic Textiles, Glasgow, UK, 13–15 July 2004; Janaway, R.C., Wyeth, P., Eds.; Archetype Press: London, UK, 2005. [Google Scholar]
- Schaening, A.; Schreiner, M.; Jembrih-Simbuerger, D. Identification and classification of synthetic organic pigments of a collection of the 19th and 20th century by FTIR. In Proceedings of the Sixth Infrared and Raman Users Group Conference (IRUG6), Florence, Italy, 29 March–1 April 2004; pp. 302–305. [Google Scholar]
- Ehrmann, E. Traité des Matières Colorantes Organiques et de Leurs Diverses Applications; Dunod: Paris, France, 1922; 615p. [Google Scholar]
- Dépierre, J. Traité de la Teinture et de L’impression des Matières Colorantes Artificielles; Béranger: Paris, France, 1903; Volume 5, 624p. [Google Scholar]
- Cain, J.C.; Thorpe, J.F. Les Matières Colorants de Synthèse et les Produits Intermédiaires Servant à leur Fabrication; Dunod: Paris, France, 1922; 666p. [Google Scholar]
- Seyewetz, A.; Sisley, P. Chimie des Matières Colorantes Artificielles; Masson: Paris, France, 1896; 826p. [Google Scholar]
- Tamburini, D.; Shimada, C.M.; McCarthy, B. The molecular characterization of early synthetic dyes in E. Knecht et al.’s textile sample book “A Manual of Dyeing” (1893) by high performance liquid chromatography—Diode array detector—Mass spectrometry (HPLC-DAD-MS). Dye. Pigment. 2021, 190, 109286. [Google Scholar] [CrossRef]
- GBCM Laboratory, Molecular Chemistry Team Home Page. Available online: https://gbcm.cnam.fr/equipe-3/ (accessed on 4 November 2022).
- Sakudo, J. Les Entreprises de la Chimie en France de 1860 à 1932; PIE Peter Lang: Bruxelles, Belgium, 2011; 290p. [Google Scholar]
- Travis, A.S. The Rainbow Makers: The origins of the Synthetic Dyestuffs Industry in Western Europe; Lehigh University Press: Bethlehem, Palestine; Associated University Presses: London, UK; Toronto, ON, Canada, 1993; 335p. [Google Scholar]
- Langlinay, E. Apprendre de l’Allemagne? Les scientifiques et industriels français de la chimie et l’Allemagne entre 1871 et 1914. In L’économie, L’argent et les Hommes: Les Relations Franco-Allemandes de 1871 à nos Jours; Eck, J.-F., Martens, S., Schürmann, S., Eds.; Institut de la gestion publique et du développement économique: Paris, France, 2009; pp. 113–129. [Google Scholar]
- Holly, M.; Herm, C.; Schram, J. Conserving the Rainbow: First Approaches towards the Preservation of the Dye Collection of the Hochschule Niederrhein. Dye. Hist. Archaeol. 2023, 37, 262–271. [Google Scholar]
- Holly, M. Farbe als Objekt. Die Erforschung der Farbstoffsammlung der Hochschule Niederrhein in Krefeld. In Proceedings of the Zur Sache! Objektwissenschaftliche Ansätze der Sammlungsforschung, Tübingen, Germany, 6–8 September 2018; Eberhard Karls Universität Tübingen: Tübingen, Germany, 2019. [Google Scholar] [CrossRef]
- Lech, K.; Wilicka, E.; Witowska-Jarosz, J.; Jarosz, M. Early synthetic dyes—A challenge for tandem mass spectrometry. J. Mass. Spectrom. 2013, 48, 141–147. [Google Scholar] [CrossRef]
- Woodhead, A.; Cosgrove, B.; Church, J.S. The purple coloration of four late 19th century silk dresses: A spectroscopic investigation. Spectrochim. Acta Part A Mol. Biomol. Spectrosc. 2016, 154, 185–192. [Google Scholar] [CrossRef]
- Gorassini, A.; Adami, G.; Calvini, P.; Giacomello, A. ATR-FTIR characterization of old pressure sensitive adhesive tapes in historic papers. J. Cult. Herit. 2016, 21, 775–785. [Google Scholar] [CrossRef]
- Sabatini, F.; Giugliano, R.; Degano, I. Photo-oxidation processes of Rhodamine B: A chromatographic and mass spectrometric approach. Microchem. J. 2018, 140, 114–122. [Google Scholar] [CrossRef]
- Lavate, D.; Sawant, V.; Khomane, A. Photodegradation of Rhodamine-B Dye under Natural Sunlight using CdO. Bull. Chem. React. Eng. Catal. 2022, 17, 466–475. [Google Scholar] [CrossRef]
- Bartošová, A.; Blinová, L.; Sitotiak, M.; Michalíková, A. Usage of FTIR-ATR as Non-Destructive Analysis of Selected Toxic Dyes; Research papers Faculty of Materials Science and Technology; Slovak University of Technology: Bratislava, Slovakia, 2017; Volume 25, pp. 103–111. [Google Scholar] [CrossRef]
- Ahmed, F.; Dewani, R.; Pervez, M.K.; Mahboob, S.J.; Soomro, S.A. Non-destructive FT-IR analysis of mono azo dyes. Bulg. Chem. Commun. 2016, 48, 71–77. [Google Scholar]
- Majeed, H.A.S.A.; Al-Ahmad, A.Y.; Hussain, H.A. The Preparation, Characterization and the Study of the Linear Optical Properties of a New Azo Compound. J. Basrah Res. 2011, 37, 64–73. [Google Scholar]
- Cesaratto, A.; Leona, M.; Pozzi, F. Recent Advances on the Analysis of Polychrome Works of Art: SERS of Synthetic Colorants and Their Mixtures With Natural Dyes. Front. Chem. 2019, 7, 105. [Google Scholar] [CrossRef] [PubMed]
- Degano, I.; Ribechini, E.; Modugno, F.; Colombini, M.P. Analytical Methods for the Characterization of Organic Dyes in Artworks and in Historical Textiles. Appl. Spectrosc. Rev. 2009, 44, 363–410. [Google Scholar] [CrossRef]
- Doherty, B.; Vagnini, M.; Dufourmantelle, K.; Sgamellotti, A.; Brunetti, B.; Miliani, C. A vibrational spectroscopic and principal component analysis of triarylmethane dyes by comparative laboratory and portable instrumentation. Spectrochim. Acta A 2014, 121, 292–305. [Google Scholar] [CrossRef]
- Kumar, C.G.; Mongolla, P.; Basha, A.; Joseph, J.; Sarma, V.U.; Kamal, A. Decolorization and biotransformation of triphenylmethane dye, methyl violet, by Aspergillus sp. isolated from Ladakh, India. J Microbiol. Biotechnol. 2011, 21, 267–273. [Google Scholar] [CrossRef]


| Sample Number | Name | Class of the Dye | Molecular Weight | Molecule | Manufacture |
|---|---|---|---|---|---|
| 1 | Rhodamine B | xanthene | 478.0 |  | Bayer 1 M. lyonnaise 2 |
| 2 | Naphthol yellow S extra | nitro | 358.2 |  | Saint-Clair 3 |
| 3 | Chrysamine G | diazo | 526.4 |  | Bayer 1 |
| 4 | Chrysophenine G | diazo | 680.7 |  | Bayer 1 |
| 5 | Naphthol black 6B | diazo | 860.7 |  | M. lyonnaise 2 |
| 6 | Victoria black B | diazo | 622.5 |  | Bayer 1 |
| 7 | Tartrazine | monoazo | 534.4 |  | Saint-Clair 3 |
| 8 | Naphthylamine black 4B | diazo | 616.5 |  | Saint-Clair 3 |
| 9 | Alkali blue 4B | triarylmethine | 555.6 |  | Bayer 1 Saint-Denis 4 |
| 10 | Victoria Blue B | triarylmethine | 506.1 |  | Bayer 1 |
Disclaimer/Publisher’s Note: The statements, opinions and data contained in all publications are solely those of the individual author(s) and contributor(s) and not of MDPI and/or the editor(s). MDPI and/or the editor(s) disclaim responsibility for any injury to people or property resulting from any ideas, methods, instructions or products referred to in the content. |
© 2023 by the authors. Licensee MDPI, Basel, Switzerland. This article is an open access article distributed under the terms and conditions of the Creative Commons Attribution (CC BY) license (https://creativecommons.org/licenses/by/4.0/).
Share and Cite
Bilbao Zubiri, I.; Carré, A.-L. Giving a New Status to a Dyes Collection: A Contribution to the Chromotope Project. Heritage 2023, 6, 2202-2219. https://doi.org/10.3390/heritage6020117
Bilbao Zubiri I, Carré A-L. Giving a New Status to a Dyes Collection: A Contribution to the Chromotope Project. Heritage. 2023; 6(2):2202-2219. https://doi.org/10.3390/heritage6020117
Chicago/Turabian StyleBilbao Zubiri, Irene, and Anne-Laure Carré. 2023. "Giving a New Status to a Dyes Collection: A Contribution to the Chromotope Project" Heritage 6, no. 2: 2202-2219. https://doi.org/10.3390/heritage6020117
APA StyleBilbao Zubiri, I., & Carré, A.-L. (2023). Giving a New Status to a Dyes Collection: A Contribution to the Chromotope Project. Heritage, 6(2), 2202-2219. https://doi.org/10.3390/heritage6020117