Article

Seismic Soil–Structure Interaction of Three Historical Buildings at the University of Catania (Sicily, Italy)

by
Sabrina Grassi
1,*,
Maria Serafina Barbano
1,2,
Claudia Pirrotta
1,
Gabriele Morreale
1 and
Sebastiano Imposa
1
1
Department of Biological, Geological and Environmental Sciences, University of Catania, Corso Italia 57, 95129 Catania, Italy
2
CRUST—Interuniversity Center for 3D Seismotectonics with Territorial Applications, 66100 Chieti Scalo, Italy
*
Author to whom correspondence should be addressed.
Heritage 2022, 5(4), 3562-3587; https://doi.org/10.3390/heritage5040185
Submission received: 18 October 2022 / Revised: 14 November 2022 / Accepted: 16 November 2022 / Published: 18 November 2022

Abstract

:
This study aimed to evaluate the soil–structure interaction of three historical buildings at the University of Catania using ambient noise. The results point out the different oscillation modes of Villa Cerami and Palazzo Boscarino buildings sharing a side. They also show different damping values, which are probably linked to the different rigidities of the structures, since one is a masonry building and the other is a reinforced concrete building without earthquake-resistant design. Villa Zingali Tetto, a reinforced concrete building without earthquake-resistant design, showed significant torsional effects, which may be related to the geometrical and material irregularities of the structure. Comparison of the buildings’ fundamental periods and site frequencies did not show potential soil–structure resonance effects. Modelling of the local seismic response confirms the obtained experimental site frequencies, suggesting that there are no important amplification factors. On the other hand, from both of the computed Spectral and Peak Ground Accelerations for an Mw 7.3 earthquake, intensity values were estimated for which Villa Cerami could suffer heavy structural damage, and Palazzo Boscarino and Villa Zingali Tetto very heavy non-structural damage. Additional engineering investigations, aimed at reducing seismic vulnerability, are necessary to improve the safety of these heritage buildings considering they are also used for educational purposes.

1. Introduction

Seismic site effects are caused by significant contrasts in the seismic wave impedance of different lithotypes and/or the irregular geometry of the surface, due to the presence of canyons, valleys, or hills [1,2,3]. Lithological and morphological characteristics can produce variations in the amplitude and frequency content of seismic waves, which can influence earthquake hazard assessments at sites. In the frequency domain, seismic site effects can be estimated using several spectral ratio methods, which reveal how near-surface geological structures modify the spectral content of seismic waves. The most common technique for the local seismic response estimation is the standard spectral ratio (SSR), which compares earthquake recordings at two sites, e.g., [4]. One of these is a “reference site,” which is usually located on solid bedrock, and considered free from significant site amplification effects [5]. Another standard technique that does not need a reference site is based on the horizontal-to-vertical spectral ratio (HVSR) using noise recordings (i.e., microseismic or ambient vibrations). This method, which was originally introduced by Nakamura in 1989 [6] to characterize the transfer function of subsurface geological units, has been shown to provide a reliable estimate of the predominant frequency of ground motion response at the surface of soft soil deposits [7,8,9,10,11]. Lermo and Chavez-Garcia, in 1993 [8], applied the technique to horizontal shear wave recordings, showing that this method is in good agreement with results acquired using the SSR technique, especially in the frequency range close to the fundamental frequency. Recently, many authors have also successfully tested the reliability of HVSR in estimating local effects linked to the occurrence of different morphological settings, such as landslides, faults, cavities etc., e.g., [12,13,14,15].
Defining the features of historical buildings is a complex process that merges information from several disciplines, such as general and local building geometry, the masonry texture characteristics, the construction details, and the mechanical characterization of the materials. All these data can be used to model the building by using finite element (FE), e.g., [16]. The FE model should evaluate the structural safety performance under exceptional loads (such as earthquakes) and simulate the effects of structural modifications or repair interventions. However, FE modelling of a historical building can induce errors because of the simplified assumptions in modelling. Other authors have used 3D detailed micro-models for the in-plane and out-of-plane numerical analysis of masonry panels [17]. A comprehensive review of the modelling strategies for the computational analysis of unreinforced masonry structures can be found in D’Altri et al., 2020 [18]. A possible practice to obtain reliable linear models is based on performing ambient vibration modal tests. Several techniques have been developed for analyzing ambient noise in structures (frequency domain decomposition, FDD; extended frequency domain decomposition, EFDD; multimode random decrement technique, MRDT; stochastic subspace identification, SSI; etc.). Here, ambient vibrations treated using horizontal-to-horizontal spectral ratio (HHSR) techniques were used to compute the modal frequencies of the studied buildings.
Historical buildings, constructed prior to the introduction of seismic code, were usually built without considering seismic actions and are therefore potentially more susceptible to earthquake damage. It is well known that the level of building damage and its distribution during an earthquake is determined by the combined effects of local site response, the subsurface ground conditions, and the dynamic features of the structure. In this paper, ambient vibrations (i.e., wind, traffic, human activities) are used to determine the soil–structure interaction of three different vulnerable buildings by computing the modal frequencies of the structures. This method, used worldwide, is highly efficient for cultural heritage, as it is non-invasive, rapid, relatively easy to implement, and inexpensive, as demonstrated in [19,20,21,22]. Furthermore, one-dimensional (1D) site response modelling was used to validate the results and to define probable seismic scenarios. The buildings are located in a seismically active area that was historically subjected to large ground motions of an equivalent moment magnitude (Mw) of up to 7.3 earthquakes at a distance of less than 25 km [23].
The University of Catania has many heritage sites consisting of both historical and modern buildings. Three of them, Villa Cerami, Palazzo Boscarini, and Villa Zingali Tetto, representing different vulnerability types, were chosen to analyze with regard to their behavior in the event of an earthquake. The first was built soon after the 1693 earthquakes, while the second was built in the 1960s. These two buildings share the second floor in the south. Villa Zingali Tetto was built at the beginning of 1900. Furthermore, Villa Cerami and Palazzo Boscarino were built on the debris of buildings destroyed by the 1693 earthquakes, whereas Villa Zingali Tetto was built on volcanic rocks, and therefore has a different local seismic site response.
To analyse the seismic soil–structure interaction and define probable seismic scenarios, the following steps were adopted: (i) study of the building’s history since their construction; (ii) identification of historical earthquakes that may have caused damage to them; (iii) analysis of the building’s vulnerability based on construction type and any changes that may have compromised their performance; and finally, (iv) ambient noise measurements and one-dimensional (1D) site response modelling were used to evaluate the building’s dynamic response to a seismic input, as well as the soil–structure interaction.
Following descriptions of the buildings and the damage that they had suffered from earthquakes, the three selected buildings’ results and, according to their vulnerability, the damage that they may undergo from earthquakes of different magnitudes, will be shown.

2. Seismological and Geological Framework

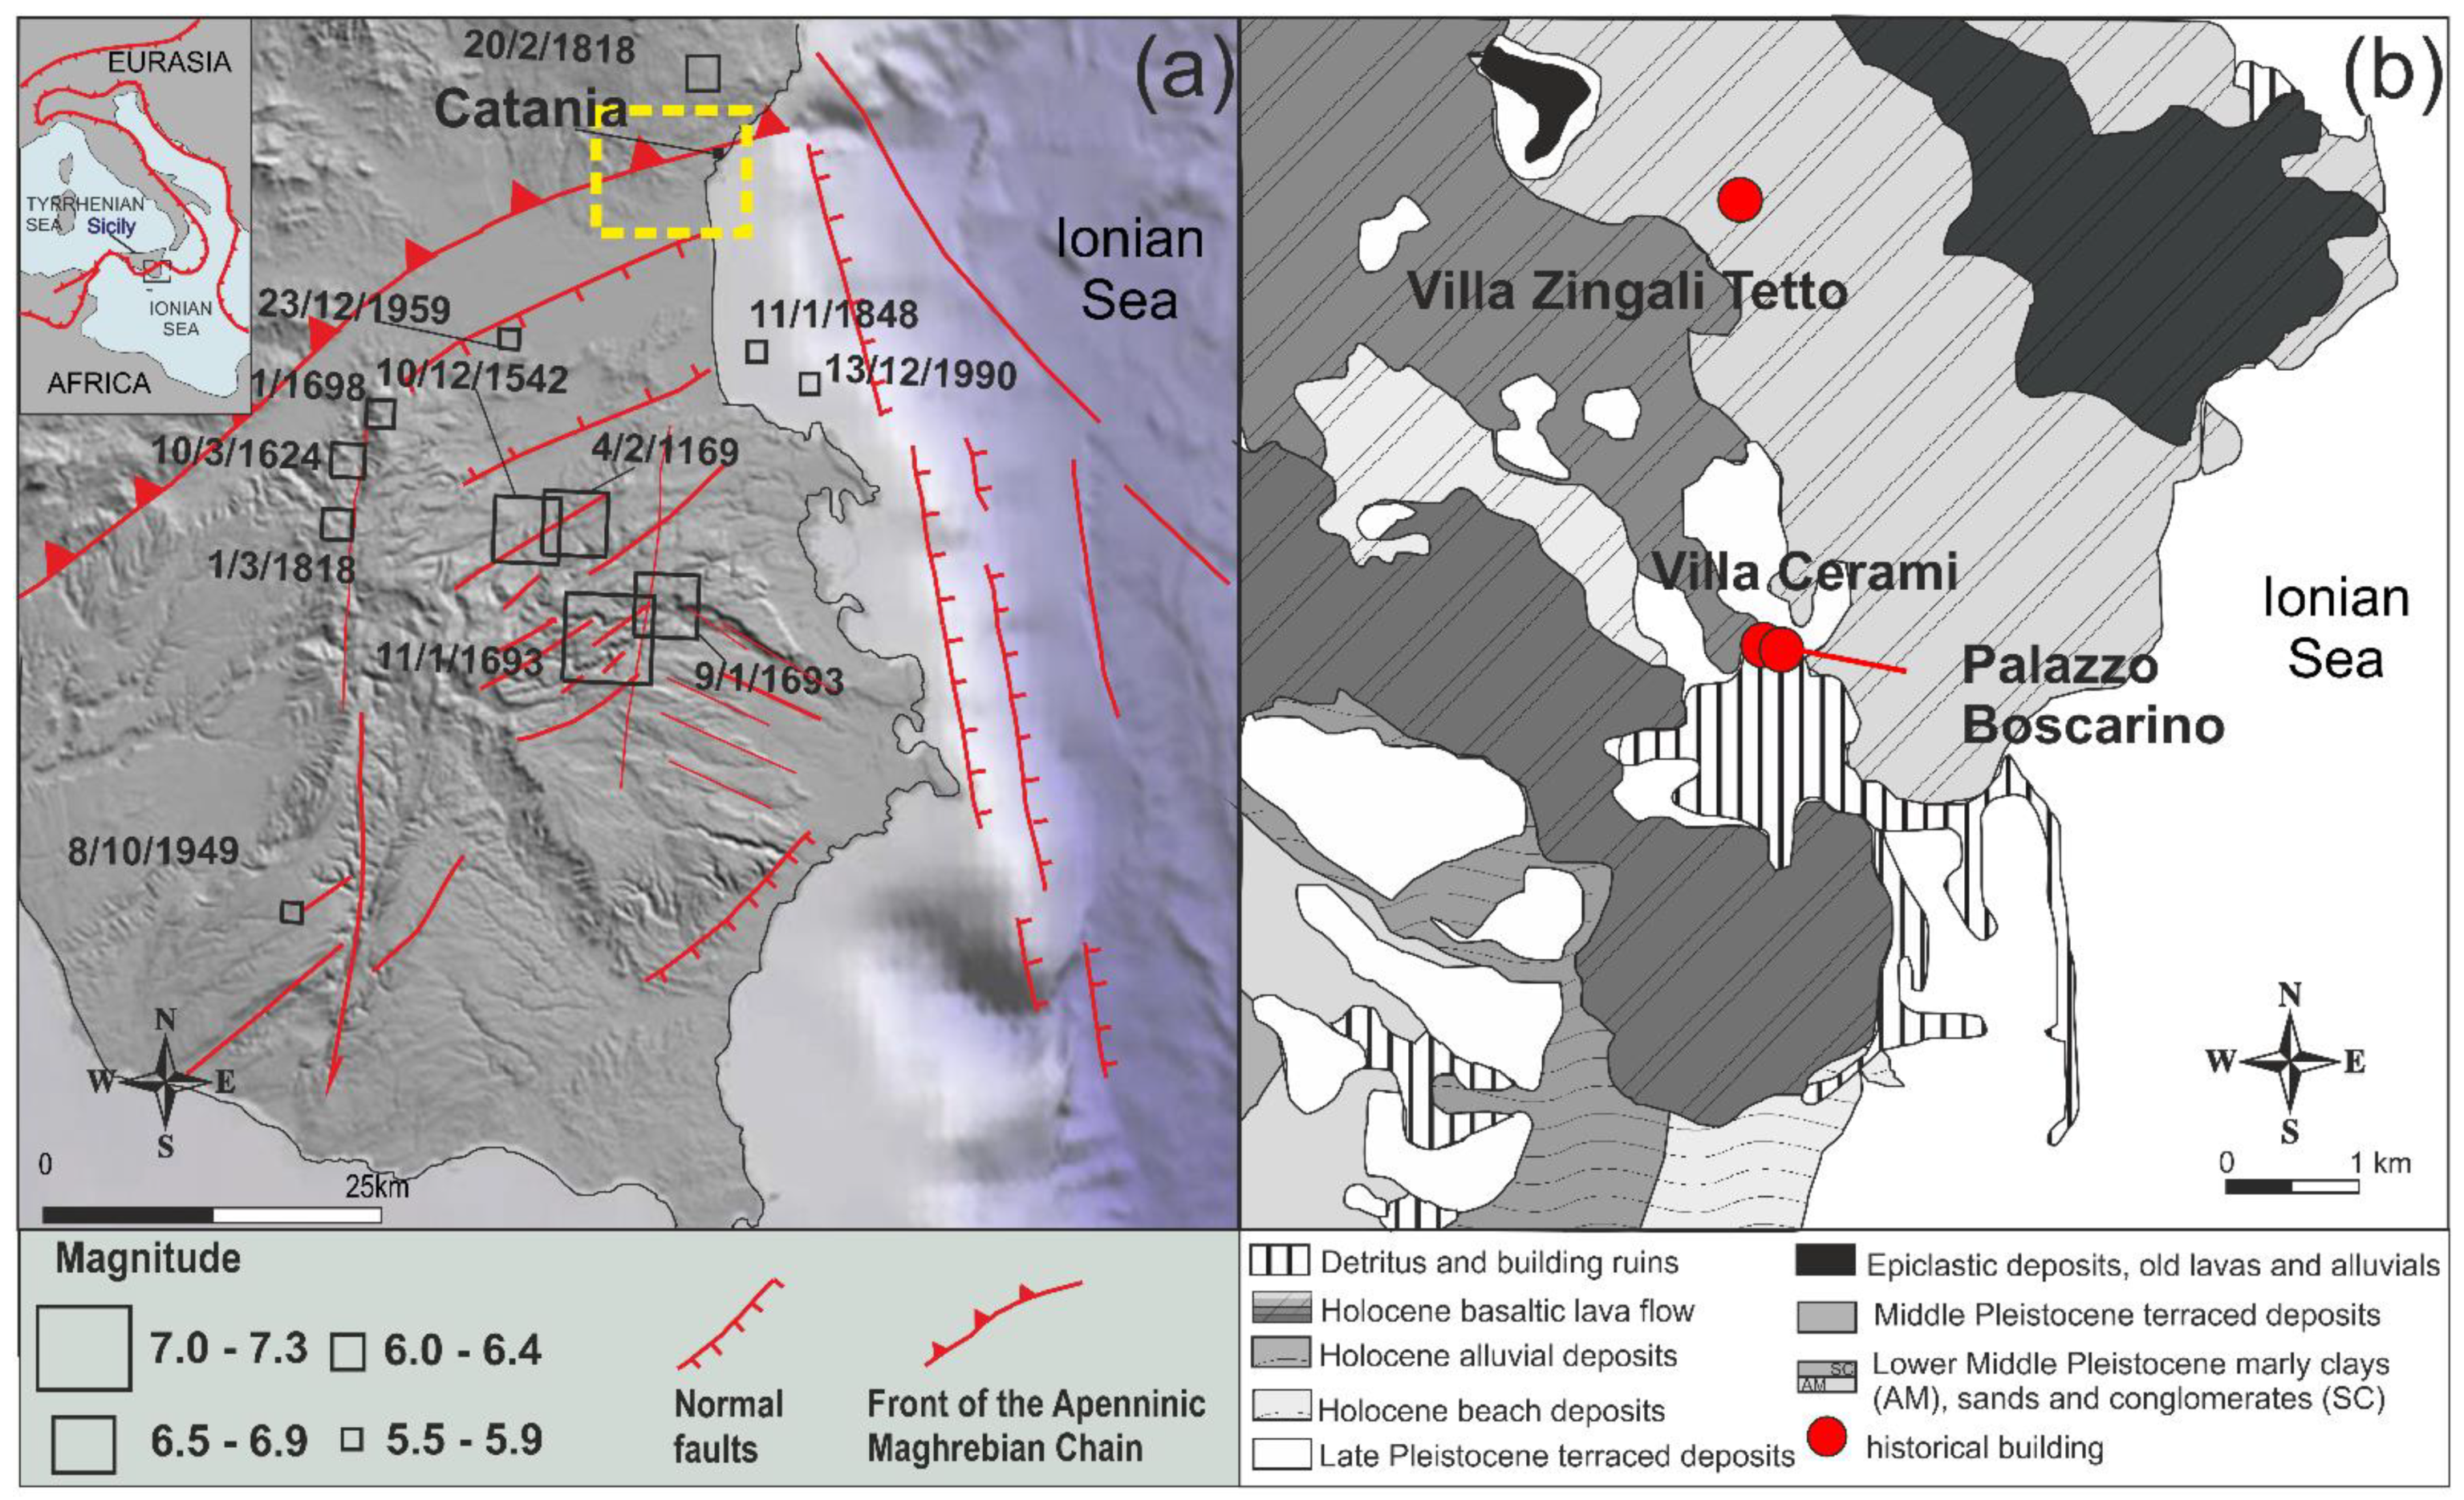
2.1. Historical Seismicity

The city of Catania is located in eastern Sicily, which is a tectonically and seismically active region (Figure 1a) with a high seismic hazard due to the strong historical earthquakes which have occurred in the neighboring areas, as explored in [24,25]. The strongest earthquakes, with intensities of up to X-XI MCS (Mercalli-Cancani-Sieberg macroseismic scale) and Mw values between 6 and 7.3 [23,26], occurred on 4 February 1169 (epicentral intensity I0 = X), 10 December 1542 (I0 = IX-X) and 9 and 11 January 1693 (I0 = VIII-IX and XI, respectively). The last nearly completely destroyed Catania [23,26] and most of the towns in southeastern Sicily e.g., [27]. In addition, some earthquakes of moderate magnitudes have caused damage in Catania, including those of 1818 and 1848 (Mw = 6.3 and Mw = 5.5, respectively), and more recently, the 13 December 1990 (Mw = 5.7) earthquake [23,28].
The earthquakes that could have damaged the chosen buildings were identified according to (i) historical notes on buildings determining the construction year and any changes undergone over time; (ii) analysis of catalogues [23,26] to select earthquakes that occurred during the life of the buildings with sufficient magnitude to cause damage or that in Catania have had maximum observed intensity Imax > VI MCS, i.e., over the damage threshold; and (iii) historical accounts describing the type of damage suffered by the buildings and any repairs, restorations, or safety measures that have been performed. All of the buildings were constructed after the 1693 earthquakes; therefore, the earthquakes that damaged Catania from this date on were selected (Table 1). Since the 1693 event, the maximum intensity reached in Catania was VII MCS during the 1818 earthquake [23]. It caused moderate damage to many buildings that had been built after the 1693 earthquake [30]. In the following section, information on the history of the buildings and on the damage suffered due to earthquakes is reported. Due to the earthquakes of 1848 and 1908, accounts on the events describe general minor damage on the oldest buildings in Catania [30]. Therefore, it is likely that, among the buildings under study, Villa Cerami, which was built before these earthquakes occurred, may have been damaged, but there is still no definitive information on this.

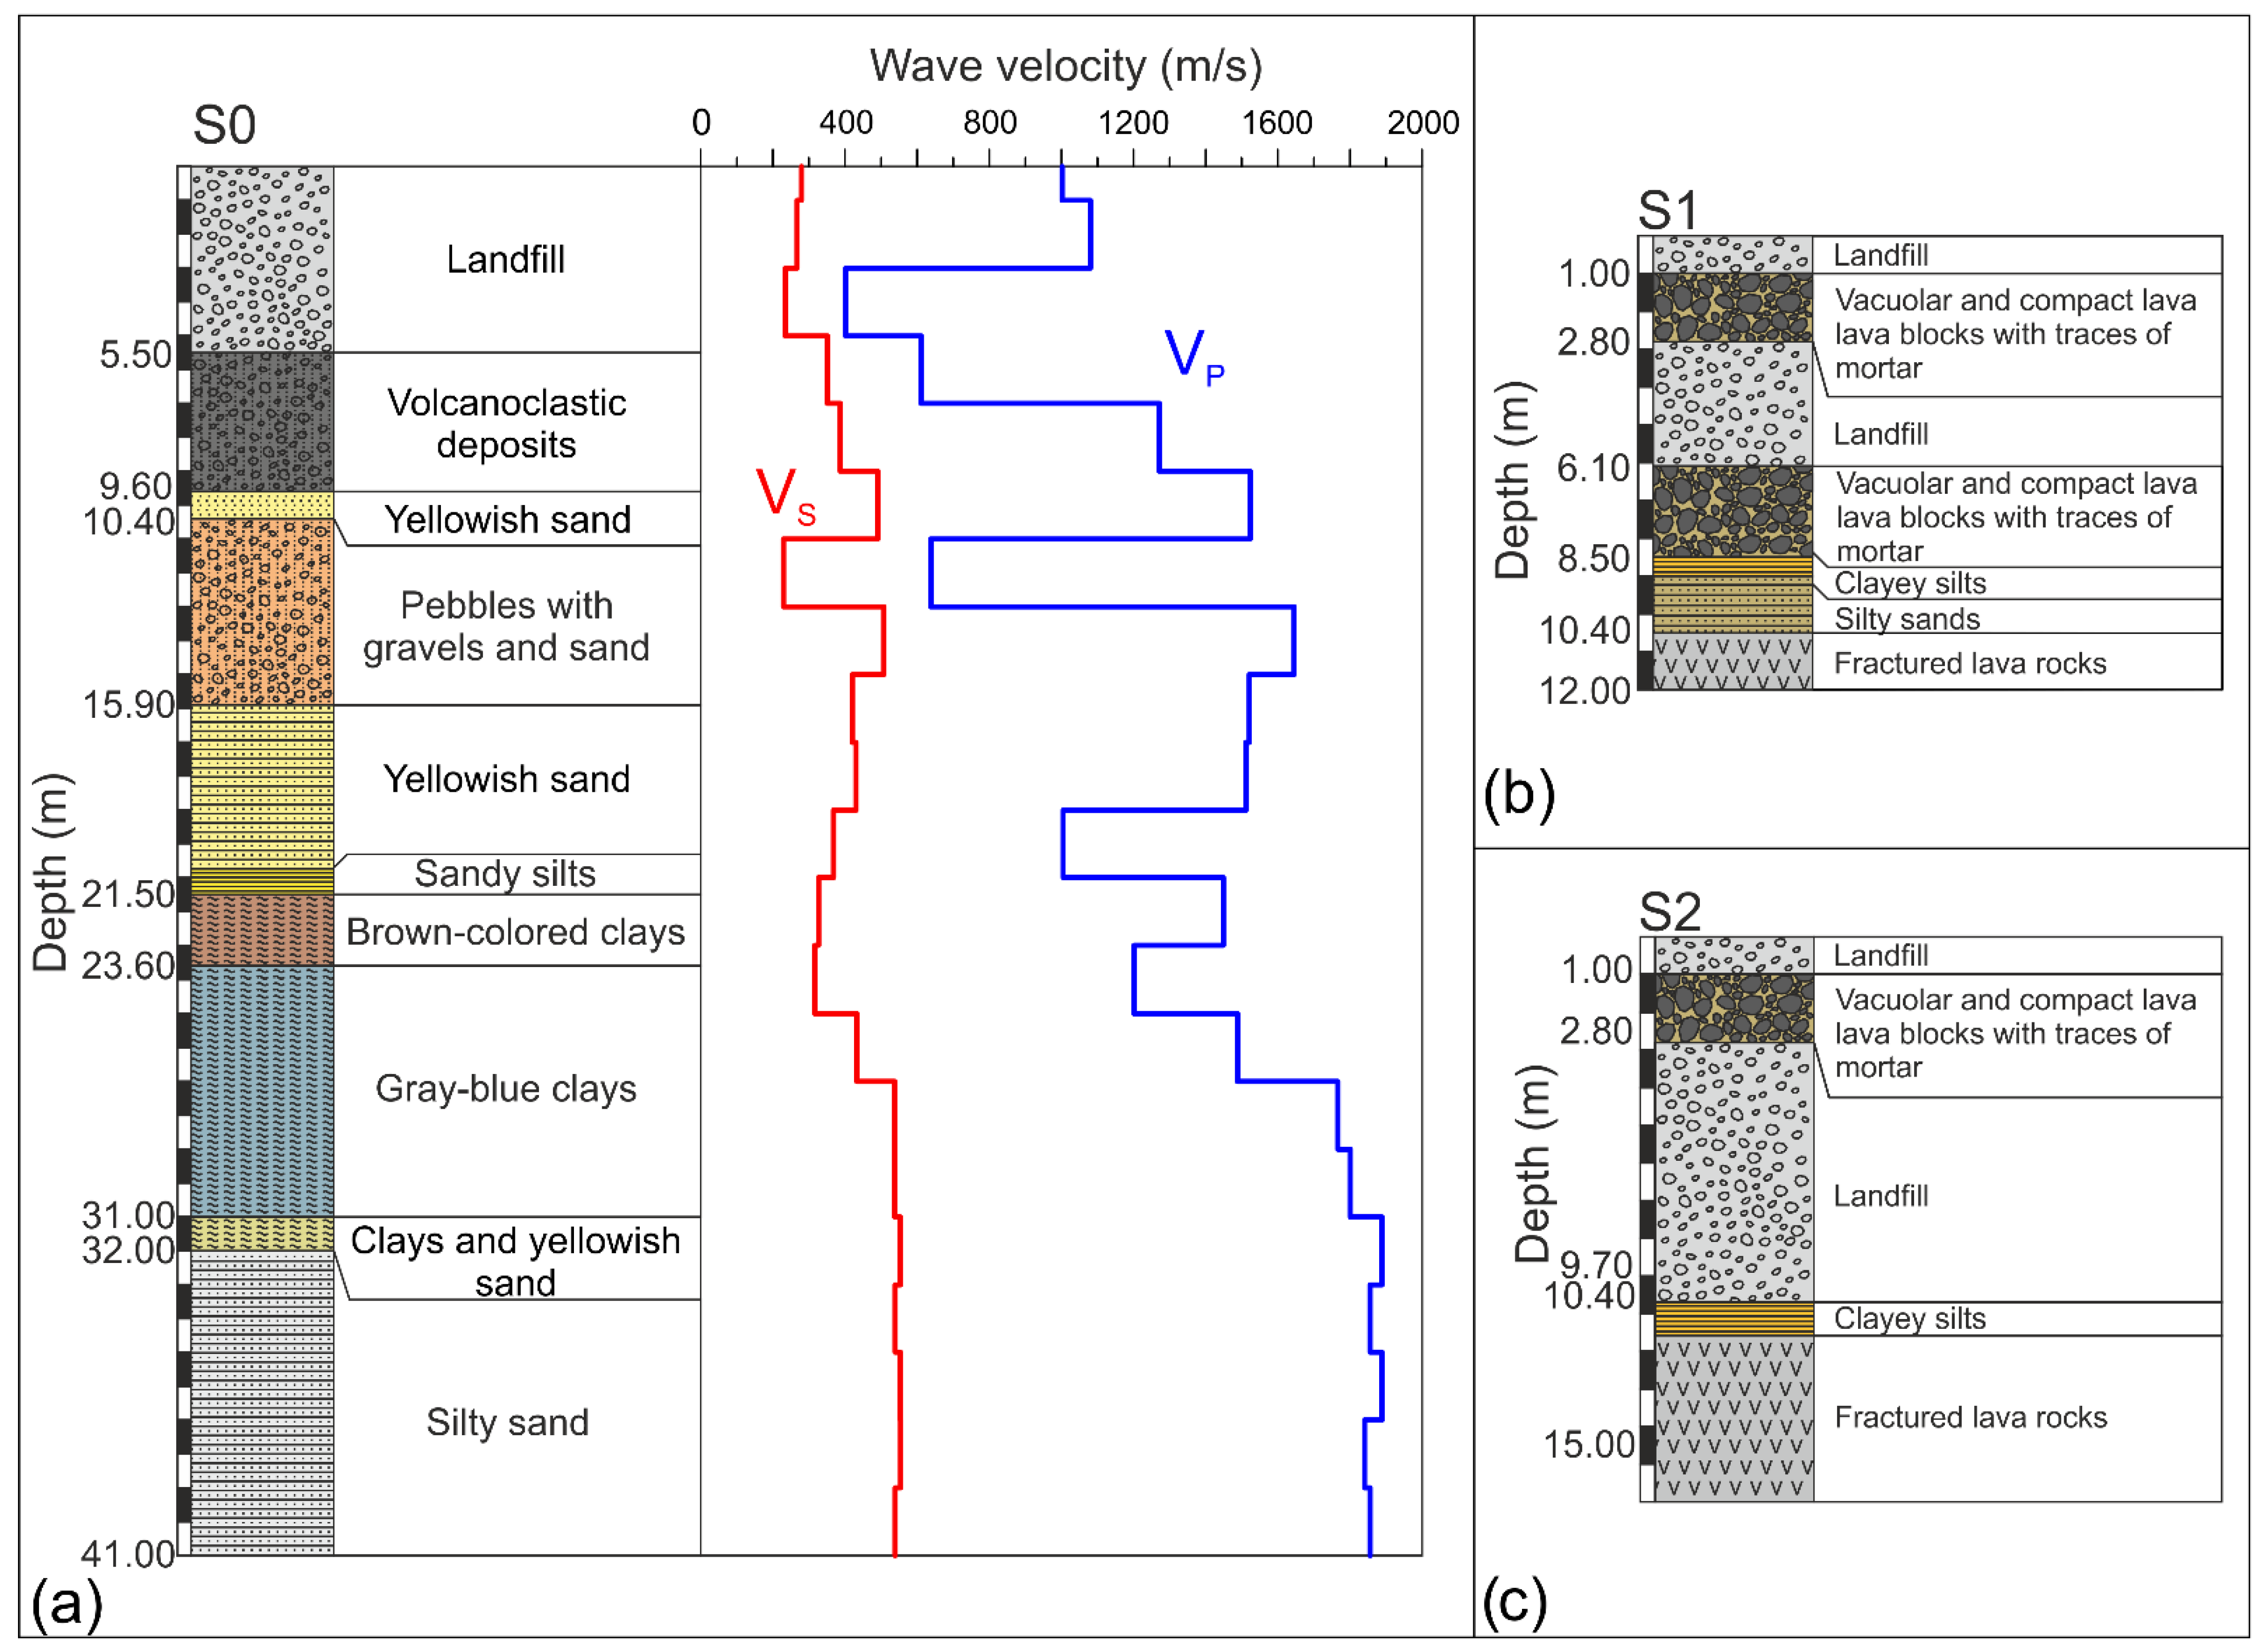
2.2. Geological Setting

The current geological features of the Catania area (Figure 1b) are the result of tectonic uplift and sea level fluctuations, which have resulted in flat marine terraces filled by lava flows, which erupted from the Etna Volcano during ancient and historical ages [31]. In particular, the subsurface of Catania is a composite setting with lateral heterogeneities at a local scale due to the presence of volcanic and sedimentary units [29]. The substratum is characterized by tens-of-meters-thick sands that overlay a sequence of Quaternary clays up to 600 m thick. The sands largely outcropping in the city’s southwestern half, as well as in some locations preserved from lava flows, are also present inside the clay layers and become prevalent, proceeding upwards in the succession. On the clayey basement, sands, conglomerates, and silty clays lie in discordance. The volcanic rocks are the most widespread lithotype outcropping in the urban area, covering almost the entire city substratum, and deeply changing the original morphology. Borehole data have highlighted the heterogeneous nature of this formation, which consists of alternating compact and scoriaceous levels that are highly variable in thickness [32]. Moreover, pyroclastic levels are observed in the sedimentary sequence of sand and sandy clays. Finally, in the historic town, the upper stratigraphic layer consists of several meters of debris (Figure 1b), which largely originate from the ruins of buildings destroyed by the 1693 earthquakes. A complete lithological sequence of the investigated area was acquired through some boreholes recovered from microzoning studies of Catania [33]. Villa Cerami (Figure 1b and Figure 2a,b) and Palazzo Boscarino (Figure 1b and Figure 2a,d) are located on a complex succession consisting, from top to bottom, of landfill and volcanoclastic and sedimentary deposits, as shown in S0 borehole (Figure 3a). Furthermore, the northernmost part of the building probably rests on volcanic rocks, as was found in the S1 and S2 boreholes at depths between 12 and 15 m (Figure 3b,c). The S0 survey, also equipped for down-hole surveys, has allowed researchers to estimate the velocities of the seismic waves of the first 41 m of the sedimentary succession (Figure 3a). A VS30 (S-wave velocity in the first 30m) of about 400 m/s was estimated. The site can be classified as B type soil [34]. Villa Zingali Tetto is located on the Larmisi lava succession (Figure 1b and Figure 4a,b) which is about 30 m thick, as shown in a profile of the geological map of the urban area of Catania [29] that intersects the study site. Near the Villa, there are no available borehole data. An accessible MASW (multichannel analysis of surface wave) [33] shows that the shear wave velocity is more than 300 m/s in the shallow part, and increases to more than 700 m/s at a depth of 12 m (Figure 4d). Considering the lithological characteristics and the VS30 (571 m/s) value (Figure 4d), the site can be classified as B type soil [34].

3. Description of Investigated Buildings
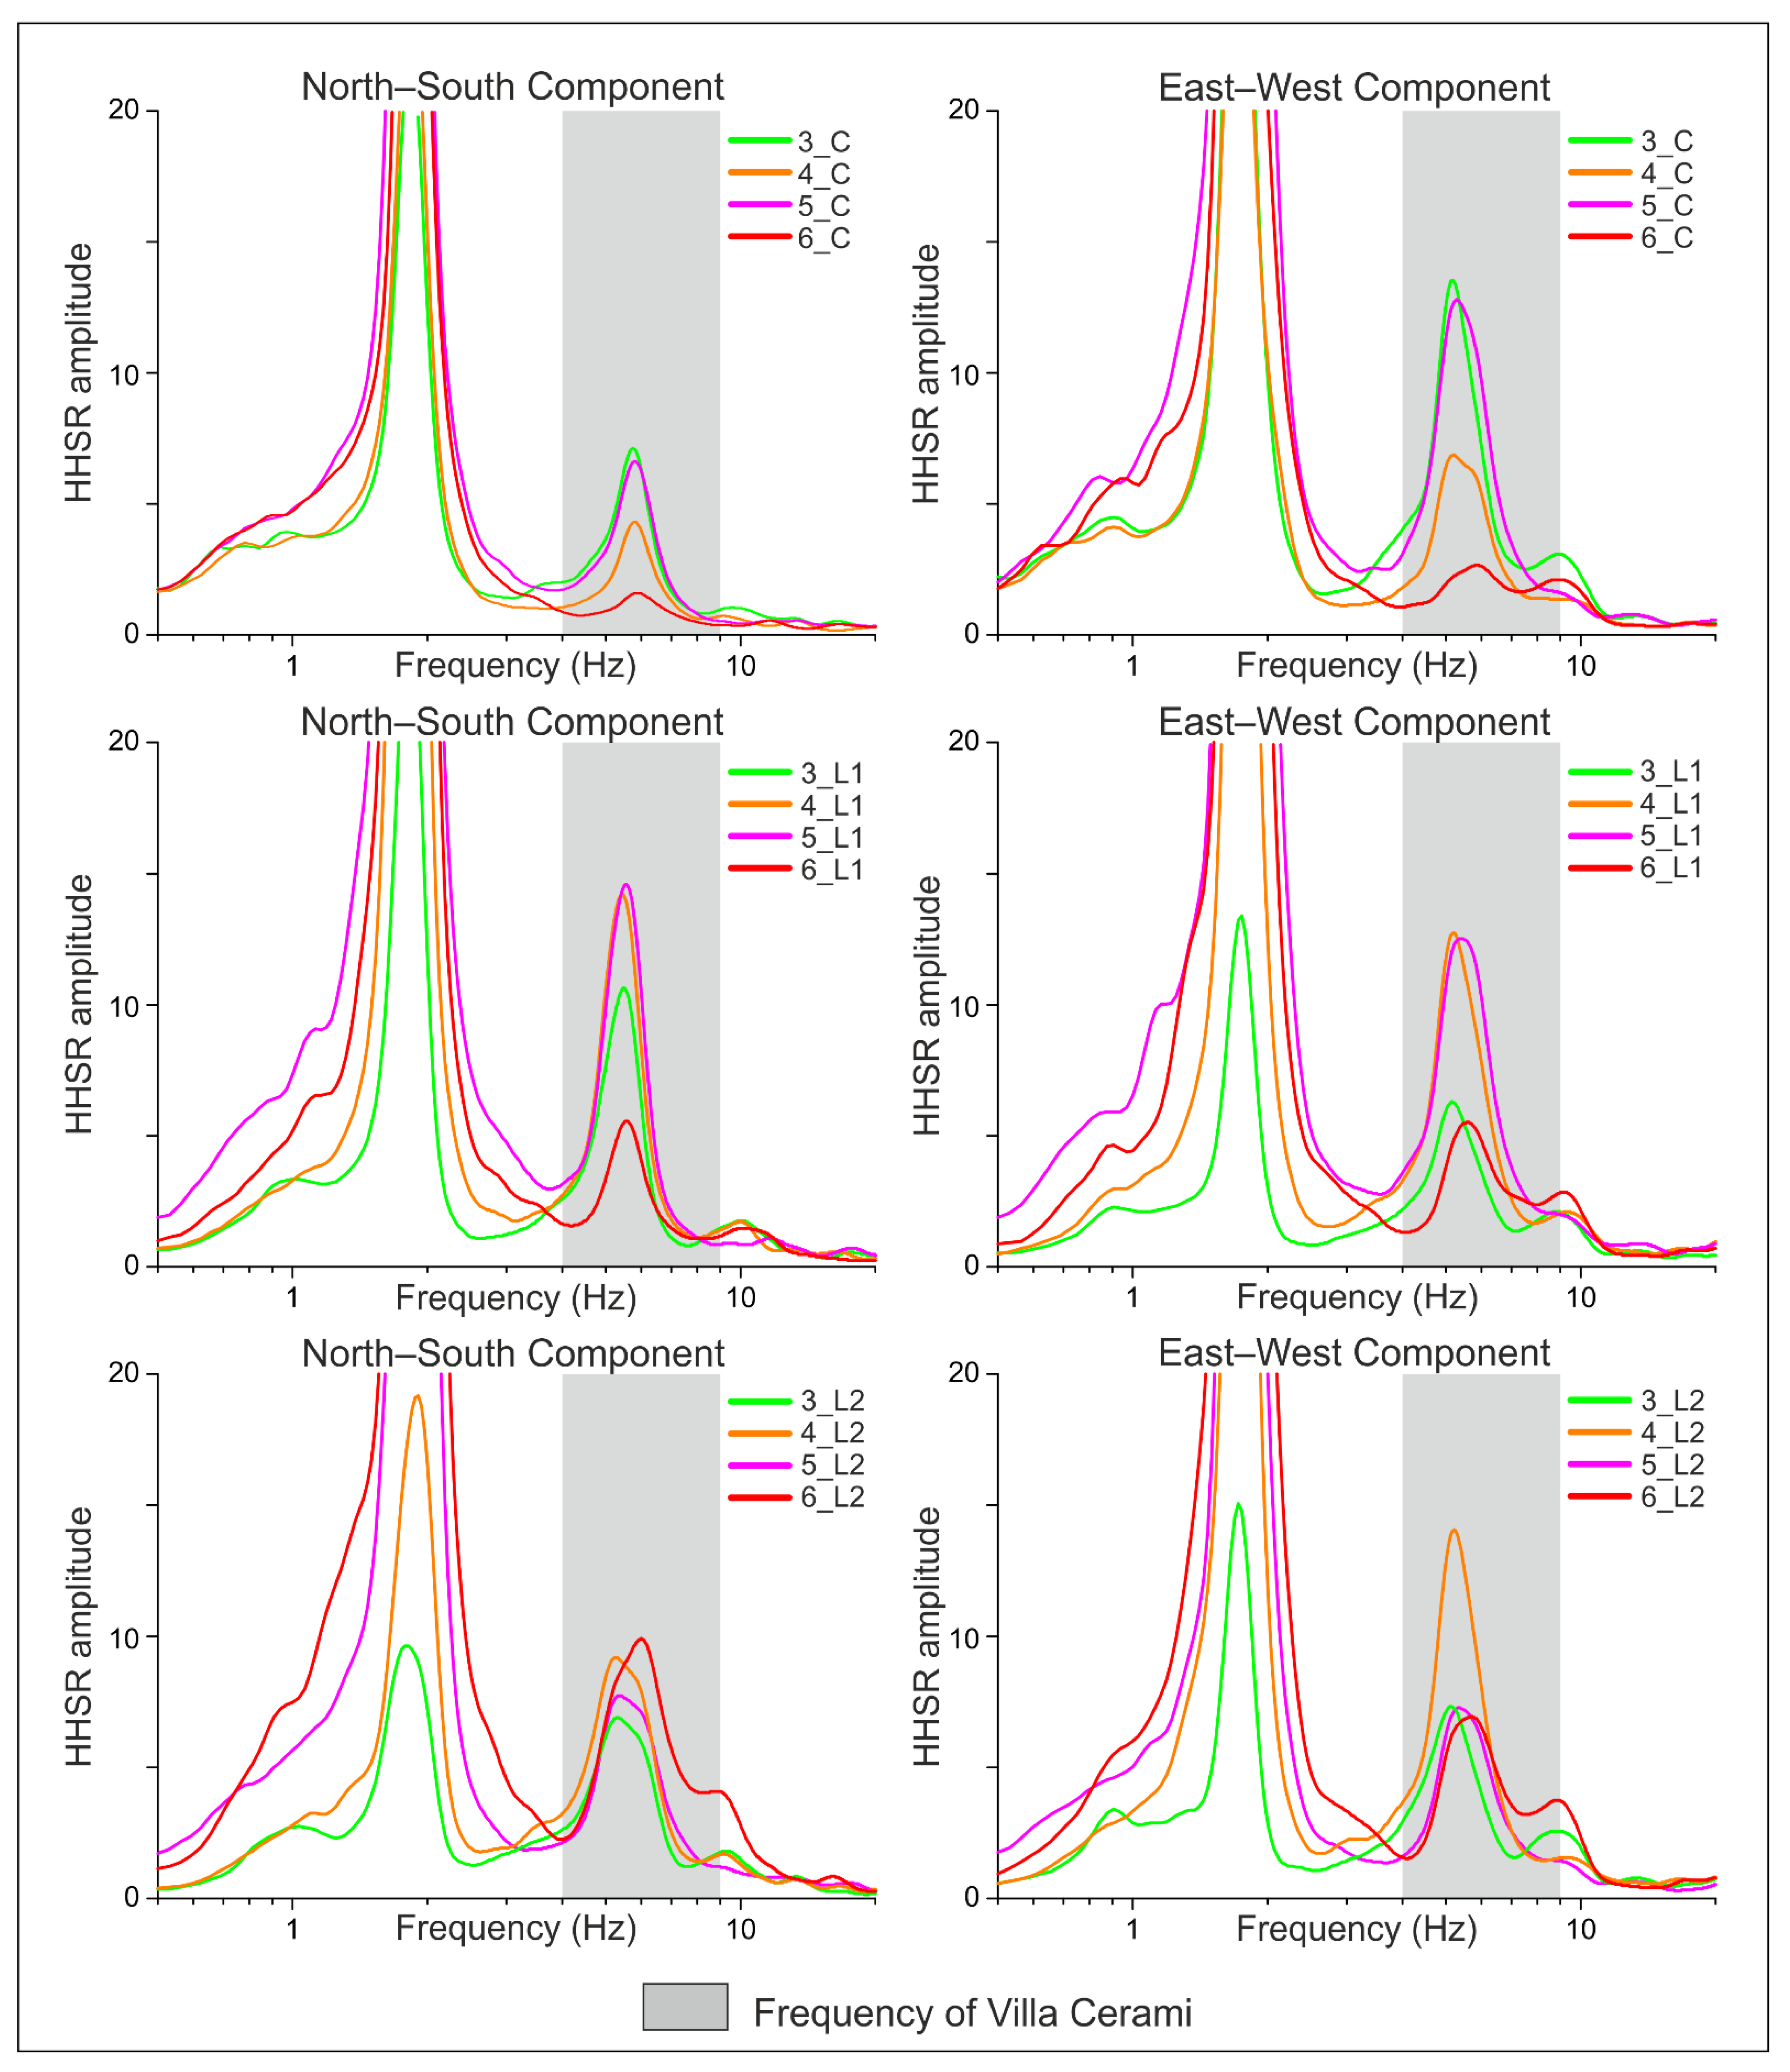
3.1. Villa Cerami

Villa Cerami (see location in Figure 1b) was constructed by the Rosso di Cerami family from about 1720 onwards, after the 1693 earthquake that had nearly destroyed the city. It is located at the end of Via dei Crociferi (Figure 2a) and is today the location of the University of Catania’s Law Department. The entrance portal, adorned with the Rosso di Cerami family’s lithic coat of arms, overlooks the large courtyard of the villa, into which the impressive staircase, complete with a fountain, leads. The villa is made up of 18th century masonry structures built in basaltic rocks that were renovated in the 19th century. According to historians, the Cerami princes made various modifications and enhancements to the villa. It is unclear whether the villa had only a central section that was later expanded by the noble family, or if the princes purchased a “great mansion.” With the partial consigning of the residence to a branch of a secondary school and the loss of some artwork, the 20th century was a period of decline for Villa Cerami. However, thanks to its acquisition in 1957 by the University of Catania, the villa returned to its former glory. The 19th century changes would lead one to suppose that in addition to reasons of use, the Villa was modified after the damage that it underwent due to the 1818, and probably the 1848, earthquake. The 1990 earthquake damaged the main staircase [26,35]. Villa Cerami is a masonry building (Figure 2b) consisting of four levels, each of differing height with an L-shaped floorplan, whose maximum longitudinal section is N-S oriented, and minimum is E-W oriented (Figure 2c).

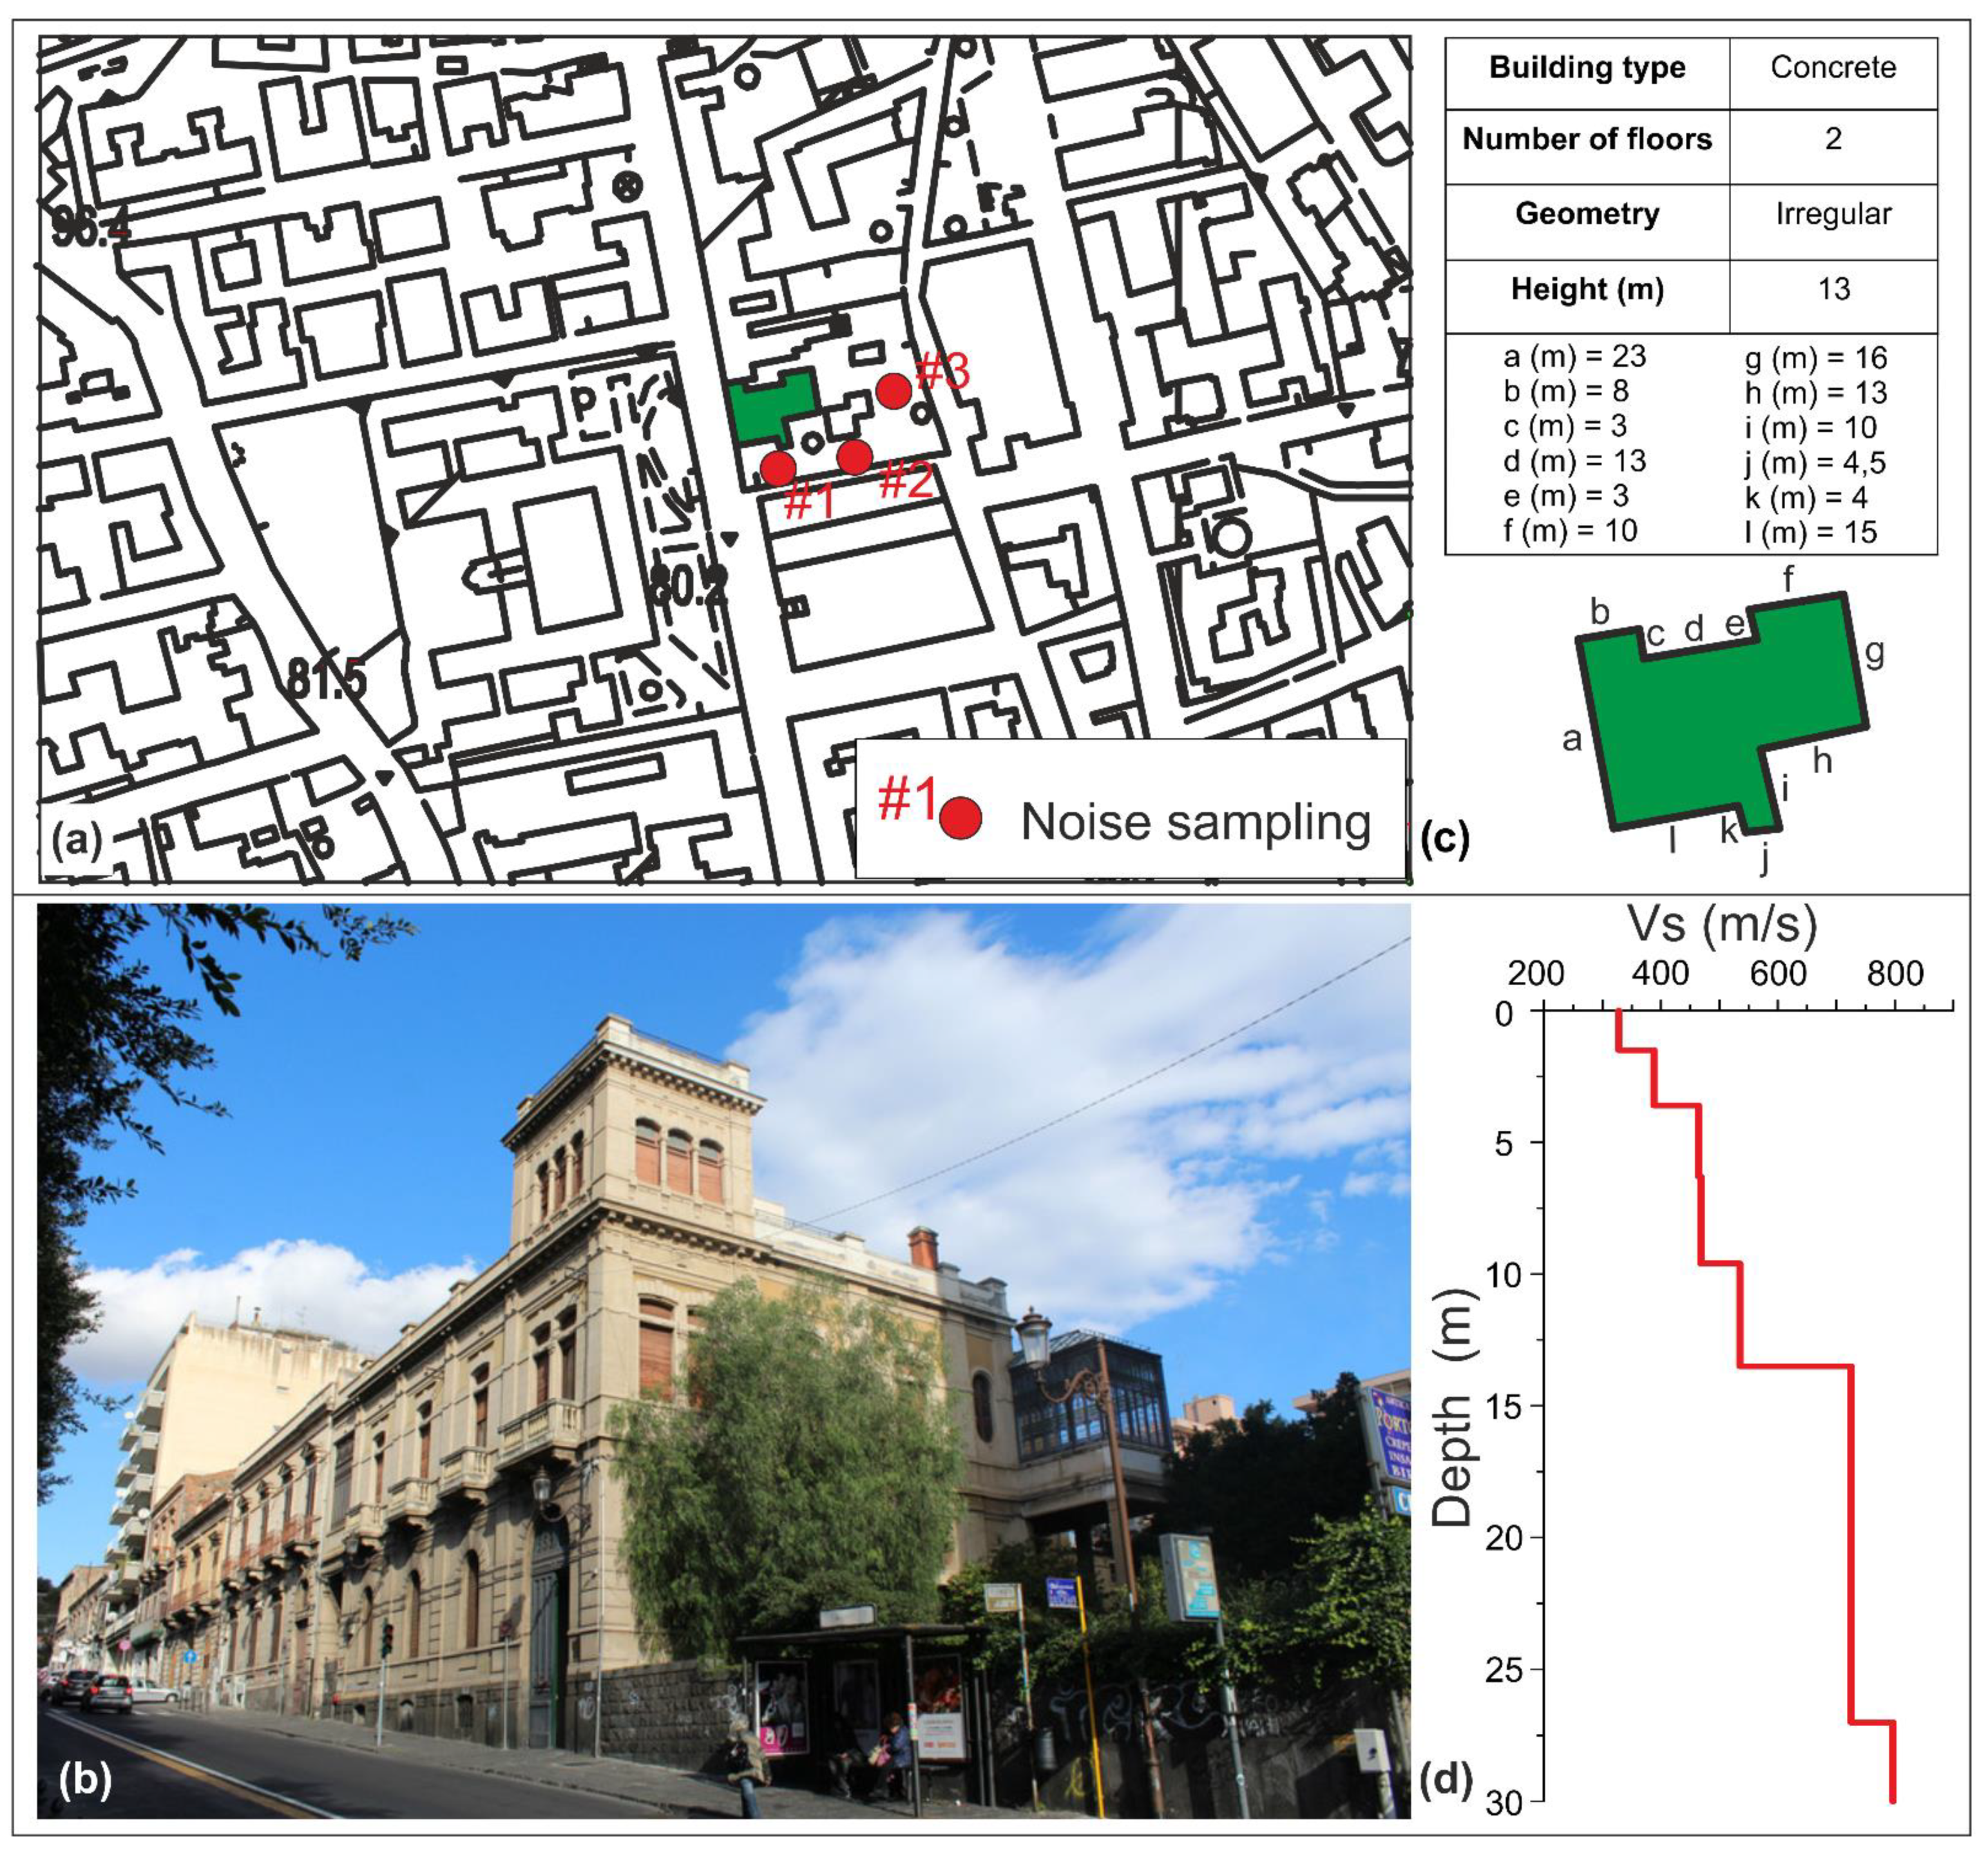
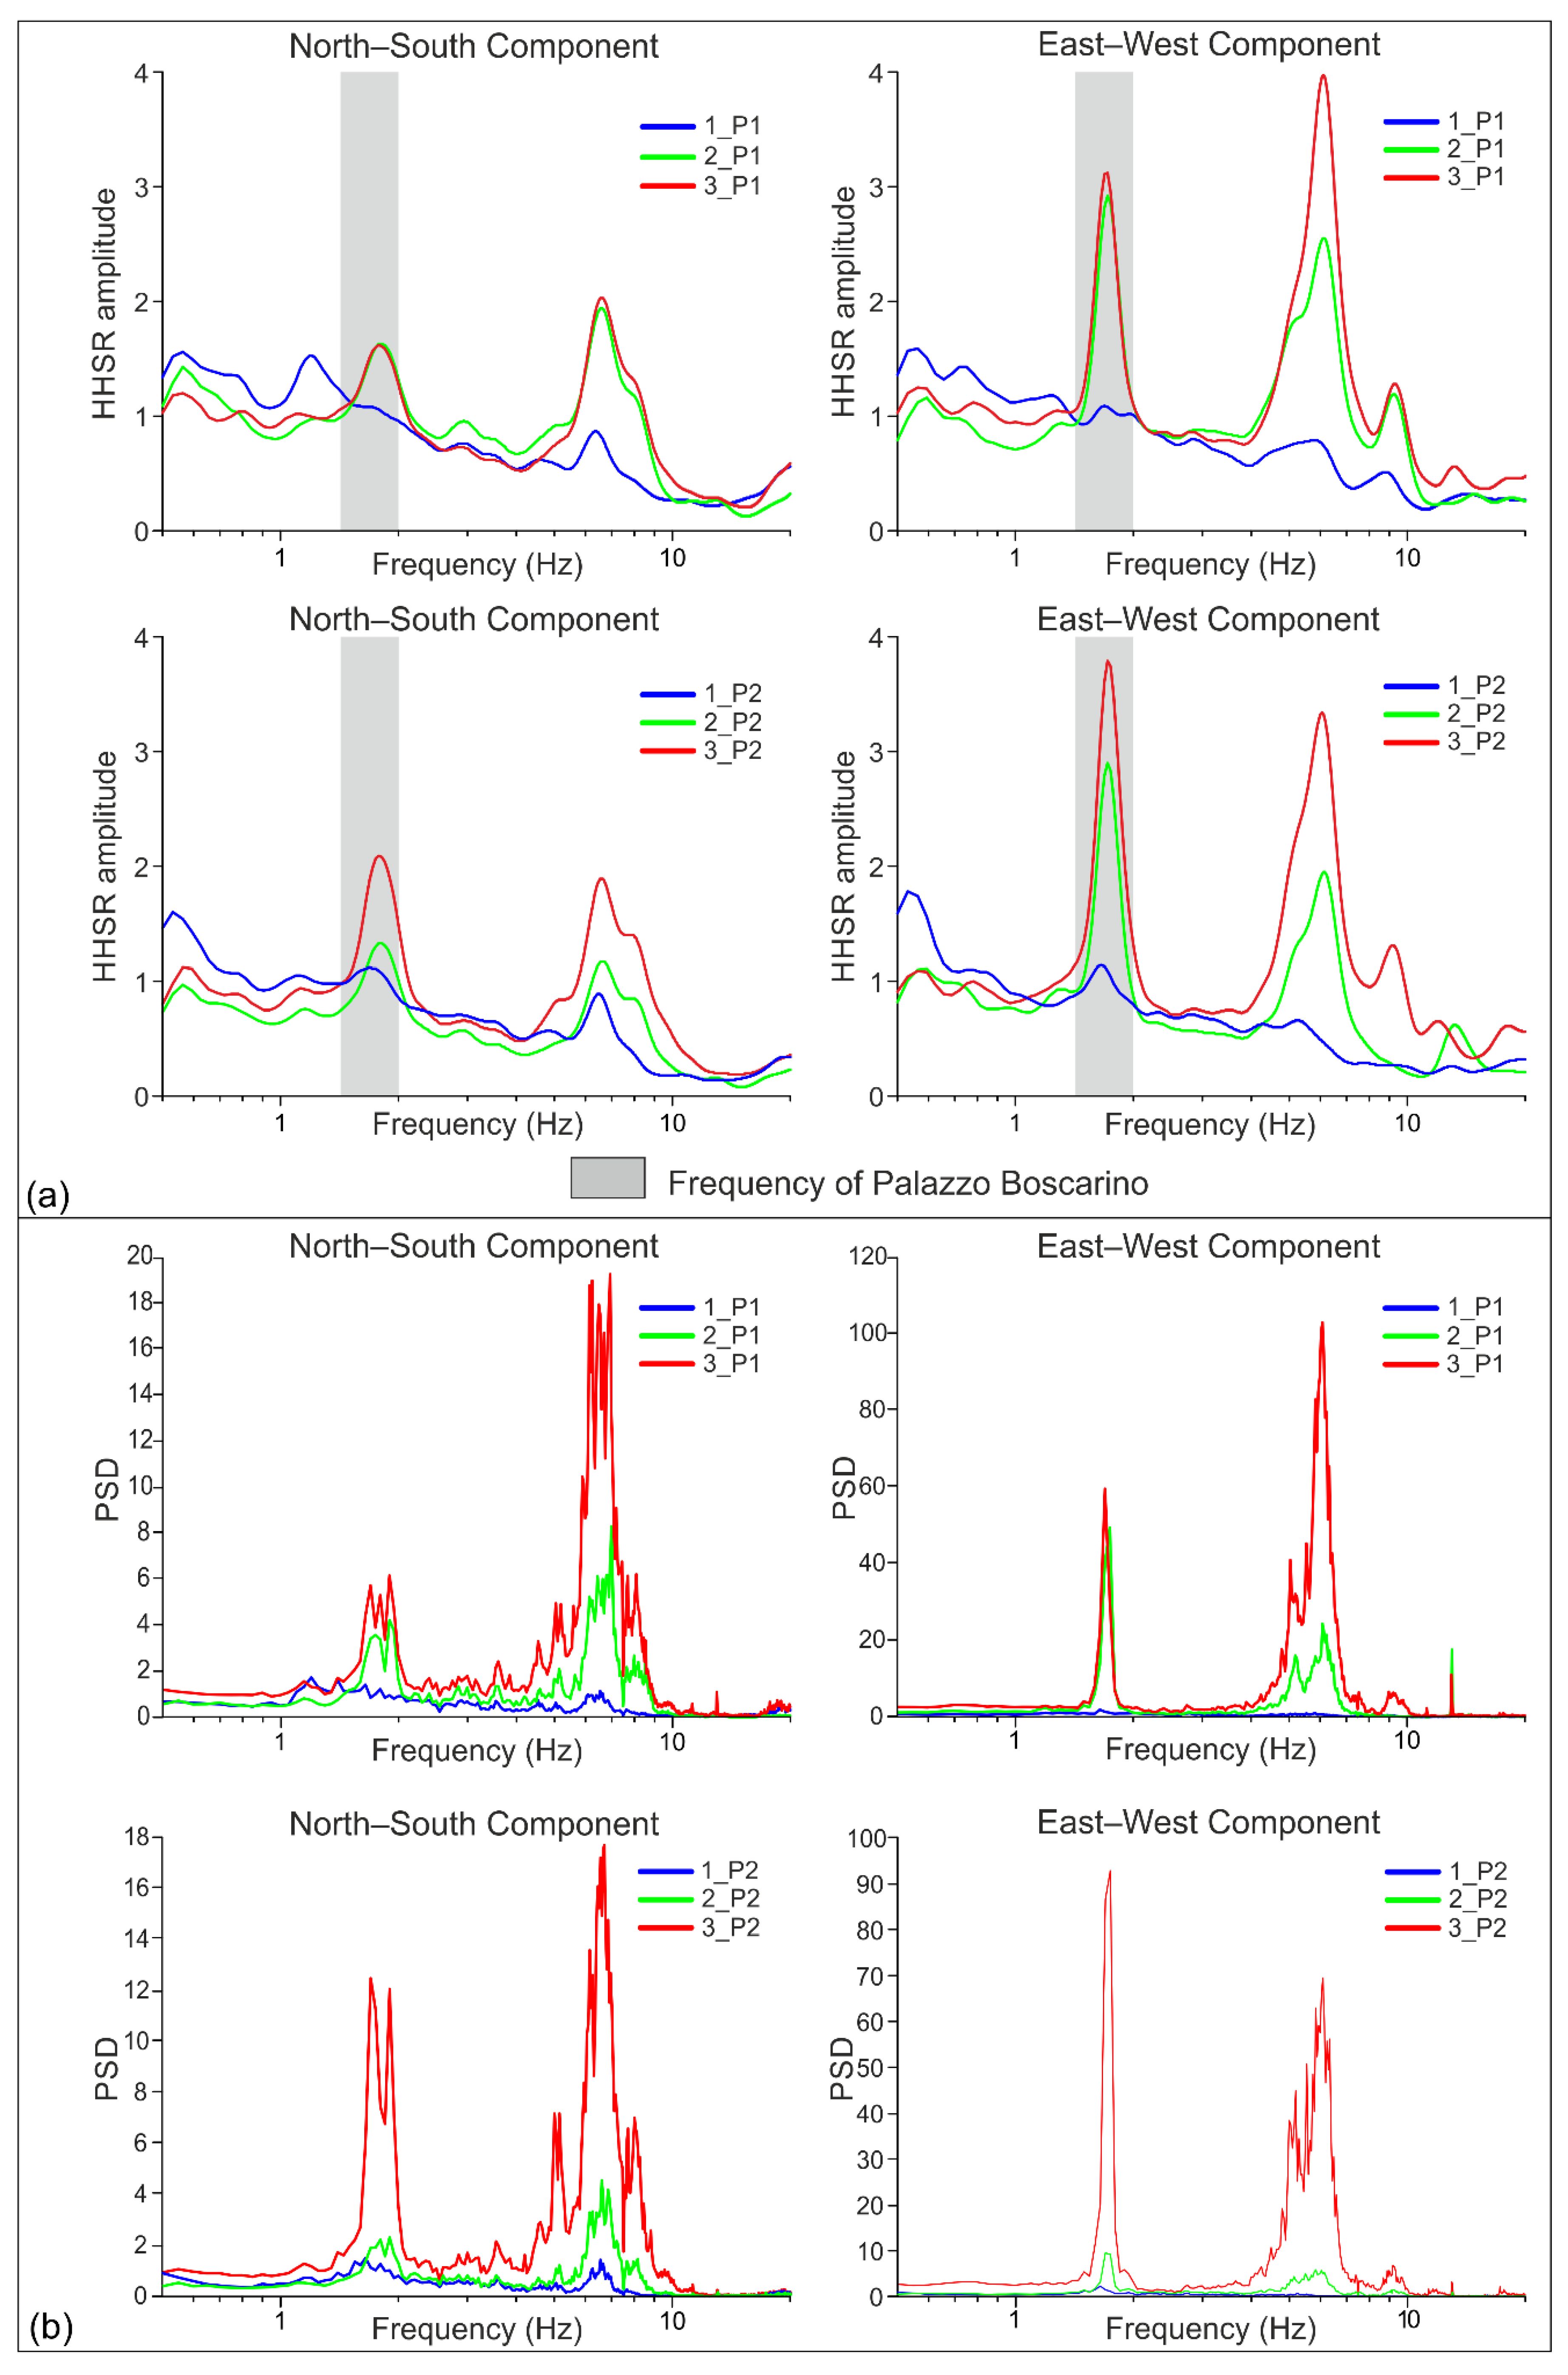
3.2. Palazzo Boscarino

The architects F. Basile and S. Boscarino designed a new building (Palazzo Boscarino) to house the “Legal Seminary” (see location in Figure 1b and Figure 2a). It is a five-story building (Figure 2d) where most of the libraries of the various disciplines (excluding the historical ones preserved inside Villa Cerami), rooms for teachers, assistants, and researchers, as well as rooms for the students and the technical-administrative staff, are located. Construction of the new building began in 1962, was completed in 1964, and inaugurated in the spring of 1965. Palazzo Boscarino is a reinforced concrete (RC) building without earthquake-resistant design (ERD), with a regular rectangular plan (Figure 2e). Only the strong 13 December 1990 earthquake occurred during the life of this building, but it did not cause damage to the building.

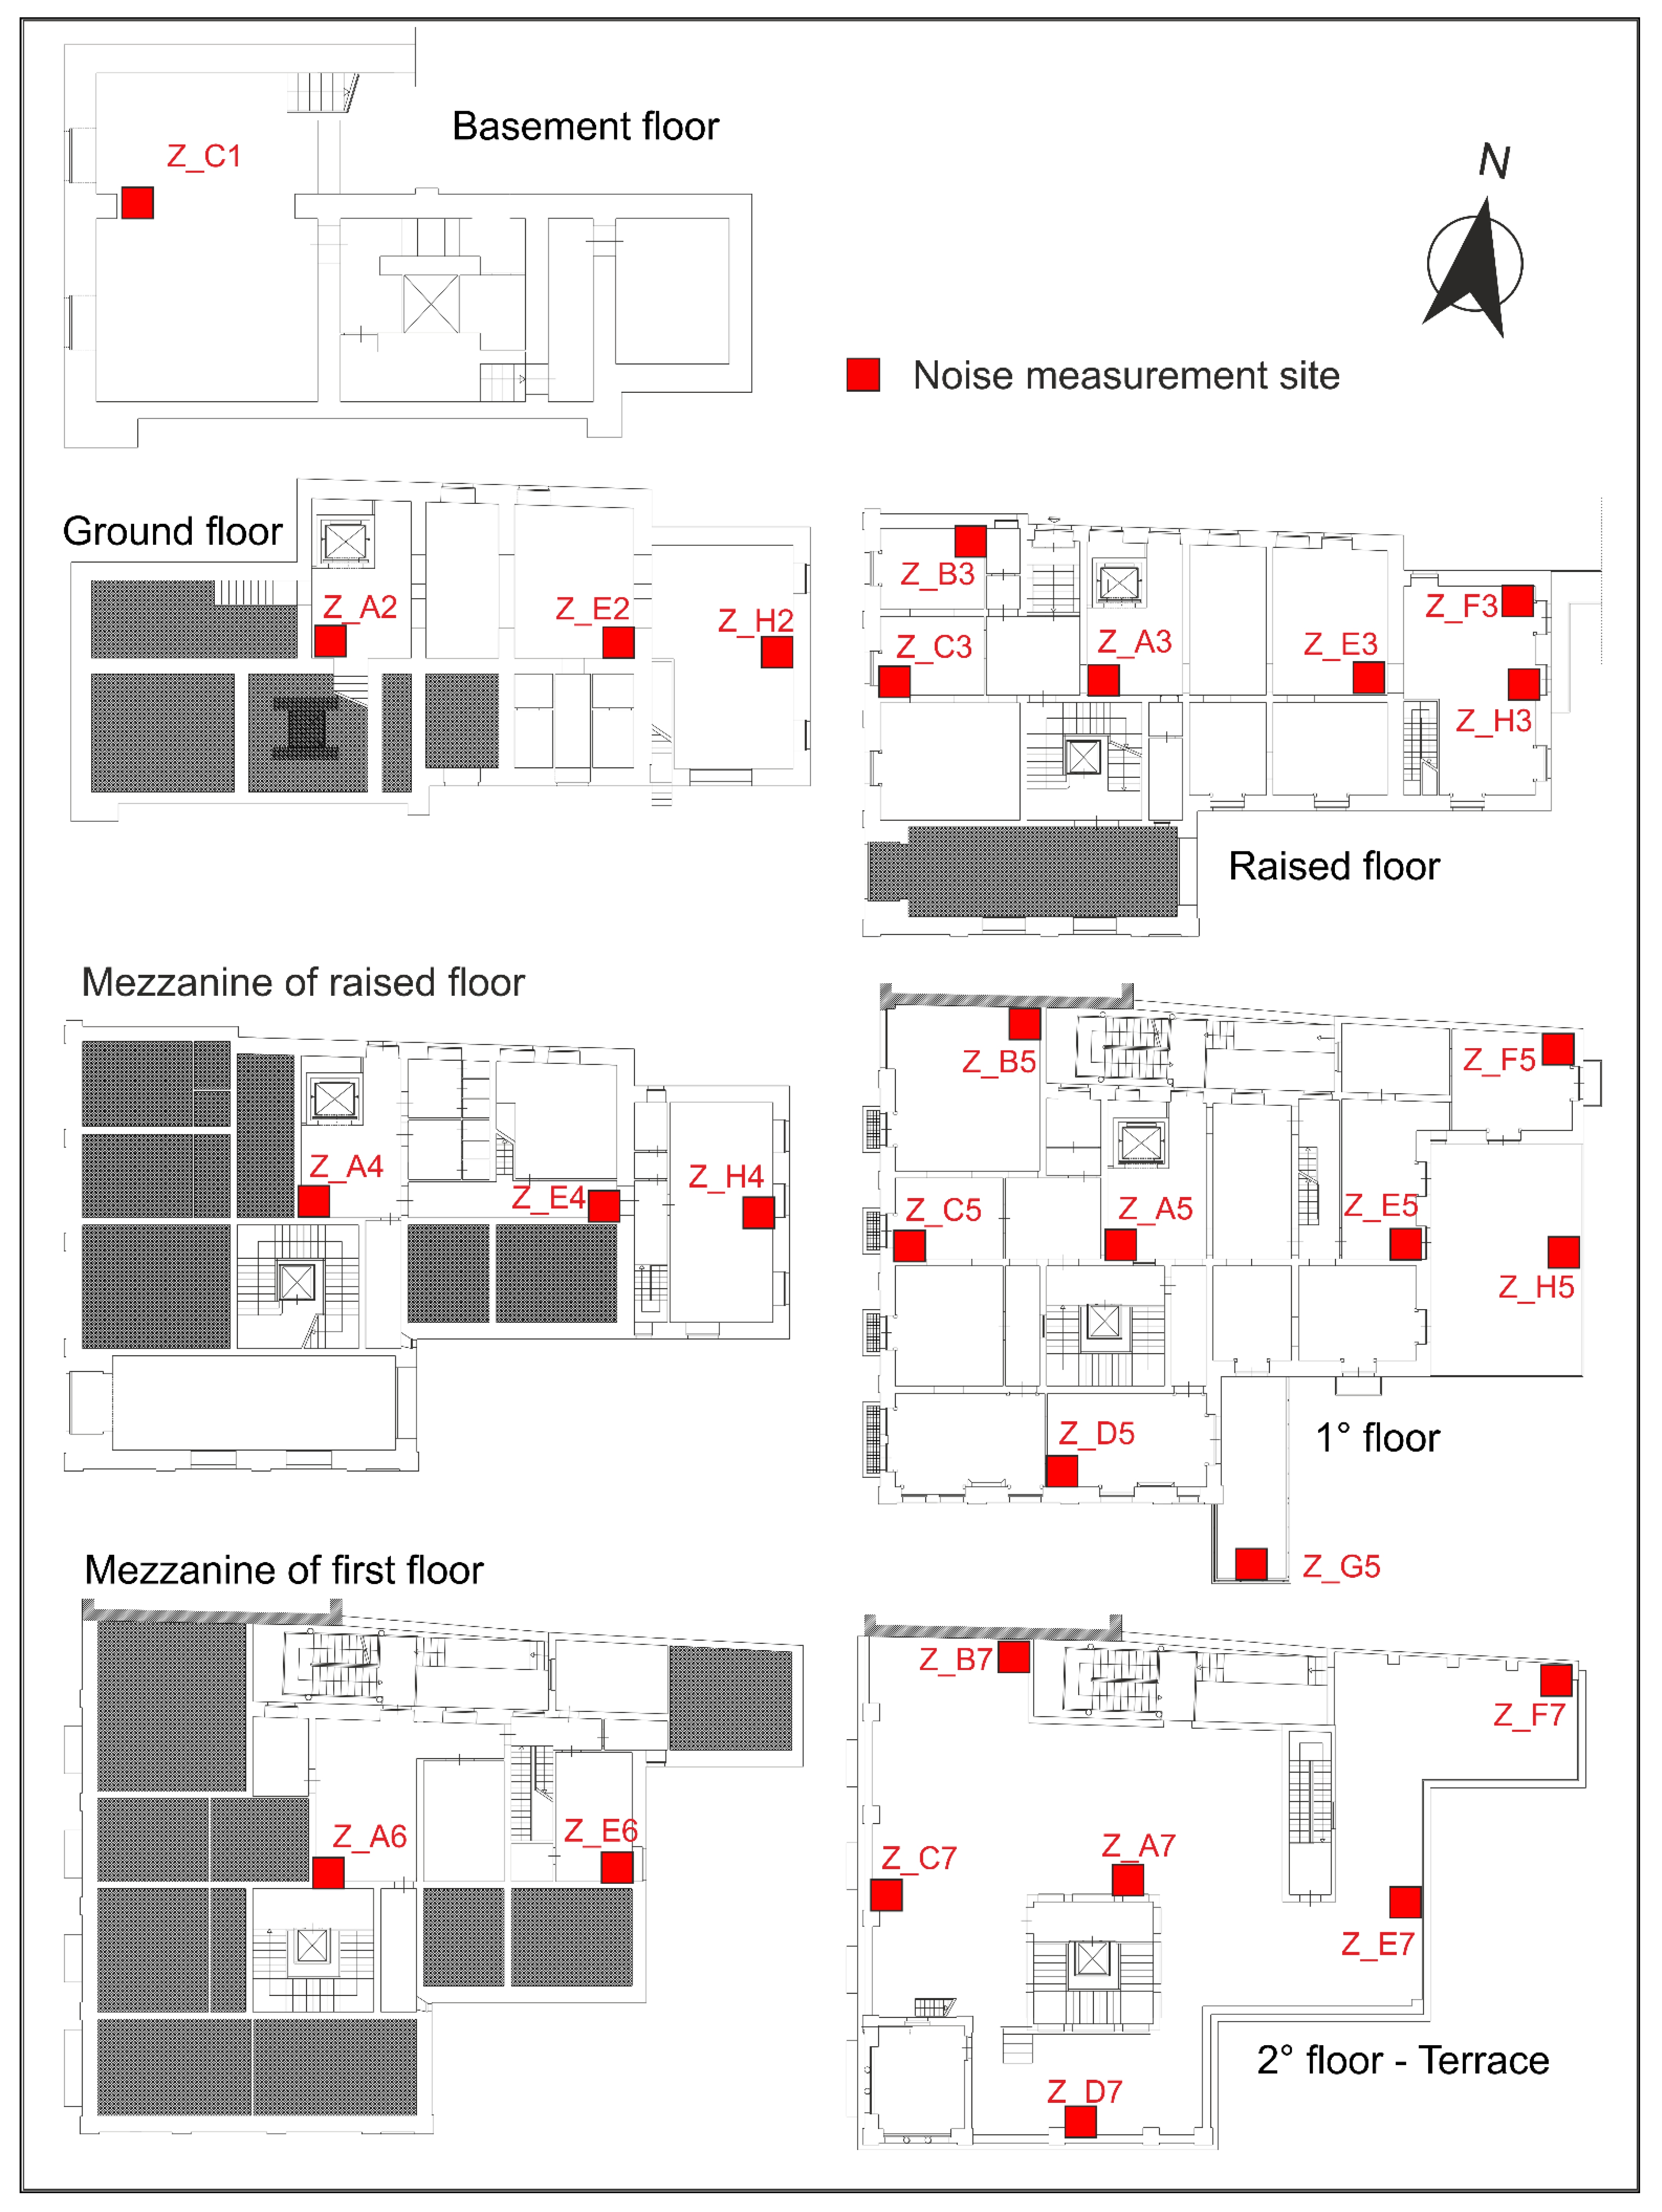
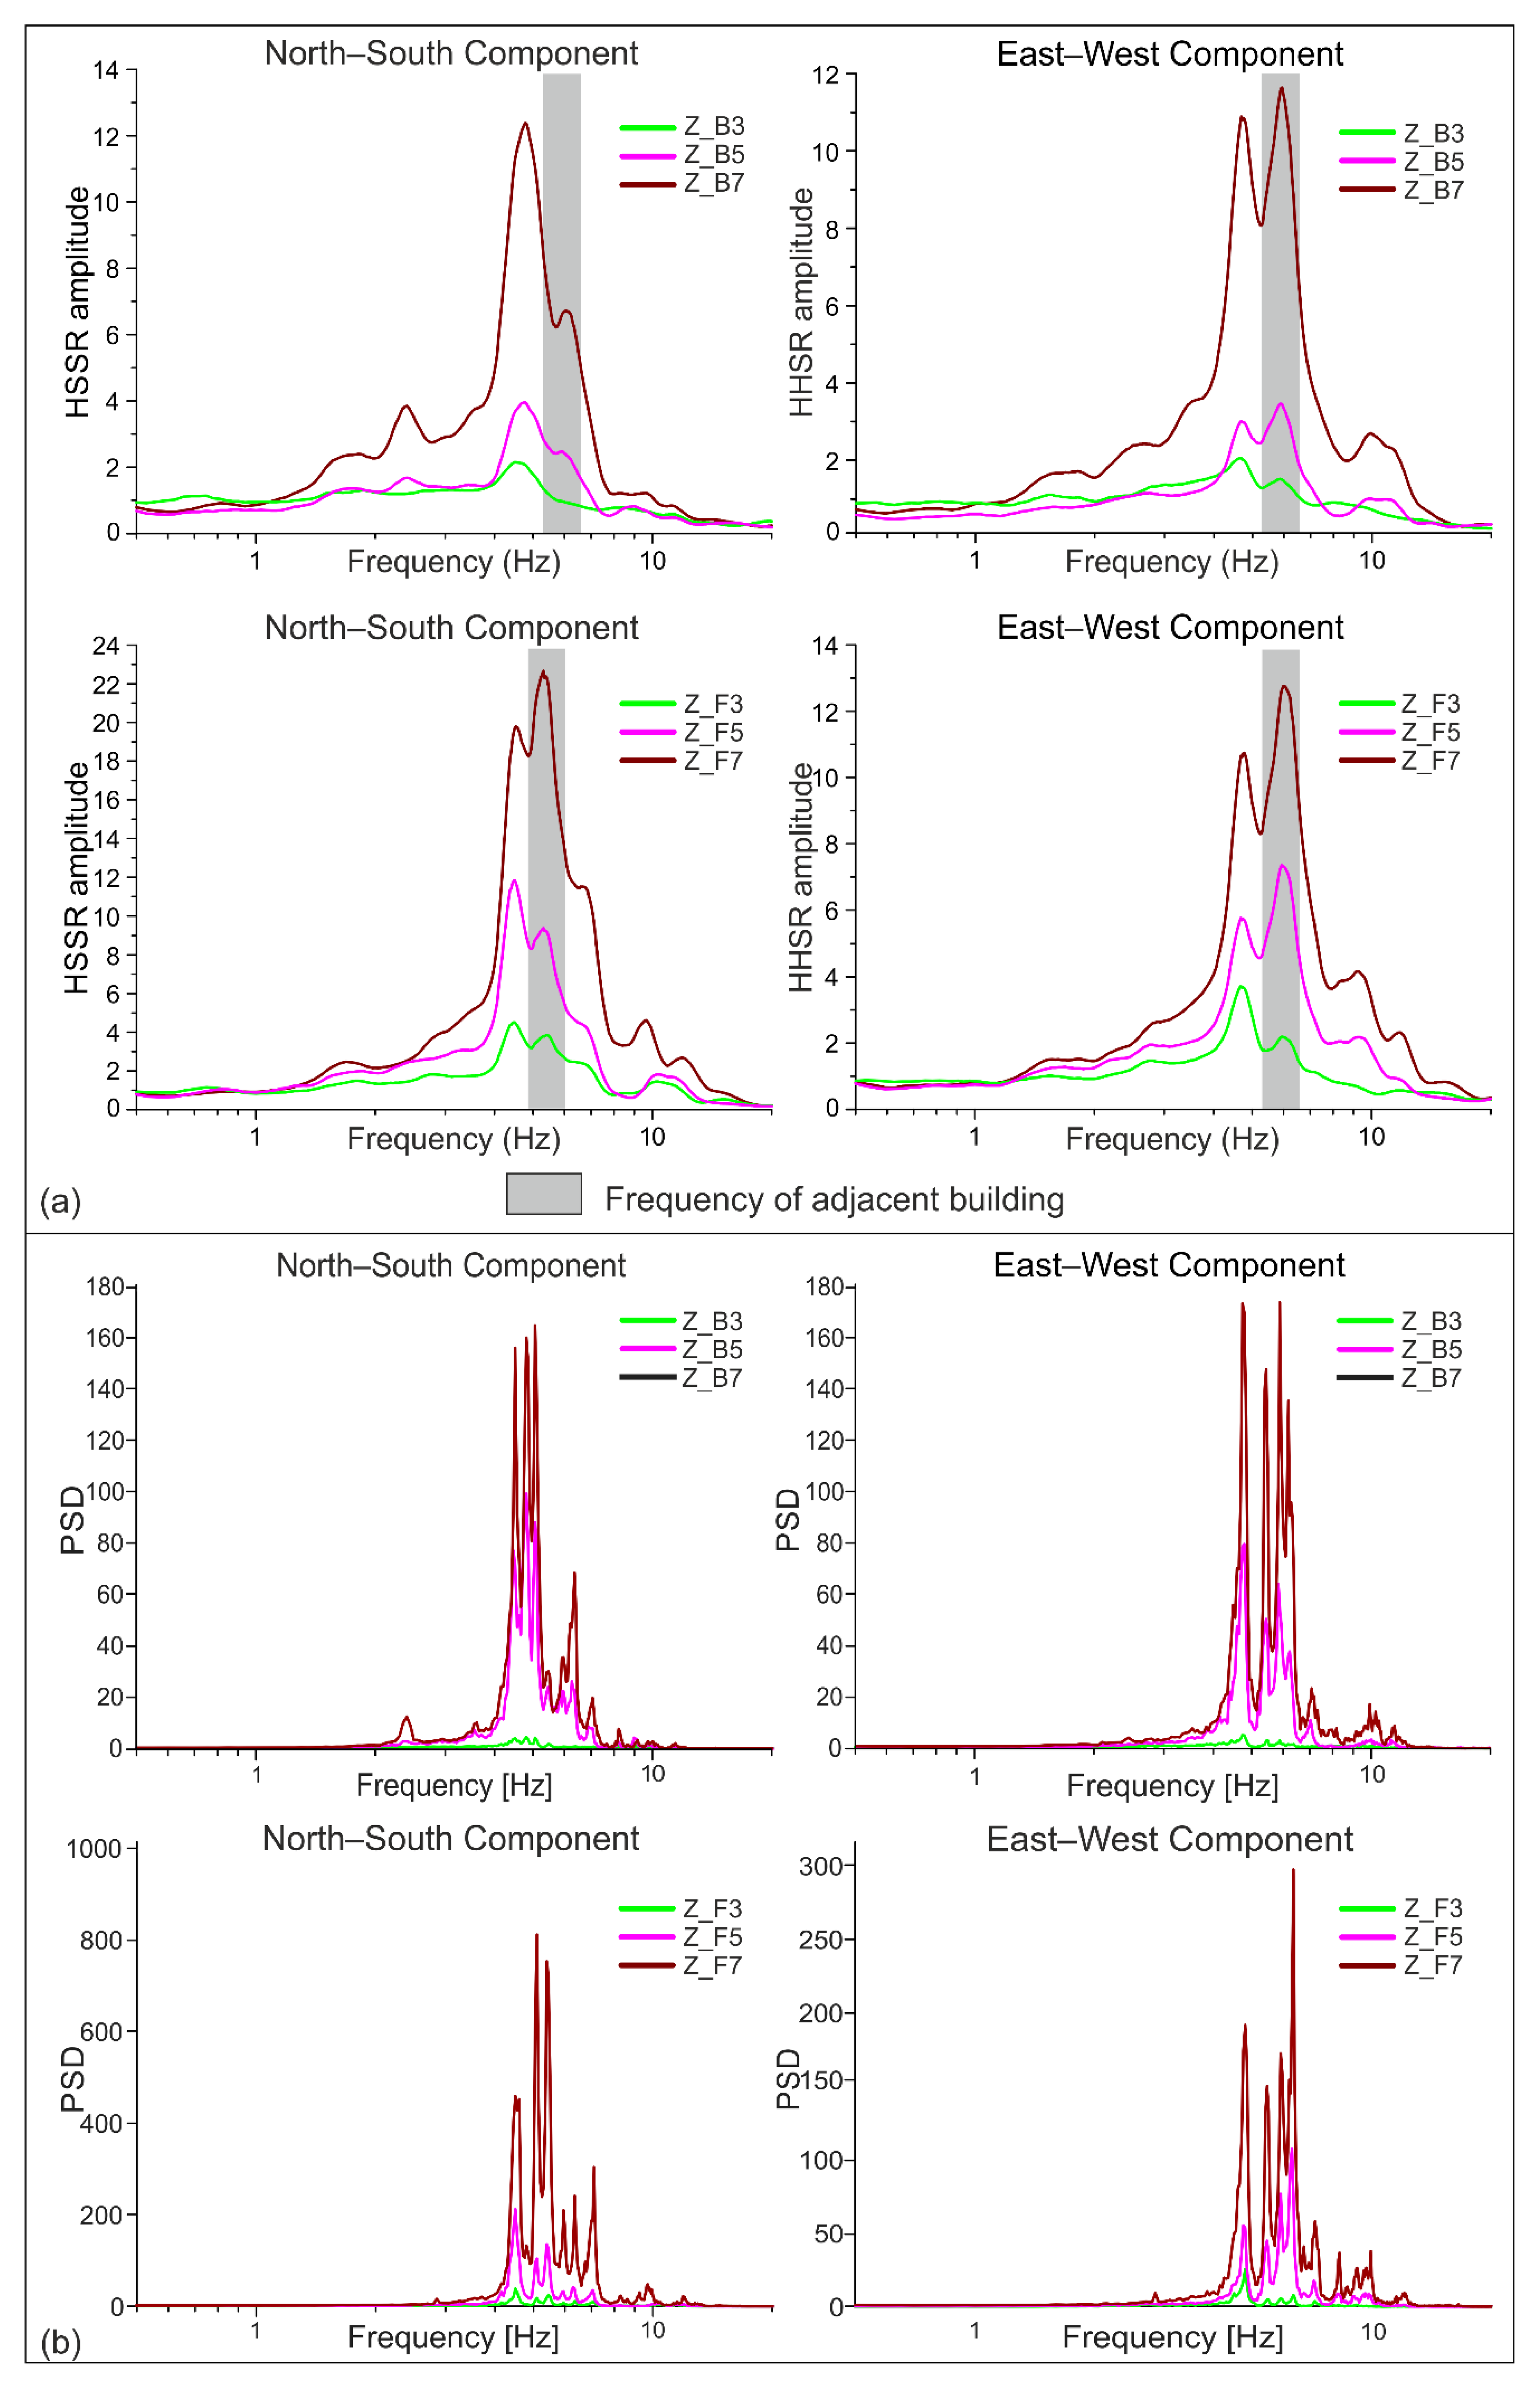
3.3. Villa Zingali Tetto

Villa Zingali Tetto is an Art Nouveau building designed by the architect P. Lanzerotti in 1926 and is located in the northern part of the Via Etna (see location in Figure 1b and Figure 4a). The villa, functioning as the residence of the professor Zingali Tetto, was declared of historic and artistic interest in 1984. It spans two floors and is characterized by a belvedere tower in one corner (Figure 4b). The main entrance is through a rounded ashlar portal leading into the hall. Beyond, there is the garden. The ground floor windows are round and arched with a radial frame, while the lowered arch openings on the first floor have balconies bordered by parapets and balustrades. Of equal compositional value is the covered veranda overlooking the garden, which consists of an iron structure closed with polychrome glass. The villa is owned by the University and is home of the Casa della Città University Museum. Villa Zingali Tetto is an RC building without ERC, with an irregular plan (Figure 4c). It was slightly damaged by the 1990 earthquake [26,35].

4. Methods

The period (T) and the damping (ζ) of a building contribute significantly to the amplitude and duration of a seismic action. The period of a building can be assumed equivalent to that of a damped harmonic oscillator, with a mass (M) and a rigidity (K):
T = 2 π M K  
Building height, structural typology, maintenance state, and regularity/irregularity in plan and elevation can also considerably affect such parameters. To evaluate T, several numerical methods for modal analysis, such as the finite element method or the boundary element method, are widely used. Empirical relationships provided by seismic codes [36], correlating T with the height (H) in meters, are also used to resolve the building period:
T = CtHa  
where Ct and a are parameters that are linked to the type of structure. These relationships are often unable to define an accurate T value for studied buildings. For this reason, to estimate the building’s dynamic properties, experimental techniques based either on the use of forced vibrations [37] or earthquake inputs [38,39], as well as on ambient vibrations, [40] are frequently adopted. Among the experimental procedures, the ambient vibrations method has become widely used, since it is easy to use and fairly low-cost. However, it is important to note that a comparison between the T estimated for undamaged buildings using ambient vibrations shows that these are 10–30% lower than T values estimated using earthquake seismic inputs [41,42,43]. Here, ambient vibrations treated through HVSR techniques were used to estimate the seismic site effects in the selected building area (Figure 1b). In addition, the spectral ratios between the Fourier spectra of horizontal components (HHSR), which are valued at the base and the different building levels, were used to determine if the frequency of the buildings is close to the frequency of the underlying layers, seeking to obtain the dynamic behavior of the structures. These procedures allow for detection of the possible soil–structure resonance effects that can arise when the fundamental frequency of a building shares the same range as that observed in the foundation soil. It is important to note that reading peaks in spectral amplitudes solely at one level of a building may indicate system resonant frequencies, where the “system” comprises both the structure and the interacting part of the local soil. Hence, changes in system frequencies after earthquakes may erroneously point to damage in the building, while in fact the non-linearity occurred in soil, such as in [44,45,46].
The damping values were evaluated by using ambient noise recordings, through the below-described random decrement method (RDM). Finally, torsional effects that can contribute to increased building damage, as suggested in all structural design codes, including Eurocode 8, 2004 [36], were evaluated.
Furthermore, for the Villa Cerami and Palazzo Boscarino area, where a complete stratigraphy and a downhole were available (Figure 3a,b), 1D modelling was carried out to reproduce the seismic site effects on the outcropping lithology. Since we had no earthquake recordings for the investigated sites, a numerical modelling was performed using the code STRATA [47,48].
To estimate probable seismic scenarios for the selected buildings, the peak ground acceleration (PGA) and mean acceleration response spectra (SA), obtained by 1D subsoil modelling, were utilized to compute the macroseismic intensities that can be caused by the obtained ground motion, using two relationships available in the literature. Finally, since the MCS scale and European Macroseismic scale (EMS98) assess the same intensity values, beyond the uncertainties [49], the EMS98 scale was used to predict the level of probable damage at the different estimated intensities according to the classification of damages expected in the EMS98 scale for buildings of different vulnerabilities.

5. Data Acquisition and Results

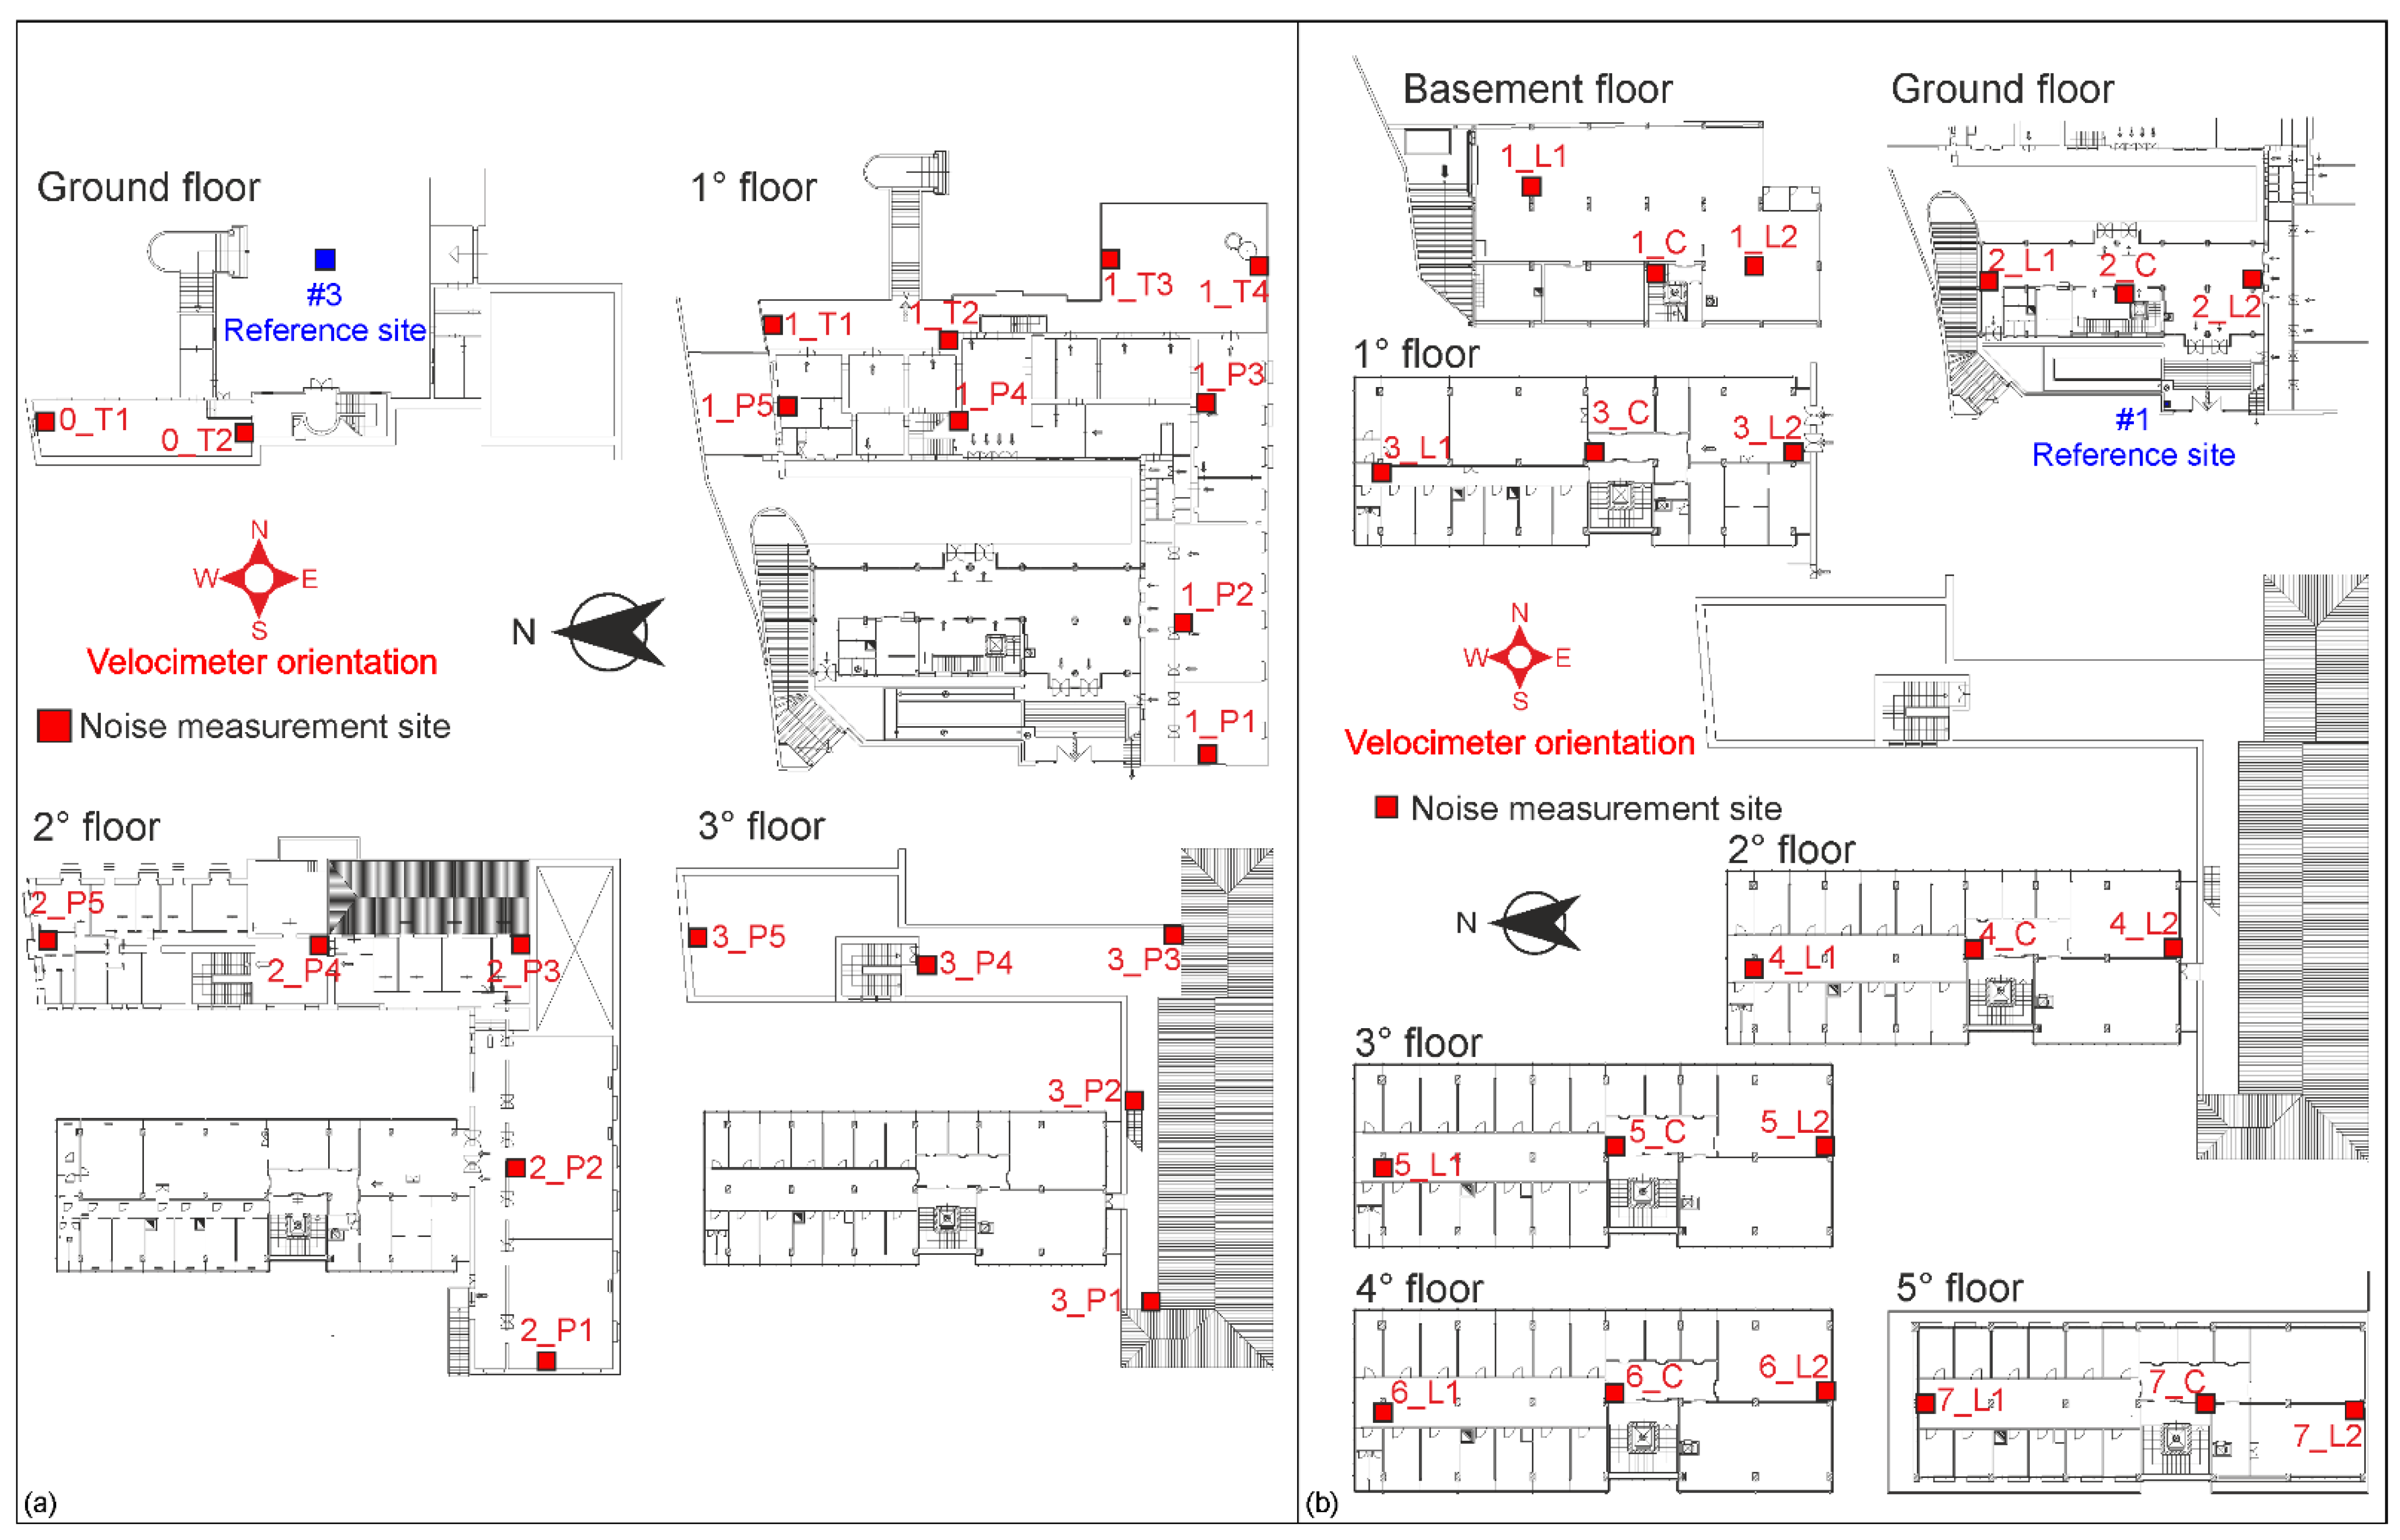
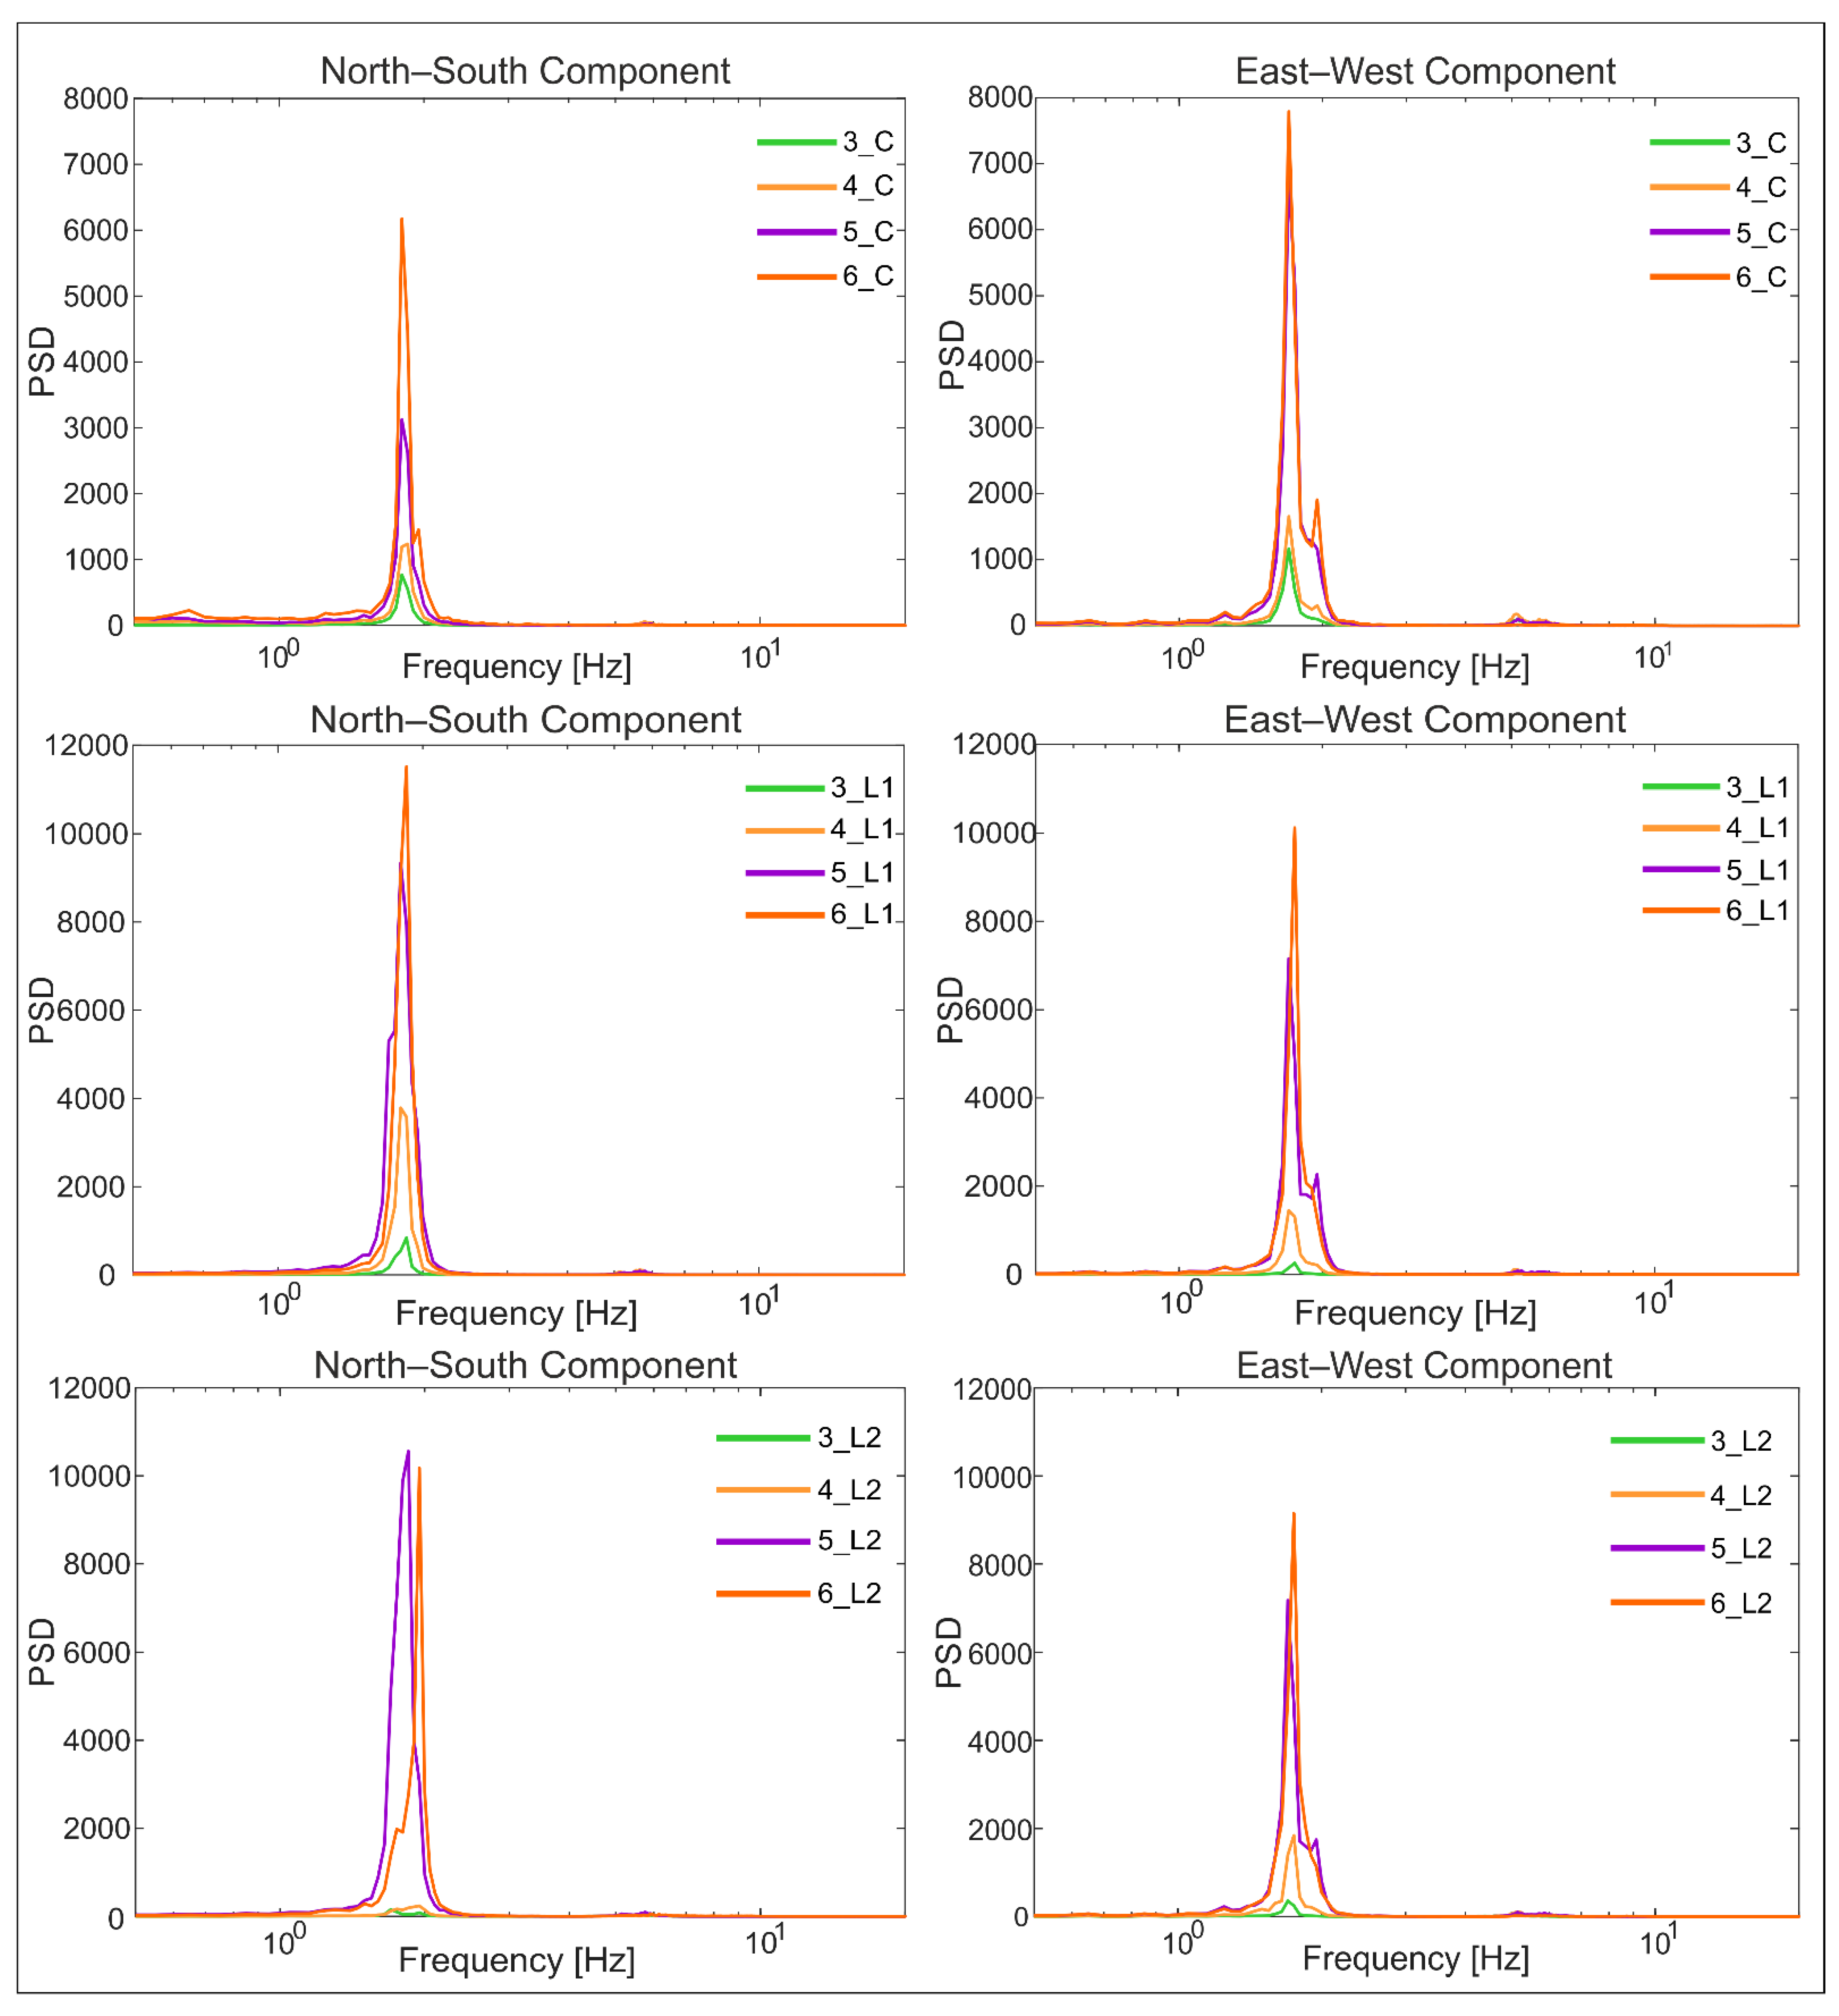
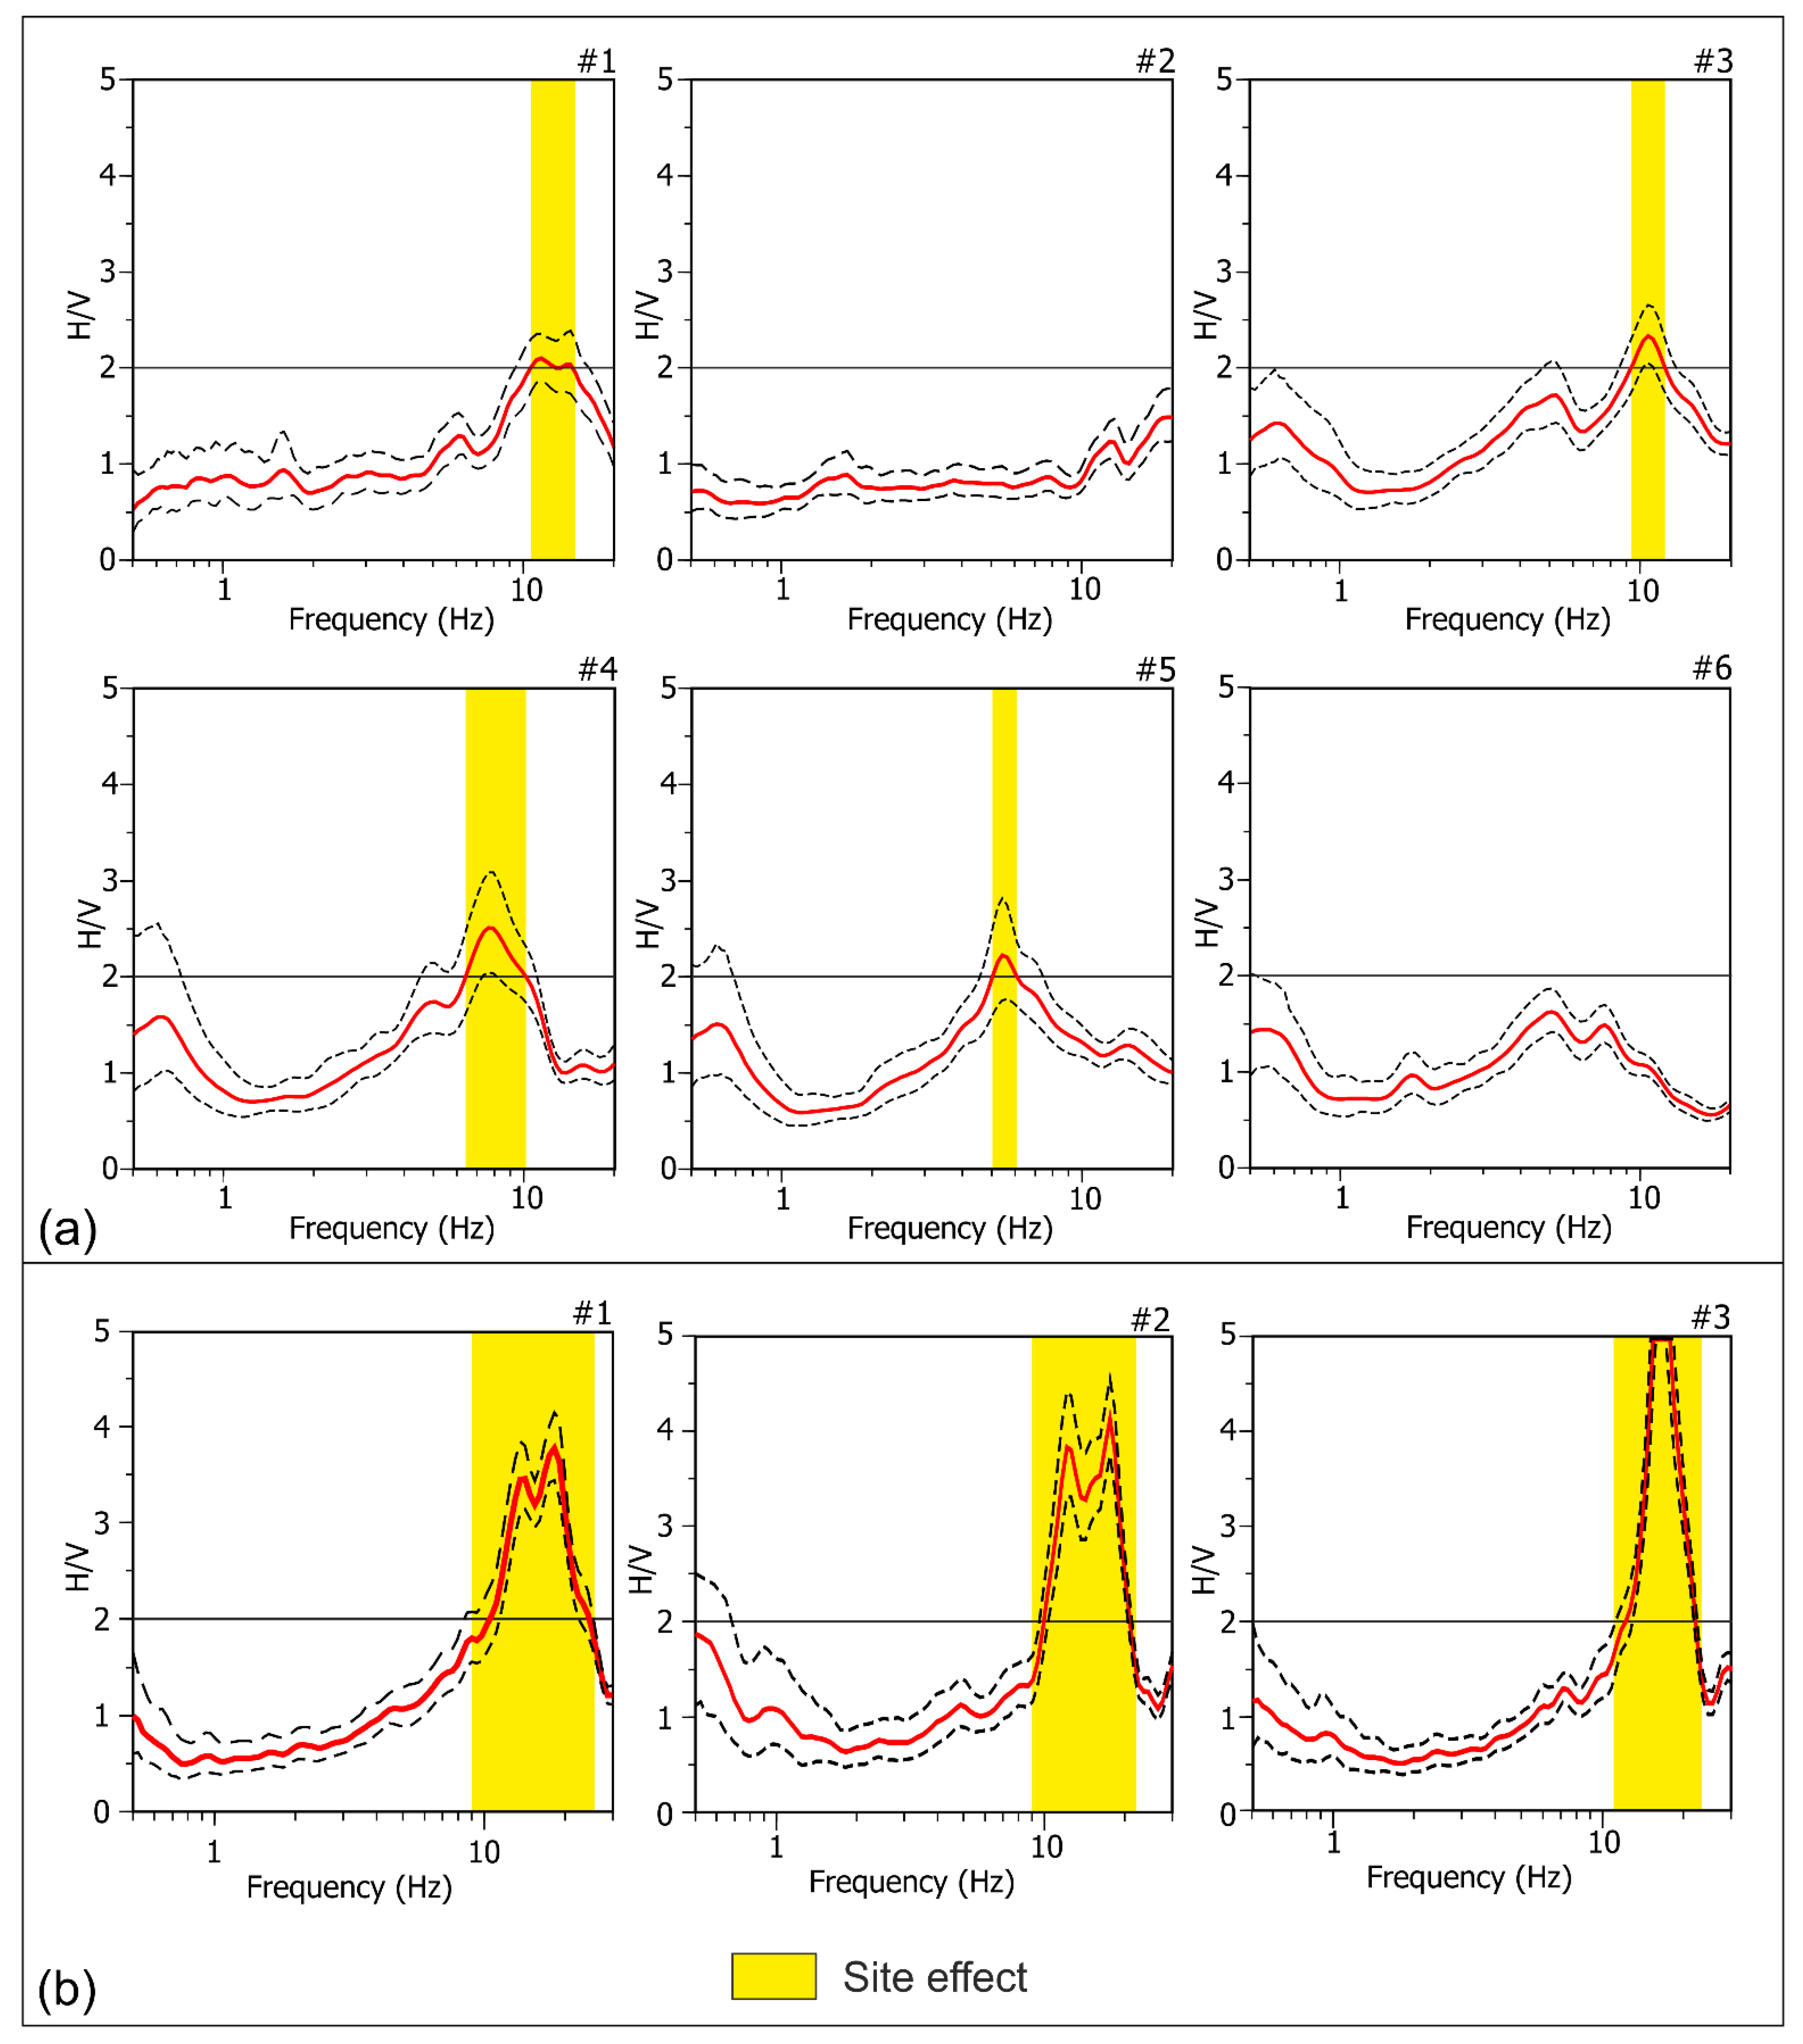
5.1. Ambient Vibration Samplings

Ambient noise samplings were carried out at both the Villa Cerami and Palazzo Boscarino and the Villa Zingali Tetto areas owned by the University of Catania. The signal was acquired with a sampling frequency of 128 Hz, using six three-component velocimeters with high sensitivity (1.5 mm/s). Three channels are coupled to the velocimeters, which sent the ambient seismic noise sampled to a low-noise digital acquisition system achieving a resolution better than 23 bits and an accuracy higher than 10−4 on spectral components down to 0.1 Hz. Unfortunately, since only one of the devices used had an integrated GPS receiver, it was not possible to acquire synchronous measurements.
At the Villa Cerami and Palazzo Boscarino complex, six noise measurements were performed outside of the buildings, placed as far as possible from the adjacent buildings (see location in Figure 2a). Using the same selection criteria previously adopted, three noise measurements were carried out outside of Villa Zingali Tetto (see location in Figure 4a). Inside the buildings, in Villa Cerami, five sites were chosen near the main structural elements (Figure 5a), and ambient vibrations were recorded for 20 min on the same vertical axes at different levels of the construction. Furthermore, two sites on the ground floor and four sites on the first-floor terrace were sampled. Overall, 21 measurements were performed across all levels (ground, first, second, and third floors). Similarly, 25 measurements were conducted on each of the five floors in Palazzo Boscarino, as well as in the basement and on the ground level (Figure 5b). In this case, the measurements were performed in the central part of each floor and on the two opposite boundaries of the building (Figure 5b). The velocimeters, both inside and outside of the structures, were set with the north–south component oriented transversally to the main direction of the buildings. Finally, in Villa Zingali Tetto, 28 measurements were carried out on each of the levels (basement, ground, raised, first, mezzanine, second and terrace floors (Figure 6) in correspondence with the main structural elements).
The data processing procedure, already used in other studies, e.g., [13,22,50], involves the partition of the recorded signal into time windows of 20 s, the selection of stationary portions, and the removal of transients associated with very close noise sources. Fourier spectra were then processed in the frequency range of 0.5–20.0 Hz, and a Konno and Ohmachi filter with b = 40 [51] was used to smooth the spectra. Finally, the system transfer function, HHSR (horizontal-to-horizontal spectral ratio), was obtained by computing the spectral ratios between the Fourier spectra of horizontal components, related to the noise samplings performed at the various building levels (Figure 7a, Figure 8 and Figure 9a), and the same components obtained by the measurements recorded outside the buildings [52,53]. Site #1, relative to the two areas (see Figure 2 and Figure 4 for the location), was used as the reference site. Furthermore, the power spectral densities of noise samplings were computed (Figure 7b, Figure 9b and Figure 10).
Some HHSR plots, both in Villa Cerami and Palazzo Boscarino, which share the second floor in the south, show an evident second peak due to the influence of the adjacent building, mainly in the E–W component (Figure 7a and Figure 8). Similarly, in Villa Zingali Tetto, some HHSR plots depict a second peak in the E–W component (Figure 9) in the measurements carried out in the northern side, where another building is present (Figure 4a,b).
To determine the fundamental site resonance frequency, the HVSR technique was instead applied to the recording sites located outside the building, and the Fourier spectra (FFT) were computed through the above-described procedure. In this case, the ratio of the geometric averaged horizontal-to-vertical frequency spectrum was used (Figure 11a,b). As suggested by SESAME, 2004 [54], only the HVSR peaks reaching an amplitude greater than two units should be considered significant. In order to highlight the potential presence of resonance effects between sites and structures during a seismic event, building and site frequencies were compared. HVSR results showed that the spectral amplitudes slightly exceed a value of 2 for a frequency range of between 8 and 10 Hz in Villa Cerami and Palazzo Boscarino, while in Villa Zingali Tetto, spectral amplitudes ranged between 3 and 5 for a frequency greater than 10 Hz.

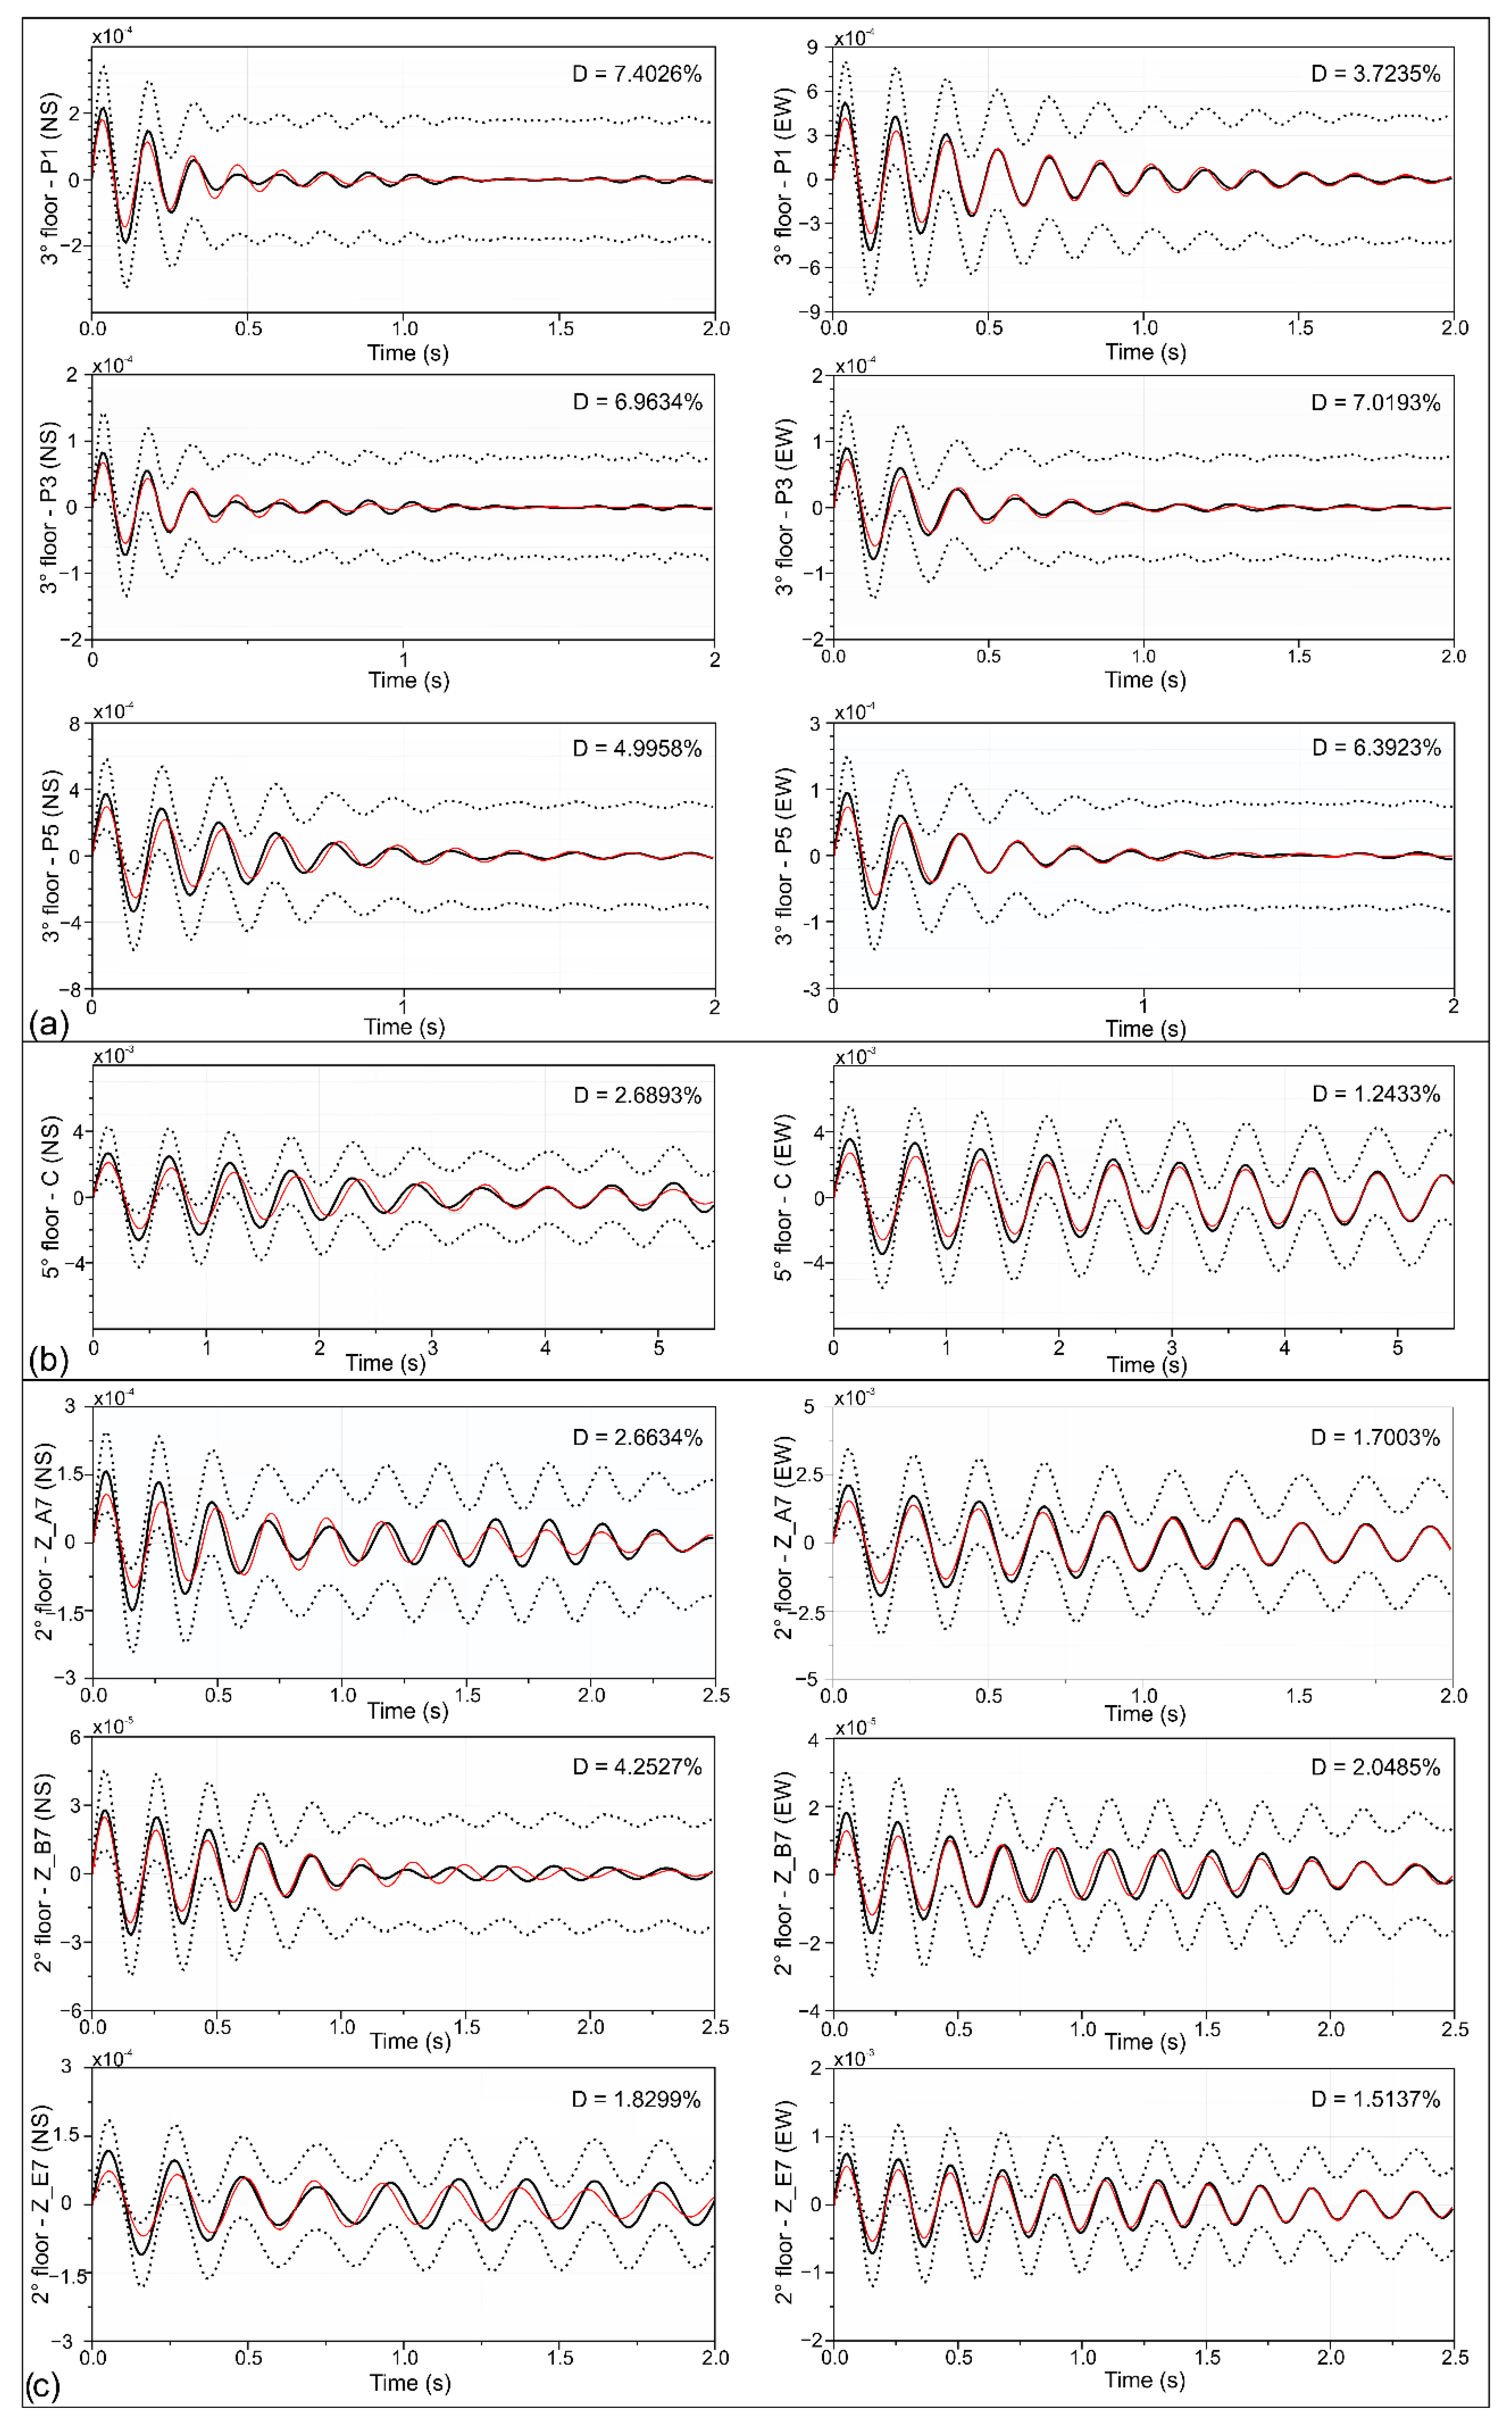
5.2. Building Damping

Damping is another factor that affects the amplitude and the duration of a building’s shaking. One of the most applied procedures for assessing the damping of structures is the random decrement method (RDM) [55]. For this method, a building is assumed to be a single degree of freedom oscillator, and the input is considered to be the sum of a random signal and an impulse response function. Averaging several time windows (N) with an initial displacement equal to zero, the random component tends to disappear, highlighting the structure response. An estimation of the system free-vibration decay, δ(τ), can be hence obtained as:
δ ( τ ) = 1 N i = 1 N s t i + τ  
where s is the ambient vibration window of duration τ, and ti is the time in which ambient vibrations remain stationary and the impulse response of the structure is enhanced [55]. Here, the damping values have been evaluated by using ambient noise recordings, through the above-described RDM technique, which was implemented in Geopsy software [56]. In the RDM application, the mode under analysis must be clearly detectable [55]. Then, RDM technique was applied on the first mode of vibration, which usually gives the largest contribution to the building’s motion [57], for buildings with limited heights. To apply RDM correctly on the chosen frequency, the signal was processed using a band pass Butterworth filter with an order of 3 in a range of 10% around the fundamental mode, and considering windows containing 20 times the selected period. Figure 12 shows examples of the calculation carried out for some particular positions in the topmost part of the studied structures. In the structural design codes, the damping is considered equal to 5% without any correlation to building geometry, height, or foundation site. For Villa Cerami (Figure 12a), the damping values obtained in this study varied between 4 and 9%, depending on the direction in which they had been computed. For Palazzo Boscarino, the damping of the building showed values ranging between 1.2% and 2.8% (Figure 12b). Finally, for Villa Zingali Tetto, the damping shows values ranged between 1.9% and 2.5% (Figure 12c), which were significantly lower than 5%, which was indicated in the structural design codes.

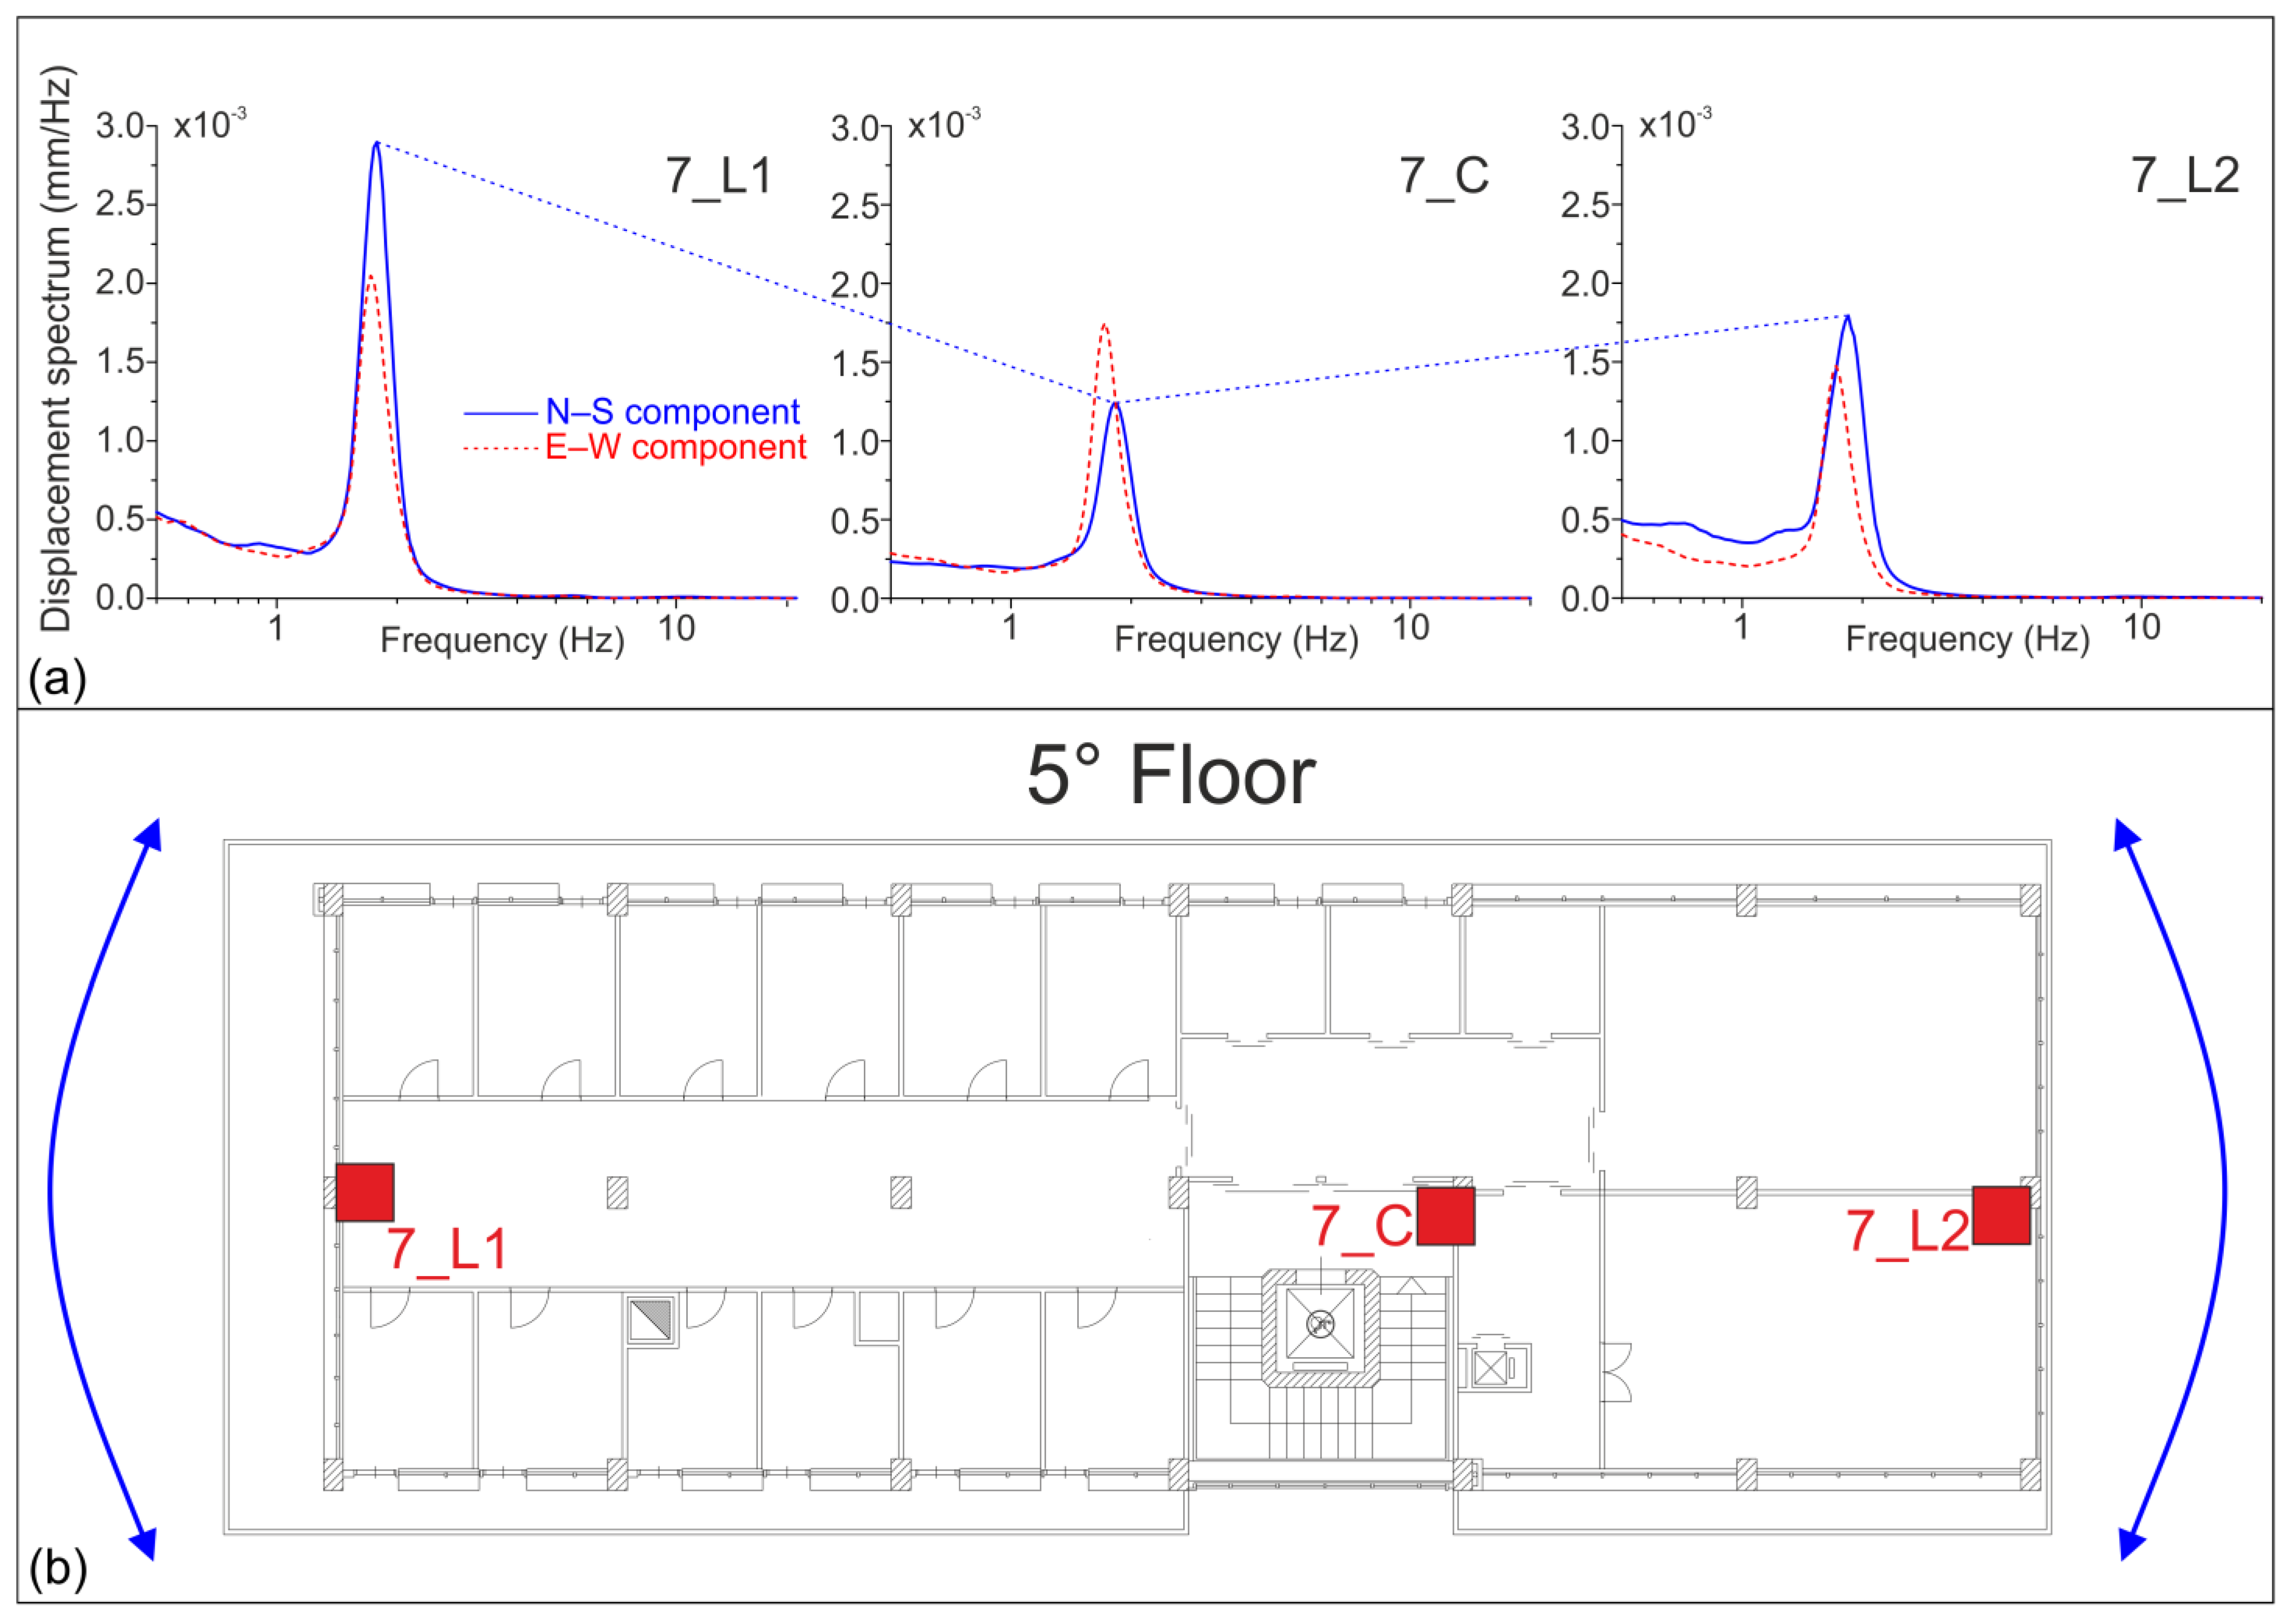
5.3. Torsional Effects

The possibility of torsional effects was investigated through the analysis and comparison of the spectral displacement obtained from ambient noise recorded in the central and lateral portions of the building. To estimate the torsional effects, the ratio (Δ) between the lateral displacements (δmax) and the displacement at the center of the building (δavg) was computed. The estimation of Δ can be carried out using microtremor measurements from at least two points on the same side of the structure [58] by calculating the displacement spectrum. In this study, the torsional effects for which Δ did not exceed 20% and 40% of δavg are considered significant, as proposed by Eurocode 8.
Although the results were obtained using microtremors, which are weak oscillations compared to an earthquake, in Villa Cerami the possibility of significant torsional effects were evidenced in the N–S components at points 3_P4 and 3_P5 (Table 2), and at Palazzo Boscarino for the measurements 7_L1 and 7_C (Table 2) in the N–S components (Figure 13). In Villa Zingali Tetto, the possibility of significant torsional effects was confirmed at Z_F7 (Table 2).

5.4. One-Dimensional Site Response Modelling

There is a general agreement among scholars regarding the reliability of the predominant frequency of ground motion response at the surface achieved through HVSR, e.g., [14,50], whereas the existence of a simple direct correlation between HVSR amplitude values and the actual site amplification has frequently been questioned [10,59]. Catania subsoil consists of alternating outcrops of sediments and basaltic rocks, with lateral and vertical heterogeneities. Despite this, some authors, e.g., [22,32], when using 1D modelling to reproduce the seismic site effects in other areas of Catania, found satisfactory findings. As accelerometric data are not available for the city of Catania, to validate HVSR results, a numerical modelling of the subsoil by using the code STRATA [47,48] was carried out. The program can compute the seismic site response of a 1D soil column using either the equivalent linear (EQL) approach or the frequency-dependent equivalent linear (F-EQL) analysis. Here, to overcome the limitations of EQL analysis in predicting site amplification at high frequencies when the induced strains are large, the F-EQL approach, in the frequency range 0.2–20 Hz, was adopted [60].
The analysis was performed considering a horizontally polarized shear wave vertically propagating through horizontal layers. In the code STRATA, it is necessary to enter the parameters of our stratigraphic column, specifying the unit of weight (kN/m3), the thickness (m), and the shear wave velocity (m/s) for each layer down to the bedrock. Specifically, the bedrock (Eurocode 8 site class A) was modelled as an elastic half-space with a unit of weight of 20 kN/m3 and 2% damping [47,61]. Furthermore, for the F-EQL response analysis, other required key geotechnical parameters comprise the normalized shear modulus decay G(γ)/Gmax and the damping versus strain curves D(γ) for each layer. The input stratigraphic sequence (see Figure 4a) was modelled using the elastic parameters of the main lithotypes, as characterized in the CNR-GNDT (Consiglio Nazionale della Ricerche—Gruppo Nazionale Difesa dai Terremoti) “Catania Project” [62]. The experimental curves of the G(γ)/Gmax and the D(γ) were retrieved from Carrubba and Maugeri, 1988 [63], for cohesive soils (clay), and from Cavallaro et al., 2001 [64], for weathered volcanic rocks and non-cohesive soils (sand). They obtained the experimental curves by performing the resonant column test (RCT) on rock specimens collected in Catania urban areas.
To define the target spectrum, the Cauzzi et al., 2015 [65], attenuation law and three different reference earthquakes were used. These were: the Mw = 5.7 earthquake, which struck southeastern Sicily in 1990, causing slight damage to the selected buildings; the Mw = 6.3 1818 earthquake which caused moderate damage in Catania; the Mw = 7.3 1693 earthquake, which destroyed Catania (see Figure 1a for location and Table 1) e.g., [23,26,30,66]. The first event was considered a slightly damaging scenario for Catania [62], the second a moderate event, whereas the last earthquake was a first-level scenario. The moment magnitude (Mw), the hypocenter distance, and the focal mechanism of these earthquakes were used for the input in the Cauzzi et al., 2015 [65], attenuation law, which allows for the computation of ground motion at a given site from defined seismic sources, to acquire the target spectrum. The equation of ground motion prediction is defined for the 5% damping displacement response spectrum (DRS) in cm, considering the period (T) in the range 0.01–10 s. The attenuation law is also defined for PGA in cm/s2, and for the peak ground velocity (PGV) in cm/s. Pseudo-spectral acceleration (PSA) values can then be calculated from DRS by using the formula:
PSA (T; 5%) = DRS (T; 5%) 4π/T2
The PSA obtained for the selected reference earthquakes were then used to choose, for each of the three seismic events of different magnitudes, seven strong motion accelerograms from the European strong motion database (ESD) [67] through the REXEL WEB software [68]. The REXEL software allows for the selection of the strong motion accelerograms that fall within the magnitude and distance range specified by the user from the records stored in ESD. It is also required to specify the period range and the tolerance limits within which the average spectrum of the N selected accelerograms should be included. Here, the search was performed by selecting N = 7 accelerograms (Table 3) that matched the target spectrum in the period interval 0.1–2.0 s, considering a 30% (upper) and a 10% (lower) tolerance. Using these input signals in the STRATA code, it was possible to obtain the mean acceleration response spectra (SA) at the chosen critical damping (Figure 14a), the mean amplification function (Figure 14b), and the PGA profile (Figure 14c) for the three earthquake scenarios.

6. Discussion

This study aimed to investigate whether the three buildings of the University of Catania could be subject to soil amplification, and their dynamic behaviors for different Mw earthquakes. To recognize possible soil–structure resonance effects, the natural frequencies experimentally obtained for different sectors of the buildings were compared with the ones measured in the free field area close to the buildings. Only the first mode of vibration was considered because it is usually sufficient for buildings with limited heights, whereas high-rise structures (with stories generally over 12 or so) can be influenced by other modes, e.g., as explored in [20]. Furthermore, the power spectral density shows the maximum in correspondence of the first mode (Figure 7b, Figure 9 and Figure 10b).
Villa Cerami consists of four levels, each of a different height, with an L-shaped plan, a maximum longitudinal section N–S oriented, and minimum E–W oriented. It is erected on thin detritic layers and volcanics. The HSSR results indicate that the fundamental frequency of the building is about 6.5 Hz. The presence of a secondary frequency at roughly 1.8 Hz, which appears to be related to the Palazzo Boscarino resonance frequency, can be seen in the HSSR graphs obtained from measurements recorded from third to fifth floors (see Figure 5a for location and Figure 7a and Figure 8). The different parts of the building are characterized by different damping values depending on the measurement point location and the direction considered. The values that are included in the range from 4 to 9% (Figure 12a), are partially greater than the 5% value that is assigned in the structural design rules. These values are most likely owing to the fact that the building is a complex structure made of basaltic rocks with a good dissipative capacity [69]. The examination of potential torsional effects revealed that, despite the weakness of the input signal used, the presence of probable torsional effects is fairly significant, particularly along the N–S sector on the third level (Table 2). This can be explained by the fact that the building has an L-shaped plan and there is a third level in the N–S side (see Figure 2b,c) which creates a strong asymmetry along this direction and in building height.
Palazzo Boscarino is made up of seven levels, it has an N–S oriented longitudinal section, and from the structural point of view is an RC building without ERD (Figure 2e). It is built on thin detritic strata and volcanics. According to the HSSR data, the building’s fundamental frequency is around 1.8 Hz. The presence of a secondary frequency at roughly 6 Hz, which appears to be related to the resonance frequency of Villa Cerami, can be seen in the HSSR graphs related to the measurements sampled from the third to fifth floors (see Figure 5b for location and Figure 7a and Figure 8). The damping of the building (Figure 12b) shows values ranging from 1.24% to 2.79%. These are lower than the value shown on the structural design rules, but are typical of RC buildings, as shown in [70,71]. The assessment of potential torsional effects suggested their presence on the N–S component along the side shared with Villa Cerami (Figure 13 and Table 2). For the above-described buildings, the HVSR obtained from measurements performed in the neighboring area of the building showed the presence of dominant spectral peaks between 8 and 12 Hz, except for measurements two and six (Figure 11a). This allows us to exclude the possibility of significant soil–structure interferences since the fundamental frequencies of the building and the site are quite different.
Villa Zingali Tetto is an RC building without ERD, made up of four levels, each with a different height and irregular plan (Figure 4a,c and Figure 6). It is built on volcanic rocks. According to the HSSR data, the building’s fundamental frequency is between 4.5 and 4.9 Hz. On the N–S component, there is a second vibration frequency of roughly 5.2 Hz, which could be due to additional structural elements or geometric imperfections, most likely the terrace, which is made of iron and alters the building’s geometric symmetry (see Figure 4b,c), or even a second vibration mode. On the north side, Villa Zingali Tetto is connected to a building of the same height. Measurements performed near the contact wall between the two buildings were associated with measurement points B and F (Figure 6). The HSSR ratios of these measurements are the only ones showing a bimodal peak on the E–W component (Figure 9). The damping of the building showed values ranging between 1.9% and 2.5% (Figure 12c), which are significantly lower than 5%, which represents the value of the structural design codes, but it is likely to be typical of RC structures. The evaluation of potential torsional effects highlighted that they can be significant (Table 2), especially in Z_F7, since at this side of the building there is the iron terrace that induces an irregularity in the structure for both geometric and material differences (Figure 4c and Figure 6). The HVSR obtained from measurements performed in the neighboring area of Villa Zingali Tetto showed the presence of dominant spectral peaks at frequencies greater than 10 Hz (Figure 11b). The fundamental frequencies of the building and the site are quite different; therefore, significant resonance effects may be excluded.
By means of STRATA code, a numerical modelling of the 1D local seismic response was carried out using borehole stratigraphy data (see Figure 2a for location and Figure 3), to evaluate the impact of the Mw = 5.7 1990 shock, the Mw = 6.2 1818 shock, and the Mw = 7.3 1693 shock on expected ground shaking in the selected site. The results, which were obtained in terms of the SA at 5% damping, point out that the highest SA peaks fell in the range of the buildings’ main oscillation periods (0.2–0.6 s), with maximum SA values ranging from 0.22g for a magnitude event similar to the 1990 earthquake, to 0.78 g for one comparable to the 1693 earthquake (Figure 14a). The amplification functions showed a shape similar to that of HVSRs, reaching small amplification values over 10 Hz (Figure 14b). PGA profiles (Figure 14c) highlighted that the main amplification effects took place at a depth lower than 20 m. This can be related to the presence of the sand layer beneath the detritus layer originating from the ruins of past earthquakes. A minor amplification located at around 5 m of depth can be associated with the detritus layer. The amplification values confirm that at the site, there are no significant amplification effects. The obtained results can also be extended to Villa Zingali Tetto, which was built on compact volcanic rocks that are not usually subject to amplification phenomena [32].
To assess probable seismic scenarios for the selected buildings, the evaluated PGA and SA values were used to estimate the macroseismic intensity that can be caused by these accelerations. Among the relationships correlating the macroseismic intensity (IMCS) estimated with the Mercalli-Cancani-Sieberg scale and PGA, the one proposed by Locati et al., 2017 [72] was selected, since it was computed using Italian catalogue data:
IMCS = −0.64 + 3.58LogPGA (cm/s2)
It was then possible to estimate an IMCS value of VI for the study area, for an earthquake of Mw = 5.7, which was concurrent with the observed damage to Villa Cerami and Villa Zingali Tetto from the earthquake of 1990 (cracks in walls, damage to the staircase [26,35]. An IMCS value of VII for an earthquake of Mw = 6.3 was obtained, also in this case coherent with the observed intensity in Catania for the 1818 earthquake (Table 1). Finally, an IMCS value of VIII-IX for an earthquake of Mw = 7.3 was obtained. In this case, the value was different to the X-XI estimated for the 11 January 1693 earthquake in Catania (Table 1). This result may be due to two reasons: the first is that some of the accelerograms selected through the REXEL WEB software used in the code STRATA (Table 3) to compute PGA were related to earthquakes with a smaller magnitude or greater distance than the 1693 earthquake had for Catania. Consequently, since the program averages values, Mw and distance from the seismic source are underestimated. The second is that from the 1693 earthquake, destruction in Catania was almost complete because the buildings had already been weakened by the earthquake of 9 January, for which an intensity of VIII was estimated in Catania (Table 1).
Finally, mean IMCS values for the area using the SA values obtained at the surface were estimated. Faenza and Michelini, 2011 [73] conducted a regression study of MCS intensity and ground motion SA values in Italy at 0.3, 1.0, and 2.0 s (SA03, SA10, and SA20, respectively). Maximum horizontal component (SA0.3shm, SA1.0shm, SA2.0shm) relationships were as follows:
IMCS = (1.24 ± 0.33) + (2.47 ± 0.18) log SA0.3shm, σ = 0.53
IMCS = (3.12 ± 0.16) + (2.05 ± 0.11) log SA1.0shm, σ = 0.36
IMCS = (4.31 ± 0.10) + (2.00 ± 0.10) log SA2.0shm, σ = 0.29
Using these relationships, the acquired results were similar to those obtained by using PGA values, i.e., IMCS = VI, IMCS = VII, and IMCS = VIII-IX for Mw = 5.7, Mw = 6.2, and M = 7.3, respectively.
According to EMS98, the way in which a building deforms under earthquake loading depends on the building type, and structures are differentiated into vulnerability classes. EMS98 defines six classes of decreasing vulnerability (A–F) of which the first three represent the strength of a “typical” adobe house, brick building, masonry, and RC structure without ERD. D, E, and F vulnerability classes are related to structures with ERD. With respect to current code developments, i.e., [36], buildings also have to be classified according to their structural regularity on the basis of dimensions, ratios of geometry, and deviations from a regular ground plan and vertical shape. Great irregularity is easy to identify; for example, buildings with plans designed in an L shape are subject to torsional effects, which may greatly increase the damage [49]. In EMS98, damage is classified in increasing levels, from grade 1, negligible to slight damage, to grade 5, destruction (very heavy structural damage, i.e., total or near total collapse). In this study, EMS98 was not used to assess intensity (which is usually assessed for a village, town, or city), but just to classify the building vulnerability and the level of damage that buildings of different vulnerability can suffer at different intensity. Furthermore, the selected buildings are not historic structures or structures with a particular typology such as defined in EMS98, but one building is of vulnerability class B-C and the other two of vulnerability class C. Villa Cerami, a masonry building, is of vulnerability class B-C, whereas Palazzo Boscarino and Villa Zingali Tetto, which are RC buildings without ERD, are of vulnerability class C. The effects on the buildings at intensity IX in the EMS98 are: (a) Many buildings of vulnerability class B suffer damage of grade 4 (very heavy damage: heavy structural damage, very heavy non-structural damage) and a few of grade 5. (b) Many buildings of vulnerability class C suffer damage of grade 3 (substantial to heavy damage: moderate structural damage, heavy non-structural damage) and a few of grade 4. Therefore, from the intensities that were obtained using the (6) and (7) relationships for a first level scenario (Mw = 7.3 1693 earthquake) and considering that the intensity assessed with MCS and EMS98 should be equal, Villa Cerami may suffer heavy structural damage, and very heavy non-structural damage, whereas the other two buildings may suffer moderate structural damage and heavy non-structural damage. Furthermore, torsional effects may increase damage in Villa Cerami (L-shaped plan and vertical difference) and Villa Zingali Tetto (irregular plan and iron terrace) considering the irregularity of these two buildings.

7. Conclusions

Through a detailed ambient vibration survey and a 1D site response modelling, it was possible to highlight the main soil and structural properties for three buildings of the University of Catania. The ambient vibration survey allowed for us to compute the fundamental mode of the buildings, damping curves, and torsional effects. The results show that Villa Cerami and Palazzo Boscarino have different vibration frequencies, they influence each other’s vibration modes, and torsion effects at the highest floor can affect both buildings. Furthermore, Villa Cerami is a masonry building, whereas Palazzo Boscarino is an RC building without ERD, which have different vibration modes and damping. Therefore, since the two buildings share a side, it is likely that during an earthquake they can be subject to anomalous movements, due to the influence of the adjacent building, which, in the case of earthquakes of significant magnitude and duration, can contribute to increased damage. Villa Zingali Tetto is an RC without ERD that shows strong torsional effect on the terrace because this structure is made of iron and creates a marked asymmetry to the building.
SA, amplification function, and PGA profiles obtained from the 1D modelling showed that for earthquakes of magnitudes comparable to those that affected Catania in 1990 and 1818, the structures should suffer only slight and moderate damage. However, for an earthquake resembling the 1693 event, despite the fact that computed accelerations are not very high, Villa Cerami could suffer heavy structural damage, and Palazzo Boscarino and Villa Zingali Tetto could undergo very heavy non-structural damage. If a seismic sequence similar to that of the 1693 events were to affect Catania, it is likely that the damage would be greater, because of cumulated damage on the buildings, as observed in 1693. These findings can therefore represent useful clues for further numerical modelling, and additional engineering investigations aimed at reducing the seismic vulnerability of the analyzed buildings.
This study shows that the ambient vibrations method, which is a non-invasive technique, when used alongside the building vulnerability analysis and a simple 1D modelling of local seismic response, can give very sound results to define seismic site response and information about the level of damage that buildings can sustain during an earthquake. The adopted methodology can be also used for other structures because of its effortlessness of use, especially when quick analyses are required at historical buildings, located in seismically active areas with a high probability of damaging earthquakes, needing plan actions to reduce their vulnerability.

Author Contributions

Conceptualization, M.S.B., S.G., S.I. and C.P.; methodology, M.S.B., S.G. and S.I.; validation, M.S.B. and S.G.; investigation, S.G., S.I. and G.M.; data curation, M.S.B., S.G., S.I., G.M. and C.P.; writing—original draft preparation, M.S.B., S.G., S.I. and C.P.; writing—review and editing, M.S.B., S.G., S.I., G.M. and C.P.; visualization, S.G. and G.M.; supervision, M.S.B., S.G. and S.I. All authors have read and agreed to the published version of the manuscript.

Funding

This work was funded by the AGM for CuHe project (PNR 2015–2020—Area di Specializzazione “CULTURAL HERITAGE”—CUP E66C18000380005); the project “CH2V—Cultural Heritage Hazard and Vulnerability” (University of Catania, Linea 2-PIACERI, funds granted to Giovanna Pappalardo); and an agreement between the University of Catania and the Earth Science section of the Department of Biological, Geological and Environmental Sciences—University of Catania.

Data Availability Statement

The data presented in this study are available on request from the corresponding author.

Acknowledgments

We wish to thank the two anonymous reviewers and the editor for their valuable comments and suggestions that have contributed to improve the original manuscript. Thanks to Stephen Conway for reviewing the English text.

Conflicts of Interest

The authors declare no conflict of interest.

References

  1. Bard, P.Y.; Bouchon, M. The two-dimensional resonance of sediment-filled valleys. Bull. Seism. Soc. Am. 1985, 75, 519–541. [Google Scholar] [CrossRef]
  2. Faccioli, E. Seismic amplification in the presence of geological and topographic irregularities. In Proceedings of the 2nd International Conference on Recent Advances in Geotechnical Earthquake Engineering and Soil Dynamics, St. Louis, MO, USA, 11–15 March 1991; pp. 1779–1797. [Google Scholar]
  3. Naganoh, M.; Kagami, H.; Muratami, H. Effects of surface and subsurface irregularities. In Earthquake Motions and Ground Conditions; The Architectural Institute: Tokyo, Japan, 1993; Section 3.3. [Google Scholar]
  4. Steidl, J.H.; Tumarkin, A.G.; Archuleta, R. What is a reference site? Bull. Seism. Soc. Am. 1996, 86, 1733–1748. [Google Scholar] [CrossRef]
  5. Borcherdt, R.D. Effects of local geology on ground motion near San Francisco Bay. Bull. Seism. Soc. Am. 1970, 60, 29–61. [Google Scholar] [CrossRef]
  6. Nakamura, Y. A Method for Dynamic Characteristics Estimation of Sub Surface Using Microtremor on the Ground Surface. Railw. Tech. Res. Inst. Q. Rep. 1989, 30, 25–33. [Google Scholar]
  7. Trifunac, M.D. Comparison between ambient and forced vibration experiments. Earthq. Eng. Struct. Dyn. 1972, 1, 133–150. [Google Scholar] [CrossRef]
  8. Lermo, J.; Chavez-Garcia, F.J. Site effect evaluation using spectral ratios with only one station. Bull. Seism. Soc. Am. 1993, 83, 1574–1594. [Google Scholar] [CrossRef]
  9. Seekins, L.C.; Wennerberg, L.; Marghereti, L.; Liu, H.P. Site amplification at five locations in San Francisco, California: A comparison of S waves, codas, and microtremors. Bull. Seism. Soc. Am. 1996, 86, 627–635. [Google Scholar] [CrossRef]
  10. Haghshenas, E.; Bard, P.Y.; Theodulidis, N. SESAME WP04 Team. Empirical evaluation of microtremor H/V spectral ratio. Bull. Earthq. Eng. 2008, 6, 75–108. [Google Scholar] [CrossRef]
  11. Moisidi, M.; Vallianatos, F.; Gallipoli, M.R. Assessing the Main Frequencies of Modern and Historical Buildings Using Ambient Noise Recordings: Case Studies in the Historical Cities of Crete (Greece). Heritage 2018, 1, 171–188. [Google Scholar] [CrossRef] [Green Version]
  12. Burjànek, J.; Moore, J.R.; Molina, F.X.Y.; Fäh, D. Instrumental evidence of normal mode rock slope vibration. Geophys. J. Int. 2012, 188, 559–569. [Google Scholar] [CrossRef] [Green Version]
  13. Imposa, S.; Lombardo, G.; Panzera, F.; Grassi, S. Ambient Vibrations Measurements and 1D Site Response Modelling as a Tool for Soil and Building Properties Investigation. Geosciences 2018, 8, 87. [Google Scholar] [CrossRef]
  14. Albarello, D.; Lunedei, E. Combining horizontal ambient vibration components for H/V spectral ratio estimates. Geophys. J. Int. 2013, 194, 936–951. [Google Scholar] [CrossRef] [Green Version]
  15. Pappalardo, G.; Imposa, S.; Barbano, M.S.; Grassi, S.; Mineo, S. Study of landslides at the archaeological site of Abakainon necropolis (NE Sicily) by geomorphological and geophysical investigations. Landslides 2018, 15, 1279–1297. [Google Scholar] [CrossRef]
  16. Gentile, C.; Saisi, A.; Cabboi, A. Structural Identification of a Masonry Tower Based on Operational Modal Analysis. Int. J. Archit. Herit. 2015, 9, 98–110. [Google Scholar] [CrossRef]
  17. D’Altri, A.M.; de Miranda, S.; Castellazzi, G.; Sarhosis, V. A 3D detailed micro-model for the in-plane and out-of-plane numerical analysis of masonry panels. Comput. Struct. 2018, 206, 18–30. [Google Scholar] [CrossRef] [Green Version]
  18. D’Altri, A.M.; Sarhosis, V.; Milani, G.; Rots, J.; Cattari, S.; Lagomarsino, S.; Sacco, E.; Tralli, A.; Castellazzi, G.; Miranda, S. Modeling Strategies for the Computational Analysis of Unreinforced Masonry Structures: Review and Classification. Arch. Comput. Methods Eng. 2020, 27, 1153–1185. [Google Scholar] [CrossRef]
  19. Castellaro, S.; Imposa, S.; Barone, F.; Chiavetta, F.; Gresta, S.; Mulargia, F. Georadar and Passive Seismic Survey in the Roman Amphitheatre of Catania (Sicily). J. Cult. Herit. 2008, 9, 357–366. [Google Scholar] [CrossRef]
  20. Beskhyroun, S.; Navabian, N.; Wotherspoon, L.; Ma, Q. Dynamic behaviour of a 13-story reinforced concrete building under ambient vibration, forced vibration, and earthquake excitation. J. Build. Eng. 2020, 28, 101066. [Google Scholar] [CrossRef]
  21. Grassi, S.; Imposa, S.; Patti, G.; Boso, D.; Lombardo, G.; Panzera, F. Geophysical surveys for the dynamic characterization of a cultural heritage building and its subsoil: The S. Michele Arcangelo Church (Acireale, eastern Sicily). J. Cult. Herit. 2019, 36, 72–84. [Google Scholar] [CrossRef]
  22. Grassi, S.; Patti, G.; Tiralongo, P.; Imposa, S.; Aprile, D. Applied geophysics to support the cultural heritage safeguard: A quick and non-invasive method to evaluate the dynamic response of a great historical interest building. J. Appl. Geophy. 2021, 189, 104321. [Google Scholar] [CrossRef]
  23. Rovida, A.; Locati, M.; Camassi, R.; Lolli, B.; Gasperini, P. The Italian earthquake catalogue CPTI15. Bull. Earthq. Eng. 2020, 18, 2953–2984. [Google Scholar] [CrossRef]
  24. Lanzano, G.; Luzi, L.; D’Amico, V.; Pacor, F.; Meletti, C.; Marzocchi, W.; Rotondi, R.; Varini, E. Ground motion models for the new seismic hazard model of Italy (MPS19): Selection for active shallow crustal regions and subduction zones. Bull. Earthq. Eng. 2020, 18, 3487–3516. [Google Scholar] [CrossRef]
  25. Barbano, M.S.; Castelli, V.; Pantosti, D.; Pirrotta, C. Integration of historical, archaeoseismic and paleoseismological data for the reconstruction of the early seismic history in Messina Strait (south Italy): The 1st and 4th centuries AD earthquakes. Ann. Geophys. 2014, 57, S0192. [Google Scholar] [CrossRef]
  26. Guidoboni, E.; Ferrari, G.; Mariotti, D.; Comastri, A.; Tarabusi, G.; Sgattoni, G.; Valensise, G. CFTI5Med, Catalogo dei Forti Terremoti in Italia (461 a.C.-1997) e Nell’area Mediterranea (760 a.C.-1500). Istituto Nazionale di Geofisica e Vulcanologia; INGV: Bologna, Italy, 2018. [Google Scholar] [CrossRef]
  27. Pirrotta, C.; Barbano, M.S. New Macroseismic and Morphotectonic Constraints to Infer a Fault Model for the 9 (Mw6.1) and 11 January (Mw7.3) 1693 Earthquakes (Southeastern Sicily). Front. Earth. Sci. 2020, 8, 550851. [Google Scholar] [CrossRef]
  28. Amato, A.; Azzara, R.; Basili, A.; Chiarabba, C.; Cocco, M.; Di Bona, M.; Selvaggi, G. Main shock and aftershocks of the December 13, 1990, Eastern Sicily earthquake. Ann. Geophys. 1995, 38, 255–266. [Google Scholar] [CrossRef]
  29. Monaco, C.; Catalano, S.; De Guidi, G.; Gresta, S.; Langer, H.; Tortorici, L. The geological map of the urban area of Catania (Eastern Sicily): Morphotectonic and seismotectonic implications. Mem. Soc. Geol. Ital. 2000, 55, 425–438. [Google Scholar]
  30. Azzaro, R.; Barbano, M.S.; Moroni, A.; Mucciarelli, M.; Stucchi, M. The seismic history of Catania. J. Seismol. 1999, 3, 235–252. [Google Scholar] [CrossRef]
  31. Scudero, S.; De Guidi, G.; Imposa, S.; Currenti, G. Modelling the long-term deformation of the sedimentary substrate of Mt. Etna volcano (Italy). Terra Nova 2015, 27, 338–345. [Google Scholar] [CrossRef]
  32. Lombardo, G.; Coco, G.; Corrao, M.; Imposa, S.; Azzara, R.; Cara, F.; Rovelli, A. Results of microtremor measurements in the urban area of Catania (Italy). Boll. Geofis. Teor. Appl. 2001, 42, 317–334. [Google Scholar]
  33. UniCT Seismic Microzonation Working Group. Microzonazione Sismica (MS) di Livello 1. D.D.G. n. 219 del 08/07/2014. 2014. Available online: http://sit.protezionecivilesicilia.it/ (accessed on 23 September 2021).
  34. NTC. Aggiornamento Delle «Norme Tecniche per le Costruzioni». Ministero delle Infrastrutture e dei Trasporti: Rome, Italy, 2018; Gazzetta Ufficiale della Repubblica Italiana: Rome, Italy, 2018. [Google Scholar]
  35. La Sicilia, 1990.12.21, a.46, n.349. Catania (Italy). ANSA, Notiziario Italiano, 21 December 1990.
  36. Eurocode 8. Design of Structures for Earthquake Resistance—Part 1: General Rules, Seismic Actions and Rules for Buildings; EN 1998-1; European Committee for Standardization (CEN): Brussels, Belgium, 2004; Available online: www.eurocodes.jrc.eceuropa.eu/ (accessed on 23 September 2021).
  37. Ditommaso, R.; Parolai, S.; Mucciarelli, M.; Eggert, S.; Sobiesiak, M.; Zschau, J. Monitoring the response and the back-radiated energy of a building subjected to ambient vibration and impulsive action: The Falkenhof Tower (Potsdam, Germany). Bull. Earthq. Eng. 2010, 8, 705–722. [Google Scholar] [CrossRef] [Green Version]
  38. Michel, C.; Guéguen, P. Time–frequency analysis of small frequency variations in civil engineering structures under weak and strong motions using a reassignment method. Struct. Health. Monit. 2010, 9, 159–171. [Google Scholar] [CrossRef] [Green Version]
  39. Todorovska, M.I. Soil-structure system identification of Millikan library north–south response during four earthquakes (1970–2002): What caused the observed wandering of the system frequencies? Bull. Seism. Soc. Am. 2009, 99, 626–635. [Google Scholar] [CrossRef]
  40. Gallipoli, M.R.; Mucciarelli, M.; Vona, M. Empirical estimate of fundamental frequencies and damping for Italian buildings. Earthq. Eng. Struct. Dyn. 2009, 38, 973–988. [Google Scholar] [CrossRef]
  41. Celebi, M. Comparison of damping in buildings under low-amplitude and strong motions. J. Wind. Eng. Ind. Aerodyn. 1996, 59, 309–323. [Google Scholar] [CrossRef]
  42. Trifunac, M.D.; Todorovska, M.I.; Manić, M.I.; Bulajić, B.Đ. Variability of the fixed-base and soil-structure system frequencies of a building—The case of Borik-2 building. Struct. Control Health Monit. 2010, 17, 120–151. [Google Scholar] [CrossRef]
  43. Hoult, R. A computationally-effective method for rapidly determining the seismic structural response of high-rise buildings with a limited number of sensors. Bull. Earthq. Eng. 2021, 20, 4395–4417. [Google Scholar] [CrossRef]
  44. Mucciarelli, M.; Gallipoli, M.R.; Ponzo, C.F.; Dolce, M. Seismic waves generated by oscillating building. Soil Dyn. Earthq. Eng. 2003, 23, 255–262. [Google Scholar] [CrossRef]
  45. Cornou, C.; Guéguen, P.; Bard, P.Y.; Haghshenas, E. Ambient noise energy bursts observation and modeling: Trapping of harmonic structure-soil induced–waves in a topmost sedimentary layer. J. Seismol. 2004, 8, 507–524. [Google Scholar] [CrossRef] [Green Version]
  46. Bulajić, B.Đ.; Todorovska, M.T.; Manić, M.I.; Trifunac, M.D. Structural health monitoring study of the ZOIL building using earthquake records. Soil Dyn. Earthq. Eng. 2020, 133, 106105. [Google Scholar] [CrossRef]
  47. Kottke, A.R.; Rathje, E.M. Technical Manual for Strata; PEER Report 2008/10; University of California: Berkeley, CA, USA, 2008; Available online: http://nees.org/resources/strata (accessed on 15 February 2022).
  48. Rathje, E.M.; Kottke, A. Strata. 2013. Available online: https://nees.org/resources/strata (accessed on 15 February 2022).
  49. Grünthal, G. European Macroseismic Scale 1998 (EMS-98). In European Seismological Commission, Subcommission on Engineering Seismology, Working Group Macroseismic Scales. Cahiers du Centre Européen de Géodynamique et de Séismologie, Conseil de l’Europe Luxembourg; European Seismological Commission: Geneva, Switzerland, 1998; Volume 15, 99p. [Google Scholar]
  50. Picozzi, M.; Strollo, A.; Parolai, S.; Durukal, E.; Özel, O.; Karabulut, S.; Zschau, J.; Erdik, M. Site characterization by seismic noise in Istanbul, Turkey. Soil Dyn. Earthq. Eng. 2009, 29, 69–482. [Google Scholar] [CrossRef]
  51. Konno, K.; Ohmachi, T. Ground-motion characteristics estimated from spectral ratio between horizontal and vertical components of microtremor. Bull. Seism. Soc. Am. 1998, 88, 228–241. [Google Scholar] [CrossRef]
  52. Snieder, R.; Safak, E. Extracting the building response using seismic interferometry: Theory and application to the Millikan Library in Pasadena, California. Bull. Seism. Soc. Am. 2006, 96, 586–598. [Google Scholar] [CrossRef]
  53. Castellaro, S.; Mulargia, F. How far from a building does the ground motion free field start? The cases of three famous towers and of a modern building. Bull. Seism. Soc. Am. 2010, 100, 2080–2094. [Google Scholar] [CrossRef]
  54. SESAME. Guidelines for the Implementation of the H/V Spectral Ratio Technique on Ambient Vibrations Measurements, Processing and Interpretation. 2004. Available online: http://sesamegeopsy.org/Papers/HV_User_Guidelines.pdf (accessed on 11 December 2021).
  55. Dunand, F.; Bard, P.Y.; Chatelain, J.L.; Gueguen, P.; Vassail, T.; Farsi, M.N. Damping and frequency from randomec method applied to in-situ measurements of ambient vibrations: Evidence for effective soil structure interaction. In Proceedings of the 12th European Conference on Earthquake Engineering, London, UK, 9–13 September 2002; Paper No. 868; Elsevier Science Ltd.: Amsterdam, The Netherlands, 2002. [Google Scholar]
  56. Wathelet, M.; Chatelain, J.L.; Cornou, C.; Di Giulio, G.; Guillier, B.; Ohrnberger, M.; Savvaidis, A. Geopsy: A User-Friendly Open-Source Tool Set for Ambient Vibration Processing. Seismol. Res. Lett. 2020, 91, 1878–1889. Available online: http://www.geopsy.org/ (accessed on 20 December 2021). [CrossRef]
  57. Kareem, A.; Gurley, K. Damping in structures: Its evaluation and treatment of uncertainty. J. Wind. Eng. Ind. Aerodyn. 1996, 59, 131–157. [Google Scholar] [CrossRef]
  58. Grimaz, S.; Barazza, F.; Malisan, P. Misure all’interno degli edifici. In A Cura di M. Mucciarelli, Tecniche Speditive per la Stima Dell’amplificazione Sismica e Della Dinamica Degli Edifici-Studi Teorici ed Applicazioni Professionali; Aracne: Rome, Italy, 2011; pp. 195–209. ISBN 978-88-548-4495-7. [Google Scholar] [CrossRef]
  59. Mucciarelli, M. Reliability and applicability of Nakamura’s technique using microtremors: An experimental approach. J. Earthq. Eng. 1998, 2, 625–638. [Google Scholar] [CrossRef]
  60. Assimaki, D.; Kausel, E. An Equivalent Linear Algorithm with Frequency-and-Pressure-Dependent Moduli and Damping for Seismic Analysis of Deep Sites. Soil Dyn. Earthq. Eng. 2002, 22, 959–965. [Google Scholar] [CrossRef]
  61. Seed, H.B.; Idriss, I.M. Soil Moduli and Damping Factors for Dynamic Response Analyses; Report No. EERC-70-10; University of California: Berkeley, CA, USA, 1970. [Google Scholar]
  62. Faccioli, E.; Pessina, V. The Catania Project: Earthquake Damage Scenarios for High Risk Area in the Mediterranean; CNR—Gruppo Nazionale per la Difesa Terremoti: Rome, Italy, 2000; 225p. [Google Scholar]
  63. Carrubba, P.; Maugeri, M. Determinazione delle proprietà dinamiche di un’argilla mediante prove di colonna risonante. Riv. Ital. Geotecnica 1988, 22, 101–113. (In Italian) [Google Scholar]
  64. Cavallaro, A.; Grasso, S.; Maugeri, M. A dynamic geothechnical characterization of soil at Saint Nicola alla Rena Church damaged by South Eastern Sicily Earthquake of 13 December 1990. In Proceedings of the 15th International Conference on Soil Mechanics and Geotechnical Engineering, Satellite Conference Lessons Learned from Recent Strong Earthquake, Istanbul, Turkey, 25 August 2001; pp. 243–248. [Google Scholar]
  65. Cauzzi, C.; Faccioli, E.; Vanini, M.; Bianchini, A. Updated predictive equations for broadband (0.01–10 s) horizontal response spectra and peak ground motions, based on a global dataset of digital acceleration records. Bull. Earthq. Eng. 2015, 13, 1587–1612. [Google Scholar] [CrossRef]
  66. Visini, F.; De Nardis, R.; Barbano, M.S.; Lavecchia, G. Testing the seismogenic sources of the January 11th 1693 Sicilian earthquake (Io X/XI): Insights from macroseismic field simulations. Ital. J. Geosci. 2009, 128, 147–156. [Google Scholar]
  67. Luzi, L.; Lanzano, G.; Felicetta, C.; D’Amico, M.C.; Russo, E.; Sgobba, S.; Pacor, F. ; ORFEUS Working Group 5. Engineering Strong Motion Database (ESM) (Version 2.0); Istituto Nazionale di Geofisica e Vulcanologia (INGV): Rome, Italy, 2020. [Google Scholar] [CrossRef]
  68. Sgobba, S.; Puglia, R.; Pacor, F.; Luzi, L.; Russo, E.; Felicetta, C.; Lanzano, G.; D’Amico, M.; Baraschino, R.; Baltzopoulos, G.; et al. REXEL web: A tool for selection of ground-motion records from the Engineering Strong Motion database (ESM). In Proceedings of the 7th International Conference on Earthquake Geotechnical Engineering (ICEGE), Roma, Italy, 17–20 June 2019; 2019. [Google Scholar]
  69. Lagomarsino, S. Forecast models for damping and vibration periods of buildings. J. Wind Eng. Ind. Aerodyn. 1993, 48, 221–239. [Google Scholar] [CrossRef]
  70. Salameh, C.; Guillier, B.; Harb, J.; Cornou, C.; Bard, P.Y.; Voisin, C.; Mariscal, A. Seismic response of Beirut (Lebanon) buildings: Instrumental results from ambient vibrations. Bull. Earthq. Eng. 2016, 14, 2705–2730. [Google Scholar] [CrossRef]
  71. Ha, T.; Shin, S.H.; Kim, H. Damping and natural period evaluation of tall RC buildings using full-scale data in Korea. Appl. Sci. 2020, 10, 1568. [Google Scholar] [CrossRef] [Green Version]
  72. Locati, M.; Gomez Capera, A.; Puglia, R.; Santulin, M. Rosetta, a tool for linking accelerometric recordings and macroseismic observations: Description and applications. Bull. Earthq. Eng. 2017, 15, 2429–2443. [Google Scholar] [CrossRef]
  73. Faenza, L.; Michelini, A. Regression analysis of MCS intensity and ground motion spectral accelerations (SAs) in Italy. Geophys. J. Int. 2011, 186, 1415–1430. [Google Scholar] [CrossRef]
Figure 1. (a) Main seismotectonic features modified after [27], and earthquakes of magnitude > 5 after [23]; the dashed box shows the area of Figure 1b. (b) Geological map of the urban area of Catania modified after [29], and the locations of the studied buildings.
Heritage 05 00185 g001
Figure 2. (a) Detailed location of Villa Cerami and Palazzo Boscarino, showing available and carried out surveys; in S0, a down-hole survey [33] was also carried out; (b) Villa Cerami view from the east; (c) Palazzo Boscarino view from the west; geometry and construction features of Villa Cerami (d) and Palazzo Boscarino (e).
Heritage 05 00185 g002
Figure 3. Litho-stratigraphic sequence from borehole data, and P and S wave velocities from down-hole survey related to S1 (a) and litho-stratigraphic sequences from geognostic boreholes S2 (b) and S3 (c) (see Figure 3 for location). Data from [33].
Heritage 05 00185 g003
Figure 4. (a) Detailed location of Villa Zingali Tetto and surveys carried out. (b) View of Villa Zingali Tetto from the south; (c) geometry and construction features; (d) S wave velocity obtained from an MASW [33] near the site.
Heritage 05 00185 g004
Figure 5. (a) Villa Cerami and (b) Palazzo Boscarino layouts with location of the ambient noise recording sites at different levels.
Heritage 05 00185 g005
Figure 6. Villa Zingali Tetto layout with location of the ambient noise recording sites at different levels.
Heritage 05 00185 g006
Figure 7. (a) More significant HHSR plots obtained from noise recordings performed on different floors of Villa Cerami. The fundamental frequency at 1.8 Hz is due to the presence of Palazzo Boscarino. (b) Power spectral density of noise records corresponding to the HHSR plots shown in Figure 7a.
Heritage 05 00185 g007
Figure 8. More significant HHSR plots obtained from noise recordings performed on different floors of Palazzo Boscarino. The fundamental frequency at 6 Hz is due to the presence of Villa Cerami.
Heritage 05 00185 g008
Figure 9. (a) More significant HHSR plots obtained from noise recordings performed on different floors in Villa Zingali Tetto. (b) Power spectral density of noise records corresponding to the HHSR plots shown in Figure 9a.
Heritage 05 00185 g009
Figure 10. Power spectral density of noise records corresponding to the HHSR plots shown in Figure 8.
Heritage 05 00185 g010
Figure 11. (a) HVSR obtained at the free field recording sites #1, #2, #3, #4, #5 and #6 in Villa Cerami and Palazzo Boscarino (see Figure 2 for locations). (b) HVSR obtained at the free field recording sites #1, #2 and #3 near Villa Zingali Tetto (see Figure 4 for location).
Heritage 05 00185 g011
Figure 12. Examples of damping curves obtained using the random decrement method (RDM): (a) Villa Cerami; (b) Palazzo Boscarino; (c) Villa Zingali Tetto. The continuous black line corresponds with the mean of the random decrement, the dashed lines indicate the standard deviation, and the solid red line shows the fitted exponentially decreasing function.
Heritage 05 00185 g012
Figure 13. Evaluation of torsional effects for Palazzo Boscarino. Δ values are reported in Table 2.
Heritage 05 00185 g013
Figure 14. (a) Acceleration response spectra, (b) mean amplification function, and (c) peak ground acceleration profile obtained from the one-dimensional modelling performed through the code STRATA for Villa Cerami for an Mw = 5.7 earthquake, an Mw = 6.2 earthquake, and an Mw = 7.3 earthquake.
Heritage 05 00185 g014
Table 1. Earthquakes that damaged Catania since 1693. I0: epicentral intensity; Mw: equivalent moment magnitude; Iobs: observed intensity in Catania (data after [23]).
YearMoDayHo MiEpicentral AreaI0MwIobs (MCS)
1693010921 00 Southeastern Sicily8–96.078
1693011113 30Southeastern Sicily117.3210–11
1818022018 15Catania area9–106.287
1846042219 45Catania plain64.946
1848011112 00 Gulf of Catania7–85.516
1908122804 20Strait of Messina117.106–7
1959122322 52Catania plain6–75.116
1990121300 24Southeastern Sicily 5.616
Table 2. Torsional effects, obtained through the analysis and comparison of the spectral displacement from data recorded in the central and lateral portions of the building. They are obtained by computing the ratio (Δ) between the lateral displacements (δmax) and those at the center of the edifice (δavg). Torsional effects showing values of Δ > 1.4 (strong torsional effects) are considered significant.
Frequency (Hz) Central Displacement
( δ a v g )   mm
Lateral Displacement
( δ m a x )   mm
ComponentΔ
Villa Cerami3_P55.95-----0.000052N–S3.5
3_P46.670.000015-----N–S
Palazzo Boscarino7_L11.91-----0.0026N–S2.2
7_C1.880.0012-----N–S
7_L21.91-----0.0018N–S1.5
7_C1.880.0012-----N–S
Villa Zingali TettoZ_D74.8-----0.0000419E–W1.5
Z_A74.80.0000275-----E–W
Z_C74.8-----0.0000475N–S2.6
Z_A74.30.0000182-----N–S
Z_F74.5-----0.0000560N–S3.0
Table 3. Considered earthquake scenarios processed through the REXEL software. Earthquake Name: accelerogram of the reference earthquake; Station Code: seismic station code; Mw: moment magnitude; and Fault Mechanisms of the reference earthquake.
First Level Scenario (Mw 7.3)
Earthquake NameStation CodeDateMwFault MechanismEpicentral Distance (km)Eurocode 8 Site Class
AFriuli _3rd shock (Italy)SRC01976-09-156Thrust15.8A
BIrpinia (Italy)BSC (E)1980-11-236.9Normal28.3A
CDuzce (Turkey)D05311999-11-127.3Strike-slip30.3A
DCentral ItalyT12122016-10-306.5Normal10.5A
EIrpinia (Italy)BSC (N)1980-11-236.9Normal28.3A
FCentral ItalyT12122016-10-306.5Normal12A
GDodecanese Island (Greece)GMLD2020-10-307Normal19.7A
Mean6.7 20.7
Moderate Event Scenario (Mw 6.2)
Earthquake NameStation CodeDateMwFault MechanismEpicentral Distance (km)Eurocode 8 Site Class
ACentral ItalyT12152016-10-306.5Normal20.1A
BSouthern ItalyLRS (N)1998-09-095.6Normal18A
CFriuli_3rd shock (Italy)SRC01976-09-156Thrust15.8A
DCentral ItalyACC2016-10-306.5Normal18.6A
EIrpinia (Italy)BSC 1980-11-236.9Normal28.3A
FSouthern ItalyLRS (E)1998-09-095.6Normal18A
GCentral ItalyT12122016-10-306.5Normal10.5A
Mean6.2 18.4
Slightly Damaging Scenario (Mw 5.7)
Earthquake NameStation CodeDateMwFault MechanismEpicentral Distance (km)Eurocode 8 Site Class
ACentral ItalyASS1998-04-035.1Normal18.6A
BWestern TurkeyDEMR2015-10-065.2Normal17.5A
CFriuli_2nd shock (Italy)SRC01976-09-155.9Thrust17.1A
DL’Aquila (Italy)ANT2009-04-066.1Normal25.4A
EFriuli_3rd shock (Italy)SRC01976-09-156Thrust15.8A
FCentral ItalyACC2016-10-265.9Normal25.4A
GCentral ItalyT12122016-10-265.9Normal18.8A
Mean5.7 19.8
Publisher’s Note: MDPI stays neutral with regard to jurisdictional claims in published maps and institutional affiliations.

