Article

Studying Saraha: Technical and Multi-Analytical Investigation of the Painting Materials and Techniques in an 18th Century Tibetan Thangka

1
Department of Scientific Research, British Museum, Great Russell Street, London WC1B 3DG, UK
2
Department of Collection Care, Pictorial Art Conservation, British Museum, Great Russell Street, London WC1B 3DG, UK
3
Department of Collection Care, Organic Materials Conservation, British Museum, Great Russell Street, London WC1B 3DG, UK
4
Department of Asia, British Museum, Great Russell Street, London WC1B 3DG, UK
*
Author to whom correspondence should be addressed.
Heritage 2022, 5(4), 2851-2880; https://doi.org/10.3390/heritage5040148
Submission received: 24 June 2022 / Revised: 26 September 2022 / Accepted: 26 September 2022 / Published: 27 September 2022
(This article belongs to the Section Museum and Heritage)

Abstract

:
Scientific analyses of the traditional materials and methods in thangka production are uncommon, as thangkas are sacred objects, the sampling of which is discouraged, in order to preserve their integrity. This study builds on this important ethical challenge and presents a three-stage methodology that systematically delves deeper into each layer of the composition, successfully enabling the investigation of different phases of production. In the first stage, visual examination of the painting, including observations under magnification, was used to assess its condition. In the next step, the infrared reflected (IRR) and short-wave infrared (SWIR) images revealed the underdrawing and instances of modifications as well as colour notations. Additionally, ultraviolet-induced visible luminescence (UVL), infrared-reflected false colour (IRRFC) and X-ray images provided important preliminary information on the colourants present, the nature of the underdrawing, and the painting technique. In the final stages, fibre optic reflectance (FORS), Fourier-transform infrared (FTIR) and Raman spectroscopies confirmed the identity of many of the pigments (cinnabar/vermillion, minium, iron oxide, malachite, azurite, indigo, Indian lac), the ground and the binder used for the blue and green paint layers. In addition, key details of practices and materials were revealed, that may indicate provenance or other information of scholarly importance. These will constitute a helpful comparison to existing and future studies of other thangkas.

1. Introduction

Thangkas are portable sacred objects with a central image, usually painted on a cotton fabric prepared with a ground layer, framed by a textile mount. Wooden rods are attached to the top and bottom of the mount to allow for hanging, and some thangkas have a silk veil to protect the image. Thangkas are traditionally stored, rolled and then unrolled for display, which, along with poor handling, causes damage to the paint layer and textiles over time [1].
The British Museum’s collection includes over 260 thangkas, encompassing a full range of styles from various periods and regions. Many of these have intact textile borders and provide a wealth of valuable information for art historians, source communities, conservators and scientists.
The traditional materials and methods used in thangka production have been well-documented in the literature and are based on historical sources, accounts from living thangka painters, and technical and scientific studies. Two early accounts of Tibetan painting technique, based on Tibetan literary sources [2,3], examine the iconography used in thangka painting and indicate which pigments may be expected in connection with particular iconographic elements found in thangka paintings. The pioneering work of Giuseppe Tucci (1894–1984), a respected Tibetologist, who travelled extensively in Tibet and contributed immensely to the study of Tibetan paintings, focuses on central Tibet [4,5]. Extensive work on regional styles, including the Eastern Tibetan region, have been documented in detail by Huntington [6,7], Jackson [8,9,10,11] and others [12]. A thorough overview of the literature relating to thangka materials and techniques from the 1970s to 2010 has been compiled by Cotte [13], including a number of technical studies [4,14,15,16,17,18,19,20,21].
Since Cotte’s review, published work on thangkas has included conservation case studies [22,23,24], storage and display solutions [25], and ethical considerations [26], but rarely scientific analyses [27]. The major exception to this is a comprehensive project to analyse thirty-five thangkas at the Museo Nazionale d’Arte Orientale ‘Giuseppe Tucci’ (MNAO) in Rome, using predominantly non-invasive techniques (short wave infrared reflectography (SWIR), X-Ray Fluorescence (XRF), colorimetry and X-radiography). This systematic study has vastly expanded previously existing knowledge of the materials and methods used in thangka painting and also sheds light on the characteristics of the raw materials used to make the pigments and their availability in Tibet [28]. Non-invasive scientific analyses have also previously been carried out on Tibetan wall paintings [29,30], manuscripts [31,32] and prints [32].
Most recently, Brocchieri et al. [33] used a combination of non-invasive imaging techniques to characterise pigments in a Buddhist thangka painting from Tibet, probably dating from the 18th century. Scanning Macro-XRF (MA-XRF), XRF point measurements and hyperspectral imaging (HSI) in the visible and near-infrared range were combined to characterise the pigments, as well as revealing underlying annotations and a carbon black underdrawing. This work showed the importance of a multi-analytical approach in the investigation of thangka paintings and highlighted the benefits, as well as the challenges and limitations, of non-invasive methods when working with objects, where it is important to preserve historical integrity.
This study builds on this approach and offers alternatives to the methodology employed by Brocchieri et al. for those that may not have access to specialised techniques, such as scanning macro-XRF and HSI. Previous work has shown that integrating the use of widely-accessible non-invasive techniques, namely broadband multispectral imaging (MSI) and fibre optic reflectance spectroscopy (FORS), into a multi-analytical protocol is an effective strategy for both acquiring highly visual, chemically and spatially specific information, as well as narrowing down the number of additional, potentially more invasive, measurements.
MSI is well-established in the study of paintings and polychrome surfaces [34,35,36,37] and has proved to be a powerful tool for the study of fragile cases, such as textiles, where sampling opportunities are limited [38,39,40,41]. The approach is extremely visual, providing information that can be easily accessible to non-specialists.
Similarly, FORS is well-known to be a rapid and effective non-invasive method, which has been applied to painted surfaces and textiles [38,39,40,42,43]. Measurements are very fast (less than one minute per acquisition) and yield information on both reflectance and absorption features of the materials investigated.
In addition, as detailed above, previous studies of thangkas have shown the importance of both X-radiography and infrared reflectography for the study of technical features such as underdrawings, hidden mantras or colour notations [15,16,20,21,28,33].
To capitalise on the strengths of each of these available approaches, which are widely employed as part of the analytical protocols at the British Museum and elsewhere, a three-part methodology is presented, which combines these techniques and includes visual examination and investigation of features of interest under magnification, in a staged process that systematically delves deeper into each layer of the composition. Alternative non-invasive approaches not available to this investigation, such as near infrared FORS, portable XRF, FTIR, Raman spectroscopies and in situ X-ray powder diffraction (XRPD), could also have been complementary in this study, potentially even avoiding the need for sampling. It should be noted, however, that as with any primarily non-invasive approach, there are restrictions to the level of information that can be obtained with the methods selected, for example, molecular information leading to the identification of the precise origin of the binder used. As a result, the holistic, largely non-invasive approach adopted in this study aims to offer a compromise by minimising the number of samples that are required from the painting.

2. Materials and Methods
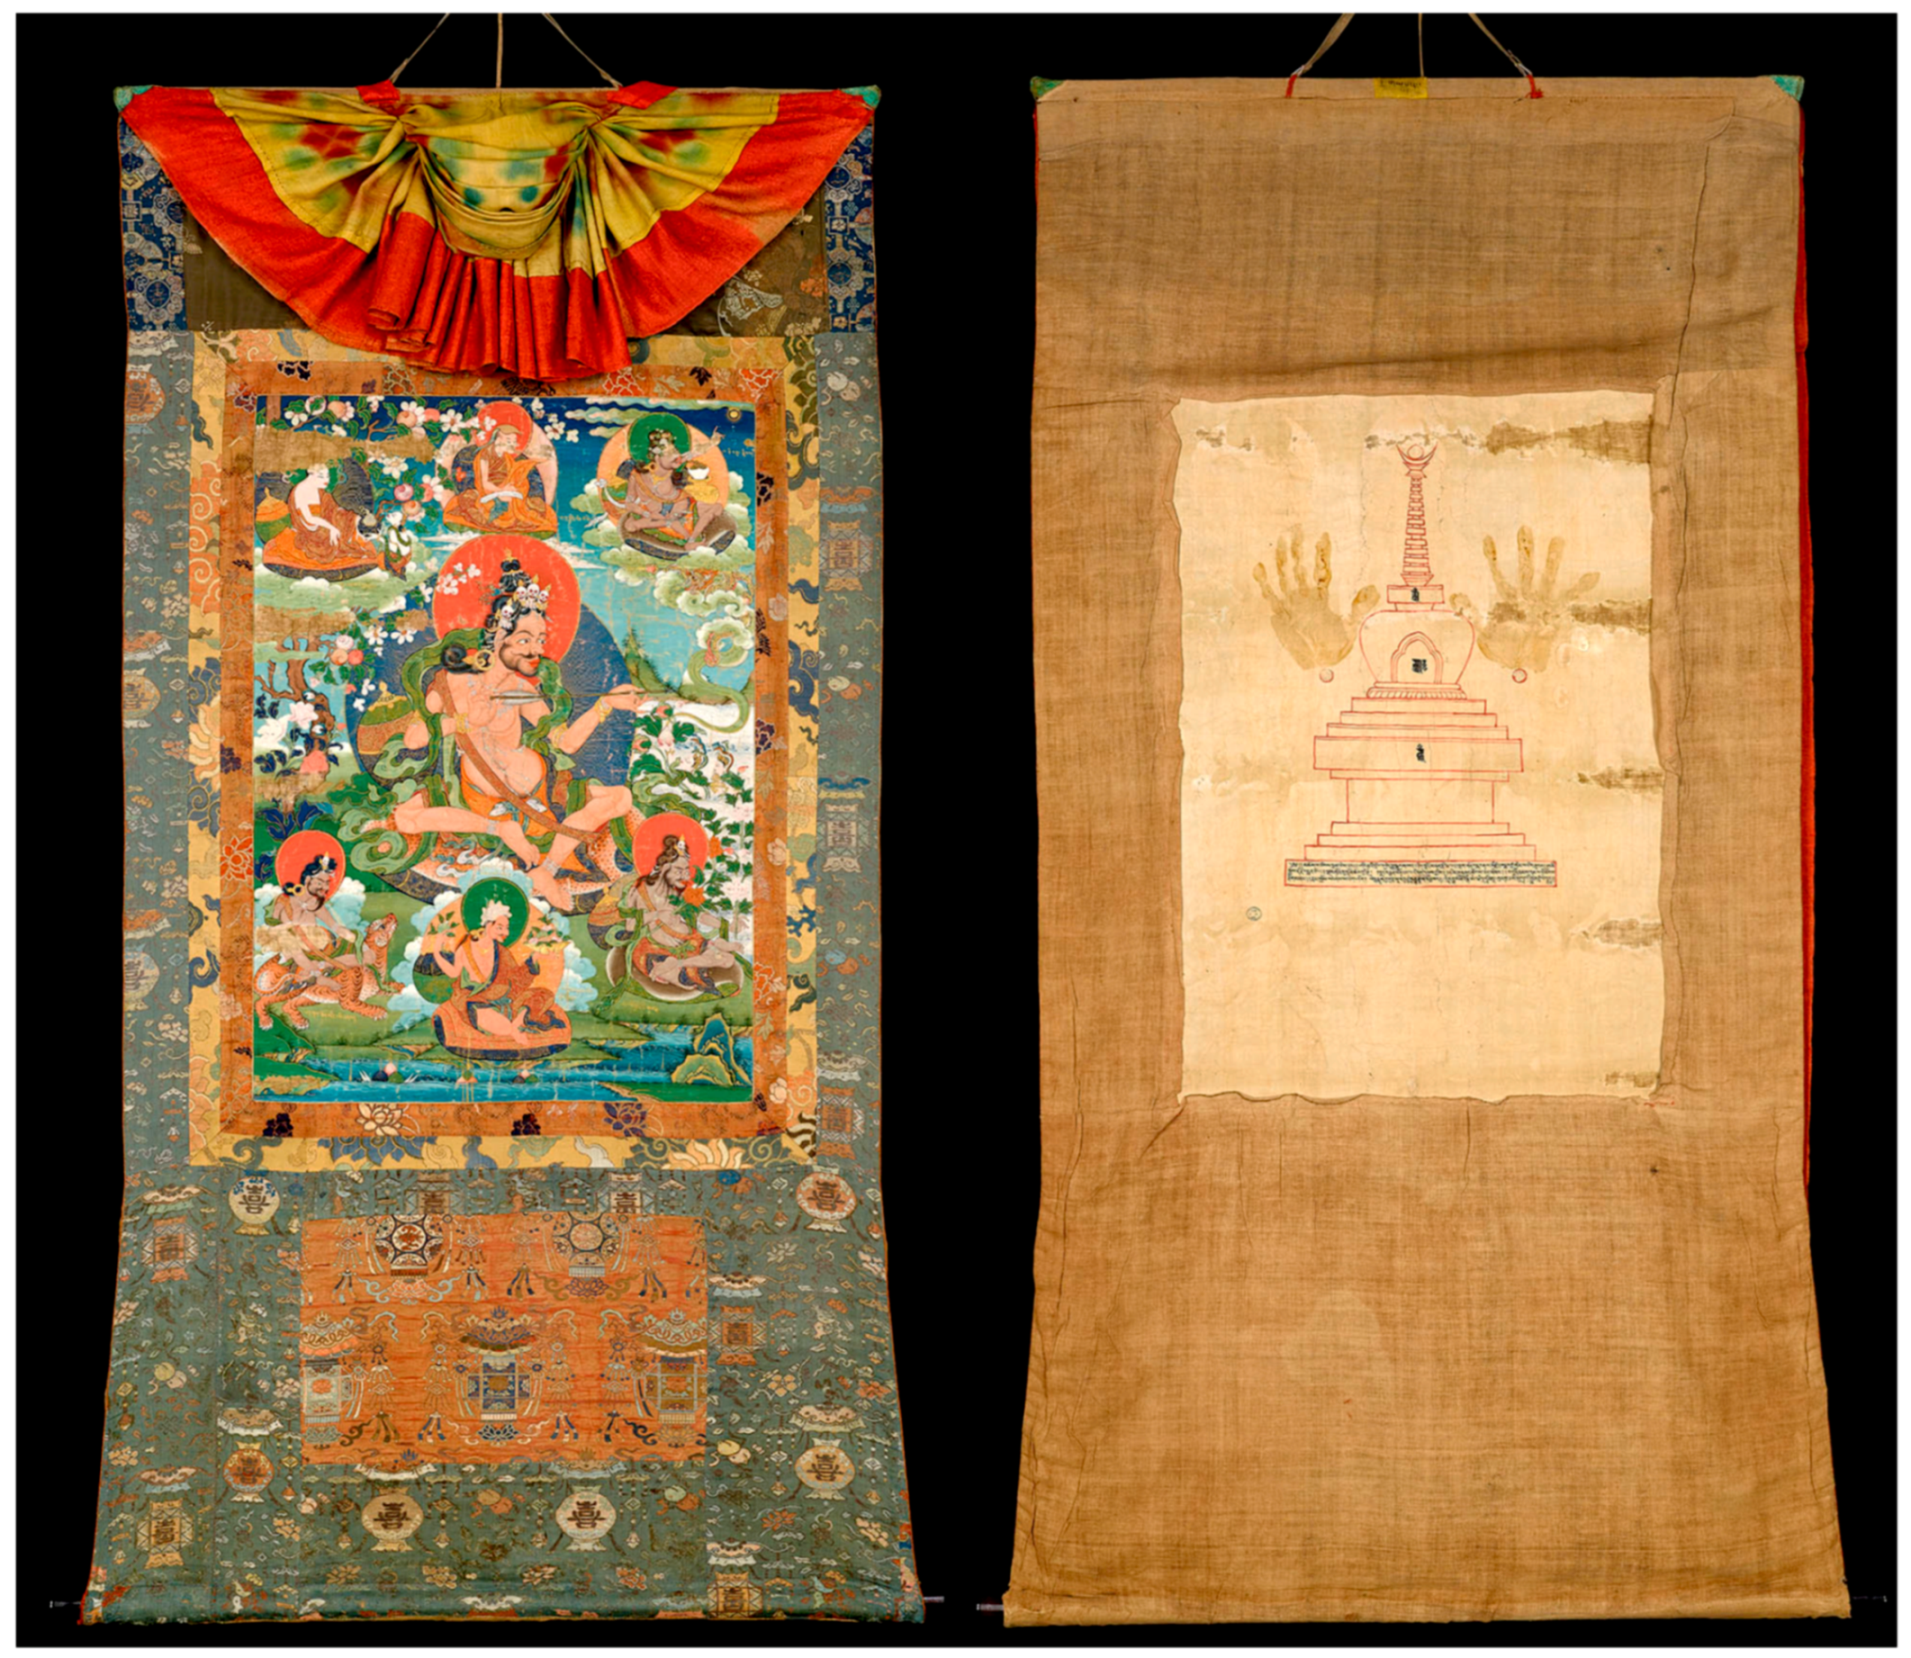
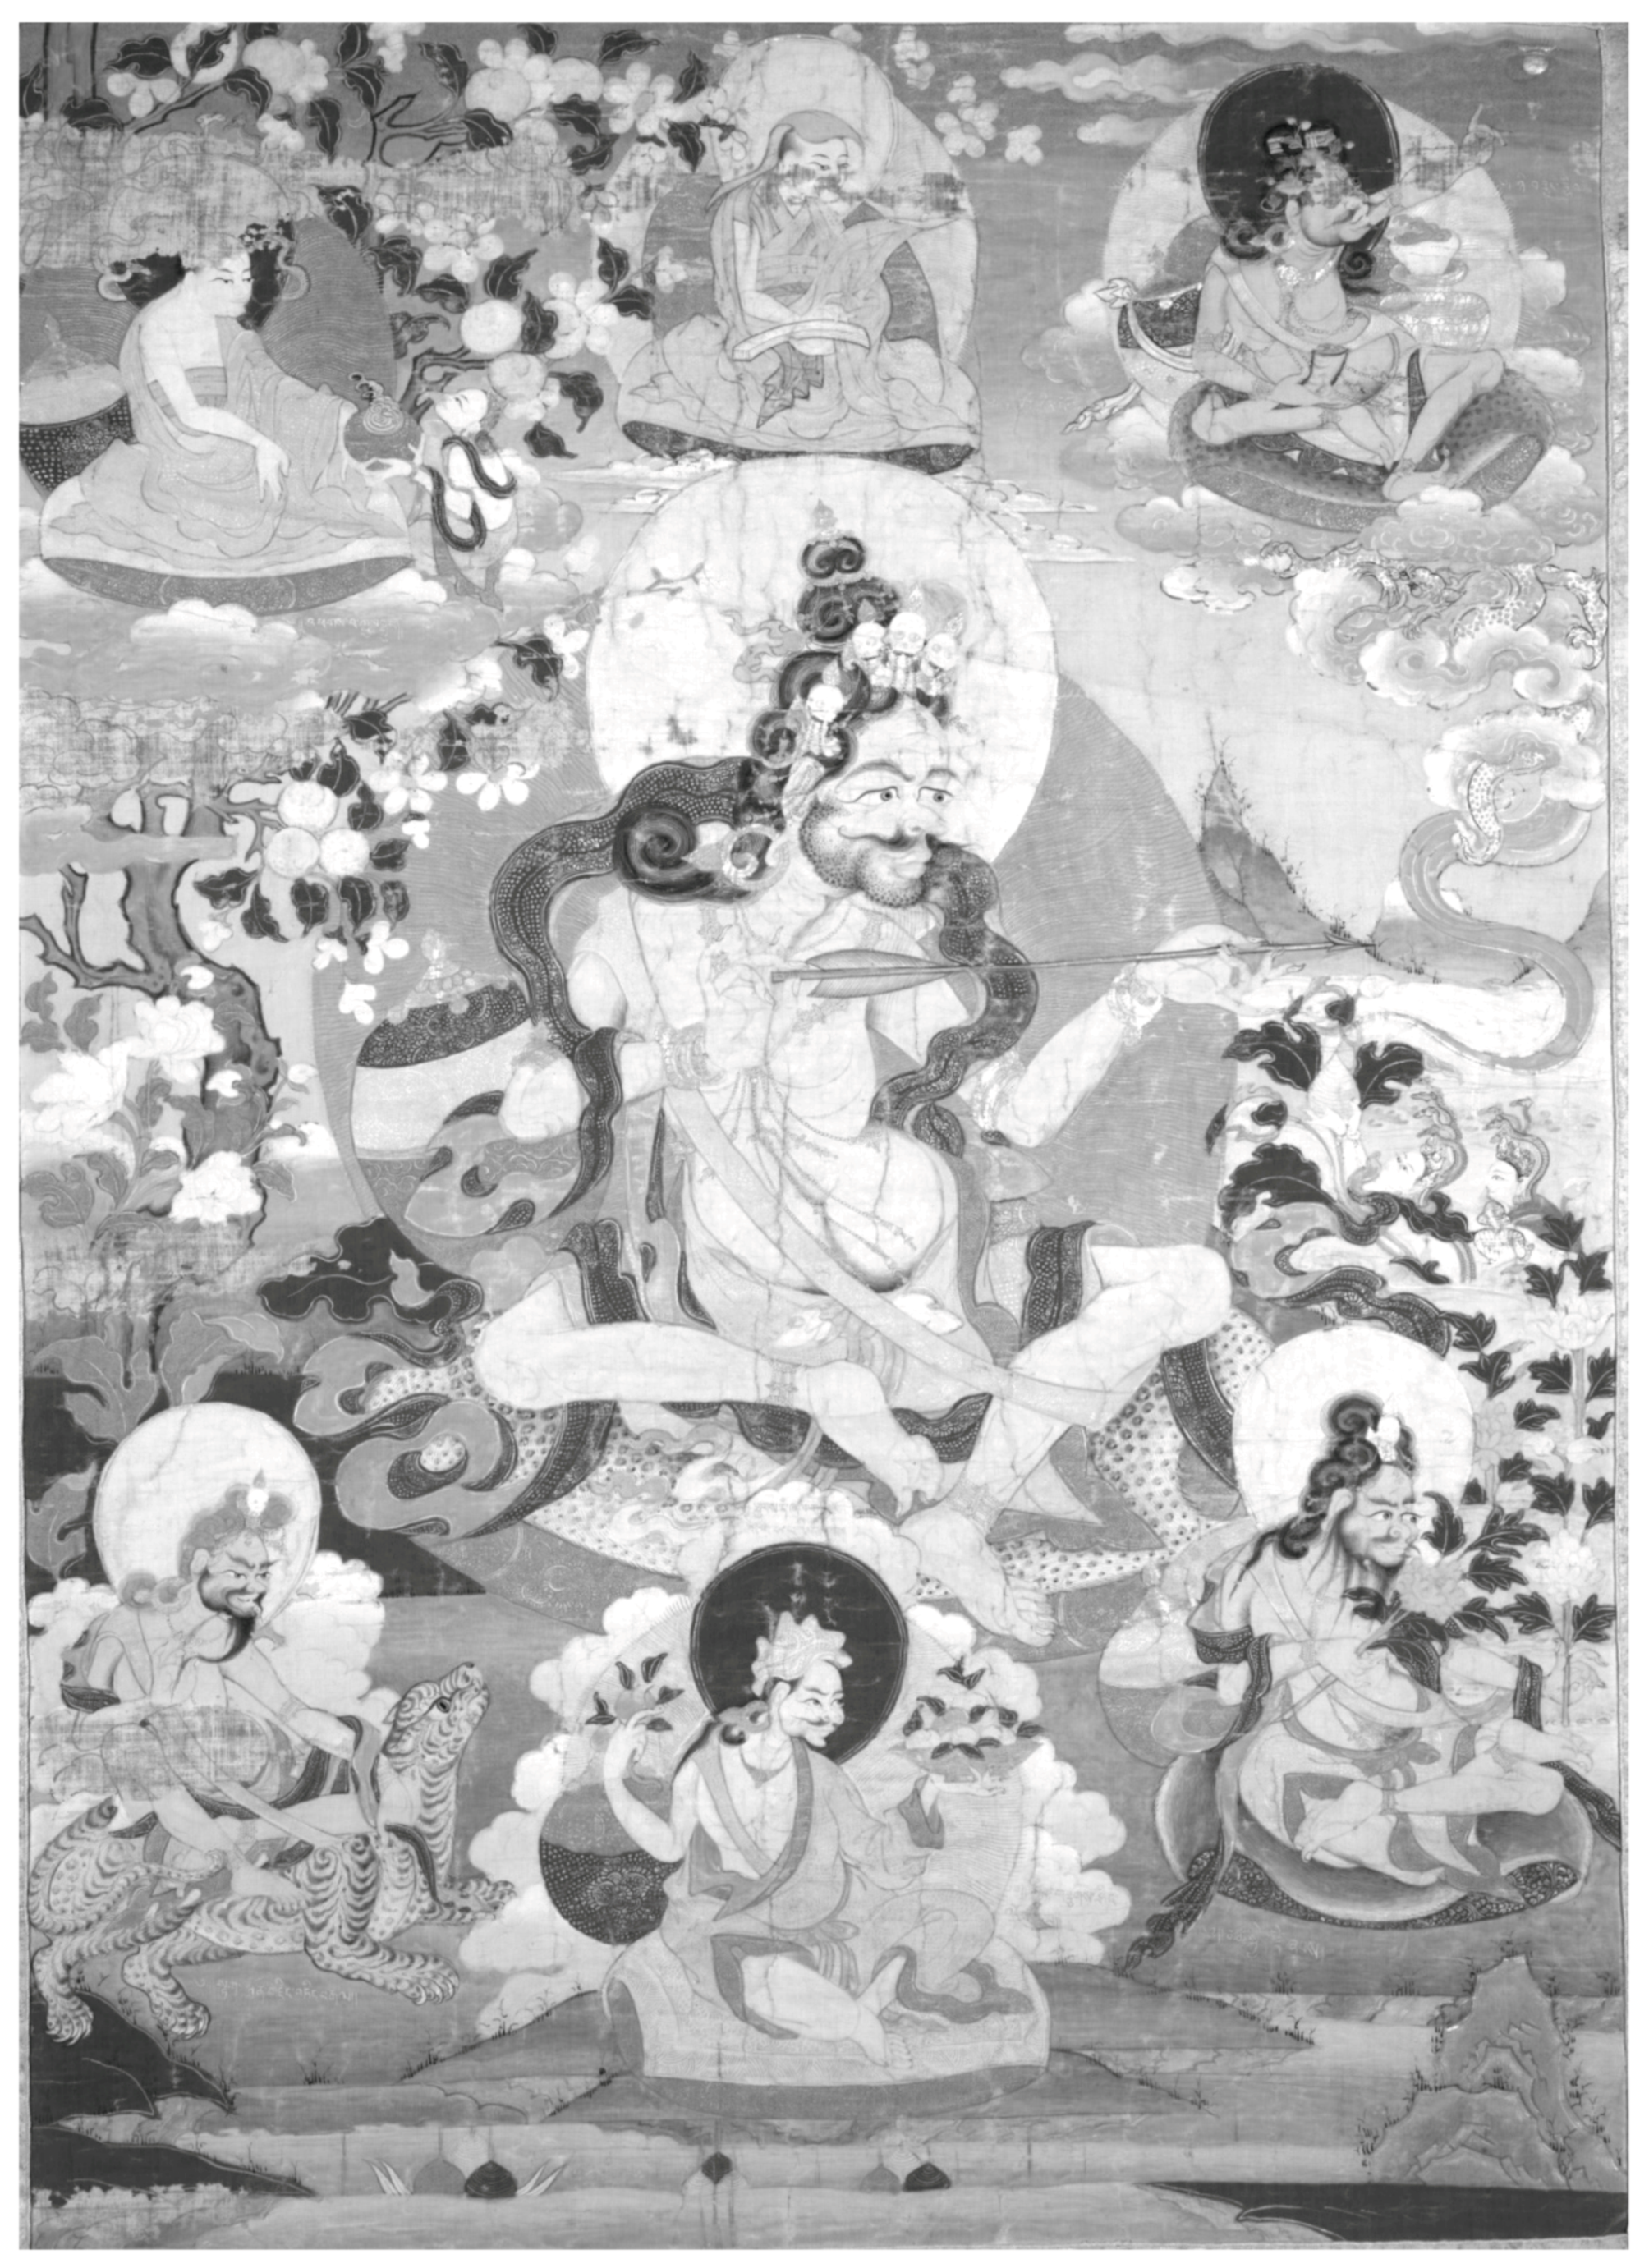
2.1. The Thangka

The thangka chosen for this study (British Museum Registration No. 1956,0714,0.40, Figure 1) is a painting on a cellulose-based textile, likely cotton, surrounded by silk borders dating to the 18th century and represents the Mahasiddha Saraha in the centre surrounded by five other Mahasiddhas (Nagarjuna, Virupa, Ḍombi Heruka, Padmavajra and Saroruhavajra), along with Butön Rinchendrup (1290–1364), the 11th Abbot of Shalu Monastery and a Sakya master. It is a large work (185 × 107.5 cm; the painting is 83 × 59 cm), part of a series of five Mahasiddha thangka paintings that were acquired by the museum as a complete set in 1956 and may have once hung together in a monastic assembly hall in Tibet [44] (p. 121).
On the reverse of the painting (Figure 1), there is a red outline of a stupa, a Buddhist shrine, and symbol of the enlightened mind of a Buddha, along with a mantra and a pair of handprints from the lama who consecrated the thangka after its completion [44] (p. 123). Handprints are not commonly found on thangkas [17] and the circular red seals below each handprint may indicate the identity of the holy teacher who consecrated this particular piece. The inscriptions along the base of the stupa include auspicious verses for the welfare of all beings.
It should be noted that, although this work focuses on the painted surface, the textile borders of a thangka are an integral part of the work. The significance of textiles mountings, as well as dye analysis of the textiles that compose the borders of this thangka, is addressed in another publication [45].
Furthermore, other than the issues detailed in the visual examination and microscopy section of the Results, the thangka painting was observed to be in a good general state of preservation with little evidence for alteration of any of the pigments (other than the faded yellow sections mentioned later) or past conservation treatments, other than some light consolidation around areas of paint loss.

2.2. Methodology

A multi-analytical protocol was applied in order to provide a better understanding of the thangka’s creation. The main aim was to collect as much information non-invasively about the painting as possible, by using available techniques to minimise the number of micro-samples to be taken for further analysis.
Figure 2 describes the workflow followed for these investigations, which was comprised of three stages, namely:
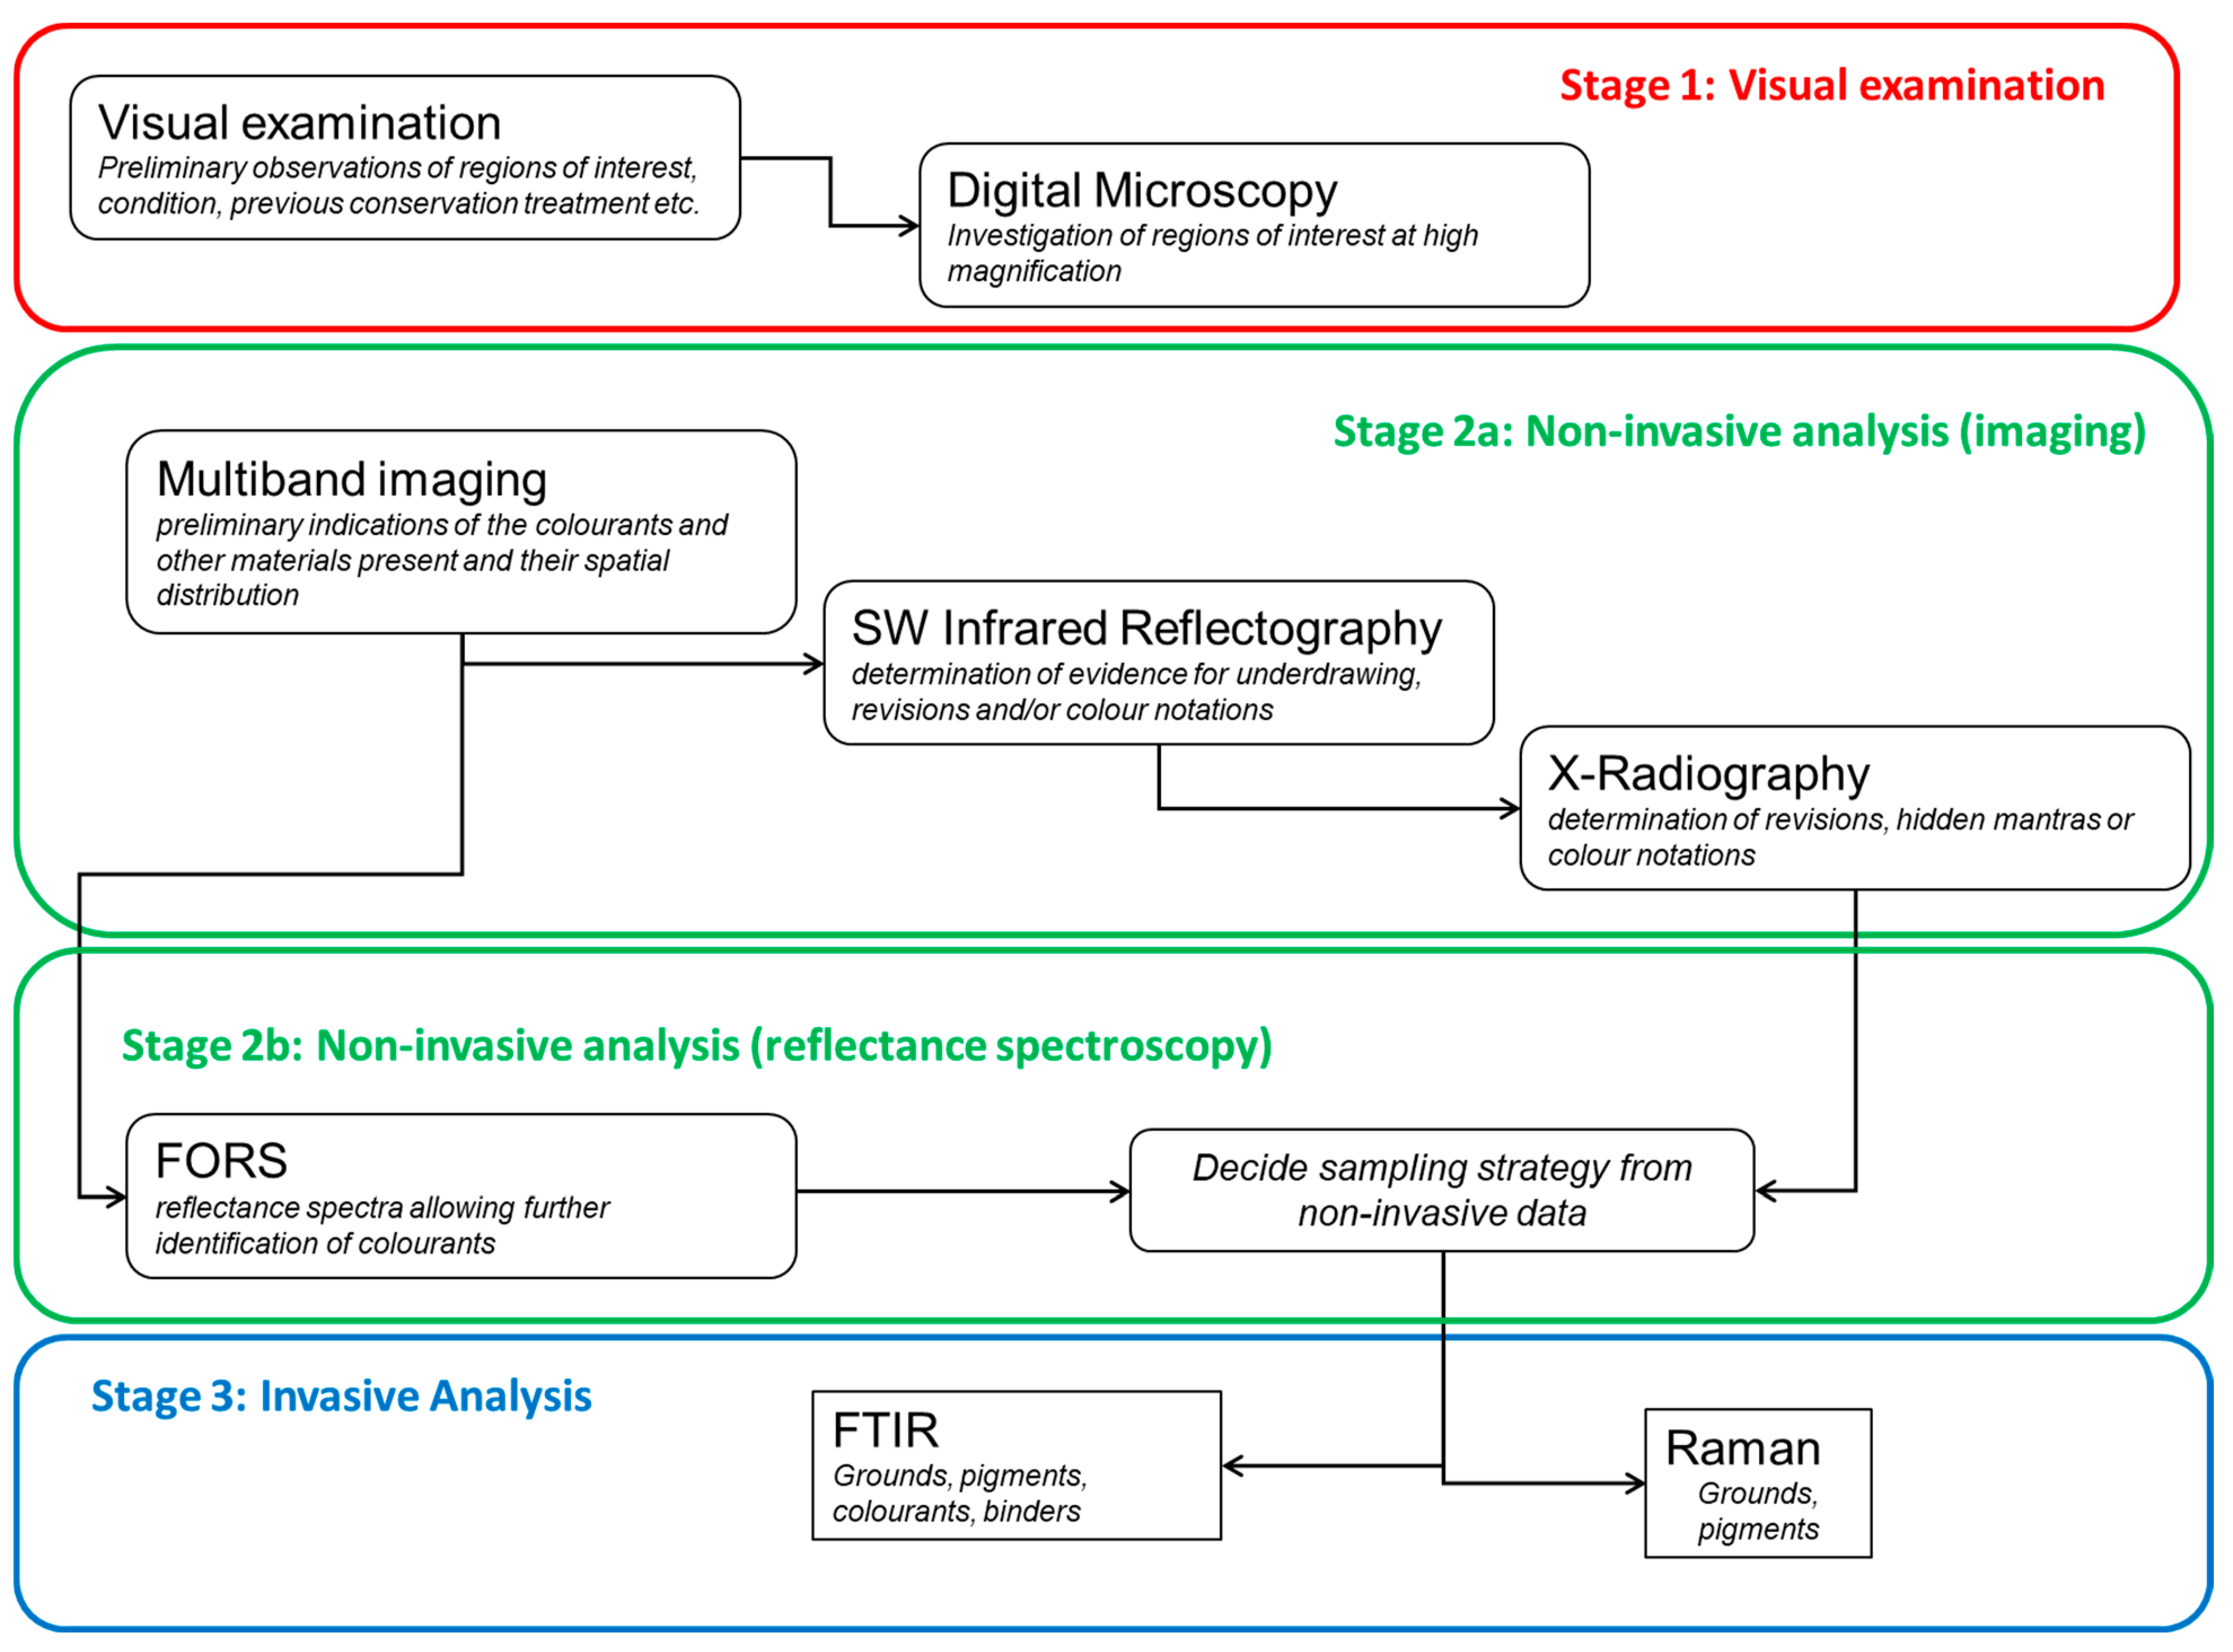
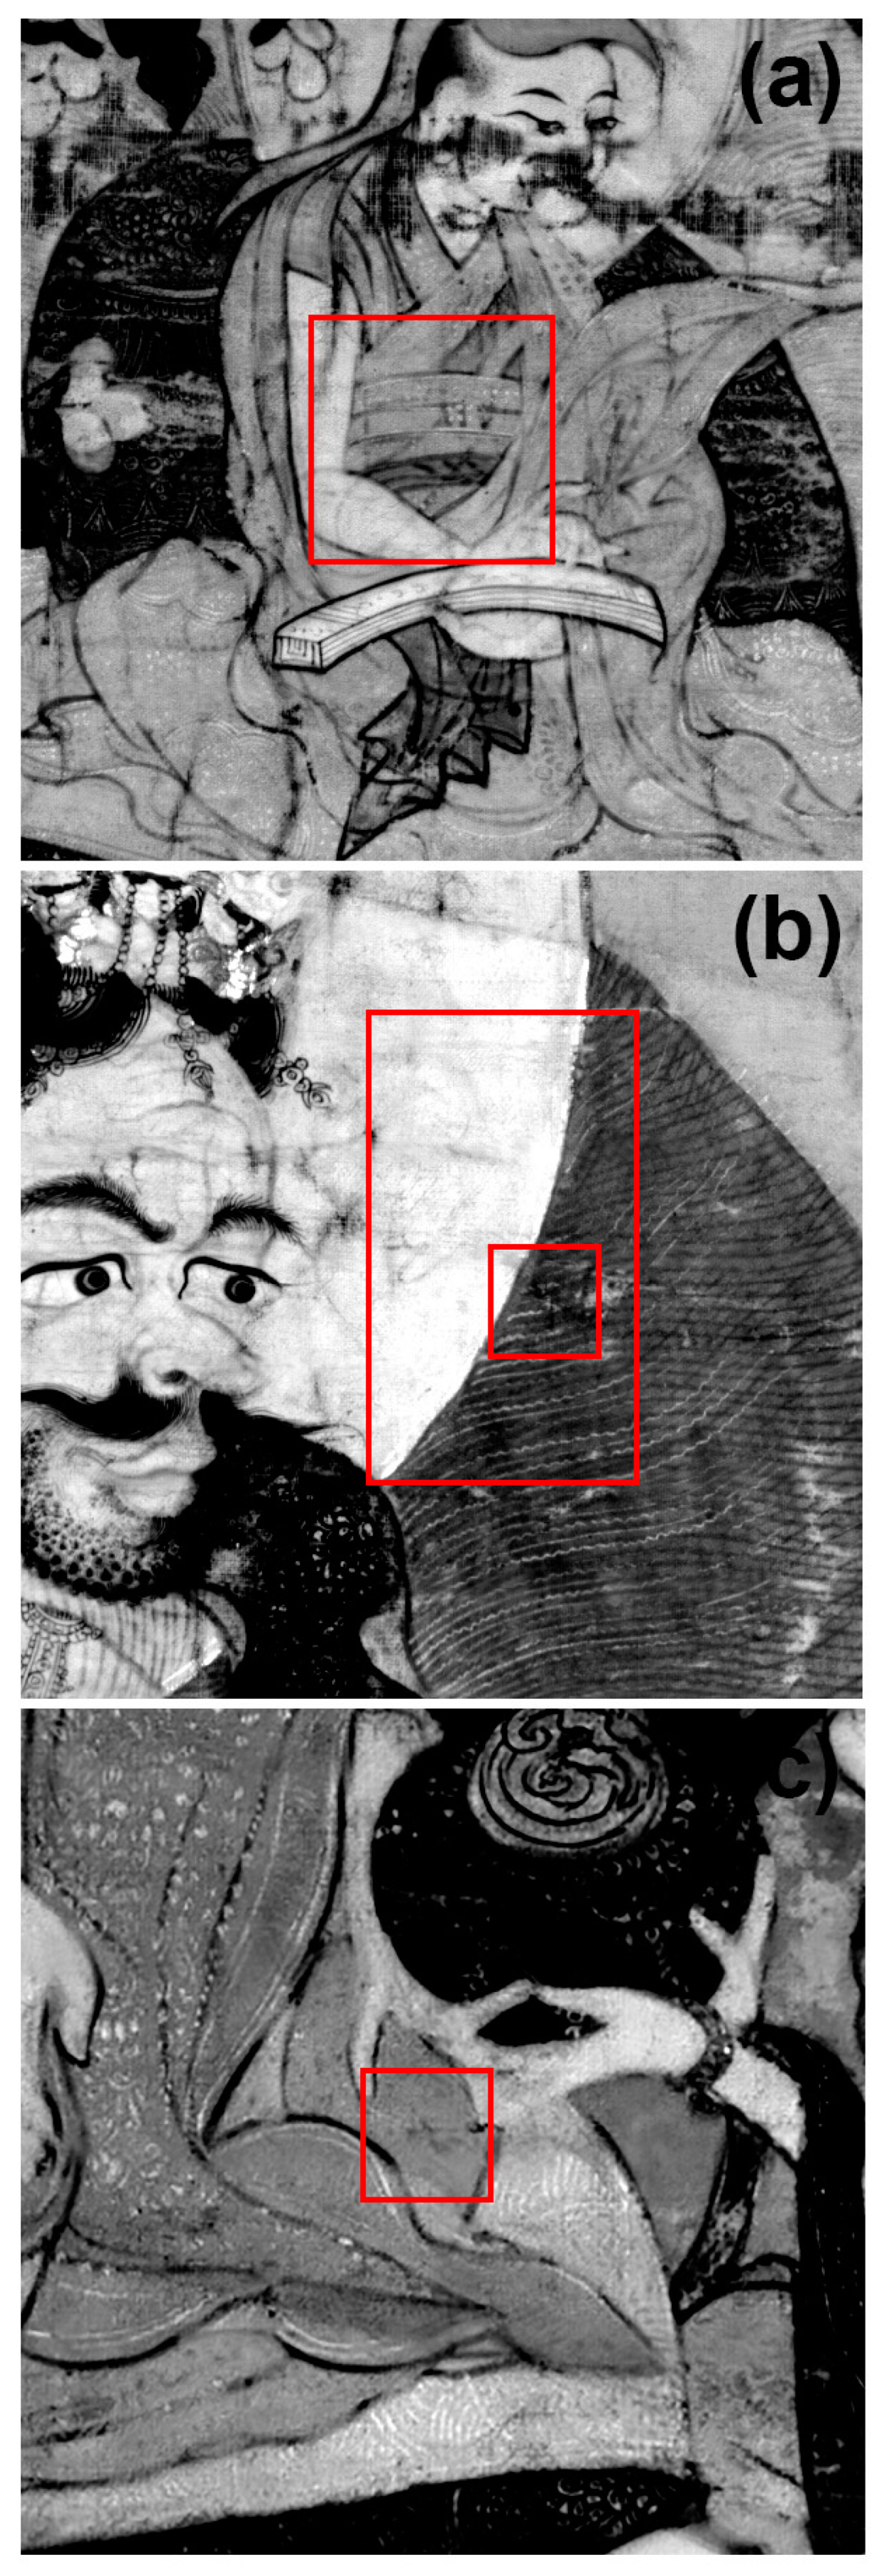
  • A preliminary visual examination of the painting, including observations under magnification, in order to assess its condition. Digital microscopy was used to capture details related to the underdrawing and painting technique (Stage 1).
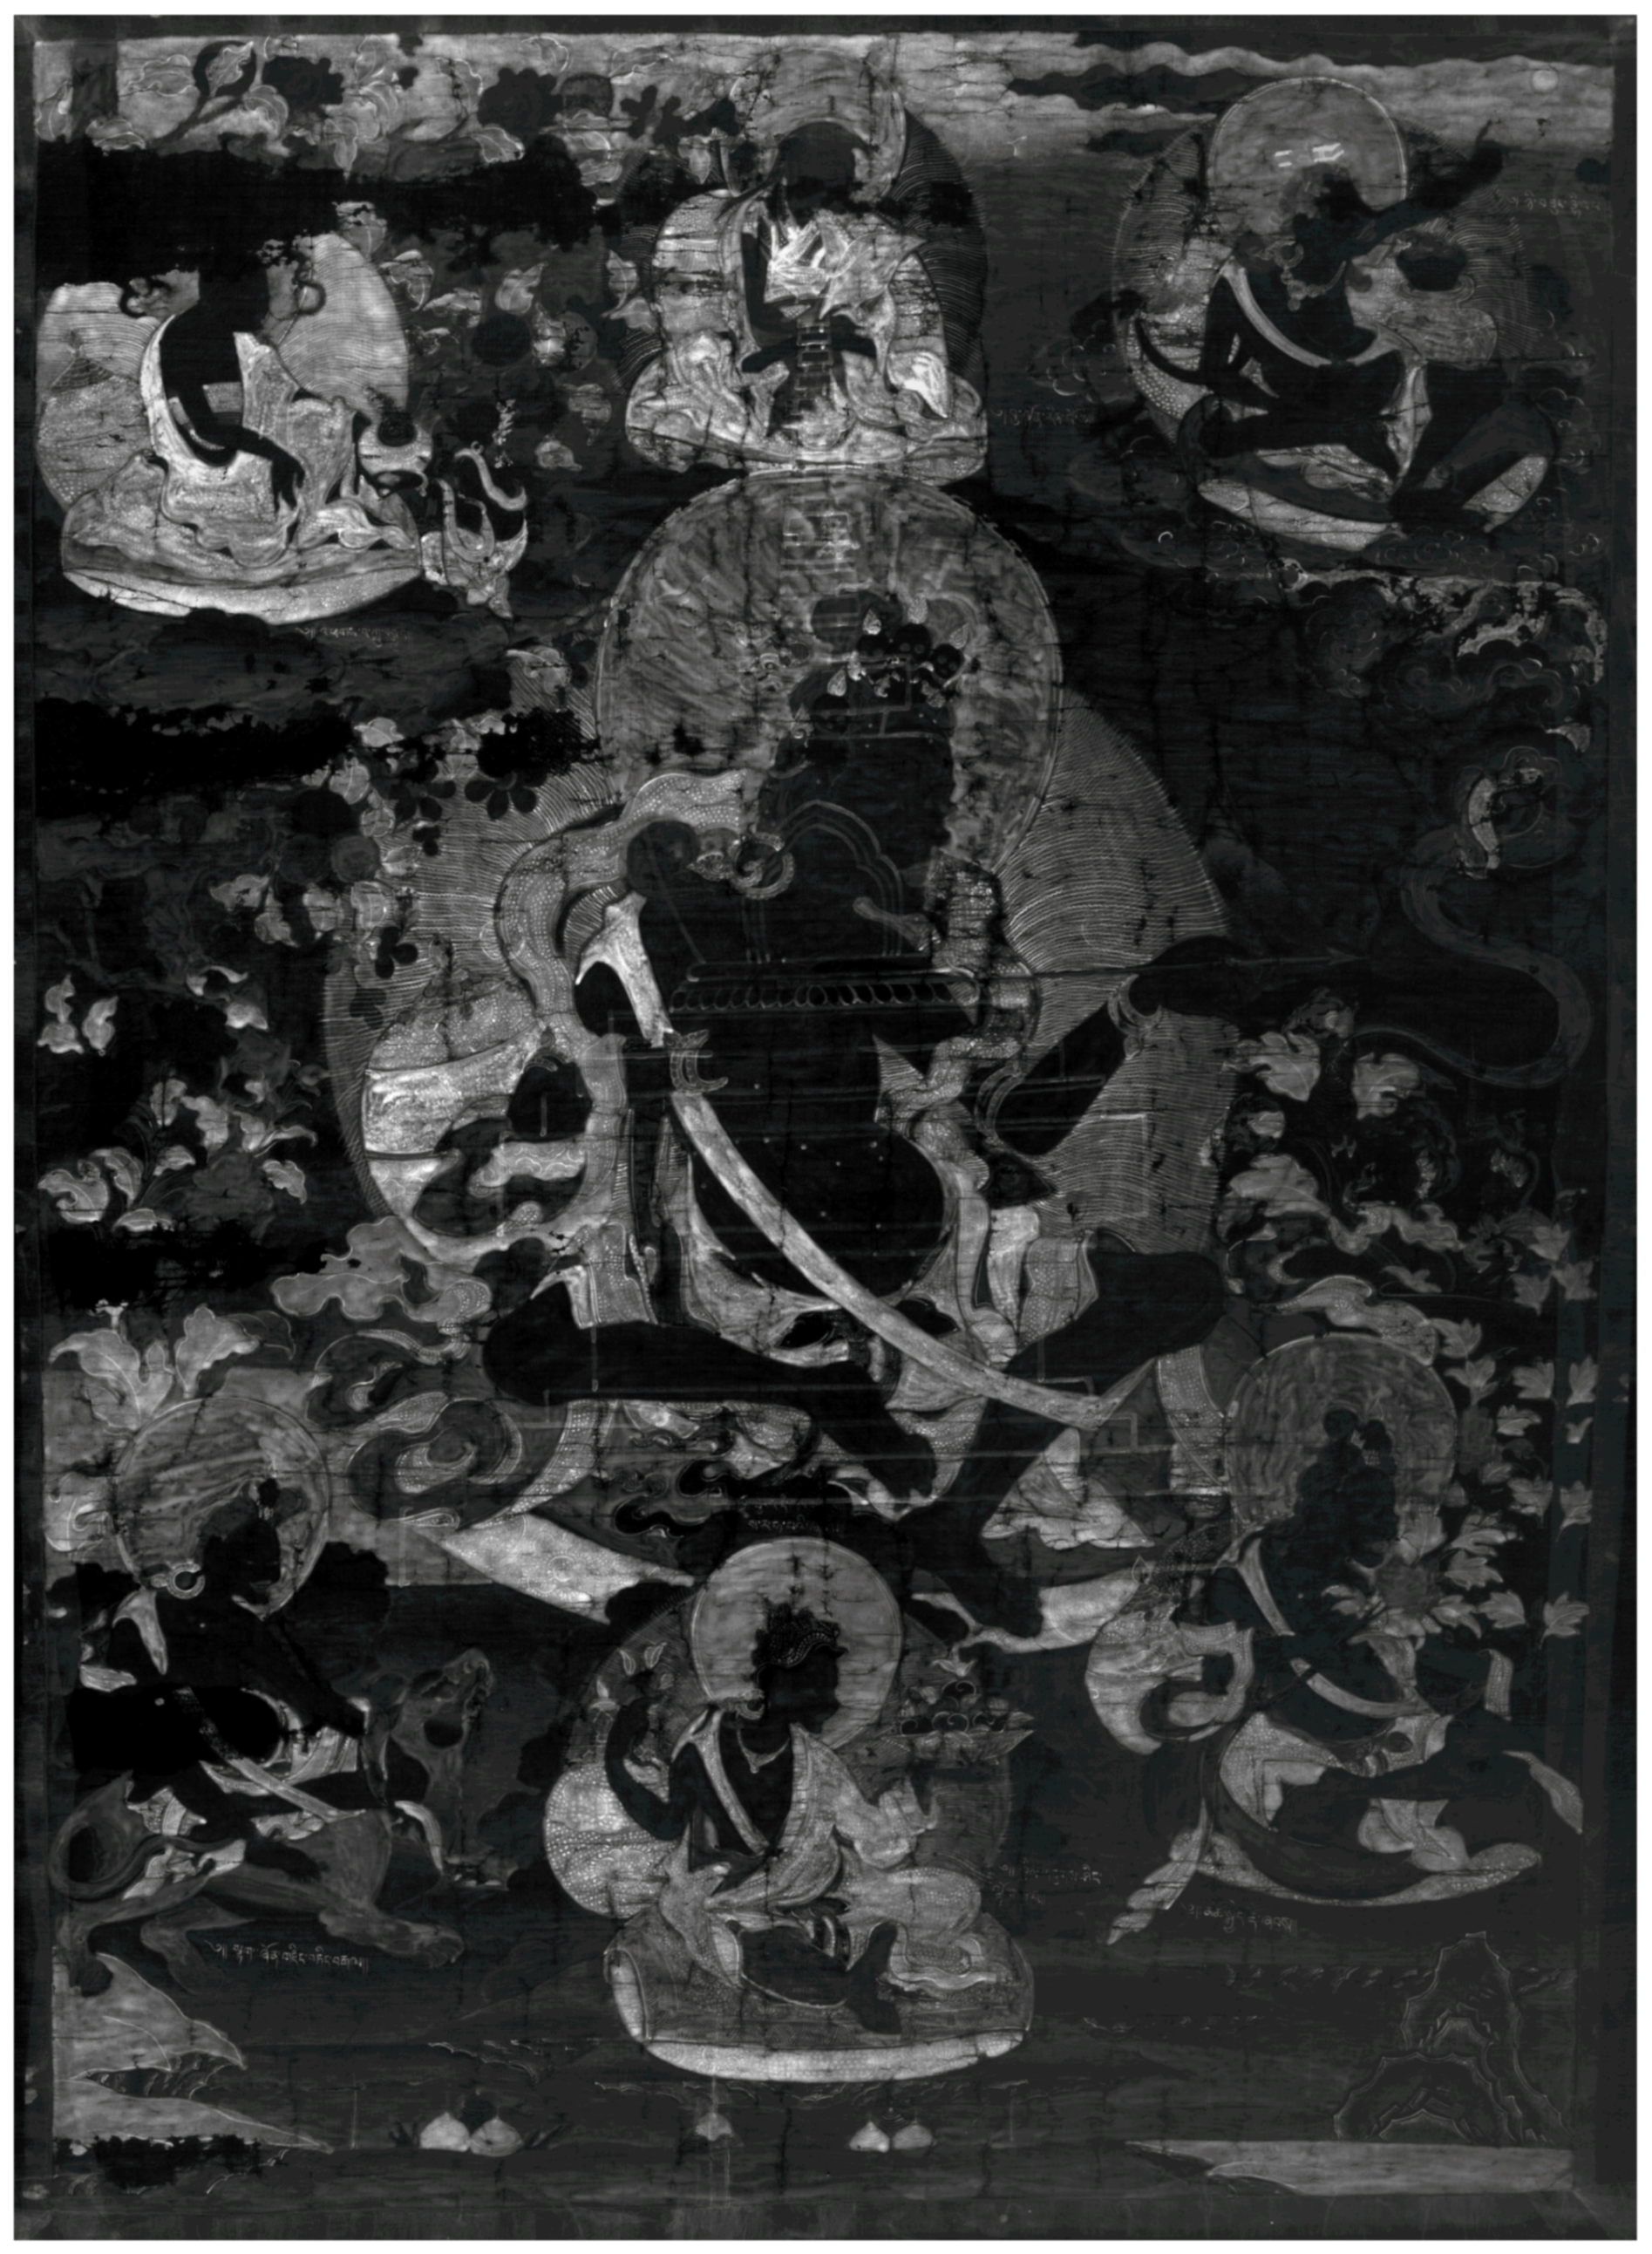
  • The use of non-invasive imaging techniques, including broadband multispectral imaging (MSI), short-wave infrared reflectography (SWIR) and X-radiography (Stage 2a). The increasing depth of penetration of each technique into the paint layers allowed the various layers of the composition to be studied. At this stage, the nature of some of the colourants and drawing media could already be identified. However, where further information was required, this was supplemented by spot measurements of areas of interest using fibre optic reflectance spectroscopy (FORS), which further elucidated the nature of the colourants employed (Stage 2b).
  • A strategic sampling campaign enabled by this combined data set, in which a very low number of samples were taken for further analysis, based on similarities between coloured areas observed by MSI and FORS. The samples were investigated using Fourier transform infrared (FTIR) and Raman spectroscopy (Stage 3).

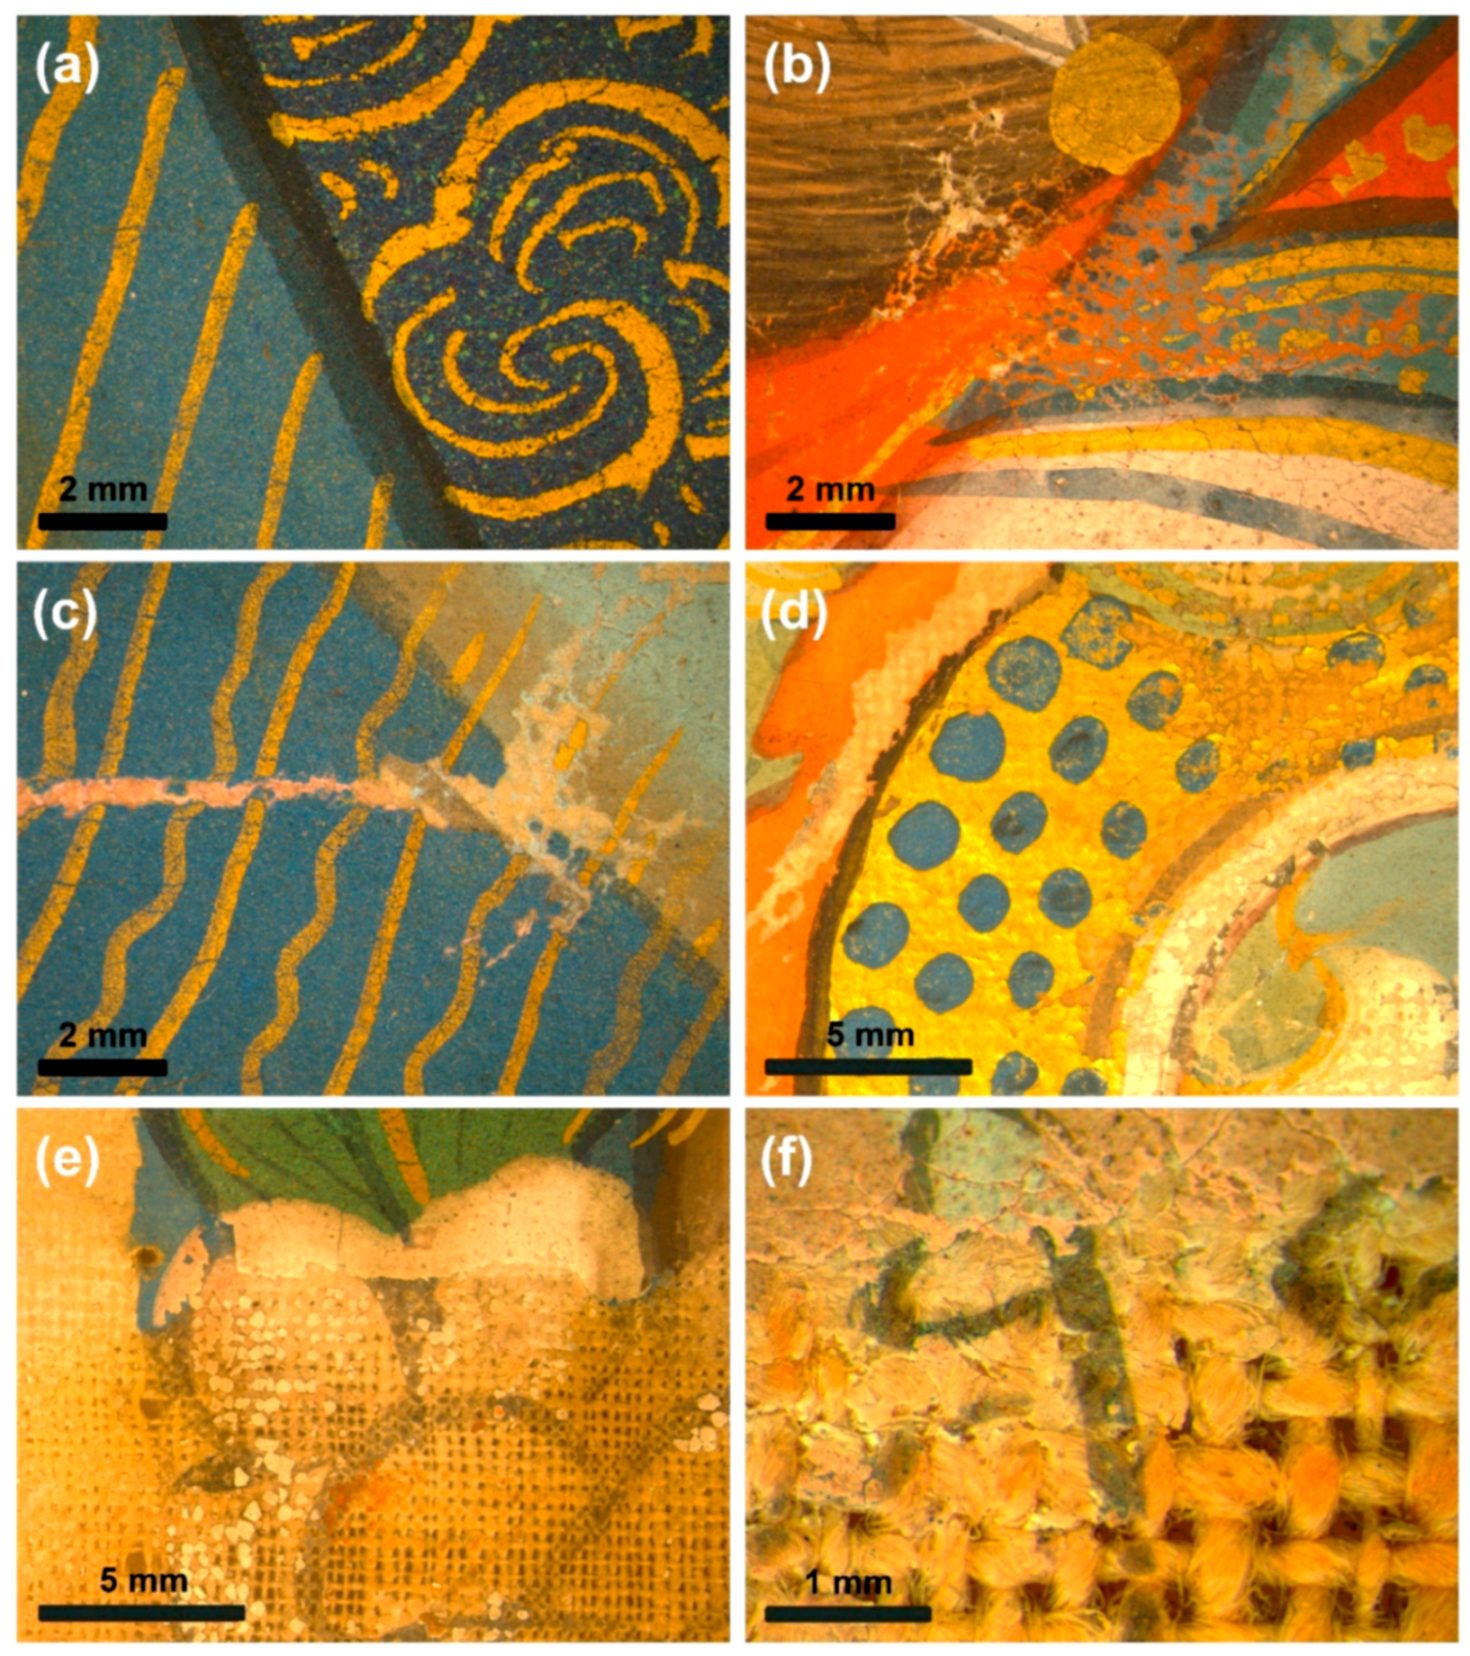
2.2.1. Visual Examination and Digital Microscopy

Initial examination was carried out in direct and raking light, and under magnification using a Leica M651 surgical microscope.

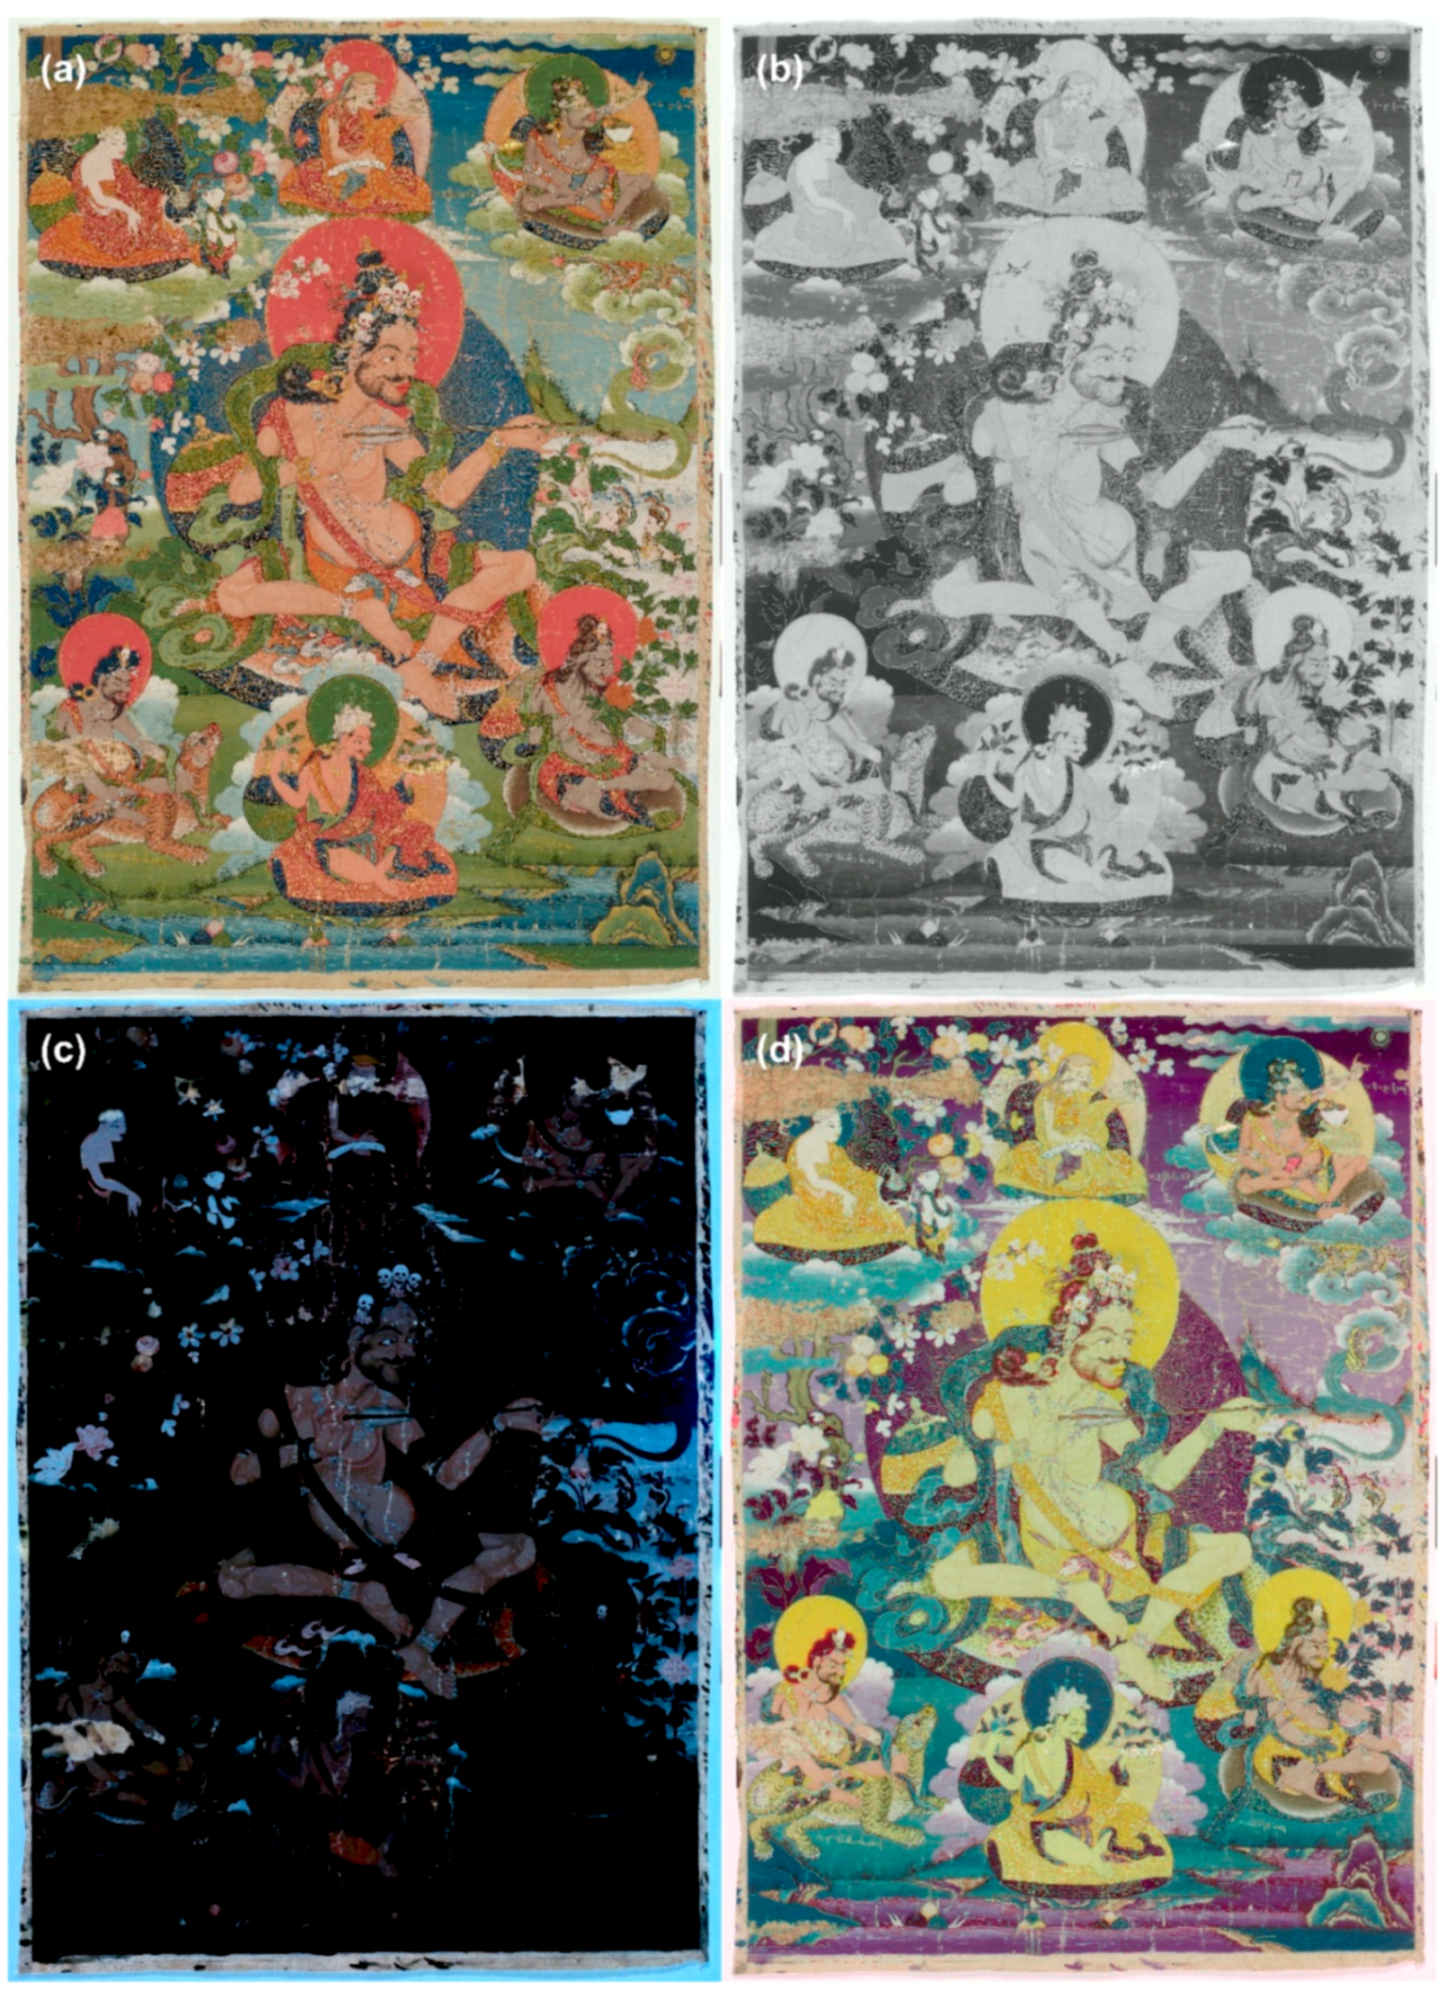
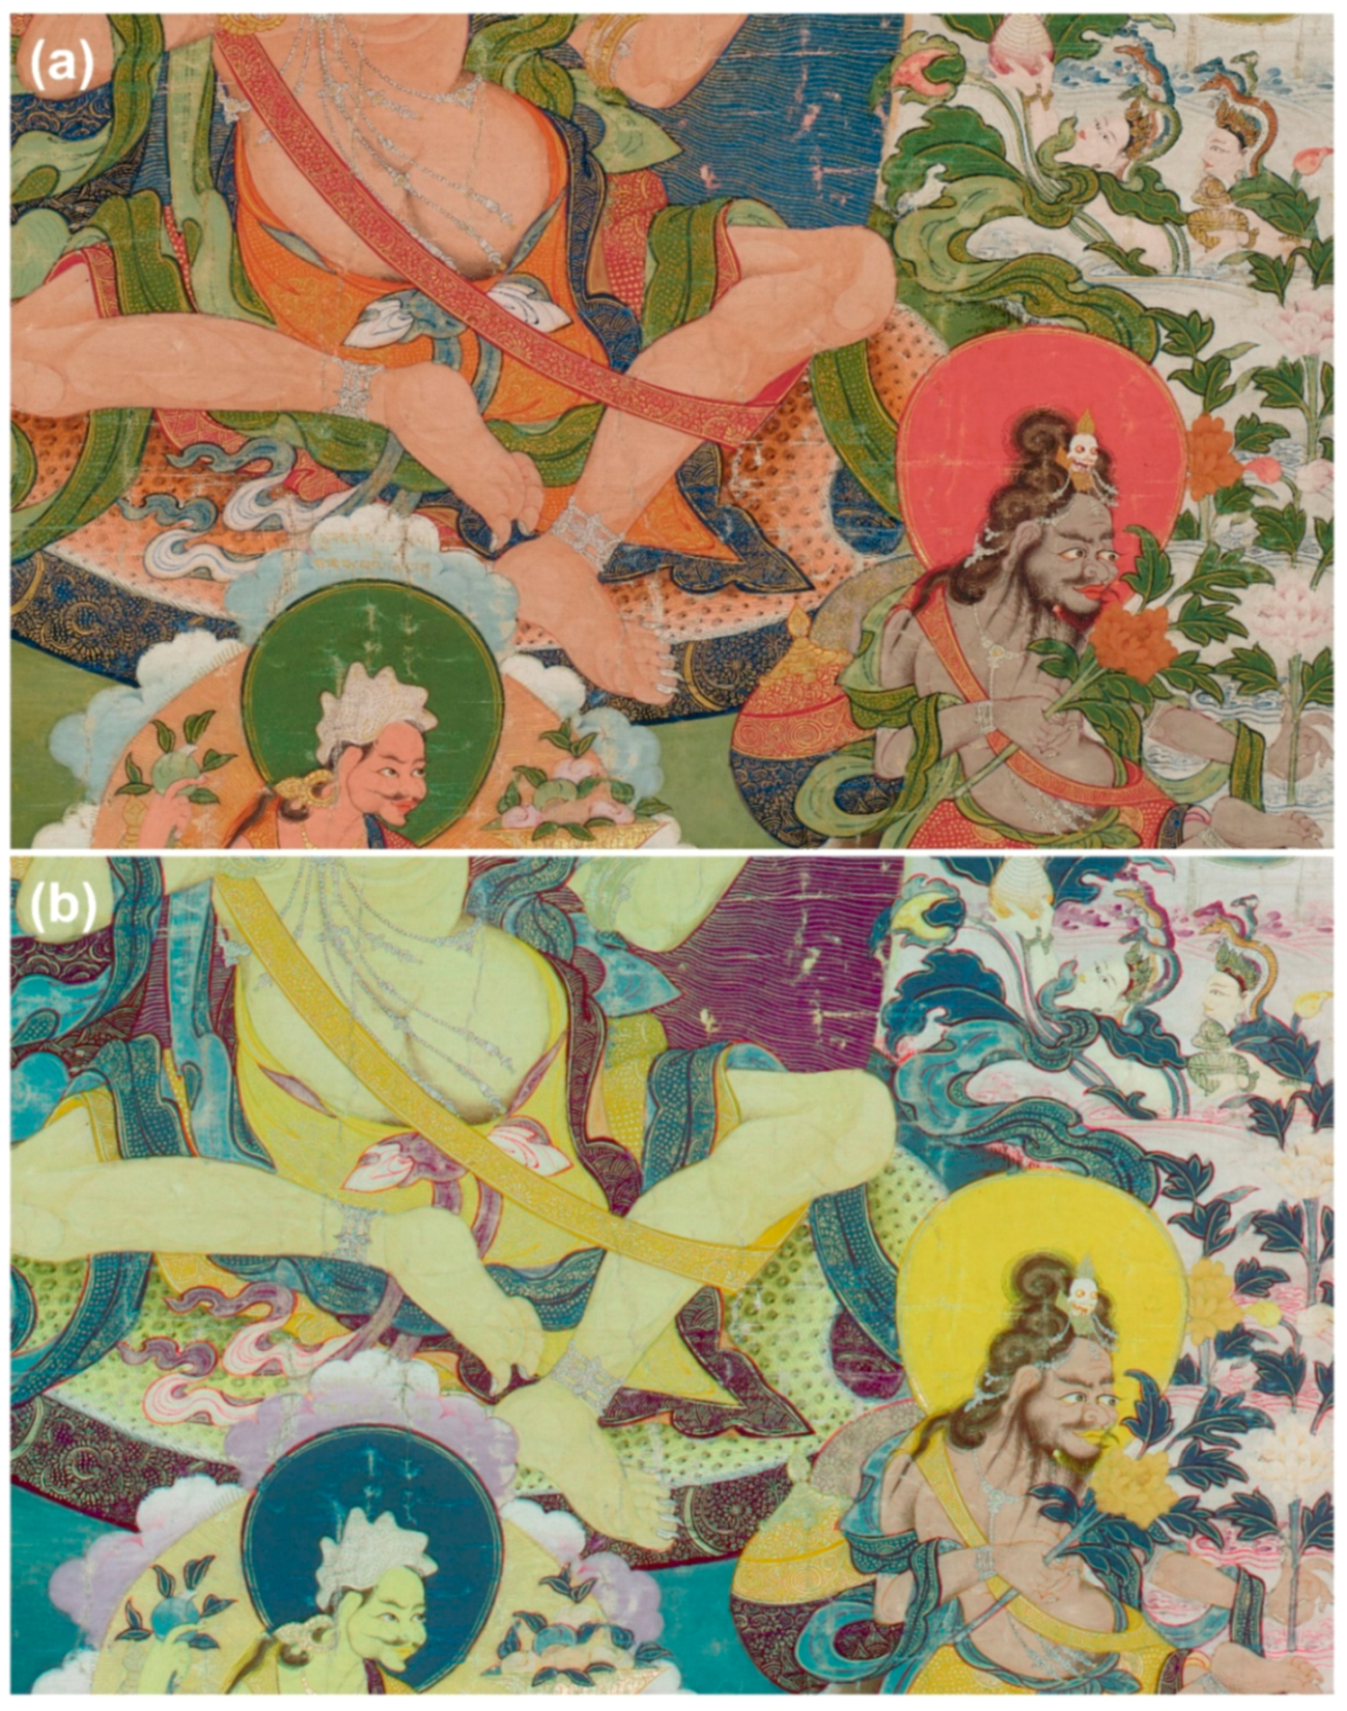
2.2.2. Broadband Multispectral Imaging (MSI)

The set of images acquired included visible-reflected (VIS), infrared-reflected (IRR) and ultraviolet-induced visible luminescence (UVL). An infrared-reflected false colour (IRRFC) image was produced by combining VIS and IRR, as described in [34,36,38]. The images were taken using a Hasselblad Camera 503CW with Carl Zeiss Planar 80 mm f/2.8 lens.
An unmodified Phase One P65+ digital back was used to acquire the VIS and UVL images. A Phase One IQ3 80 MP digital back, modified by the removal of the inbuilt UV-IR blocking filter in order to exploit the full sensitivity of the CCD sensor (ca. 350–1100 nm), was used to collect the IRR images. The camera was operated in fully manual mode. The thangka was illuminated by two radiation sources symmetrically positioned at approximately 45° with respect to the focal axis of the camera and at about the same height. A filter, or combination of filters, was placed in front of the camera lens in order to select the wavelength range of interest. The combinations of radiation sources and filter(s) used for each MSI technique are summarised in Table 1.
The entire shooting process for acquiring the images lasted for approximately one hour, of which 15 min were dedicated to UVL imaging. The risk of damage when exposing the painted surface to a UV source for such a short amount of time can be considered negligible. Details about the post-processing of the images and the production of the IRRFC image are reported in a previous publication [34,36,38].

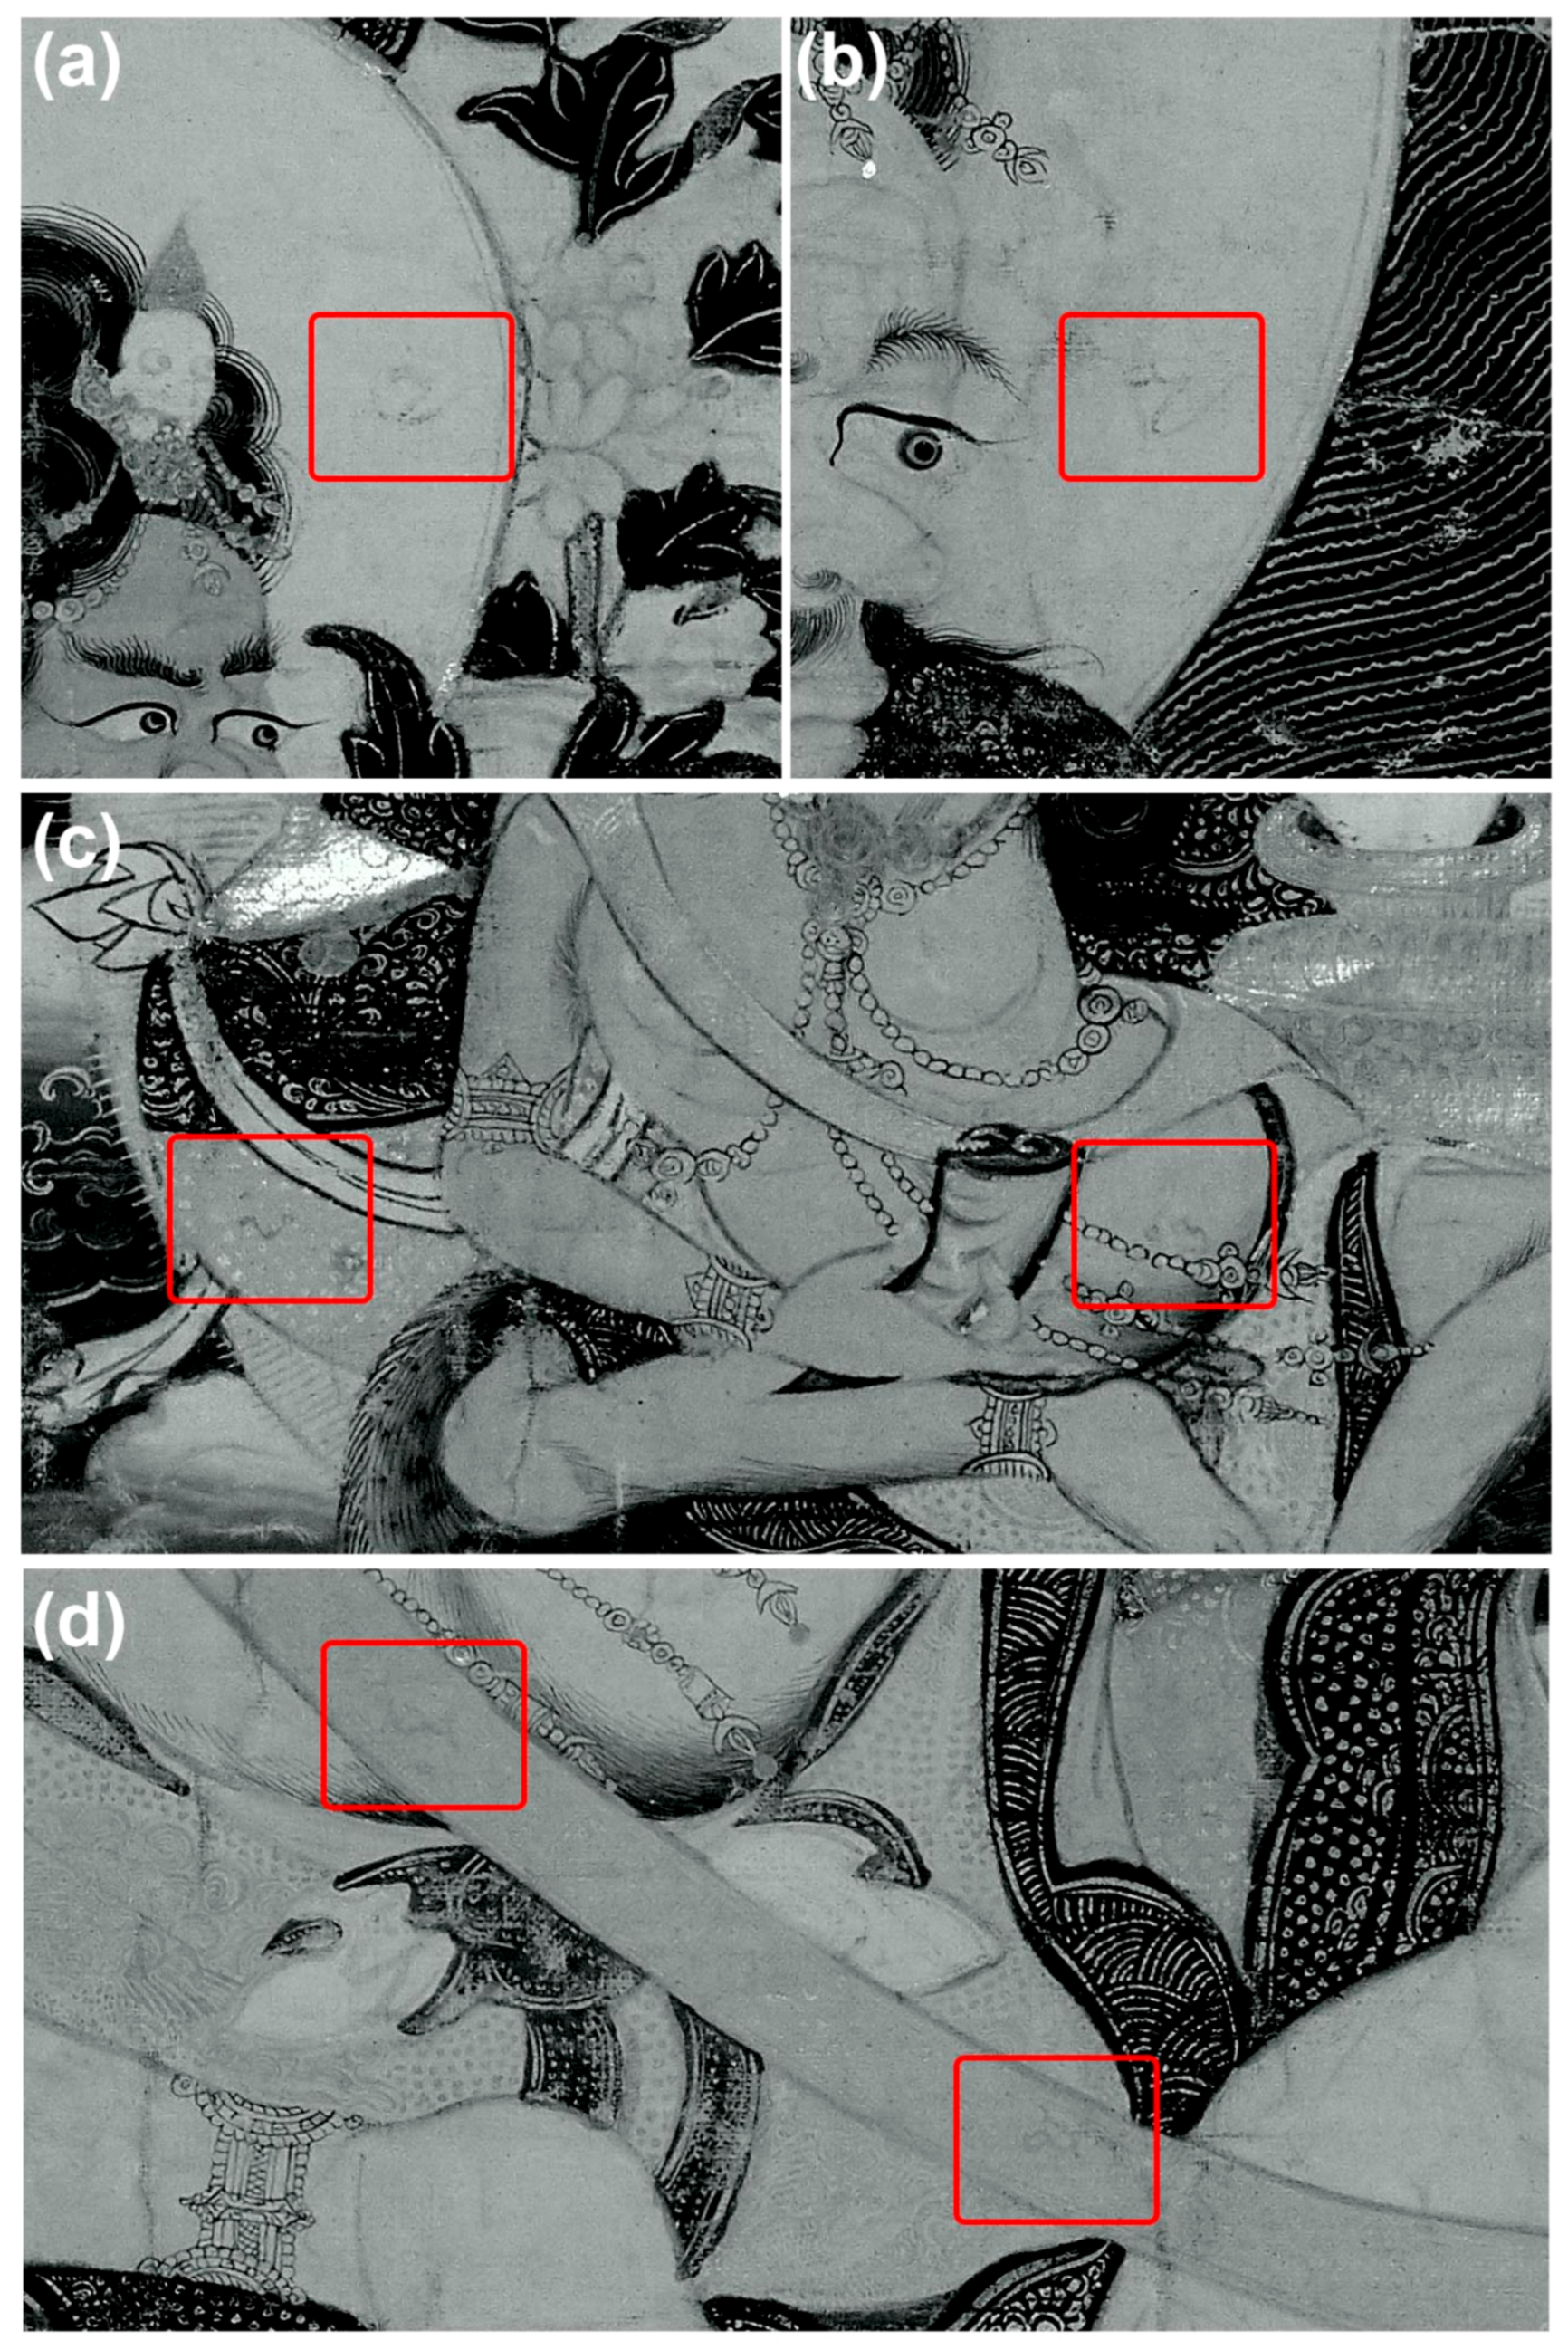
2.2.3. Short Wave Infrared Reflectography (SWIR)

Infrared reflectograms were captured using an Apollo Imaging System, manufactured by Opus Instruments, UK, with a 128 × 128 px InGaAs area sensor (sensitivity c. 900–1700 nm) and a six-element 150 mm focal length f/5.6–f/45 lens.
Two tungsten radiation sources Classic Elinchrom 500 Xenon flashlights, each equipped with a softbox (diffuser), were positioned at approximately 45° with respect to the focal axis of the camera.

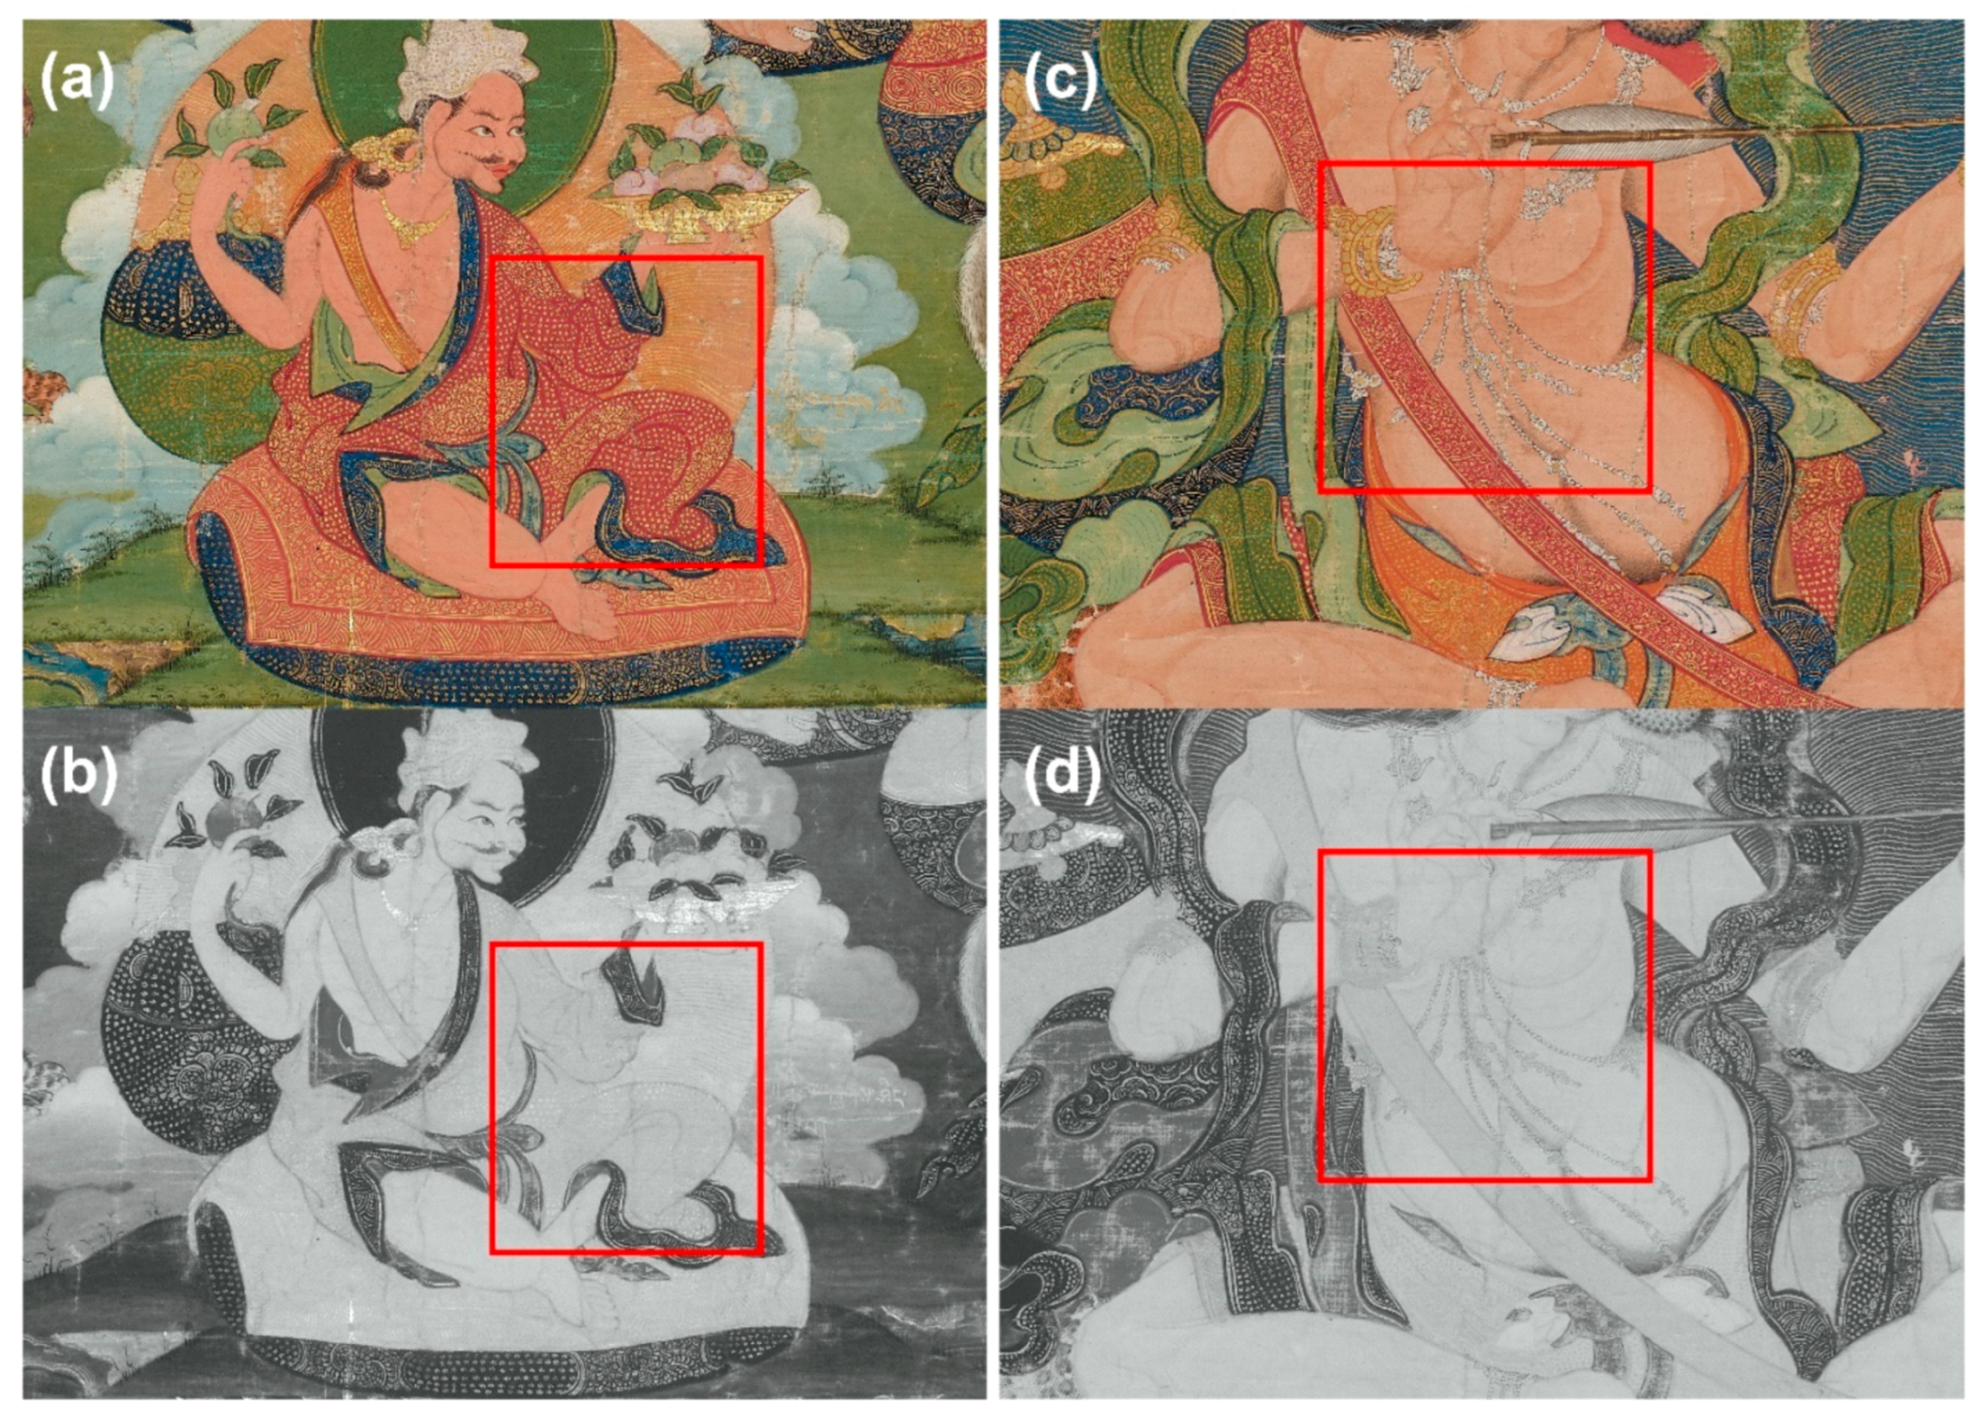
2.2.4. X-Radiography

Computed radiography of the thangka was conducted in the British Museum X-radiography Suite. The thangka was laid flat on a foamcore board and the X-ray tube was positioned above the thangka at a height of approx. 3 m and oriented with the aperture facing straight down.
Radiographs were recorded on a Carestream Industrex Flex HR imaging plate (dimensions 350 × 430 mm) positioned underneath the thangka. The imaging plates were subsequently scanned and converted to digital images with a 35-micron pixel size. Due to the size of the thangka, 8 partially overlapping X-radiographs were acquired (4 horizontal rows of 2 images) and then stitched into one image. The positions of the X-ray tube and thangka were kept fixed throughout the imaging process.
X-radiographs were acquired using X-ray tube settings of 50 kV and 5.0 mA, with a 1.0 mm focal spot selected, and no additional beam filtration. The exposure time was 300 s per radiograph.
A flat field approximation (to correct for a non-uniform X-ray illumination of the thangka in the horizontal plane) was taken by averaging the radiographic intensity across the bottom textile border of the thangka, fitting to a quadratic and extrapolating across the whole image. The stitched radiograph was then divided by this flat field to obtain a corrected image. A dark field correction was not performed, since the imaging plate had a sufficiently uniform response across its active area.

2.2.5. Fibre Optic Reflectance Spectroscopy (FORS)

Fibre optic reflectance spectra were recorded for all the coloured areas of interest with an Avantes (Apeldoorn, The Netherlands) AvaSpec-ULS2048XL-USB2 spectrophotometer equipped with an AvaLight-HAL-S-IND tungsten halogen light source. The detector and light source were connected with a fibre optic bundle to an FCR-7UV200-2-1.5 × 100 probe. In this configuration, light was sent and retrieved by the bundle set at approximately 45° from the surface normal, thus excluding specular reflectance. The spectral range of the detector was 200–1160 nm; nevertheless, due to poor blank correction on both the extremes of the range, only the range between 400 and 900 nm was considered; as per the features of the monochromator (slit width 50 μm, a grating of UA type with 300 lines/mm) and of the detector (2048 pixels), the best spectra resolution was 2.4 nm calculated as full width at half maximum (FWHM). Spectra were referenced against the WS-2 reference tile provided by Avantes. The diameter of the investigated area on the sample was approximately 1 mm, obtained by setting the distance between the probe and the sample at 1 mm. The instrumental parameters were as follows: 50 ms integration time and 20 scans for a total acquisition time of 1 s for each spectrum. The whole system was managed by the software AvaSoft 8 for Windows™.

2.2.6. Raman Spectroscopy

Raman spectroscopy was carried out with a Jobin Yvon LabRam Infinity spectrometer with a liquid nitrogen-cooled CCD detector and an Olympus microscope system. Raman spectra were recorded by focusing a 532 nm or 785 nm laser (with maximum powers of 2.4 and 4 mW at the sample, respectively) through 50× and 100× Olympus objectives with an acquisition time between 10 and 20 s for each spot collecting 5 to 20 accumulations. 1800 lines/mm and 950 lines/mm gratings were used, respectively, with the 532 nm and 785 nm lasers. Samples of a few grains were collected using a clean scalpel, placed onto a microscope slide and measured without any further treatment. The materials were identified by comparison with an in-house database.

2.2.7. Fourier Transform Infrared (FTIR) Spectroscopy

FTIR Spectroscopy was performed on a Nicolet 6700 spectrometer attached to a Continuum IR microscope equipped with MCT/A detectors. The sample was analysed in transmission mode, flattened in a diamond micro-compression cell. The cell was opened, and the flattened sample supported on one diamond window, a clean area of which was used for background spectra. The field of view was controlled by the sliding aperture which, when fully open, gives a maximum area of analysis of 100 × 100 μm. The spectra were acquired over a range of 4000–650 cm−1 using 32 scans at a resolution of 4 cm−1 and automatic gain. The materials were identified by comparison with in-built databases.

3. Results

3.1. Stage 1—Visual Examination and Microscopy

The primary support for the thangka painting is a flexible cellulose-based textile, likely cotton. The thin ground layer, applied to both sides of the cloth, is smooth and fine-grained and has been worked into the fabric by burnishing to provide an even surface for the paint layers. As is traditional for thangka painting, the flat areas of colour have been applied first. In some areas, colours have been mixed with white to produce various shades and in other areas there is evidence of washes of colour, probably using organic pigments, which applied either above or below flat areas of inorganic pigments to intensify colour. Blue or red outlines were then added, and finally, the golden details were applied. In the thangka painting tradition, the flat colours were painted by apprentices, and then the outlines and ornamental details were executed by the more experienced artists in the workshop [14]. The sequence of layers creates a striking image with variations in texture and gloss, depending on pigment particle size and the translucency of the paint layer afforded by different proportions of pigment and binder.
In some areas, pigments were ground, or mixed with white, to produce various shades. For flat areas of blue pigment, grinding of the pigment to produce various particle sizes, and hence shades of colour, was observed. In areas where the blue is darkest, as on the right of Figure 3a, the pigment particles are large and angular. This has contributed to the fragility of the paint layer, which was unstable in most of these darker areas. As the particles are ground more finely, the intensity of colour is reduced (see the left side of Figure 3a); these lighter areas were found to be stable when assessed under magnification. In both cases, green particles can also be seen alongside the blue particles. Azurite mineral (Cu3(CO3)2(OH)2) is usually found in association with malachite (Cu2CO3(OH)2), and often with other copper-rich minerals (e.g., cuprite, tenorite, and chrysocolla) [46] (p. 39). Thus, the observation of mixed blue and green particles may suggest that a mineral source of azurite was used to paint these areas. In the sky and foreground, it can be inferred that the blue pigment was probably mixed with an extender to create tonal gradations. It is likely that the different shades of blue were blended using a wet shading technique [8] (p. 98).
In other areas there are indications for the use of organic pigments, applied either above or below flat areas of inorganic pigments to intensify the colour fields. This is particularly evident on the white lotus flowers to the middle left of the painting, where a translucent red (likely organic) pigment has been applied over the white flowers in fine brush strokes to model the lotus petals using a dry shading technique [8] (p. 98). It should be noted that on other lotus flowers, the same transparent red has been used to outline the petals.
Under magnification, evidence of a wash of transparent red colour, presumably added to intensify the hue, was observed over Saraha’s loin cloth. Some of the overlap from this colour wash onto the adjacent white areas can be seen in Figure 3b. Pale pink pigment layers under bright fields of colour were also detected, most notably in areas of blue pigment loss beneath the central figure’s blue mandorla decorated with gold radial lines (Figure 3c).
Observations under magnification also indicated that the flat areas of gold, which have a lustrous and shiny appearance, as seen on the dragon figure (Figure 3d), are likely to have been burnished. Evidence for this was found on the gold of the headdress of Saroruhavajra (bottom right), which has burnishing marks that overlap with the surrounding red pigment.
Information on the painting’s underdrawing visible through five large areas of paint loss on the left side of the painting (Figure 1) was also recorded. As the textile borders did not exhibit any corresponding water damage, the losses likely occurred when the painting was stored as a roll (prior to these borders being attached), with water seepage through the layers of the roll causing a repeated pattern of localised damage. It was observed that only black underdrawings were used, for both the figures and landscape elements. Tibetan ink traditionally used for underdrawings is reported to be made by mixing carbon in the form of soot with water and glue, then grinding and pressing the mixture into small pellets to be used in ink bottles [6].
On initial examination, the underdrawings appeared to have been applied directly to the cloth. However, under magnification, it was observed that the underdrawings had been made on top of the thin ground layer, as seen in small areas at the edges of the losses, where only the top layers of pigment were lost and the ground remained intact (Figure 3e). The most likely explanation is that the black underdrawings penetrated the thin ground layer onto the raised parts of the cloth below, when first applied, and remained on the cloth when the pigment layer and ground layer were lost through water damage. There was no obvious evidence that the black lines were a later addition. The underdrawing lines over the ground layer appeared slightly furrowed under magnification (e.g., Figure 3f), with accumulation of pigment at the edges, indicating that the underdrawings were probably applied with a fine brush rather than a woodblock. The slight variations in line thickness and intensity also point to the use of a brush.
Some small revisions in the underdrawings were noted in areas of loss; for instance, there is a double line on the aureola of Nagarjuna (top left) (Figure 4a). More noticeable is the change to the bottom border, where a horizontal line extends from the bottom left corner, indicating that the bottom border was amended to be about 1 cm higher. Two purposeful strikes have been added to the incorrect line in black (Figure 4b), to indicate clearly which border line should be followed.
Differences between the final painting and the underdrawings were also evident. For example, the position of the proper left eye of Virupa (top right) has been adjusted in the final image (Figure 4c). This stage of the examination also yielded the first evidence of a possible colour notation in an area of loss, in the form of two diverging lines located above the head of Nagarjuna (top left) (Figure 4a).

3.2. Stage 2a—Non-Invasive Analysis (Imaging)

3.2.1. Broadband Multispectral Imaging (MSI)

Table 2 summarises the main observations from the set of broadband MSI images (VIS, IRR, IRRFC and UVL) available (Figure 5). The interpretations given are based on comparisons with reference to known reflectance and luminescence phenomena; however, it should be cautioned that a wide variety of factors, including formation conditions and chemical alteration can influence this behaviour.
The high levels of absorption observed in the UVL image (Figure 5c), indicate that the palette is dominated by metal-containing pigments of mineral origin [34]. This is the case for the larger areas of blue, green, orange and red, evident in various tones throughout the painting. For the blues and greens, this is confirmed by the IRRFC image, where these areas appear shades of purple and teal, respectively (Figure 6b). The latter is particularly indicative of a copper-containing inorganic pigment, likely malachite [34]. The purple tones observed are consistent with a pigment with low transparency in the c. 750–1100 nm region of the infrared, as recorded in this image. Azurite would be consistent with this behaviour [47], also in keeping with the observations made under magnification and the selection expected for this production period (18th century) [15] (p. 196).
Different behaviour is noted for the blue and green pigments used to carry out the outlines of various areas of the composition. Their bright red appearance in the IRRFC image indicates that indigo, which is infrared transparent and thus appears red [34,38,39,47], has been used, either on its own or in mixtures with yellow, for this purpose. Although most prevalent in areas of foliage, the use of indigo is also observed in the outlines of some of the figures (Figure 6b).
The presence of mineral reds, such as cinnabar/vermillion (for the deeper red) and red lead/minium (for the more orange shade) are suggested from the observed absorbance of these areas under UV illumination (Figure 7b). However, areas of weak, deep red luminescence in the outlines of figures (see for example Saraha shown in Figure 7b) and in other areas, such as the lotus flowers and buds, supports previous observations that an organic red, such as Indian lac, was used to carry out these details. Areas showing similar luminescence behaviour are also observed in the lighter areas of the leopard skin that Saraha is sitting on and patchily in areas of his loincloth (Figure 7b), which is corroborated by the observation under magnification.
The use of yellow is sparse in this painting, but a few areas were observed, particularly on the head-covering worn by Butön Rinchendrup (top centre), some elements of his drapery and that of Virupa to his right, and the yellow pigment “swatch” on the uppermost border. Under UV irradiation, the yellow pigment in these areas was observed to emit weak yellow luminescence, suggesting a possible organic origin, and corroborated by the fact that the yellow in exposed areas has visibly faded with respect to the yellow brushstroke that was protected by the textile border.
A mixture of yellow and black may have been used to create some of the brown tones noted in areas such as the tree trunk on the left, the brown animal skins that Virupa (top right) and Saroruhavajra (bottom right) are sat on, and areas of Saroruhavajra’s hair. These areas were observed to be partially opaque in the IRR image, greyish-yellow in IRRFC and absorb strongly in the UVL images (Figure 5b–d), which is consistent with the presence of some carbon-based pigments present in the mixture.
Areas of white, grey and black showed characteristic behaviour in these images, with the white areas remaining white in the IRRFC (Figure 6b) and emitting slightly blue luminescence in the UVL image (Figure 7b). Areas of black/grey absorb in the UVL image (Figure 7b) and remain black/grey in the IRRFC (see for example figures’ facial hair in Figure 6b), consistent with carbon-based paints. It should be noted that the underdrawing lines also exhibit this behaviour, confirming this to have been carried out in carbon-based media.
Additionally, a variety of flesh tones are observed for the figures in the painting. Saraha and Padmavajra (bottom centre) have warm, pale, peach-coloured tones and appear pale yellow in IRRFC colour image (Figure 6b) with pale orange luminescence under UV illumination (Figure 7b). Virupa (top right), Saroruhavajra (bottom right) and Ḍombi Heruka (bottom left) appear much darker with light grey/brown flesh tones. Of note is that these display quite different characteristics under UV illumination, with Virupa and Ḍombi Heruka emitting weak luminescence, whereas Saroruhavajra absorbs UV and appears dark (Figure 5b). Finally, Nagarjuna (top left) and Butön Rinchendrup (top centre) appear to have very pale, almost white flesh tones. The two nāgas (serpent divinities and guardians of concealed teachings) approaching Saraha appear similarly pale, as well as the female attendant approaching Nagarjuna (top left), who is probably a dakini (a feminine embodiment of enlightened wisdom). All of these figures display pale blue luminescence under UVL image, similarly to the white areas (Figure 5b). It is highly likely that the luminescence of all the flesh tone areas, despite their various hues, is related to a large proportion of a luminescing white pigment in the various paint mixtures.
As is evident from the IRR image, several areas are infrared transparent and appear white (Figure 5b). In these areas, this infrared transparency of the paint layer permitted access to the underdrawing and further evidence of this was observed. Although this generally corresponds well with the final composition, there are a few instances where some revisions have taken place. Figure 8a,b show an example of such a revision of the folds of the garment over the proper left arm and leg of Padmavajra (bottom centre). Further instances include the pattern on the belt of Nagarjuna (top left) and differences in the lines demarking the chests of Saraha (Figure 8c,d) and Virupa (top right) (see Figure S1, Supplementary Materials). In some cases, there were additions to the underdrawings rather than amendments; for instance, lines have been added to the proper right leg of Padmavajra (bottom centre) and toes have been added to the proper right foot of Virupa (top right) (see Figure S1, Supplementary Materials).
Additionally, evidence of colour notations was also observed in these infrared transparent areas of the IRR image, upon enhancing the contrast, as shown in Figure 9. Two colour notations were observed under the red aureolas of Saraha and Saroruhavajra (bottom right) (Figure 9a,b), and two were noted on the stomach of Virupa (top right) and on the bright red part of the pot behind his right elbow (Figure 9c). Two further colour notations were observed beneath the red sash of Saraha (Figure 9d).
Notably, all these notations were observed in red or orange areas, which are infrared transparent. Unfortunately, the areas of green and blue paint, which dominate the composition, are opaque in the c. 750–1100 nm region of the infrared and thus appear dark in the IRR image (Figure 5 and Figure 8), precluding further information from these images on either underdrawing or colour notations beneath these areas.

3.2.2. Short Wave Infrared Reflectography (SWIR)

SWIR was employed to further investigate both underdrawings and possible colour notations that were either unclear or not accessible in the IRR image, as this technique is able to penetrate further into the infrared region (900–1700 nm). Figure 10 shows a SWIR image of the thangka painting. Areas that are infrared transparent in this region appear white, whereas those that are not appear darker with increasing opacity to infrared.
Several intentional adjustments to the composition were noticed; most prominently, the position of the proper left arm of Butön Rinchendrup (top centre) was changed from a raised arm to a lowered arm (Figure 11a). Other observations included visible underdrawings under the clouds behind Ḍombi Heruka (bottom left) and Padmavajra (bottom centre), and slight revisions to the shape and modelling of the clouds by tiger’s claws, as well as changes to the contouring of the proper left leg of Saroruhavajra (bottom right) (see Figure S2, Supplementary Materials). Interestingly, the design for the gold patterning of the mandorla behind Saraha also appears to have undergone some considerable revision, as shown by the two sets of lines observed in Figure 11b.
In addition, two possible notations were noted in the SWIR image only, in the mandorla behind Saraha (Figure 11b) and below the left hand of Nagarjuna (top left) (Figure 11c). The blue mandorla behind Saraha was the only blue or green area where revisions or colour notations were observed.

3.2.3. X-Radiography

Figure 12 shows an X-radiograph of the thangka painting, with brighter areas corresponding to regions of stronger X-ray attenuation. These brighter regions, including areas of red, orange, blue, green and gold paint, are associated with pigments containing heavy metals [48]. Regions appearing dark in the X-radiograph correspond to areas of paint loss, or where organic, carbon-based colours have been used. The result is a “map” of heavy metal-containing mineral pigments, as opposed to carbon-based or organic pigments.
The stupa painted in red on the reverse of the thangka is clearly visible in the X-radiograph and thus is likely painted in a red mineral pigment, such as vermillion/cinnabar or red ochre. By contrast, the script on the reverse is invisible by X-ray imaging, therefore corresponding to organic colour or pigments of low atomic number, likely indigo or carbon black.
No mantras or notations were visible underneath the figures, although their presence cannot be completely ruled out, since the X-radiograph will not provide strong image contrast in the cases of carbon-based pigments, or paints of comparable atomic composition to the overlying paint layer.
As X-ray attenuation is also affected by the thickness of the paint layer and the concentration of pigments present, the imaging also made evident certain features of the painting. For example, individual brushstrokes can be seen in the X-radiograph, particularly in green, red, and orange regions (Figure 13a,b). These brushstrokes indicate that a fluid layer of paint was applied with a relatively broad brush in these areas.
The gold-containing paint used throughout the thangka shows strong X-ray attenuation, suggesting that the gold is in a relatively high concentration in the binding medium. The gold colour of the script has reduced contrast against a brighter background in visible light, whereas X-radiography gives strong contrast due to the large difference in atomic numbers between the gold paint and the background layer (Figure 13c). Areas with a high concentration of gold are clearly visible and indicate where the artist’s brush was reloaded.
The red and orange regions generally show weaker X-ray attenuation than gold, green or blue areas, perhaps due to thin application of paint, and/or lower concentrations of pigments. The underdrawing is invisible under X-radiography, implying the use of carbon-based media, as reported above.
The white background region on the right side of the thangka appears dark under X-radiography, which would rule out the use of lead white, since this would be expected to give significant X-ray attenuation. Instead, a white pigment based on elements of lower atomic number, such as calcium or magnesium, is likely.
The reworking of the gold lines radiating from Saraha, as noted from the SWIR, can also be seen under X-radiography (Figure 13a). The lines initially trended towards a horizontal orientation with increased distance from the centre; the later reworked lines trend vertically. A similar reworking is seen to the left of Saraha, as well as the later addition of a white flower, added after the gold lines, but before the reworking was complete (Figure 13b). Interestingly, there are several occasions where flowers were painted on top of the flat colours at a later stage, for example, over the blue sky to the right of Butön Rinchendrup (top centre) and over the red aureola of Saraha.

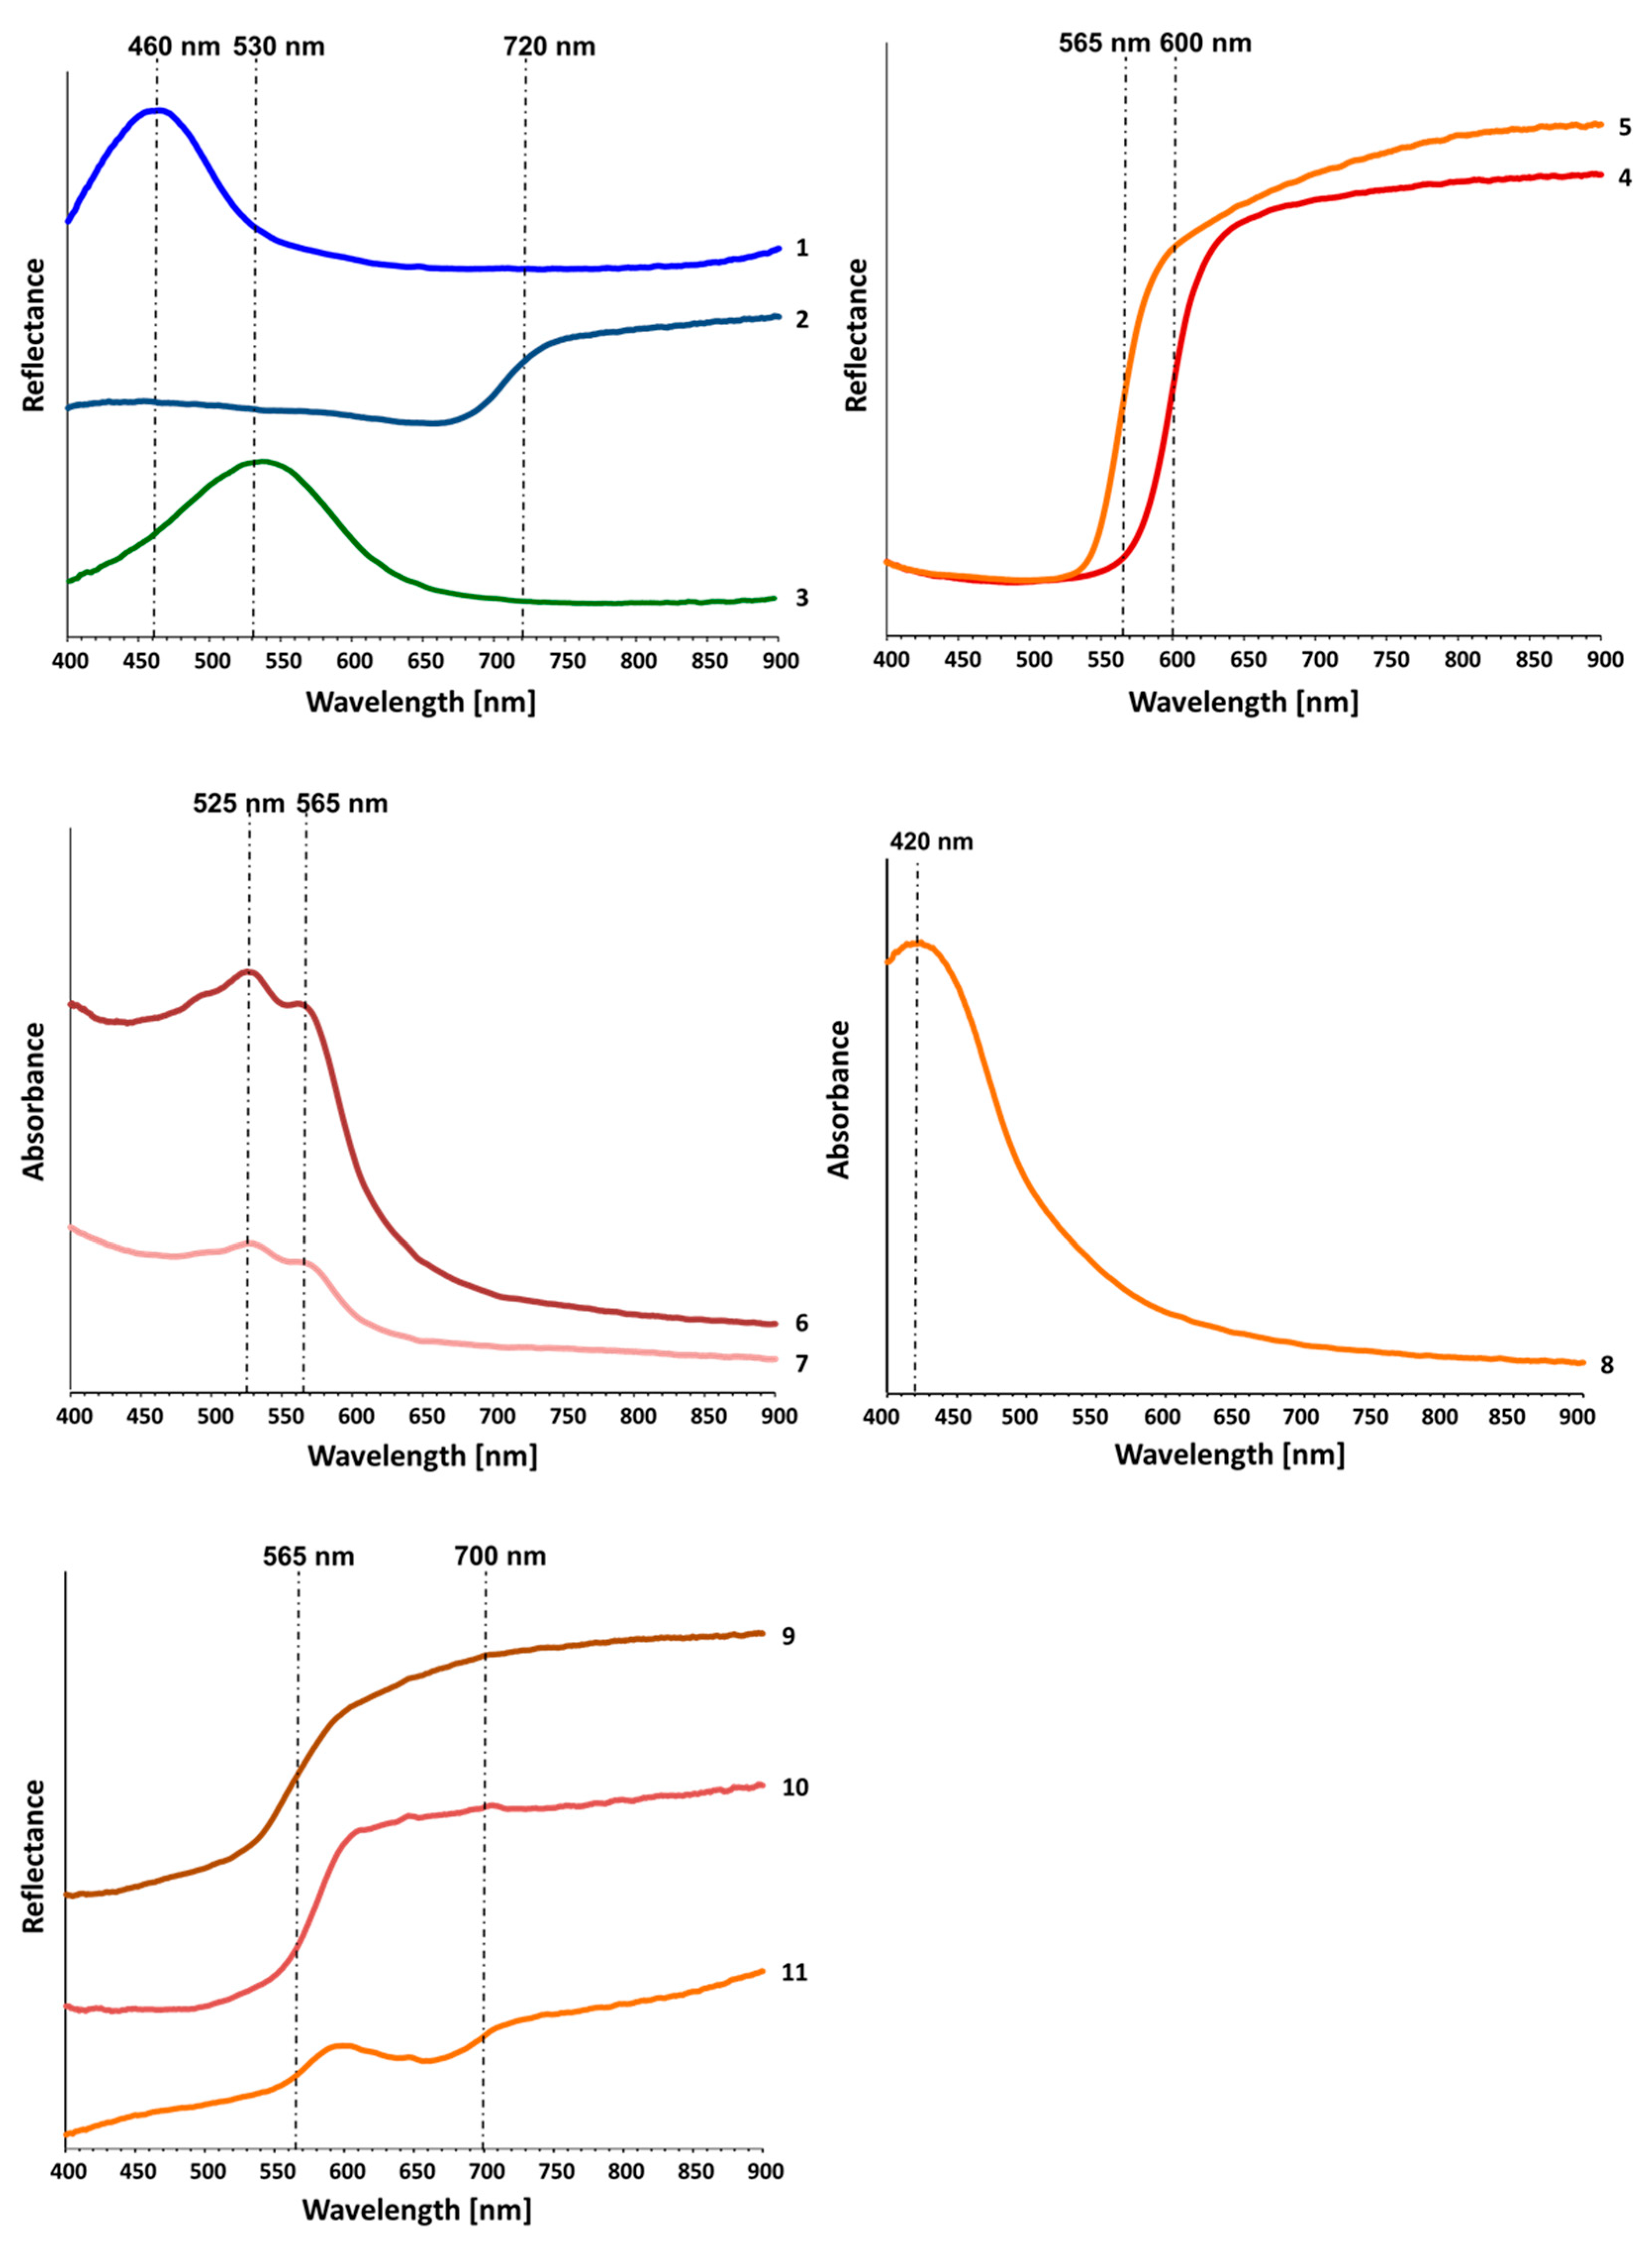
3.3. Stage 2b—Fibre Optic Reflectance Spectroscopy (FORS)

Reflectance spectra were acquired by FORS at several locations representative of all the areas of colour on the paintings, as shown in Figure S3 (Supplementary Materials). Of approximately fifty spectra acquired, the representative ones are shown in Figure 14 and the results are summarised in Table 2.
The reflectance spectral features observed from the FORS measurements for areas of blue paint showed a sharp band centred at ca. 460 nm, with very low reflectance in the near-infrared region (spectrum 1, Figure 14). This is consistent with the use of azurite in different shades [42].
The FORS spectra obtained from the other blue areas highlighted by the IRRFC image are likely to contain indigo; e.g., the outlines, hair and facial hair of the central figure and the object held by the figure on the top right, all showed an inflection point at 720 nm (spectrum 2, Figure 14), confirming that indigo was used in these areas [42].
The pigment(s) used for the various green shades were difficult to identify solely from FORS measurements. Nevertheless, the spectra showed a band centred at ca. 530 nm and low reflectance in the near-infrared region for most green/dark green areas (spectrum 3, Figure 14). This is reported to be consistent with a copper-containing inorganic pigment [42,49], as also indicated from the IRRFC image. The reflectance spectra showed good correspondence with reference spectra of malachite [42,49]. However, in lighter green areas, such as in the green cloud, a slight shift in reflectance towards higher wavelengths (ca. 560 nm) was observed (Table 2), likely due to mixtures of the green pigment with white in this and similar areas
Cinnabar/vermillion and red lead (minium) were identified in the deep red and bright orange areas, respectively. Their characteristic inflection points at 600 and 565 nm were observed in their respective reflectance spectra (spectra 4 and 5 in Figure 14) [42,49]. These pigments were also used in various shades or over white to produce various hues.
The deeper shade of red, suggested to derive from an organic colourant from the UVL images, produced a reflectance spectrum with two characteristic absorption bands centred at ca. 525 and 565 nm (spectra 6 and 7 in Figure 14). This is typical of an insect-based red colourant [42]. Considering the geographical origin of the painting, Indian lac is the most probable source for this colour.
Yellow was used sparingly in this painting and its properties as a result of Stage 2a suggested the use of an organic yellow. This was confirmed by the reflectance spectral features observed from the FORS measurements for areas of yellow paint, such as the head-covering worn by Butön Rinchendrup (top centre), which showed a sharp band centred at ca. 420 nm, with very low reflectance in the near-infrared region (spectrum 8, Figure 14). Organic yellows are notoriously difficult to identify by FORS [38,39,42], so no further information could be derived from these data. It is likely that a similar yellow mixed with black was used to create the brown of the tree trunk to the left of the image; however, the FORS spectrum for this area was not recorded.
As discussed, several flesh tones were noted. FORS measurements for representative areas showed these to be very different. The spectra collected from areas of Saraha and Padmavajra (bottom centre), both a warm pale peach-coloured tone, showed characteristic inflection points at 565 nm (spectra 9 and 10 in Figure 14), indicating the use of minium [42,49]. The spectral shape and the characteristics of these areas in the MSI and X-ray images (Table 2), likely suggest that the pigment has been heavily admixed with white to create this pale peach colour.
The FORS spectrum recorded in the area of the darker figure at the bottom right with light grey/brown flesh tones, although low in intensity perhaps due to mixtures with carbon-based black pigments, shows spectral features associated with iron oxide-containing pigments, with an inflection point in the 575–590 nm range, a characteristic positive slope in the region above 600 nm leading to an inflection point around 700 nm and an absorption band due to ligand field transition, centred around 850–900 nm (spectrum 11, Figure 14) [42]. These features are common to a number of iron oxide-containing pigments, including those obtained by roasting goethite-containing earths, such as burnt sienna and burnt umber. Thus it is impossible to discriminate among the different iron oxide-containing pigments only on the basis of their FORS spectra, but the presence of iron-based pigments is consistent with the UV-absorbing behaviour of this area (Figure 5b).
The FORS technique was not able to provide further information about the white, grey or black areas, due to the absence of characteristic spectral features. In addition, some questions remained on the nature of the yellow and red organic colourants. Unfortunately, the fragility and dilute application of these paint layers did not allow samples to be taken for further investigation. If available, further elemental analyses would also have been beneficial in order to confirm the assignments made at this stage. However, by considering the information gathered in stages 1 and 2 (Table 2) to plan a strategic sampling campaign, it was possible to address a number of outstanding questions in areas where sampling was possible.

3.4. Stage 3—Invasive Analysis

The very low number of samples taken for invasive analysis were investigated using the complimentary vibrational spectroscopy techniques of Fourier transform infrared (FTIR) and Raman spectroscopy (Stage 3). These included samples from areas of white pigment (S1), ground (S2), blue (S3) and green areas (S4). The locations of these samples and associated spectra are shown in Figures S3–S5, respectively (Supplementary Materials). It should be noted that investigation of the stratigraphy was not possible from these samples, as the paint layers they were taken from are thin and under-bound, making the setting and polishing of cross-sections extremely challenging.
FTIR spectra of samples S1 and S2 showed bands consistent with the magnesium carbonate mineral magnesite (MgCO3) (Table 2), revealing that this was used as both a white pigment and a ground layer in this composition.
Both FTIR and Raman spectra of sample S3 (Table 2) confirmed that azurite (Cu3(CO3)2(OH)2) was used in the main areas of blue. The FTIR spectrum also showed that the clay mineral, kaolinite (Al2Si2O5(OH)4) was present (Table 2), indicating that, not only was the pigment ground to produce various particle sizes and hence shades of colour, but it was also mixed with kaolinite to create different shades. A proteinaceous medium, probably animal glue was also detected from the FTIR spectrum, as the amide I and amide II bands at 1647 and 1541 cm−1 are clearly visible. Binders derived from yak-hide have been suggested as being used in thangka paintings [7], but these analyses do not allow any more details as to the source of this.
Similarly, both FTIR and Raman spectra of sample S4 (Table 2) confirmed that malachite (Cu2CO3(OH)2), was used for the green areas, which were also bound with a proteinaceous medium. The FTIR spectrum additionally confirmed the presence of antlerite and a proteinaceous binder, the latter evidenced by a shoulder due to the amide I stretch at ca. 1645 cm−1, whereas the Raman spectrum also revealed the presence of brochantite. Both antlerite and brochantite are copper sulphate hydroxide minerals with formulas Cu3(SO4)(OH)4 and Cu4SO4(OH)6, respectively, known to be associated with malachite as either secondary minerals or weathering/degradation products [46] (p. 39). Although the good state of preservation of the pigments, as reported above, would suggest the former, further investigations of the particle morphology, which was not possible during this investigation, would be required to clarify whether these are crushed natural particles or alteration products.

4. Discussion

Technical and multi-analytical investigation of the painting materials and techniques in this 18th century Tibetan thangka has provided strong evidence that the palette used is in accordance with traditional thangka painting practices of the 17–18th centuries, and the findings are largely in keeping with the results of previous studies [14,15,16,19,20,28,33]. However, several observations about practices and materials may indicate provenance or other details of scholarly importance. These are highlighted in the hope that they may be helpful by comparison to existing and future studies of other pieces.
Several intentional revisions of the underdrawing were observed, including the repositioning of the arm of Butön Rinchendrup (top centre) (Figure 11a) and the use of a double line to indicate an incorrect underdrawing (Figure 4b), which has also been observed on an 18th-century thangka in the Tucci collection [28] (p. 90). These revisions differ from the slight adjustments, which are a result of the artists’ needs to use memory and intuition when painting the final outlines after the underdrawings have been obscured by the thickly applied opaque colours [15] (p. 196). These intentional revisions in the drawing phase represent a departure from the strict iconographical rules [13] that usually govern the composition process. Additionally, although similar instances of such intentional revisions have previously been observed on other thangkas [28] (pp. 67, 72, 89), they are infrequent and may be unique markers of specific workshop practices.
Several possible colour notations (locations given in Figure 9 and Figure 11) were revealed, and these, like the inscriptions, are written in the Tibetan umê script. This indicates that the painting may have been produced in central Tibet, as evidence from a previous study suggests that thangkas produced in Eastern Tibet, bordering China, tend to have Chinese notations [20] (p. 1755). However, it is also possible that it was made in Eastern Tibet by painters who migrated there but continued to use the umê script. Nevertheless, the painting style fits that of Central Tibet and the mount was also found to be in keeping with Central Tibetan traditions [45].
In terms of painting technique, the use of organic red glazes over red pigments for the modelling of drapery is not unusual and has been previously observed in other investigations [4,16,18]. However, the use of a transparent red below other pigments, as found on Saraha’s mandorla (Figure 3c), is less commonly observed [21,28]. The closest example is an 18th century thangka from South-West Tibet, on which two different colour notations, the letter tha (mthing/blue) and the syllable ngo (sngon/blue) were found in areas where the blue paint layer was completely lost, and a pinkish-purple colour was revealed below [28] (p. 130). The use of an insect-based organic red (likely Indian lac) under azurite observed in this study thus adds to the evidence that this technique may have been used more widely than has been documented thus far.
To the best of our knowledge, the use of two different techniques (mixing with white and grinding) to create different shades of blue on a single thangka painting has not been documented elsewhere. In other studies, adding white to azurite to produce lighter shades has been observed on Tibetan thangkas, along with notations denoting the mixing of colours [16]. The grinding of pigments to produce lighter shades has been observed on thangkas with colour notations written in Chinese characters [20], as well as on 18th-century Eastern Tibetan thangkas with notations in the umê script [28] (p. 146). With further study, it may be possible to understand if the use of both techniques in the same painting is widespread or has particular significance.
The use of magnesite in the ground and as a white pigment has seldom been reported in thangka painting [16,19]. However, as few scientific analyses have been carried out to date, it may be that more examples will be found as further studies on these paintings are carried out in the future, leading to a better understanding of how the use of certain whites may be indicative of region or period of production.
Thangka artists did not tend to sign or date their work, so the results of this study and any future work can be added to scientific information gathered internationally to help scholars determine more precise dates and locations for particular thangkas.

5. Conclusions

The three-stage methodology proposed has successfully enabled a layer-by-layer investigation of the different stages of production of this painting from ground preparation, underdrawing and colour notations to palette and painting techniques.
In particular, the IRR and SWIR images were useful to understand the under-drawing, and instances of modifications as well as colour notations. The UVL, IRRFC and X-ray images provided important preliminary information on the colourants present, including the nature of the underdrawing, and the painting technique used. This imaging stage helped to better understand and extend what had been observed visually and under magnification and laid the foundations for further investigations. FORS, FTIR and Raman spectroscopies were able to confirm key information, such as the identity of many of the pigments (cinnabar/vermillion, minium, iron oxide, malachite, azurite, indigo, Indian lac), the proteinaceous nature of the binder used for the blue and green paint layers, and the identification of magnesite together with kaolinite, as the white pigment used to produce the various shades of the latter throughout the composition as well as in the ground. Unfortunately, further characterizations, particularly of the organics and the materials used in past conservation interventions were not permitted due to sampling limitations. Moreover, additional techniques, such as near infrared FORS, portable Raman and in situ X-ray powder diffraction (XRD) and X-ray fluorescence, could have supplemented the non-invasive characterisation of these materials. However, these were unavailable during these studies.
A major challenge to the methodology, and in particular to the imaging methods, was the extensive use in this work of the blue and green copper carbonate-based pigments, azurite and malachite. The opacity of these pigments in the infrared severely hindered access to possible underdrawings and/or colour notations, especially in dark blue and green areas. It has been shown that the spectral transparency of both these pigments is highly attenuated by both pigment mass concentration and particle size [50]. A further limitation of the mostly non-invasive approach was the lack of information at the molecular level that may have enabled the identification of both the origin of the binder and the organic colourants used.
Despite these challenges, valuable information was obtained from the study of this thangka painting, which uses a combination of early traditional techniques, for example, the application of lac as a glaze, alongside later techniques that were used to expand the palette, such as mixing with white to produce a variety of tints of green and blue for the landscape.
Future advancements in non-invasive techniques, and an increasing number of scientific analyses carried out on thangkas, combining evidence gathered from technical examination alongside stylistic interpretation, will expand our understanding of how thangka painting techniques developed. This will allow broader conclusions to be drawn on the use of painting materials and techniques, their influence on style and how these correspond to the location and period in which these sacred objects were made, without the need to sample them.

Supplementary Materials

The following supporting information can be downloaded at: https://www.mdpi.com/article/10.3390/heritage5040148/s1. Figure S1: Details from VIS (top) and IRR (bottom; enhanced contract) images. © Trustees of the British Museum; Figure S2: Details from SWIR image showing revisions of the underdrawing in the final composition. © Trustees of the British Museum; Figure S3: Location of selected FORS measurements (white) and samples taken for FTIR/Raman spectroscopy (black). © Trustees of the British Museum; Figure S4: Raman spectrum (red) of a sample of blue pigment (S3) taken from the location indicated in Figure S3 and a reference spectrum of azurite (blue). © Trustees of the British Museum; Figure S5: FTIR spectra of samples of (a) white pigment (S2); (b) blue pigment (S3) and (c) green pigment (S4) taken from the locations indicated in Figure S3. © Trustees of the British Museum.

Author Contributions

Conceptualization, J.D., A.D. and T.H.; methodology, J.D.; formal analysis, J.D., A.D. and D.O.; investigation, J.D., A.D. and D.O.; data curation, J.D., A.D. and D.O.; writing—original draft preparation, J.D. and A.D.; writing—review and editing, J.D., A.D., D.O., D.T., T.H. and I.R.; visualization, J.D. All authors have read and agreed to the published version of the manuscript.

Funding

This research received no external funding.

Data Availability Statement

The data presented in this study are available on request from the corresponding author.

Acknowledgments

The authors wish to thank Anne Bancroft (previously, Senior Book & Paper Conservator, Victoria and Albert Museum) for contributing to the initial visual examination, Jacki Elgar (Pamela and Peter Voss Head of Asian Conservation, Museum of Fine Arts, Boston) for sharing her expertise on underdrawings and colour notations, Catherine Wilkinson from Opus Instruments for the use of the SWIR images acquired during the demo of their Apollo camera, Kevin Lovelock (Photography & Imaging, Collection Care Department, British Museum) for kindly acquiring the broadband multispectral images, Christian Luczanits (David L. Snellgrove Senior Lecturer in Tibetan and Buddhist Art, SOAS, University of London) for examining the series of Mahasiddha thangkas and transliterating the accompanying inscriptions, which identify the figures pictured, Caroline Barry and Joanna Kosek (Joint Heads of Pictorial Art Conservation, Collection Care Department, British Museum) and Monique Pullen (Senior Conservator: Textiles and fibres, Collection Care Department, British Museum) for their support in the development of this research. The results of this investigation were shared with members of the global Tibetan community at a British Museum Tibetan Collections workshop held online in January 2022 (co-organised by Thupten Kelsang, as part of his research towards a DPhil degree from Oxford University, in collaboration with Imma Ramos, curator of South Asia collections at the British Museum) and consultation with this group will continue for future studies of thangkas at the British Museum.

Conflicts of Interest

The authors declare no conflict of interest.

References

  1. Shaftel, A. Conservation Treatment of Tibetan Thangkas. J. Am. Inst. Conserv. 1991, 30, 3–11. [Google Scholar] [CrossRef]
  2. Sankrityayana, R. Technique in Tibetan paintings. Asia Mag. 1937, 16, 30–33. [Google Scholar]
  3. Tucci, G. Tibetan Painted Scroll; Libreria dello Stato: Roma, Italy, 1949. [Google Scholar]
  4. Bruce-Gardner, R. Himalayan scroll paintings: Conservation parameters. Conservator 1988, 12, 3–14. [Google Scholar] [CrossRef]
  5. Klimburg-Salter, D.E.; Orientale, M.N.D.A. Discovering Tibet: The Tucci Expeditions and Tibetan Paintings; Skira: Milan, Italy, 2015. [Google Scholar]
  6. Huntington, J.C. The iconography and structure of the mountings of Tibetan paintings. Stud. Conserv. 1970, 15, 190–205. [Google Scholar]
  7. Huntington, J.C. The technique of Tibetan paintings. Stud. Conserv. 1970, 15, 122–123. [Google Scholar]
  8. Jackson, D.P.; Jackson, J.A. Tibetan Thangka Painting: Methods & Materials; Serindia Publications: London, UK, 1984. [Google Scholar]
  9. Jackson, D.P. A History of Tibetan Painting: The Great Tibetan Painters and Their Traditions; Austrian Academy of Sciences Press: Vienna, Austria, 1996. [Google Scholar]
  10. Jackson, D.P. Patron and Painter: Situ Panchen and the Revival of the Encampment Style; Rubin Museum of Art: New York, NY, USA, 2009; Volume 1. [Google Scholar]
  11. Jackson, D.P.; Linrothe, R.N.; Luczanits, C. The Place of Provenance: Regional Styles in Tibetan Painting; Rubin Museum of Art: New York, NY, USA, 2012. [Google Scholar]
  12. Shaftel, A. Notes on the Technique of Tibetan Thangkas. J. Am. Inst. Conserv. 1986, 25, 97–103. [Google Scholar] [CrossRef]
  13. Cotte, S. Conservation of Thangkas-A Review of the Literature Since the 1970s. Stud. Conserv. 2011, 56, 81–93. [Google Scholar] [CrossRef]
  14. Mehra, V.R. Note On The Technique And Conservation Of Some Thang-Ka Paintings. Stud. Conserv. 1970, 15, 206–214. [Google Scholar]
  15. Bruce-Gardner, R. Realizations: Reflections on Technique in Early Central Tibetan Painting. In Sacred Visions: Early Paintings from Central Tibet; Kossak, S., Singer, J.C., Eds.; Metropolitan Museum of Art: New York, NY, USA, 1998. [Google Scholar]
  16. Duffy, K.I.; Elgar, J.A. An investigation of palette and color notations used to create a set of Tibetan thangkas. In Proceedings of the Historical Painting Techniques, Materials, and Studio Practice: Preprints of a Symposium, Leiden, The Netherlands, 26–29 June 1995. [Google Scholar]
  17. Elgar, J. Tibetan thang kas: An overview. Pap. Conserv. 2006, 30, 99–114. [Google Scholar] [CrossRef]
  18. Leona, M.; Jain, S. Crossing the line: The interplay between scientific examination and conservation approaches in the treatment of a fifteenth century Nepali thangka. In Scientific Research on the Pictorial Arts of Asia: Proceedings of the Second Forbes Symposium at the Freer Gallery of Art; Jett, P., McCarthy, B.E., Winter, J.F., Eds.; Archetype: London, UK, 2005. [Google Scholar]
  19. Mass, J.; Huang, J.; Fiske, B.; Shaftel, A.; Zhang, X.; Laursen, R.; Shimoda, C.; Matsen, C.; Bisulca, C. Thangka Production in the 18th 21st Centuries: Documenting the Introduction of Non-Traditional Materials into Himalayan Painting Practice. In Proceedings of the Forum on the Conservation of Thangkas: Special Session of the ICOM-CC 15th Triennial Conference, New Delhi, India, 26 September 2008. [Google Scholar]
  20. Duffy, K.; Elgar, J. Examination of thangkas from Central and Eastern Tibet. In Art’99—6th International Conference on “Non Destructive Investigations and Microanalysis for the Diagnostics and Conservation of the Cultural and Environmental Heritage; ICCROM: Rome, Italy, 1999. [Google Scholar]
  21. Duffy, K.; Elgar, J. Five protective goddesses (Pancaraksha): A study of color notations and pigments. In Scientific Research in the Field of Asian Art: Proceedings of the First Forbes Symposium at the Freer Gallery of Art; Jett, P., Douglas, J.G., McCarthy, B.E., Winter, J.F., Eds.; Archetype: London, UK; Washington, DC, USA, 2003; pp. 164–169. [Google Scholar]
  22. Breeze, C.; Smith, K. Crossing The Boundaries between Conservation Disciplines in the Treatment of Asian Thangkas. In Proceedings of the American Institute for Conservation of Historic & Artistic Works: 40th Annual Meeting, Albuquerque, NM, USA, 8–11 May 2012. [Google Scholar]
  23. Fang, X.; Zhang, R.; Shi, N.; Song, J. Conservation of the modern thangka, Caturbhuji-Avalokiteshvara. Stud. Conserv. 2016, 61 (Suppl. S2), 289–290. [Google Scholar] [CrossRef]
  24. Song, J.; Fang, X. Conservation of thangkas in the Palace Museum, Beijing, China. Stud. Conserv. 2014, 59 (Suppl. S1), S134–S136. [Google Scholar] [CrossRef]
  25. Migdail, D. In Consideration of the Thangka. In Proceedings of the Textile Specialty Group Postprints: American Institute for Conservation of Historic & Artistic Works, 42nd Annual Meeting, San Francisco, CA, USA, 28–31 May 2014. [Google Scholar]
  26. Cotte, S. Reflections Around the Conservation of Sacred Thangkas. J. Conserv. Mus. Stud. 2013, 11, Art. 3. [Google Scholar] [CrossRef]
  27. Ernst, R.R. In situ Raman microscopy applied to large Central Asian paintings. J. Raman Spectrosc. 2010, 41, 275–284. [Google Scholar] [CrossRef]
  28. Tabasso, M.; Polichetti, M.A.; Seccaroni, C. Visibilia Invisibilium: Non-Invasive Analyses on Tibetan Paintings from the Tucci Expeditions; Museo Nazionale d’Arte Orientale “Giuseppe Tucci” ENA: Rome, Italy, 2011. [Google Scholar]
  29. Li, Z.; Wang, L.; Ma, Q.; Mei, J. A scientific study of the pigments in the wall paintings at Jokhang Monastery in Lhasa, Tibet, China. Herit. Sci. 2014, 2, 21. [Google Scholar] [CrossRef] [Green Version]
  30. Simonsen, K.P.; Bøllingtoft, P.; Sanyova, J.; Wangdu, P.; Scharff, M.; Rasmussen, A.R. Tibetan Wall Painting: Investigation Of Materials And Techniques and Dna Analysis Of Proteinaceous Binding Medium. Int. J. Conserv. Sci. 2015, 6, 323–334. [Google Scholar]
  31. Almogi, O.; Kindzorra, E.; Hahn, O.; Rabin, I. Inks, pigments, paper: In quest of unveiling the history of the production of a tibetan buddhist manuscript collection from the tibetan-nepalese borderlands. J. Int. Assoc. Buddh. Stud. 2015, 37, 93–118. [Google Scholar]
  32. Ricciardi, P.; Pallipurath, A. The Five Colours of Art: Non-invasive Analysis of Pigments in Tibetan Prints and Manuscripts. In Tibetan Printing: Comparison, Continuities, and Change; Brill: Leiden, The Netherlands, 2016; pp. 485–500. [Google Scholar]
  33. Brocchieri, J.; de Viguerie, L.; Sabbarese, C.; Boyer, M. Combination of noninvasive imaging techniques to characterize pigments in Buddhist thangka paintings. X-ray Spectrom. 2020, 50, 320–331. [Google Scholar] [CrossRef]
  34. Dyer, J.; Newman, N. Multispectral imaging techniques applied to the study of Graeco-Roman funerary portraits from Egypt at The British Museum. In APPEAR Proceedings; Cartwright, C.R., Svoboda, M., Eds.; Getty Publications: Los Angeles, CA, USA, 2020. [Google Scholar]
  35. Dyer, J.; Sotiropoulou, S. A technical step forward in the integration of visible-induced luminescence imaging methods for the study of ancient polychromy. Herit. Sci. 2017, 5, 24. [Google Scholar] [CrossRef]
  36. Dyer, J.; Verri, G.; Cupitt, J. Multispectral Imaging in Reflectance and Photo-Induced Luminescence Modes: A User Manual. 2013. Available online: https://courtauld.pure.elsevier.com/en/publications/multispectral-imaging-in-reflectance-and-photo-induced-luminescen (accessed on 23 June 2022).
  37. Dyer, J.; O’Connell, E.R.; Simpson, A. Polychromy in Roman Egypt: A study of a limestone sculpture of the Egyptian god Horus. Br. Mus. Tech. Res. Bull. 2014, 8, 93–103. [Google Scholar]
  38. Dyer, J.; Tamburini, D.; O’Connell, E.R.; Harrison, A. A multispectral imaging approach integrated into the study of Late Antique textiles from Egypt. PLoS ONE 2018, 13, e0204699. [Google Scholar] [CrossRef]
  39. Tamburini, D.; Dyer, J. Fibre optic reflectance spectroscopy and multispectral imaging for the non-invasive investigation of Asian colourants in Chinese textiles from Dunhuang (7th–10th century AD). Dye. Pigment. 2019, 162, 494–511. [Google Scholar] [CrossRef]
  40. Tamburini, D.; Dyer, J.; Vandenbeusch, M.; Borla, M.; Angelici, D.; Aceto, M.; Oliva, C.; Facchetti, F.; Aicardi, S.; Davit, P.; et al. A multi-scalar investigation of the colouring materials used in textile wrappings of Egyptian votive animal mummies. Herit. Sci. 2021, 9, 106. [Google Scholar] [CrossRef]
  41. Romano, C.; Dyer, J.; Shibayama, N. Reading polychrome laces: Multispectral imaging techniques on historic textiles from the collections of The Metropolitan Museum of Art. Dye. Hist. Archaeol. 2021, 33–34, 128–137. [Google Scholar]
  42. Aceto, M.; Agostino, A.; Fenoglio, G.; Idone, A.; Gulmini, M.; Picollo, M.; Ricciardi, P.; Delaney, J.K. Characterisation of colourants on illuminated manuscripts by portable fibre optic UV-visible-NIR reflectance spectrophotometry. Anal. Methods 2014, 6, 1488–1500. [Google Scholar] [CrossRef]
  43. Tamburini, D.; Dyer, J.; Davit, P.; Aceto, M.; Turina, V.; Borla, M.; Vandenbeusch, M.; Gulmini, M. Compositional and Micro-Morphological Characterisation of Red Colourants in Archaeological Textiles from Pharaonic Egypt. Molecules 2019, 24, 3761. [Google Scholar] [CrossRef]
  44. Ramos, I. Tantra: Enlightenment to Revolution; Thames and Hudson: London, UK, 2020. [Google Scholar]
  45. Tamburini, D.; Dyer, J.; Heady, T.; Derham, A.; Kim-Marandet, M.; Pullan, M.; Luk, Y.-P.; Ramos, I. Bordering on Asian Paintings: Dye Analysis of Textile Borders and Mount Elements to Complement Research on Asian Pictorial Art. Heritage 2021, 4, 4344–4365. [Google Scholar] [CrossRef]
  46. Eastaugh, N.; Walsh, V.; Chaplin, T.; Siddall, R. Pigment Compendium; Taylor & Francis: London, UK, 2008. [Google Scholar]
  47. Aldrovandi, A.; Buzzegoli, E.; Keller, A.; Kunzelman, D. Investigation of painted surfaces with a reflected UV false colour technique. In Proceedings of the Art’05—8th International Conference on Non Destructive Investigations and Microanalysis for the Diagnostics and Conservation of the Cultural and Environmental Heritage, Lecce, Italy, 15–19 May 2005. [Google Scholar]
  48. Dik, J.; Janssens, K.; Van Der Snick, G.; van der Loeff, L.; Rickers, K.; Cotte, M. Visualization of a Lost Painting by Vincent van Gogh Using Synchrotron Radiation Based X-ray Fluorescence Elemental Mapping. Anal. Chem. 2008, 80, 6436–6442. [Google Scholar] [CrossRef]
  49. Cosentino, A. FORS spectral database of historical pigments in different binders. E Conserv. J. 2014, 2, 54–65. [Google Scholar] [CrossRef]
  50. Liang, H.; Lange, R.; Peric, B.; Spring, M. Optimum spectral window for imaging of art with optical coherence tomography. Appl. Phys. B 2013, 111, 589–602. [Google Scholar] [CrossRef] [Green Version]
Figure 1. Front (left) of a Tibetan thangka (British Museum Registration No. 1956,0714,0.40) depicting Mahasiddha Saraha in the centre surrounded by five other Mahasiddhas; Nagarjuna (top left), Virupa (top right), Ḍombi Heruka (bottom left), Padmavajra (bottom centre) and Saroruhavajra (bottom right), and Butön Rinchendrup (1290–1364), the 11th Abbot of Shalu Monastery and a Sakya master (top centre). Reverse (right) with stupa outline, script and handprints (painting height: 83 cm; width: 59 cm; height (with mount): 185 cm; width (with mount): 107.5 cm; 18th century). © Trustees of the British Museum.
Heritage 05 00148 g001
Figure 2. Methodology applied for the examination of the thangka.
Heritage 05 00148 g002
Figure 3. Detailed images of the painting showing; (a) finely and coarsely ground blue pigment; (b) organic red over orange on loin cloth; (c) organic red under blue; (d) burnished gold on dragon with dots of viscous blue paint and (e,f) underdrawing visible in loss areas. © Trustees of the British Museum.
Heritage 05 00148 g003
Figure 4. Detailed images of the painting showing; (a) a revision to the aureola of Nagarjuna (top left) shown by a double line and a possible colour notation; (b) an amendment to the bottom border, indicated by two purposeful strikes; and (c) an adjustment to the position of the proper left eye of Virupa (top right). © Trustees of the British Museum.
Heritage 05 00148 g004
Figure 5. (a) Visible (VIS); (b) Infrared-reflected (IRR); (c) UV-induced visible luminescence (UVL) and (d) Infrared-reflected (IRRFC) images of the thangka (British Museum Registration No. 1956,0714,0.40). © Trustees of the British Museum.
Heritage 05 00148 g005
Figure 6. Detail from (a) VIS and (b) IRRFC images. The blues and greens appear as shades of purple and teal, respectively, in the IRRFC image, whereas details and outlines picked out in indigo appear bright red. © Trustees of the British Museum.
Heritage 05 00148 g006
Figure 7. Detail from (a) VIS and (b) UVL images. Areas of luminescence are observed in the white areas. Weak deep red luminescence is noted in other areas, such as lotus flowers and buds. © Trustees of the British Museum.
Heritage 05 00148 g007
Figure 8. Details from VIS (a,c) and IRR (b,d) images. The areas marked in red show examples of revisions of the underdrawing in the final composition, where (a,b) the folds of the garment over the proper left arm and leg of Padmavajra (bottom centre) have been amended and (c,d) the lines demarking the chest of Saraha have been altered. © Trustees of the British Museum.
Heritage 05 00148 g008
Figure 9. Enhanced contrast details of the IRR image showing colour notations at; (a) the red aureola of Saroruhavajra (bottom right); (b) the aureola of Saraha; (c) on the stomach and pot behind Virupa (top right) and (d) the red sash of Saraha. © Trustees of the British Museum.
Heritage 05 00148 g009
Figure 10. SWIR image of the thangka (British Museum Registration No. 1956,0714,0.40). © Trustees of the British Museum.
Heritage 05 00148 g010
Figure 11. Enhanced contrast details from SWIR image showing revisions of the underdrawing in the final composition at (a) the proper left arm of Butön Rinchendrup (top centre); (b) the design for the gold patterning of the mandorla behind Saraha. In addition, two possible colour notations were noted in (b) the mandorla behind Saraha and (c) below the left hand of Nagarjuna (top left). © Trustees of the British Museum.
Heritage 05 00148 g011
Figure 12. X-radiograph of thangka (British Museum Registration No. 1956,0714,0.40). Note the visibility of the stupa painted on the reverse of the thangka. © Trustees of the British Museum.
Heritage 05 00148 g012
Figure 13. Details from X-radiograph showing; (a) Saraha. Reworking of the radial gold lines can be seen to the right of the figure and individual brushstrokes in Saraha’s red aureola (b) centre-left of the thangka. Reworking of the radial gold lines can be seen to the left of the figure. The red rectangle highlights a flower which was added to the painting just before the radial lines were reworked and (c) lower-right region of the thangka. The X-radiograph shows improved contrast of the script to the left. © Trustees of the British Museum.
Heritage 05 00148 g013
Figure 14. Representative FORS spectra of (1) blue areas containing azurite, (2) blue areas containing indigo; (3) green areas containing malachite; (4) bright red areas containing cinnabar/vermillion; (5) bright orange areas containing minium/red lead; (6,7) deep red areas containing an organic insect-based colourant (likely Indian lac); (8) yellow areas containing an organic yellow colourant; (9,10) flesh tones areas (pale peach colour) containing minium/red lead mixed with a white pigment; (11). grey/brown flesh tones containing iron oxide pigments. Locations shown in Figure S3 (Supplementary Materials).
Heritage 05 00148 g014
Table 1. Summary of the combination of radiation sources and filter(s) used for each of the broadband MSI techniques considered.
MSI Technique Radiation SourcesFilter(s) in Front of CameraRange Investigated
Visible-reflected imaging (VIS)Elinchrom 6000 Micro AS powerpack with A3000N flash heads, each equipped with Rotalux softboxes (diffuser)No filterca. 380–700 nm
Ultraviolet-induced visible luminescence imaging (UVL)Wood’s radiation sources (365 nm) filtered with a Schott DUG11 interference bandpass filter (280–400 nm)Schott KV418 cut-on filter (50% transmission at c. 418 nm) ca. 420–700 nm
Infrared-reflected imaging (IRR)Elinchrom 6000 Micro AS powerpack with A3000N flash heads, each equipped with Rotalux softboxes (diffuser)Kodak Wratten No. 87 filter (50% transmittance at c. 800 nm)ca. 750–1100 nm
Table 2. Summary of the main observations and interpretations made during the various stages of investigation, as outlined in Figure 2.
Broadband MSISWIRX-rayConclusion at Stage 2aConclusion at Stage 2b (FORS)Conclusion at Stage 3 (FTIR and Raman)
VISIRRIRRFCUVL
RedTransparentDark yellowDark (Absorbing)TransparentBrightMineral red, likely cinnabar/vermillionInflection point at 600 nm; Cinnabar/vermillion-
PinkTransparentDark yellowWeak, deep red luminescenceTransparentDarkOrganic redAbsorption bands at ca. 525 and 565 nm; insect-based red colourant, possibly Indian lac-
OrangeTransparentYellowDark (Absorbing)TransparentBrightMineral red, likely minium/red leadInflection point at 565 nm; minium/red lead -
YellowTransparentPale yellowYellow luminescenceTransparentDarkOrganic yellow Band at ca. 420 nm, with low reflectance in the near-infrared region; Organic yellow-
GreenOpaqueTealDark (Absorbing)OpaqueBrightMineral green, likely malachiteBand at ca. 530 nm, with very low reflectance in the near-infrared region; malachite
Slight shift in reflectance towards higher wavelengths (ca. 560 nm) in lighter green areas
FTIR bands at 3407, 3335, 1503, 1393, 1098, 1047, 882, 819 and 751 cm−1; malachite and 3583, 3575, 3489, 1157 and 989 cm−1; antlerite
Raman bands at 971, 595, 480, 422, 384 and 196 cm−1; brochantite
Blue 1OpaquePurpleDark (Absorbing)Some transparencyBrightMineral blue, likely azuriteBand at ca. 460 nm, with low reflectance in the near-infrared region; azurite FTIR bands at 3704, 3621, 1118, 1034, 1003 and 914 cm−1; kaolinite and 3429, 1464, 1417, 956 and 840 cm−1; azurite Raman bands at 170, 247, 400, 542, 763, 836, 938, 1096, 1413, 1570 cm−1; azurite
Blue 2TransparentRedWeak, deep blue luminescenceTransparentDarkOrganic blue, likely indigoInflection point at 720 nm; indigo-
BrownPartially opaqueGreyish-yellow?Dark (Absorbing)Some transparencyDarkMixture with yellow and carbon-based black (tentative)--
BlackOpaqueBlackDark (Absorbing)OpaqueDarkCarbon-based black-
Flesh tone 1—PeachTransparentPale yellowWeak luminescenceTransparentDarkMixtures of a red/orange pigment with white (tentative)Inflection point at 565 nm; minium/red lead, likely mixed with white -
Flesh tone 2—BrownTransparentPale orangeWeak luminescenceTransparentDarkMixtures with white (tentative)inflection points 575–590 nm and ca. 700 nm; iron-oxide-based pigment, likely mixed with white-
WhiteTransparentWhiteBluish luminescenceTransparentDarkWhite pigment, not lead-based and likely based on calcium or magnesium.-FTIR bands at 1435, 888 and 747 cm−1; magnesite
Publisher’s Note: MDPI stays neutral with regard to jurisdictional claims in published maps and institutional affiliations.

