
Compositional and Morphological Investigations of Roman Glass from Cremation Deposits at Birdoswald Fort on Hadrian’s Wall, UK


Abstract
:1. Introduction
1.1. Cremation in Roman Britain
1.2. Roman Glassmaking
1.3. Research Aims
2. Materials and Methods
3. Results
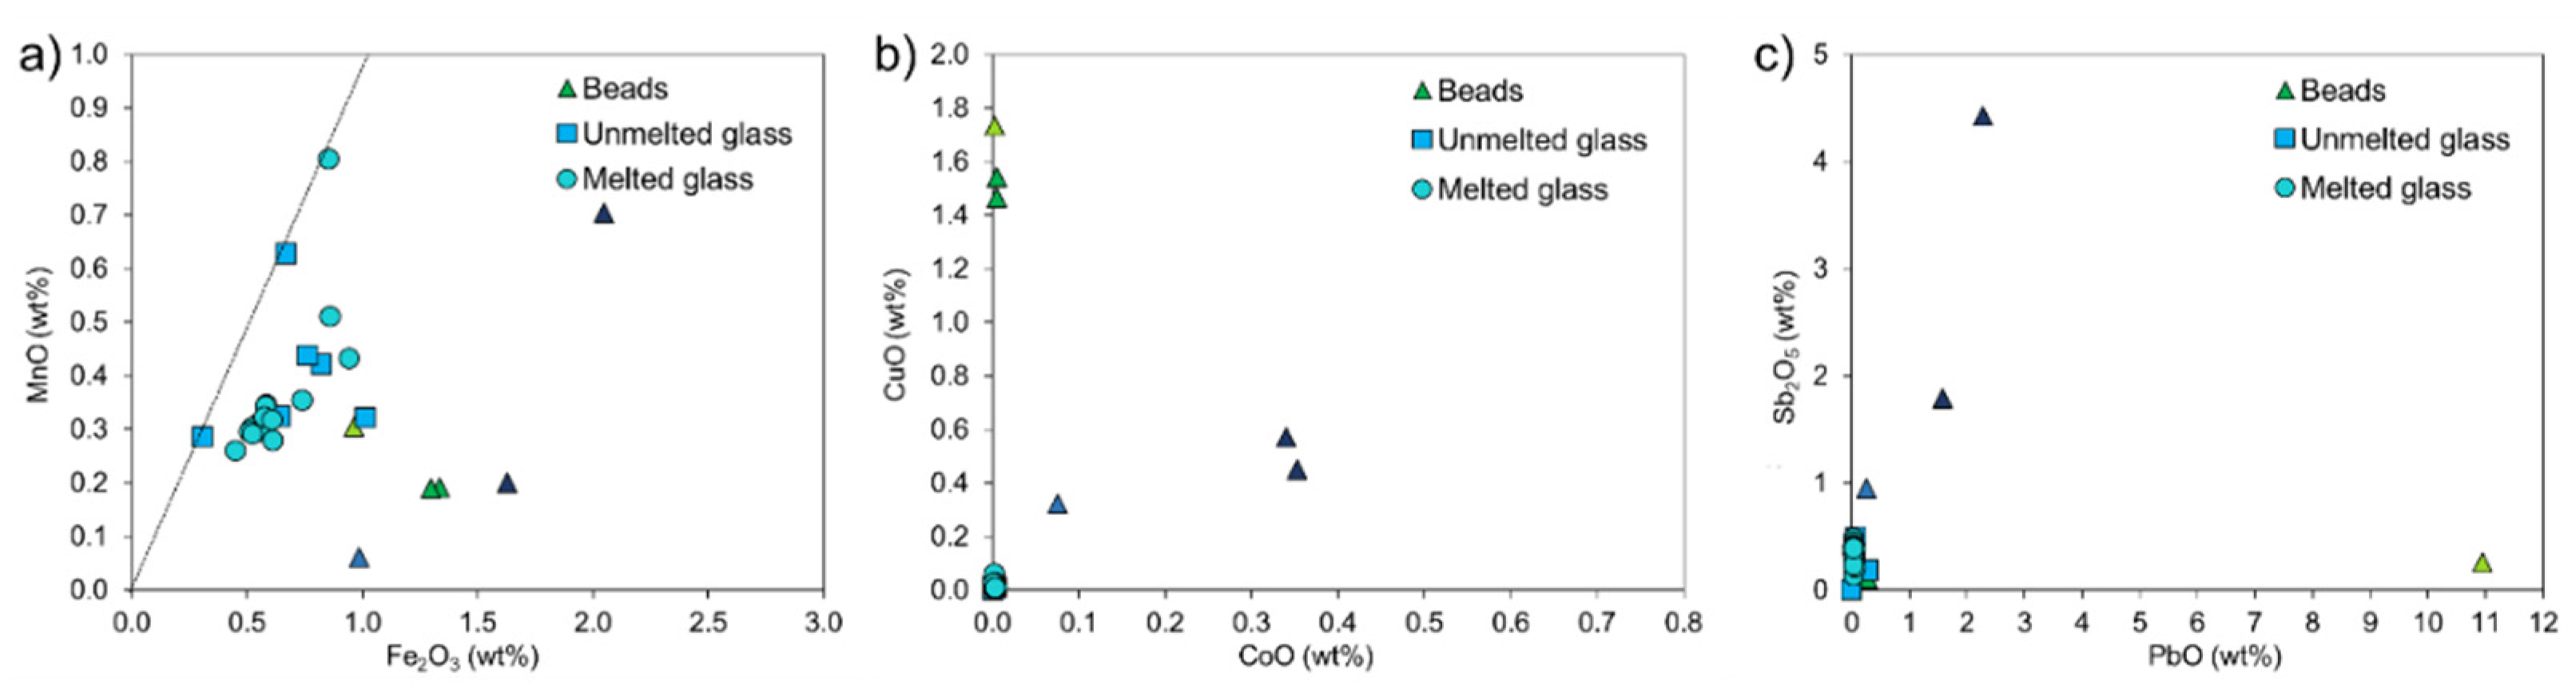
3.1. Chemical Characteristics of the Different Types of Glass
3.2. The Colour of the Glass
4. Discussion
4.1. Recycled Glass
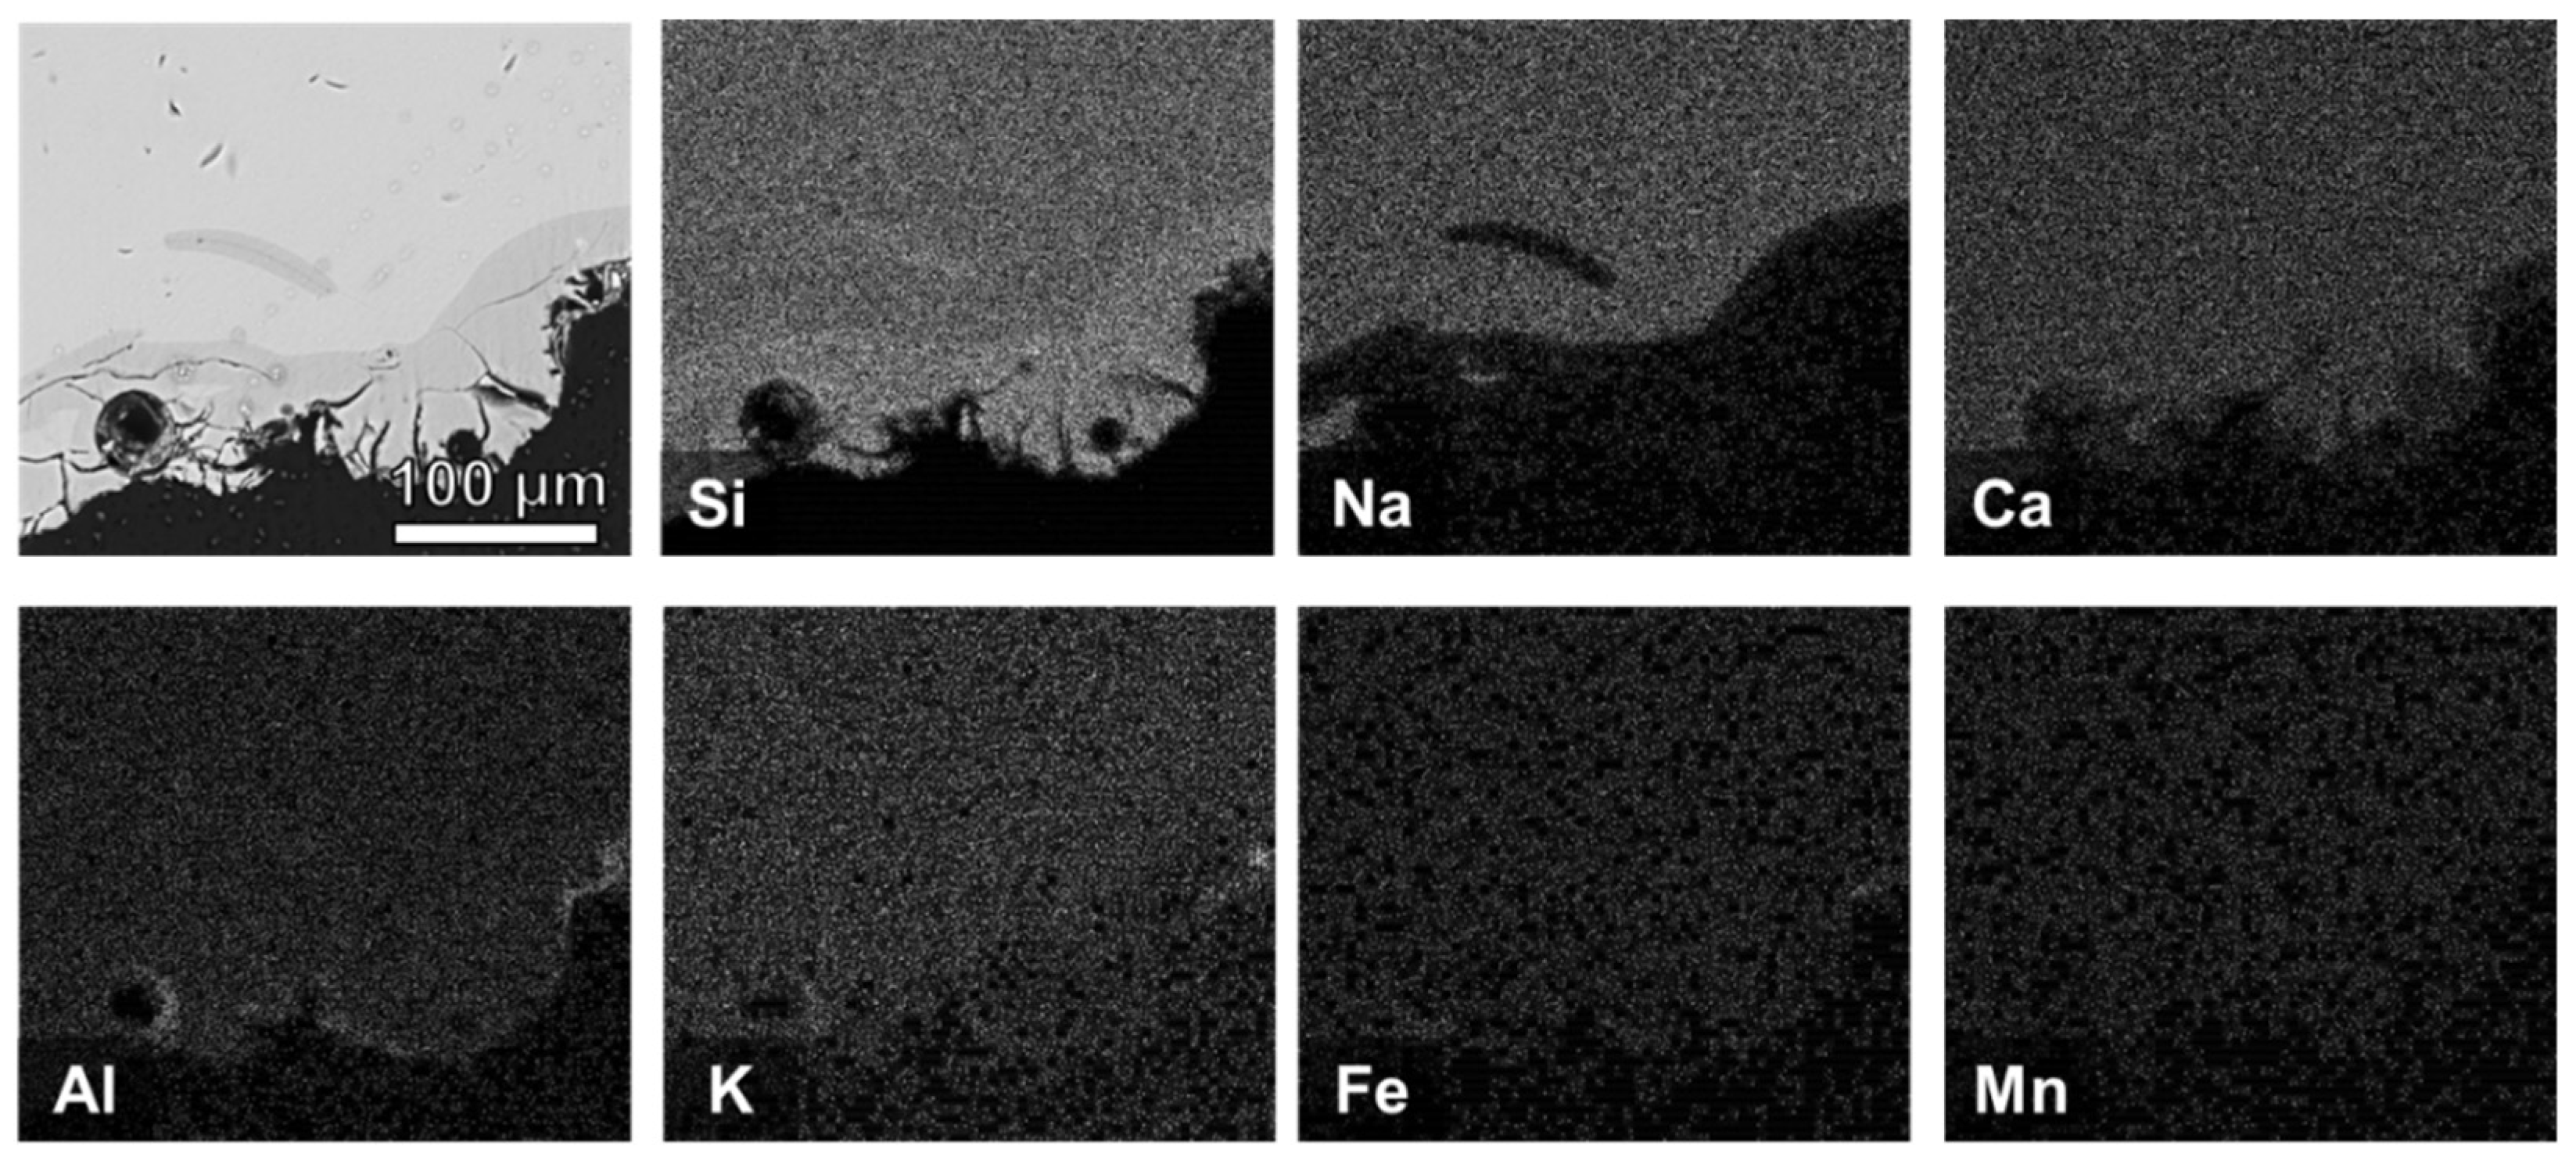
4.2. Sodium Depletion
4.3. Estimating the Temperature Experienced by the Glass
5. Conclusions
Author Contributions
Funding
Institutional Review Board Statement
Informed Consent Statement
Data Availability Statement
Acknowledgments
Conflicts of Interest
References
- McKinley, J.I. Chapter 10—In the Heat of the Pyre. In The Analysis of Burned Human Remains, 2nd ed.; Schmidt, C.W., Symes, S.A., Eds.; Academic Press: San Diego, CA, USA, 2015; pp. 181–202. [Google Scholar]
- Thompson, T.J.U.; Szigeti, J.; Gowland, R.L.; Witcher, R.E. Death on the frontier: Military cremation practices in the north of Roman Britain. J. Archaeol. Sci. Rep. 2016, 10, 828–836. [Google Scholar] [CrossRef]
- Wilmott, T. The Cemetery of the Hadrian’s Wall Fort at Birdoswald; Cumberland and Westmorland Antiquarian and Archaeological Society Research Series; Titus Wilson: Kendal, UK, 2022; in preparation. [Google Scholar]
- Williams, H. Chapter 15—Towards an Archaeology of Cremation. In The Analysis of Burned Human Remains, 2nd ed.; Schmidt, C.W., Symes, S.A., Eds.; Academic Press: San Diego, CA, USA, 2015; pp. 259–293. [Google Scholar]
- McKinley, J.I. A pyre and grave goods in British cremation burials; have we missed something? Antiquity 2015, 68, 132–134. [Google Scholar] [CrossRef]
- Brems, D.; Degryse, P.; Hasendoncks, F.; Gimeno, D.; Silvestri, A.; Vassilieva, E.; Luypaers, S.; Honings, J. Western Mediterranean sand deposits as a raw material for Roman glass production. J. Archaeol. Sci. 2012, 39, 2897–2907. [Google Scholar] [CrossRef]
- Wedepohl, K.H.; Baumann, A. The use of marine molluskan shells for Roman glass and local raw glass production in the Eifel area (western Germany). Sci. Nat. 2000, 87, 129–132. [Google Scholar] [CrossRef]
- Shortland, A.; Schachner, L.; Freestone, I.; Tite, M. Natron as a flux in the early vitreous materials industry: Sources, beginnings and reasons for decline. J. Archaeol. Sci. 2006, 33, 521–530. [Google Scholar] [CrossRef]
- Nenna, M.-D.; Vichy, M.; Picon, M. L’atelier de verrier de Lyon, du Ier siècle apr. J.-C, et l’origine des verres «romains». ArchéoSci. Rev. Archéomét. 1997, 21, 81–87. [Google Scholar] [CrossRef]
- Freestone, I.; Gorin-Rosen, Y.; Hughes, M.J. Primary glass from Israel and the production of glass in late antiquity and the early Islamic period. Route Verre 2000, 33, 65–83. [Google Scholar]
- Picon, M.; Vichy, M. D’Orient en Occident: L’origine du verre à l’époque romaine et durant le haut Moyen Âge. In Échanges et Commerce du Verre dans le Monde Antique Actes du Colloque de l’Association Française pour l’Archéologie du Verre, 7–9 Juin; Foy, D., Nenna, M.D., Eds.; Editions Mergoil: Aix-en-Provence et Marseille, France, 2003; pp. 17–31. [Google Scholar]
- Foy, D.; Vichy, M.; Picon, M. Lingots de verre en Méditerrané occidentale. In Annales du 14e Congrès de l’Association Internationale pour l’Histoire du Verre; AIHV: Amsterdam, The Netherlands, 2000; pp. 51–57. [Google Scholar]
- Degryse, P.; Schneider, J. Pliny the Elder and Sr–Nd isotopes: Tracing the provenance of raw materials for Roman glass production. J. Archaeol. Sci. 2008, 35, 1993–2000. [Google Scholar] [CrossRef] [Green Version]
- Ganio, M.; Boyen, S.; Fenn, T.; Scott, R.; Vanhoutte, S.; Gimeno, D.; Degryse, P. Roman glass across the Empire: An elemental and isotopic characterization. J. Anal. At. Spectrom. 2012, 27, 743–753. [Google Scholar] [CrossRef] [Green Version]
- Price, J.; Cottam, S. Romano-British Glass Vessels: A Handbook; Council for British Archaeology: London, UK, 1998. [Google Scholar]
- Jackson, C.M.; Paynter, S. A Great Big Melting Pot: Exploring Patterns of Glass Supply, Consumption and Recycling in Roman Coppergate, York. Archaeometry 2016, 58, 68–95. [Google Scholar] [CrossRef] [Green Version]
- Schibille, N.; Sterrett-Krause, A.; Freestone, I. Glass groups, glass supply and recycling in late Roman Carthage. Archaeol. Anthropol. Sci. 2017, 9, 1223–1241. [Google Scholar] [CrossRef] [Green Version]
- Boschetti, C.; Leonelli, C. Glass Coloring and Recycling in Late Antiquity: A New Case Study from Aquileia (Italy). J. Glass Stud. 2016, 58, 69–86. [Google Scholar]
- Lakatos, T.; Johansson, L.-G.; Simmingsköld, B. Viscosity temperature relations in the glass system SiO2-Al2O3-Na2O-K2O-CaO-MgO in the composition range of technical glasses. Glass Technol. 1972, 13, 88–95. [Google Scholar]
- Lakatos, T. Viscosity and temperature relations in glasses composed of SiO2-Al2O3-Na2O-K2O-Li2O-CaO-MgO-BaO-ZnO-PbO-B2O. Glastek. Tidskr. 1976, 31, 51–54. [Google Scholar]
- Bingham, P.A.; Jackson, C.M. Roman blue-green bottle glass: Chemical–optical analysis and high temperature viscosity modelling. J. Archaeol. Sci. 2008, 35, 302–309. [Google Scholar] [CrossRef]
- Henderson, J. The raw materials of early glass production. Oxf. J. Archaeol. 1985, 4, 267–291. [Google Scholar] [CrossRef]
- Freestone, I.C.; Leslie, K.A.; Thirlwall, M.; Gorin-Rosen, Y. Strontium Isotopes in the Investigation of Early Glass Production: Byzantine and Early Islamic Glass from the Near East. Archaeometry 2003, 45, 19–32. [Google Scholar] [CrossRef]
- Silvestri, A. The coloured glass of Iulia Felix. J. Archaeol. Sci. 2008, 35, 1489–1501. [Google Scholar] [CrossRef]
- Henderson, J. Chemical Characterization of Roman Glass Vessels, Enamels and Tesserae. Mater. Res. Soc. Symp. Proc. 2011, 185, 601–607. [Google Scholar] [CrossRef]
- Mirti, P.; Casoli, A.; Appolonia, L. Scientific analysis of Roman glass from Augusta Praetoria. Archaeometry 1993, 35, 225–240. [Google Scholar] [CrossRef]
- Fredrickx, P.; De Ryck, I.; Janssens, K.; Schryvers, D.; Petit, J.-P.; Döcking, H. EPMA and µ-SRXRF analysis and TEM-based microstructure characterization of a set of Roman glass fragments. Xray Spectrom. 2004, 33, 326–333. [Google Scholar] [CrossRef]
- Lahlil, S.; Biron, I.; Galoisy, L.; Morin, G. Rediscovering ancient glass technologies through the examination of opacifier crystals. Appl. Phys. A 2008, 92, 109–116. [Google Scholar] [CrossRef]
- Paynter, S.; Kearns, T.; Cool, H.; Chenery, S. Roman coloured glass in the Western provinces: The glass cakes and tesserae from West Clacton in England. J. Archaeol. Sci. 2015, 62, 66–81. [Google Scholar] [CrossRef] [Green Version]
- Di Turo, F.; Moro, G.; Artesani, A.; Albertin, F.; Bettuzzi, M.; Cristofori, D.; Moretto, L.M.; Traviglia, A. Chemical analysis and computed tomography of metallic inclusions in Roman glass to unveil ancient coloring methods. Sci. Rep. 2021, 11, 11187. [Google Scholar] [CrossRef] [PubMed]
- Paynter, S.; Jackson, C. Clarity and brilliance: Antimony in colourless natron glass explored using Roman glass found in Britain. Archaeol. Anthropol. Sci. 2019, 11, 1533–1551. [Google Scholar] [CrossRef] [Green Version]
- Henderson, J.; Warren, S.E. X-ray fluorescence analyses of iron age glass: Beads from Meare and Glastonbury lake villages. Archaeometry 1981, 23, 83–94. [Google Scholar] [CrossRef]
- Schiavon, N.; Candeias, A.; Ferreira, T.; Da Conceiçao Lopes, M.; Carneiro, A.; Calligaro, T.; Mirao, J. A combined multi-analytical approach for the study of Roman glass from South-West Iberia: Synchrotron μ-XRF, external-Pixe/Pige and BSEM-EDS. Archaeometry 2012, 54, 974–996. [Google Scholar] [CrossRef] [Green Version]
- Moropoulou, A.; Zacharias, N.; Delegou, E.T.; Maróti, B.; Kasztovszky, Z. Analytical and technological examination of glass tesserae from Hagia Sophia. Microchem. J. 2016, 125, 170–184. [Google Scholar] [CrossRef]
- Cailleteau, C.; Weigel, C.; Ledieu, A.; Barboux, P.; Devreux, F. On the effect of glass composition in the dissolution of glasses by water. J. Non-Cryst. Solids 2008, 354, 117–123. [Google Scholar] [CrossRef]
- Beerkens, R.G.C. Modeling the Kinetics of Volatilization from Glass Melts. J. Am. Ceram. Soc. 2001, 84, 1952–1960. [Google Scholar] [CrossRef]
- Jackson, C.M.; Greenfield, D.; Howie, L.A. An assessment of compositional and morphological changes in model archaeological glasses in an acid burial matrix. Archaeometry 2012, 54, 489–507. [Google Scholar] [CrossRef]
- Mays, S. The Archaeology of Human Bones; Routledge: Abingdon, UK, 2010. [Google Scholar]
- Pinto, J.; Prieto, A.C.; Coria-Noguera, J.C.; Sanz-Minguez, C.; Souto, J. Investigating glass beads and the funerary rituals of ancient Vaccaei culture (S. IV-I BC) by Raman spectroscopy. J. Raman Spectrosc. 2021, 52, 170–185. [Google Scholar] [CrossRef]
- Thompson, T.J.U.; Islam, M.; Bonniere, M. A new statistical approach for determining the crystallinity of heat-altered bone mineral from FTIR spectra. J. Archaeol. Sci. 2013, 40, 416–422. [Google Scholar] [CrossRef]
- Carroll, E.L.; Squires, K.E. The application of quantitative petrography and macroscopic colour change in a comparative analysis of Roman and Anglo-Saxon cremation practices. Int. J. Osteoarchaeol. 2020, 30, 882–890. [Google Scholar] [CrossRef]
- Ubelaker, D.; Rife, J. The practice of cremation in the Roman-era cemetery at Kenchreai, Greece. The perspective from archeology and forensic science. Bioarchaeol. Near East 2007, 1, 35–57. [Google Scholar]
- Gonçalves, D.; Duarte, C.; Costa, C.; Muralha, J.; Campanacho, V.; Costa, A.; Angelucci, D.E. The Roman cremation burials of the Encosta de Sant’ Ana (Lisbon, Portugal). Rev. Port. Arqueol. 2010, 13, 125–144. [Google Scholar]
- García-Prósper, E.; Polo-Cerdá, M. Estudio bioantropológico y paleopatológico del sepulcretum de Llanos del Pretorio, Cordoba. In El Sepulcretum de Llanos del Pretorio (Córdoba—España); Vaquerizo, D., Ruiz, A., Rubio, M., Eds.; Edipuglia: Bari, Italy, 2020; pp. 161–172. [Google Scholar]
- Masotti, S.; Mongillo, J.; Gualdi-Russo, E. Burned human remains: Diachronic analysis of cremation rituals in necropolises of northern Italy. Archaeol. Anthropol. Sci. 2020, 12, 74. [Google Scholar] [CrossRef]


| Sample | Na2O | MgO | Al2O3 | SiO2 | P2O5 | SO3 | K2O | CaO | TiO2 | MnO | Fe2O3 | CoO | CuO | ZnO | Sb2O5 | BaO | PbO | ||
|---|---|---|---|---|---|---|---|---|---|---|---|---|---|---|---|---|---|---|---|
| Corning A | Measured | Avg | 13.15 | 2.73 | 0.98 | 67.64 | bd | 0.27 | 3.16 | 5.25 | 0.77 | 1.03 | 1.04 | 0.20 | 1.28 | 0.07 | 1.69 | 0.59 | 0.13 |
| std | 0.26 | 0.13 | 0.21 | 0.46 | bd | 0.13 | 0.07 | 0.12 | 0.20 | 0.08 | 0.12 | 0.02 | 0.08 | 0.05 | 0.33 | 0.15 | 0.22 | ||
| Known | 14.30 | 2.66 | 1.00 | 66.76 | 0.13 | 0.10 | 2.87 | 5.03 | 0.79 | 1.00 | 1.09 | 0.17 | 1.17 | 0.04 | 1.75 | 0.56 | 0.12 | ||
| Corning B | Measured | Avg | 15.86 | 1.09 | 4.32 | 62.15 | 0.85 | 0.55 | 1.15 | 8.90 | 0.13 | 0.30 | 0.29 | 0.07 | 3.07 | 0.24 | 0.43 | bd | 0.55 |
| std | 0.18 | 0.08 | 0.04 | 0.70 | 0.25 | 0.14 | 0.08 | 0.16 | 0.03 | 0.12 | 0.10 | 0.06 | 0.06 | 0.18 | 0.38 | 0.08 | 0.12 | ||
| Known | 17.00 | 1.03 | 4.36 | 61.52 | 0.82 | 0.50 | 1.00 | 8.56 | 0.09 | 0.25 | 0.34 | 0.05 | 2.66 | 0.19 | 0.46 | 0.12 | 0.61 | ||
| Corning C | Measured | Avg | 1.18 | 2.72 | 0.80 | 34.65 | bd | bd | 3.01 | 5.20 | 0.87 | 0.07 | 0.35 | 0.18 | 1.23 | 0.09 | 0.39 | 12.56 | 36.70 |
| std | 0.18 | 0.03 | 0.22 | 0.29 | bd | bd | 0.07 | 0.14 | 0.07 | 0.06 | 0.05 | 0.08 | 0.06 | 0.14 | 0.51 | 0.15 | 0.32 | ||
| Known | 1.07 | 2.76 | 0.87 | 35.88 | 0.14 | 0.10 | 2.84 | 5.07 | 0.79 | bd | 0.34 | 0.18 | 1.13 | 0.05 | 0.03 | 11.40 | 36.7 | ||
| Corning D | Measured | Avg | 1.36 | 4.18 | 5.04 | 54.80 | 3.85 | 0.42 | 11.95 | 15.08 | 0.45 | 0.44 | 0.48 | bd | 0.34 | 0.14 | 0.80 | 0.41 | 0.27 |
| std | 0.18 | 0.23 | 0.03 | 0.34 | 0.17 | 0.16 | 0.11 | 0.12 | 0.10 | 0.08 | 0.14 | bd | 0.20 | 0.12 | 0.24 | 0.21 | 0.11 | ||
| Known | 1.20 | 3.94 | 5.30 | 54.65 | 3.93 | 0.30 | 11.30 | 14.80 | 0.38 | 0.55 | 0.52 | 0.02 | 0.38 | 0.10 | 0.97 | 0.51 | 0.48 | ||
| Sample ID | Description | Type of Glass |
|---|---|---|
| B1 | Transparent blue bead | Sb glass |
| B2 | Opaque dark blue fragment | Sb-Mn glass |
| B3 | Opaque dark blue fragment | Sb-Mn glass |
| B4 | Green bead (burned) | Sb-Mn glass |
| B5 | Opaque light green bead | Sb-Mn glass |
| B6 | Green bead (burned) | Sb-Mn glass |
| UG1 | Blue-green fragment | Low-Mn glass |
| UG2 | Blue-green fragment | Sb-Mn glass |
| UG3 | Blue-green fragment | Sb-Mn glass |
| UG4 | Blue-green fragment | Sb-Mn glass |
| UG5 | Blue-green fragment | Sb-Mn glass |
| UG6 | Blue-green fragment | Sb-Mn glass |
| MG1 | Melted blue-green fragment | Sb-Mn glass |
| MG2 | Melted blue-green fragment | Sb-Mn glass |
| MG3 | Melted blue-green fragment | Sb-Mn glass |
| MG4 | Melted blue-green fragment | Sb-Mn glass |
| MG5 | Melted blue-green fragment | Sb-Mn glass |
| MG6 | Melted blue-green fragment | Sb-Mn glass |
| MG7 | Melted blue-green fragment | Sb-Mn glass |
| MG8 | Melted blue-green fragment | Sb-Mn glass |
| MG9 | Melted blue-green fragment | Sb-Mn glass |
| MG10 | Melted blue-green fragment | Sb-Mn glass |
| MG11 | Melted blue-green fragment | Sb-Mn glass |
| MG12 | Melted blue-green fragment | Sb-Mn glass |
| MG13 | Melted blue-green fragment | Sb-Mn glass |
| MG14 | Melted blue-green fragment | Sb-Mn glass |
| MG15 | Melted blue-green fragment | Sb-Mn glass |
| MG16 | Melted blue-green fragment | Sb-Mn glass |
| MG17 | Melted blue-green fragment | Sb-Mn glass |
| MG18 | Melted blue-green fragment | Sb-Mn glass |
| MG19 | Melted blue-green fragment | Sb-Mn glass |
| MG20 | Melted blue-green fragment | Sb-Mn glass |
| Sample | Na2O | MgO | Al2O3 | SiO2 | SO3 | K2O | CaO | TiO2 | MnO2 | Fe2O3 | CoO | CuO | SrO | Sb2O5 | PbO | P2O5 | ZnO | SnO2 | |
|---|---|---|---|---|---|---|---|---|---|---|---|---|---|---|---|---|---|---|---|
| B1 | Avg | 1.89 | 0.27 | 2.16 | 85.68 | 0.46 | 0.37 | 6.35 | 0.07 | 0.06 | 0.99 | 0.08 | 0.32 | 0.08 | 0.95 | 0.25 | bd | 0.01 | bd |
| std | 0.79 | 0.03 | 0.18 | 0.93 | 0.05 | 0.18 | 0.22 | 0.01 | 0.01 | 0.11 | 0.01 | 0.03 | 0.01 | 0.11 | 0.04 | bd | 0.00 | bd | |
| B2 | Avg | 13.37 | 0.15 | 3.42 | 66.60 | 0.03 | 1.86 | 4.70 | 0.14 | 0.20 | 1.63 | 0.35 | 0.45 | 0.05 | 4.42 | 2.28 | bd | 0.31 | 0.03 |
| std | 2.10 | 0.21 | 1.78 | 1.80 | 0.03 | 0.20 | 0.81 | 0.16 | 0.20 | 1.04 | 0.17 | 0.08 | 0.00 | 2.22 | 1.07 | bd | 0.05 | 0.06 | |
| B3 | Avg | 7.11 | 0.19 | 3.38 | 73.95 | 0.35 | 0.50 | 7.02 | 0.06 | 0.70 | 2.05 | 0.34 | 0.57 | 0.05 | 1.79 | 1.59 | 0.34 | 0.01 | bd |
| std | 0.86 | 0.07 | 1.11 | 5.07 | 0.06 | 0.08 | 0.50 | 0.01 | 0.56 | 2.17 | 0.13 | 0.14 | 0.02 | 0.35 | 0.73 | 0.67 | 0.00 | bd | |
| B4 | Avg | 13.78 | 1.51 | 3.90 | 66.22 | 0.25 | 1.29 | 9.01 | 0.13 | 0.19 | 1.34 | 0.01 | 1.47 | 0.07 | 0.11 | 0.27 | 0.27 | 0.03 | 0.15 |
| std | 1.89 | 0.09 | 1.03 | 0.99 | 0.02 | 0.04 | 0.34 | 0.01 | 0.00 | 0.10 | 0.00 | 0.17 | 0.03 | 0.08 | 0.08 | 0.10 | 0.00 | 0.12 | |
| B5 | Avg | 4.21 | 0.90 | 7.63 | 65.24 | bd | 0.92 | 5.58 | 0.14 | 0.30 | 0.96 | bd | 1.73 | 0.05 | 0.26 | 10.96 | bd | 0.04 | 1.06 |
| std | 0.70 | 0.07 | 0.40 | 0.76 | bd | 0.03 | 0.17 | 0.01 | 0.01 | 0.05 | bd | 0.13 | 0.01 | 0.09 | 0.56 | bd | 0.00 | 0.35 | |
| B6 | Avg | 12.85 | 1.51 | 2.58 | 68.27 | 0.26 | 1.29 | 9.06 | 0.12 | 0.19 | 1.30 | 0.01 | 1.54 | 0.08 | 0.18 | 0.31 | 0.12 | 0.03 | 0.29 |
| std | 1.36 | 0.06 | 0.12 | 0.94 | 0.01 | 0.10 | 0.28 | 0.01 | 0.01 | 0.04 | 0.00 | 0.10 | 0.01 | 0.04 | 0.02 | 0.02 | 0.00 | 0.06 | |
| Sample | Na2O | MgO | Al2O3 | SiO2 | SO3 | K2O | CaO | TiO2 | MnO2 | Fe2O3 | CoO | CuO | SrO | Sb2O5 | PbO | P2O5 | ZnO | SnO2 | |
|---|---|---|---|---|---|---|---|---|---|---|---|---|---|---|---|---|---|---|---|
| UG1 | Avg | 9.83 | 0.19 | 2.61 | 75.86 | 0.09 | 3.42 | 7.27 | 0.05 | 0.29 | 0.31 | bd | bd | 0.05 | bd | bd | bd | bd | bd |
| std | 0.73 | 0.02 | 0.06 | 0.23 | 0.01 | 0.92 | 0.08 | 0.00 | 0.01 | 0.01 | bd | bd | 0.00 | bd | bd | bd | bd | bd | |
| UG2 | Avg | 2.39 | 0.41 | 3.64 | 82.25 | 0.47 | 0.86 | 8.07 | 0.10 | 0.32 | 1.01 | bd | 0.01 | 0.05 | 0.35 | 0.04 | bd | bd | bd |
| std | 0.52 | 0.05 | 0.66 | 0.53 | 0.11 | 0.03 | 0.11 | 0.00 | 0.01 | 0.12 | bd | 0.00 | 0.00 | 0.01 | 0.00 | bd | bd | bd | |
| UG3 | Avg | 7.32 | 0.25 | 2.87 | 78.87 | 0.42 | 1.07 | 7.40 | 0.09 | 0.63 | 0.67 | bd | 0.01 | 0.05 | 0.25 | 0.06 | bd | 0.01 | bd |
| std | 0.11 | 0.05 | 0.02 | 0.12 | 0.00 | 0.03 | 0.15 | 0.01 | 0.01 | 0.01 | bd | 0.00 | 0.00 | 0.02 | 0.00 | bd | 0.00 | bd | |
| UG4 | Avg | 3.45 | 0.34 | 2.85 | 82.25 | 0.36 | 0.95 | 7.90 | 0.09 | 0.42 | 0.82 | bd | 0.01 | 0.05 | 0.18 | 0.29 | bd | 0.01 | bd |
| std | 0.70 | 0.06 | 0.04 | 0.57 | 0.01 | 0.01 | 0.06 | 0.00 | 0.00 | 0.01 | bd | 0.00 | 0.00 | 0.02 | 0.02 | bd | 0.00 | bd | |
| UG5 | Avg | 0.85 | 0.28 | 3.11 | 85.61 | 0.48 | 0.60 | 7.14 | 0.08 | 0.44 | 0.76 | bd | 0.01 | 0.05 | 0.49 | 0.08 | bd | bd | bd |
| std | 0.15 | 0.03 | 0.35 | 0.22 | 0.02 | 0.00 | 0.19 | 0.00 | 0.01 | 0.01 | bd | 0.00 | 0.00 | 0.02 | 0.00 | bd | bd | bd | |
| UG6 | Avg | 1.34 | 0.52 | 3.69 | 83.60 | 0.51 | 0.96 | 7.87 | 0.10 | 0.32 | 0.65 | bd | 0.01 | 0.06 | 0.32 | 0.04 | bd | 0.01 | bd |
| std | 0.32 | 0.22 | 0.39 | 1.20 | 0.03 | 0.06 | 0.22 | 0.01 | 0.01 | 0.07 | bd | 0.00 | 0.00 | 0.01 | 0.00 | bd | 0.00 | bd | |
| Sample | Na2O | MgO | Al2O3 | SiO2 | SO3 | K2O | CaO | TiO2 | MnO2 | Fe2O3 | CoO | CuO | SrO | Sb2O5 | PbO | P2O5 | ZnO | SnO2 | |
|---|---|---|---|---|---|---|---|---|---|---|---|---|---|---|---|---|---|---|---|
| MG1 | Avg | 0.83 | 0.32 | 2.76 | 86.46 | 0.32 | 0.52 | 7.41 | 0.08 | 0.31 | 0.54 | bd | 0.01 | 0.05 | 0.32 | 0.04 | bd | bd | bd |
| std | 0.11 | 0.07 | 0.03 | 0.17 | 0.02 | 0.00 | 0.05 | 0.00 | 0.01 | 0.01 | bd | 0.00 | 0.00 | 0.01 | 0.00 | bd | bd | bd | |
| MG2 | Avg | 0.94 | 0.41 | 2.94 | 85.10 | 0.32 | 0.63 | 8.26 | 0.09 | 0.35 | 0.58 | bd | 0.01 | 0.05 | 0.26 | 0.04 | bd | bd | bd |
| std | 0.36 | 0.07 | 0.13 | 0.38 | 0.01 | 0.02 | 0.08 | 0.00 | 0.01 | 0.02 | bd | 0.00 | 0.00 | 0.03 | 0.00 | bd | bd | bd | |
| MG3 | Avg | 0.97 | 0.33 | 2.93 | 86.60 | 0.31 | 0.45 | 6.89 | 0.08 | 0.29 | 0.55 | bd | 0.01 | 0.05 | 0.48 | 0.03 | bd | bd | bd |
| std | 0.07 | 0.02 | 0.18 | 0.48 | 0.01 | 0.04 | 0.23 | 0.00 | 0.01 | 0.03 | bd | 0.00 | 0.01 | 0.04 | 0.00 | bd | bd | bd | |
| MG4 | Avg | 0.98 | 0.36 | 3.17 | 86.34 | 0.35 | 0.66 | 6.88 | 0.09 | 0.32 | 0.60 | bd | bd | 0.05 | 0.14 | 0.04 | bd | 0.01 | bd |
| std | 0.28 | 0.03 | 0.34 | 0.24 | 0.01 | 0.05 | 0.08 | 0.01 | 0.01 | 0.05 | bd | bd | 0.00 | 0.04 | 0.00 | bd | 0.00 | bd | |
| MG5 | Avg | 0.71 | 0.27 | 2.64 | 87.12 | 0.30 | 0.49 | 7.07 | 0.08 | 0.29 | 0.51 | bd | 0.01 | 0.05 | 0.41 | 0.03 | bd | bd | bd |
| std | 0.24 | 0.02 | 0.09 | 0.43 | 0.01 | 0.07 | 0.17 | 0.00 | 0.01 | 0.02 | bd | 0.00 | 0.00 | 0.05 | 0.00 | bd | bd | bd | |
| MG6 | Avg | 0.04 | 0.38 | 2.74 | 87.23 | 0.31 | 0.49 | 7.43 | 0.08 | 0.30 | 0.54 | bd | 0.01 | 0.05 | 0.36 | 0.04 | bd | bd | bd |
| std | 0.07 | 0.05 | 0.08 | 0.17 | 0.01 | 0.02 | 0.03 | 0.00 | 0.00 | 0.01 | bd | 0.00 | 0.00 | 0.03 | 0.00 | bd | bd | bd | |
| MG7 | Avg | 1.83 | 0.64 | 4.01 | 79.72 | 0.28 | 2.19 | 9.29 | 0.17 | 0.43 | 0.94 | bd | 0.06 | 0.06 | 0.29 | 0.04 | bd | 0.02 | bd |
| std | 0.58 | 0.04 | 0.32 | 0.33 | 0.04 | 0.13 | 0.36 | 0.04 | 0.03 | 0.10 | bd | 0.02 | 0.01 | 0.02 | 0.00 | bd | 0.01 | bd | |
| MG8 | Avg | 0.49 | 0.60 | 2.95 | 85.38 | 0.17 | 1.21 | 7.61 | 0.08 | 0.32 | 0.59 | bd | 0.02 | 0.06 | 0.45 | 0.03 | bd | 0.01 | bd |
| std | 0.21 | 0.07 | 0.03 | 0.67 | 0.01 | 0.11 | 0.35 | 0.00 | 0.01 | 0.02 | bd | 0.00 | 0.00 | 0.02 | 0.00 | bd | 0.00 | bd | |
| MG9 | Avg | 0.39 | 0.31 | 2.64 | 87.36 | 0.29 | 0.55 | 7.03 | 0.08 | 0.30 | 0.52 | bd | 0.01 | 0.05 | 0.42 | 0.03 | bd | bd | bd |
| std | 0.18 | 0.04 | 0.09 | 0.22 | 0.01 | 0.02 | 0.06 | 0.00 | 0.00 | 0.01 | bd | 0.00 | 0.00 | 0.02 | 0.00 | bd | bd | bd | |
| MG10 | Avg | 0.19 | 0.41 | 3.12 | 86.54 | 0.23 | 1.19 | 6.85 | 0.09 | 0.30 | 0.56 | bd | 0.03 | 0.05 | 0.39 | 0.03 | bd | 0.01 | bd |
| std | 0.06 | 0.08 | 0.48 | 0.97 | 0.03 | 0.18 | 0.16 | 0.00 | 0.01 | 0.06 | bd | 0.01 | 0.00 | 0.03 | 0.00 | bd | 0.00 | bd | |
| MG11 | Avg | 0.92 | 0.34 | 2.91 | 85.70 | 0.17 | 1.31 | 7.29 | 0.08 | 0.30 | 0.51 | bd | 0.02 | 0.05 | 0.34 | 0.03 | bd | 0.01 | bd |
| std | 0.37 | 0.05 | 0.10 | 0.84 | 0.03 | 0.07 | 0.41 | 0.01 | 0.01 | 0.03 | bd | 0.00 | 0.00 | 0.02 | 0.00 | bd | 0.00 | bd | |
| MG12 | Avg | 0.63 | 0.45 | 3.48 | 85.51 | 0.40 | 0.88 | 7.21 | 0.11 | 0.34 | 0.58 | bd | 0.01 | 0.05 | 0.29 | 0.04 | bd | bd | bd |
| std | 0.06 | 0.04 | 0.13 | 0.76 | 0.06 | 0.20 | 0.23 | 0.01 | 0.00 | 0.02 | bd | 0.00 | 0.00 | 0.01 | 0.00 | bd | bd | bd | |
| MG13 | Avg | 1.05 | 0.36 | 3.07 | 86.34 | 0.35 | 0.48 | 6.93 | 0.10 | 0.32 | 0.57 | bd | 0.01 | 0.05 | 0.32 | 0.04 | bd | bd | bd |
| std | 0.21 | 0.07 | 0.06 | 0.38 | 0.02 | 0.12 | 0.21 | 0.00 | 0.01 | 0.03 | bd | 0.00 | 0.00 | 0.01 | 0.00 | bd | bd | bd | |
| MG14 | Avg | 0.97 | 0.94 | 2.98 | 83.44 | 0.23 | 0.96 | 8.05 | 0.19 | 0.80 | 0.85 | 0.01 | 0.01 | 0.07 | 0.38 | 0.08 | 0.01 | bd | bd |
| std | 0.14 | 0.12 | 0.20 | 0.12 | 0.02 | 0.02 | 0.12 | 0.02 | 0.01 | 0.00 | 0.00 | 0.00 | 0.01 | 0.04 | 0.00 | 0.01 | bd | bd | |
| MG15 | Avg | 0.44 | 0.32 | 2.99 | 86.93 | 0.26 | 1.02 | 6.64 | 0.09 | 0.28 | 0.61 | bd | 0.01 | 0.05 | 0.28 | 0.03 | bd | 0.01 | bd |
| std | 0.21 | 0.02 | 0.10 | 0.50 | 0.06 | 0.16 | 0.12 | 0.02 | 0.02 | 0.14 | bd | 0.00 | 0.00 | 0.05 | 0.00 | bd | 0.00 | bd | |
| MG16 | Avg | 0.70 | 0.36 | 2.88 | 87.50 | 0.32 | 0.58 | 6.35 | 0.08 | 0.29 | 0.52 | bd | 0.01 | 0.05 | 0.31 | 0.03 | bd | bd | bd |
| std | 0.13 | 0.12 | 0.07 | 0.38 | 0.02 | 0.10 | 0.15 | 0.00 | 0.00 | 0.01 | bd | 0.00 | 0.00 | 0.01 | 0.00 | bd | bd | bd | |
| MG17 | Avg | 1.38 | 0.42 | 3.61 | 83.59 | 0.22 | 0.91 | 8.01 | 0.10 | 0.51 | 0.86 | bd | 0.01 | 0.06 | 0.21 | 0.08 | bd | bd | bd |
| std | 0.17 | 0.04 | 0.36 | 0.24 | 0.02 | 0.02 | 0.15 | 0.01 | 0.04 | 0.06 | bd | 0.00 | 0.00 | 0.03 | 0.00 | bd | bd | bd | |
| MG18 | Avg | 0.58 | 0.38 | 2.93 | 86.16 | 0.32 | 0.71 | 7.55 | 0.09 | 0.32 | 0.61 | bd | 0.01 | 0.05 | 0.24 | 0.04 | bd | bd | bd |
| std | 0.26 | 0.06 | 0.05 | 0.58 | 0.02 | 0.04 | 0.16 | 0.00 | 0.01 | 0.02 | bd | 0.00 | 0.00 | 0.04 | 0.00 | bd | bd | bd | |
| MG19 | Avg | 0.41 | 0.23 | 2.99 | 88.68 | 0.15 | 1.02 | 5.23 | 0.07 | 0.26 | 0.45 | bd | 0.02 | 0.05 | 0.40 | 0.02 | bd | 0.01 | bd |
| std | 0.13 | 0.09 | 0.19 | 0.72 | 0.03 | 0.08 | 0.17 | 0.00 | 0.00 | 0.02 | bd | 0.00 | 0.00 | 0.02 | 0.00 | bd | 0.00 | bd | |
| MG20 | Avg | 17.46 | 0.16 | 2.24 | 71.04 | 0.17 | 0.55 | 6.71 | 0.07 | 0.35 | 0.74 | bd | 0.01 | 0.04 | 0.39 | 0.03 | bd | bd | bd |
| std | 0.11 | 0.05 | 0.03 | 0.20 | 0.03 | 0.01 | 0.13 | 0.00 | 0.01 | 0.02 | bd | 0.00 | 0.00 | 0.02 | 0.00 | bd | bd | bd | |
| Sample | Na2O | MgO | Al2O3 | SiO2 | SO3 | K2O | CaO | TiO2 | MnO2 | Fe2O3 | CoO | CuO | SrO | Sb2O5 | PbO | P2O5 | SnO2 | |
|---|---|---|---|---|---|---|---|---|---|---|---|---|---|---|---|---|---|---|
| UG2 bulk | Avg | 17.39 | 0.55 | 2.25 | 69.53 | 0.10 | 0.61 | 7.27 | 0.13 | 0.31 | 0.87 | 0.08 | 0.02 | 0.24 | 0.30 | 0.07 | 0.04 | 0.22 |
| std | 1.39 | 0.15 | 0.07 | 1.00 | 0.15 | 0.04 | 0.50 | 0.04 | 0.06 | 0.11 | 0.03 | 0.03 | 0.13 | 0.35 | 0.03 | 0.06 | 0.03 | |
| UG2 surface | Avg | 18.14 | 0.63 | 2.36 | 69.20 | 0.15 | 0.60 | 7.04 | 0.08 | 0.28 | 0.88 | bd | 0.18 | 0.15 | bd | 0.23 | 0.07 | bd |
| std | 1.10 | 0.13 | 0.08 | 0.83 | 0.06 | 0.04 | 0.96 | 0.04 | 0.04 | 0.21 | bd | 0.10 | 0.22 | bd | 0.25 | 0.10 | bd | |
| UG3 bulk | Avg | 17.38 | 0.43 | 2.32 | 69.54 | 0.31 | 0.63 | 6.85 | 0.02 | 0.62 | 0.53 | 0.01 | 0.07 | 0.22 | 0.55 | 0.15 | 0.13 | 0.22 |
| std | 2.16 | 0.18 | 0.13 | 2.22 | 0.08 | 0.00 | 0.31 | 0.03 | 0.08 | 0.18 | 0.02 | 0.05 | 0.08 | 0.44 | 0.21 | 0.16 | 0.32 | |
| UG3 surface | Avg | 16.19 | 0.49 | 2.33 | 70.77 | 0.36 | 0.67 | 7.14 | 0.10 | 0.63 | 0.59 | 0.05 | 0.04 | 0.10 | 0.16 | 0.18 | 0.09 | 0.14 |
| std | 1.29 | 0.05 | 0.08 | 0.32 | 0.00 | 0.04 | 0.66 | 0.01 | 0.21 | 0.12 | 0.06 | 0.05 | 0.13 | 0.04 | 0.07 | 0.04 | 0.20 | |
| UG4 bulk | Avg | 16.13 | 0.67 | 2.39 | 70.17 | 0.25 | 0.76 | 7.22 | 0.15 | 0.40 | 0.77 | 0.03 | 0.06 | 0.21 | 0.28 | 0.12 | 0.25 | 0.15 |
| std | 2.51 | 0.10 | 0.06 | 1.61 | 0.11 | 0.06 | 0.21 | 0.10 | 0.17 | 0.06 | 0.03 | 0.07 | 0.13 | 0.29 | 0.16 | 0.14 | 0.03 | |
| UG4 surface | Avg | 13.51 | 0.52 | 2.51 | 71.73 | 0.21 | 1.00 | 7.63 | 0.20 | 0.57 | 0.70 | 0.07 | 0.14 | 0.16 | 0.18 | 0.32 | 0.19 | 0.40 |
| std | 0.28 | 0.00 | 0.29 | 0.52 | 0.05 | 0.21 | 0.12 | 0.03 | 0.00 | 0.09 | 0.06 | 0.12 | 0.22 | 0.21 | 0.45 | 0.02 | 0.06 | |
| MG7 bulk | Avg | 13.76 | 0.64 | 2.04 | 72.06 | 0.36 | 0.80 | 7.67 | 0.26 | 0.31 | 0.59 | bd | 0.10 | 0.08 | 0.66 | 0.40 | bd | 0.27 |
| std | 0.23 | 0.11 | 0.22 | 0.37 | 0.11 | 0.03 | 0.42 | 0.23 | 0.12 | 0.12 | bd | 0.09 | 0.37 | 0.25 | 0.35 | bd | 0.32 | |
| MG7 surface | Avg | 2.57 | 1.90 | 14.64 | 58.01 | bd | 1.42 | 7.43 | bd | 1.28 | 8.63 | bd | bd | 1.56 | bd | 1.55 | 1.00 | bd |
| std | 2.13 | 0.64 | 5.02 | 5.20 | bd | 0.04 | 1.20 | bd | 0.18 | 0.76 | bd | bd | 1.50 | bd | 0.06 | 0.13 | bd | |
| MG15 bulk | Avg | 16.83 | 0.54 | 2.31 | 68.94 | 0.26 | 1.53 | 6.52 | 0.19 | 0.32 | 0.62 | 0.07 | bd | 0.56 | 0.46 | 0.21 | 0.29 | 0.37 |
| std | 1.54 | 0.12 | 0.10 | 1.74 | 0.09 | 0.80 | 0.25 | 0.02 | 0.01 | 0.04 | 0.02 | bd | 0.21 | 0.21 | 0.28 | 0.13 | 0.13 | |
| MG15 surface | Avg | 0.41 | 0.35 | 2.43 | 81.41 | 0.17 | 1.32 | 9.87 | 0.32 | 0.82 | 1.01 | bd | bd | 0.83 | 0.66 | 0.30 | 0.10 | bd |
| std | 0.13 | 0.00 | 0.13 | 0.28 | 0.03 | 0.06 | 2.38 | 0.16 | 0.49 | 0.43 | bd | bd | 0.32 | 0.01 | 0.23 | 0.00 | bd | |
| MG19 bulk | Avg | 17.94 | 0.61 | 2.26 | 69.69 | 0.27 | 0.70 | 6.72 | 0.07 | 0.23 | 0.43 | 0.03 | 0.08 | 0.26 | 0.25 | 0.24 | 0.11 | 0.09 |
| std | 2.39 | 0.12 | 0.08 | 2.14 | 0.08 | 0.14 | 0.35 | 0.01 | 0.02 | 0.10 | 0.04 | 0.06 | 0.37 | 0.19 | 0.34 | 0.16 | 0.13 | |
| MG19 surface | Avg | 0.31 | 0.80 | 2.96 | 85.36 | 0.37 | 0.61 | 7.12 | 0.03 | 0.31 | 0.81 | 0.14 | 0.04 | 0.07 | 0.61 | 0.08 | 0.17 | 0.22 |
| std | 0.27 | 0.22 | 0.12 | 1.34 | 0.01 | 0.76 | 0.62 | 0.02 | 0.01 | 0.24 | 0.01 | 0.06 | 0.10 | 0.13 | 0.11 | 0.17 | 0.30 | |
| Sample | Melting Temperature °C | Gathering Temperature °C | Stiffening Temperature °C |
|---|---|---|---|
| MG7 | 1230 | 1148 | 706 |
| MG15 | 1211 | 1128 | 688 |
| MG19 | 1201 | 1120 | 684 |
| UG2 | 1206 | 1124 | 689 |
| UG3 | 1208 | 1126 | 688 |
| UG4 | 1217 | 1135 | 695 |
Publisher’s Note: MDPI stays neutral with regard to jurisdictional claims in published maps and institutional affiliations. |
© 2022 by the author. Licensee MDPI, Basel, Switzerland. This article is an open access article distributed under the terms and conditions of the Creative Commons Attribution (CC BY) license (https://creativecommons.org/licenses/by/4.0/).
Share and Cite
Gherardi, F. Compositional and Morphological Investigations of Roman Glass from Cremation Deposits at Birdoswald Fort on Hadrian’s Wall, UK. Heritage 2022, 5, 362-377. https://doi.org/10.3390/heritage5010021
Gherardi F. Compositional and Morphological Investigations of Roman Glass from Cremation Deposits at Birdoswald Fort on Hadrian’s Wall, UK. Heritage. 2022; 5(1):362-377. https://doi.org/10.3390/heritage5010021
Chicago/Turabian StyleGherardi, Francesca. 2022. "Compositional and Morphological Investigations of Roman Glass from Cremation Deposits at Birdoswald Fort on Hadrian’s Wall, UK" Heritage 5, no. 1: 362-377. https://doi.org/10.3390/heritage5010021
APA StyleGherardi, F. (2022). Compositional and Morphological Investigations of Roman Glass from Cremation Deposits at Birdoswald Fort on Hadrian’s Wall, UK. Heritage, 5(1), 362-377. https://doi.org/10.3390/heritage5010021