
Low-Invasive CO2-Based Visual Alerting Systems to Manage Natural Ventilation and Improve IAQ in Historic School Buildings

 , , and
Abstract
:1. Introduction
2. Materials and Methods
- Selection of the case studies (two classrooms each in four schools) and monitoring of indoor air quality in a first winter and summer monitoring campaign.
- Preliminary theoretical study of the ventilation rate necessary to ensure good indoor air quality according to the standard EN 16798-1:2019 [54].
- Installation of the CO2 -based passive visual alerting system in one of the two classrooms monitored in each school.
- Second winter and summer monitoring campaign to test the effectiveness of the installed devices.
- Interviews with school staff to evaluate the effectiveness of the installed system from their point of view.
2.1. Case Studies
2.2. Characteristics of the Classrooms and Monitoring Systems Installed
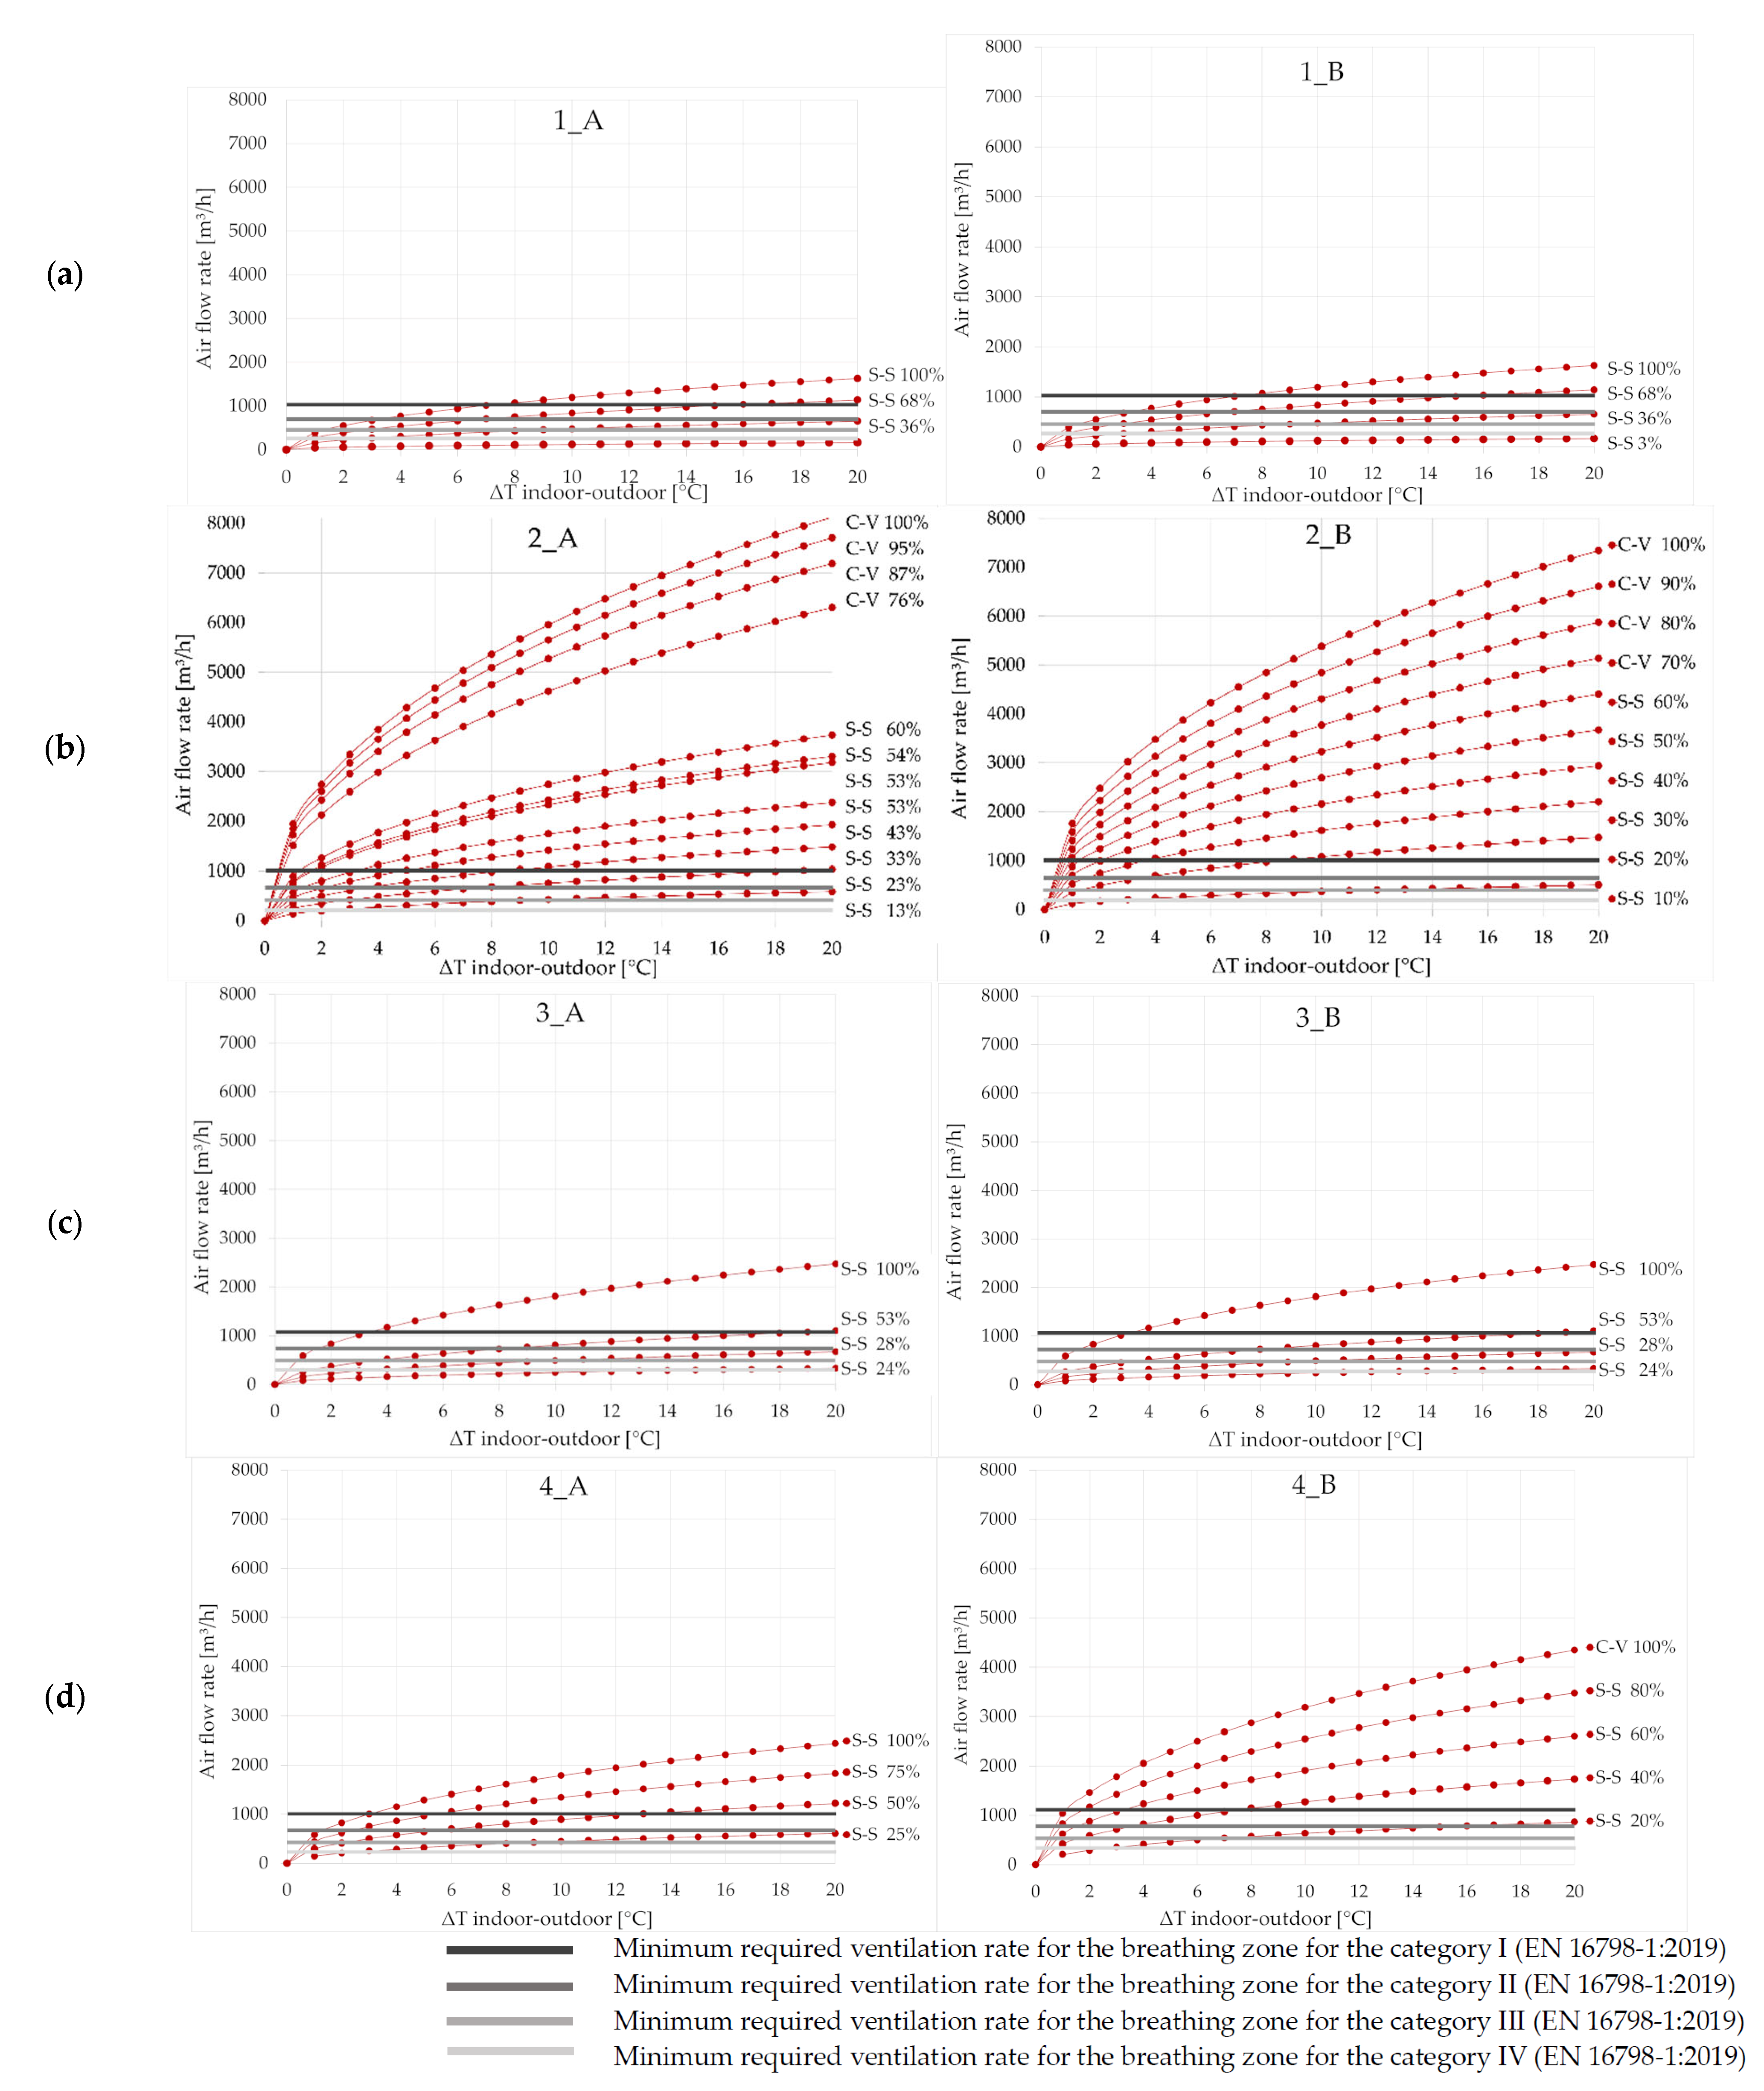
2.3. Ventilation Rate Required for Acceptable Air Quality
2.4. Experimental Methods
- First monitoring campaign 2019–2020 (week 0), before the COVID-19 pandemic. Both classrooms, in the absence of any CO2-based visual system, were monitored using sensors capable of measuring specific pollutants. This week has been used as baseline, in order to assess the preliminary air quality.
- Data analysis to understand the most dominant pollutants influencing air quality in the classrooms and their concentrations.
- CO2 identified as the main pollutant that affected the IAQ in the classrooms, with levels higher than those permitted by the standard EN 16798-1:2019 [54].
- Once the problem has been identified, the CO2-based passive visual alerting system was installed in one of the two classrooms.
- Second monitoring campaign 2020–2021 (week 1–week 2), during the COVID-19 pandemic. Both classrooms were monitored to test the effectiveness of the CO2-based visual system comparing the results recorded in the classroom with the device installed and the classroom without it.
2.4.1. Installation of the Passive CO2-Based Visual Alerting System
2.4.2. Information Collected by School Representatives
3. Results and Discussion
- Analysis of the results within the same week, hence similar boundary conditions, such as external temperatures, occupancy, and rules regarding COVID-19 pandemic, for the two classrooms, one with the device (A) and one without (B).
- Analysis of the results comparing week 1 and week 2, in order to see if there are improvements in IAQ and possible changes in the occupant behavior.
- Analysis of the responses derived from the interviews.
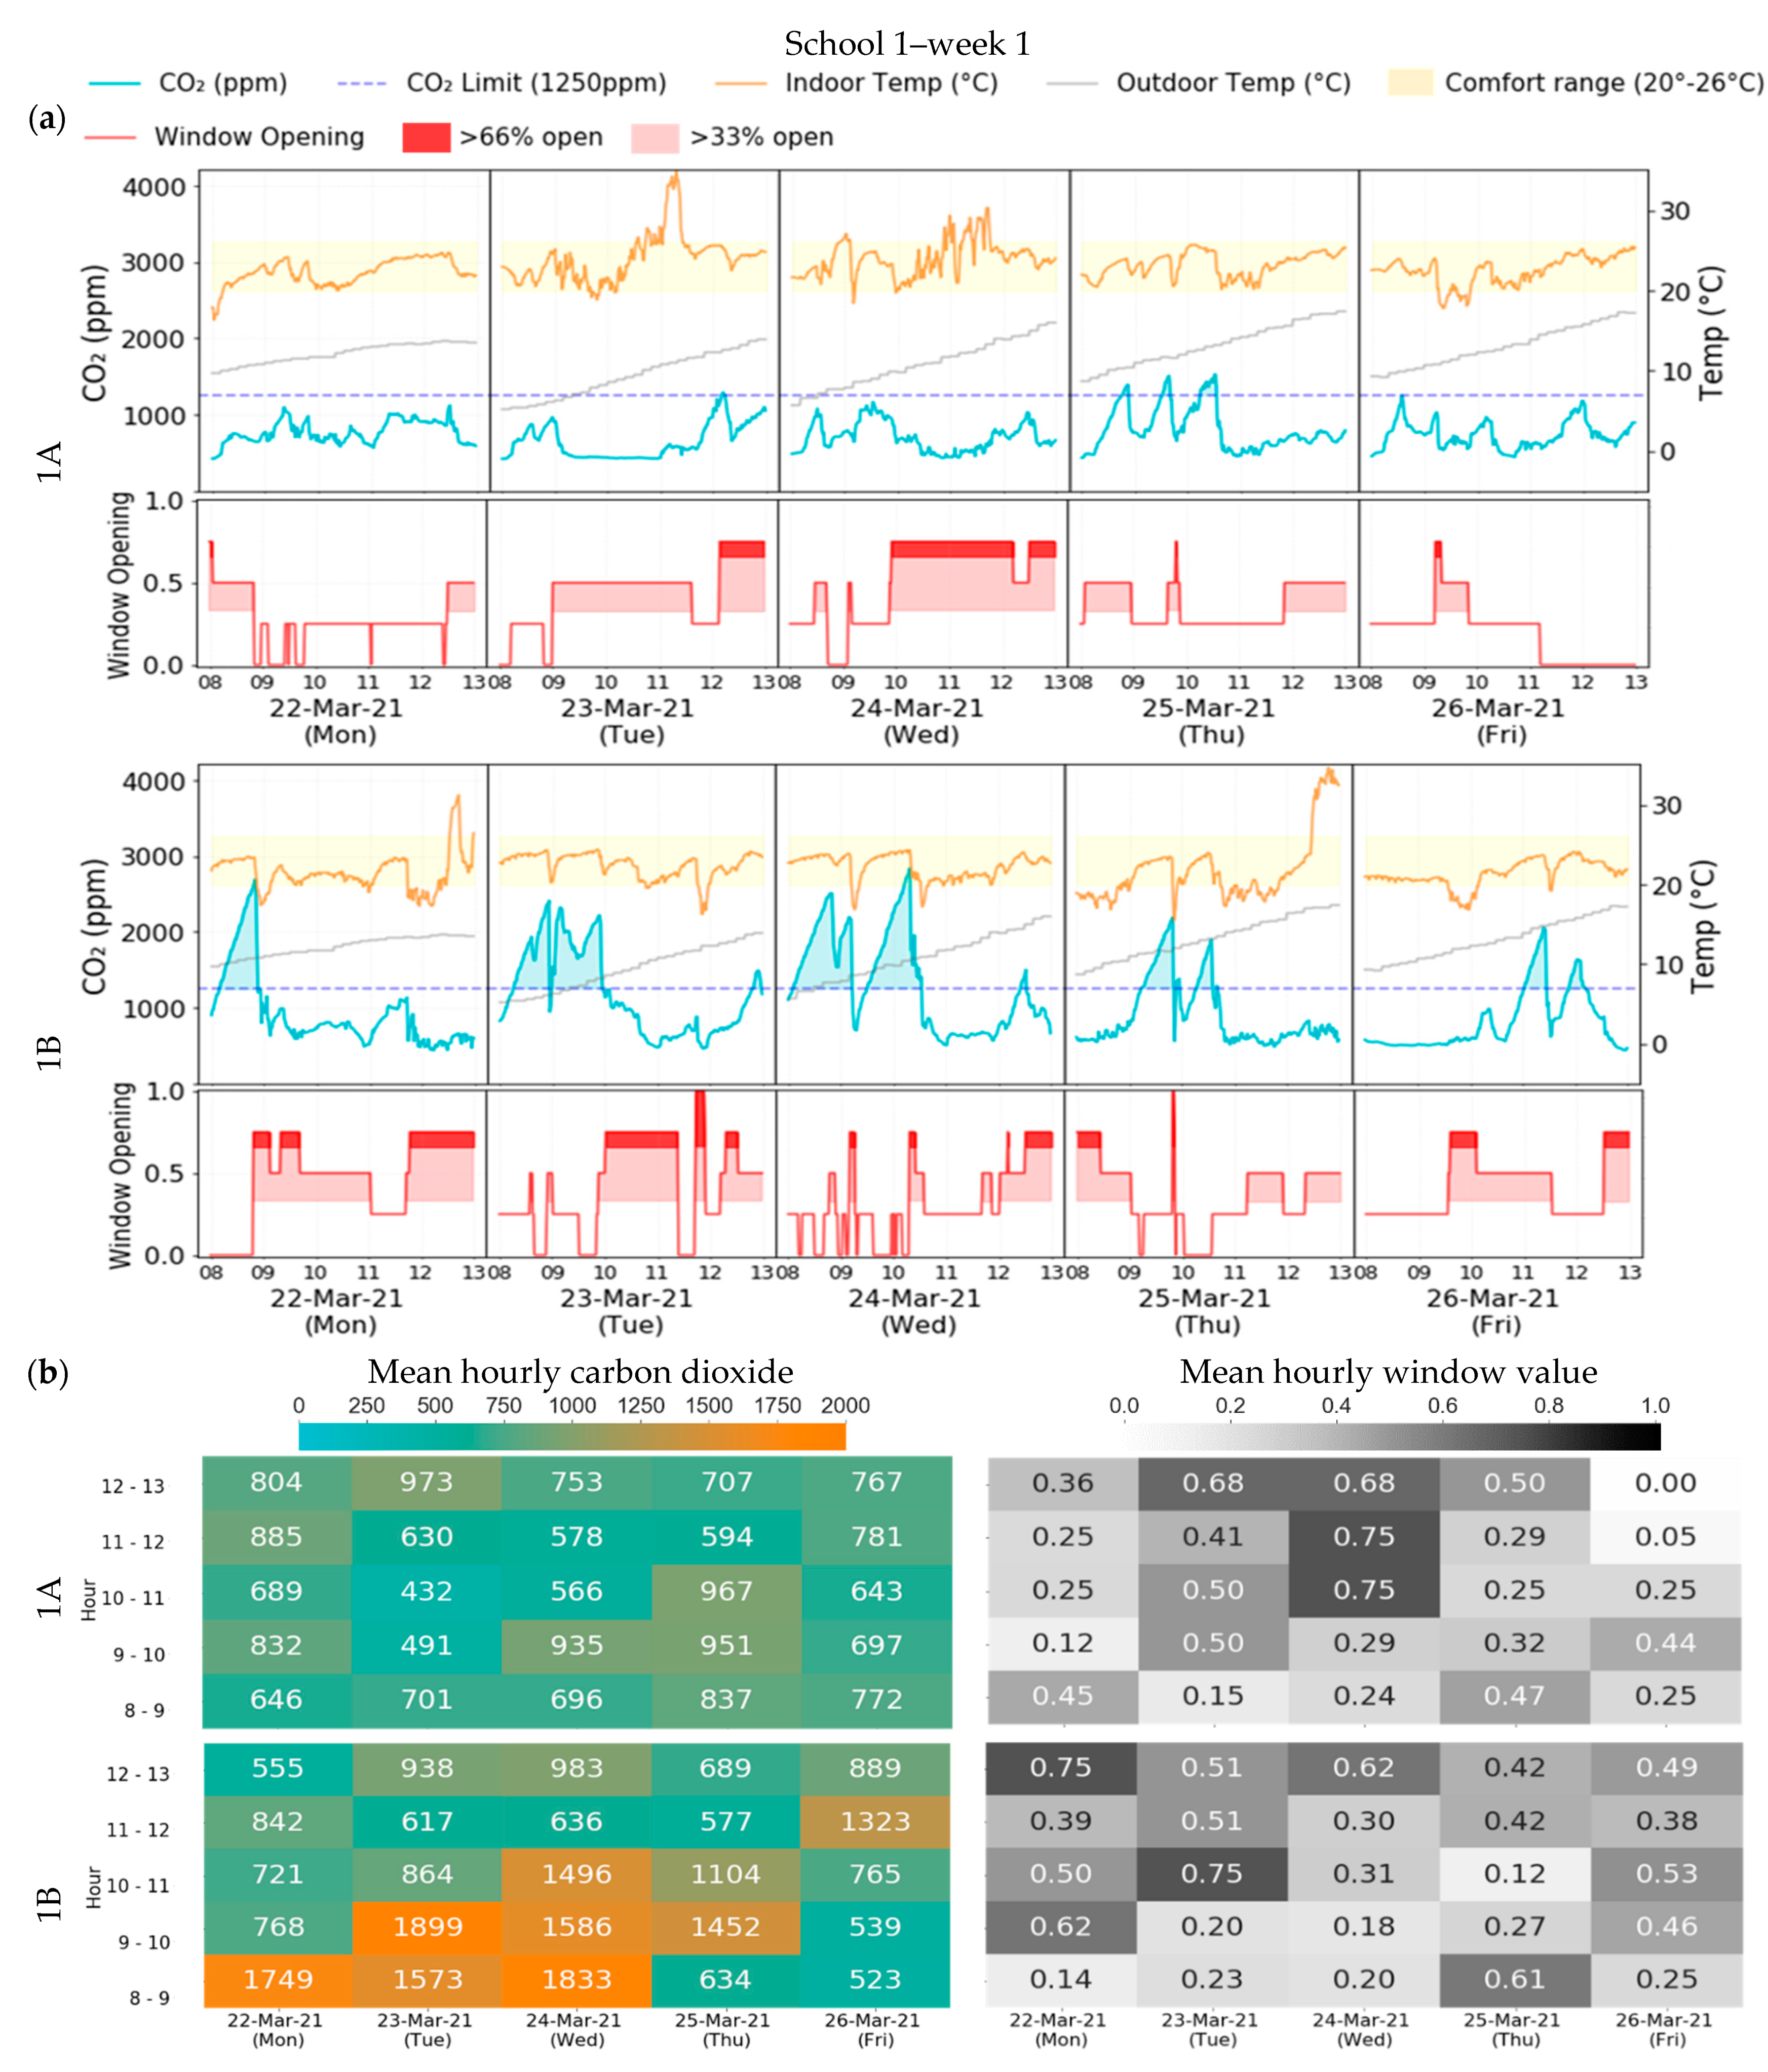
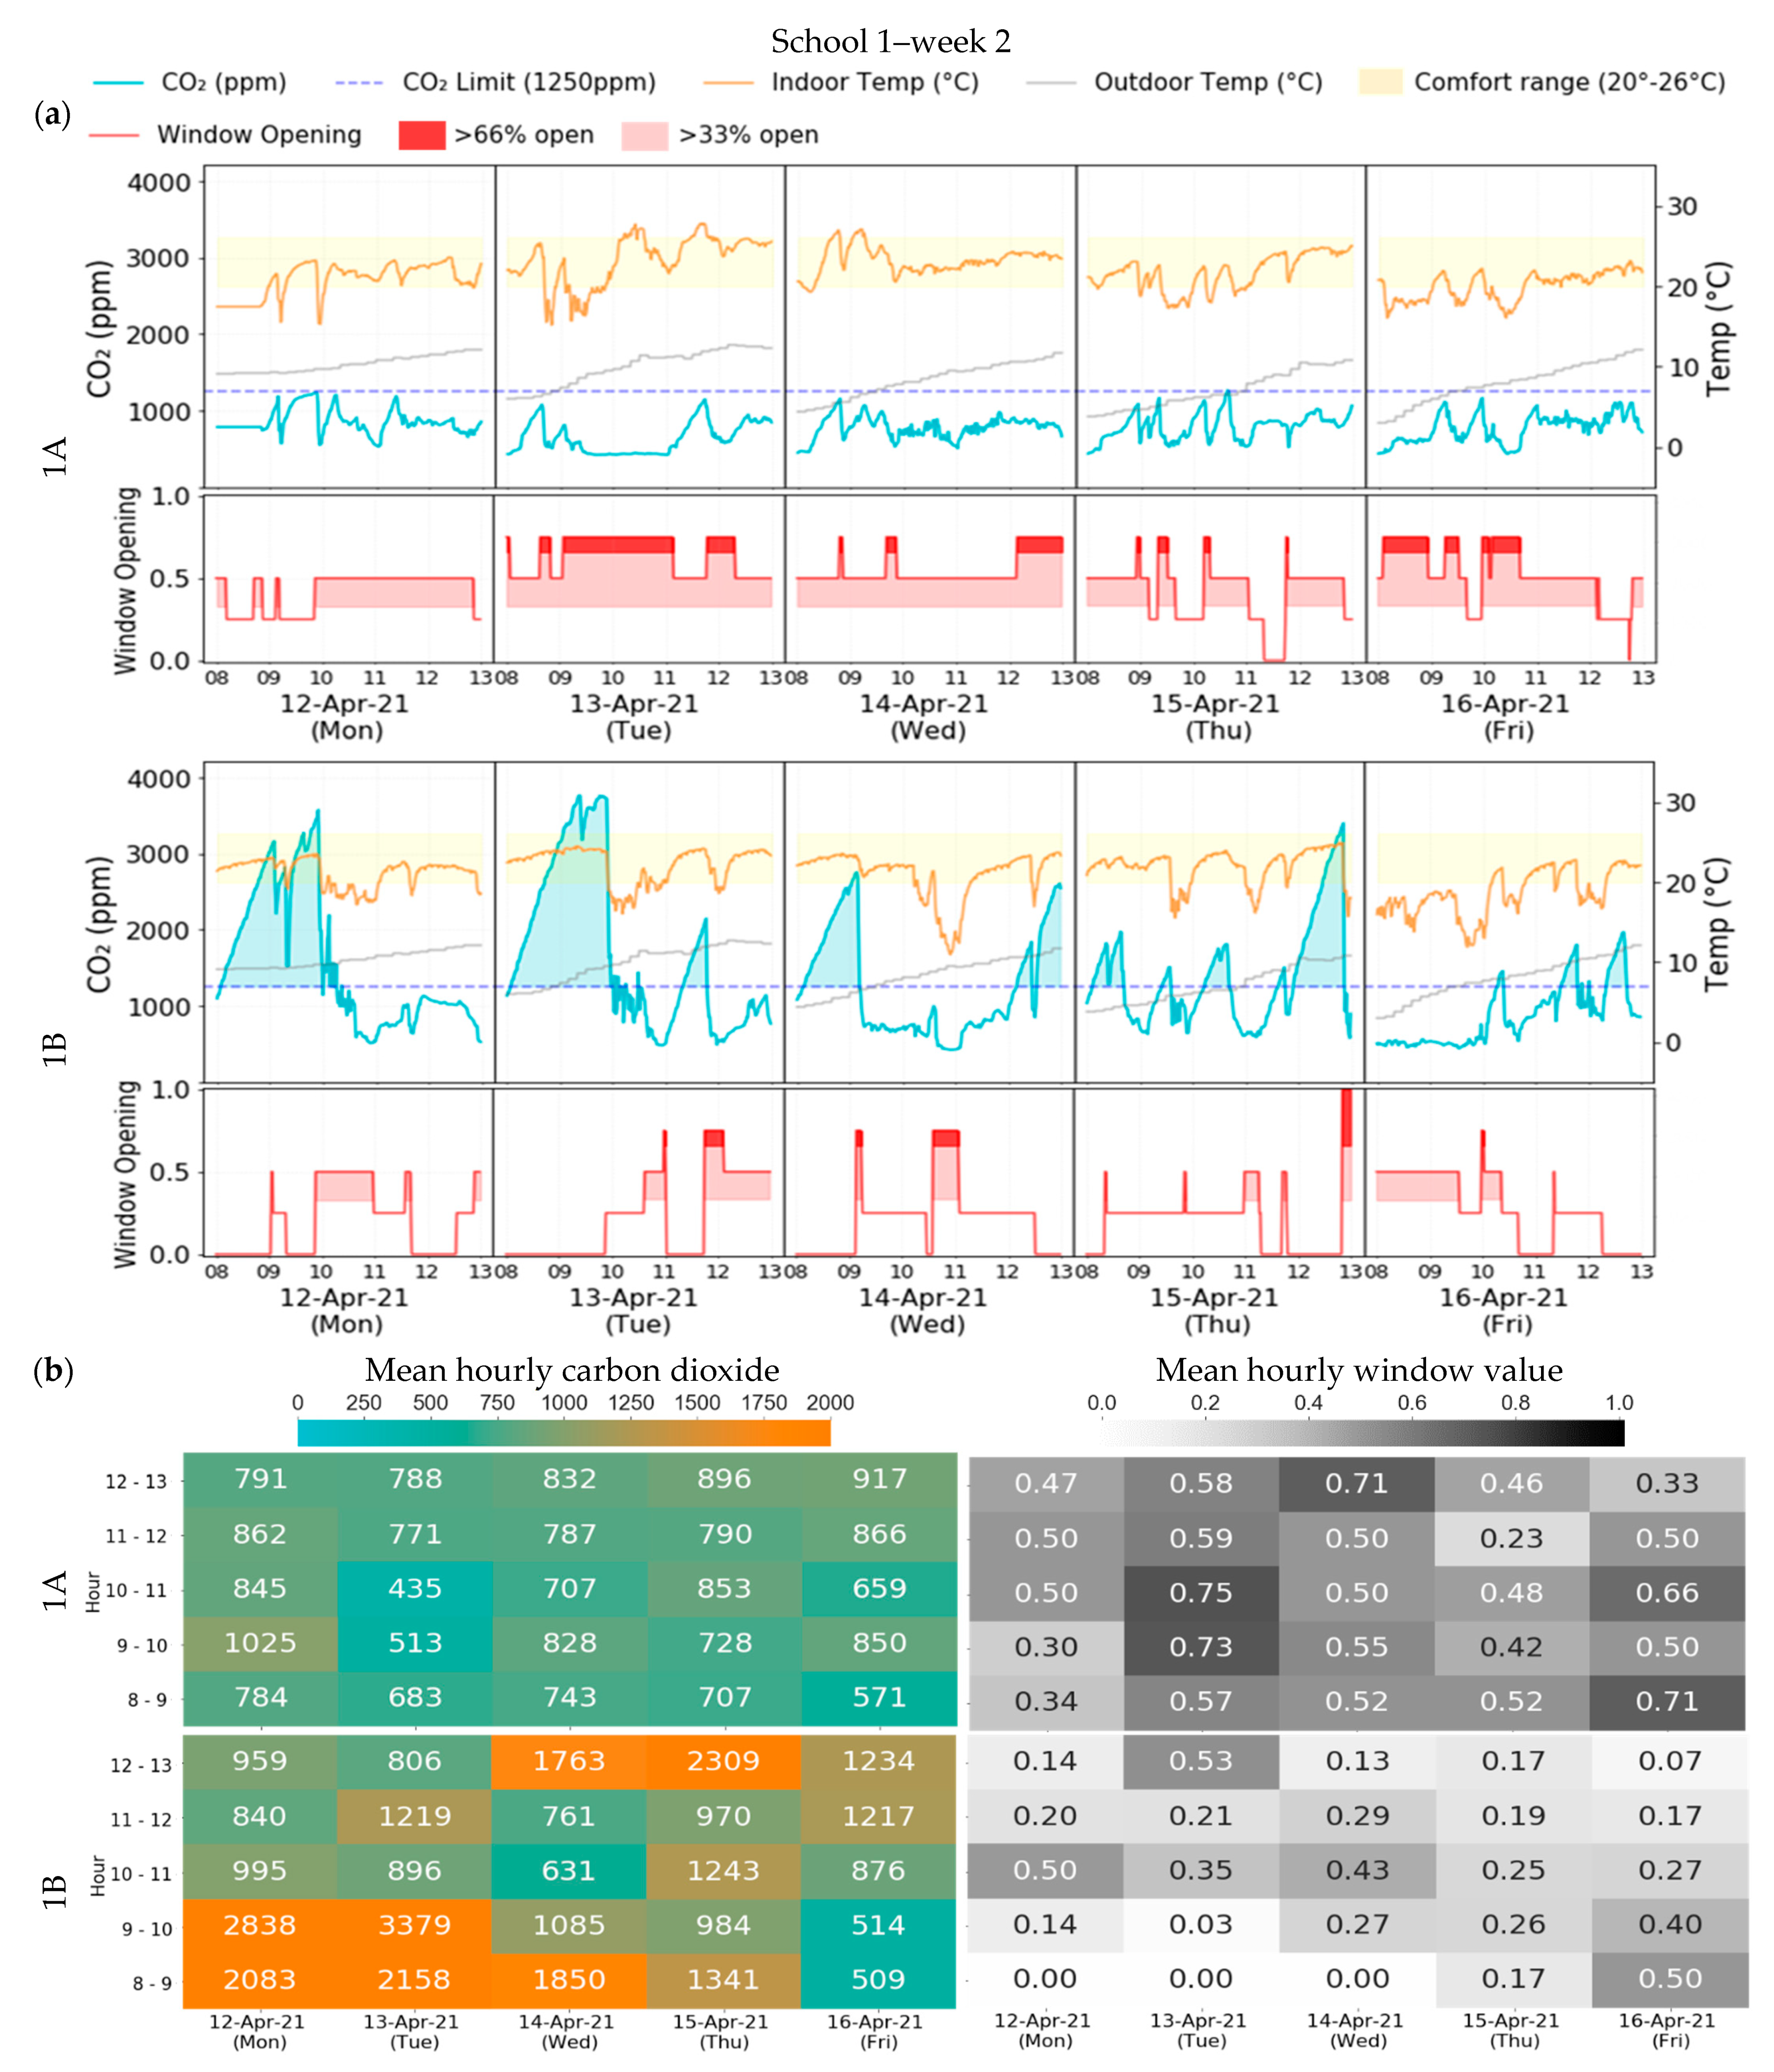
3.1. School 1
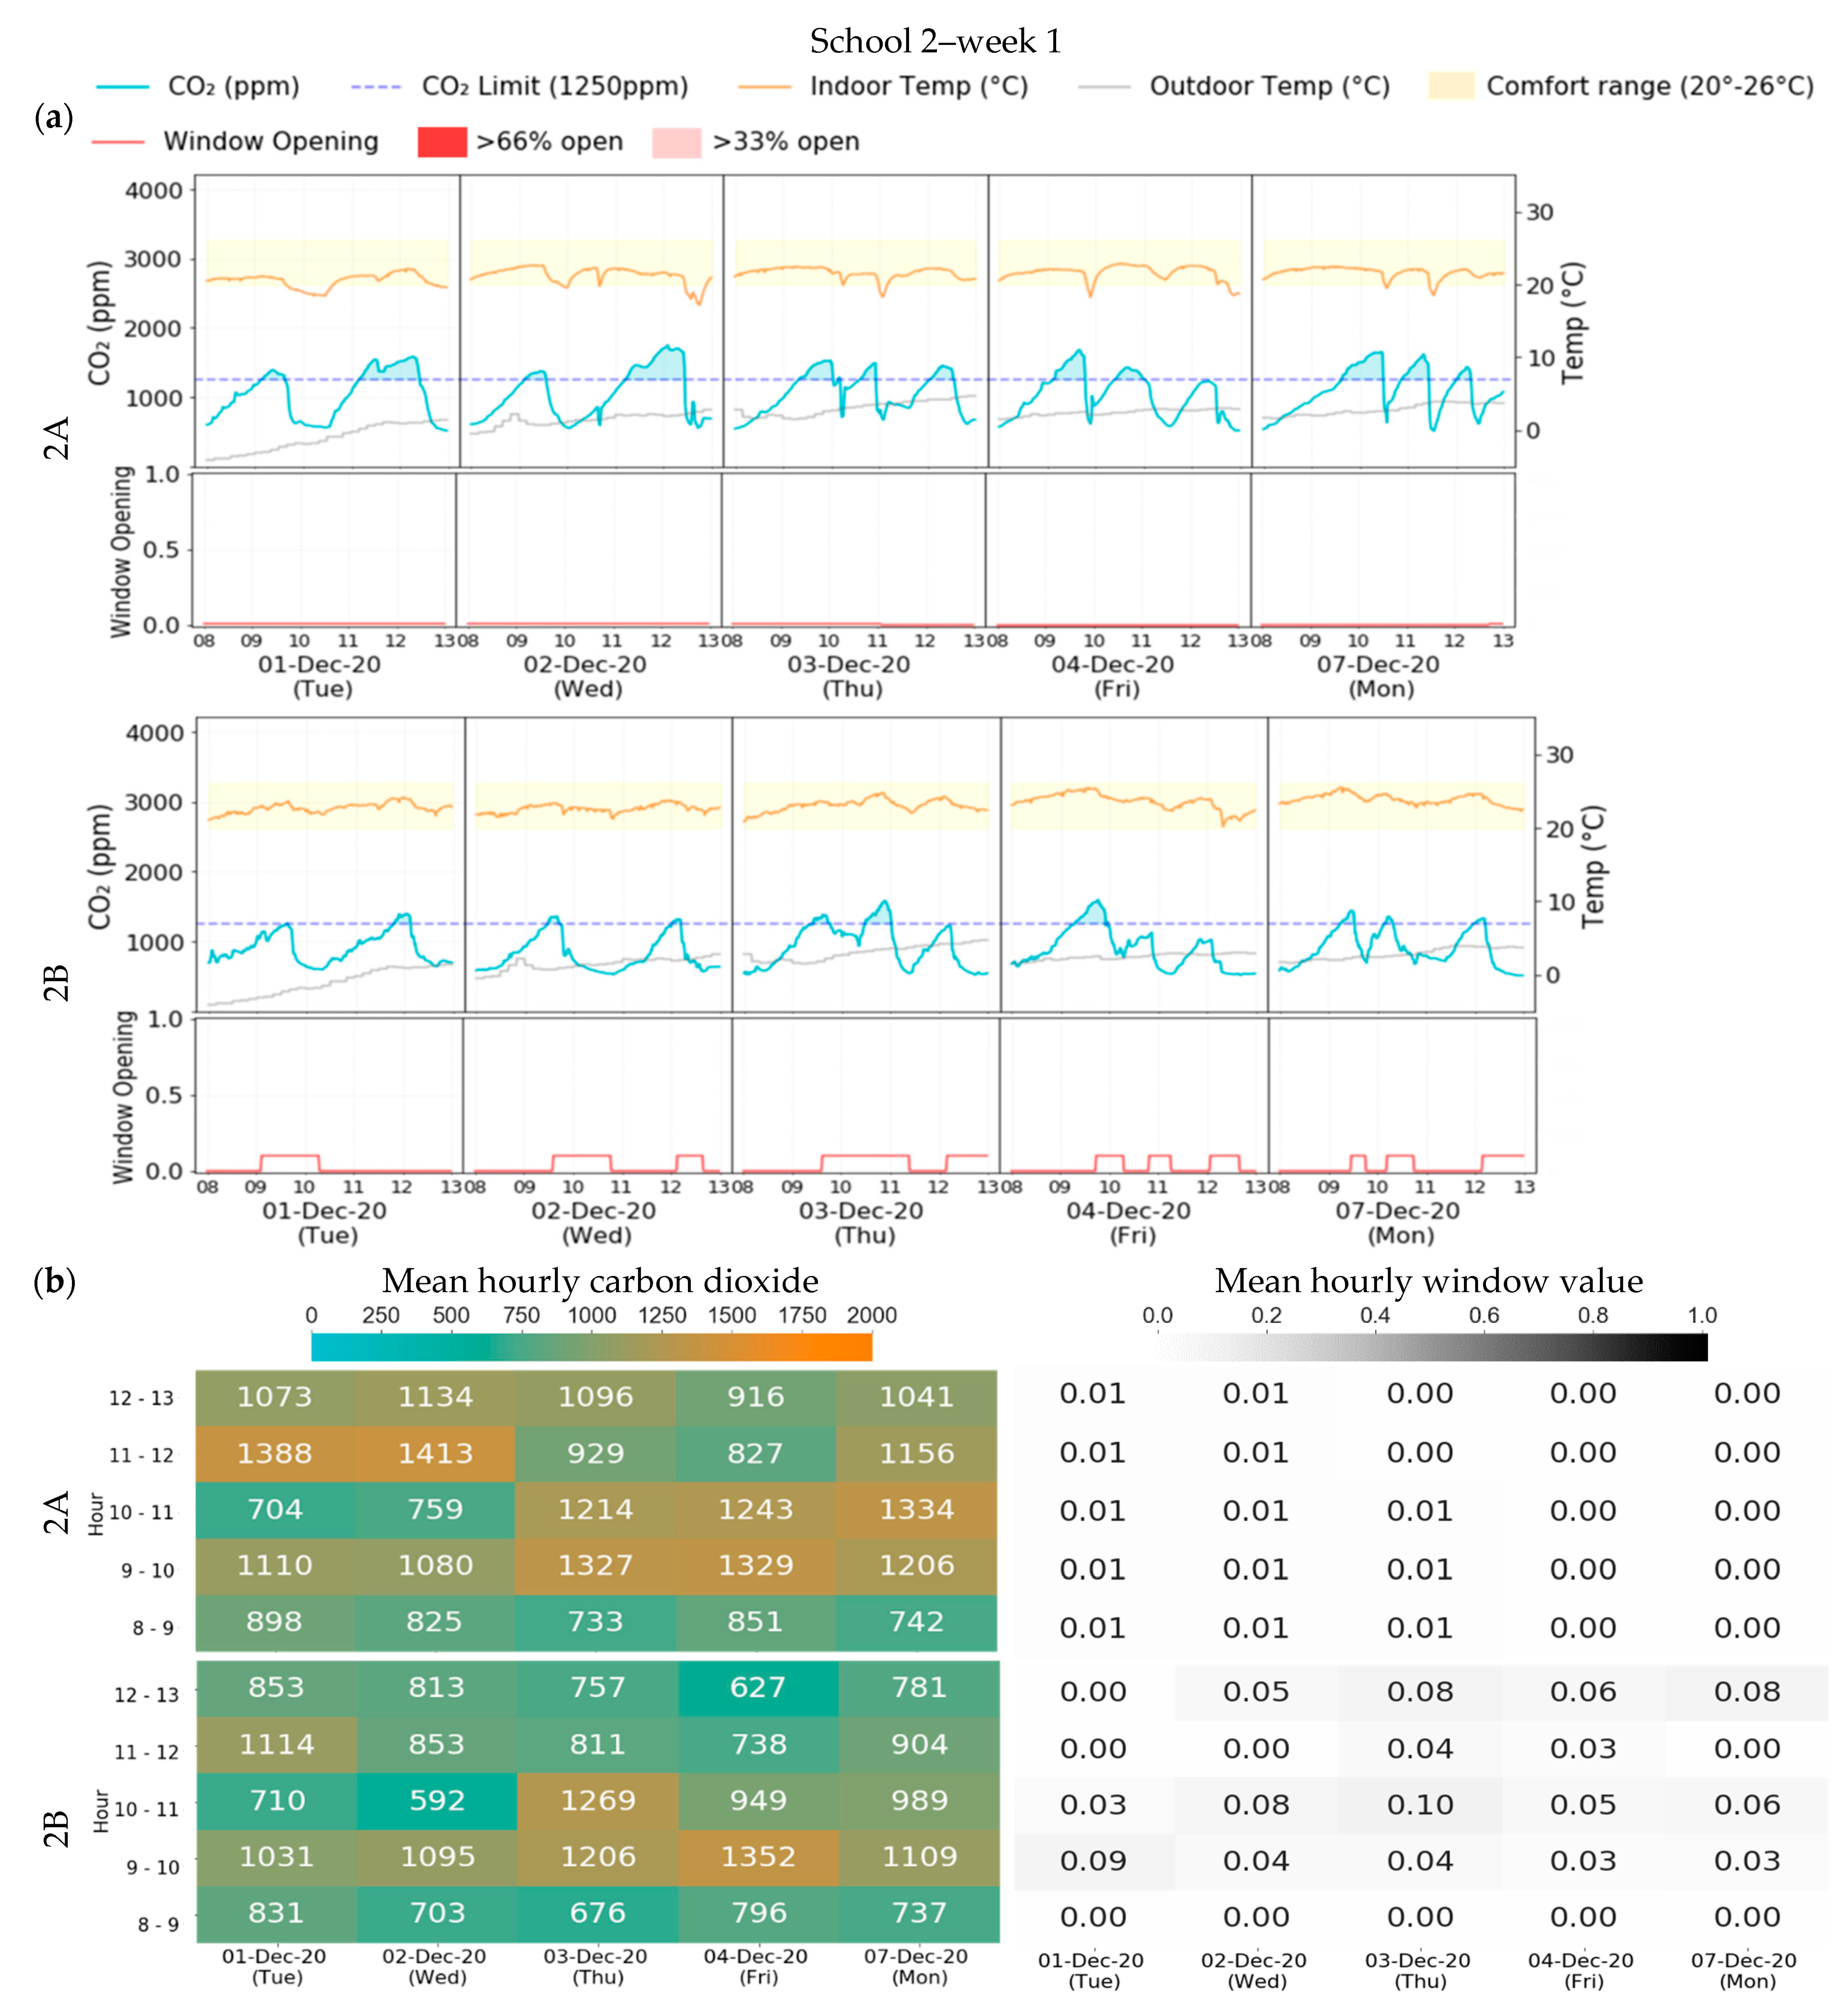
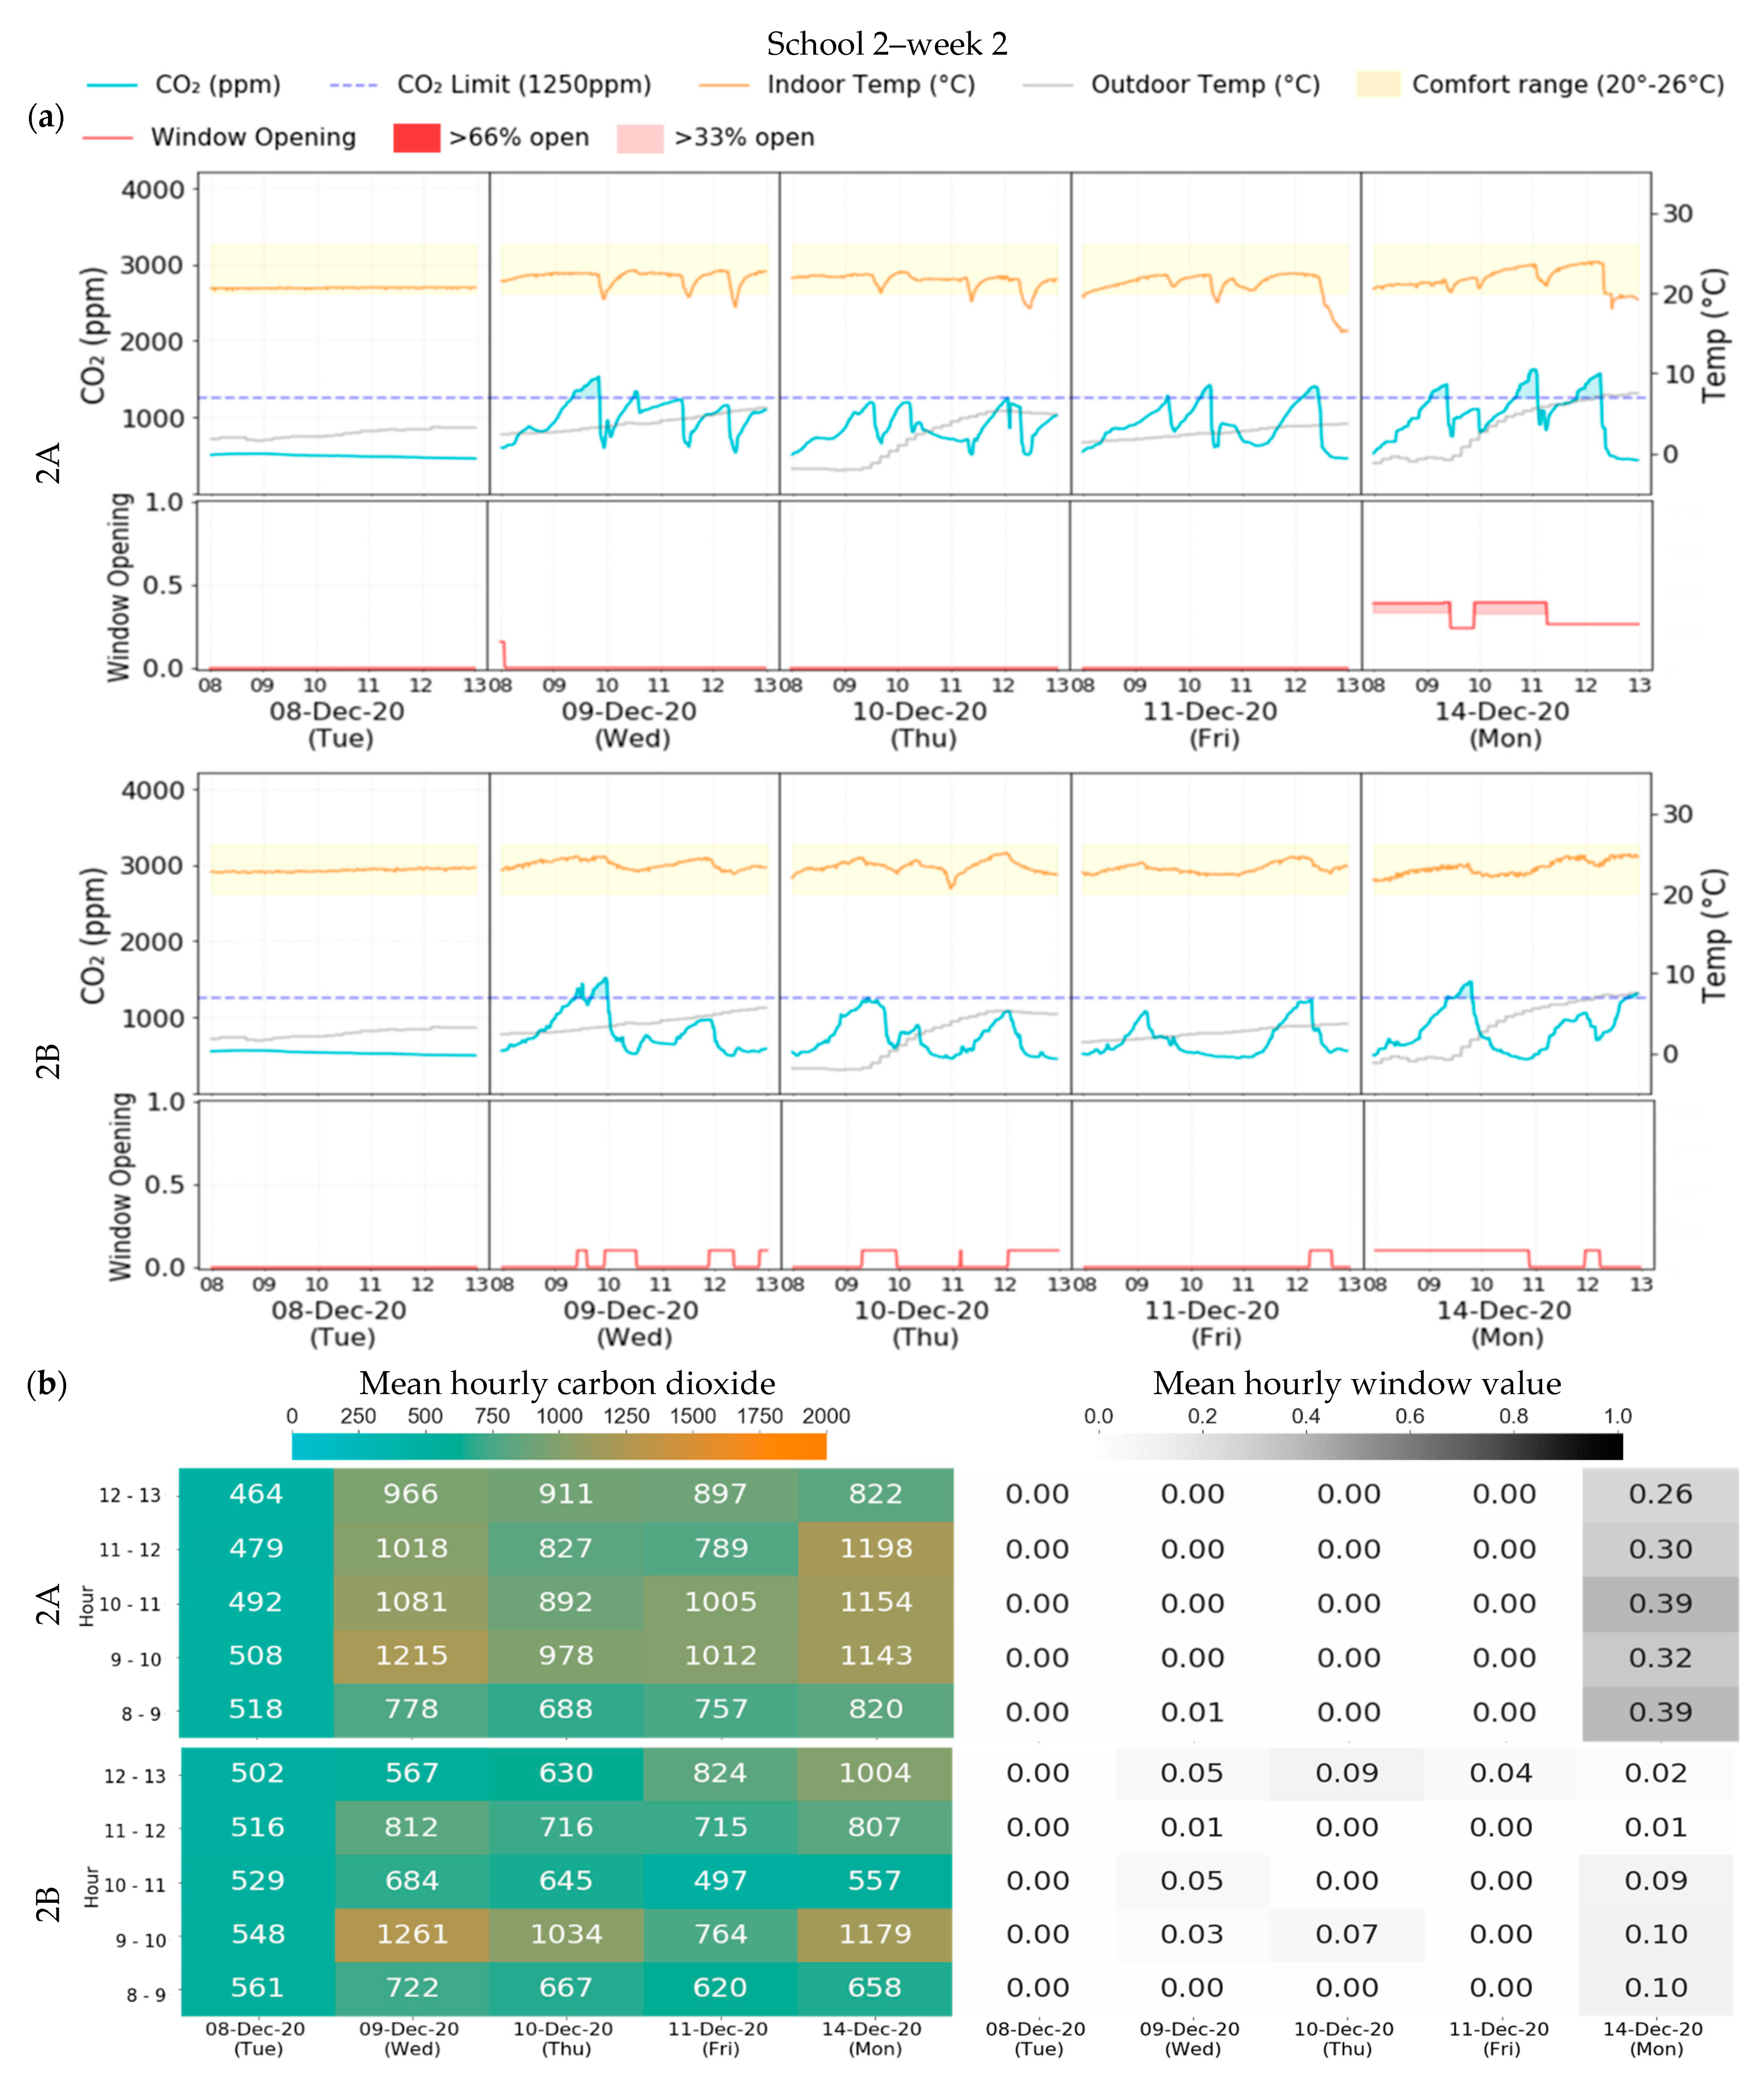
3.2. School 2
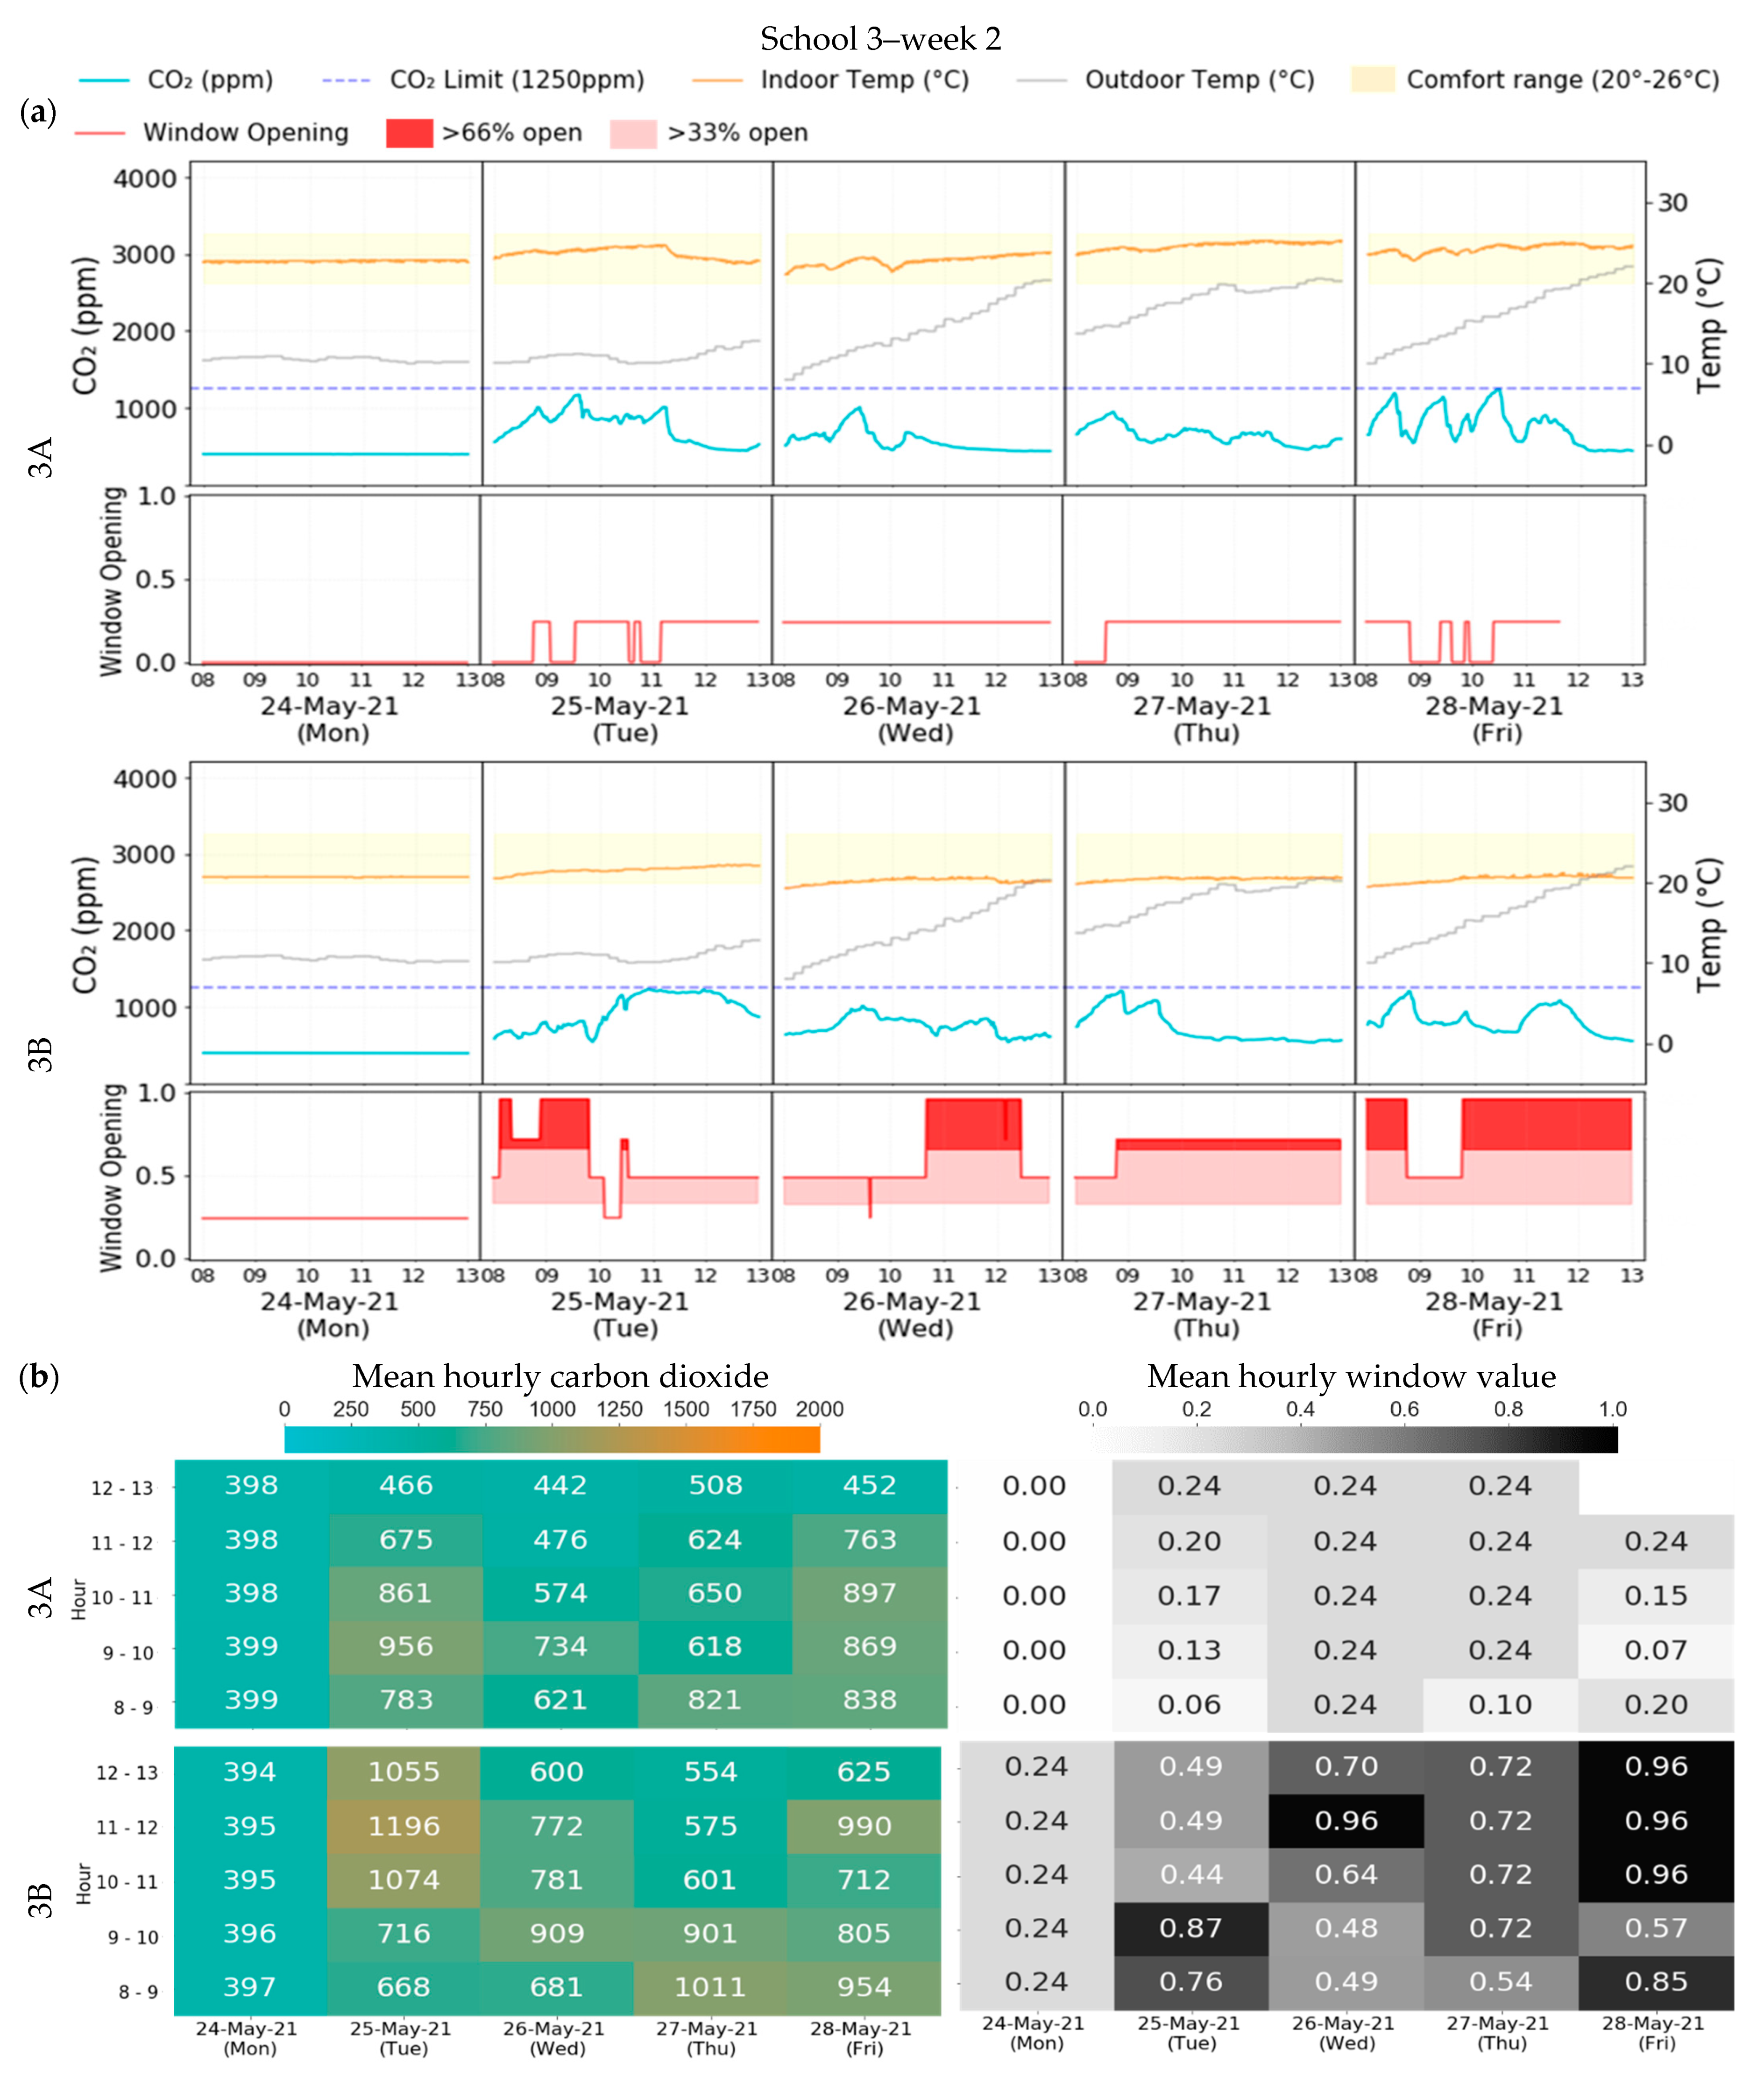
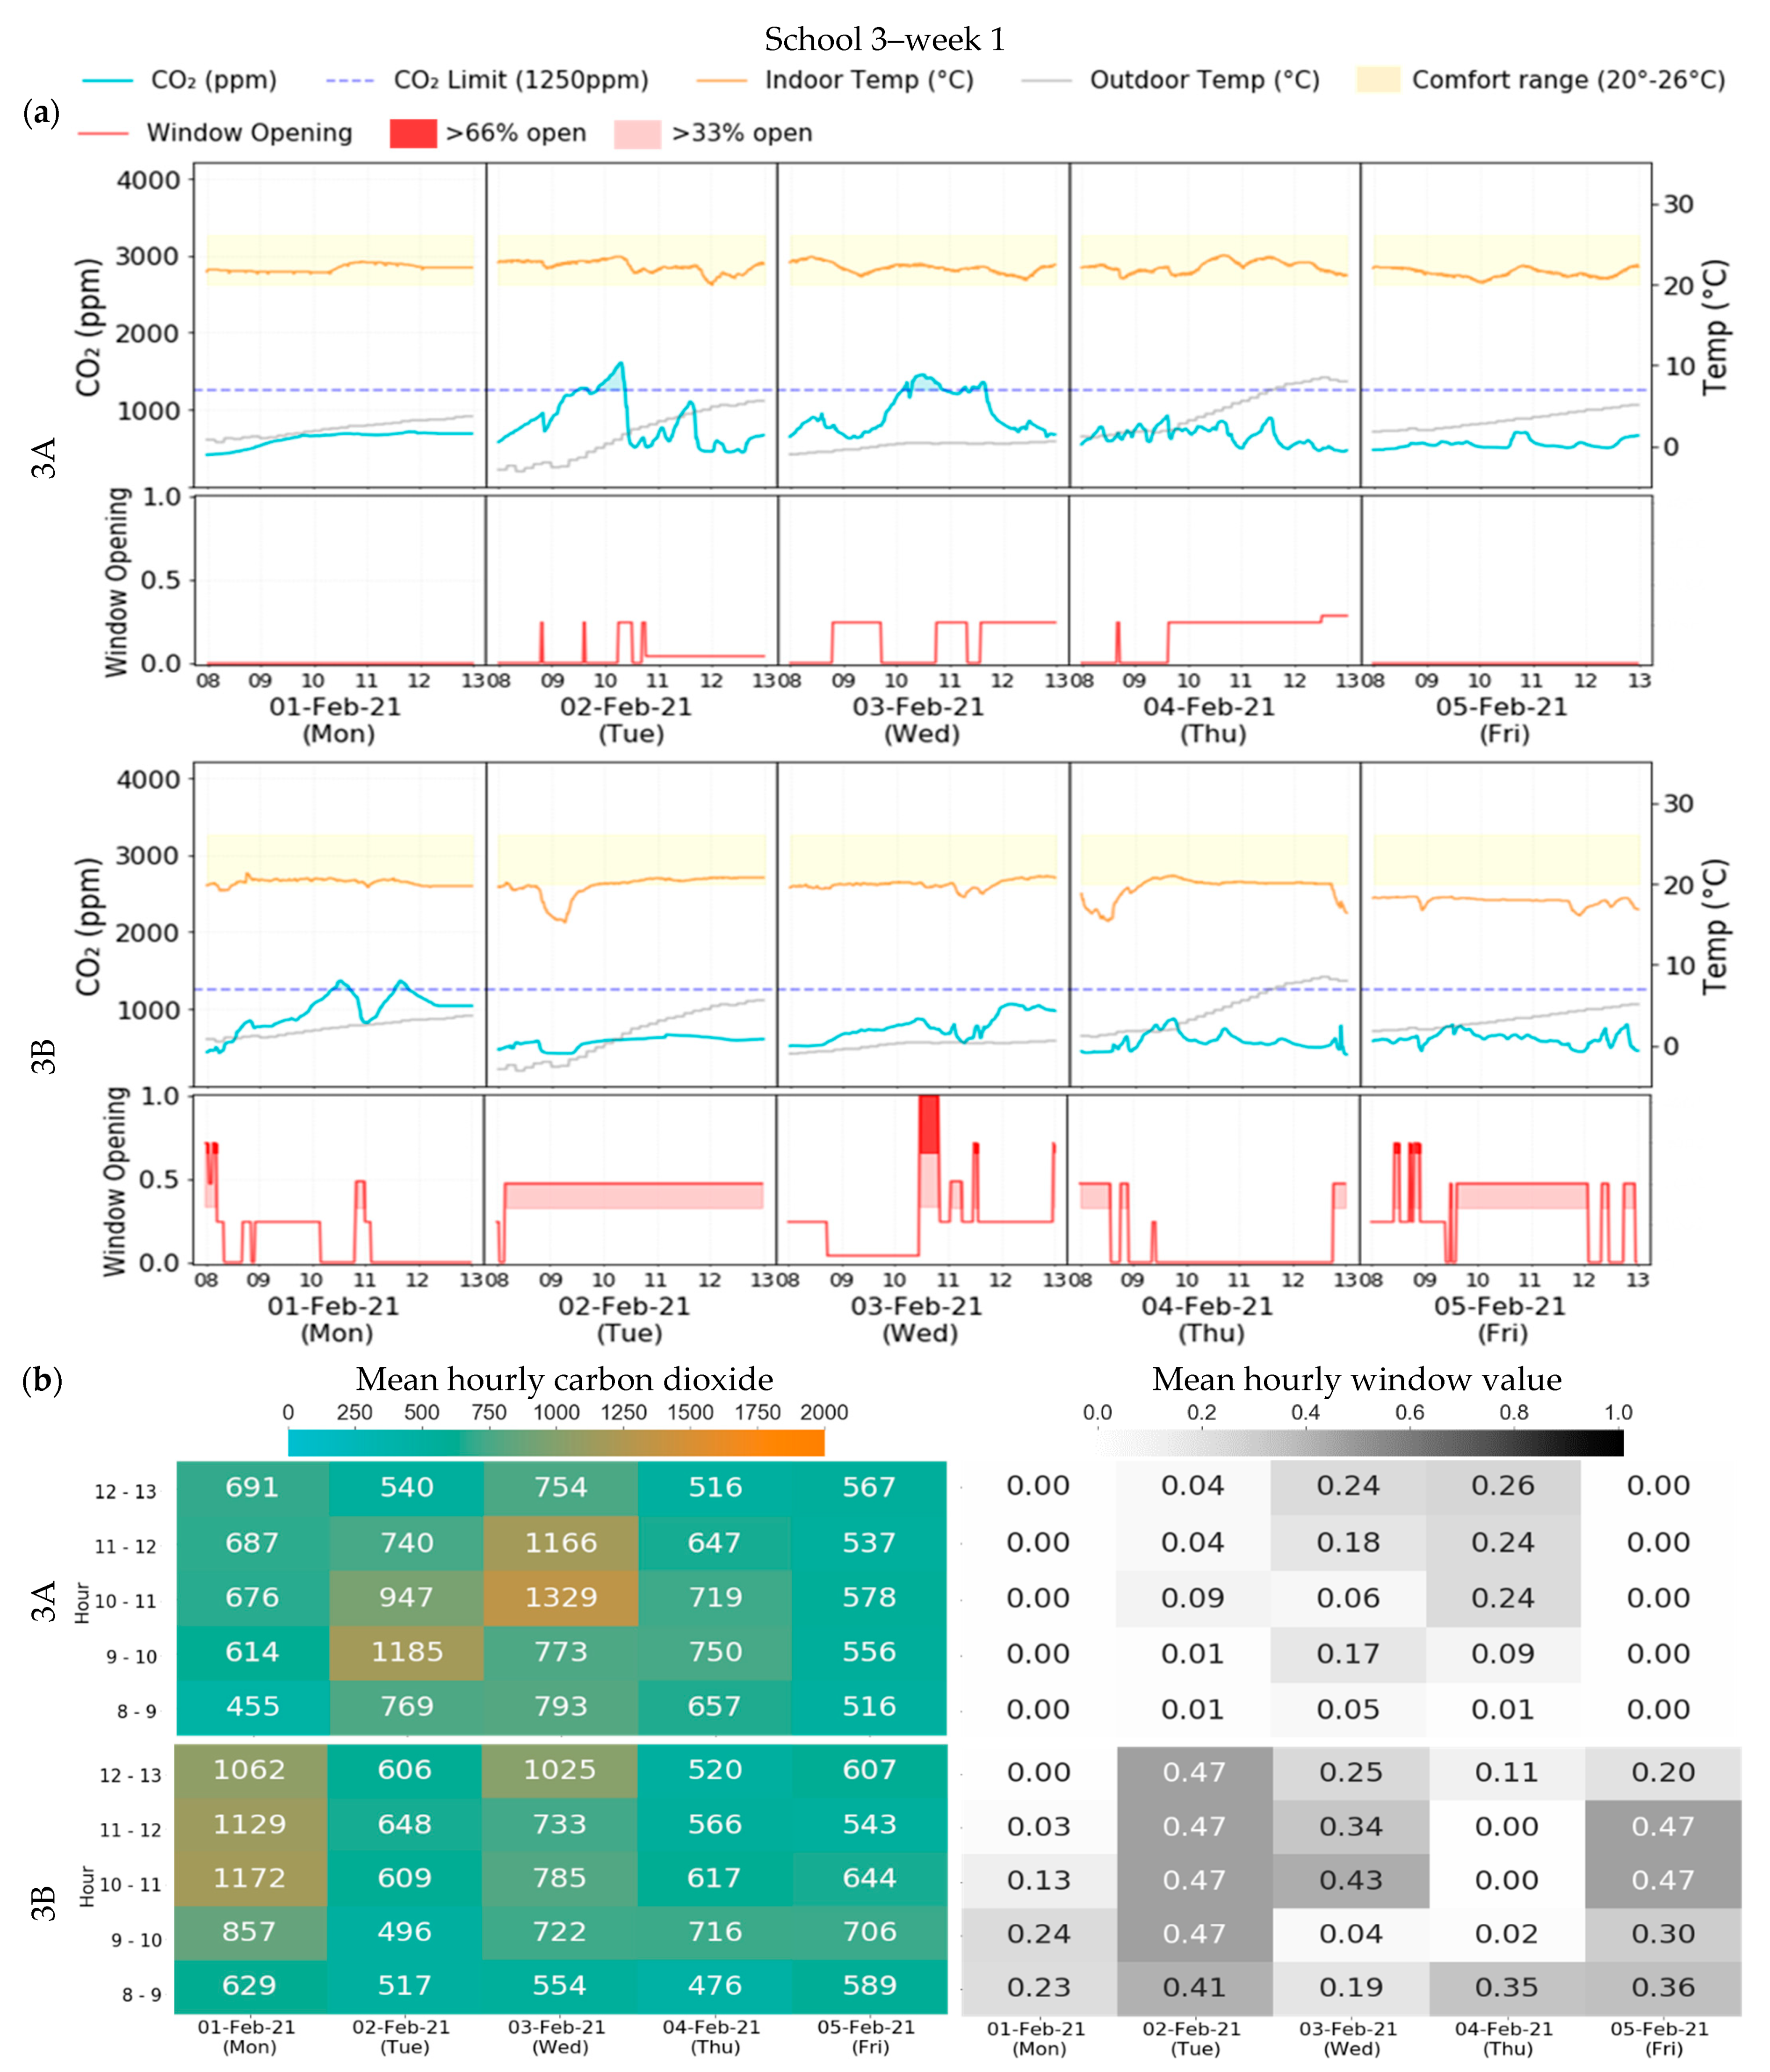
3.3. School 3
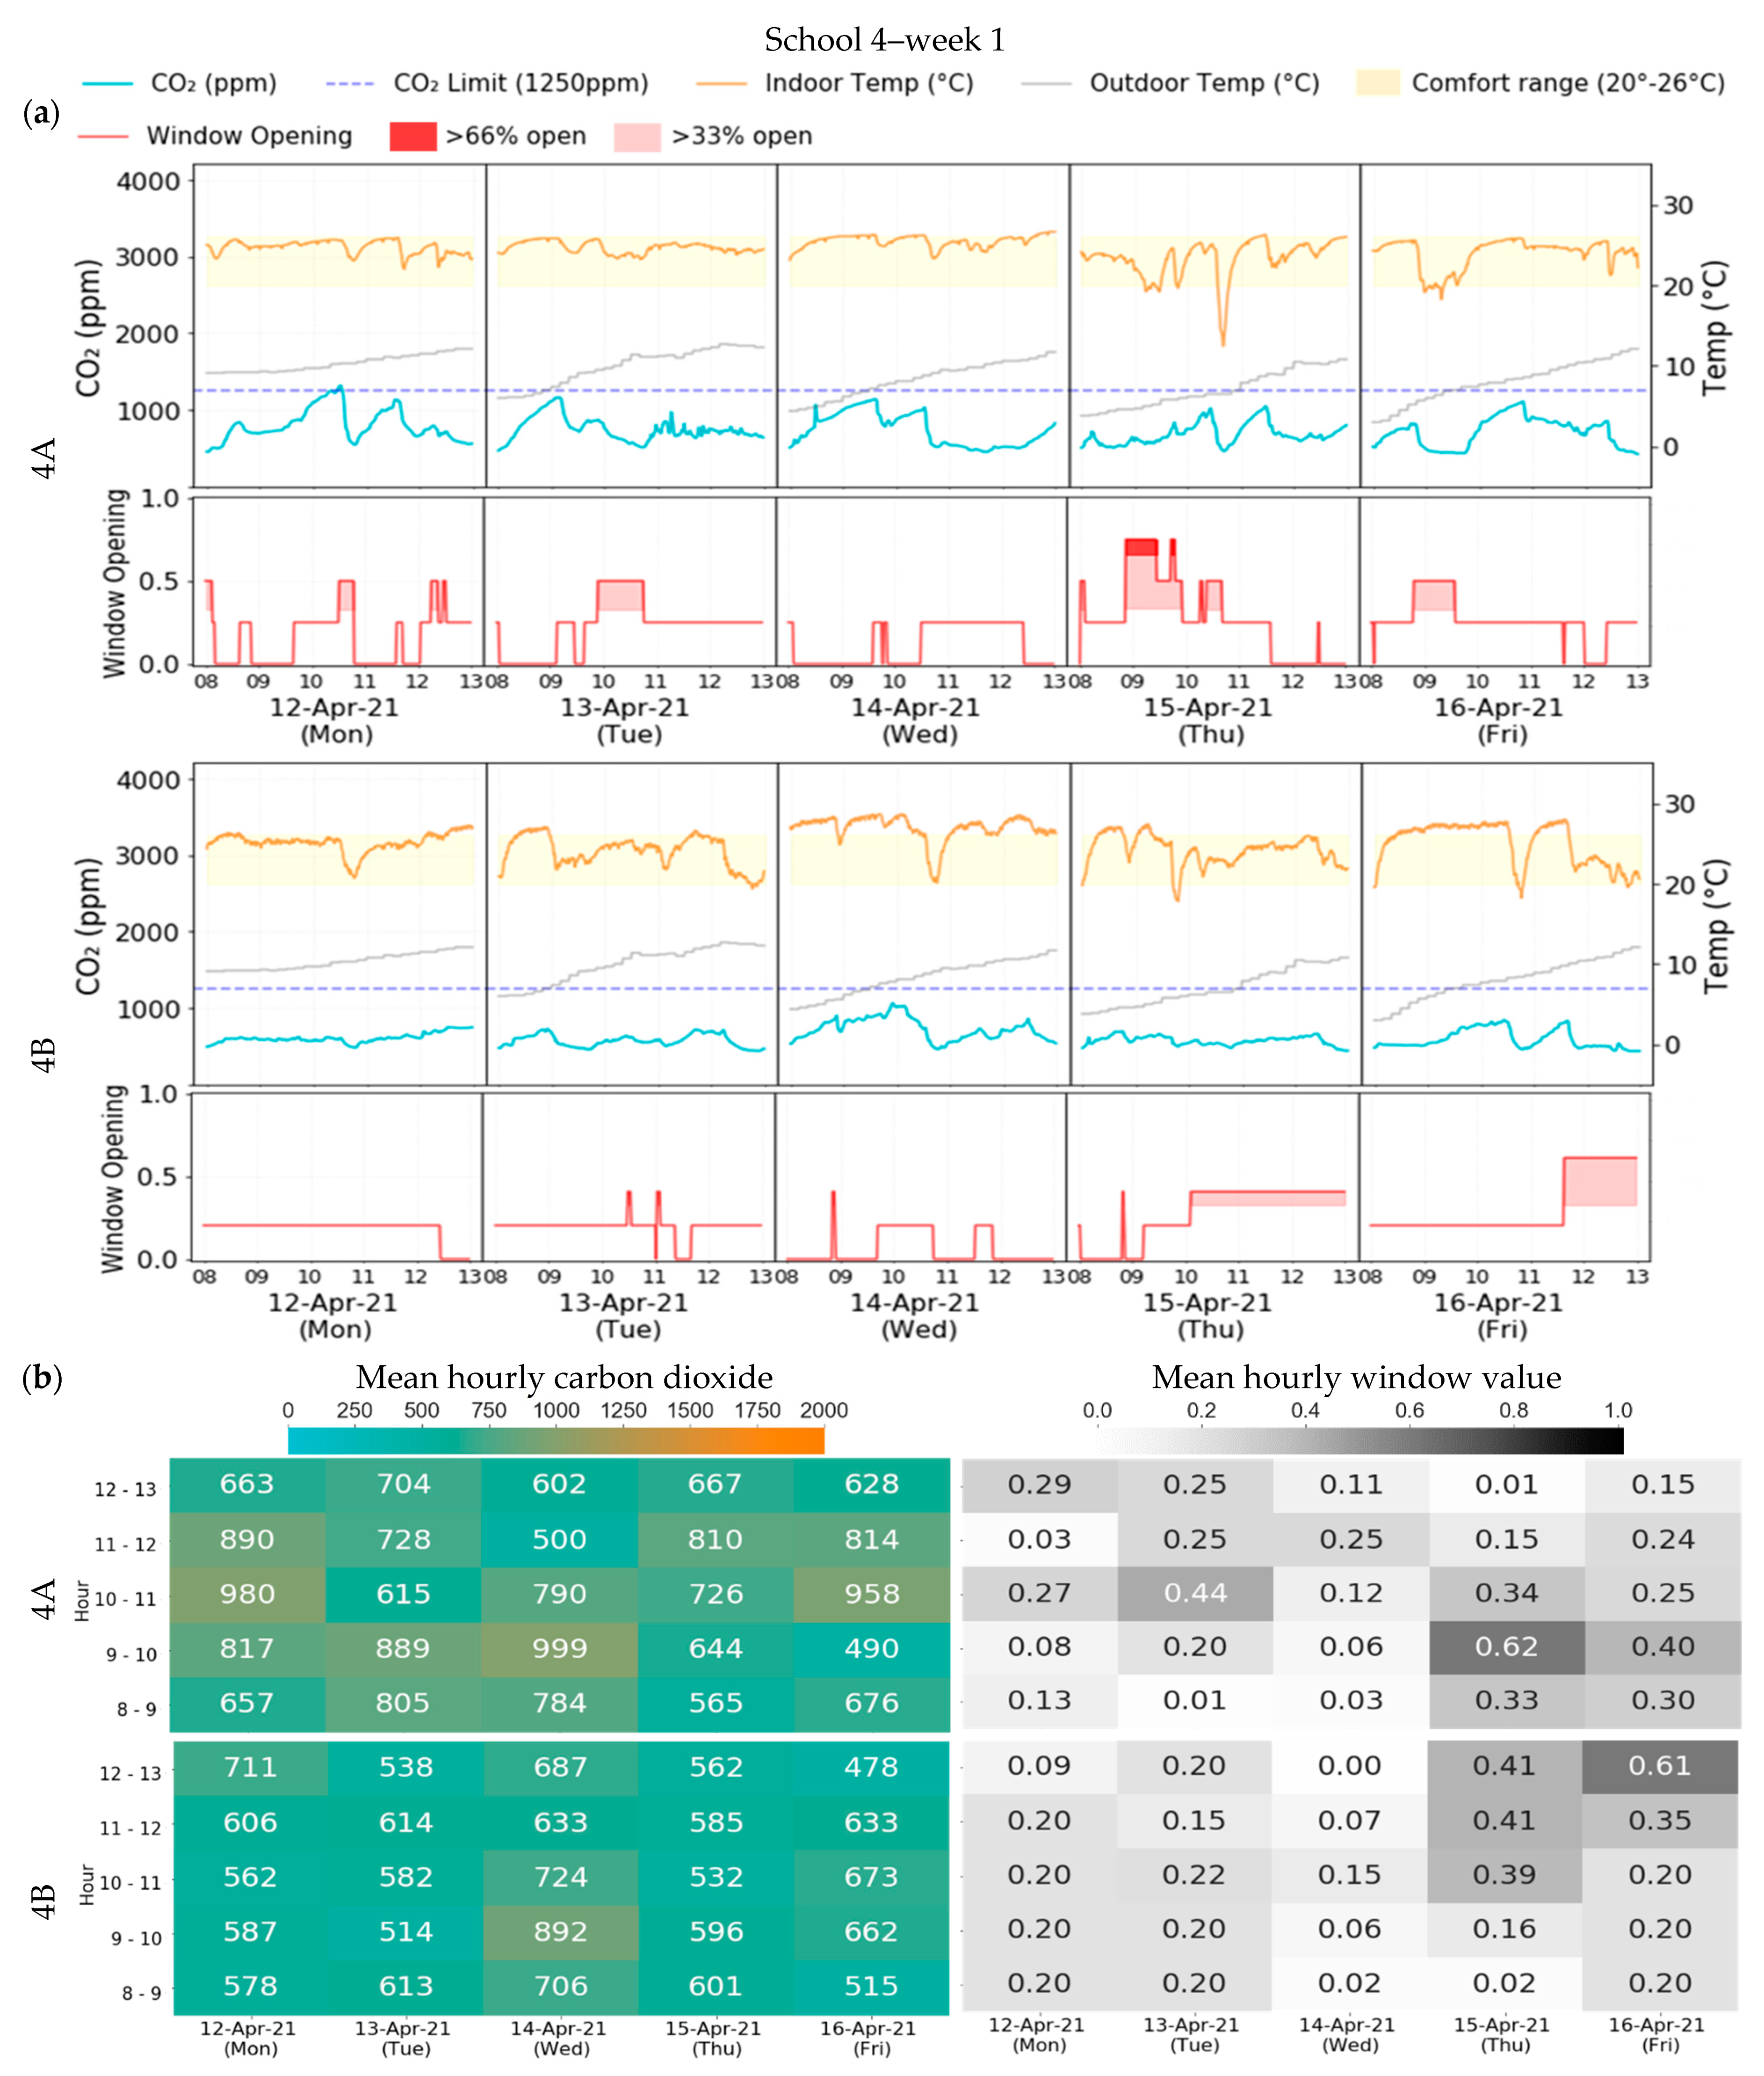
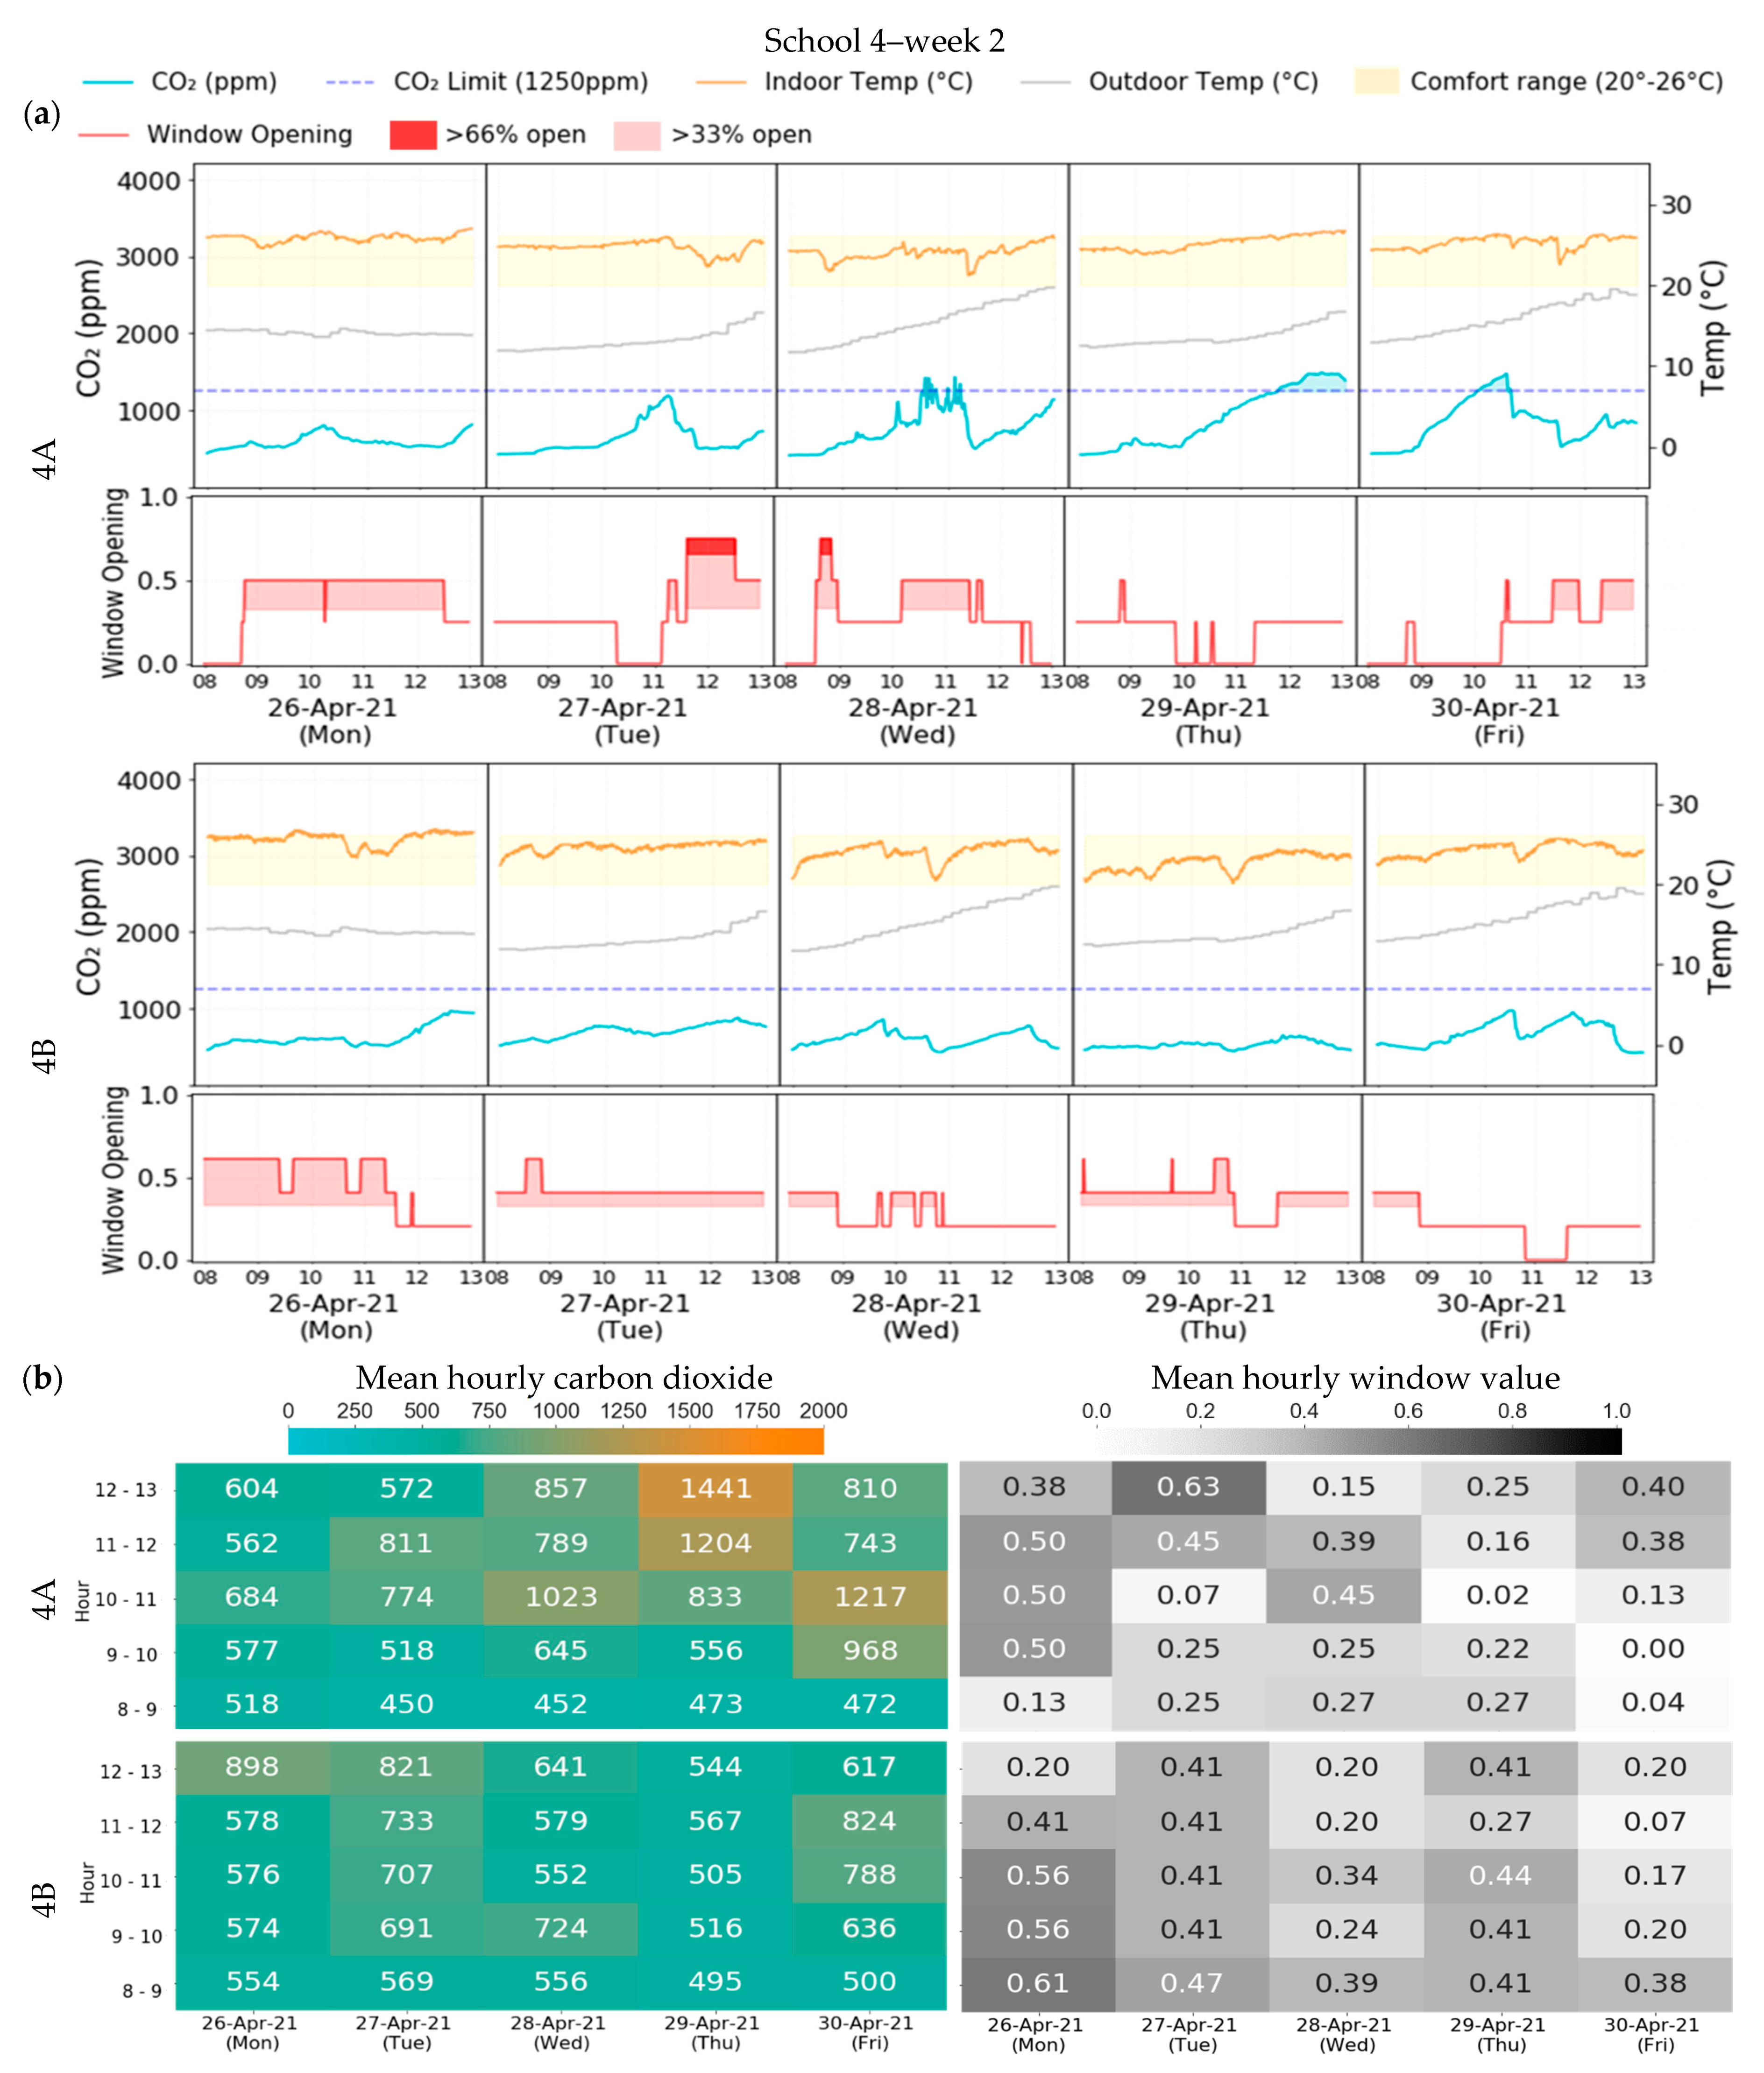
3.4. School 4
4. Conclusions
- The device has proven effective in school 1 (high school) being the only case study that simultaneously ha a full occupancy and conducts frontal lessons. A reduction of 28% and 42% in average CO2 concentration in the two monitored weeks respectively, was noted in the classroom with the device, as compared to its counterpart classroom without the device and with comparable occupancy.
- Due to the organization and low occupancy in school 2 and 4 respectively, no considerable difference in CO2 was recorded in the classrooms with and without the device. In school 2, the only kindergarten evaluated, the device was not the most ideal solution due to the young age of the pupils and the type of lesson (no frontal classes), which meant less interaction with the device. In school 4, a considerable reduction in the occupancy, due to the COVID-19 pandemic, limited the possibility of comparison.
- The device is more likely to be used with milder outdoor temperatures, as people open windows more willingly.
- The COVID-19 pandemic affected the results by changing occupancy and habits as confirmed also by the interviews with the teachers.
Author Contributions
Funding
Data Availability Statement
Acknowledgments
Conflicts of Interest
Appendix A

| 1 | In English: Laboratory for air monitoring and radioprotection–Autonomous Province of Bolzano–South Tyrol. |
| 2 | Damaged during World War II and rebuilt in some parts (source not provided for the anonimity of the school). |
References
- De Gennaro, G.; Dambruoso, P.R.; Loiotile, A.D.; Di Gilio, A.; Giungato, P.; Tutino, M.; Marzocca, A.; Mazzone, A.; Palmisani, J.; Porcelli, F. Indoor air quality in schools. Environ. Chem. Lett. 2014, 12, 467–482. [Google Scholar] [CrossRef]
- Korsavi, S.S.; Montazami, A.; Mumovic, D. Ventilation rates in naturally ventilated primary schools in the UK.; Contextual, Occupant and Building-related (COB) factors. Build. Environ. 2020, 181, 107061. [Google Scholar] [CrossRef]
- Wargocki, P.; Wyon, D.P. Effects of HVAC on student performance. ASHRAE J. 2006, 48, 22–28. [Google Scholar]
- Alonso, A.; Llanos, J.; Escandón, R.; Sendra, J.J. Effects of the COVID-19 Pandemic on Indoor Air Quality and Thermal Comfort of Primary Schools in Winter in a Mediterranean Climate. Sustainability 2021, 13, 2699. [Google Scholar] [CrossRef]
- Toyinbo, O.; Matilainen, M.; Turunen, M.; Putus, T.; Shaughnessy, R.; Haverinen-Shaughnessy, U. Modeling Associations between Principals’ Reported Indoor Environmental Quality and Students’ Self-Reported Respiratory Health Outcomes Using GLMM and ZIP Models. Int. J. Environ. Res. Public Health 2016, 13, 385. [Google Scholar] [CrossRef] [PubMed] [Green Version]
- Korsavi, S.S.; Montazami, A. Children’s thermal comfort and adaptive behaviours; UK primary schools during non-heating and heating seasons. Energy Build. 2020, 214, 109857. [Google Scholar] [CrossRef]
- Stazi, F.; Naspi, F.; Ulpiani, G.; DI Perna, C. Indoor air quality and thermal comfort optimization in classrooms developing an automatic system for windows opening and closing. Energy Build. 2017, 139, 732–746. [Google Scholar] [CrossRef]
- Heath, G.A.; Mendell, M.J. Do Indoor Environments in Schools Influence Student Performance? A Review of the Literature. In Proceedings of the Indoor Air 2002 Conference, Monterey, USA, 30 June–5 July 2002; Volume 1, pp. 1–48. [Google Scholar]
- Almeida, S.M.; Canha, N.; Silva, A.; Freitas, M.D.C.; Pegas, P.; Alves, C.; Evtyugina, M.; Pio, C. Children exposure to atmospheric particles in indoor of Lisbon primary schools. Atmos. Environ. 2011, 45, 7594–7599. [Google Scholar] [CrossRef]
- Bakó-Biró, Z.; Clements-Croome, D.; Kochhar, N.; Awbi, H.; Williams, M. Ventilation rates in schools and pupils’ performance. Build. Environ. 2012, 48, 215–223. [Google Scholar] [CrossRef]
- Wargocki, P.; Wyon, D.P. Providing better thermal and air quality conditions in school classrooms would be cost-effective. Build. Environ. 2013, 59, 581–589. [Google Scholar] [CrossRef]
- Griffiths, M.; Eftekhari, M. Control of CO2 in a naturally ventilated classroom. Energy Build. 2007, 40, 556–560. [Google Scholar] [CrossRef]
- Semprini, G.; Marinosci, C.; Ferrante, A.; Predari, G.; Mochi, G.; Garai, M.; Gulli, R. Energy management in public institutional and educational buildings: The case of the school of engineering and architecture in Bologna. Energy Build. 2016, 126, 365–374. [Google Scholar] [CrossRef]
- Khalil, A.; Hammouda, N.Y.; El-Deeb, K.F. Implementing Sustainability in Retrofitting Heritage Buildings. Case Study: Villa Antoniadis, Alexandria, Egypt. Heritage 2018, 1, 57–87. [Google Scholar] [CrossRef] [Green Version]
- Mısırlısoy, D.; Günçe, K. Adaptive reuse strategies for heritage buildings: A holistic approach. Sustain. Cities Soc. 2016, 26, 91–98. [Google Scholar] [CrossRef]
- Webb, A.L. Energy retrofits in historic and traditional buildings: A review of problems and methods. Renew. Sustain. Energy Rev. 2017, 77, 748–759. [Google Scholar] [CrossRef]
- Fabbri, K.; Pretelli, M. Heritage buildings and historic microclimate without HVAC technology: Malatestiana Library in Cesena, Italy, UNESCO Memory of the World. Energy Build. 2014, 76, 15–31. [Google Scholar] [CrossRef]
- Cho, H.M.; Yun, B.Y.; Yang, S.; Wi, S.; Chang, S.J.; Kim, S. Optimal energy retrofit plan for conservation and sustainable use of historic campus building: Case of cultural property building. Appl. Energy 2020, 275, 115313. [Google Scholar] [CrossRef]
- Ma, Z.; Cooper, P.; Daly, D.; Ledo, L. Existing building retrofits: Methodology and state-of-the-art. Energy Build. 2012, 55, 889–902. [Google Scholar] [CrossRef]
- Franco, G.; Magrini, A.; Cartesegna, M.; Guerrini, M. Towards a systematic approach for energy refurbishment of historical buildings. The case study of Albergo dei Poveri in Genoa, Italy. Energy Build. 2015, 95, 153–159. [Google Scholar] [CrossRef]
- Kabirikopaei, A.; Lau, J.; Nord, J.; Bovaird, J. Identifying the K-12 classrooms’ indoor air quality factors that affect student academic performance. Sci. Total. Environ. 2021, 786, 147498. [Google Scholar] [CrossRef]
- Wargocki, P.; Porras-Salazar, J.A.; Contreras-Espinoza, S.; Bahnfleth, W. The relationships between classroom air quality and children’s performance in school. Build. Environ. 2020, 173, 106749. [Google Scholar] [CrossRef]
- Lee, S.; Chang, M. Indoor and outdoor air quality investigation at schools in Hong Kong. Chemosphere 2000, 41, 109–113. [Google Scholar] [CrossRef]
- Gao, J.; Wargocki, P.; Wang, Y. Ventilation system type, classroom environmental quality and pupils’ perceptions and symptoms. Build. Environ. 2014, 75, 46–57. [Google Scholar] [CrossRef]
- Kephalopoulos, S.; Csobod, E.; de Bruin, Y.B.; de Oliveira Fernandes, E. SINPHONIE Schools Indoor Pollution and Health Observatory Network in Europe Guidelines for Healthy Environments within European Schools; European Commission’s Directorates General for Health and Consumers and Joint Research Centre: Luxembourg, 2014. [Google Scholar]
- Zhang, X.; Wargocki, P.; Lian, Z.; Thyregod, C. Effects of exposure to carbon dioxide and bioeffluents on perceived air quality, self-assessed acute health symptoms, and cognitive performance. Indoor Air 2016, 27, 47–64. [Google Scholar] [CrossRef] [PubMed] [Green Version]
- Dorizas, P.V.; Assimakopoulos, M.-N.; Santamouris, M. A holistic approach for the assessment of the indoor environmental quality, student productivity, and energy consumption in primary schools. Environ. Monit. Assess. 2015, 187, 1–18. [Google Scholar] [CrossRef] [PubMed]
- Twardella, D.; Matzen, W.; Lahrz, T.; Burghardt, R.; Spegel, H.; Hendrowarsito, L.; Frenzel, A.C.; Fromme, H. Effect of classroom air quality on students’ concentration: Results of a cluster-randomized cross-over experimental study. Indoor Air 2012, 22, 378–387. [Google Scholar] [CrossRef] [PubMed]
- Myhrvold, A.N.; Olsen, E.; Lauridsen, O. Indoor environment in schools–pupils health and performance in regard to CO2 concentrations. In Proceedings of the 7th International Conference on Indoor Air Quality and Climate, Nagoya, Japan, 21–26 July 1996; Volume 96, pp. 369–371. [Google Scholar]
- Wargocki, P.; Da Silva, N.A.F. Use of visual CO2 feedback as a retrofit solution for improving classroom air quality. Indoor Air 2014, 25, 105–114. [Google Scholar] [CrossRef] [PubMed]
- Daisey, J.M.; Angell, W.J.; Apte, M.G. Indoor air quality, ventilation and health symptoms in schools: An analysis of existing information. Indoor Air 2003, 13, 53–64. [Google Scholar] [CrossRef]
- The Lancet COVID-19 Commission Task Force on Safe Work, Safe School, and Safe Travel. Designing Infectious Disease Resilience into School Buildings through Improvements to Ventilation and Air Cleaning. Available online: https://static1.squarespace.com/static/5ef3652ab722df11fcb2ba5d/t/60a3d1251fcec67243e91119/1621348646314/Safe+Work+TF+Desigining+infectious+disease+resilience+April+2021.pdf (accessed on 24 August 2021).
- Aviv, D.; Chen, K.W.; Teitelbaum, E.; Sheppard, D.; Pantelic, J.; Rysanek, A.; Meggers, F. A Fresh (Air) Look at Ventilation for COVID-19: Estimating the global energy savings potential of coupling natural ventilation with novel radiant cooling strategies. Appl. Energy 2021, 292, 116848. [Google Scholar] [CrossRef]
- Park, S.; Choi, Y.; Song, D.; Kim, E.K. Natural ventilation strategy and related issues to prevent coronavirus disease 2019 (COVID-19) airborne transmission in a school building. Sci. Total. Environ. 2021, 789, 147764. [Google Scholar] [CrossRef]
- Hobday, R.; Dancer, S. Roles of sunlight and natural ventilation for controlling infection: Historical and current perspectives. J. Hosp. Infect. 2013, 84, 271–282. [Google Scholar] [CrossRef]
- Tang, J.; Bahnfleth, W.; Bluyssen, P.; Buonanno, G.; Jimenez, J.; Kurnitski, J.; Li, Y.; Miller, S.; Sekhar, C.; Morawska, L.; et al. Dismantling myths on the airborne transmission of severe acute respiratory syndrome coronavirus-2 (SARS-CoV-2). J. Hosp. Infect. 2021, 110, 89–96. [Google Scholar] [CrossRef]
- Dijken, F.V.A.N.; Boerstra, A. Implications of COVID-19 pandemic for application of natural ventilation. REHVA Eur. HVAC J. 2021, 58, 58–63. [Google Scholar]
- CEN. EN Standard 16798-2. Energy Performance of Buildings—Ventilation for Buildings—Part. 2: Interpretation of the Requirements in EN 16798-1—Indoor Environmental Input Parameters for Design and Assessment of Energy Performance of Buildings Addressing Indoor Air Quality, Thermal Environment, Lighting and Acoustics—Module M1-6; European Committee for Standardization: Brussels, Belgium, 2019. [Google Scholar]
- Li, Y.; Leung, G.; Tang, J.; Yang, X.; Chao, Y.H.C.; Lin, Z.; Lu, W.-Z.J.; Nielsen, P.V.; Niu, J.; Qian, H.; et al. Role of ventilation in airborne transmission of infectious agents in the built environment ? A multidisciplinary systematic review. Indoor Air 2007, 17, 2–18. [Google Scholar] [CrossRef] [PubMed]
- Du, C.; Wang, S.; Yu, M.; Chiu, T.; Wang, J.; Chuang, P.; Jou, R.; Fang, C. Effect of ventilation improvement during a tuberculosis outbreak in underventilated university buildings. Indoor Air 2019, 30, 422–432. [Google Scholar] [CrossRef]
- Escombe, A.R.; Oeser, C.C.; Gilman, R.H.; Ñavincopa, M.; Ticona, E.; Pan, W.; Martínez, C.; Chacaltana, J.; Rodríguez, R.; Moore, D.A.J.; et al. Natural Ventilation for the Prevention of Airborne Contagion. PLoS Med. 2007, 4, e68. [Google Scholar] [CrossRef] [PubMed] [Green Version]
- WHO. Roadmap to Improve and Ensure Good Indoor Ventilation in the Context of COVID-19; World Health Organization: Geneva, Switzerland, 2021; Volume 19, ISBN 9789240021280. [Google Scholar]
- Rapporto ISS COVID-19. Available online: https://www.iss.it/documents/20126/0/Rapporto+ISS+COVID-19+12_2021.pdf/4eeb2ce8-648d-b045-4a8c-5dfe1fc7b56a?t=1622463358049 (accessed on 24 August 2021).
- Kalimeri, K.K.; Saraga, D.E.; Lazaridis, V.D.; Legkas, N.A.; Missia, D.A.; Tolis, E.I.; Bartzis, J.G. Indoor air quality investigation of the school environment and estimated health risks: Two-season measurements in primary schools in Kozani, Greece. Atmos. Pollut. Res. 2016, 7, 1128–1142. [Google Scholar] [CrossRef]
- Michelot, N.; Marchand, C.; Ramalho, O.; Delmas, V.; Carrega, M. Monitoring indoor air quality in French schools and day-care centres. (Results from the first phase of a pilot survey). HVAC&R Res. 2012, 2, 1776–1781. [Google Scholar]
- Blázquez, T.; Ferrari, S.; Suárez, R.; Sendra, J.J. Adaptive approach-based assessment of a heritage residential complex in southern Spain for improving comfort and energy efficiency through passive strategies: A study based on a monitored flat. Energy 2019, 181, 504–520. [Google Scholar] [CrossRef]
- Hernández, J.L.; Reeb, S.; Paci, G.; Garrecht, H.; Garcia, D. A novel monitoring and control system for historical buildings. In Proceedings of the 3rd European Workshop on Cultural Heritage Preservation (EWCHP), Bozen/Bolzano, Italy, 16–17 September 2013. [Google Scholar]
- 3encult Deliverables. Available online: https://www.3encult.eu/en/casestudies/Documents/3ENCULT_Case%20Study%205.pdf (accessed on 24 August 2021).
- Torresin, S.; Albatici, R.; Aletta, F.; Babich, F.; Oberman, T.; Stawinoga, A.E.; Kang, J. Indoor soundscapes at home during the COVID-19 lockdown in London—Part I: Associations between the perception of the acoustic environment, occupantś activity and well-being. Appl. Acoust. 2021, 183, 108305. [Google Scholar] [CrossRef]
- Geelen, L.M.J.; Huijbregts, M.; Ragas, A.M.J.; Bretveld, R.W.; Jans, H.W.A.; Van Doorn, W.J.; Evertz, S.J.C.J.; Van Der Zijden, A. Comparing the effectiveness of interventions to improve ventilation behavior in primary schools. Indoor Air 2008, 18, 416–424. [Google Scholar] [CrossRef]
- Weis, N.; Siemers, U.; Kopiske, G. A Visual Ventilation Guiding Device (VVGD)—Development and Validation for Use in Dwellings and Schools. HVAC&R Res. 2006, 12, 903–915. [Google Scholar] [CrossRef]
- Ackerly, K.; Brager, G. Window signalling systems: Control strategies and occupant behaviour. Build. Res. Inf. 2013, 41, 342–360. [Google Scholar] [CrossRef]
- QAES. Available online: https://www.qaes.it/ (accessed on 24 August 2021).
- CEN. EN 16798-1:2019 Energy Performance of Buildings—Ventilation for Buildings—Part 1: Indoor Environmental Input Parameters for Design and Assessment of Energy Performance of Buildings Addressing Indoor Air Quality, Thermal Environment, Lighting and Acous; European Committee for Standardization: Brussels, Belgium, 2019. [Google Scholar]
- QAES Deliverables. Available online: https://www.qaes.it/wp-content/uploads/2020/05/QAES_T3.4_Selezione-casi-studio_FINALE_pubblico.pdf (accessed on 24 August 2021).
- Meteo Browser Südtirol. Available online: http://meteobrowser.eurac.edu/ (accessed on 24 August 2021).
- UNI. EN 16798-7:2017 Energy Performance of Buildings–Ventilation for Buildings–Part 7: Calculation Methods for the Determination of air Flow Rates in Buildings Including Infiltration; (Modules M5-5); European Committee for Standardization: Brussels, Belgium, 2017. [Google Scholar]
- Babich, F.; Belleri, A.; Demanega, I.; Peretti, C.; Verdi, L.; Gianmaria, F. The indoor environmental quality in schools in South Tyrol: Insights from the field measurements, and initial design of the improvements. In Proceedings of the 41st AIVC–ASHRAE IAQ Joint Conference, Athens, Greece, 4–6 May 2022. [Google Scholar]
- Guo, H.; Aviv, D.; Loyola, M.; Teitelbaum, E.; Houchois, N.; Meggers, F. On the understanding of the mean radiant temperature within both the indoor and outdoor environment, a critical review. Renew. Sustain. Energy Rev. 2019, 117, 109207. [Google Scholar] [CrossRef]
- Walikewitz, N.; Jänicke, B.; Langner, M.; Meier, F.; Endlicher, W. The difference between the mean radiant temperature and the air temperature within indoor environments: A case study during summer conditions. Build. Environ. 2015, 84, 151–161. [Google Scholar] [CrossRef]
- Shendell, D.G.; Prill, R.; Fisk, W.J.; Apte, M.G.; Blake, D.; Faulkner, D. Associations between classroom CO2 concentrations and student attendance in Washington and Idaho. Indoor Air 2004, 14, 333–341. [Google Scholar] [CrossRef] [PubMed]
- Grimsrud, D.; Bridges, B.; Schulte, R. Continuous measurements of air quality parameters in schools. Build. Res. Inf. 2006, 34, 447–458. [Google Scholar] [CrossRef]


| School ID | Year of Construction | Context | Level of Education | Ventilation |
|---|---|---|---|---|
| 1 | 1960 | urban | Secondary school | Natural |
| 2 | 1905 | urban | Kindergarten | Natural |
| 3 | 2012 | urban | High school | Natural |
| 4 | 16002 | urban | High school | Natural |
| School ID | Classroom ID | Max Occupants | Floor | Orientation | Area (m2) | Volume (m3) |
|---|---|---|---|---|---|---|
| 1 | 1A | 22 | Second | South-east | 50 | 149 |
| 1B | 23 | Second | South-west | 50 | 150 | |
| 2 | 2A | 24 | First | East | 57 | 171 |
| 2B | 24 | Ground | East | 52 | 187 | |
| 3 | 3A | 25 | Second | South-west | 59 | 177 |
| 3B | 25 | Third | South-east | 55 | 165 | |
| 4 | 4A | 21 | Second | South | 68 | 204 |
| 4B | 21 | First | South | 82 | 245 |
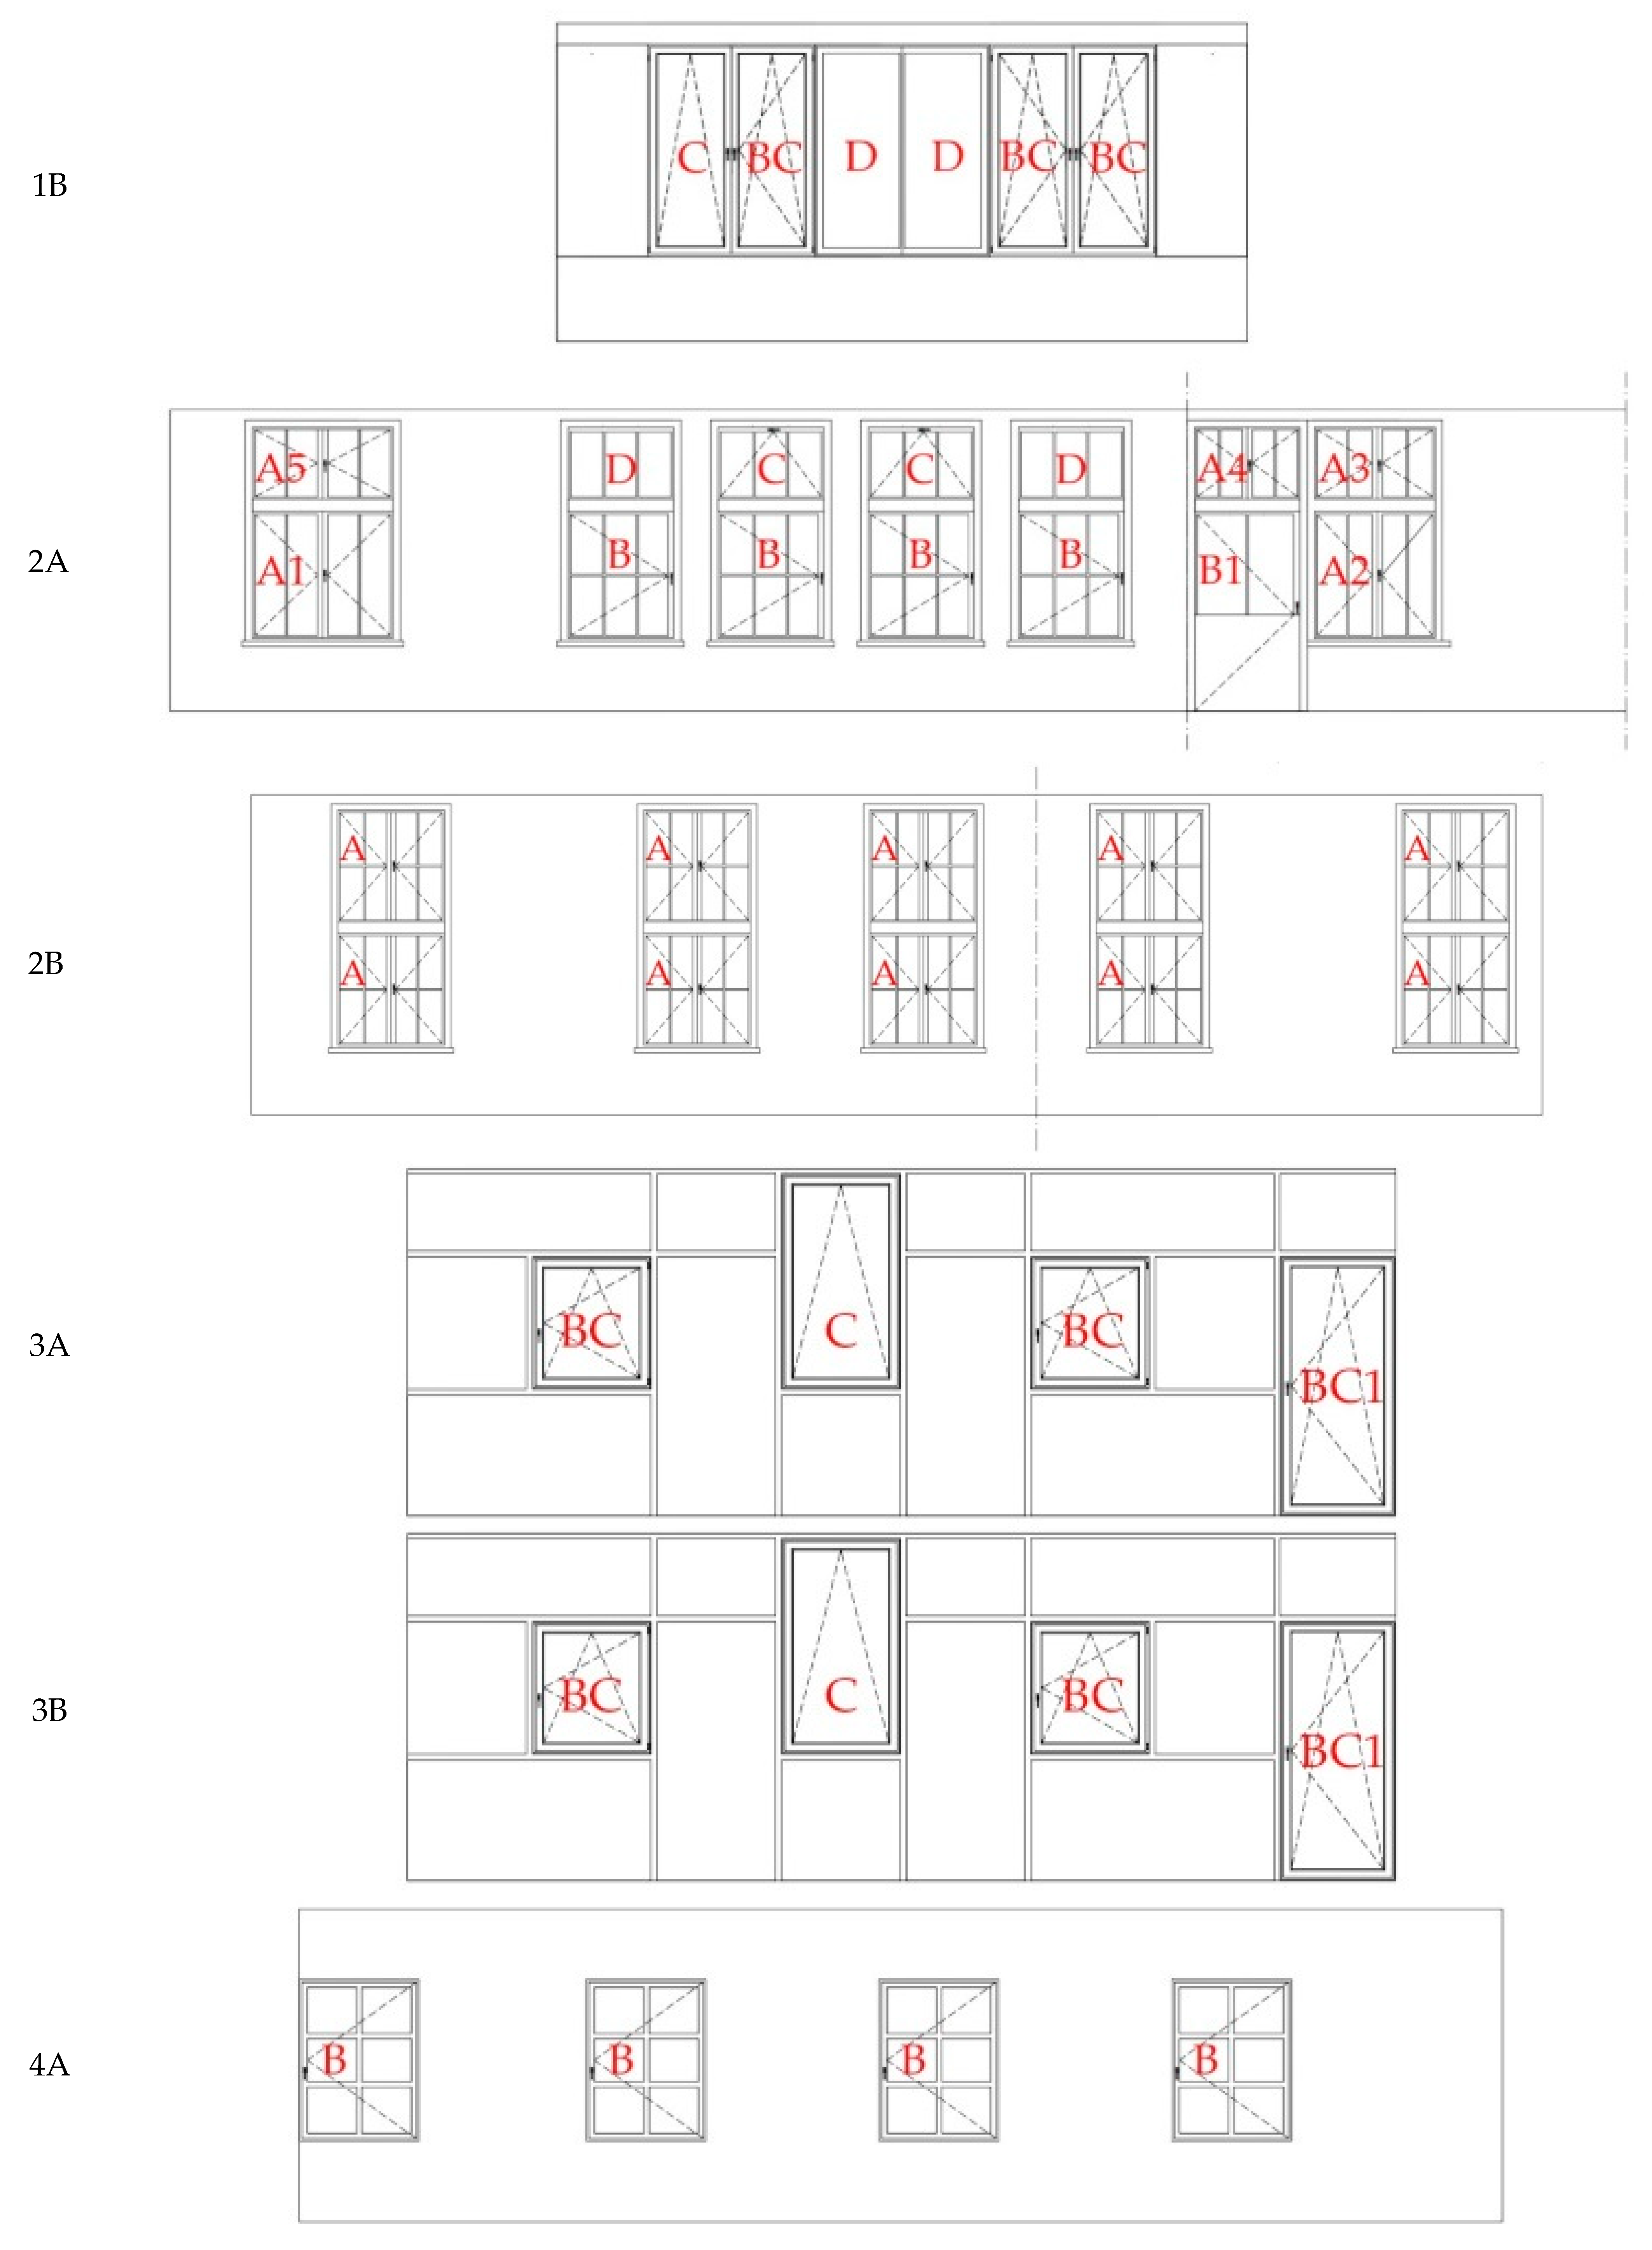
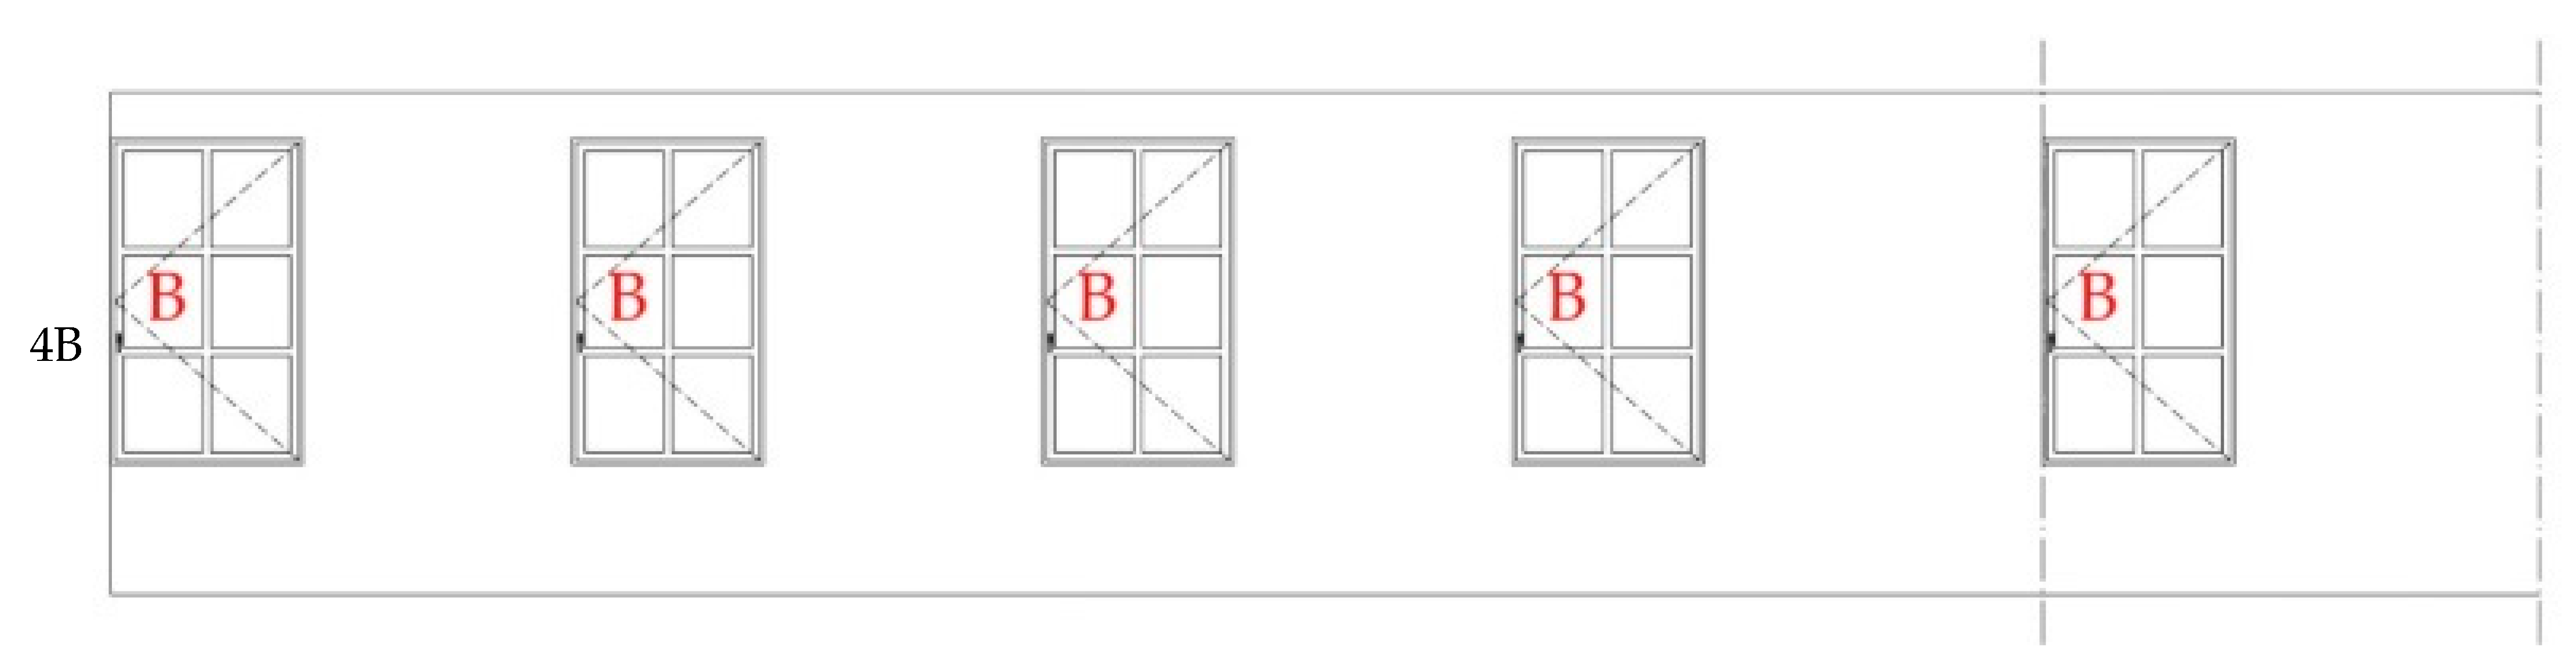
| School ID | Classroom ID | Ventilation | Window Typology 1 | Window Opening Free Area (m2) 2 | Normalized Opening Weight (αn) | Number of Windows |
|---|---|---|---|---|---|---|
| 1 | C | 0.3 | 0.032 | 1 | ||
| 1A | Single-sided | BC | 0.8 | 0.323 | 3 | |
| D | 0 | 0 | 2 | |||
| C | 0.3 | 0.032 | 1 | |||
| 1B | Single-sided | BC | 0.8 | 0.323 | 3 | |
| D | 0 | 0 | 2 | |||
| 2 | 2A | Cross-ventilation | A1 | 1.20 | 0.132 | 1 |
| A2 | 1.02 | 0.113 | 1 | |||
| A3 | 0.60 | 0.074 | 1 | |||
| A4 | 0.50 | 0.056 | 1 | |||
| A5 | 0.70 | 0.064 | 1 | |||
| B | 0.90 | 0.099 | 3 | |||
| B1 | 1.40 | 0.156 | 1 | |||
| C | 0.20 | 0.006 | 2 | |||
| D | 0 | 0 | 2 | |||
| 2B | Cross-ventilation | A | 1.00 | 0.100 | 10 | |
| 3 | BC | 0.70 | 0.243 | 2 | ||
| 3A | Single-sided | BC1 | 1.40 | 0.473 | 1 | |
| C | 0.40 | 0.040 | 1 | |||
| BC | 0.70 | 0.243 | 2 | |||
| 3A | Single-sided | BC1 | 1.40 | 0.473 | 1 | |
| C | 0.40 | 0.040 | 1 | |||
| 4 | 4A | Single-sided | B | 1.12 | 0.250 | 4 |
| 4B | Cross-ventilation | B | 1.40 | 0.200 | 5 |
| School ID | Classroom ID | Category I | Category II | Category III | Category IV | ||||
|---|---|---|---|---|---|---|---|---|---|
| (m³/h) | ACH | (m³/h) | ACH | (m³/h) | ACH | [m³/h] | ACH | ||
| 1 | 1A | 970 | 7 | 679 | 5 | 388 | 3 | 251 | 2 |
| 1B | 1007 | 7 | 705 | 5 | 403 | 3 | 261 | 2 | |
| 2 | 2A | 1070 | 6 | 749 | 4 | 428 | 3 | 278 | 2 |
| 2B | 1052 | 6 | 736 | 4 | 421 | 2 | 272 | 2 | |
| 3 | 3A | 1112 | 5 | 779 | 3 | 445 | 2 | 289 | 1 |
| 3B | 1098 | 7 | 769 | 5 | 439 | 3 | 284 | 2 | |
| 4 | 4A | 1001 | 5 | 701 | 3 | 400 | 2 | 262 | 1 |
| 4B | 1050 | 4 | 735 | 3 | 420 | 2 | 277 | 1 | |
| Pre COVID | During COVID | |||||||
|---|---|---|---|---|---|---|---|---|
| School ID | Classroom ID | Device | Week 0 | Average Occupants | Week 1 | Average Occupants | Week 2 | Average Occupants |
| 1 | 1A | Yes | 23–29 November 2019 | 24 | 21–27 March 2021 | 21 | 11–17 April 2021 | 21 |
| 1B | No | 22 | 21 | 22 | ||||
| 2 | 2A | Yes | 7–13 December 2019 | 20 | 1–7 December 2020 | 22 | 8–14 December 2020 | 22 |
| 2B | No | 12 | 21 | 21 | ||||
| 3 | 3A | Yes | 11–17 January 2020 | 23 | 31 January–6 February 2021 | 11 | 23–29 May 2021 | 11 |
| 3B | No | 23 | 11 | 11 | ||||
| 4 | 4A | Yes | - | - | 11–17 April 2021 | 6 | 25 April–1 May 2021 | 10 |
| 4B | No | - | - | 8 | 10 | |||
| CO2 | Window Opening (W.O.) | Ind_T | Out_T | |||||||||||||||||
|---|---|---|---|---|---|---|---|---|---|---|---|---|---|---|---|---|---|---|---|---|
| School ID | Ref. Week | Class ID | Avg Occ. | Avg | Min | Max | St.Dev | % Time CO2 > 1250 ppm (cat II) | % Time CO2 > 1800 ppm(cat IV) | Total no. of Signals | Avg | Min | Max | St.Dev | % Time W.O. > 0.33 | % Time W.O. > 0.66 | Avg | % Time Temp b/w 20–26 °C | Avg | ΔT |
| 1 | 0 | 1A | 24 | 1357 | 481 | 2910 | 593 | 44 | 19 | 36 | 0.2 | 0.0 | 0.8 | 0.2 | 25.5 | 0.6 | 23 | 59 | 15 | 9 |
| 1B | 22 | 1727 | 412 | 3514 | 759 | 65 | 44 | 69 | 0.3 | 0.0 | 0.8 | 0.2 | 37.1 | 13.5 | 25 | 75 | 15 | 11 | ||
| 1 | 1A | 21 | 733 | 422 | 1526 | 217 | 3 | 0 | 56 | 0.4 | 0.0 | 0.8 | 0.2 | 44.6 | 15.4 | 23 | 90 | 12 | 11 | |
| 1B | 21 | 1022 | 439 | 2843 | 545 | 26 | 13 | 129 | 0.4 | 0.0 | 1.0 | 0.3 | 50.9 | 23.7 | 22 | 79 | 12 | 10 | ||
| 2 | 1A | 21 | 769 | 423 | 1268 | 189 | 0 | 0 | 59 | 0.5 | 0.0 | 0.8 | 0.2 | 83.8 | 24.7 | 22 | 72 | 9 | 13 | |
| 1B | 22 | 1338 | 425 | 3761 | 825 | 39 | 23 | 58 | 0.2 | 0.0 | 1.0 | 0.2 | 24.8 | 4.8 | 21 | 70 | 9 | 12 | ||
| 2 | 0 | 2A | 20 | 1094 | 383 | 1903 | 377 | 33 | 2 | 51 | 0.1 | 0.0 | 0.6 | 0.2 | 20.3 | 0.0 | 22 | 88 | 7 | 15 |
| 2B | 12 | 746 | 391 | 1102 | 149 | 0 | 0 | 0 | 0.3 | 0.3 | 0.3 | 0.0 | 0.0 | 0.0 | 23 | 87 | 7 | 16 | ||
| 1 | 2A | 22 | 1053 | 513 | 1750 | 333 | 33 | 0 | 4 | 0.0 | 0.0 | 0.0 | 0.0 | 0.0 | 0.0 | 21 | 89 | 2 | 20 | |
| 2B | 21 | 892 | 512 | 1596 | 270 | 13 | 0 | 24 | 0.0 | 0.0 | 0.1 | 0.0 | 0.0 | 0.0 | 23 | 100 | 2 | 21 | ||
| 2 | 2A | 22 | 856 | 436 | 1621 | 300 | 10 | 0 | 15 | 0.1 | 0.0 | 0.4 | 0.1 | 11.3 | 0.0 | 21 | 92 | 3 | 19 | |
| 2B | 21 | 721 | 447 | 1518 | 250 | 4 | 0 | 28 | 0.0 | 0.0 | 0.1 | 0.0 | 0.0 | 0.0 | 23 | 100 | 3 | 20 | ||
| 3 | 0 | 3A | 23 | 1568 | 573 | 2959 | 699 | 64 | 45 | 16 | 0.1 | 0.0 | 0.5 | 0.2 | 25.4 | 0.0 | 23 | 99 | -2 | 25 |
| 3B | 23 | 2085 | 632 | 4434 | 925 | 76 | 62 | 38 | 0.5 | 0.0 | 1.0 | 0.4 | 56.4 | 44.5 | 24 | 99 | -2 | 25 | ||
| 1 | 3A | 11 | 726 | 413 | 1608 | 249 | 7 | 0 | 18 | 0.1 | 0.0 | 0.3 | 0.1 | 0.0 | 0.0 | 22 | 100 | 2 | 20 | |
| 3B | 11 | 701 | 411 | 1366 | 210 | 2 | 0 | 33 | 0.3 | 0.0 | 1.0 | 0.2 | 40.1 | 3.5 | 19 | 43 | 2 | 17 | ||
| 2 | 3A | 11 | 625 | 395 | 1242 | 208 | 0 | 0 | 8 | 0.2 | 0.0 | 0.2 | 0.1 | 0.0 | 0.0 | 24 | 100 | 14 | 10 | |
| 3B | 11 | 726 | 393 | 1231 | 245 | 0 | 0 | 26 | 0.5 | 0.2 | 1.0 | 0.2 | 58.7 | 31.3 | 21 | 89 | 14 | 7 | ||
| 4 | 1 | 4A | 6 | 736 | 425 | 1320 | 187 | 0 | 0 | 54 | 0 | 0 | 1 | 0 | 15 | 3 | 24 | 90 | 9 | 16 |
| 4B | 8 | 615 | 438 | 1066 | 115 | 0 | 0 | 46 | 0 | 0 | 1 | 0 | 18 | 0 | 25 | 59 | 9 | 16 | ||
| 2 | 4A | 10 | 742 | 414 | 1490 | 284 | 8 | 0 | 62 | 0.3 | 0.0 | 0.8 | 0.2 | 33.3 | 4.5 | 25 | 84 | 14 | 11 | |
| 4B | 10 | 630 | 421 | 977 | 130 | 0 | 0 | 29 | 0.4 | 0.0 | 0.6 | 0.1 | 61.8 | 0.0 | 24 | 92 | 14 | 10 | ||
Publisher’s Note: MDPI stays neutral with regard to jurisdictional claims in published maps and institutional affiliations. |
© 2021 by the authors. Licensee MDPI, Basel, Switzerland. This article is an open access article distributed under the terms and conditions of the Creative Commons Attribution (CC BY) license (https://creativecommons.org/licenses/by/4.0/).
Share and Cite
Avella, F.; Gupta, A.; Peretti, C.; Fulici, G.; Verdi, L.; Belleri, A.; Babich, F. Low-Invasive CO2-Based Visual Alerting Systems to Manage Natural Ventilation and Improve IAQ in Historic School Buildings. Heritage 2021, 4, 3442-3468. https://doi.org/10.3390/heritage4040191
Avella F, Gupta A, Peretti C, Fulici G, Verdi L, Belleri A, Babich F. Low-Invasive CO2-Based Visual Alerting Systems to Manage Natural Ventilation and Improve IAQ in Historic School Buildings. Heritage. 2021; 4(4):3442-3468. https://doi.org/10.3390/heritage4040191
Chicago/Turabian StyleAvella, Francesca, Akshit Gupta, Clara Peretti, Gianmaria Fulici, Luca Verdi, Annamaria Belleri, and Francesco Babich. 2021. "Low-Invasive CO2-Based Visual Alerting Systems to Manage Natural Ventilation and Improve IAQ in Historic School Buildings" Heritage 4, no. 4: 3442-3468. https://doi.org/10.3390/heritage4040191
APA StyleAvella, F., Gupta, A., Peretti, C., Fulici, G., Verdi, L., Belleri, A., & Babich, F. (2021). Low-Invasive CO2-Based Visual Alerting Systems to Manage Natural Ventilation and Improve IAQ in Historic School Buildings. Heritage, 4(4), 3442-3468. https://doi.org/10.3390/heritage4040191