Article

Correlation of Environmental Parameters and the Water Saturation Induced Deterioration of Earthen Archaeological Sites: The Case of World Heritage Liangzhu City, China

1
College of Civil Engineering and Architecture, Zhejiang University, Hangzhou 310058, China
2
Hangzhou Ruhr Technology Co., Ltd., Hangzhou 310023, China
3
Hangzhou Archaeological Ruins of Liangzhu City World Heritage Monitoring and Management Center, Hangzhou 310000, China
4
Department of Engineering Geology and Hydrogeology, RWTH-Aachen University, 52074 Aachen, Germany
*
Author to whom correspondence should be addressed.
Heritage 2021, 4(1), 387-400; https://doi.org/10.3390/heritage4010024
Submission received: 19 November 2020 / Revised: 9 February 2021 / Accepted: 11 February 2021 / Published: 19 February 2021
(This article belongs to the Special Issue Digital Applications in Archaeology and Cultural Heritage)

Abstract

:
This paper proposes a combined methodology for the quantitative analysis of the correlations between the monitored influencing environmental factors and the water saturation induced deterioration of earthen relics in a humid area. The Archaeological Ruins of Liangzhu City that have been exposed and severely damaged in a humid environment with high water content and dry–wet cycles are chosen as examples. A monitoring system including atmospheric, groundwater, soil moisture conditions, and images of the surface was installed. Based on the proposed methodology, 11 key influencing indexes involving groundwater, soil moisture and temperature at different depths, atmospheric radiation, and rainfall for the water saturation induced deterioration are investigated, and their correlation is described by a regression model. The weight rankings of influencing factors to the deterioration of the research area are calculated. The results can help quantitatively control the atmospheric environment where the earthen relics are located and can promote the conservation of the archaeological ruins in the humid environment.

1. Introduction

Sites with soil as the main building material are called earthen sites. As places where cultural relics are preserved, the earthen site is an important component of cultural heritage that demonstrates the unique spiritual value, vitality, and creativity of a nation [1]. When the earthen site is located in a humid environment, the stability of historic constructions is degraded by high water content, high temperature, and dry and wet cycles [2,3]. When the soil mechanics soften with rainfall and groundwater, the archaeological relics suffer severe damages due to soil erosion, cracks, water seepage, fragment, soil collapse, instability, and even the total loss of structure [4,5,6,7,8]. Currently, the protection of earthen sites has gradually become the focus of multidisciplinary scientific and technological research, such as chemical, image-based, monitoring, and laser scanning technologies (Table 1).
Research has been carried out on many earthen sites (Table 2). However, damaging processes and influencing factors are very complex and often difficult to identify and quantitatively evaluate. The correlation between environmental factors and site deterioration is sometimes specialized by the different sites, thus a common model has not been proposed yet. For the earthen relics in a humid environment, the saturation zone is the surface performance of the degradation of rainfall and groundwater. For a historic soil slope, the phreatic line represents the intersection line between the free water surface and the cross section of the slope body that is formed by the water seepage from the upstream surface of the slope, through the slope body, and downstream. The soil below the phreatic line is saturated and affected by the water seepage. Therefore, the position and shape of the phreatic line in the slope surface greatly influences the shear strength of the soil material, the stability of the slope, and the seepage stability of the soil material. The determination of its location is an important part of the soil slope seepage analysis and stability analysis. Furthermore, effectively reducing the height of the phreatic line is a research topic in practical engineering.
China has a long history and culture characterized by a large number of cultural relics and historical sites [26]. The Archaeological Ruins of Liangzhu City are one of the typical representatives of earthen sites. In October 2018, a monitoring system for Liangzhu City was established and initiated. The monitoring includes overall topographic features, the characteristics of important archaeological relics, the cracks of open relics, environmental parameters, tourist management, archaeological excavation records, etc. In this study, a methodology for the analysis of the quantitative correlations between the influencing environmental factors and the water saturation induced deterioration of earthen relics is proposed.

2. Site Description and Monitoring System

2.1. Site Description

The Neolithic Archaeological Ruins of Liangzhu City (about 3300–2300 BCE) were added to the UNESCO World Heritage list during the 43rd session of the World Heritage Committee in Baku (Azerbaijan) on 6 July 2019. The ruins, with a core area covering 14.3 km2, are located in the Yangtze River Basin on the southeastern coast of China. They are considered an important representation of the early urban civilization based on the rice-cultivating agriculture as the economic foundation [27,28]. Liangzhu City has a well-planned structure consisting of a palace area, altar, moated city, outer wall, and a water conservancy system [29,30]. The peripheral Water Conservancy System of Liangzhu City, including Area of High-Dam, Area of Low-Dam, and the causeway in front of the mountains, built about 5000–4840 years ago, has multiple functions such as flood control and water storage, irrigation and transportation, which is a comprehensive management strategy for water. It is designed through unified planning at the beginning of the construction of Liangzhu City. Peripheral Water Conservancy System is the earliest large-scale water conservancy project site found in China so far and one of the earliest dam systems in the world. Liangzhu City belongs to a subtropical monsoon climate. Figure 1 is the location map of Liangzhu City.
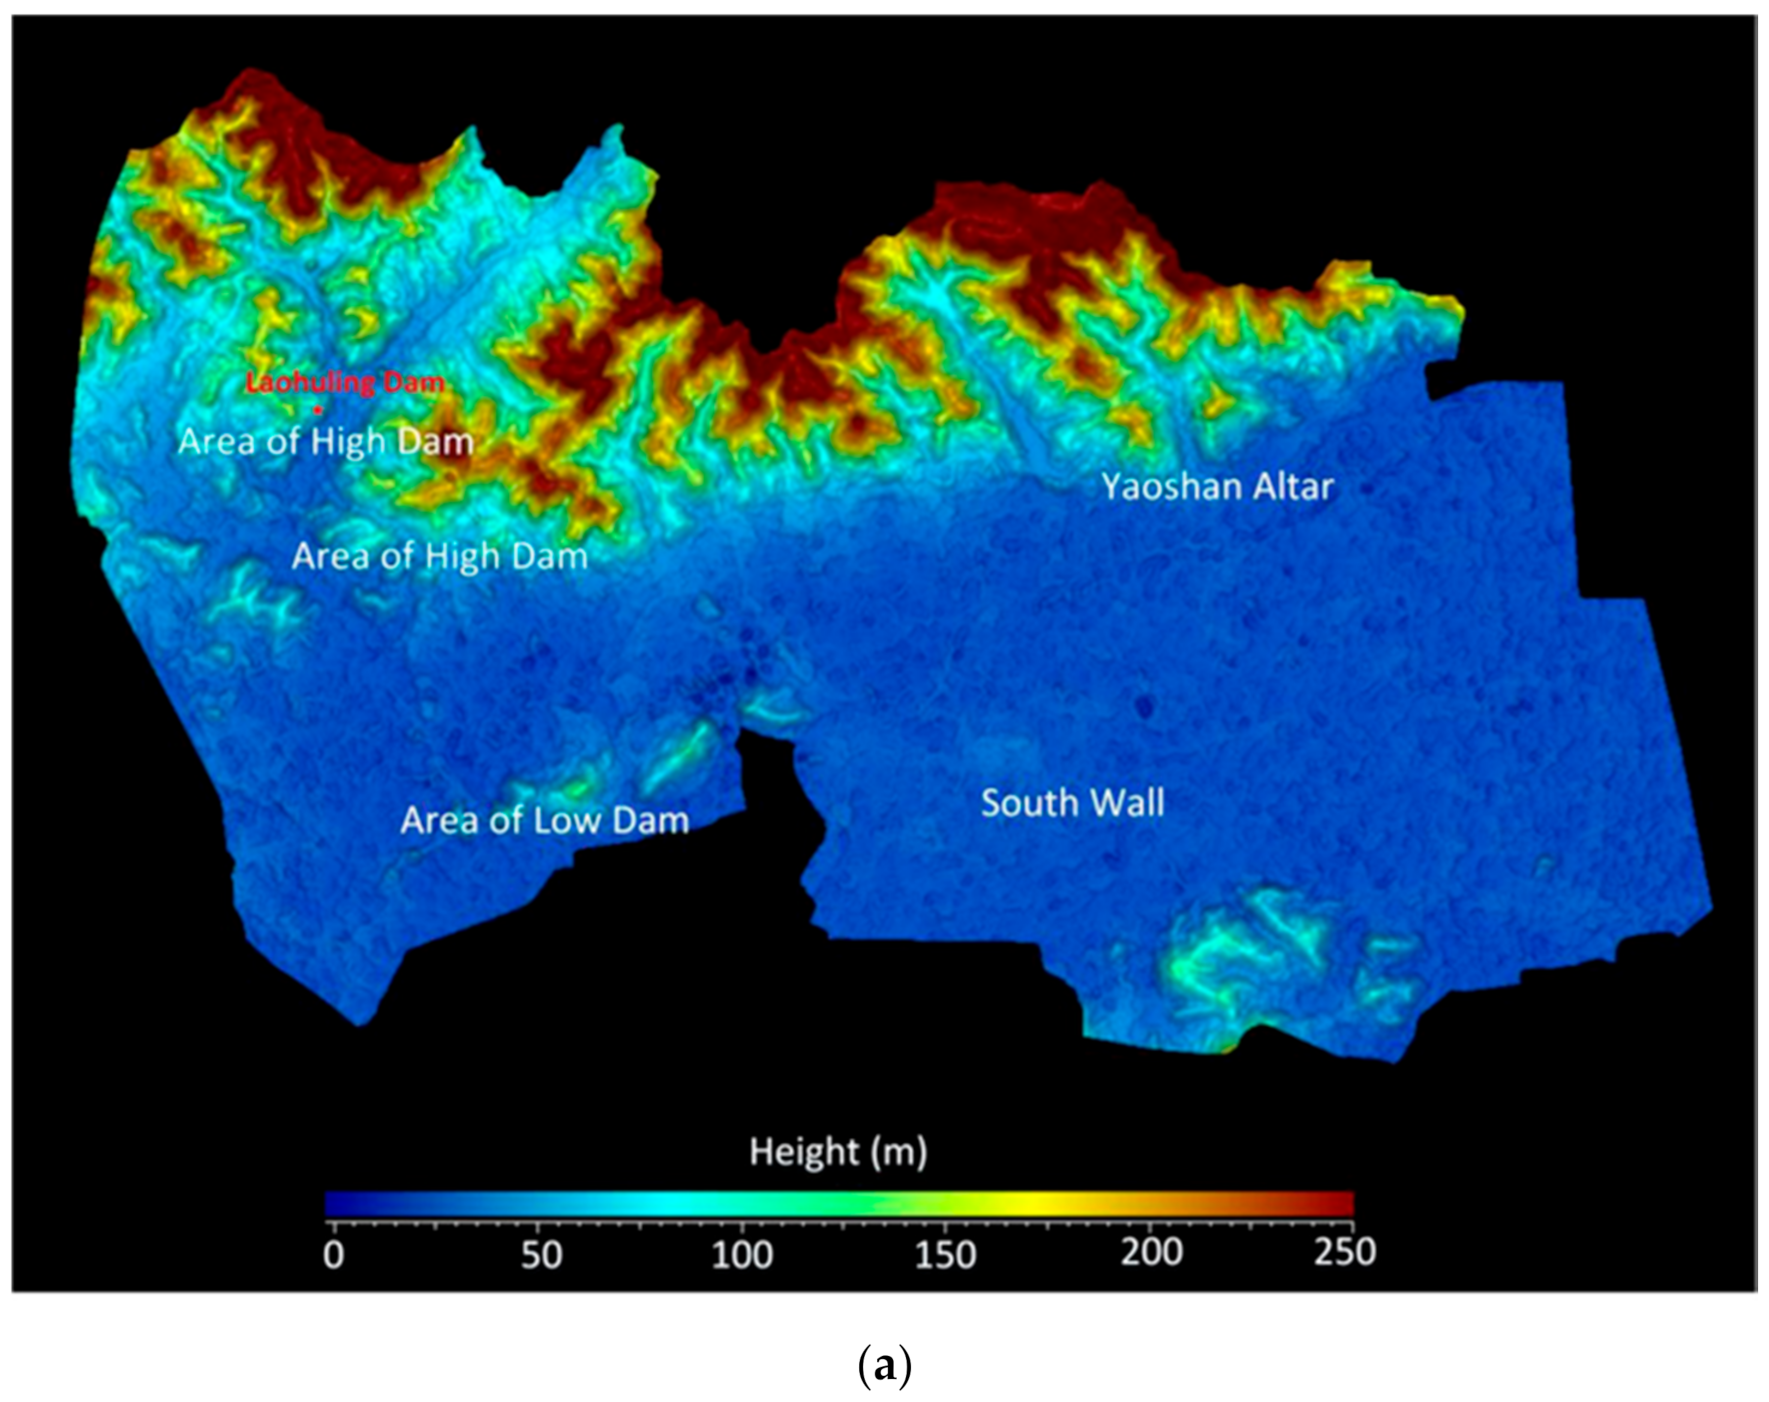
The property of Liangzhu City is composed of four areas: (i) the Area of Yaoshan Site, (ii) the Area of High-dam at the Mouth of the Valley, (iii) the Area of Low-dam on the Plain, and (iv) the Area of City Site. Currently, only four relics in Liangzhu City are excavated, which are the Mojiaoshan Palace, the Laohuling dam site, the southern wall, and the Yaoshan altar. The four relics are damaged by the rainfall and groundwater of the environment since excavated. The Laohuling dam is part of the Area of High-dam, which was excavated in 2016 (Figure 2).
The Laohuling dam is mainly composed of silty clay soil with hydrological conditions closely related to the surrounding environment. The open Laohuling dam relic has an inverted “U” shape, which means that the water will flow to the Laohuling dam from the nearby mountains. It can be divided into the east section, south section, and west section. The east section is from southwest to northeast and is facing northwest, with a length of about 14 m and a relative height from 2.1 m to 4.1 m. The south section is from southeast to northwest and is facing northeast, with a length of about 33 m and a relative height from 3.2 m to 5.9 m. This area represents the main excavation section. The west section is from south to north and is facing east, with a length of about 18.7 m and a relative height from 2.9 m to 4.1 m.
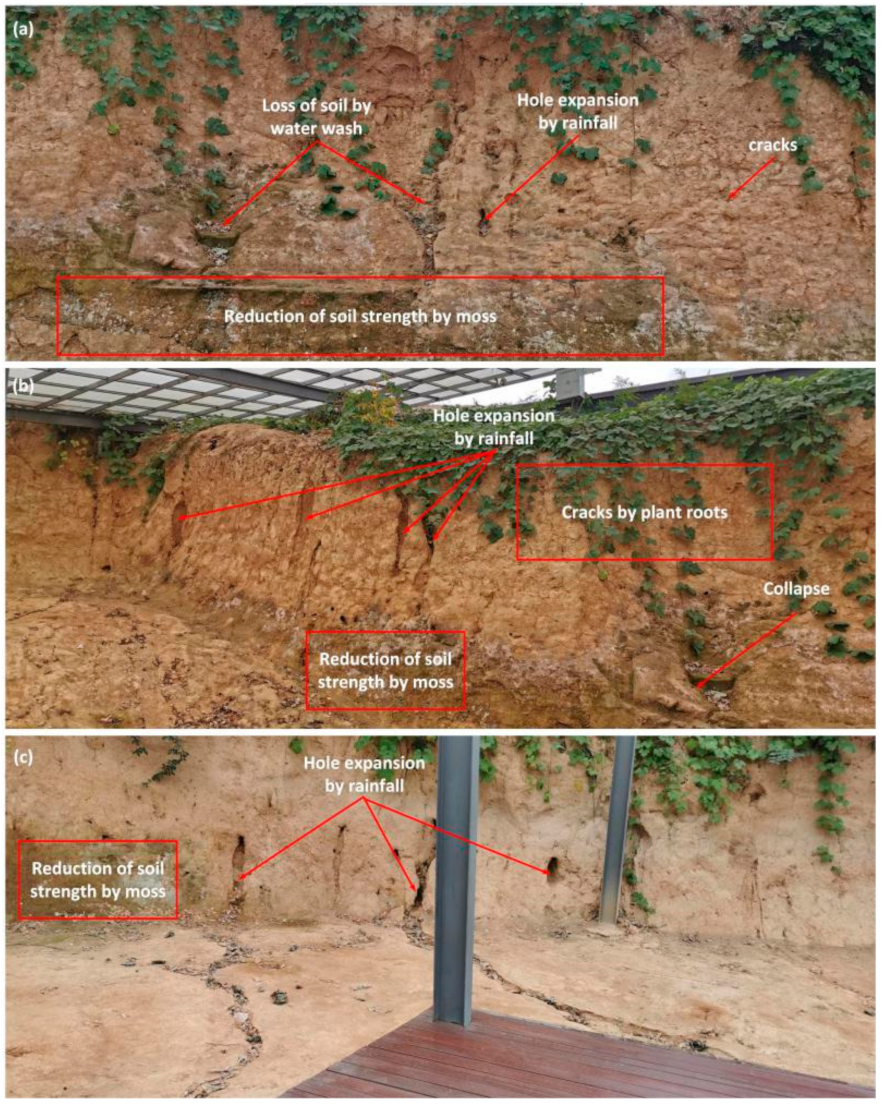
According to an investigation of the Archaeological Ruins of Liangzhu City, typical structural deterioration in the Laohuling dam relics was caused by the humid climate (Figure 3). Firstly, a lot of soil cracks appeared when the dam relic was exposed to the air. Furthermore, some of the fracture channels experienced water seepage during rainy conditions. Secondly, a high saturation line was formed by the capillary water infiltration, and the soil mechanical properties at the foot of the slope were weakened due to the immersion of water. Thirdly, due to alternating dry–wet cycles, the silty clay soil started to shrink and swell, which resulted in the expansion of cracks and numerous local collapses. Fourthly, the collapse and holes in the slope expanded, thus leading to large and visible deformations. From the excavation year of 2016 till now, the instability of the structure, the surface cracks, holes, and loss of soils have been investigated. The results from the field survey showed that the Laohuling dam relic is a representative area for the research of earthen archaeological sites as it contains almost all types of damage occurring in a humid earthen site.

2.2. Monitoring System

The Liangzhu Site Management Committee monitors the environmental conditions of the open Laohuling dam relic. This mainly includes monitoring atmospheric, groundwater, and soil moisture conditions. This monitoring system has been operating since October 2018, and its components are shown in Table 3.
Other than the monitored components in Table 3, periodical images of the Laohuling dam site were shot using installed high-resolution cameras to collect daily information on the important parts with cracks, holes, or other damages. The camera can rotate automatically according to the set direction of 45°, covering the surface of the dam site. The Digital Single Lens Reflex (SLR) camera with 4000 k resolution and a maximum focal length of 20 mm was chosen. Manual inspection was also performed daily in order to protect the archaeological relics. The environment in the glass shed is different from the outside especially in the summer days and rainy days. The current monitoring system only focuses on the meteorological, groundwater, and soil information surrounding the study area. As the dimensions of the Laohuling dam site are small, the position of the environment monitoring device is in the center of the dam area. In order to improve the correlation analysis, more indexes need to be monitored in the future.

3. Identification of the Saturation Area

The saturation of the slope foot can weaken the stability of the dam site by reducing the shear strength of the soil. The photos of the saturation area were taken by the SLR camera. The dimensions of the saturation area can be identified by image recognition technology. After applying the algorithm to identify the saturation area, the position and time of the image with the best recognition effect can be recorded as the measuring point for further data acquisition.

3.1. Image Recognition

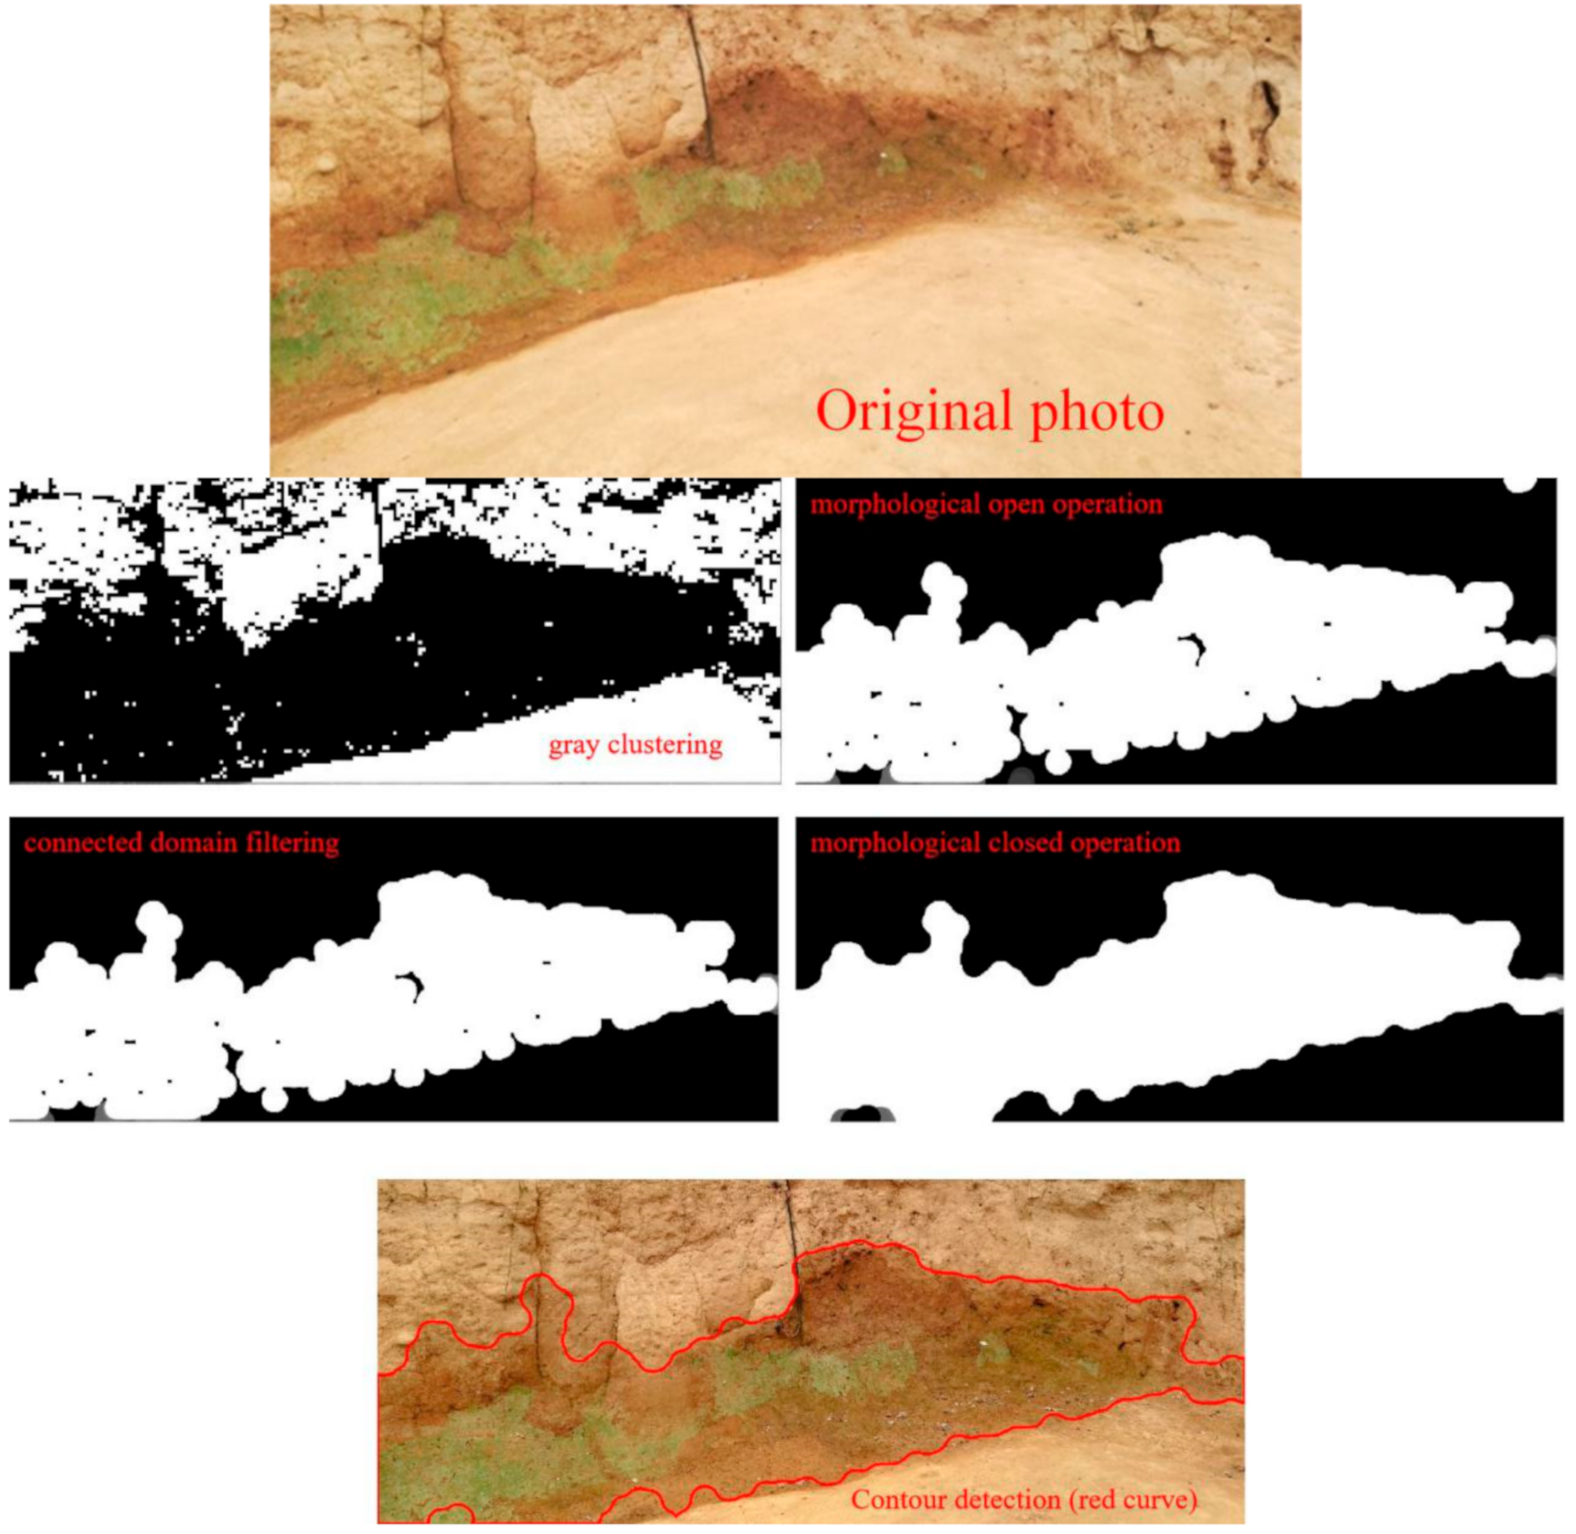
The gray clustering algorithm was applied to separate the saturation area and the dry area. The main steps for identification of the saturation area were processed as follows (Figure 4):
  • To improve algorithm efficiency, a square of 9 pixels by 9 pixels was selected as the clustering object. The average pixel value for gray and blue channels in the square was calculated. Then, the average value of these two channels was used as the clustering feature. As clustering is an unsupervised learning method, it can only divide the image pixels into two categories, yet it cannot indicate whether black or white colors belong to the saturation area. Therefore, further feature screening was needed to confirm the category. Here, we set white to represent the saturation area.
  • There were a large number of discrete points in the output of the previous clustering method. Therefore, we applied a morphological method for further image optimization. Morphological open operations were applied to smooth the regional boundary and eliminate discrete pixels.
  • After the application of the morphological open operations, a few scattered white areas remained as they were mistakenly identified as saturation area. Two regions were classified by the connected domain filtering. Furthermore, small and scattered white areas were removed from the saturation area.
  • After filtering the connected domain, the saturation area was identified. However, there were a few black pixels in the white area, so we used the morphological closed operation to fill them. In this step, all cavities in the region were filled and the adjacent region was connected.
  • Contour detection was used to mark the edge of the saturation area. Accordingly, the edge of the saturation region was identified, and the pixel area of the saturation region was calculated.
Finally, the area in the red circle in Figure 4 was identified as the saturation area. The detected area by the algorithm was fit to the actual situation. The image recognition process can be used to calculate the dimensions of the saturation area, which is a performance of the deterioration of the dam site. As the camera takes 12 photos every day, the automatic process is necessary. Thus, the process of the image recognition was coded, the saturation area can be automatically identified when the images are input.

3.2. Identification of the Saturation Area of Laohuling Dam Site

A small region with the largest saturation area at the foot of the Laohuling dam site was selected as the study area. During 2019, 678 images of the study area were collected. However, only 191 images could visualize the deterioration area clearly. Other images could not be used for recognition because of the shadow of sunshine. The proposed image recognition algorithm was applied to identify and calculate the saturation area. The area with wet pixels (i.e., white pixels) ranged from 11,853 to 797,762. The pixel area can be converted into actual dimensions of the saturation area by applying the information related to the shooting angle, shooting distance, and lens focal length. Due to the lack of relevant information, pixel area was used in the analysis. Among the identified wet areas, 171 days had a wet pixel area with less than 10,000 pixels, which accounted for 46.85% of the whole year (including image missing days and dry days); 24 days had a wet pixel area of 10,000–200,000, which accounted for 6.58% of the whole year; 40 days had a wet pixel area of 200,000–400,000, and it accounted for 10.96% of the whole year; 87 days had a wet pixel area of 400,000–600,000, which accounted for 23.84% of the whole year. Finally, 21 days had a wet pixel area of 600,000–800,000, and it accounted for 5.75% of the whole year.

4. Correlation Analysis and Factor Analysis

The following processes are used to analyze the correlation between the environmental parameters and the saturation area.
First of all, the correlations between the monitored environmental parameters were assessed with the correlation analysis. The multi-collinearity analysis was performed for the data group with high correlation coefficients. Variance expansion factor and condition numbers were also used to determine whether multi-collinearity existed or not.
Secondly, multiple regression analysis was carried out. Data were collected at different temporal scales (e.g., seconds, hours, days), and the daily average was calculated for each factor. Multiple correlation analysis was performed to test the correlation between the monitoring data (x) and the dimension of the saturation pixel area (y). Regression analysis and recursive feature elimination were applied to select the monitoring indicators with statistical significance. Afterward, the regression model can be established. In the current research area, only one-year data can be used to establish the regression model, which is not reliable enough. The regression model needs to be optimized after collecting data for more years.
Factor analysis represents a statistical technique for the extraction of common factors from variable groups, and it decomposed the monitoring indicators into two parts (a common factor group and a special factor group) by applying the principal component analysis (PCA). Accordingly, the same information dispersed across multiple variables will be concentrated. The Kaiser–Meyer–Olkin (KMO) measure and Bartley sphere tests should be performed on the original dataset to check whether the data is suitable for factor analysis. The closer the KMO measure to 1, the better the effect of factor analysis is. Bartley sphere test is used to test whether each variable in the correlation matrix is independent. If the original hypothesis is rejected, factor analysis can be done. For factor analysis of normalized data, the number of common factor groups can be determined by a scree plot, or by a common factor with an eigenvalue greater than 1. Eigenvalues represent the ability of common factors to explain the information of all variables. Eigenvalues greater than 1 indicate that the explanatory power of a common factor is at least greater than the average explanatory power of one primary variable. Furthermore, the model can retain most of the internal information of the original data structure through factor rotation. Thus, it can better explain the influences of the environmental factors on changes of saturation area.

5. Results

5.1. Regression Model

The correlation analysis of 33 monitoring indicators revealed that 11 monitoring indicators are significantly related to the saturation area. These indicators are: “PH value”, “soil moisture 0 cm horizontal”, “soil moisture 450 cm vertical”, “soil temperature 100 cm horizontal”, “soil temperature 50 cm horizontal”, “soil temperature 0 cm horizontal”, “groundwater level”, “soil temperature 400 cm vertical”, “atmospheric radiation”, “rainfall”, and “three days of cumulative rainfall”. The coefficient of determination of the multiple-factor model R2 was 0.85 and the optimal multiple regression model was established.
Theoretically, the saturation dimension of the research area can be calculated by applying the below regression model:
Wet pixel area = −0.59 + 0.9 * “PH” + 0.77*“groundwater level” + 0.26 * “atmospheric radiation” + 0.34 * “rainfall” − 0.34 * “three day cumulative rainfall” − 1.85 * “soil moisture 0 cm horizontal” + 0.81 * “soil moisture 450 cm vertical” − 7.06 * “soil temperature 0 cm horizontal” − 19.56 * “Soil temperature 100 cm horizontal” − 1.46 * “Soil temperature 400 cm vertical” + 27.07 * “Soil temperature 50 cm horizontal”
Based on the regression model, the saturation area can be calculated by the values of the 11 monitoring indicators. Thus, the deterioration through the saturation area can be mitigated by controlling the 11 monitoring indicators.
Multiple regression analysis showed that monitoring factors, such as soil temperature at different depths, have strong correlations with the wet pixel area. The strongest correlation (−0.7) with the wet pixel area is from the value of “soil temperature 0 cm horizontal”. That is, when the value of “soil temperature 0 cm horizontal” increased, then the wet pixel area decreased significantly.

5.2. Factor Analysis

The KMO statistic was 0.79, and the Bartley sphere test p-value was 0, which indicated that the factor analysis is suitable for the original dataset. The results of factor analysis show that five groups of common factors were intercepted and retained. Five factors were rotated by varimax orthogonal factors to maximize the variance of each factor. After the factor rotation, the matrix of factor load can be obtained. Factor load represents the correlation coefficient between variables and a common factor. Furthermore, five groups of common factors consist of different indicators, and the results of factor analysis are obtained.
The first group consists of mostly temperature-related monitoring indicators, and it includes: “soil temperature 0 cm horizontal”, “soil temperature 50 cm horizontal”, “soil temperature 100 cm horizontal”, “soil temperature 300 cm vertical”, “Soil temperature 400 cm vertical”, “Soil temperature 450 cm vertical”, “soil humidity 0 cm horizontal”, “soil humidity 300 cm vertical”, “soil humidity 400 cm vertical”, “atmospheric temperature(q)”, “PM25”, “groundwater temperature”, and “groundwater PH”. The highest factor load among the 13 variables was 0.981 for “soil temperature 300 cm vertical”, with other soil temperature factor loads greater than 0.9. Accordingly, the common factor is called the temperature factor, and it explains 32.6% of the overall variance.
The second group consists of mostly humidity-related monitoring indicators, and it includes: “soil moisture 50 cm horizontal”, “soil moisture 100 cm horizontal”, “soil moisture 450 cm vertical”, “groundwater level”, “PH(q)”, and “turbidity”. The highest factor load was 0.908 for “soil moisture 100 cm horizontal”, and other soil humidity factor loads were greater than 0.8. Thus, the second group of common factors is called the humidity factor, and it explains 17.4% of the total variance.
The third group consists of mostly environment-related monitoring indicators, and it includes: “noise”, “illumination”, “wind direction(q)”, “atmospheric radiation”, and “wind speed(q)”. The highest factor load was 0.841 for “atmospheric radiation”, while the factor load of “illuminance” was 0.809. Thus, the third group of common factors is called the environmental factor, and it explains 11.2% of the total variance.
The fourth group consists of mostly rainfall-related monitoring indicators, and it includes: “rainfall”, “three days cumulative rainfall”, and “CO2”. The highest factor load was 0.856 for “rainfall”, while the load of the “three-day cumulative rainfall” factor was 0.843. Thus, the fourth group of common factors is called the rainfall factor, and it explains 7.2% of the total variance.
The fifth group consists of mostly oxygen-related monitoring indicators, and it includes “dissolved oxygen” and “conductivity”. The highest factor load was 0.805 for “conductivity”, while factor load was 0.611 for “dissolved oxygen”. Thus, the fifth group of common factors is called the oxygenated factor, and it explains 5.5% of the total variance.
Regrouping of common factors can prevent information fragmentation caused by the analysis of each monitoring indicator, and it also reduces the analysis of highly correlated factors. Table 5 shows the calculated weight rankings of monitoring factors for the wet pixel area of the research area.

6. Discussion and Conclusions

Environmental parameters such as temperature, moisture, groundwater, rainfall, and wind can cause severe damage to earthen archaeological ruins. In order to protect the earthen ruins, an advanced monitoring system is usually adopted worldwide. The current study applied correlation analysis, regression analysis, and factor analysis in order to identify the main influencing factors of the saturation induced deterioration of an earthen site.
A regression model to calculate the wet pixel area (represented as the saturation area) by monitoring indexes was established, which can be used to support the environmental control of the protected area. By the model, the change of the dimension of the saturation area can be calculated and forecasted by the indicators of “PH value”, “soil moisture 0 cm horizontal”, “soil moisture 450 cm vertical”, “soil temperature 100 cm horizontal”, “soil temperature 50 cm horizontal”, “soil temperature 0 cm horizontal”, “groundwater level”, “soil temperature 400 cm vertical”, “atmospheric radiation”, “rainfall”, and “three days of cumulative rainfall”. The regression model should be optimized in the future based on more trained data from the monitoring system and the identification of the dimensions of the saturation area.
Temperature and humidity are widely demonstrated as the most significant factors destroying earthen ruins. In the current study, the damage of temperature and humidity to different parts of the Laohuling dam relic was classified. The temperature factor group explained nearly one-third of the information in the model, and accordingly, it represents the most important group of common factors. In the temperature group, the most important components are represented by the six monitoring indicators in Table 5. The second most important group is the humidity factor that explained nearly one-fifth of the model’s information. The important components of the humidity factor are “soil moisture 50 cm horizontal”, “soil moisture 100 cm horizontal”, “soil moisture 450 cm vertical”, and “groundwater level”. The important indexes from the temperature and humidity factor groups should be paid more attention during the design of the conservation treatment and routine maintenance.
The proposed methodology could be used to analyze the monitoring data and to calculate the dimensions of the saturation area. The current study provided preliminary results for predicting further saturation-induced deterioration of earthen objects in the Archaeological Ruins of Liangzhu City. The micro-environment in the glass shed of the Laohuling dam site will be controlled in the future by the installation of dehumidifiers and automatic sprinklers, as well as the construction of a waterproof curtain underground. The regression model can provide scientific recommendations for the performance of the environmental control machines. Thus, the conservation and protection of the relics in the humid environment will be more reliable. The image recognition algorithm, correlation analysis process, and factor analysis process can be adopted by other archaeological ruins to analyze monitoring data and acquire useful features from the dataset for protection.

Author Contributions

Conceptualization, M.D., H.H. and R.A.; methodology, M.D., H.H. and Q.G.; data curation, Q.G. and M.K.; writing—original draft preparation, M.D. and H.H.; writing—review and editing, M.D., X.G. and R.A.; supervision, X.G.; funding acquisition, Q.G. and M.D. All authors have read and agreed to the published version of the manuscript.

Funding

This research was funded by Zhejiang Provincial Research Project of Conservation Science and Technology, grant number 2021021; and the Project of the Development of the Non-destructive Monitoring Technology for the Liangzhu Ancient City Ruins support by Hangzhou Liangzhu Archaeological Site World Heritage Monitoring and Management Center in 2019.

Conflicts of Interest

The authors declare no conflict of interest.

References

  1. Delgado Rodrigues, J.; Ferreira Pinto, A.; Rodrigues da Costa, D. Tracing of decay profiles and evaluation of stone treatments by means of microdrilling techniques. J. Cult. Herit. 2002, 3, 117–125. [Google Scholar] [CrossRef]
  2. Houben, H.; Guillaud, H. Earth Construction: A Comprehensive Guide; Intermediate Technology Publication: London, UK, 1994. [Google Scholar]
  3. Wang, X.D. Exploration of Conservation Philosophy for Earthen Sites in Humid Environments and an Outlook on Future Conservation Technology. Dunhuang Res. 2013, 1, 1–7. [Google Scholar] [CrossRef]
  4. Xu, Y.Y.; Wang, S.J.; Zhang, B.J. Investigation and research on relics diseases of the earthen site of Kuahuqiao Site Museum. Cult. Relic Prot. Archaeol. Sci. 2018, 30, 53–62. [Google Scholar] [CrossRef]
  5. Zhang, H.Y.; Li, M.; Wang, X.D. Status and counter measures of conservation of earthen monuments in moist circumstances. Dunhuang Res. 2011, 6, 70–75. [Google Scholar]
  6. Schulz, W.H.; Smith, J.B.; Wang, G.; Jiang, Y.; Roering, J.J. Clayey landslide initiation and acceleration strongly modulated by soil swelling. Geophys. Res. Lett. 2018, 45, 1888–1896. [Google Scholar] [CrossRef]
  7. Wu, F.S.; Wang, W.F.; He, D.P.; Xu, R.H.; Su, B.M. Analysis of Algae Growing on the Surface of the North City Wall of Liangzhu Site. Dunhuang Res. 2014, 4, 114–120. [Google Scholar] [CrossRef]
  8. Pan, C.G.; Chen, K.Y.; Chen, D.T.; Xi, S.C.; Geng, J.; Zhu, D.Y. Research progress on in-situ protection status and technology of earthen sites in moisty environment. Constr. Build. Mater. 2020, 253, 119219. [Google Scholar] [CrossRef]
  9. Elert, K.; Pardo, E.S.; Rodriguez-Navarro, C. Alkaline activation as an alternative method for the consolidation of earthen architecture. J. Cult. Herit. 2015, 16, 461–469. [Google Scholar] [CrossRef]
  10. Lv, J.; Zhou, T.H.; Du, Q.; Wu, H.H. Experimental investigation on properties of gypsum-quicklime-soil grout material in the reparation of earthen site cracks. Constr. Build. Mater. 2017, 157, 253–262. [Google Scholar] [CrossRef]
  11. Li, M.; Zhang, H. Hydrophobicity and carbonation treatment of earthen monuments in humid weather condition. Sci. China Ser. E Technol. Sci. 2012, 55, 2313–2320. [Google Scholar] [CrossRef]
  12. De Reu, J.; De Smedt, P.; Herremans, D.; Van Meirvenne, M.; Laloo, P.; De Clercq, W. On introducing an image-based 3D reconstruction method in archaeological excavation practice. J. Archaeol. Sci. 2014, 41, 251–262. [Google Scholar] [CrossRef]
  13. De Reu, J.; Plets, G.; Verhoeven, G.; De Smedt, P.; Bats, M.; Cherretté, B.; De Maeyer, W.; Deconynck, J.; Herremans, D.; Laloo, P.; et al. Towards a three-dimensional cost-effective registration of the archaeological heritage. J. Archaeol. Sci. 2013, 40, 1108–1121. [Google Scholar] [CrossRef]
  14. Watanabe, N.; Nakamura, S.; Liu, B.; Wang, N.Y. Utilization of Structure from Motion for processing CORONA satellite images: Application to mapping and interpretation of archaeological features in Liangzhu Culture, China. Archaeol. Res. Asia 2017, 11, 38–50. [Google Scholar] [CrossRef]
  15. Fujii, Y.; Fodde, E.; Watanabe, K.; Murakami, K. Digital photogrammetry for the documentation of structural damage in earthen archaeological sites: The case of Ajina Tepa, Tajikistan. Eng. Geol. 2009, 105, 124–133. [Google Scholar] [CrossRef] [Green Version]
  16. Lercari, N. Monitoring earthen archaeological heritage using multi-temporal terrestrial laser scanning and surface change detection. J. Cult. Herit. 2019, 39, 152–165. [Google Scholar] [CrossRef] [Green Version]
  17. Barton, J. 3D laser scanning and the conservation of earthen architecture: A case study at the UNESCO World Heritage Site Merv, Turkmenistan. World Archaeol. 2009, 41, 489–504. [Google Scholar] [CrossRef]
  18. Xiao, Y.; Chen, X.; Wang, L.; Li, W.; Liu, B.; Fang, D. An immune theory based health monitoring and risk evaluation of earthen sites with internet of things. In Proceedings of the IEEE International Conference on Green Computing and Communications (GreenCom) and Internet of Things (iThings) and IEEE Cyber, Physical and Social Computing (CPSCom), Bejing, China, 20–23 August 2013. [Google Scholar]
  19. Torres, J.A.; Hernandez-Lopez, D.; Gonzalez-Aguilera, D.; Hidalgo, M.A.M. A hybrid measurement approach for archaeological site modelling and monitoring: The case study of Mas D’Is, Penàguila. J. Archaeol. Sci. 2014, 50, 475–483. [Google Scholar] [CrossRef]
  20. Kong, D.Q.; Wan, R.; Chen, J.X.; Jing, Y.L.; Huang, W.M.; Wang, Y.H. The study on engineering characteristics and compression mechanisms of typical historical earthen site soil. Constr. Build. Mater. 2019, 213, 386–403. [Google Scholar] [CrossRef]
  21. Zhang, Q.Y.; Chen, W.W.; Fan, W.J. Protecting earthen sites by soil hydrophobicity under freeze–thaw and dry–wet cycles. Constr. Build. Mater. 2020, 262, 120089. [Google Scholar] [CrossRef]
  22. Fodde, E.; Watanabe, K.; Fujii, Y. Preservation of Earthen Sites in Remote Areas: The Buddhist Monastery of Ajina Tepa, Tajikistan. Conserv. Manag. Archaeol. Sites 2007, 9, 194–218. [Google Scholar] [CrossRef] [Green Version]
  23. Zhang, M.Q.; Zhang, L.; Wang, X.D.; Ma, K.J.; Lu, X. Establishment and application of an index system discriminating the dry and humid environment in the earthen monument protection on archaeological sites. J. Lanzhou Univ. 2013, 49, 465–469. [Google Scholar]
  24. Wang, Y.W.; Li, G.Q. Experimental study on the selection of materials for reinforcement and protection of earthen archaeological sites in humid environments-On the Fujian Tanshishan site. Sci. Conserv. Archaeol. 2014, 26, 8–21. [Google Scholar] [CrossRef]
  25. Du, Y.M.; Chen, W.W.; Cui, K.; Gong, S.Y.; Pu, T.B.; Fu, X.L. A model characterizing deterioration at earthen sites of the Ming Great Wall in Qinghai Province, China. Soil Mech. Found. Eng. 2017, 53, 426–434. [Google Scholar] [CrossRef]
  26. Liu, L.; Chen, X. The Archaeology of China: From the Late Paleolithic to the Early Bronze Age (Cambridge World Archaeology); Cambridge University Press: Cambridge, UK, 2012. [Google Scholar]
  27. Wang, X.C.; Mo, D.W.; Li, C.H.; Yu, S.Y.; Xue, B.; Liu, B.; Wang, H.; Shi, C.X. Environmental changes and human activities at a fortified site of the Liangzhu culture in eastern China: Evidence from pollen and charcoal records. Quat. Int. 2017, 438, 189–197. [Google Scholar] [CrossRef]
  28. Renfrew, C.; Liu, B. The emergence of complex society in China: The case of Liangzhu. Antiquity 2018, 92, 975–990. [Google Scholar] [CrossRef]
  29. Liu, B.; Wang, N.; Chen, M.; Wu, X.; Mo, D.; Liu, J.; Xu, S.; Zhuang, Y. Earliest hydraulic enterprise in China, 5100 years ago. Proc. Natl. Acad. Sci. USA 2017, 114, 13637–13642. [Google Scholar] [CrossRef] [Green Version]
  30. Wang, N.Y. Survey and excavation of the water conservancy system in Liangzhu City and surroundings. Res. Herit. Preserv. 2016, 1, 102–110. [Google Scholar] [CrossRef]
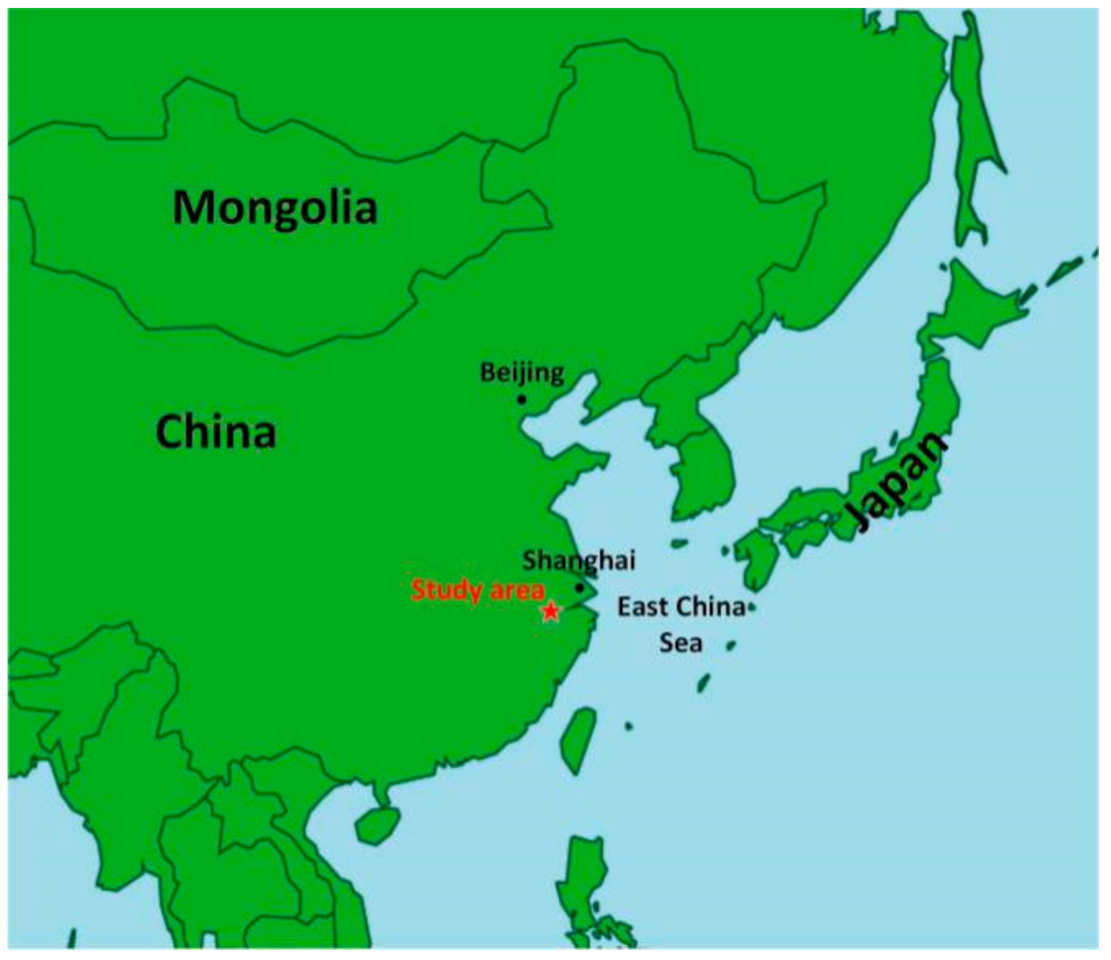
Figure 1. Location map of the study area.
Heritage 04 00024 g001
Figure 2. (a): The digital elevation model of Liangzhu City. (b): Overview of the open Laohuling dam relics.
Heritage 04 00024 g002aHeritage 04 00024 g002b
Figure 3. Photos showing the deterioration of the open Laohuling dam relic on 4 December 2020 ((a): south section, (b): east section, (c): west section).
Heritage 04 00024 g003
Figure 4. Steps for identifying the saturation area.
Heritage 04 00024 g004
Table 1. A selection of technologies for cultural relic protection.
TechnologyKey ResultsReferences
Chemical Technologyalkaline activation as an alternative consolidation treatment for clayey materialsElert et al., 2015 [9]
a new type of grout material composed of gypsum, quicklime, soil, and admixtures for cracks reparationLv et al., 2017 [10]
the tentative protection treatment of earthen monuments with tung oil and quicklimeLi et al., 2012 [11]
Image-based Technologythe image-based technology for mapping, restoring, and interpreting the archaeological heritagesDe Reu et al., 2013, 2014 [12,13], Watanabe et al., 2017 [14]
the digital photogrammetry technology for the documentation of structural damageFujji et al., 2009 [15]
Laser scanning Technologythe laser scanning technologies for the conservation of the archaeological heritageLercari 2019 [16] and Barton 2019 [17]
Monitoring Technology the Internet of Things based health monitoring and risk evaluation for protection of earthen sitesXiao et al., 2013 [18]
a hybrid measurement for the monitoring and modeling of earthen sitesTorres et al., 2014 [19]
Table 2. A selection of research studies on earthen sites.
Key StudyStudy SiteReferences
Evaluation of the engineering characteristics and the compaction mechanisms of the earthen siteTongwan City in ChinaKong et al., 2019 [20]
Exploration of the phenomenon and effects of dry–wet and freeze–thaw cycles on the hydrophobicity of polyvinyl alcohol composite soilLanzhou City in ChinaZhang et al., 2020 [21]
Exploration of the repair materials and conservation technologiesThe Buddhist Monastery of Ajina Tepa in TajikistanFodde et al., 2007 [22]
Establishment of an index system to discriminate the dry and humid environment in the earthen monument protectionLiangzhu City in ChinaZhang et al., 2013 [23]
Experiments on selected materials for reinforcement and protection of earthen archaeological sites in humid environmentFujian Tanshishan site in ChinaWang and Li 2014 [24]
Exploration of the different types of deteriorationMing Great Wall in ChinaDu et al., 2016 [25]
Table 3. Monitoring components of the Laohuling dam relic.
Monitoring ComponentMonitoring Indicators (Precision)No. of Devices
GroundwaterLevel (±2 cm)2
PH value (±0.01), conductivity (1%), turbidity (±3%), and dissolved oxygen (0.2 mg/L)1
Soilsoil moisture (±3%)1
Environment in the glass shedwind speed (0.3 m/s) and direction (3°), atmospheric humidity (3%), and atmospheric temperature (0.3 °C)1
Regional environment outside of the glass shedPM2.5 (0.03 μg/ m3), carbon dioxide (± 3%), noise (1.5 dB), negative oxygen ion (15%), illumination (3%), atmospheric radiation, salinity (2%), atmospheric humidity (3%), atmospheric temperature (0.2 °C), wind direction (3°), wind speed (0.1 m/s), air pressure (0.1%FS), soil humidity (0.1%), soil temperature (0.1 °C), and rainfall (2%)1
A total of 33 monitoring indicators are recorded (Table 4).
Table 4. Descriptions of the monitoring indicators.
Monitoring ContentDescription of Monitoring Indicators
Groundwatergroundwater level, groundwater temperature
dissolved oxygen, turbidity, groundwater PH, conductivity
Soilsoil moisture 0 cm horizontalThree sensors are installed vertically in the west section and another three are installed horizontally in the south section. The length data means the inserted depth of the sensors.
soil moisture 50 cm horizontal
soil moisture 100 cm horizontal
soil moisture 300 cm vertical
soil moisture 400 cm vertical
soil moisture 450 cm vertical
soil temperature 0 cm horizontal
soil temperature 50 cm horizontal
soil temperature 100 cm horizontal
soil temperature 300 cm vertical
soil temperature 400 cm vertical
soil temperature 450 cm vertical
Environment in the glass shedwind speed, wind direction, atmospheric humidity, atmospheric temperature
Regional environment outside of the glass shedPM25, carbon dioxide (CO2), noise, PH value(q), illumination, wind direction(q), atmospheric radiation, air pressure, atmospheric temperature(q), rainfall, wind speed(q)“(q)” distinguishes the same indicator from the environment in the glass shed.
Table 5. Calculated weights of monitoring factors to the wet pixel area of the research area.
Common FactorFactor WeightFactor ComponentFactor Load
Temperature factor0.326Soil temperature 300 cm vertical0.981
Soil temperature 400 cm vertical0.974
Soil temperature 450 cm vertical0.973
Soil temperature 0 cm horizontal0.967
Soil temperature 50 cm horizontal0.959
Soil temperature 100 cm horizontal0.952
Humidity factor0.174Soil moisture 100 cm horizontal0.908
Soil moisture 50 cm horizontal0.879
Soil moisture 450 cm vertical0.827
Groundwater level0.824
Environmental Factors0.112atmospheric radiation0.841
Illumination0.809
Rainfall factor0.072Rainfall0.856
Three days accumulative rainfall0.843
Oxygenated factor0.055Conductivity0.808
Dissolved oxygen0.611
Publisher’s Note: MDPI stays neutral with regard to jurisdictional claims in published maps and institutional affiliations.