Ag-Nanostars for the Sensitive SERS Detection of Dyes in Artistic Cross-Sections—Madonna della Misericordia of the National Gallery of Parma: A Case Study


Abstract

1. Introduction
2. Materials and Methods
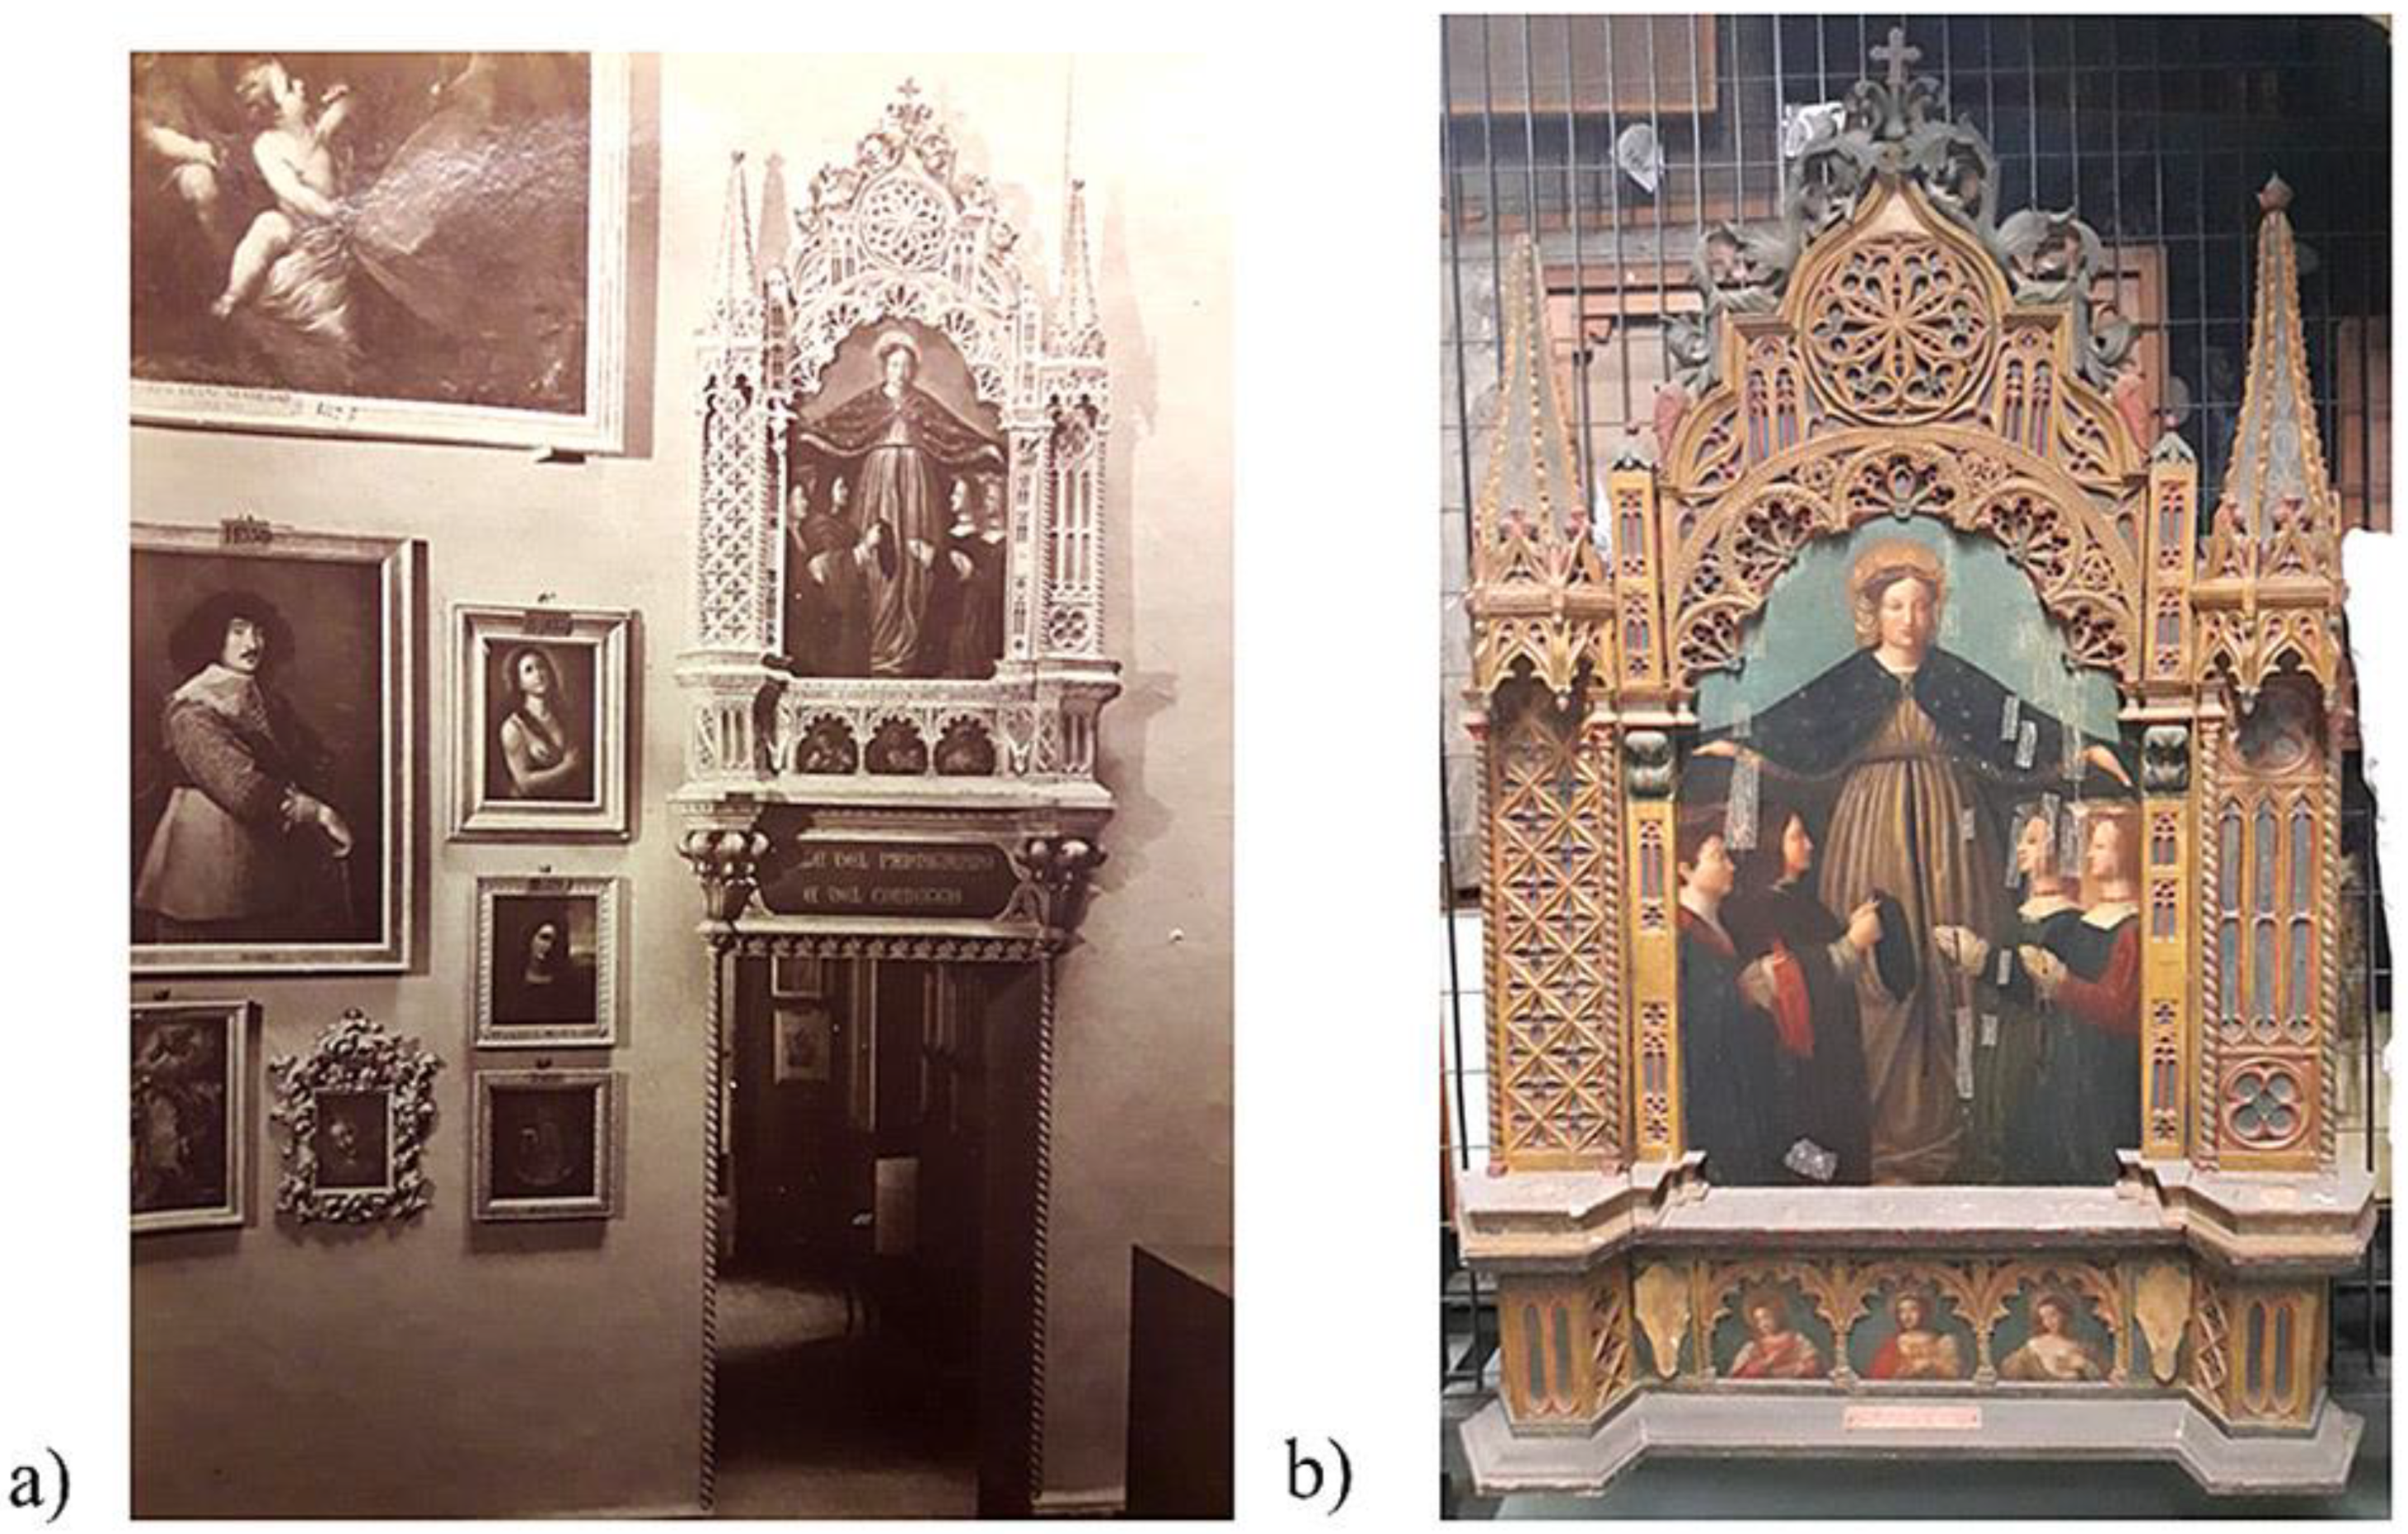
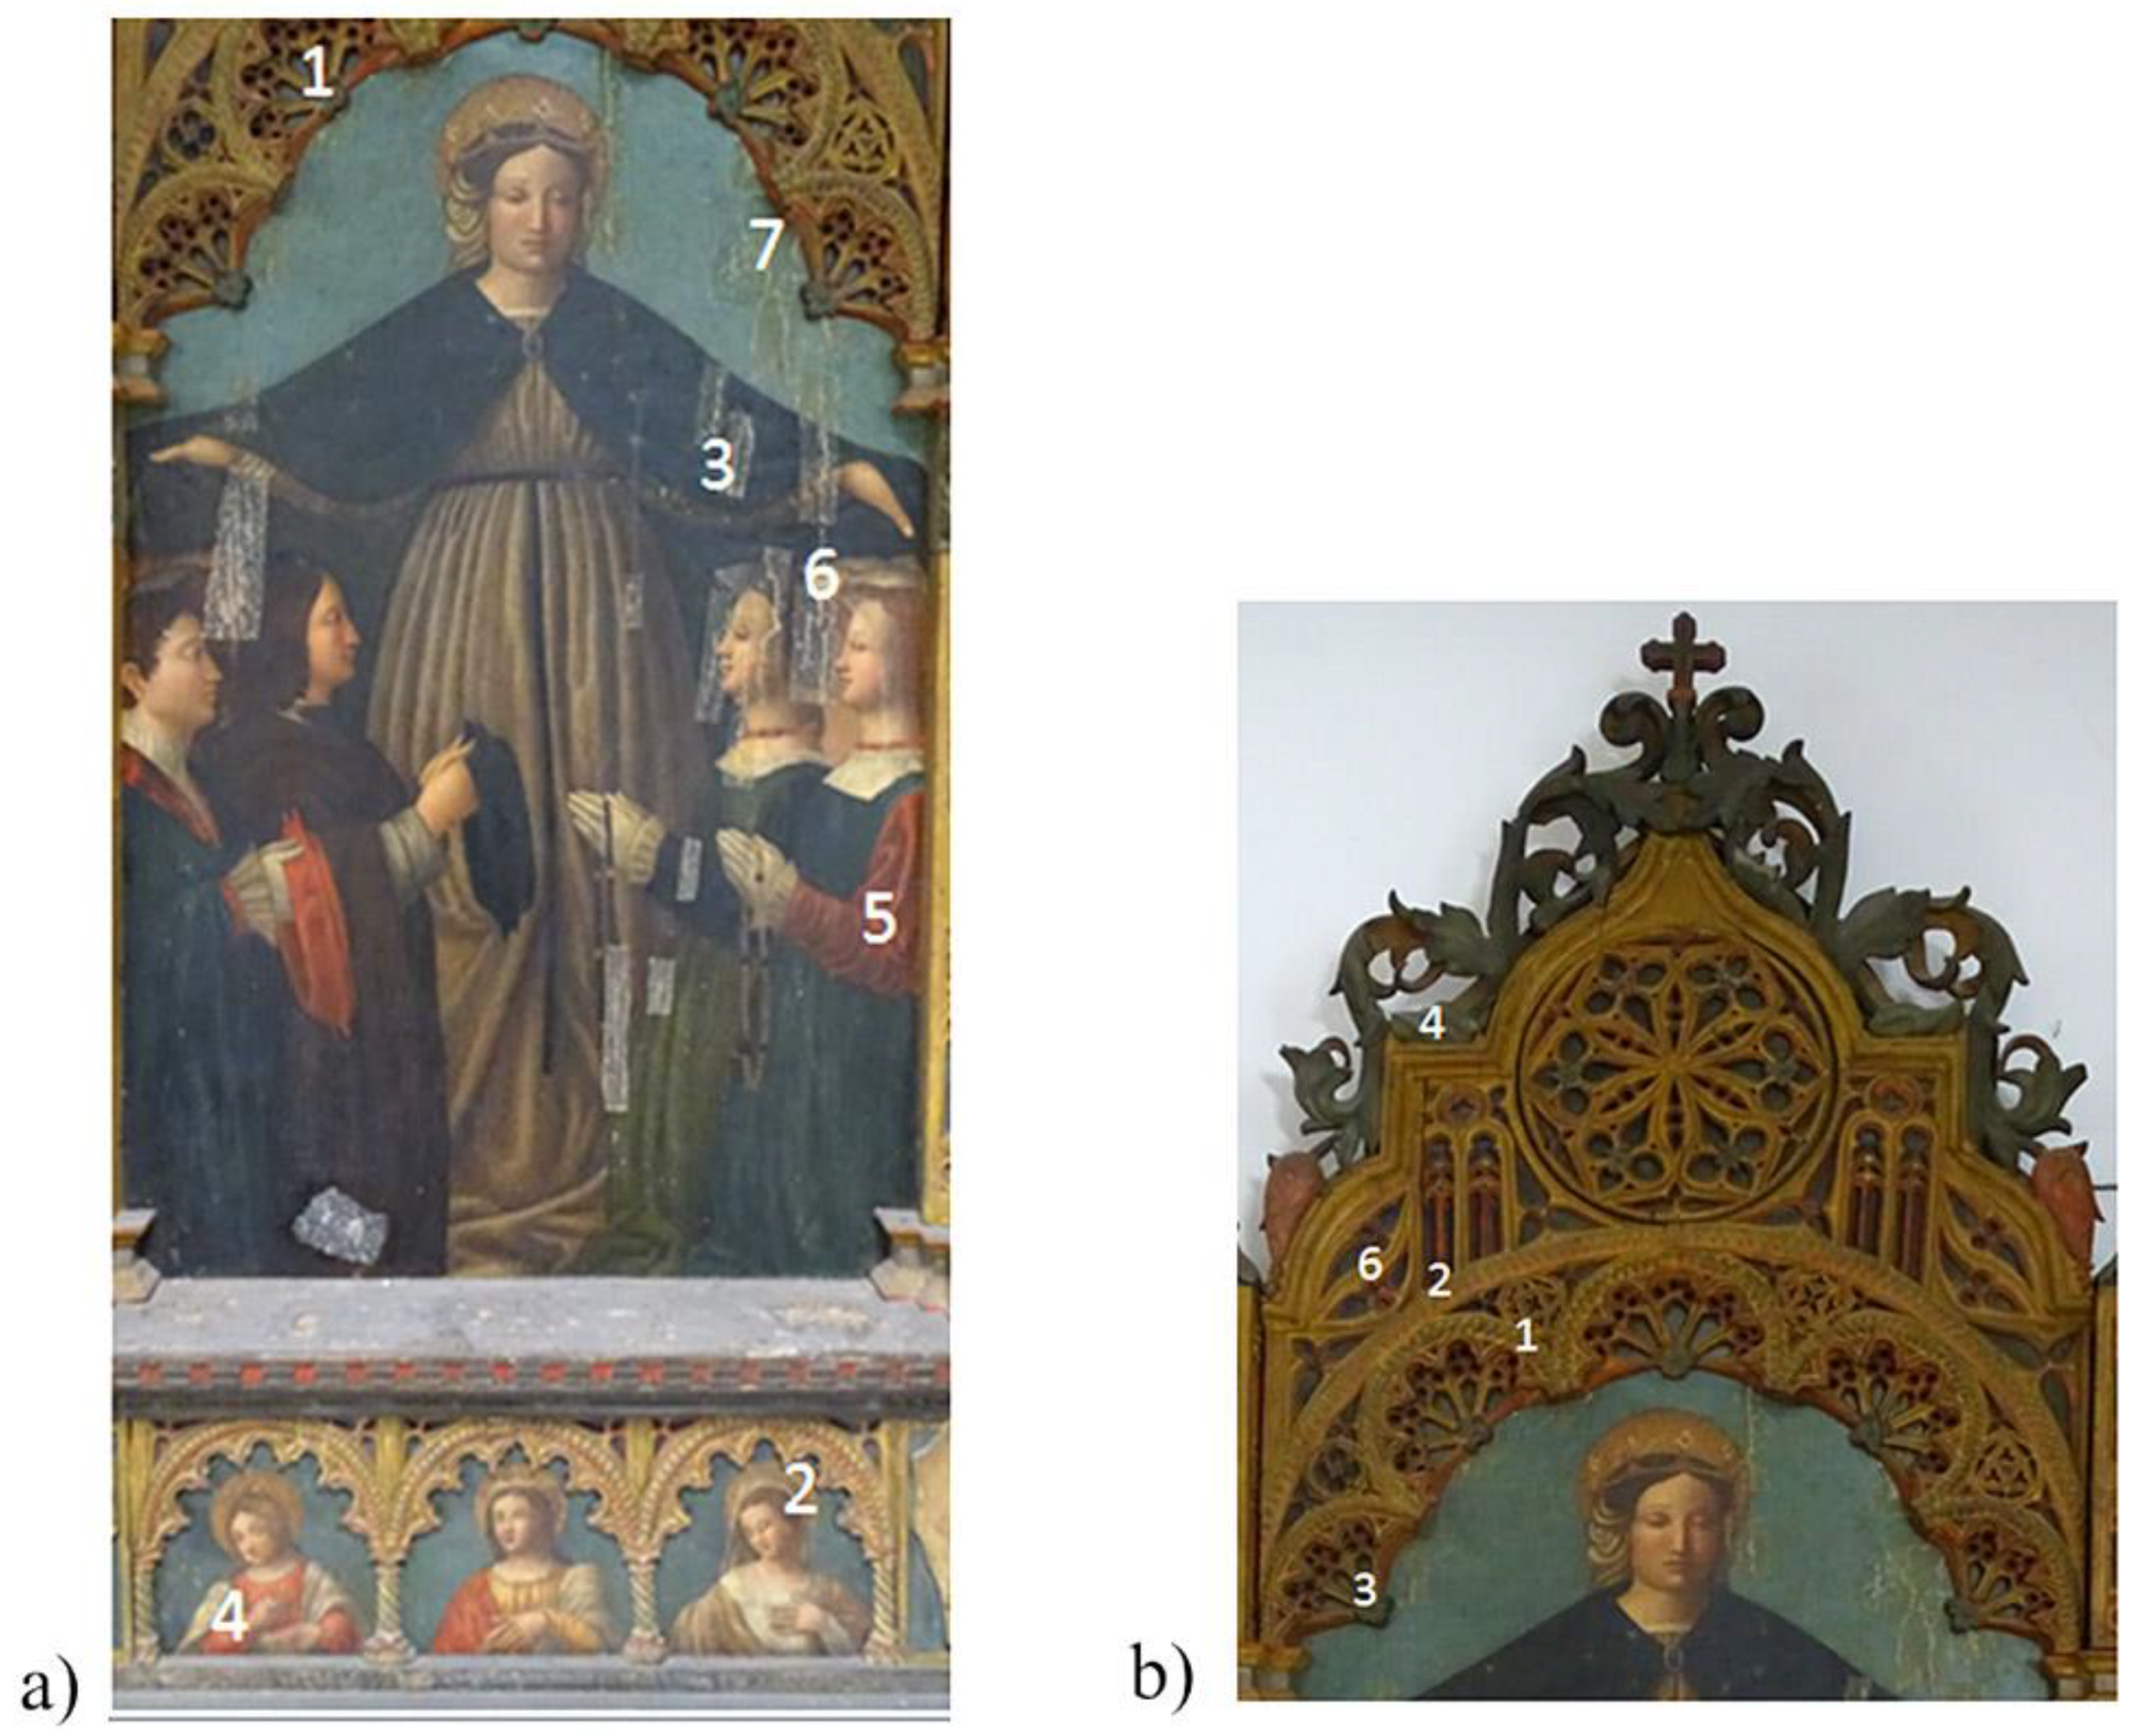
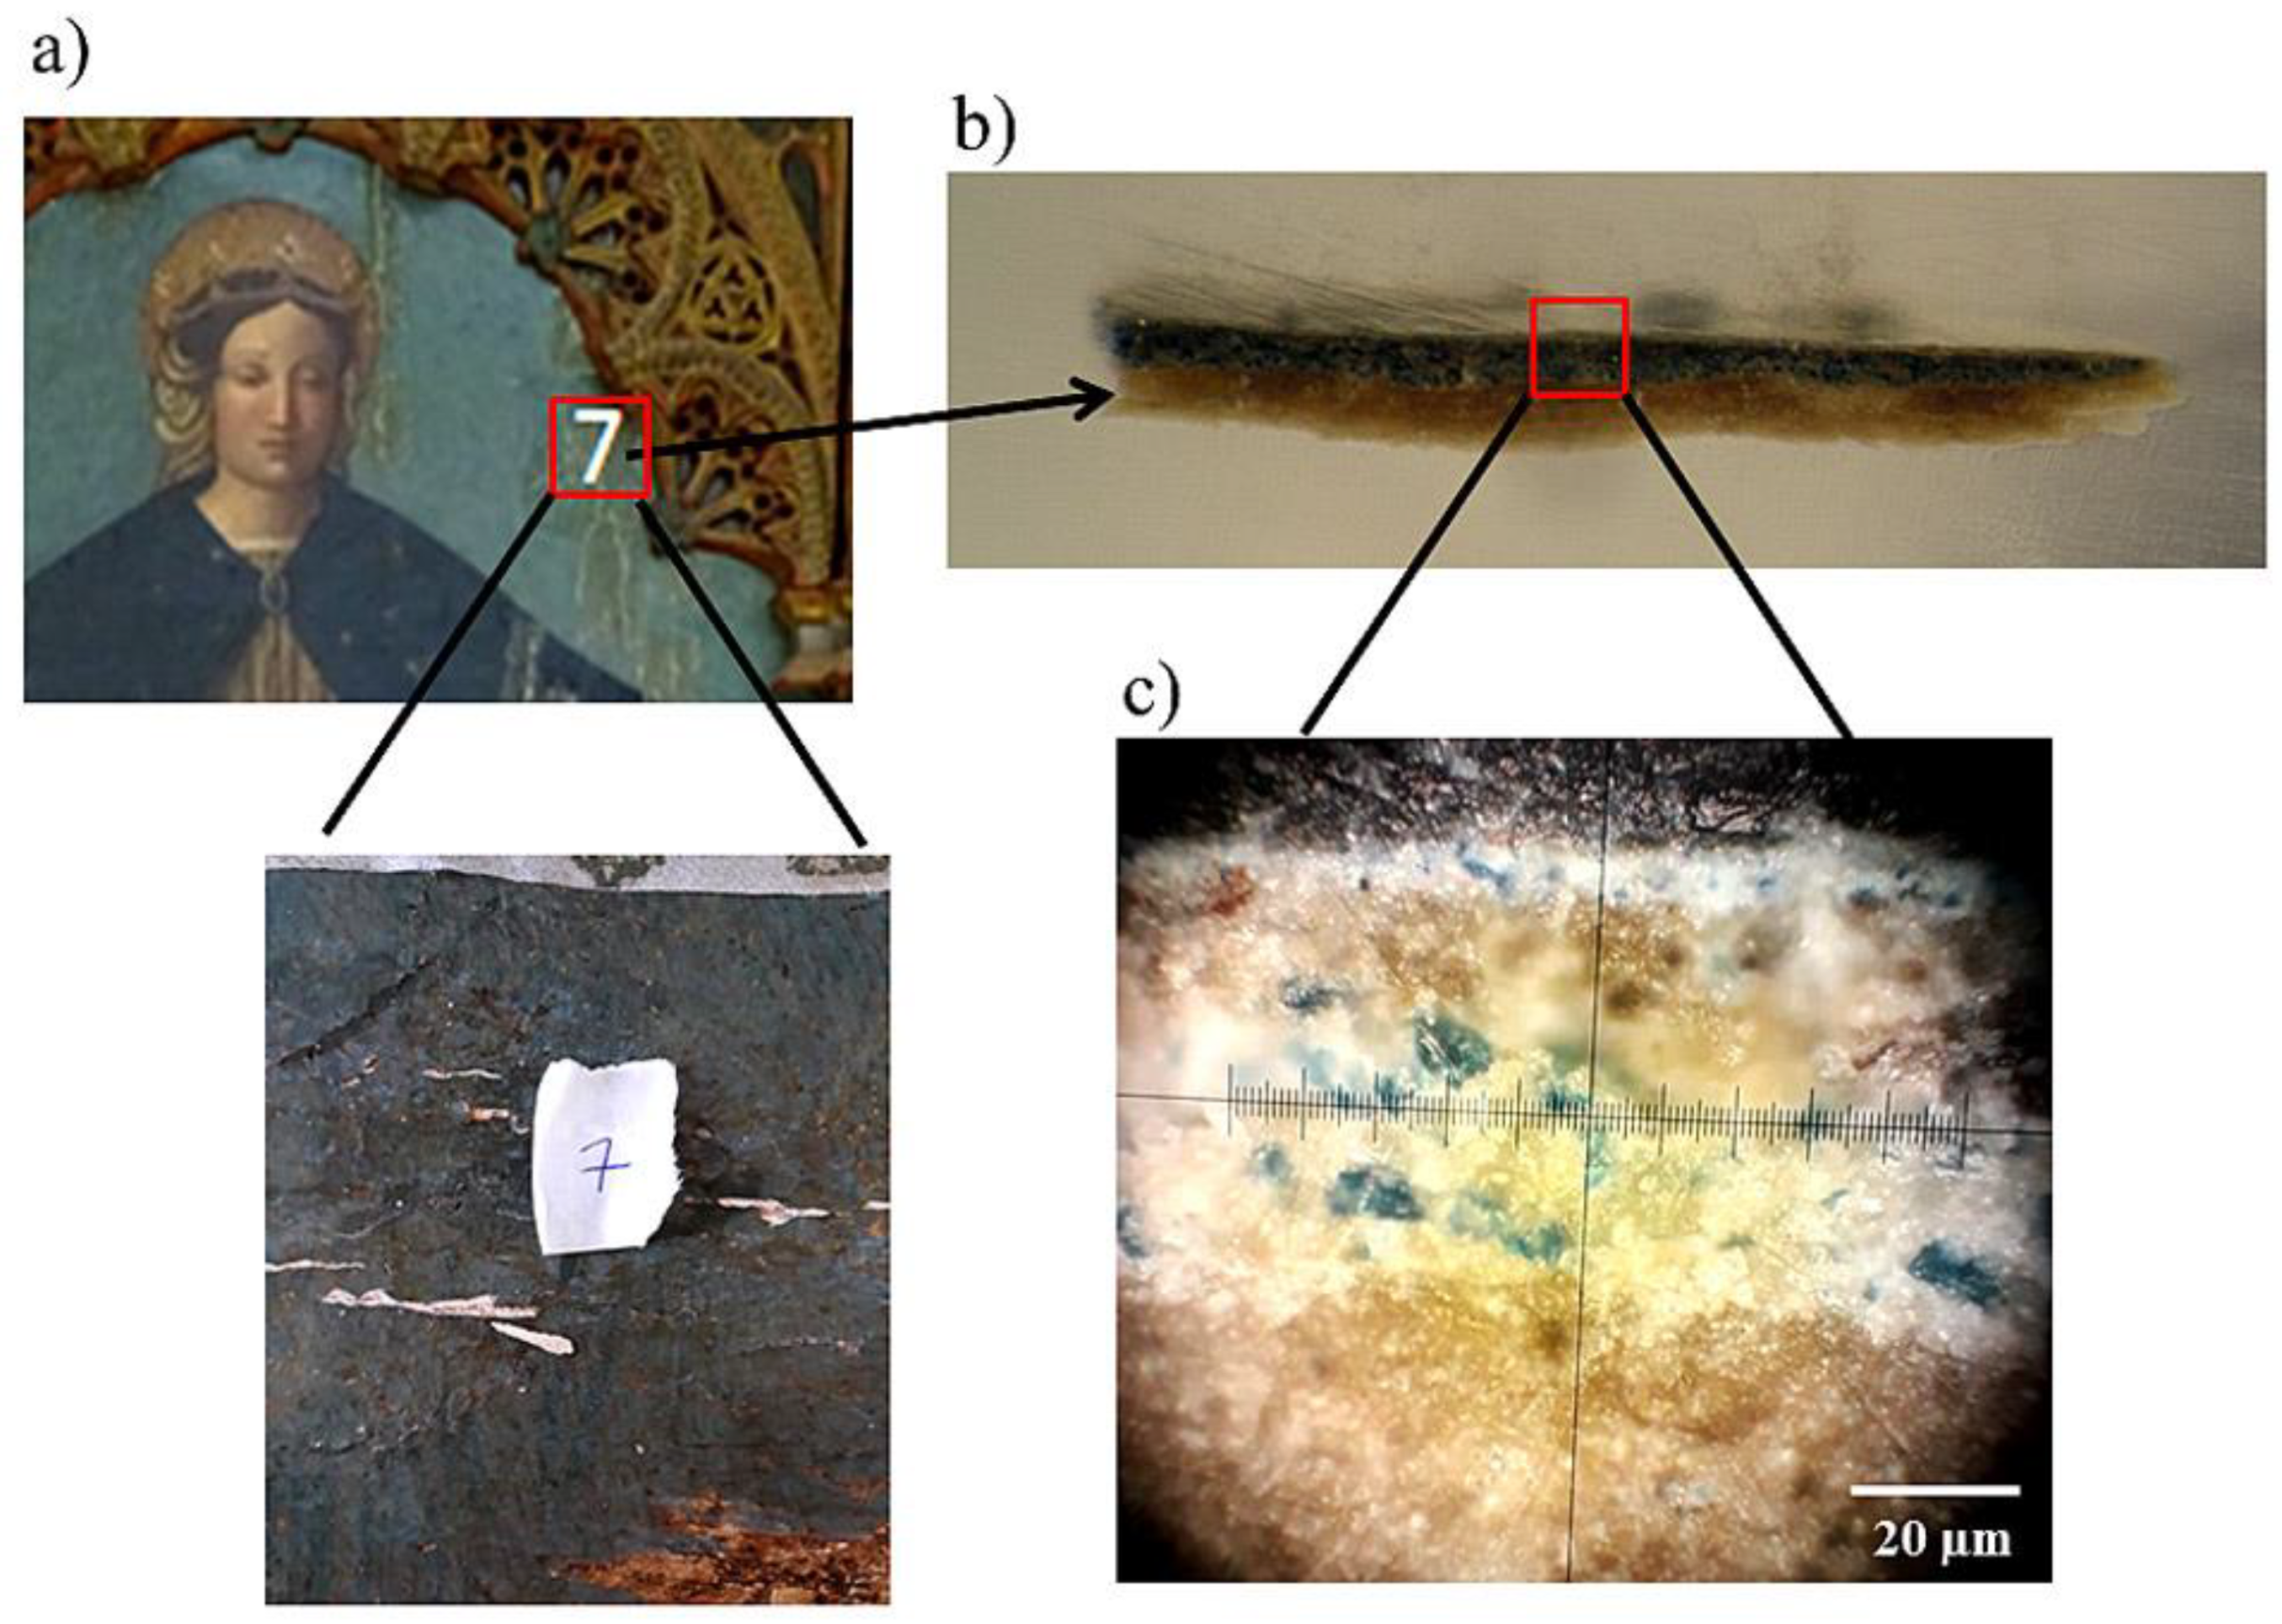
2.1. The painting “Madonna della Misericordia” from the National Gallery of Parma
2.2. UV-Visible Absorption Spectroscopy
2.3. Transmission Electron Microscopy (TEM)
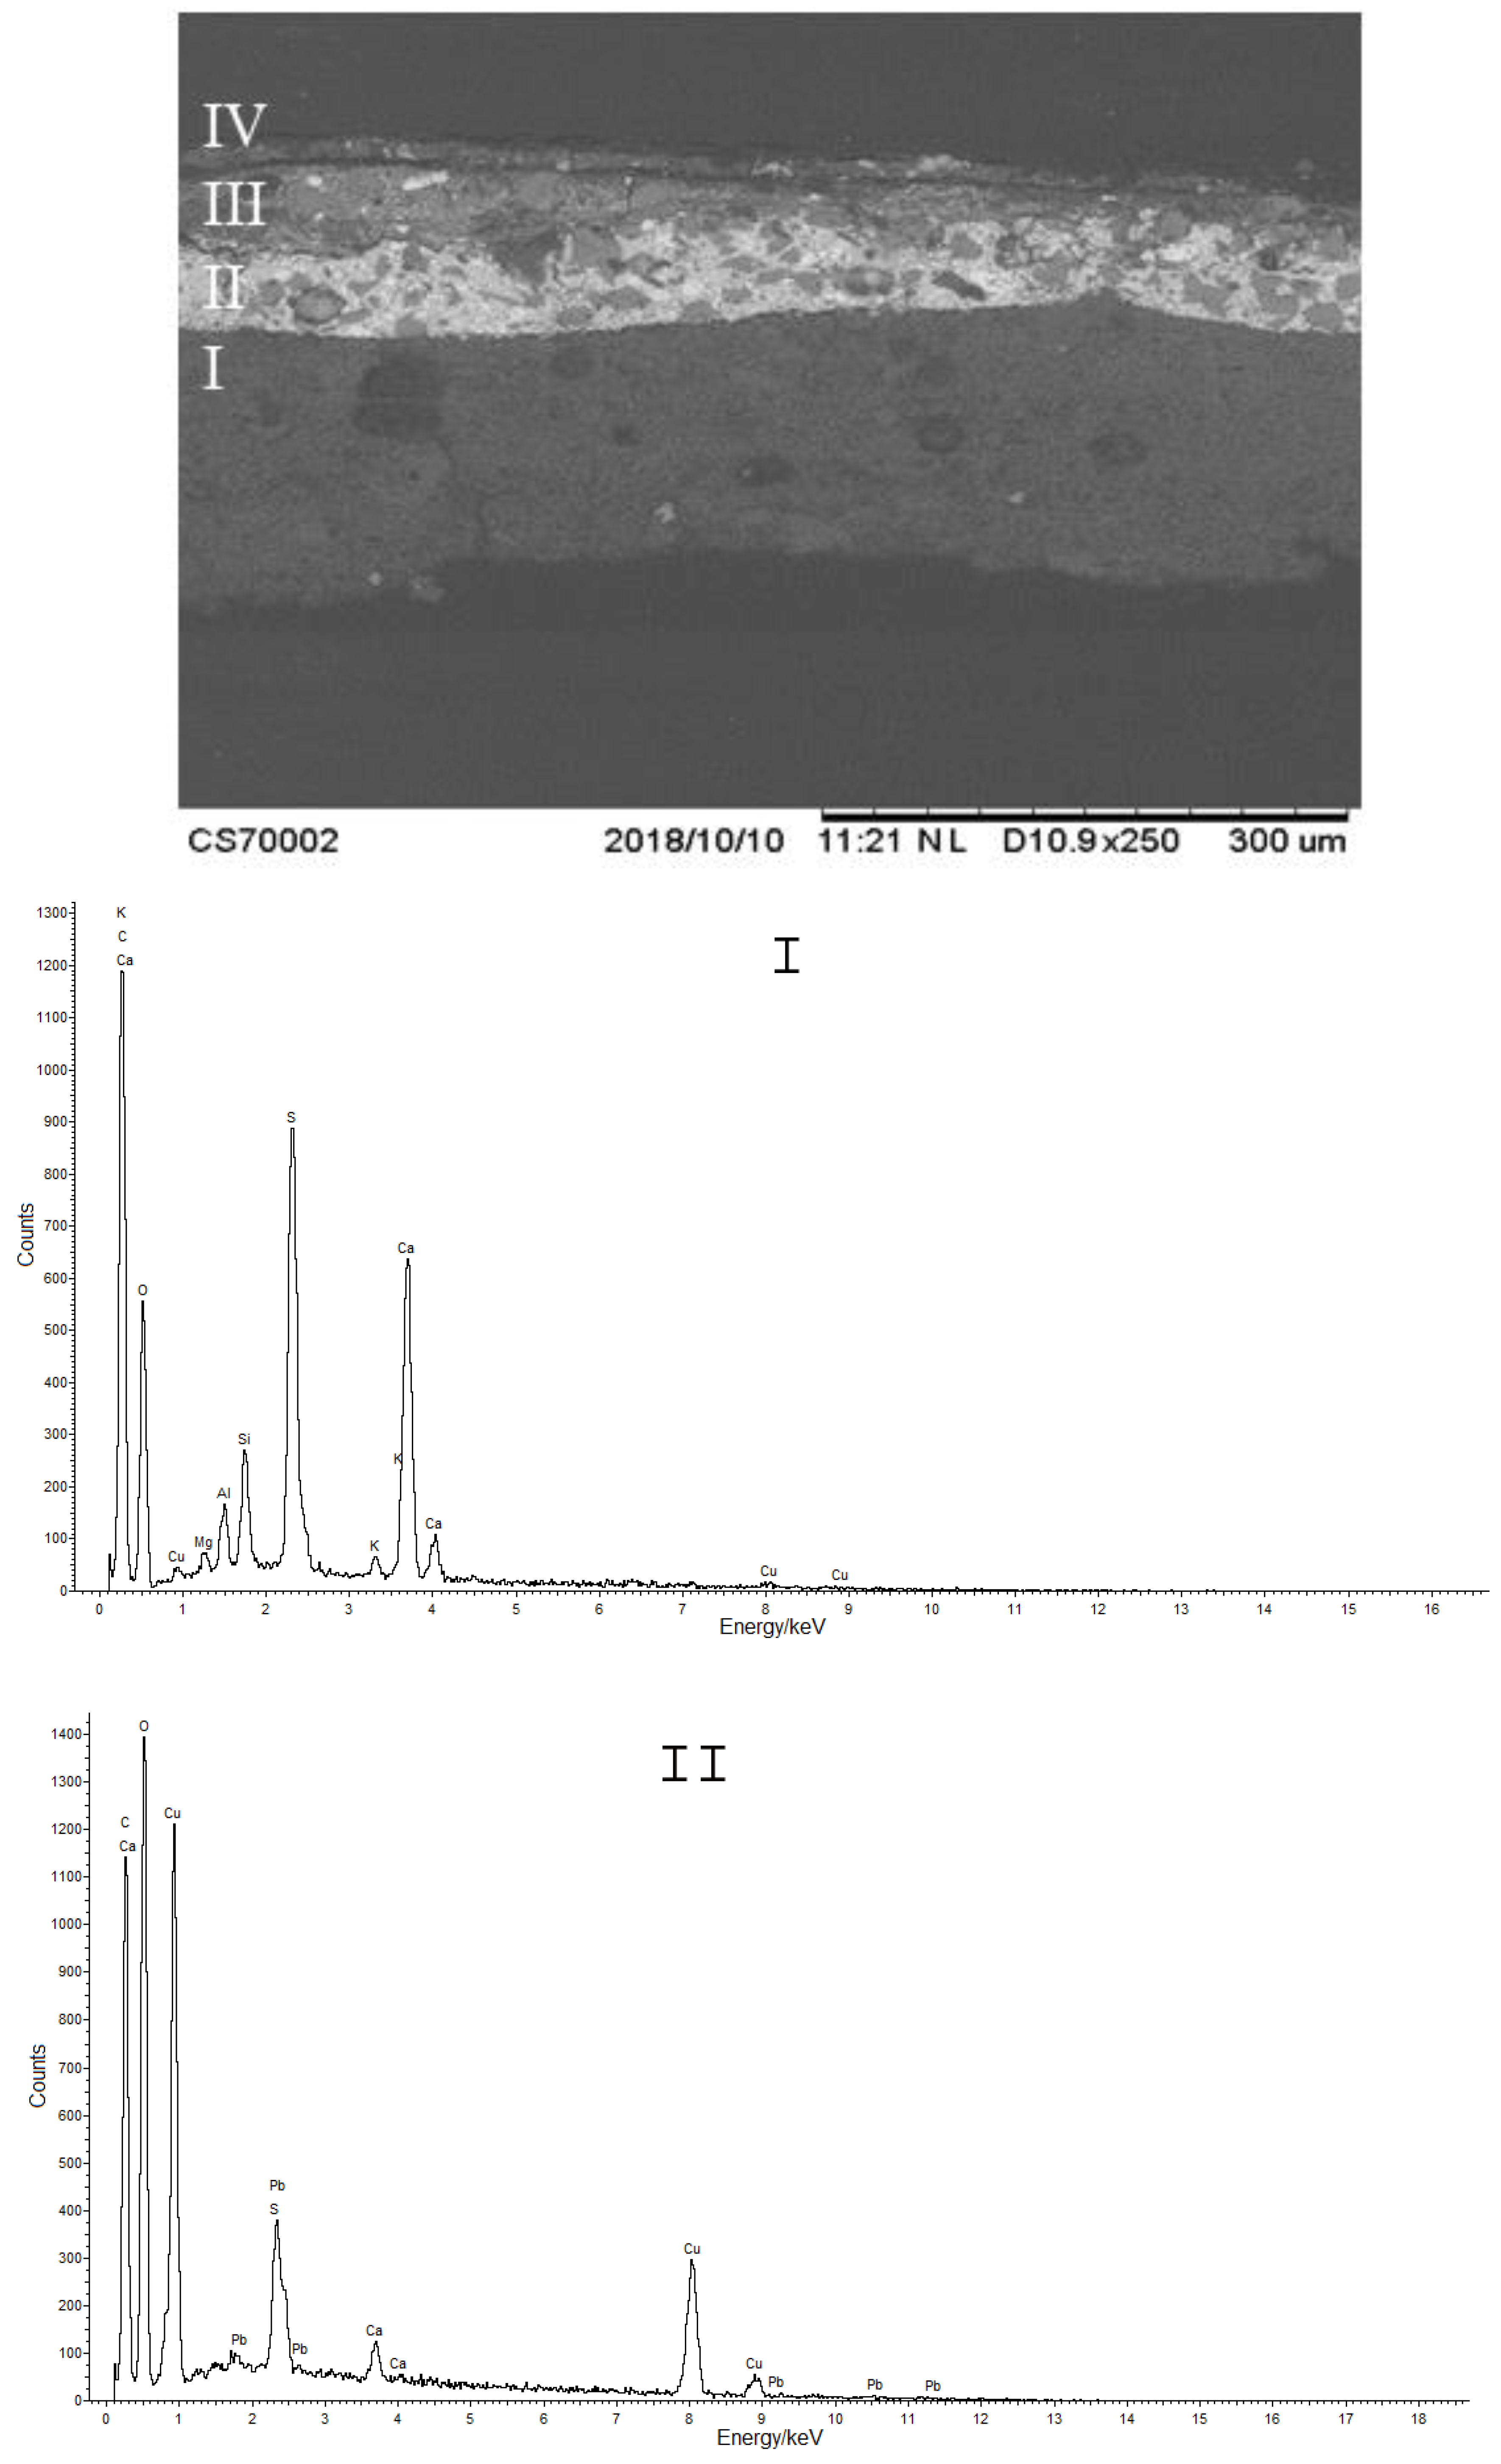
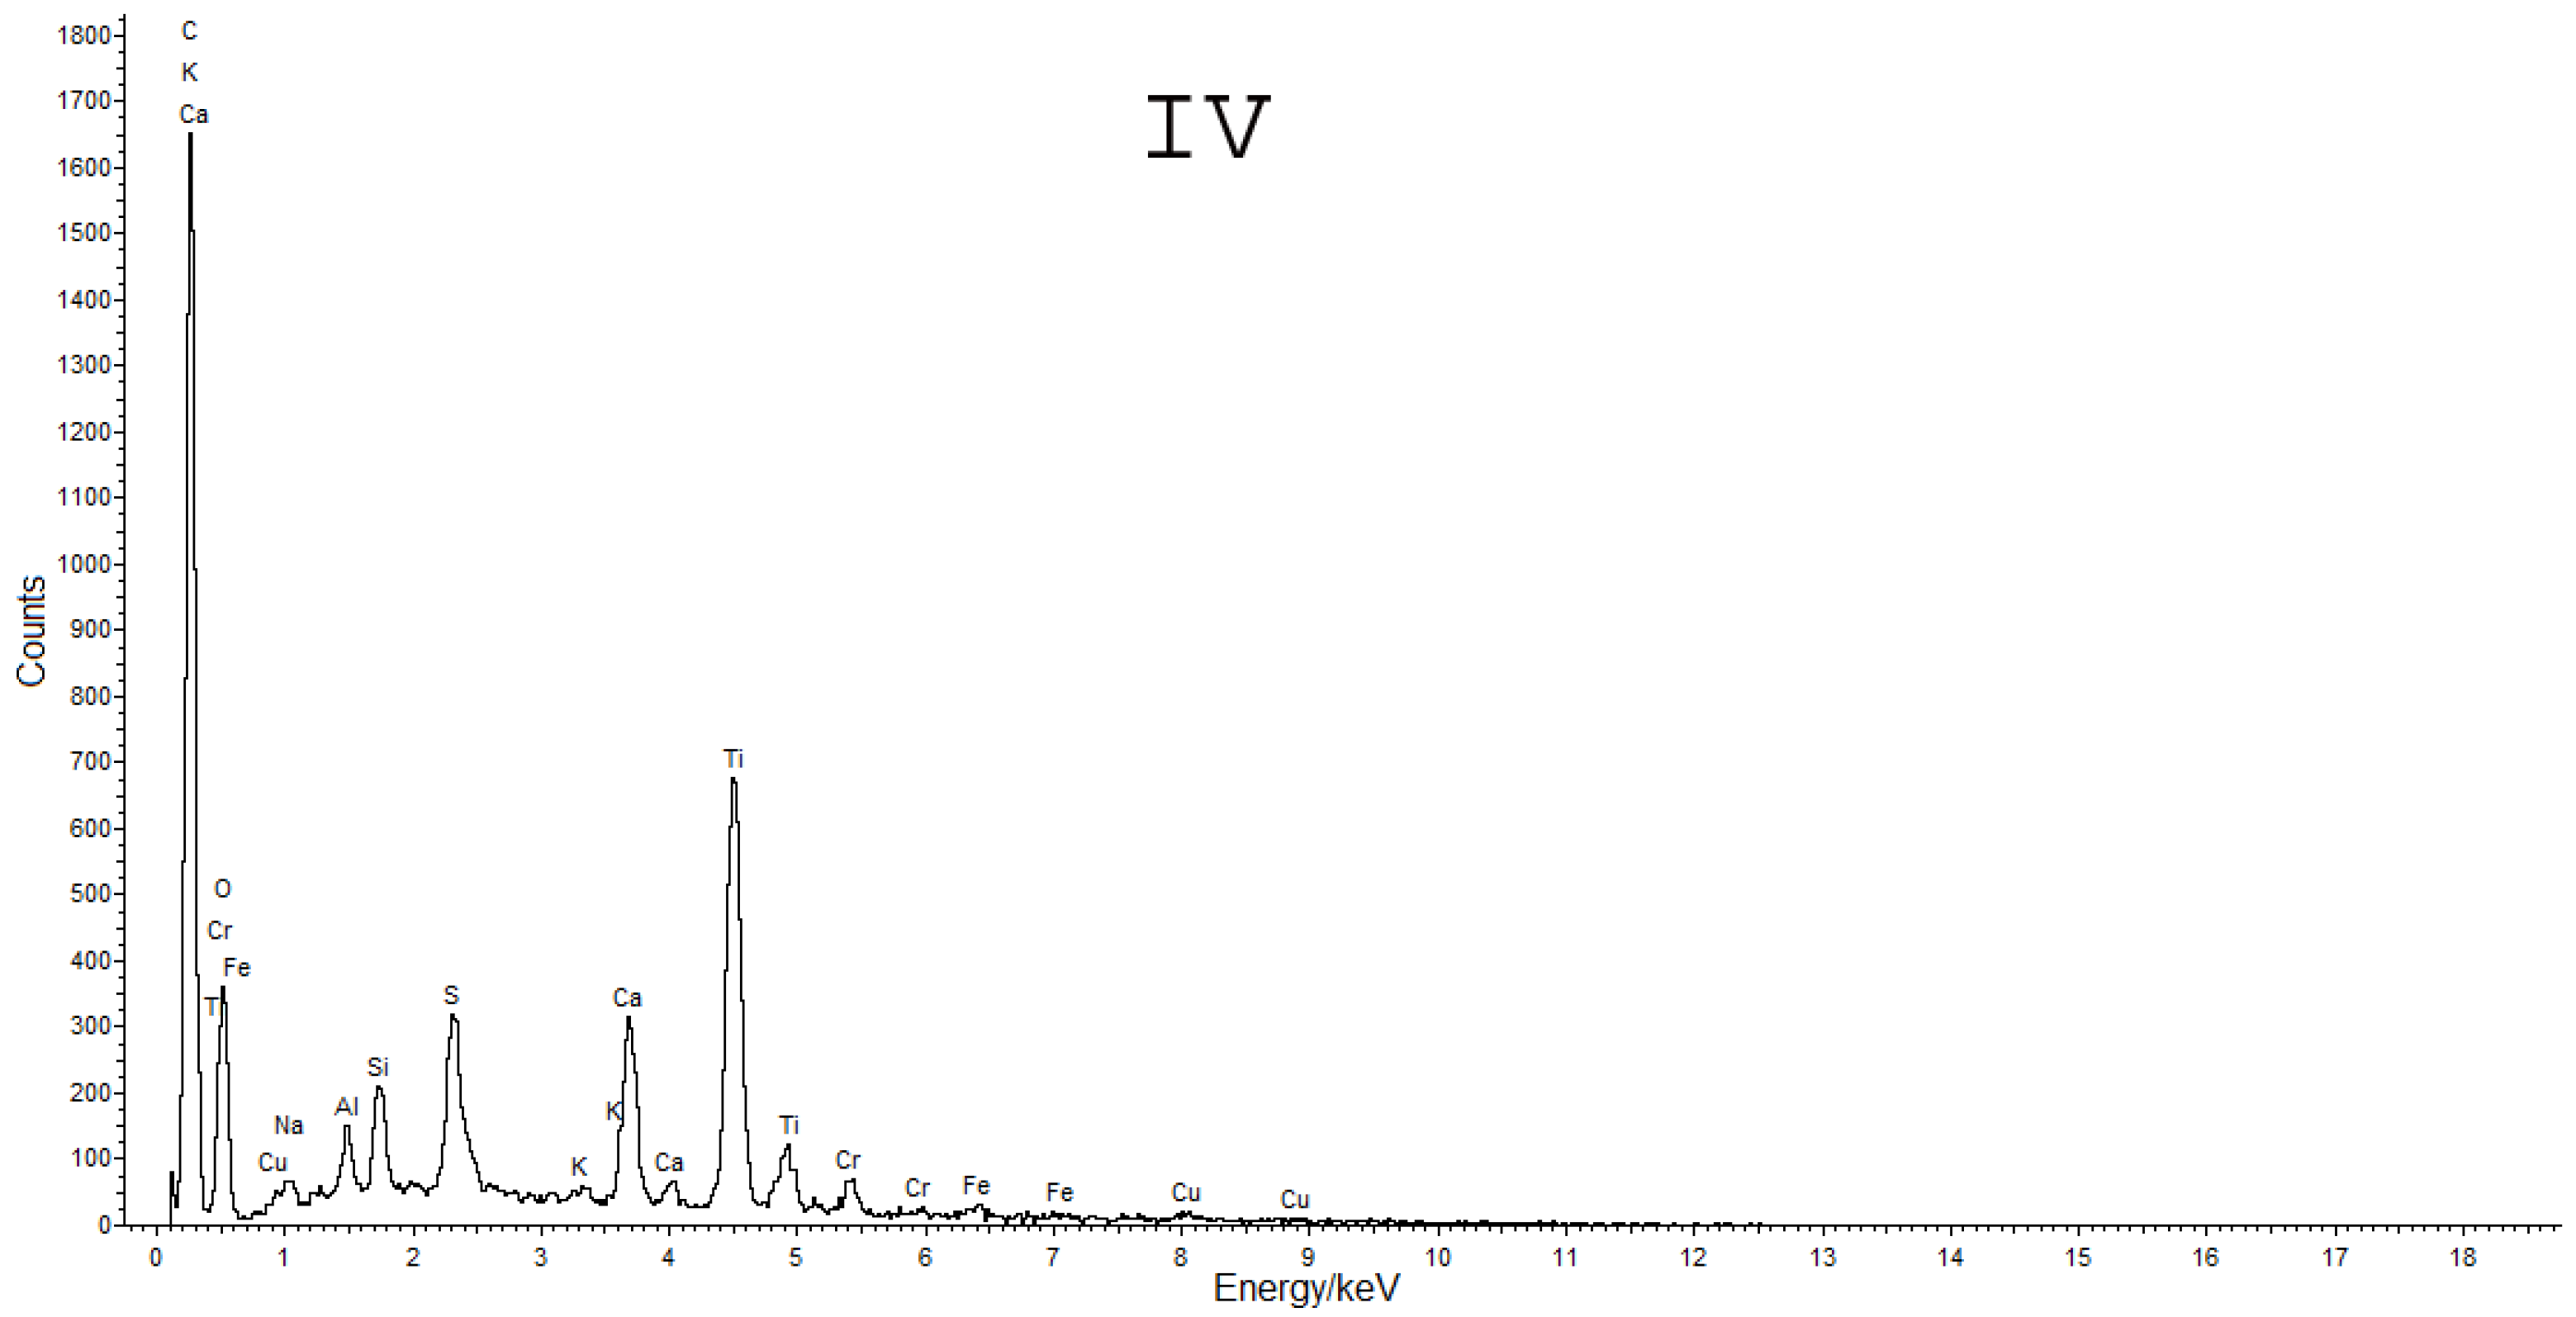
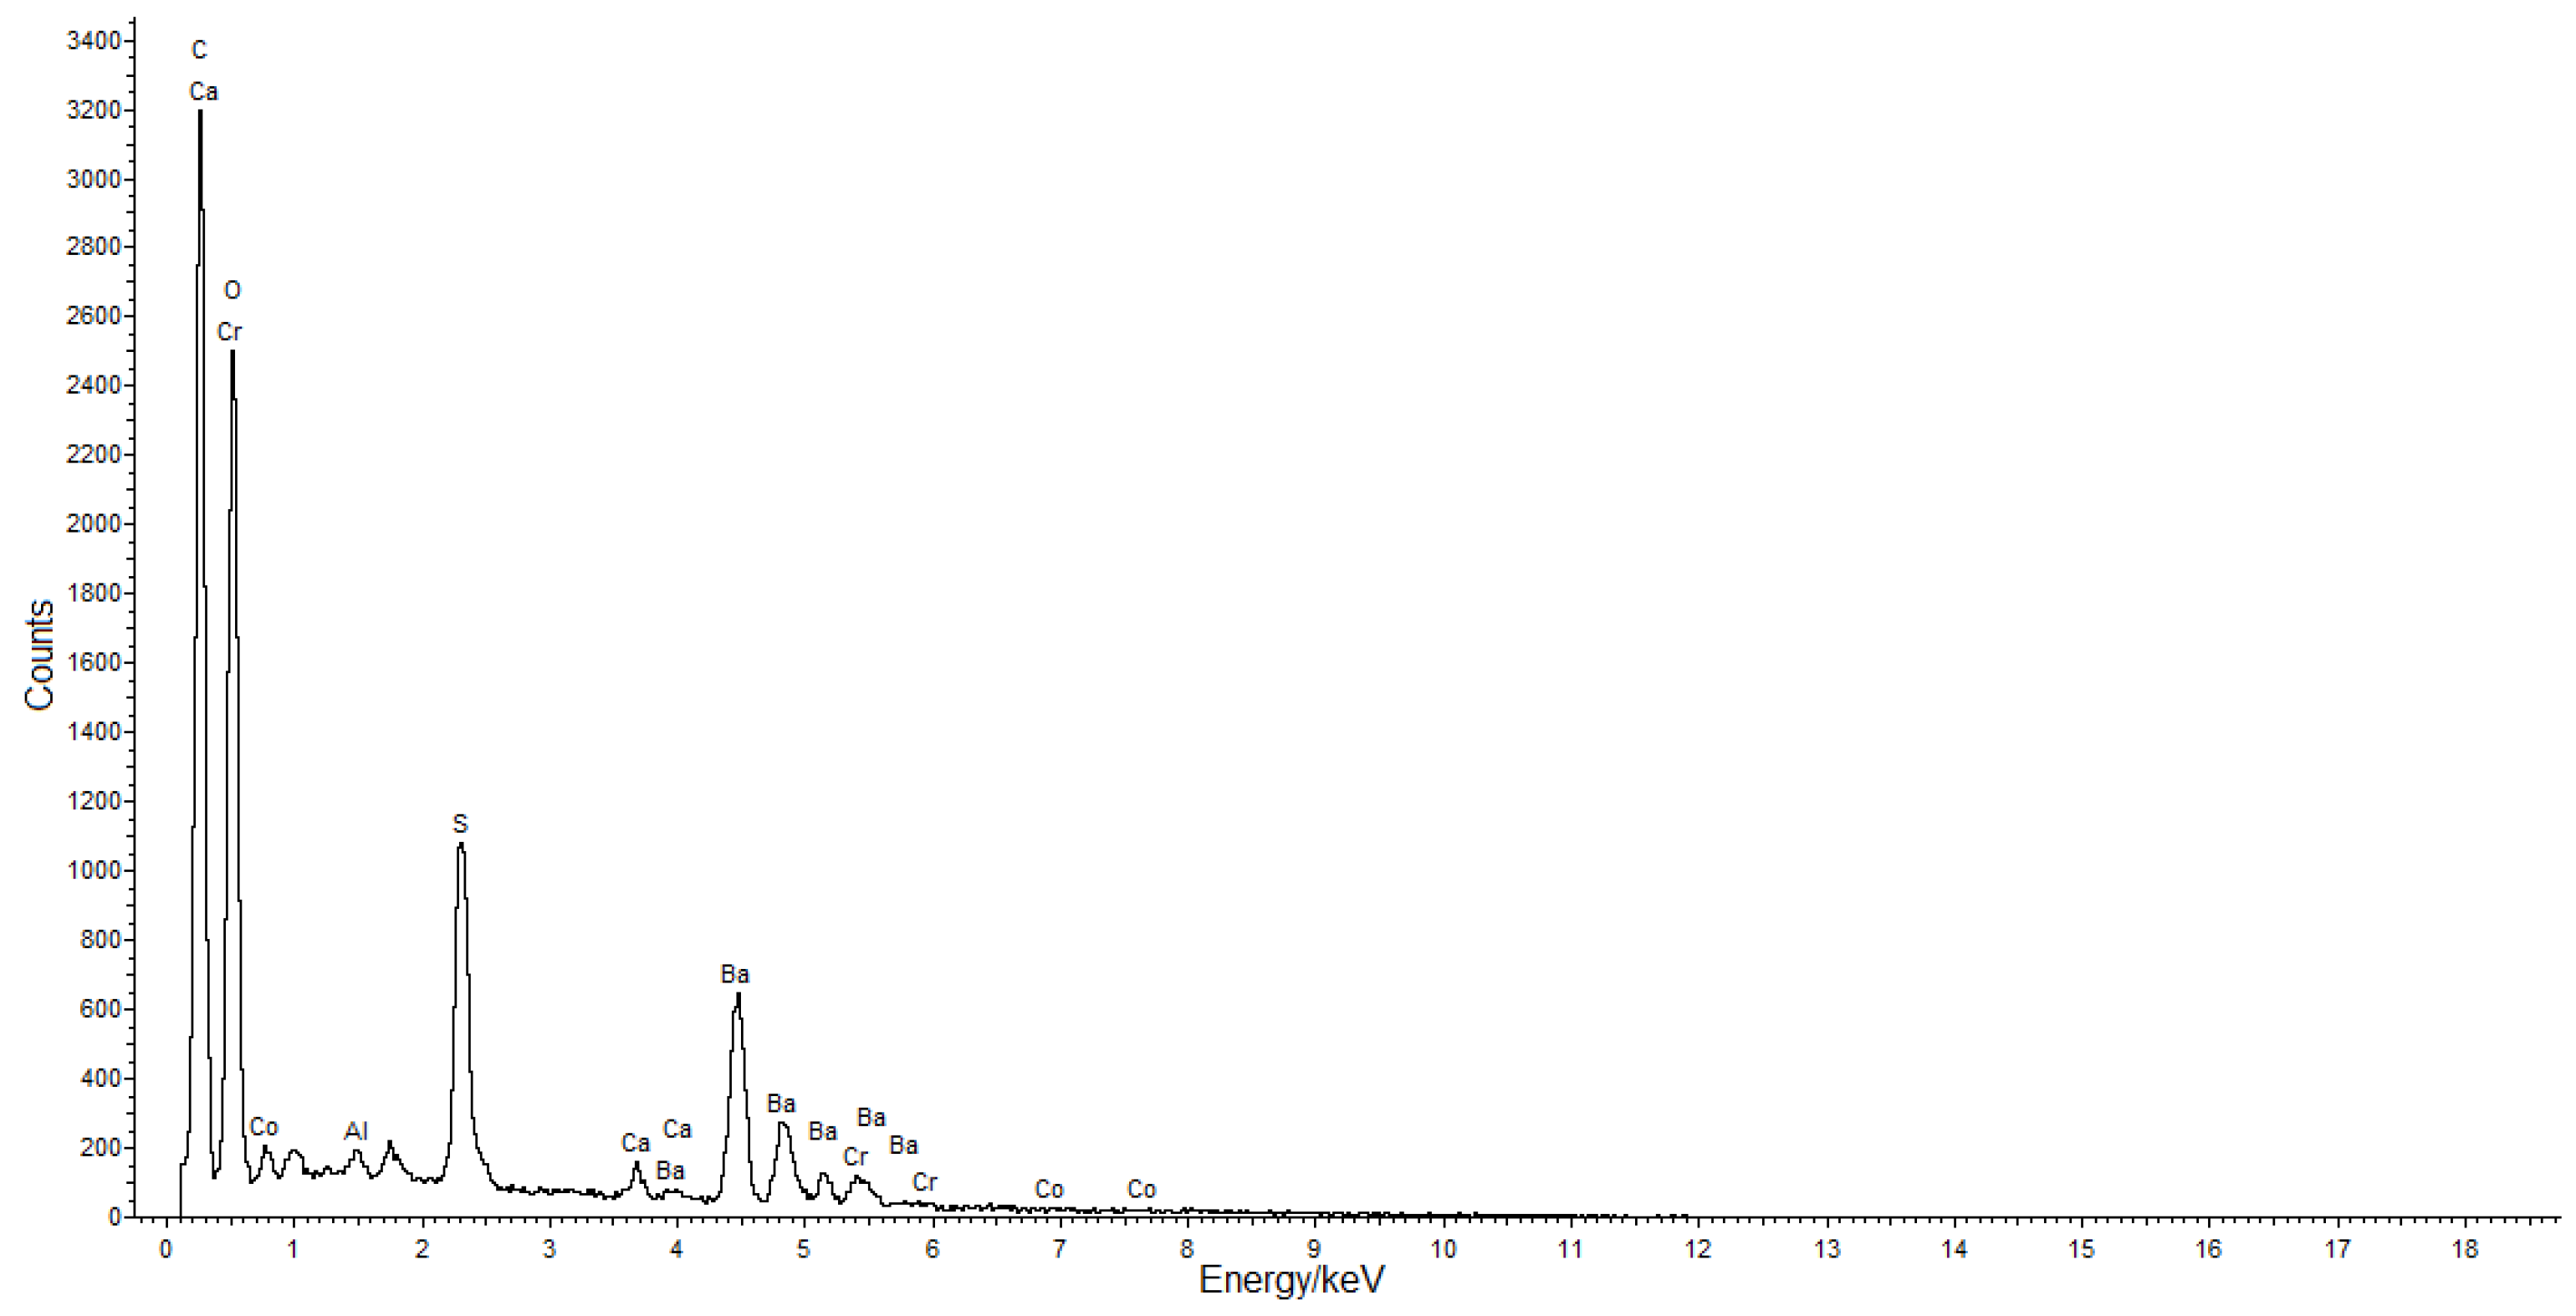
2.4. SEM-EDS
2.5. Micro-Raman Spectroscopy
2.6. Preparation of the Cross-Sections
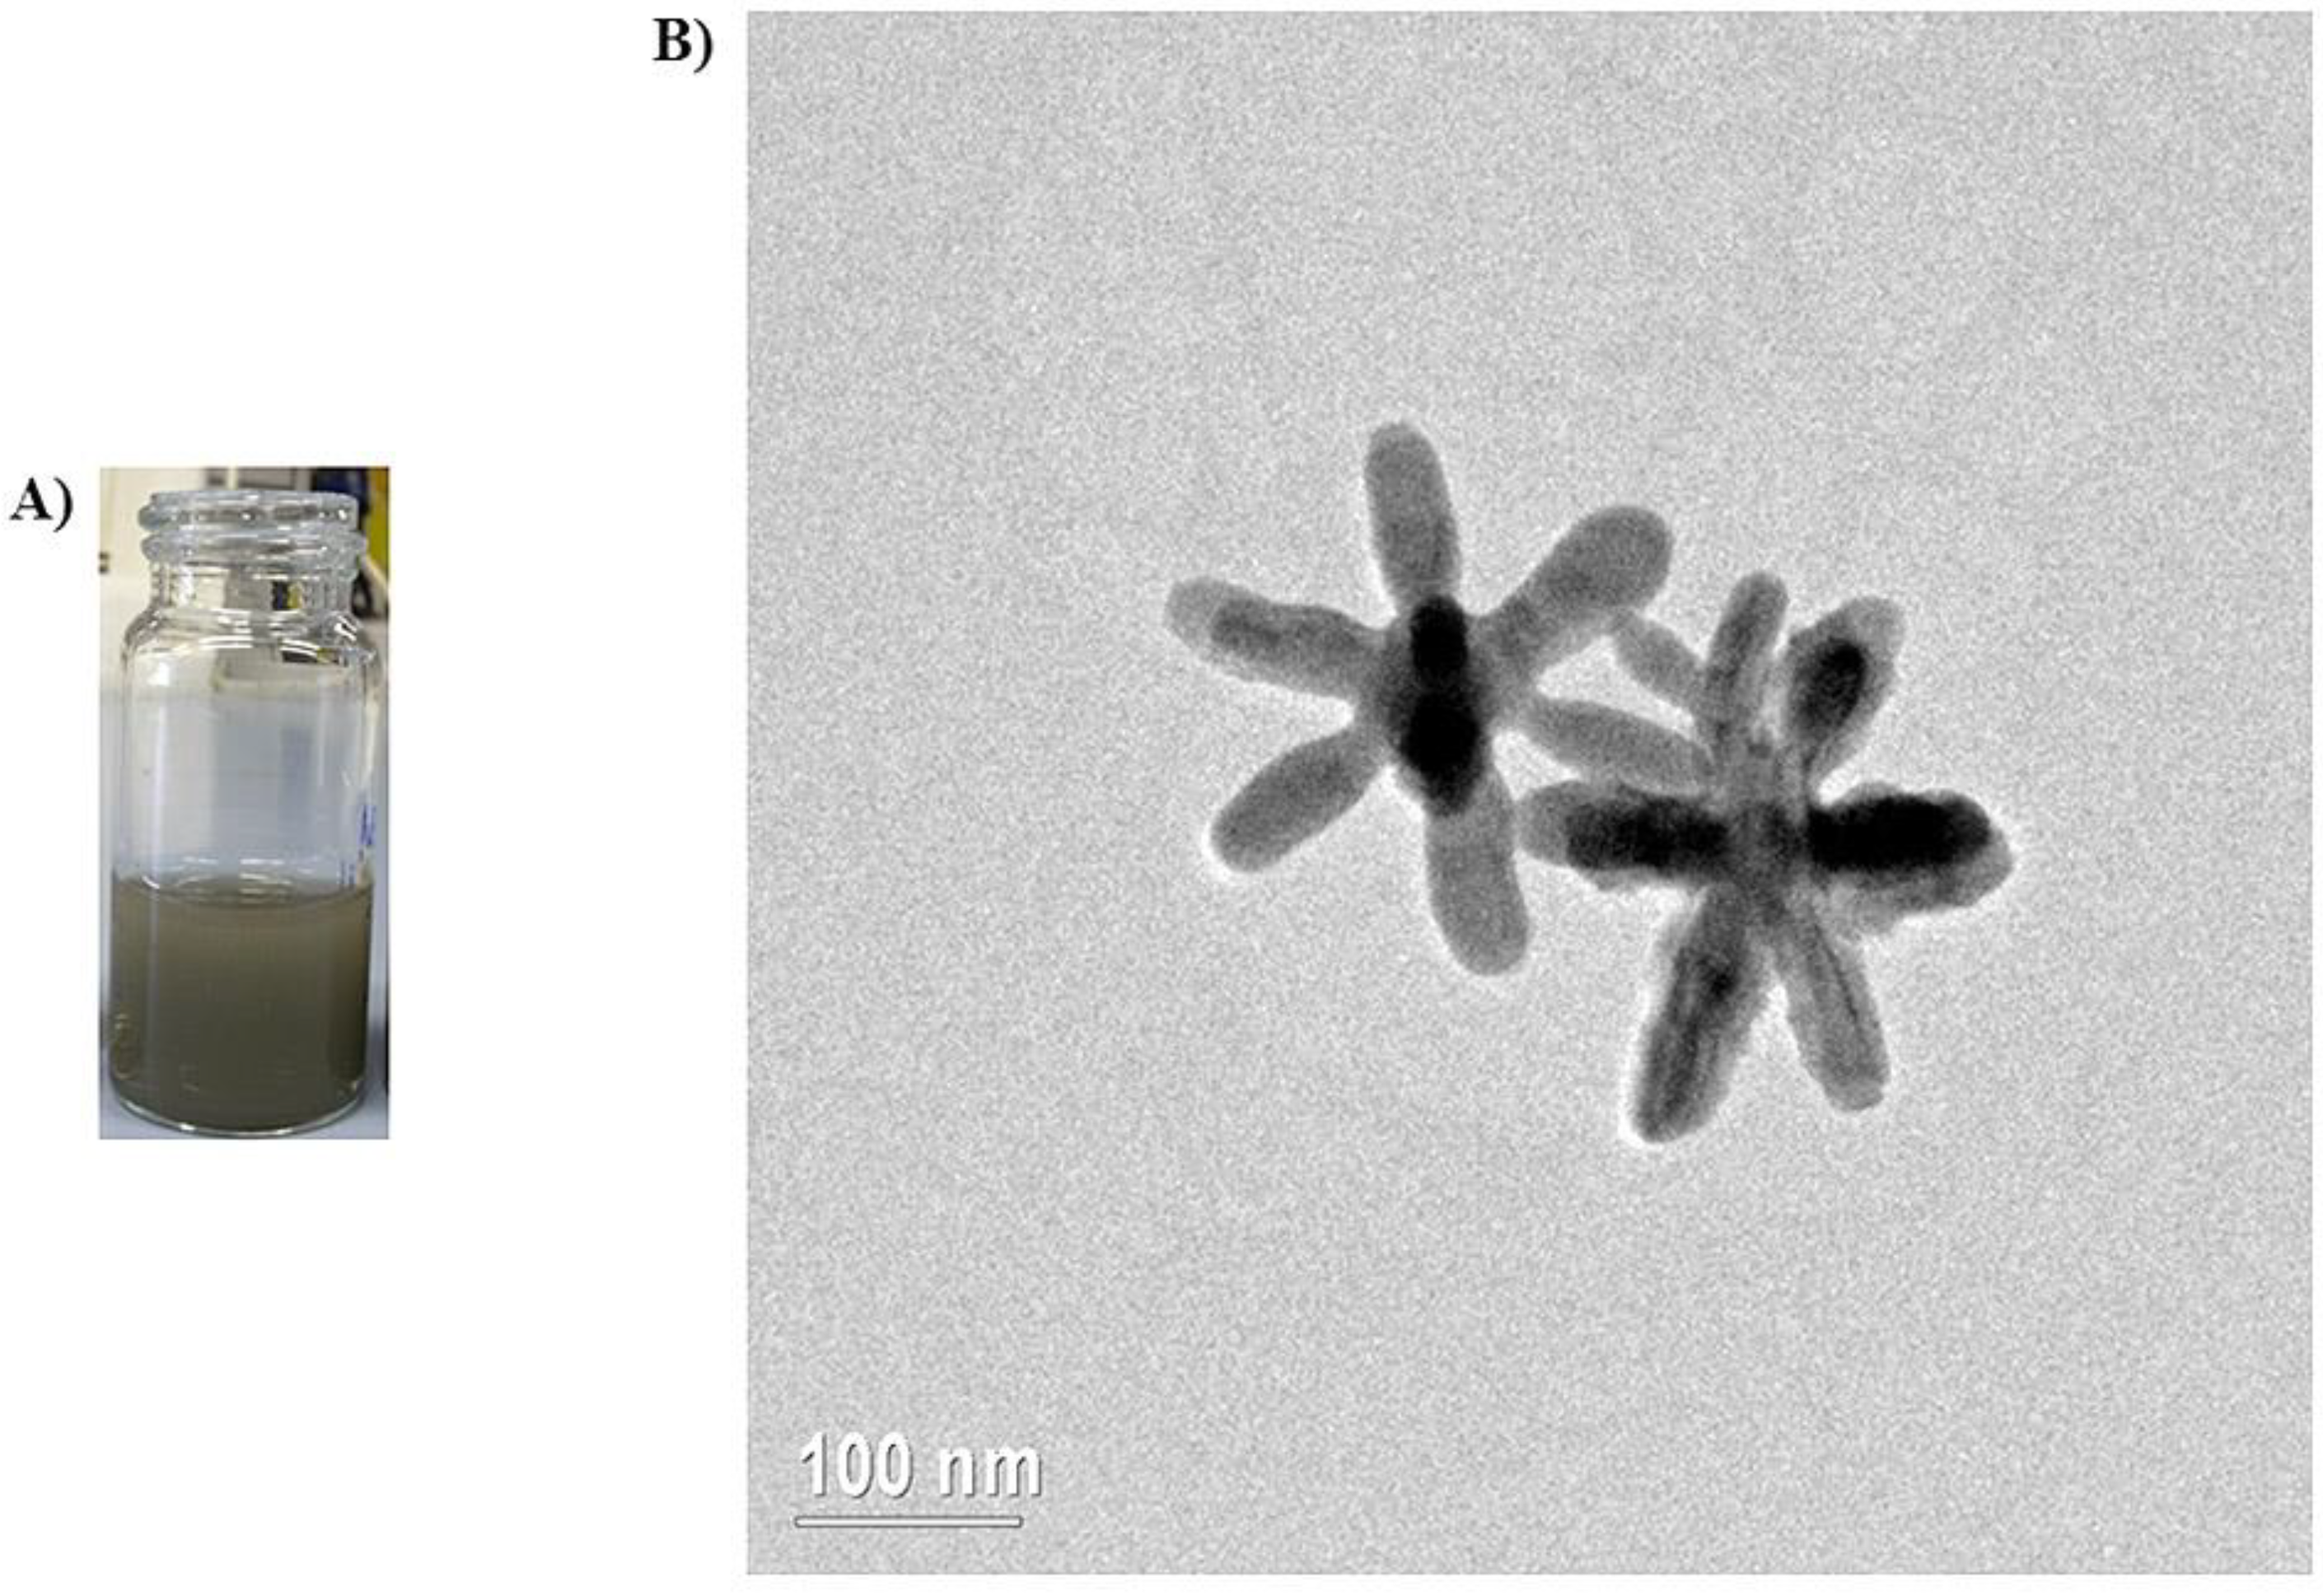
2.7. Ag Nanostars Colloid: Preparation and Application on the Cross Sections
- Sodium hydroxide solution: NaOH (0.02 g) dissolved in water (10 mL) to get a 0.05 M solution.
- Hydroxylamine solution: NH2OH (18 μL) at 50% w/v in water (5 mL).
- Silver nitrate solution: AgNO3 (0.0017 g) dissolved in water (10 mL) to obtain a 1·10−3 M solution.
- Trisodium citrate solution: of C6H5O7Na3.2H2O (0.114 g) dissolved in water (10 mL) to get a 0.045 M solution.
3. Results and Discussion
3.1. Synthesis and Characterization of AgNSs
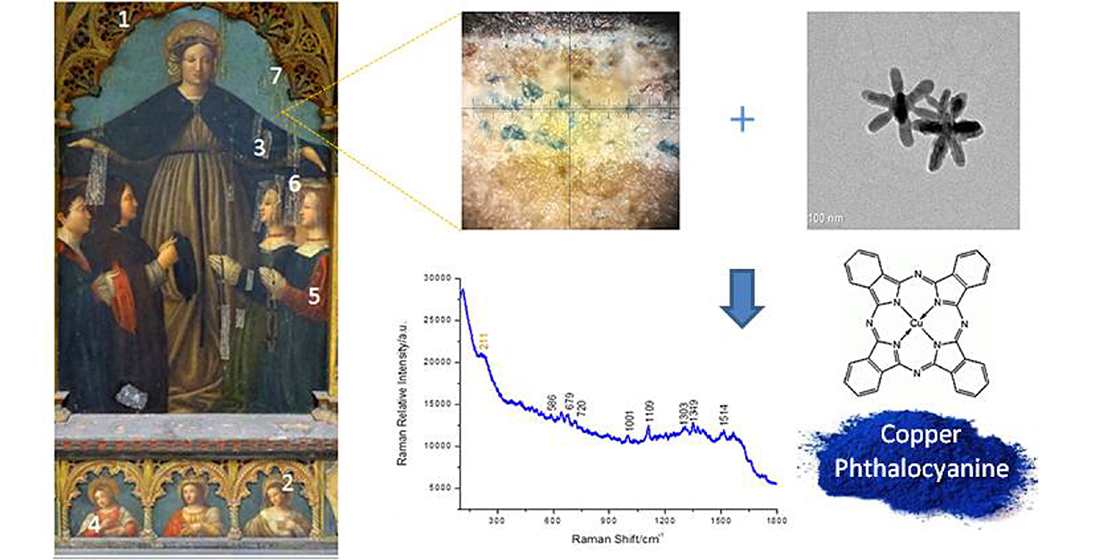
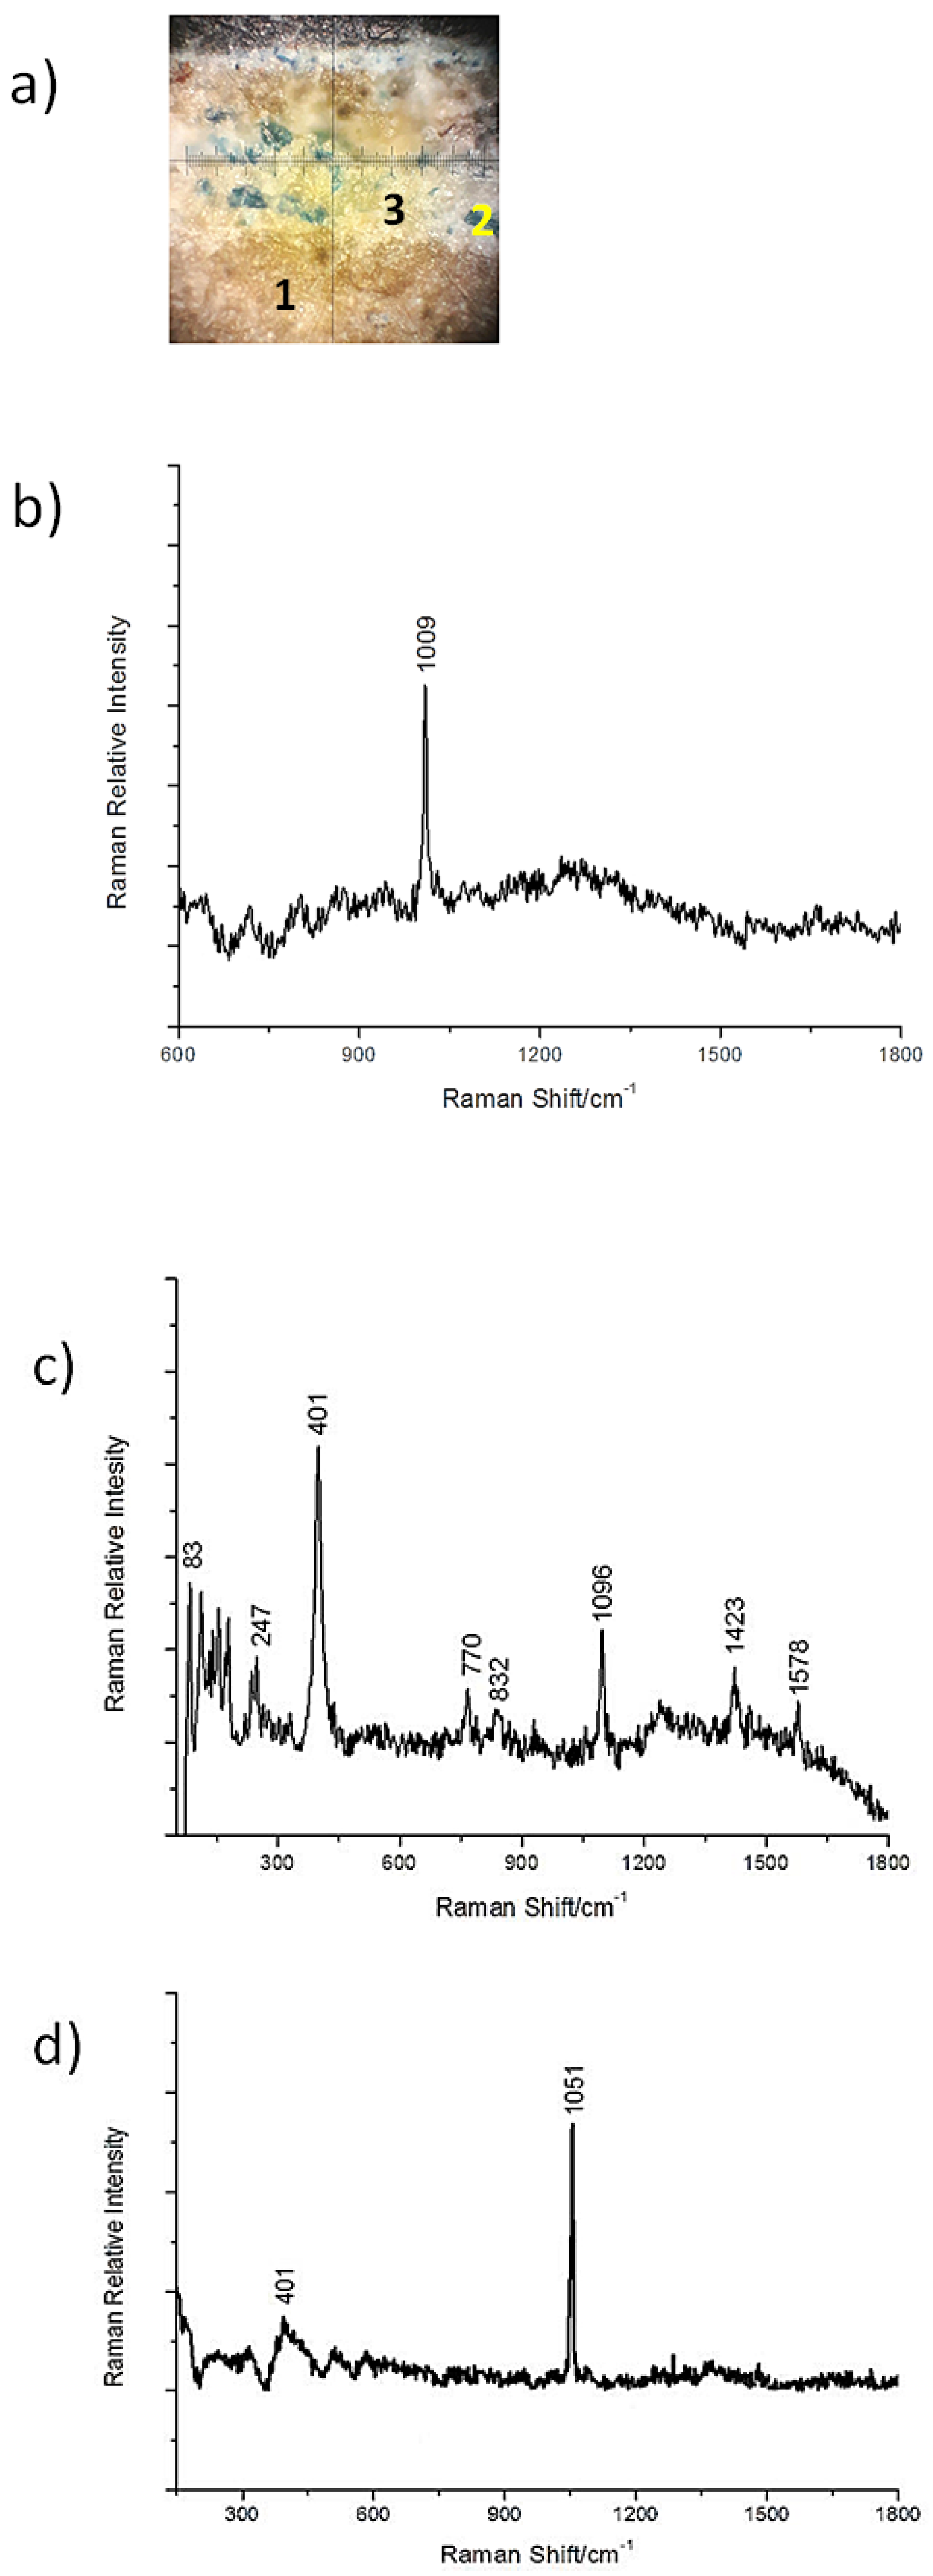
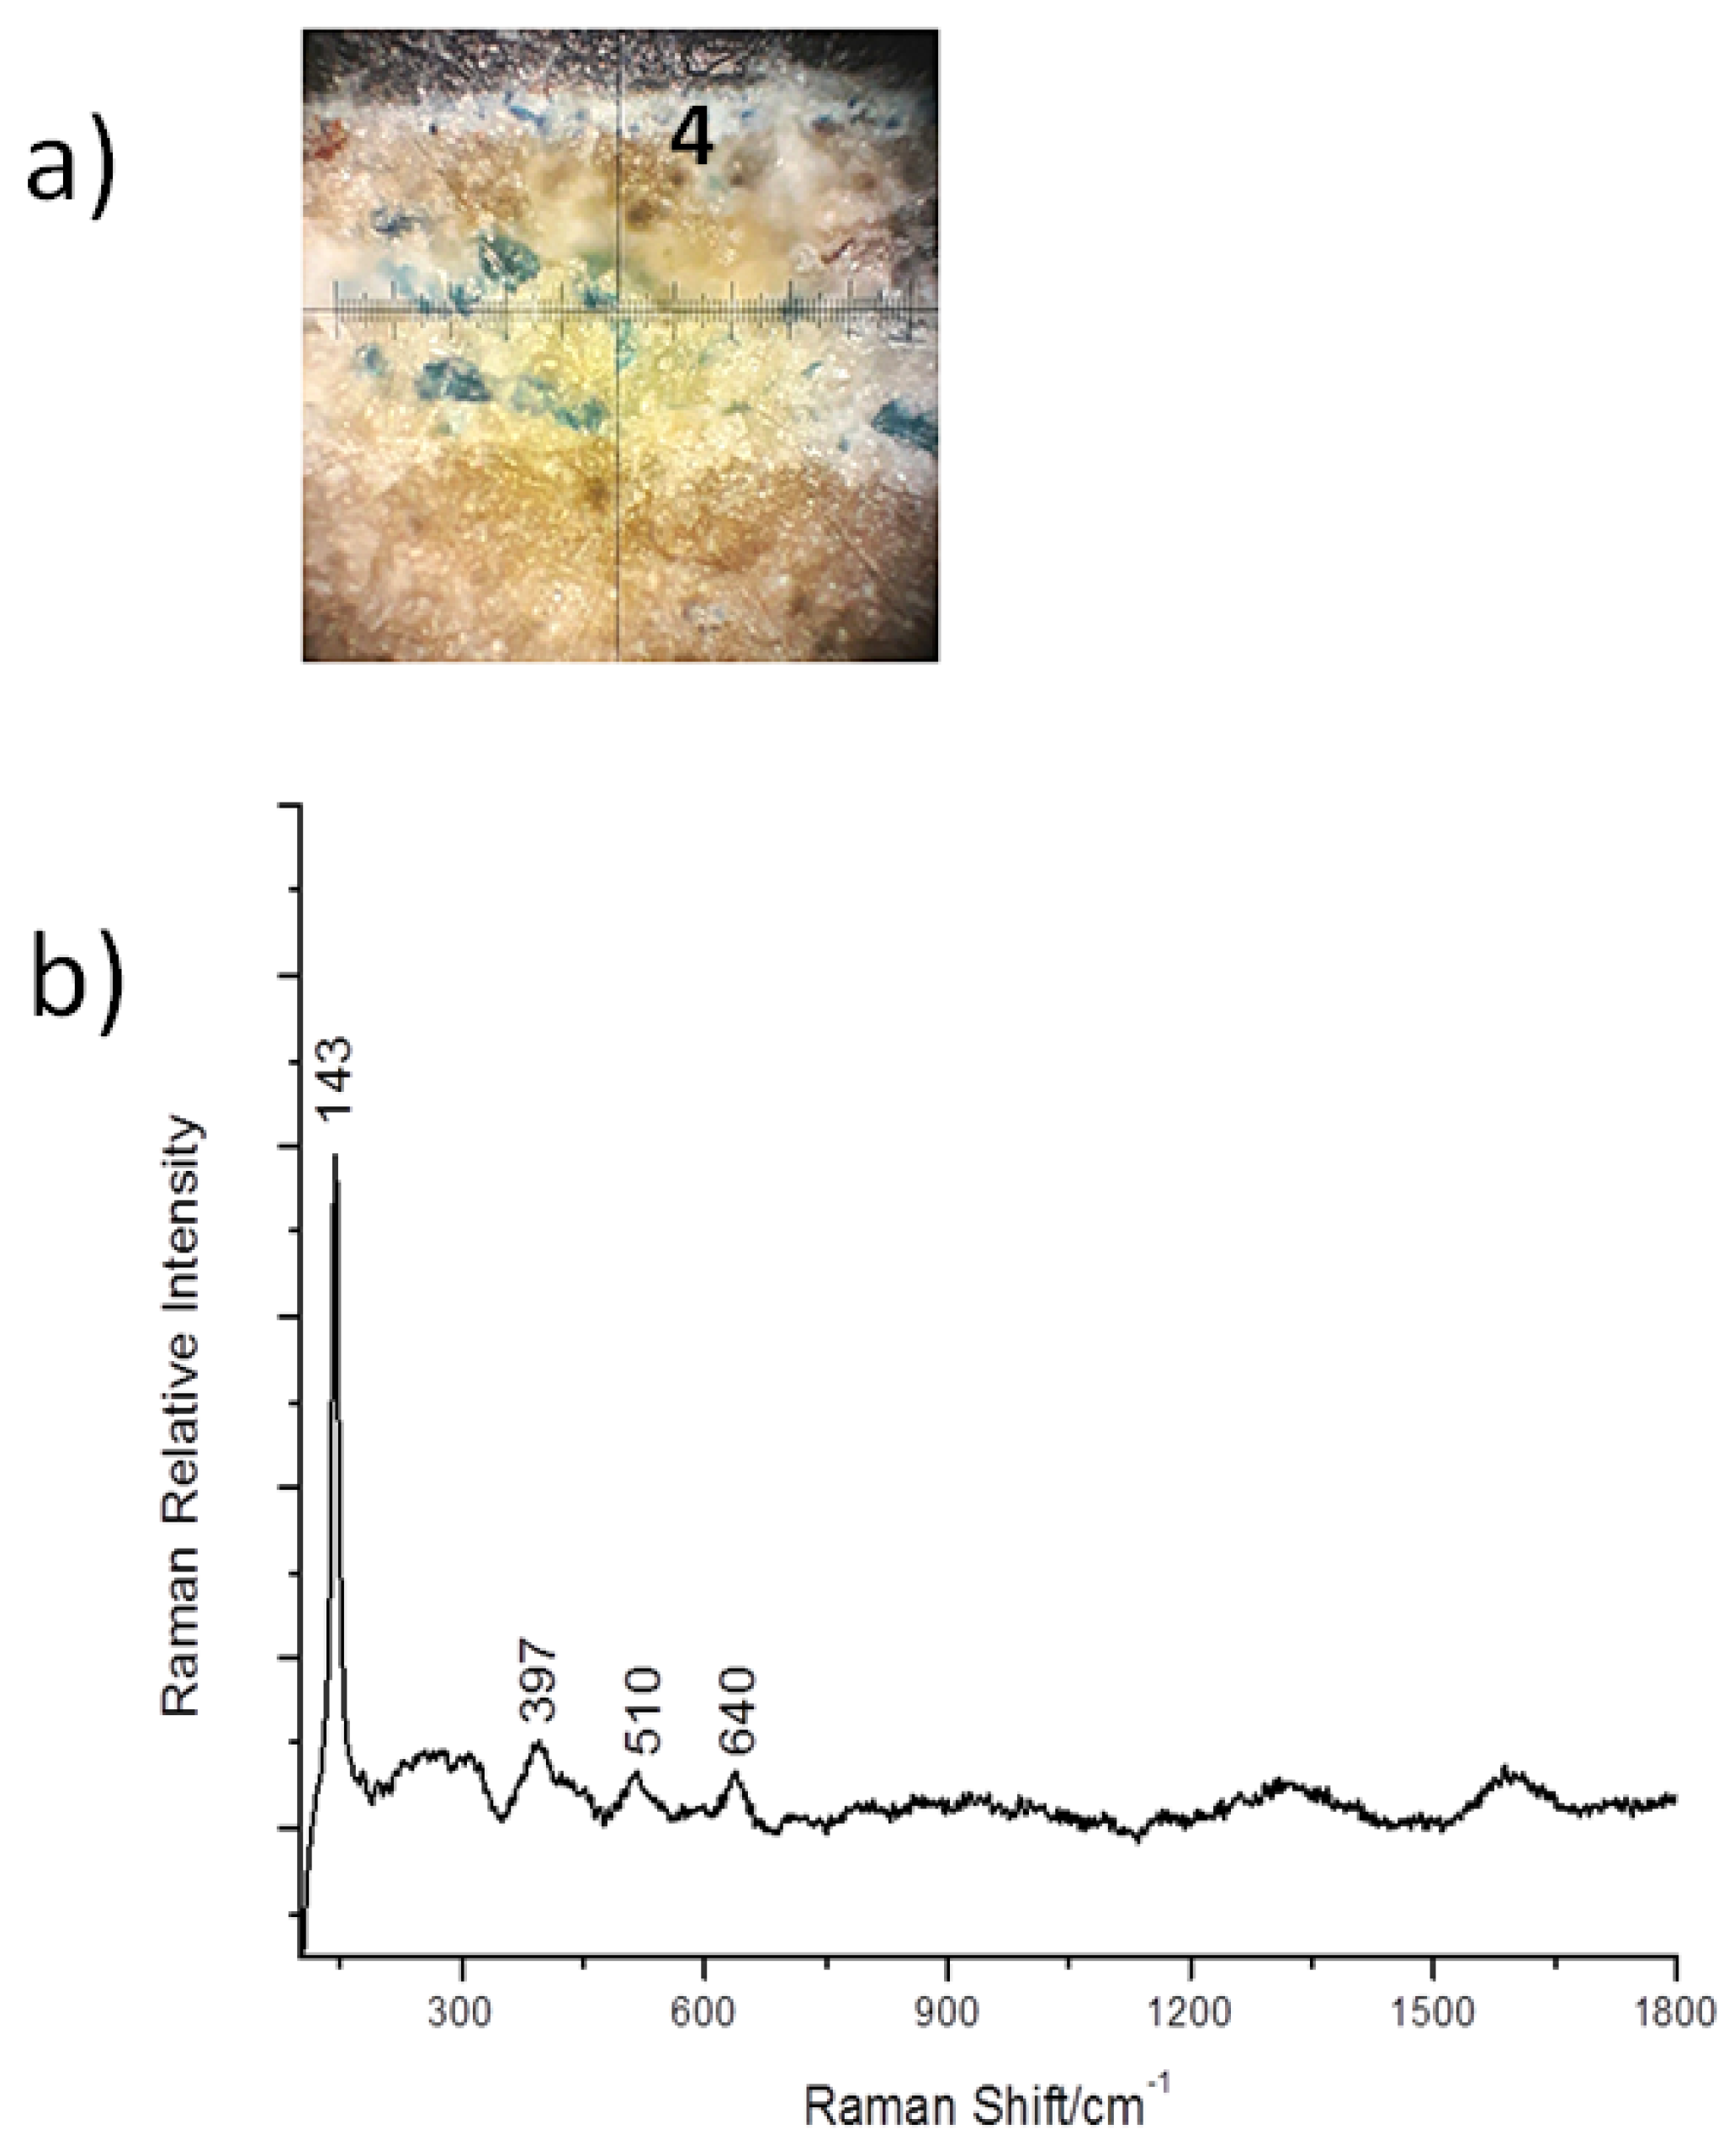
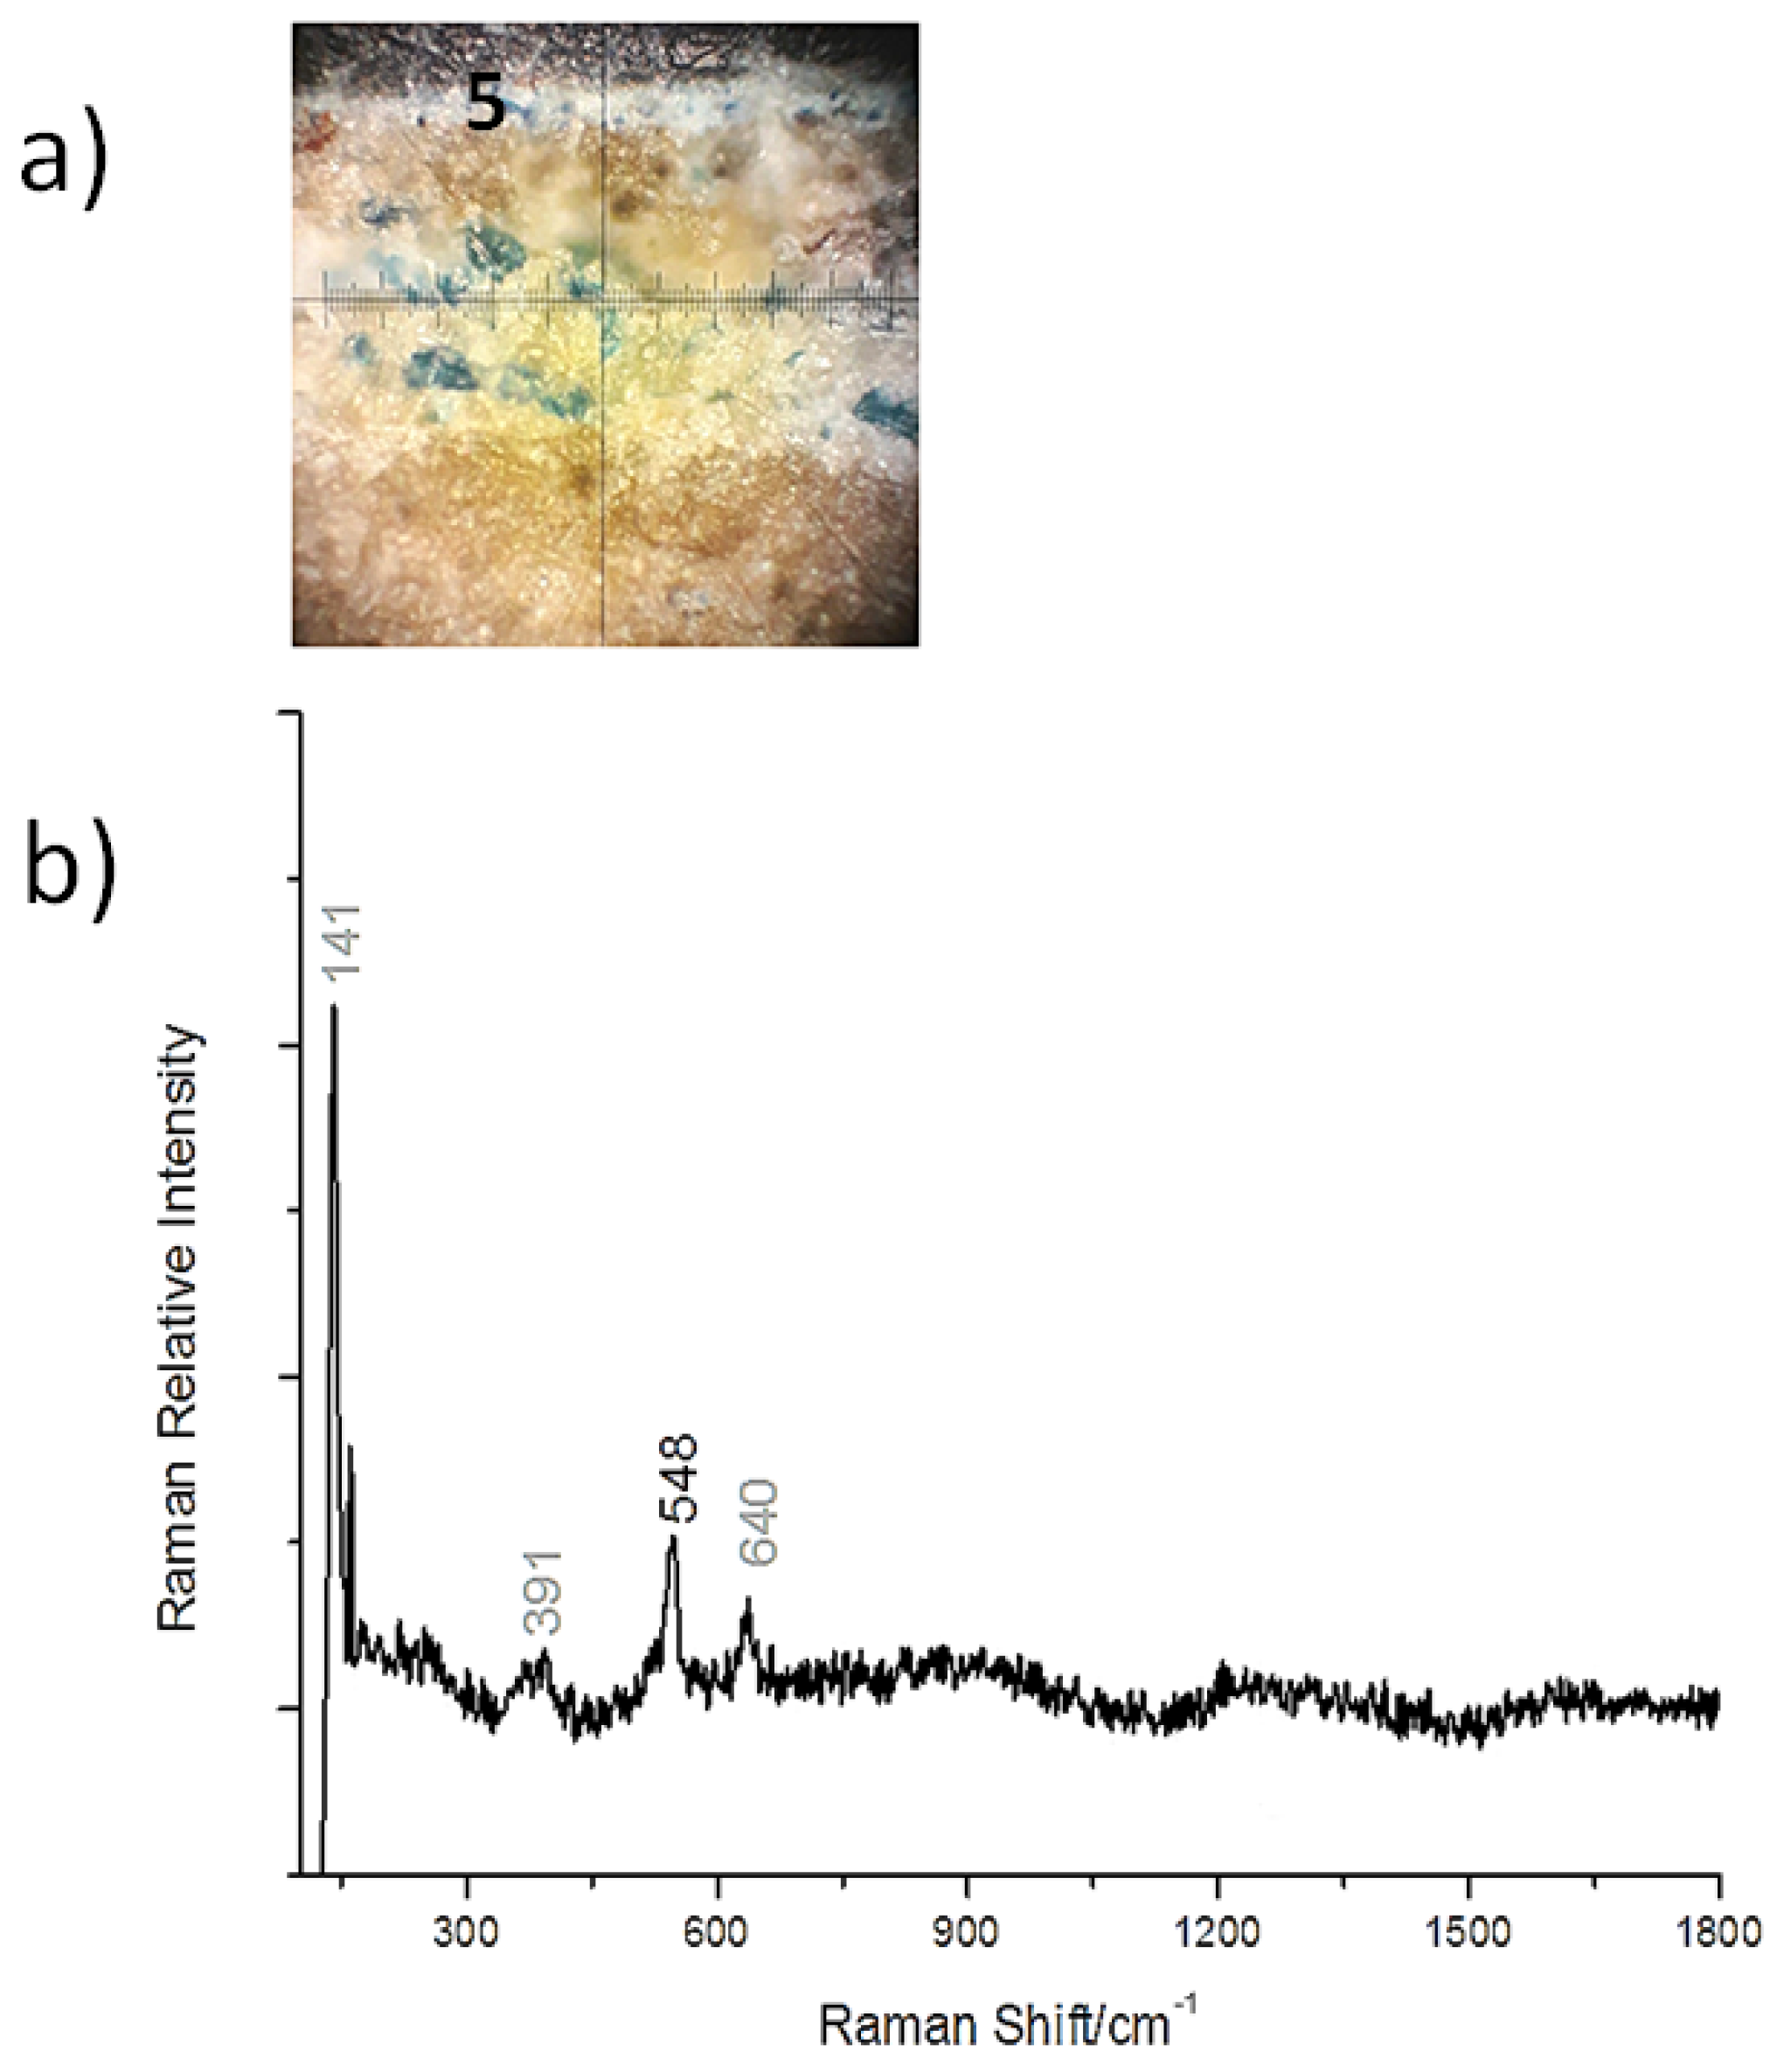
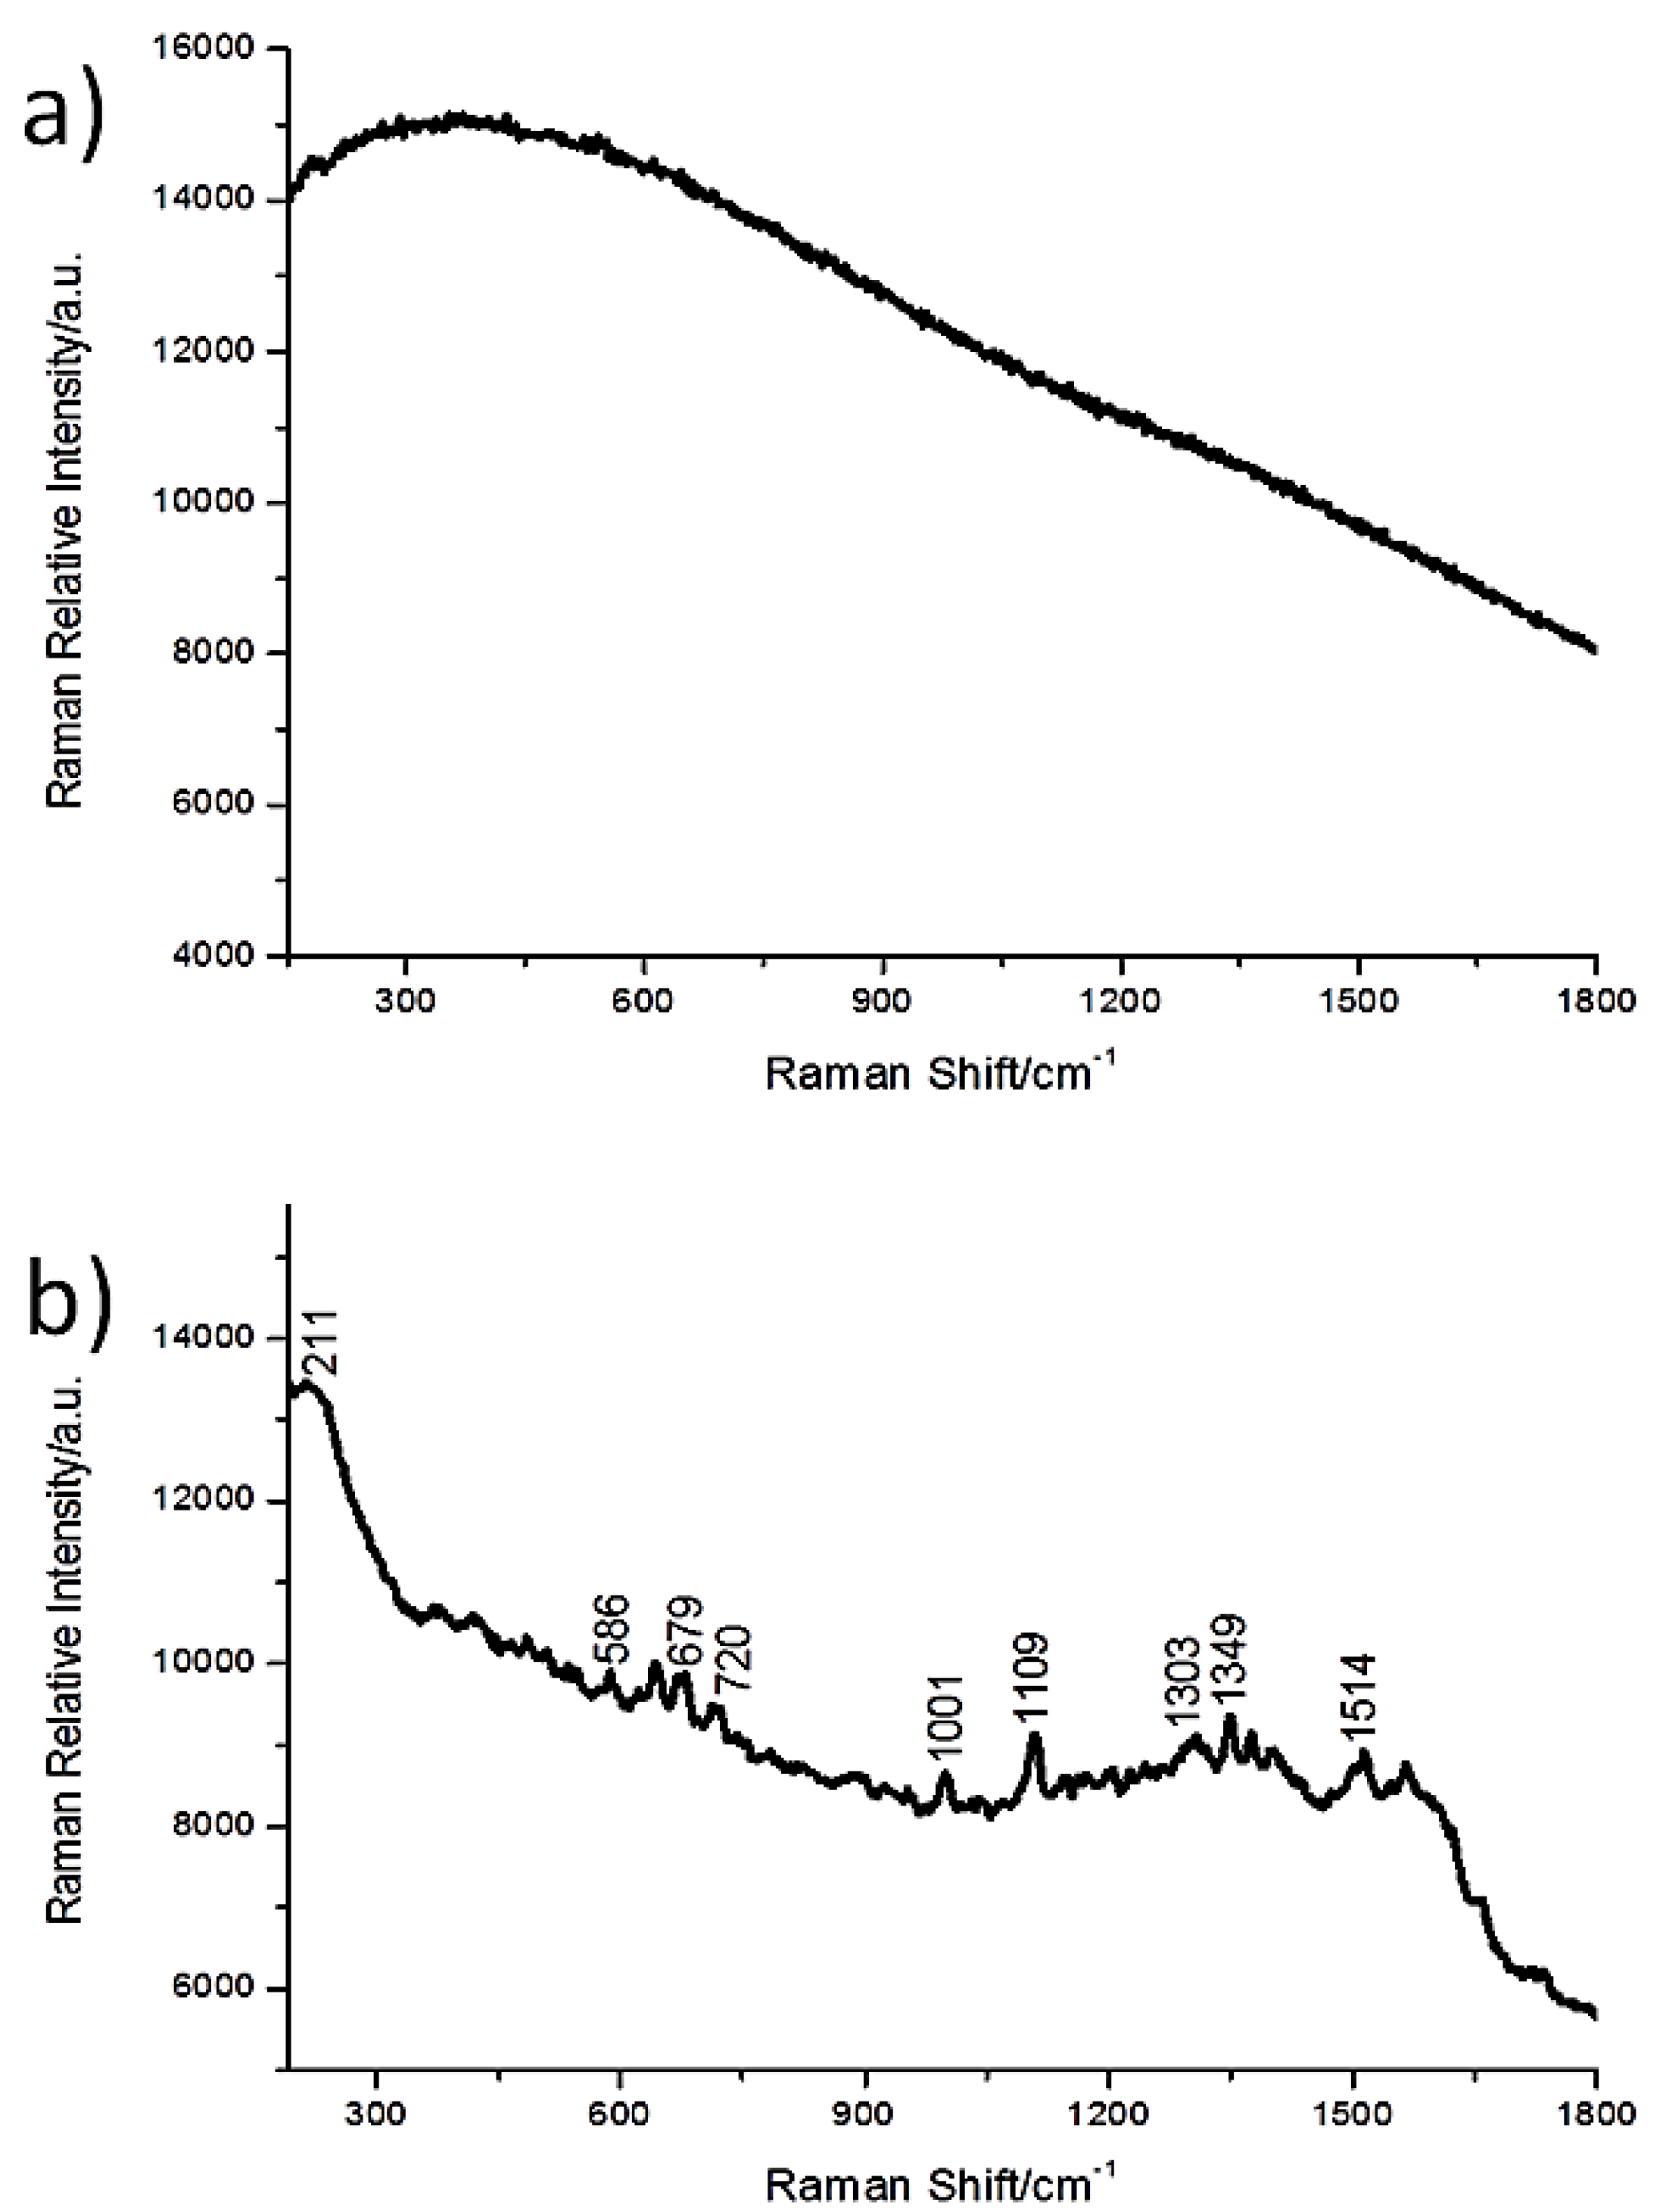
3.2. Cross-Sections Analysis: Bluish Background (CS7), an Exemplificative Study
4. Conclusions
Supplementary Materials
Author Contributions
Funding
Acknowledgments
Conflicts of Interest
References
- Pinna, D.; Galeotti, M.; Mazzeo, R. Scientific examination for the investigation of paintings. In A Handbook for Restorers; Centro Di of Edifimi srl: Florence, Italy, 2011. [Google Scholar]
- Zalaffi, M.S.; Karimian, N.; Ugo, P. Review—Electrochemical and SERS Sensors for Cultural Heritage Diagnostics and Conservation: Recent Advances and Prospects. J. Electrochem. Soc. 2020, 167, 037548. [Google Scholar] [CrossRef]
- Smith, G.D.; Clark, R.J.H. Raman microscopy in archaeological science. J. Archaeol. Sci. 2004, 31, 1137–1160. [Google Scholar] [CrossRef]
- Wiesinger, R.; Pagnin, L.; Anghelone, M.; Moretto, L.M.; Orsega, E.F.; Schreiner, M. Pigment and Binder Concentrations in Modern Paint Samples Determined by IR and Raman Spectroscopy. Angew. Chem. Int. Ed. 2018, 57, 7401–7407. [Google Scholar] [CrossRef] [PubMed]
- Fleischmann, M.; Hendra, P.J.; McQuillan, A.J. Raman spectra of pyridzine adsorbed at a silver electrode. Chem. Phys. Lett. 1974, 26, 163–166. [Google Scholar] [CrossRef]
- Le Ru, E.C.; Blackie, E.; Meyer, M.; Etchegoin, P.G. Surface Enhanced Raman Scattering Enhancement Factors: A Comprehensive Study. J. Phys. Chem. C 2007, 111, 13794–13803. [Google Scholar] [CrossRef]
- Jurasekova, Z.; Del Puerto, E.; Bruno, G.; García-Ramos, J.V.; Sanchez-Cortes, S.; Domingo, C. Extractionless non-hydrolysis surface-enhanced Raman spectroscopic detection of historical mordant dyes on textile fibers. J. Raman Spectrosc. 2010, 41, 1455–1461. [Google Scholar] [CrossRef]
- Pozzi, F.; Lombardi, J.R.; Leona, M. Winsor & Newton original handbooks: A surface-enhanced Raman scattering (SERS) and Raman spectral database of dyes from modern watercolor pigments. Heritage Sci. 2013, 1, 23. [Google Scholar] [CrossRef]
- Idone, A.; Aceto, M.; Diana, E.; Appolonia, L.; Gulmini, M. Surface-enhanced Raman scattering for the analysis of red lake pigments in painting layers mounted in cross sections. J. Raman Spectrosc. 2014, 45, 1127–1132. [Google Scholar] [CrossRef]
- Lee, P.C.; Meisel, D. Adsorption and surface-enhanced Raman of dyes on silver and gold sols. J. Phys. Chem. 1982, 86, 3391–3395. [Google Scholar] [CrossRef]
- Cañamares, M.V.; Garcia-Ramos, J.V.; Gómez-Varga, J.D.; Domingo, C.; Sanchez-Cortes, S. Comparative Study of the Morphology, Aggregation, Adherence to Glass, and Surface-Enhanced Raman Scattering Activity of Silver Nanoparticles Prepared by Chemical Reduction of Ag+Using Citrate and Hydroxylamine. Langmuir 2005, 21, 8546–8553. [Google Scholar] [CrossRef]
- Guerrero-Martínez, A.; Barbosa, S.; Pastoriza-Santos, I.; Liz-Marzán, L.M. Nanostars shine bright for you. Curr. Opin. Colloid Interface Sci. 2011, 16, 118–127. [Google Scholar] [CrossRef]
- Wang, Y.; Camargo, P.H.C.; Skrabalak, S.E.; Gu, H.; Xia, Y. A Facile, Water-Based Synthesis of Highly Branched Nanostructures of Silver. Langmuir 2008, 24, 12042–12046. [Google Scholar] [CrossRef]
- Garcia-Leis, A.; Garcia-Ramos, J.V.; Sanchez-Cortes, S. Silver Nanostars with High SERS Performance. J. Phys. Chem. C 2013, 117, 7791–7795. [Google Scholar] [CrossRef]
- Zalaffi, M.S.; Litti, L.; Canton, P.; Meneghetti, M.; Moretto, L.M.; Ugo, P. Preparation and characterization of Ag-nanostars@Au-nanowires hierarchical nanostructures for highly sensitive surface enhanced Raman spectroscopy. Nano Express 2020, 1, 020006. [Google Scholar] [CrossRef]
- Kumar, P.S.; Pastoriza-Santos, I.; Rodríguez-González, B.; De Abajo, F.J.G.; Liz-Marzán, L.M. High-yield synthesis and optical response of gold nanostars. Nanotechnology 2008, 19, 015606. [Google Scholar] [CrossRef]
- Litti, L.; Reguera, J.; De Abajo, F.J.G.; Meneghetti, M.; Liz-Marzán, L.M. Manipulating chemistry through nanoparticle morphology. Nanoscale Horiz. 2020, 5, 102–108. [Google Scholar] [CrossRef]
- Rodríguez-Lorenzo, L.; Álvarez-Puebla, R.A.; Pastoriza-Santos, I.; Mazzucco, S.; Stéphan, O.; Kociak, M.; Liz-Marzán, L.M.; De Abajo, F.J.G. Zeptomol Detection Through Controlled Ultrasensitive Surface-Enhanced Raman Scattering. J. Am. Chem. Soc. 2009, 131, 4616–4618. [Google Scholar] [CrossRef]
- Pastoriza-Santos, I.; Liz-Marzán, L.M. N,N-Dimethylformamide as a Reaction Medium for Metal Nanoparticle Synthesis. Adv. Funct. Mater. 2009, 19, 679–688. [Google Scholar] [CrossRef]
- Yuan, H.; Khoury, C.G.; Hwang, H.; Wilson, C.M.; A Grant, G.; Vo-Dinh, T. Gold nanostars: Surfactant-free synthesis, 3D modelling, and two-photon photoluminescence imaging. Nanotechnology 2012, 23, 075102. [Google Scholar] [CrossRef]
- Yamamoto, M.; Kashiwagi, Y.; Sakata, T.; Mori, H.; Nakamoto, M. Synthesis and Morphology of Star-Shaped Gold Nanoplates Protected by Poly(N-vinyl-2-pyrrolidone). Chem. Mater. 2005, 17, 5391–5393. [Google Scholar] [CrossRef]
- Bakr, O.M.; Wunsch, B.H.; Stellacci, F. High-Yield Synthesis of Multi-Branched Urchin-Like Gold Nanoparticles. Chem. Mater. 2006, 18, 3297–3301. [Google Scholar] [CrossRef]
- Zhou, M.; Chen, S.; Zhao, S. Preparation of Branched Gold Nanocrystals by an Electrochemical Method. Chem. Lett. 2006, 35, 332–333. [Google Scholar] [CrossRef]
- Li, Z.; Li, W.; Camargo, P.H.C.; Xia, Y. Facile Synthesis of Branched Au Nanostructures by Templating Against a Self-Destructive Lattice of Magnetic Fe Nanoparticles. Angew. Chem. Int. Ed. 2008, 47, 9653–9656. [Google Scholar] [CrossRef] [PubMed]
- Lu, L.; Kobayashi, A.; Tawa, K.; Ozaki, Y. Silver Nanoplates with Special Shapes: Controlled Synthesis and Their Surface Plasmon Resonance and Surface-Enhanced Raman Scattering Properties. Chem. Mater. 2006, 18, 4894–4901. [Google Scholar] [CrossRef]
- Zalaffi, M.S. Metal Nanostructures Decorated with Silver Nanostars: A Novel Highly Efficient Substrate for Dyes and Pigments Detection. Ph.D. Thesis, Università degli Studi di Trieste and Università Ca’ Foscari, Venezia, Italy, 2019. [Google Scholar]
- da Campagnola, S. L’arte nella chiesa e nel convento di s. Maria Maddalena e dell’Immacolata (già S. Caterina). In I Cappuccini a Parma: Quattro secoli di vita; da Mareto, F., Ed.; Istitutografico tiberino: Rome, Italy, 1961. [Google Scholar]
- Ricci, C. La Regia. Galleria di Parma; BatteiL: Parma, Italy, 1896. [Google Scholar]
- Fornari-Schianchi, L.; Riccomini, E. Galleria Nazionale di Parma, Catalogo delle opere dall’antico al Cinquecento; Ricci, F.M., Ed.; Franco Maria Ri: Milan, Italy, 1997. [Google Scholar]
- Laver, M. Titanium dioxide whites in Artists’ Pigments. In A Handbook of Their History and Characteristics, 3rd ed.; Fitzhugh, E.W., Ed.; National Gallery of Art: Washington, DC, USA, 1997; Volume 3. [Google Scholar]
- Feller, R.L. Barium Sulphate—Natural and Synthetic in Artists’ Pigments. In A Handbook of Their History and Characteristics; Feller, R.L., Ed.; Cambridge University Press: Cambridge, UK, 1986; Volume 1, pp. 255–283. [Google Scholar]
- Newman, R. Chromium oxide greens in “Artists” Pigments. In A Handbook of Their History and Characteristics, 3rd ed.; Fitzhugh, E.W., Ed.; National Gallery of Art: Washington, DC, USA, 1997; Volume 3. [Google Scholar]
- Burgio, L.; Clark, R.J.H. Library of FT-Raman spectra of pigments, minerals, pigment media and varnishes, and supplement to existing library of Raman spectra of pigments with visible excitation. Spectrochim. Acta Part A Mol. Biomol. Spectrosc. 2001, 57, 1491–1521. [Google Scholar] [CrossRef]
- Caggiani, M.; Cosentino, A.; Mangone, A. Pigments Checker version 3.0, a handy set for conservation scientists: A free online Raman spectra database. Microchem. J. 2016, 129, 123–132. [Google Scholar] [CrossRef]
- Plesters, J. Ultramarine Blue, Natural and Artificial in Artists’ Pigments. In A Handbook of their History and Characteristics; Feller, R.L., Ed.; Cambridge University Press: Cambridge, UK, 1986; Volume 1, pp. 37–61. [Google Scholar]
- Available online: www.maimeri.it (accessed on 15 July 2020).
- Scherrer, N.C.; Stefan, Z.; Francoise, D.; Annette, F.; Renate, K. Synthetic organic pigments of the 20th and 21st century relevant to artist’s paints: Raman spectra reference collection. Spectrochim. Acta Part A Mol. Biomol. Spectrosc. 2009, 73, 505–524. [Google Scholar] [CrossRef] [PubMed]
- Defeyt, C.; Strivay, D. PB15 as 20th and 21st artists’ pigments: Conservation concerns. e-PS 2014, 11, 6–14. [Google Scholar]
- Harroun, S.G.; Bergman, J.; Jablonski, E.; Brosseau, C.L. Surface-enhanced Raman spectroscopy analysis of house paint and wallpaper samples from an 18th century historic property. Analyst 2011, 136, 3453. [Google Scholar] [CrossRef]
- Dahlen, M.A. The Phthalocyanines a New Class of Synthetic Pigments and Dyes. Ind. Eng. Chem. 1939, 31, 839–847. [Google Scholar] [CrossRef]
- Cañamares, M.; Garcia-Ramos, J.; Domingo, C.; Sanchez-Cortes, S. Surface-enhanced Raman scattering study of the anthraquinone red pigment carminic acid. Vib. Spectrosc. 2006, 40, 161–167. [Google Scholar] [CrossRef]


Publisher’s Note: MDPI stays neutral with regard to jurisdictional claims in published maps and institutional affiliations. |
© 2020 by the authors. Licensee MDPI, Basel, Switzerland. This article is an open access article distributed under the terms and conditions of the Creative Commons Attribution (CC BY) license (http://creativecommons.org/licenses/by/4.0/).
Share and Cite
Zalaffi, M.S.; Agostinelli, I.; Karimian, N.; Ugo, P. Ag-Nanostars for the Sensitive SERS Detection of Dyes in Artistic Cross-Sections—Madonna della Misericordia of the National Gallery of Parma: A Case Study. Heritage 2020, 3, 1344-1359. https://doi.org/10.3390/heritage3040074
Zalaffi MS, Agostinelli I, Karimian N, Ugo P. Ag-Nanostars for the Sensitive SERS Detection of Dyes in Artistic Cross-Sections—Madonna della Misericordia of the National Gallery of Parma: A Case Study. Heritage. 2020; 3(4):1344-1359. https://doi.org/10.3390/heritage3040074
Chicago/Turabian StyleZalaffi, Maria Sole, Ines Agostinelli, Najmeh Karimian, and Paolo Ugo. 2020. "Ag-Nanostars for the Sensitive SERS Detection of Dyes in Artistic Cross-Sections—Madonna della Misericordia of the National Gallery of Parma: A Case Study" Heritage 3, no. 4: 1344-1359. https://doi.org/10.3390/heritage3040074
APA StyleZalaffi, M. S., Agostinelli, I., Karimian, N., & Ugo, P. (2020). Ag-Nanostars for the Sensitive SERS Detection of Dyes in Artistic Cross-Sections—Madonna della Misericordia of the National Gallery of Parma: A Case Study. Heritage, 3(4), 1344-1359. https://doi.org/10.3390/heritage3040074