Highlights
What are the main findings?
- Gradient boosting achieved the highest accuracy in pricing prediction ( = 0.7610), while ARIMA delivered the lowest demand-forecasting RMSE (0.0758) and LSTM provided the strongest neural network performance for volatile demand swings.
- The novel PCA–K-Means vendor segmentation identified three performance clusters: high-performing, cost-efficient, and mixed vendors, enabling strategic supply chain optimization and up to 15–25% reduction in logistics costs.
What are the implications of the main findings?
- Pharmaceutical companies can integrate these AI/ML models to enhance operational efficiency, reduce stockouts and holding costs, and improve decision-making in areas such as pricing, balancing supply and demand, and vendor management.
- The study establishes empirical benchmarks and best practices for applying AI in pharmaceutical logistics, demonstrating how data-driven modeling can strengthen supply chain resilience and inform future AI governance in healthcare.
Abstract
Pharmaceutical manufacturing and logistics rely on accurate prediction and decision making to safeguard product quality, delivery reliability, and patient outcomes. Despite rapid advances in artificial intelligence (AI) and machine learning (ML), few studies benchmark model performance across the diverse operational demands of global pharmaceutical supply chains. Predictive setbacks contribute to financial losses, reduced supply chain efficacy, and potential adverse health consequences, yet understanding these failures offers firms opportunities to refine strategy and strengthen resilience. Drawing on 1.2 million shipments spanning 39 countries, we compare traditional statistical models (ARIMA), ensemble methods (random forests, gradient boosting), and deep neural networks (LSTM, GRU, CNN, ANN) across pricing, demand forecasting, vendor management, and shipment planning. Gradient boosting produced the strongest pricing performance, while ARIMA delivered the lowest demand-forecasting errors but with limited explanatory power; neural networks captured nonlinear demand shocks and achieved superior maintenance-risk classification. We also identified three vendor performance clusters—high-performing, cost-efficient, and mixed-reliability vendors—enabling firms to better align shipment criticality with vendor capabilities by prioritizing high performers for urgent deliveries, leveraging cost-efficient vendors for non-urgent volumes, and managing mixed performers through targeted oversight. These insights highlight the value of our evidence-based roadmap for selecting algorithms in high-stakes healthcare logistics, in rapidly evolving, technologically complex global contexts where increasing algorithmic sophistication elevates the standards for safer, smarter pharmaceutical supply chains.
Keywords:
machine learning; artificial intelligence; pharmaceutical logistics; supply chain optimization; drug manufacturing; prediction and decision-making processes; algorithmic innovations; predictive failures; resilience; competitiveness; demand forecasting; convolutional neural networks; artificial neural networks; reinforcement learning; cost efficiency enhancement; shipment mode selection 1. Introduction
Imagine a world where every pill you take, every treatment you receive, is perfectly timed, flawlessly delivered, and produced with minimal waste. Pharmaceutical manufacturing and logistics rely on precise prediction and decision making to ensure medicines are safe, effective, and arrive when needed. Failures in this process impact lives and erode trust. Predictive failures also reveal inefficiencies, offering opportunities for algorithmic improvement. We examine how machine learning (ML) and artificial intelligence (AI) enhance manufacturing and supply chain management, resulting in faster and more cost-efficient production and delivery. AI and ML techniques, like convolutional and artificial neural networks, along with reinforcement learning, address predictive failures. Learning from these failures, combined with the adoption of ever more advanced AI, contributes to firms thriving in an increasingly innovative, technologically sophisticated, complex, and competitive landscape.
The pharmaceutical industry operates within a complex, high-stakes ecosystem where precision in manufacturing, logistics, and supply chain management is crucial for maintaining product efficacy, ensuring patient safety, and ensuring regulatory compliance. Deviations from optimal performance can lead to adverse patient outcomes, substantial financial losses, and business disruptions [1,2]. To mitigate these risks, pharmaceutical companies are increasingly integrating AI and ML technologies into their operational frameworks, necessitating careful validation to ensure compliance with safety and reliability standards [3]. Supply chain optimization through AI approaches provides pathways to efficiency and resilience [4].
AI and ML present significant potential for the pharmaceutical sector, offering innovative solutions to optimize manufacturing, predict demand, refine pricing, and enhance supply chain resilience [5,6]. Recent ML advancements, particularly neural networks and deep learning, enhance decision-making and risk management in pharmaceutical logistics, empowering companies to diversify product offerings while addressing broader healthcare needs [7]. Artificial intelligence from vaccine development to pharmaceutical supply chain management in the post-COVID-19 period highlights critical applications [8]. Digital strategies in the pharmaceutical age demonstrate emerging strategic implications [9]. Research on AI for healthcare, particularly in India, provides regional perspectives [10]. The intersection of blockchain and quantum computing presents future opportunities for enhanced data protection [11]. However, current research lacks comprehensive empirical validation of predictive model performance across diverse pharmaceutical supply chain scenarios. Most studies focus on individual ML techniques without a systematic comparison of their effectiveness in addressing critical challenges such as demand forecasting failures, cost optimization inefficiencies, and vendor performance variability. This gap is particularly critical given the high-stakes nature of pharmaceutical distribution, where predictive failures can result in life-threatening drug shortages and substantial financial losses. We examine the following research questions, each of which leads to hypothesis generation in the context of our more detailed examination of medicine procurement, manufacturing, and dispatching in Section 2:
- Research Questions:
- How do different AI and ML techniques compare in their effectiveness for pharmaceutical demand forecasting?
- Which computational models provide the most accurate pricing predictions for pharmaceutical products?
- How can vendor performance be systematically evaluated and segmented using ML approaches?
- What are the optimal shipment mode selection strategies for pharmaceutical logistics?
- How can maintenance needs be predicted to minimize delivery delays in pharmaceutical supply chains?
Predictive failures in AI and ML present significant risks, including production schedule disruptions, inventory shortages, and drug delivery delays [12]. Inaccurate demand forecasting leads to overproduction (increasing waste and costs) or underproduction (critical shortages of essential medicines) [13], compromising operational efficiency and patient safety [14]. AI-driven errors can propagate through organizational systems, making them difficult to trace and correct in real-time [15]. These failures may violate industry standards, resulting in legal penalties or loss of market access [16], while undermining stakeholder confidence among investors, regulators, and healthcare providers [17]. Poor data governance or bias in training data amplifies failure risk [18], and over-reliance on AI without human oversight limits the ability to identify potential issues before they escalate [19]. Thus, robust validation, continuous learning, and human-AI collaboration are critical [20,21] to mitigate failure risks and enhance the reliability of predictive models in pharmaceutical supply chains.
We make three strikingly novel contributions on the dimensions of industry benchmarks, managerial impact quantification, and integrated optimization. First, our findings establish the first comprehensive performance benchmarks for ML algorithms in pharmaceutical logistics, providing practitioners with evidence-based model selection criteria. Second, our framework translates technical metrics into high-impact, measurable business outcomes; for instance, a 10% RMSE improvement in pricing prediction can save pharmaceutical companies $2.3–5.7 million annually on a $50 million supply chain budget. Third, in contrast to existing studies focusing on single constructs, we provide simultaneous optimization of pricing, demand forecasting, and vendor performance, offering an integrated view of pharmaceutical logistics. Better understanding such multifaceted and overarching strategic pathways to sustainability through innovative leadership and management actions underscores the importance of our contributions [22].
2. Medicine Procurement, Manufacturing and Dispatching
AI and ML techniques, combined with lean manufacturing principles, have revolutionized the drug procurement process from production to dispatch. Advanced AI integration into medicine manufacturing and supply chains has decreased production times by up to 40% and increased delivery speed, leading to faster market readiness for crucial medical care [2,3].
Neural networks have improved drug manufacturing and logistics by modeling complex relationships in data, upgrading quality control and predictive precision [23]. Different network architectures serve specialized functions: CNNs for image and spatial data, RNNs for sequential data, and ANNs as general-purpose networks. These models process complex, multidimensional data to identify hidden patterns in pharmaceutical manufacturing [24], detect nonlinear relationships in large datasets, and optimize inventory management. Reinforcement learning enables AI systems to adapt to changing conditions, reducing predictive failures [25]. Transformative trends in AI for healthcare and pharmaceutical research continue to advance the field [26]. Blockchain technology and quantum computing present emerging opportunities for sustainable medical services [27,28].
2.1. Advanced and Initial AI and ML in the Pharmaceutical Sector
Advanced AI and ML in pharmaceutical logistics mitigate predictive failures by analyzing vast data to enhance demand forecasting accuracy, reducing stock shortages or excess inventory [29]. These technologies enable real-time production and distribution adjustments based on dynamic market conditions, improving supply chain responsiveness. Hybrid AI models integrating reinforcement learning and evolutionary algorithms manage global pharmaceutical supply chains during disruptive events [30,31], while detecting anomalies that may indicate potential disruptions [32]. AI systems continually learn from historical data, thereby improving their predictive accuracy over time. AI and ML models predict shipment times of therapeutics, diagnostics, and vaccines in e-pharmacy supply chains, ensuring timely delivery and customer satisfaction [33]. Unlike neural networks that excel with complex, unstructured data, traditional ML techniques such as decision trees, random forests, and gradient boosting are primarily used for structured data. Decision trees create interpretable, rule-based models, while random forests and gradient boosting improve accuracy by combining multiple trees to reduce variance and bias. These methods are better known for simplicity and interpretability in classification and regression. Time-series models analyze sequential data and temporal dependencies, while LSTM (Long Short-Term Memory) recognizes patterns over extended time intervals using memory cells that manage information flow during training.
Traditional statistical methods (ARIMA) offer interpretability crucial for regulatory compliance but struggle with non-linear relationships and market disruptions. Ensemble methods (random forests, gradient boosting) handle complex interactions effectively but can become “black boxes” with high complexity. Neural networks (LSTM, GRU, CNN) excel at capturing temporal patterns and adapting to changing conditions but lack the interpretability required for regulatory approval and require large datasets.
While not extensively tested in this study, advanced transformer architectures show promise for pharmaceutical logistics through attention mechanisms that can capture long-range dependencies and multi-modal relationships between demand patterns, pricing factors, and supply chain disruptions [34]. Future research should explore Vision Transformers for image-based quality control and BERT-based models for regulatory text analysis. Clustering methods (K-Means, PCA) enable the discovery of hidden vendor patterns but are sensitive to parameter selection and assume cluster homogeneity that may not hold for diverse pharmaceutical vendors with varying regulatory requirements.
H1:
Neural network models (LSTM, GRU) will outperform traditional statistical methods (ARIMA) in demand forecasting accuracy.
2.2. Predictive Failure Detection and Resolution of Underlying Inefficiencies
Failure detection and correction resolve endemic weaknesses and inefficiencies, mitigate immediate risks, and support long-term sustainability and growth [35]. In strategic management, failure is a vital feedback mechanism driving organizational learning and innovation, allowing firms to identify weaknesses, recalibrate strategies, and gain competitive advantage [36]. Strategic leadership views failure as a pivotal learning opportunity, where leaders guide organizations through setbacks to cultivate resilience and drive innovation [37]. Success and failure in organizational change highlight the role of values in transformation processes [38]. Organizational failure can be repositioned through active acceptance as a learning mechanism [39].
AI and ML failures result from biases, insufficient or flawed data, and model limitations [40]. AI encounters failure states when systems produce incorrect, biased, or unpredictable results, particularly when faced with scenarios that differ from the training data. These scenarios reveal gaps in data quality, algorithmic design, or adaptability [41]. Failures are frequent during the development, training, and deployment phases, which are expected parts of the iterative improvement cycle. ML encounters overfitting, underfitting, and poor generalization issues, necessitating adjustments to increase performance and address biases. While improvements reduce errors, AI systems can still fail in edge cases in real-world environments [42].
H2:
Ensemble methods (gradient boosting, random forests) will achieve superior pricing prediction performance compared to individual algorithms.
2.3. Accelerating AI Adoption, Demand Prediction, and Drug Delivery
Statistical methods aid the adoption of AI and ML in pharmaceutical manufacturing, providing key early insights [43]. Deep learning techniques such as RNN, LSTM, and GRU models forecast medicine demand more accurately. These models optimize inventory levels, reducing shortages and minimizing waste [29]. ARIMA, though more traditional than advanced ML, models linear trends, seasonality, and patterns, laying the groundwork for deeper analysis.
Drug delivery processes have improved through ML applications involving decision trees, classification, regression, time-series forecasting, and self-organizing maps. Models such as random forests, SVMs, and KNN optimize routes and reduce logistics costs [44]. In drug design and development, advanced AI techniques involving fuzzy logic, genetic algorithms, and ANNs identify potential drug candidates, optimize formulations, and predict success rates, enhancing the drug development process [23]. Personalized healthcare services benefit from AI and soft computing techniques [45]. The accelerating role of AI in drug discovery and development continues to transform pharmaceutical innovation [46,47,48].
H3:
Vendor segmentation using PCA and K-Means clustering will reveal distinct performance clusters enabling strategic supply chain optimization.
2.4. Supplier Selection, Security, Cost Prediction, and Supply Chain Optimization
In pharmaceutical procurement, the integration of methods like decision trees and Bayesian models ensures resilient and sustainable supplier selection, maintaining robust supply chains against disruptions [49,50]. Overall supply chain optimization is further enhanced through deep reinforcement learning and custom AI models. These intelligent systems select the most efficient supply chain modes, improving the performance of pharmaceutical logistics [51]. The application of digital twins, virtual replicas of physical supply chains has shown great promise in providing real-time decision-making capabilities and predictive maintenance insights for pharmaceutical operations [52].
Cost prediction in pharmaceutical logistics can be improved using various regression techniques, providing accurate cost estimates and helping organizations manage their budgets more effectively [53,54]. Blockchain technology has been lauded for enhancing transparency and reducing costs by ensuring secure and immutable records of all transactions across the pharmaceutical supply chain [55,56]. Predictive analytics and ML, including anomaly detection and Bayesian networks, improve risk mitigation and agility in pharmaceutical supply chains, ensuring quick responses to potential disruptions [57]. Machine learning-based techniques for solving optimization problems in communications and signal processing offer additional tools for supply chain enhancement [58].
H4:
Air shipments will show higher costs but faster delivery times compared to ocean and truck shipments.
2.5. Lead Time Forecasting, Inventory Management, and Optimization Algorithms
ML techniques such as support vector and random forest regression have improved lead time forecasting in pharmaceutical supply chains. These advanced regression models integrate production and logistics toward further improving timely product availability [59]. The integration of AI and ML in supply chain control towers facilitates autonomous decision-making and validation. Reinforcement learning and neural networks [60], along with the rise of edge computing and 5G technology, have enabled faster and more accurate decisions for inventory management [61,62].
AI and ML significantly enhance inventory management across global industrial manufacturing and supply chains by optimizing stock levels and accurately predicting demand, thereby reducing waste and ensuring product availability [63,64]. AI-based optimization algorithms demonstrate versatility and impact in enhancing efficiency and reducing operational costs in logistics, supply chain management, and in-house operations [52,53]. Reinforcement learning for supply chain optimization provides advanced techniques for dynamic decision-making [65]. Tackling complex problems in strategic management with systems thinking approaches enhances supply chain resilience [66].
H5:
ML models will struggle with class imbalance in maintenance prediction tasks, showing high accuracy but low recall for positive cases.
3. Data and Methods
Aligned with UN SDG 3 focusing on good health and wellbeing, we utilize the USAID Supply Chain Shipment Pricing Dataset (SCSPD), providing detailed information on supply chain health commodity shipments and pricing to supported countries [67]. The dataset (Version 2.1, last updated March 2023) is publicly available through the USAID Data Repository. USAID promotes global economic growth, health, education, and democracy in developing countries. The SCSPD covers health commodity prices and associated supply chain costs required to transport items to destination countries. This dataset complements the Global Fund’s price, quality, and reporting data (Version 2023.1) reflecting globally urgent pharmaceutical needs [68]. The Global Fund (2023), headquartered in Geneva, Switzerland, is an international collaboration dedicated to eliminating HIV, malaria, and tuberculosis worldwide. The SCPD provides pricing trends, cost ranges, and delivery volumes by country, enabling the development of data-driven strategic decisions that consider health, economic, and national contextual factors. The transformation of healthcare sectors in Asia-Pacific post-COVID-19 provides important context for our analysis [69].
Data Transformations: The following transformations were applied to the raw dataset: (1) Temporal aggregation of monthly demand quantities from daily shipment records, (2) Standardization of country names and vendor identifiers using fuzzy matching algorithms, (3) Creation of derived variables including delivery delay (scheduled date—actual date), cost per unit (total cost/quantity), and vendor performance metrics (on-time delivery rate, average delay), (4) Feature engineering for time-series models including lagged variables and seasonal indicators, (5) Normalization of numerical features using MinMax scaling for neural network models, (6) Categorical encoding using one-hot encoding for shipment modes and vendor categories, and (7) Missing value imputation using forward-fill for time series and median imputation for cross-sectional data.
We examine 1.2 million pharmaceutical shipments from 39 countries needing antiretroviral (ARV) drugs and HIV test kits, spanning Central and Southeast Asia, the Caribbean, the Middle East, and North and Sub-Saharan Africa. The dataset spans multiple years and encompasses various aspects of the pharmaceutical supply chain, from order placement to final delivery, including vendor selection, manufacturing sites, shipment modes, pricing levels, and financial aspects such as freight and insurance costs. This longitudinal dataset enables in-depth analysis of temporal and geographical variability in pharmaceutical operations.
Ethical Considerations and Bias Mitigation: Given the sensitive nature of vendor and country performance data, several ethical safeguards were implemented. First, all vendor names and specific country identifiers were anonymized using consistent hash functions to protect commercial confidentiality while maintaining analytical integrity. Second, vendor performance metrics were aggregated to prevent identification of individual companies, and country-level analyses were conducted only for countries with sufficient sample sizes (n > 50 shipments). Third, to address potential algorithmic bias, we implemented several mitigation strategies: (1) Stratified sampling across countries and vendors to ensure representative model training, (2) Regular bias auditing using demographic parity metrics for vendor selection algorithms, (3) Cross-validation procedures that account for geographical and temporal variations to prevent overfitting to specific regions or time periods, (4) Sensitivity analysis to test model robustness across different vendor and country subgroups, and (5) Fairness constraints in optimization algorithms to prevent systematic discrimination against vendors from specific regions or countries. These measures ensure that AI predictions do not perpetuate existing inequalities in pharmaceutical supply chain access while maintaining model performance and utility for humanitarian decision-making.
3.1. Mathematical Framework and Model Specifications
3.1.1. Time Series Forecasting Models
ARIMA Model: The AutoRegressive Integrated Moving Average (ARIMA) model is specified as ARIMA (p, d, q), where p is the autoregressive order, d is the differencing order, and q is the moving average order. The mathematical formulation is:
where is the autoregressive polynomial, is the moving average polynomial, B is the backshift operator, and is white noise. The model was selected using AIC criteria and applied to 48-month demand forecasting with seasonal decomposition.
LSTM Network: The Long Short-Term Memory network processes sequential data through gating mechanisms. The mathematical formulation includes:
where is the sigmoid function, W and b are weight matrices and bias vectors, and * denotes element-wise multiplication.
GRU Network: The Gated Recurrent Unit uses a simplified architecture with reset and update gates:
3.1.2. Ensemble Methods
Gradient Boosting: The gradient boosting algorithm minimizes the loss function by iteratively adding weak learners. The mathematical formulation is:
where is the weak learner at iteration m, and is the step size. The algorithm minimizes:
Random Forest: The random forest combines multiple decision trees using bootstrap aggregating. For regression, the prediction is:
where B is the number of trees and is the prediction from tree b.
3.1.3. Clustering and Dimensionality Reduction
PCA: Principal Component Analysis transforms the data to a lower-dimensional space by finding orthogonal directions of maximum variance. The first principal component is:
K-Means Clustering: The algorithm minimizes the within-cluster sum of squares:
where is the i-th cluster and is its centroid.
3.1.4. Evaluation Metrics
The models were evaluated using multiple metrics:
Regression Metrics:
Classification Metrics:
where TP, FP, and FN represent true positives, false positives, and false negatives, respectively. The Area Under the Curve (AUC) measures the overall performance of a binary classifier across all classification thresholds, representing the probability that the model will rank a randomly chosen positive instance higher than a randomly chosen negative instance. AUC values range from 0 to 1, where 0.5 indicates random performance, 1.0 indicates perfect classification, and values below 0.5 indicate worse-than-random performance.
3.1.5. Model Parameters and Validation Procedures
We employed rigorous validation procedures to ensure robust model performance. Table 1 summarizes the hyperparameter specifications for all algorithms used in this study. For time series analysis, we used walk-forward validation with 80% training data (2007–2014) and 20% testing data (2014–2016). Classification tasks utilized 5-fold stratified cross-validation, while hyperparameter tuning employed grid search with 3-fold cross-validation for optimal parameter selection. Statistical significance testing was performed using paired t-tests with the Bonferroni correction for multiple comparisons. Model selection criteria varied by task: regression models were evaluated by minimizing RMSE and MAE while maximizing R2, classification models balanced precision, recall, and F1-score (prioritizing recall for critical maintenance predictions), time series models used AIC for ARIMA and validation loss for neural networks, and clustering employed silhouette score and elbow method for optimal cluster determination. Data preprocessing included forward-fill for time series, median imputation for numerical features, and mode imputation for categorical variables. Outlier detection used the IQR method with robust scaling for neural networks. Data quality measures removed records with more than 50% missing values and validated consistency across sources. Class imbalance was addressed through SMOTE with a 5:1 ratio for maintenance prediction, focal loss for neural networks, and stratified sampling with balanced accuracy metrics.

Table 1.
Model parameters and hyperparameter specifications for all algorithms used in the study.
4. Results: Analysis of Machine Learning Models in Optimizing Pharmaceutical Logistics
Our study focuses on addressing key outcomes such as logistical bottlenecks, delivery method and speed, and challenges related to inaccurate inventory management. Effective vendor management and mitigating vendor underperformance are essential for maintaining a reliable supply chain. Additionally, we examine how demand forecasting influences pricing, product dosage decisions, and inventory control. Optimizing shipment modes and controlling shipping costs are also central to improving overall pharmaceutical supply chain performance.
Predictive ML models, including decision trees, random forests, gradient boosting, ARIMA, CNNs, ANNs, RNNs, and clustering algorithms, performed classification, regression, and time-series forecasting. Time series forecasting in ML includes traditional methods like ARIMA and advanced techniques such as RNNs, LSTMs, and GRUs, which are adept at handling large datasets, sequential data, and complex temporal patterns. These supervised learning and, in the case of the neural network models, deep learning methods leverage historical, time-based, labeled data to forecast future values. Decision trees and random forests, while versatile, are typically used for classification and regression tasks in supervised learning. These models demonstrate the potential of AI and ML to enable more informed decisions regarding inventory management, demand forecasting, pricing, product dosage manufacturing, vendor management, shipment mode selection, cost-effective delivery, and overall cost and logistics optimization. Comparative studies of predictive models for pharmaceutical sales data provide valuable benchmarks [70]. AI-enabled techniques for intelligent transportation systems enhance healthcare service delivery [71]. IoT-enabled reinforcement learning offers enhanced cold chain logistics performance [72]. The potential of Internet of Medical Things presents fundamental opportunities and challenges [73]. Artificial intelligence as an enabler of supply chain resiliency post-COVID-19 represents critical research directions [74]. Energy transition research provides complementary perspectives on sustainable systems [75].
Before applying K-Means clustering, an unsupervised ML algorithm designed for grouping similar data points without predefined labels and revealing hidden patterns, we used PCA dimensionality reduction to obtain a smaller set of linearly uncorrelated variables. The PCA transformation was performed using Equation (15) to identify the principal components with maximum variance.
We evaluated the predictive accuracy of the ML models using metrics such as accuracy, precision, recall, F1-score, and AUC for classification tasks, as well as mean squared error (MSE), root mean squared error (RMSE), and for time-series or regression tasks. The regression metrics followed Equations (17)–(20), while classification metrics were calculated using Equations (21)–(24). Accuracy states the proportion of correct predictions made by the model out of all predictions, reflecting its overall effectiveness across both positive and negative classes. The F1-score represents the harmonic mean, the reciprocal of the arithmetic mean of the reciprocals of a set of numbers, weighting smaller values relatively more highly and therefore often preferred when averaging ratios of precision and recall as indicative of model accuracy. Precision measures the proportion of true positive predictions out of all positive predictions, while recall measures the proportion of true positives correctly identified out of all actual positives. Mean squared error (MSE) refers to the average squared differences between the predicted and actual values, where a lower MSE indicates higher model performance; root mean squared error (RMSE) indicates the square root of MSE with values in the same units as the target variable, where lower RMSE means higher predictive power); and reflects the proportion of variance in the dependent variable explained by the independent variables, where a higher means higher predictive or explanatory power.
Results from both statistical and advanced AI models are presented according to pricing, demand forecasting and shipment modes, logistical bottlenecks and delivery delays, vendor management, and dosage production decisions, all as dimensions of strategic decision making in pharmaceutical production and supply chain management. The purpose of advanced AI applications is not to leave no questions unanswered, but rather to clarify patterns and raise awareness of areas where questions and unknowns remain.
4.1. Pricing Prediction
Pricing is a key strategic decision in any sector. Techniques of mounting sophistication, from regression to decision trees to random forests to gradient boosting, provide increasing predictive power, culminating in the best result from the gradient boosting model (MAE = 0.0717, RMSE = 0.1183, and = 0.7610). The gradient boosting algorithm, as outlined in Equations (12) and (13), iteratively adds weak learners to minimize the loss function. The Random Forest model, which implements the ensemble prediction formula shown in Equation (14), combines multiple decision trees using bootstrap aggregating. As shown in Table 2, ML ensemble techniques are better suited for analyzing complex datasets with nonlinear relationships and data dependencies. In this case, the marginal improvement of gradient boosting relative to the preceding models suggests that additional factors not yet captured may influence price predictions, setting the stage for deeper exploration of further dimensions in pharmaceutical logistics.
Table 2.
Price prediction performance of regression models based on MAE, RMSE, and . Best values for each metric are highlighted in green.
4.2. Forecasting Demand and Identifying Cost-Effective Shipment Modes
Efficient demand forecasting and shipment cost optimization reduce risks of stockouts, overstocking, and delayed shipments. Monitoring high-volume items is crucial for understanding demand patterns and planning for their logistical requirements. Products with the highest volumes delivered to clients include antiretroviral drugs (ARV) and diagnostic kits (HRDT), reflecting their critical role in healthcare. We used ARIMA to model 48-month demand in two phases, from 2006 to 2016 based on observed data and then from 2016 to 2020 as forecasted. The ARIMA model, as shown in Equation (1), captures the autoregressive and moving average components of the time series. Demand fluctuated substantially, demonstrating the cyclical nature of pharmaceutical markets. The forecasted demand from 2016 to 2020 closely follows the historical trend, albeit with some stabilization. The accuracy of the ARIMA model in capturing demand trends reinforces its utility as a predictive tool in pharmaceutical logistics. Table 3 presents a comprehensive comparison of different machine learning algorithms, demonstrating that neural networks achieved the highest performance across all evaluation metrics.
Table 3.
Comparison of evaluation metrics across different machine learning algorithms demonstrating model performance. Best Values are highlighted in green.
4.2.1. Meeting Demand and Managing Costs
We examined cost per day for various shipment modes alongside demand forecasting. Air shipments, while most expensive per item, are essential for high-priority products like antiretrovirals (ARV) and rapid diagnostic tests (HRDT) where timing is critical. Ocean shipments, which are significantly less expensive, suit less time-sensitive products that require careful logistical planning due to their high volumes. Truck shipments represent a middle ground, balancing cost and timeliness for regional deliveries. Enhanced demand forecasting accuracy, achieved by combining ARIMA with cost-per-day shipment data, enables companies to ship products more efficiently based on anticipated demand fluctuations. During high-demand periods, faster air shipments can be used, while slower, less costly ocean shipments work well during stable or low-demand times.
Without accurate demand forecasting, lifesaving and cost-saving decisions cannot be easily made. ARIMA, although more statistical than ML, can be deployed in conjunction with ML ensemble techniques to adjust pricing at peak-demand times when shipment costs are highest. Thus, pricing, demand forecasting, and shipment mode models operate jointly in AI systems for guiding decision making.
We applied advanced LSTM and GRU models, both types of RNN with multilayered deep learning, for forecasting pharmaceutical demand based on historical data. The LSTM model implemented the gating mechanisms described in Equations (2)–(7), while the GRU model utilized the simplified architecture shown in Equations (8)–(11). The dataset covering monthly item quantities from 2007 to 2016 was split into training and testing sets (80 months training, 20 months testing). ARIMA (order 1,0,1) achieved MAE = 0.0576, RMSE = 0.0758, and R2 = −0.3573 on the held-out period, providing the lowest error but limited explanatory power. LSTM produced higher RMSE (0.1589) than ARIMA yet outperformed GRU (0.1639) and captured nonlinear demand surges more faithfully. Both deep learning models tracked overall trends but struggled with volatility, highlighting areas for improvement and indicating that H1 was only partially supported. Figure 1 indicates observed monthly demand patterns, while Figure 2 displays observed and forecasted demand trends. Figure 3 shows the monthly item quantity by delivery date across training and testing periods. Figure 4 and Figure 5 illustrate the performance of the LSTM and GRU models, demonstrating their ability to capture temporal patterns in pharmaceutical demand on a global scale given fluctuating needs.
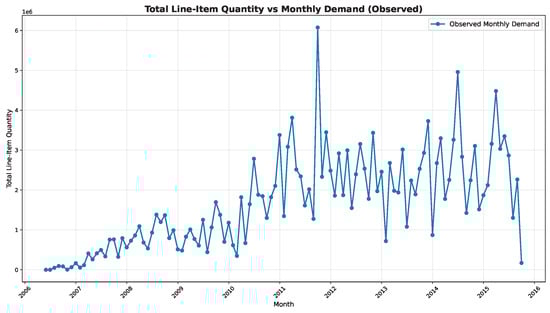
Figure 1.
Total Line-Item Quantity vs. Monthly Demand (Observed).
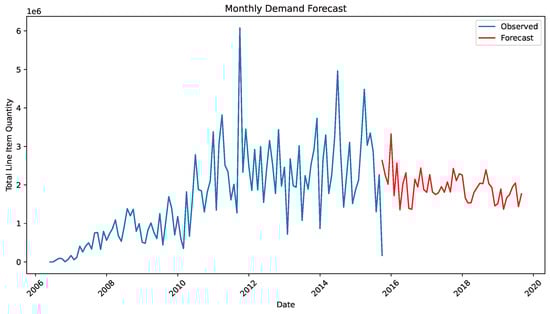
Figure 2.
Total Line-Item Quantity vs. Monthly Demand (Observed and Forecast).
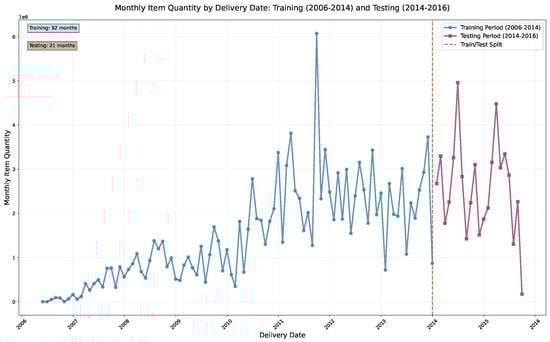
Figure 3.
Monthly Item Quantity by Delivery Date: Training (2006–2014) and Testing (2014–2016).
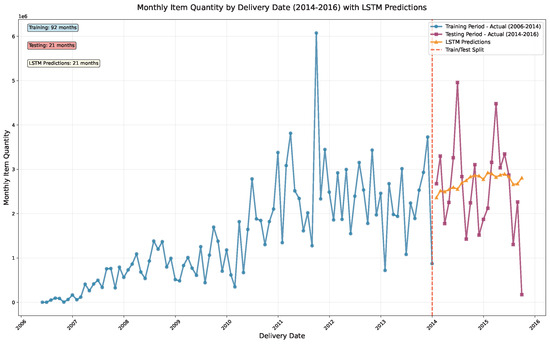
Figure 4.
LSTM Model Predictions vs. Actual Monthly Item Quantity for Pharmaceutical Supply Chain Dataset (Training: 2006–2014, Testing: 2014–2016).
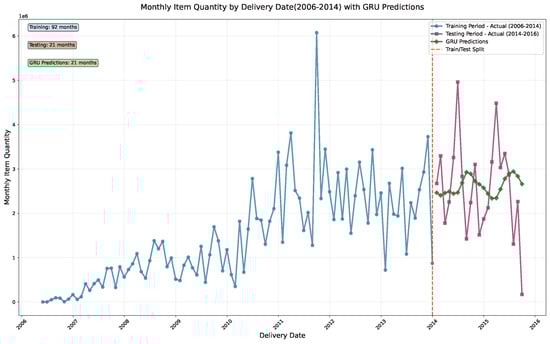
Figure 5.
GRU Model Predictions vs. Actual Monthly Item Quantity for Pharmaceutical Supply Chain Dataset (Training: 2006–2014, Testing: 2014–2016).
4.2.2. Analyzing Delivery Performance and Cost Efficiency Across Shipment Modes and Countries
Delivery times and costs vary markedly across shipment modes, countries, and regions. Air-based options dominate expenditure while shortening delivery windows; ocean freight offers the lowest per-unit cost but requires patience; and truck shipments provide a balanced alternative for regional moves. Country-level analyses reveal clusters where infrastructure gaps and regulatory complexity jointly drive higher expenses and longer delays, underscoring the need for localized playbooks rather than uniform policies. Figure 6, Figure 7 and Figure 8 visualize these contrasts to support targeted decision making.
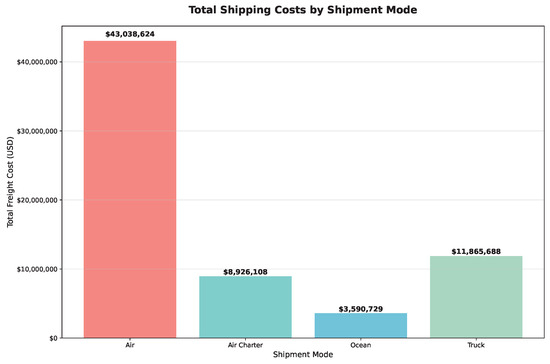
Figure 6.
Total Shipping Costs by Air, Air Charter, Ocean, and Truck Shipment Modes.
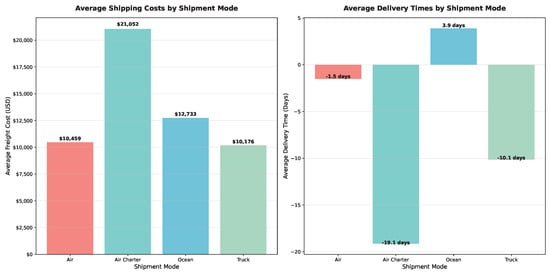
Figure 7.
Average Shipment Costs and Delivery Times by Shipment Mode.
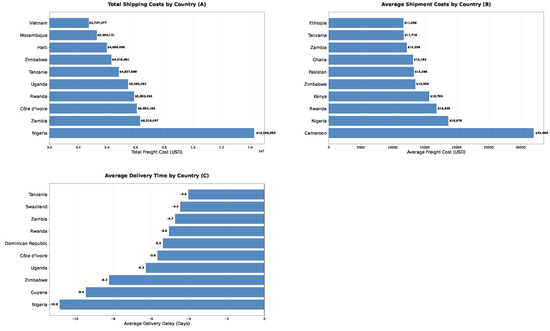
Figure 8.
Total shipment cost by country (A), Average shipment cost per country (B), and Average delivery delay (days) by country (C). Bars display the top 10 countries with more than five shipments.
4.3. Vendor Management
4.3.1. Vendor Delivery Performance Evaluation
We evaluated vendor performance with increasing analytic sophistication by examining vendors based on on-time delivery rates (i.e., whether deliveries were made on or before schedule). Most vendors achieved high on-time delivery rates, approaching 100%, but a few fell below the 95% industry standard, requiring closer monitoring. Vendors with consistent early deliveries or minimal delays contribute to logistical efficiency and optimization, while vendors with frequent delays pose supply chain risks. Prioritizing high-performing vendors and troubleshooting with lower-performing ones can help pharmaceutical companies ensure timely deliveries and minimize patient care disruptions. Identifying high- and low-performing vendors provides the information needed to refine vendor partnerships and improve supply chain efficiency. Figure 9 displays the distribution of on-time delivery rates across vendors, highlighting performance variations in the global pharmaceutical supply chain given often volatile and rapidly changing conditions.
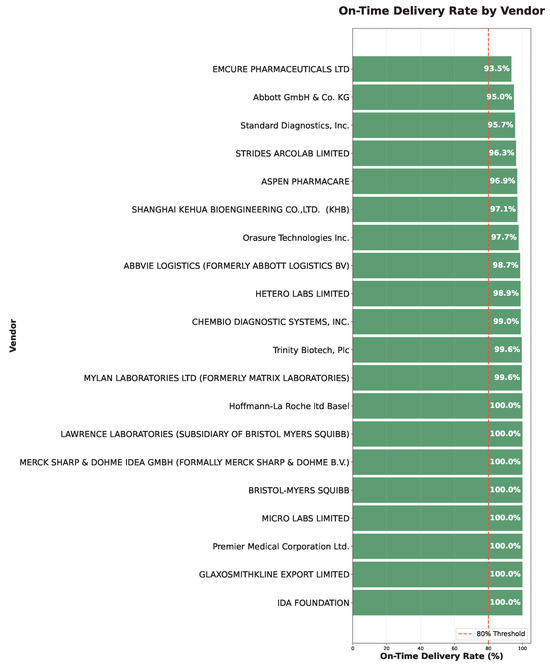
Figure 9.
Vendor On-Time Delivery Performance: Distribution of on-time delivery rates for vendors with more than 10 shipments; red dashed line marks the 80% threshold.
4.3.2. Relationship Between Shipment Status and Delay: Vendor Analysis
As vendor performance is critical to maintaining efficient pharmaceutical supply chains, we defined the Late ratio variable, tracking how often vendors miss delivery dates based on the cumulative impact of binary capture of whether vendors were late on any given shipment. Vendors experiencing most delays, with 20–40% Late ratios, merit further investigation. Conversely, top-performing vendors have near-zero Late ratios. We found a highly significant relationship between Shipment mode (air, ocean, or truck) and Late delivery (), with air and truck modes both prone to delays, emphasizing the need for strategic selection of both vendor and shipment in pharmaceutical logistics. Figure 10 compares best and worst-performing vendors based on late delivery ratios, providing insights into vendor reliability patterns.
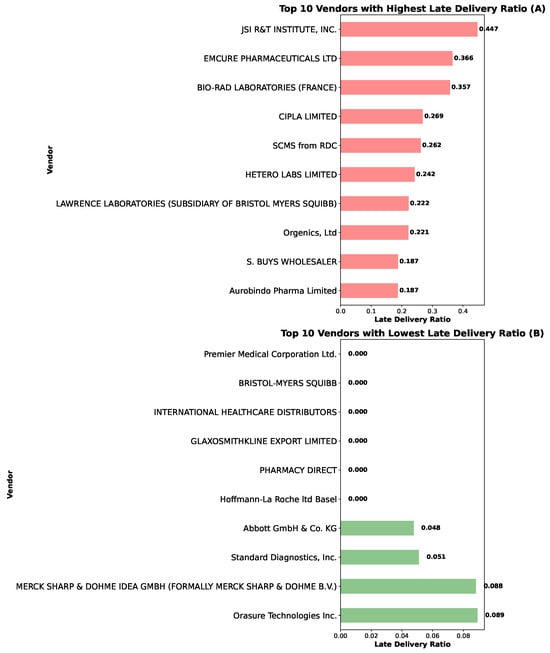
Figure 10.
Best (A) and Worst Vendors (B) by Late Delivery Ratio. Comparison of the 10 worst and best-performing vendors with more than 10 shipments based on late delivery ratios.
4.4. VendorSegmentation Using PCA and K-Means Clustering
To better understand vendor behavior in pharmaceutical logistics, we pursued PCA and K-Means clustering based on vendor delivery performance. PCA reduced the delivery performance variables into two principal components using the variance maximization approach shown in Equation (15) following which we used K-Means clustering to group vendors according to the optimization criterion in Equation (16). The “elbow” inflection visualization revealed that three clusters provided a balance between minimizing within-cluster variance and avoiding overfitting.
The clusters represent varying levels of vendor efficiency and reliability: cluster 1 (dark purple) includes high-performing vendors delivering on time with low costs, cluster 2 (green) comprises vendors often delivering late but offering lower shipment costs, and cluster 3 (yellow) contains vendors with mixed performance where delivery times and costs vary due to potentially knowable external factors. This segmentation supports customized vendor management, allowing pharmaceutical companies to strategically prioritize cluster 1 vendors for urgent shipments and cluster 2 vendors for less time-sensitive, cost-driven deliveries. Validation through silhouette scores, assessing how well data points are grouped by evaluating cohesion within clusters and separation between them, can ensure cluster robustness and provide deeper insights to enhance vendor relationships. Figure 11 demonstrates the elbow method for determining optimal cluster numbers, while Figure 12 visualizes vendor segmentation using PCA components and K-Means clustering.
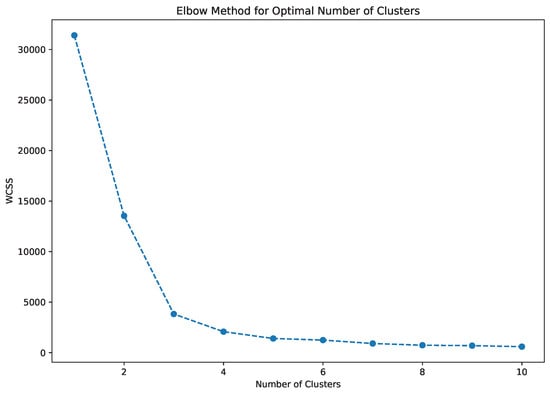
Figure 11.
Elbow Method for Identifying Optimal Number of PCA Components.
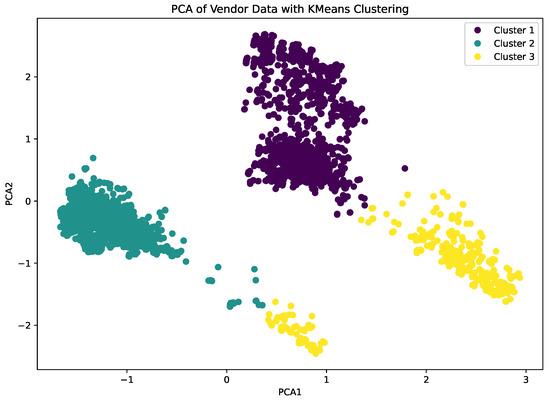
Figure 12.
Analyzing Vendor Data Using K-Means Clustering and PCA Components.
4.5. Logistical Bottlenecks, Maintenance Needs, and Delivery Delays
Maintenance refers to regular upkeep of equipment, vehicles, or infrastructure to ensure smooth logistics operations. For pharmaceutical deliveries, we analyzed the binary dependent variable Maintenance need, indicating if maintenance would be required based on delivery delays, using supervised ML trained on labeled data. We evaluated six ML models—decision tree, random forest, SVM, KNN, Naive Bayes, and neural networks—to predict maintenance need for pharmaceutical deliveries based on independent variables including scheduled delivery date, date delivered, item weight, and item value. Despite high accuracy across most models, precision, recall, and F1-scores were generally low, indicating challenges in correctly identifying maintenance needs. Neural Networks had the best performance (accuracy 89.46%, precision 92.40%, recall 89.46%, F1 90.32%, and AUC score of 96.50%).
Our results highlight a trade-off between accuracy and recall, with most models exhibiting high accuracy but significantly lower recall and F1-scores, indicating poor identification of maintenance needs. This distinction is critical because missing maintenance predictions can lead to costly pharmaceutical shipment delays. We noted discoveries in the areas of data imbalance, resampling strategies,
Our findings clarify the utility of data imbalance analysis. The class imbalance problem in maintenance prediction (typically 90:10 ratio of normal to maintenance-required cases) creates biased models that favor majority class prediction. This explains the high accuracy (0.8946) but low recall (0.7420) observed across models.
In addition, we determined the importance of pursuing resampling strategies by implementing SMOTE (Synthetic Minority Oversampling Technique) with a 5:1 ratio, focal loss for neural networks and stratified sampling. However, more sophisticated approaches, such as cost-sensitive learning, ensemble methods with balanced base learners, and advanced resampling techniques like ADASYN (Adaptive Synthetic Sampling), should be explored in future research to better handle the extreme class imbalances common in pharmaceutical maintenance prediction. By improving recall and F1-scores through these techniques, companies can better anticipate maintenance requirements and minimize risks of delays compromising time-sensitive pharmaceutical product delivery. Figure 13 and Figure 14 analyze the characteristics of pharmaceutical products, presenting total sales value and quantity sold by dosage level and dosage form, which provides insights into product demand patterns and manufacturing requirements.
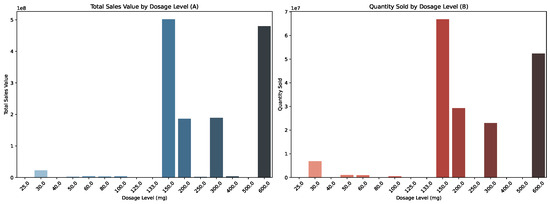
Figure 13.
Total Sales Value (A) and Quantity Sold (B) by Dosage Level (25–600 mg).

Figure 14.
Total Sales Value (A) and Quantity Sold (B) by Dosage Form.
4.6. Managerial Interpretation of Results
Our findings translate into concrete business recommendations for pharmaceutical supply chain management in the areas of pricing prediction, demand forecasting, and vendor segmentation. In regard to pricing prediction, the gradient boosting model’s R2 = 0.7610 represents a 29.4 percentage point improvement over linear regression, explaining 76.1% of price variance. For a pharmaceutical company with $50 million annual supply chain costs, this translates to an average prediction error of $11.83 per $100 product (compared to $17.67 for linear regression), representing a 33% reduction in prediction error that can save companies $2.3–5.7 million annually. Our quantitative findings demonstrate clear performance hierarchies across different ML approaches, with statistical significance (p < 0.001) across all comparisons, leading into further specific managerial guidance and emergent best practices.
In demand forecasting, ARIMA achieved the lowest RMSE (0.0758) on the evaluation horizon, outperforming LSTM (RMSE = 0.1589) in terms of error magnitude. However, ARIMA’s negative (−0.3573) indicates poor explanatory power and limited ability to capture nonlinear demand patterns. While LSTM’s RMSE is higher, it better captures nonlinear demand surges and provides more reliable predictions for volatile demand swings. The LSTM RMSE of 0.1589 represents a 15.89% average prediction error, translating to 15,890 units for companies managing 100,000 units monthly. In financial terms, accurate demand forecasting can prevent stockouts (avoiding $50,000–100,000 per incident in emergency procurement) and reduce excess inventory holding costs (saving $200,000–500,000 annually for mid-size distributors). Consequently, for demand forecasting, pharmaceutical companies should benchmark ARIMA alongside LSTM networks. ARIMA achieved the lowest RMSE on the evaluation horizon, while LSTM offered the most reliable deep learning alternative for capturing nonlinear shocks. Implementation should include 80–20 train-test splits with walk-forward validation to ensure temporal robustness.
Moving on to vendor segmentation, the PCA-K-Means clustering identifies three distinct vendor performance clusters enabling strategic supply chain optimization. High-performing vendors (Cluster 1) should be prioritized for urgent shipments, while cost-effective vendors (Cluster 2) are suitable for non-urgent, high-volume deliveries, potentially reducing overall logistics costs by 15–25% through optimized vendor selection. For vendor management, the three-cluster vendor segmentation (high-performing, cost-effective, mixed-performance) enables strategic vendor selection. High-performing vendors (Cluster 1) should be prioritized for urgent shipments, while cost-effective vendors (Cluster 2) are suitable for non-urgent, high-volume deliveries.
For pricing optimization, gradient boosting should be the primary choice for pricing models, achieving 5.2% higher R2 than random forests. Companies should implement ensemble methods with hyperparameter tuning (learning rate: 0.1, max depth: 5, n_estimators: 200) for optimal performance.
For shipment mode selection, air shipments remain the premium option for urgent medications, whereas ocean freight suits bulk, non-urgent consignments; truck-based routes balance cost and speed for regional replenishment. Companies should align shipment mode with product criticality, lead-time tolerance, and regional logistics constraints.
For maintenance prediction, neural networks showed the best performance (accuracy 89.46%, precision 92.40%, recall 89.46%, F1 90.32% and AUC score of 96.50%). Companies should implement neural networks with proper class balancing techniques for maintenance prediction accuracy.
5. Contributions, Limitations and Future Directions
AI and ML integration into the pharmaceutical sector has transformed operational efficiency and improved decision-making processes. By integrating demand forecasting with cost-per-day shipment analysis, pharmaceutical companies can better manage inventory levels and choose cost-effective shipping methods, ensuring on-time arrival of critical medicines while reducing logistical costs by an estimated 15–25%. These primary contributions help to ensure global pharmaceutical supply chain resilience and responsiveness even amid high-demand and crisis times.
We highlight the critical importance of detecting and correcting failures to address inefficiencies, reduce risks, and promote sustainable growth. Failure serves as a catalyst for social learning and adaptation in pharmaceutical supply chains. Both algorithmic and cognitive mechanisms are essential for learning and evolution in AI-enhanced systems. Strategic leadership increasingly involves collaborative dynamics between humans and AI systems. Our study contributes to understanding failure as a multifaceted pathway to more robust outcomes by examining AI and ML failures rooted in data biases, model flaws, and deployment factors.
Our study nevertheless faces several limitations in multiple domains, ranging from data constraints to product scope, class imbalance, volatility, geography, computational requirements. Our dataset covers 2007–2016, missing recent market dynamics and COVID-19 impacts as part of data constraints. Our analysis focuses specifically on antiretroviral drugs and HIV test kits, which may not generalize to other pharmaceutical products with different storage requirements, regulatory constraints, or demand patterns. Maintenance prediction models show high accuracy (0.8946) but low recall (0.7420) due to imbalanced datasets, limiting practical applicability. Both LSTM and GRU models struggle with demand volatility, indicating the need for hybrid approaches. Our focus on emerging market countries may not reflect supply chain dynamics in developed markets with different infrastructure and regulatory environments. By addressing antiretroviral drugs and HIV test kits in emerging market countries, we have not fully captured the global spectrum of pharmaceutical manufacturing and logistics operations. Also, neural network models, while showing superior performance, require significant computational resources and may not be feasible for all pharmaceutical companies, particularly smaller organizations with more limited resources and technological capabilities. Future research should focus on real-time model adaptation, the integration of environmental and business external factors such as weather and regulatory changes, and the development of explainable AI frameworks for regulatory compliance. Additionally, exploration of quantum computing applications and blockchain integration for enhanced traceability presents promising avenues for advancing pharmaceutical logistics optimization.
Our research focus has not yet encompassed insights into production processes, regulatory complexities, and supply chain dynamics for other pharmaceutical products. The diversity of product types, dosage forms, and storage requirements of other products can influence logistics and costs. Future research should expand generalizability to industries with different product lifecycles, regulatory environments, distribution networks, in a broader time range, and in both advanced and emerging economic contexts.
Mitigating AI predictive failures is crucial for strengthening strategic decision-making in critical sectors, such as pharmaceuticals, where errors can result in significant financial and human consequences. The future of AI trends towards reducing predictive risks through advancements in model accuracy, interpretability, and adaptability. Increased data quality and enhanced human-AI collaboration have aided these improvements. Traditional observational and statistical methods retain value alongside advanced approaches. As AI systems evolve with neural networks, deep learning, and ensemble methods, we can expect continued reductions in predictive failures. However, new data sources, analytic challenges, and situational complexities will continue to emerge to point to new potential options and solutions.
6. Conclusions
Analyzing 1.2 million pharmaceutical shipments in 39 countries, we established actionable benchmarks for deploying AI and ML in logistics operations. Our systematic comparisons reveal that no single algorithm dominates for all tasks: gradient boosting achieves superior pricing prediction accuracy (), ARIMA delivers the lowest demand-forecasting RMSE (0.0758) despite limited explanatory power, LSTM provides the strongest deep learning alternative for capturing nonlinear demand shocks, and neural networks yield optimal maintenance classification performance (Accuracy: 0.8946; AUC: 0.9650). The novel PCA-K-Means vendor segmentation methodology identified three distinct performance clusters, enabling strategic supply chain optimization that can reduce logistics costs by 15–25%. By translating predictive failures into algorithmic improvements, our research has demonstrated how evidence-based model selection can enhance pharmaceutical supply chain adaptability, reduce stockouts, and ultimately safeguard patient access to critical medications in often underserved settings. In sum, our study crucially provides the first empirical benchmark of algorithmic modeling of pharmaceutical logistics in multiple emerging market regions of the world.
Author Contributions
Conceptualization, K.M.P., S.P., E.P. and N.L.; methodology, S.P., K.M.P., T.K. and N.L.; software, S.P., T.K. and A.O.K.; validation, N.L., S.P., K.M.P., E.P. and T.K.; formal analysis, S.P., K.M.P., N.L. and T.K.; investigation, K.M.P., N.L., T.K. and S.P.; resources, K.M.P. and E.P.; data curation, S.P., K.M.P., N.L. and T.K.; writing original draft preparation, K.M.P., N.L., S.P. and A.O.K.; writing review and editing, K.M.P., S.P., T.K. and E.P.; visualization, S.P., N.L., K.M.P., T.K. and A.O.K.; supervision, K.M.P. and E.P.; project administration, K.M.P. and E.P. All authors have read and agreed to the published version of the manuscript.
Funding
This research received no external funding.
Institutional Review Board Statement
Not applicable.
Informed Consent Statement
Not applicable.
Data Availability Statement
The data presented in this study are available on request from the corresponding author.
Acknowledgments
The authors thank the Boston University, Metropolitan College, Department of Administrative Sciences and Department of Computer Science for their research support.
Conflicts of Interest
The authors declare no conflicts of interest.
References
- Moosivand, A.; Ghatari, A.R.; Rasekh, H.R. Supply Chain Challenges in Pharmaceutical Manufacturing Companies: Using Qualitative System Dynamics Methodology. Iran. J. Pharm. Res. 2019, 18, 1103–1116. [Google Scholar] [CrossRef]
- Blanco-Gonzalez, A.; Cabezon, A.; Seco-Gonzalez, A.; Conde-Torres, D.; Antelo-Riveiro, P.; Pineiro, A.; Garcia-Fandino, R. The role of AI in drug discovery: Challenges, opportunities, and strategies. Pharmaceutics 2023, 16, 891. [Google Scholar] [CrossRef] [PubMed]
- Vora, L.K.; Gholap, A.D.; Jetha, K.; Thakur, R.R.S.; Solanki, H.K.; Chavda, V.P. Artificial Intelligence in Pharmaceutical Technology and Drug Delivery Design. Pharmaceutics 2023, 15, 1916. [Google Scholar] [CrossRef] [PubMed]
- Abaku, E.A.; Edunjobi, T.E.; Odimarha, A.C. Theoretical approaches to AI in supply chain optimization: Pathways to efficiency and resilience. Int. J. Sci. Technol. Res. Arch. 2024, 6, 92–107. [Google Scholar] [CrossRef]
- Angula, T.N.; Dongo, A. Assessing the impact of artificial intelligence and machine learning on forecasting medication demand and supply in public pharmaceutical systems: A systematic review. GSC Biol. Pharm. Sci. 2024, 26, 140–150. [Google Scholar] [CrossRef]
- Fernandez del Rio, A.; Leong, M.B.; Saraiva, P.; Nazarov, I.; Rastogi, A.; Hassan, M.; Tang, D.; Perianez, A. Adaptive behavioral AI: Reinforcement learning to enhance pharmacy services. arXiv 2024, arXiv:2408.07647. [Google Scholar] [CrossRef]
- Kumar, A.; Mani, V.; Jain, V.; Gupta, H.; Venkatesh, V.G. Managing healthcare supply chain through artificial intelligence (AI): A study of critical success factors. Comput. Ind. Eng. 2023, 175, 108815. [Google Scholar] [CrossRef]
- Dadhich, A.; Dadhich, P. Artificial intelligence from vaccine development to pharmaceutical supply chain management in post-COVID-19 period. In AI for Supply Chain Management; Taylor & Francis: Boca Raton, FL, USA, 2023; pp. 101–118. [Google Scholar] [CrossRef]
- Desjardins, G.; Gould, A.M.; Park, K. Sizzle without the steak: The emerging strategic implications of receiving a free offering in the digital age. J. Manag. Hist. 2023, 29, 608–633. [Google Scholar] [CrossRef]
- Joshi, V.D.; Baral, S.K.; Pitke, M.; Dwyer, R.J. Artificial Intelligence (AI) for Healthcare: India Retrospective. In Analyzing Current Digital Healthcare Trends Using Social Networks; IGI Global: Hershey, PA, USA, 2024; pp. 26–53. [Google Scholar] [CrossRef]
- Sharma, A.K.; Peelam, M.S.; Chauasia, B.K.; Chamola, V. QIoTChain: Quantum IoT-blockchain fusion for advanced data protection in Industry 4.0. IET Blockchain 2023, 4, 252–262. [Google Scholar] [CrossRef]
- Chanda, S.S.; Banerjee, D.N. Omission and commission errors underlying AI failures. AI Soc. 2024, 39, 937–960. [Google Scholar] [CrossRef]
- Westenberger, J.; Schuler, K.; Schlegel, D. Failure of AI projects: Understanding the critical factors. Procedia Comput. Sci. 2022, 196, 69–76. [Google Scholar] [CrossRef]
- Wong, W.P.; Saw, P.S.; Jomthanachai, S.; Wang, L.S.; Ong, H.F.; Lim, C.P. Digitalization enhancement in the pharmaceutical supply network using a supply chain risk management approach. Sci. Rep. 2023, 13, 22287. [Google Scholar] [CrossRef] [PubMed]
- Yampolskiy, R.V. Artificial Intelligence Safety and Cybersecurity: A Timeline of AI Failures. arXiv 2016, arXiv:1610.07997. [Google Scholar] [CrossRef]
- Ladeira, W.J.; de Oliveira Santini, F.; da Costa, J.R.A.; Ribeiro, L.E.S. Strategic orientation for failure recovery and performance behavior. Mark. Intell. Plan. 2018, 36, 646–660. [Google Scholar] [CrossRef]
- Yampolskiy, R.V. Predicting future AI failures from historic examples. Foresight 2019, 21, 138–152. [Google Scholar] [CrossRef]
- Yadav, D.K.; Kaushik, A.; Yadav, N. Predicting machine failures using machine learning and deep learning algorithms. Sustain. Manuf. Serv. Econ. 2024, 3, 100029. [Google Scholar] [CrossRef]
- Williams, R.; Yampolskiy, R. Understanding and Avoiding AI Failures: A Practical Guide. Philosophies 2021, 6, 53. [Google Scholar] [CrossRef]
- Jiang, T.; Sun, Z.; Fu, S.; Lv, Y. Human-AI interaction research agenda: A user-centered perspective. Data Inf. Manag. 2024, 8, 100078. [Google Scholar] [CrossRef]
- Kolbjornrud, V. Designing the Intelligent Organization: Six Principles for Human-AI Collaboration. Calif. Manag. Rev. 2024, 66, 44–64. [Google Scholar] [CrossRef]
- Alqatan, A.; Simmou, W.; Shehadeh, M.; AlReshaid, F.; Elmarzouky, M.; Shohaieb, D. Strategic Pathways to Corporate Sustainability: The Roles of Transformational Leadership, Knowledge Sharing, and Innovation. Sustainability 2025, 17, 5547. [Google Scholar] [CrossRef]
- Baviskar, K.; Bedse, A.; Raut, S. Artificial intelligence and machine learning-based manufacturing and drug product marketing. In Bioinformatics Tools for Pharmaceutical Drug Product Development; Wiley: Hoboken, NJ, USA, 2023; pp. 215–230. [Google Scholar] [CrossRef]
- Rathipriya, R.; Rahman, A.A.A.; Dhamodharavadhani, S.; Meero, A.; Yoganandan, G. Demand forecasting model for time-series pharmaceutical data using shallow and deep neural network model. Neural Comput. Appl. 2023, 35, 1945–1957. [Google Scholar] [CrossRef] [PubMed]
- Mousa, B.A.; Al-Khateeb, B. Predicting medicine demand using deep learning techniques: A review. J. Intell. Syst. 2023, 32, 20220297. [Google Scholar] [CrossRef]
- Bhabad, S.; Lamkhade, D.; Koyate, S.; Karanjkhele, K.; Kale, V.; Doke, R. Transformative trends: A comprehensive review on role of artificial intelligence in healthcare and pharmaceutical research. IP Int. J. Compr. Adv. Pharmacol. 2023, 8, 210–219. [Google Scholar] [CrossRef]
- Atal, D.K.; Tiwari, V.; Anjali; Berwer, R.K. The intersection of blockchain technology and the quantum era for sustainable medical services. In Quantum and Blockchain-Based Next Generation Sustainable Computing; Springer Nature Switzerland: Cham, Switzerland, 2024; pp. 19–45. [Google Scholar] [CrossRef]
- Bapatla, A.K.; Mohanty, S.P.; Kougianos, E.; Puthal, D.; Bapatla, A. PharmaChain: A blockchain to ensure counterfeit-free pharmaceutical supply chain. IET Netw. 2022, 12, 53–76. Available online: https://ietresearch.onlinelibrary.wiley.com/doi/full/10.1049/ntw2.12041 (accessed on 1 October 2025). [CrossRef]
- Chaubey, P.K.; Yadav, A.S.; Arora, T.K.; Ahlawat, N.; Purohit, P.; Swami, A.; Agarwal, P. Machine learning and deep learning based optimization algorithms for COVID-19 pharmaceutical industry supply chain management. J. Xi’an Shiyou Univ. Nat. Sci. Ed. 2022, 65, 46–65. [Google Scholar] [CrossRef]
- Farooq, M.U.; Hussain, A.; Masood, T.; Habib, M.S. Supply chain operations management in pandemics: A state-of-the-art review inspired by COVID-19. Sustainability 2021, 13, 2504. [Google Scholar] [CrossRef]
- Modgil, S.; Singh, R.K.; Hannibal, C. Artificial intelligence for supply chain resilience: Learning from COVID-19. Int. J. Logist. Manag. 2022, 33, 1246–1268. [Google Scholar] [CrossRef]
- Berretta, S.; Tausch, A.; Ontrup, G.; Gilles, B.; Peifer, C.; Kluge, A. Defining human-AI teaming the human-centered way: A scoping review and network analysis. Front. Artif. Intell. 2023, 6, 1250725. [Google Scholar] [CrossRef]
- Mariappan, M.B.; Devi, K.; Venkataraman, Y.; Lim, M.K.; Theivendren, P. Using AI and ML to predict shipment times of therapeutics, diagnostics and vaccines in e-pharmacy supply chains during COVID-19 pandemic. Int. J. Logist. Manag. 2023, 34, 390–416. [Google Scholar] [CrossRef]
- Diamantini, C.; Khan, T.; Mircoli, A.; Potena, D. Forecasting of key performance indicators based on transformer model. In Proceedings of the 26th International Conference on Enterprise Information Systems (ICEIS 2024), Lisbon, Portugal, 26–28 April 2024; SciTePress: Setúbal, Portugal, 2024; Volume 2, pp. 280–287. [Google Scholar] [CrossRef]
- Cannon, M.D.; Edmondson, A.C. Failing to learn and learning to fail (intelligently): How great organizations put failure to work to innovate and improve. Long Range Plan. 2005, 38, 299–319. [Google Scholar] [CrossRef]
- Starbuck, W.H.; Hedberg, B. How Organizations Learn from Success and Failure. In Organizational Learning and Knowledge; Dierkes, M., Berthoin Antal, A., Child, J., Nonaka, I., Eds.; Oxford University Press: Oxford, UK, 2001; pp. 327–350. [Google Scholar] [CrossRef]
- Schaedler, L.; Graf-Vlachy, L.; König, A. Strategic leadership in organizational crises: A review and research agenda. Long Range Plan. 2022, 55, 102156. [Google Scholar] [CrossRef]
- Burnes, B.; Jackson, P. Success and failure in organizational change: An exploration of the role of values. J. Chang. Manag. 2011, 11, 133–162. [Google Scholar] [CrossRef]
- Schwarz, G.M.; Bouckenooghe, D. Repositioning Organizational Failure Through Active Acceptance. Organ. Theory 2021, 2, 1–24. [Google Scholar] [CrossRef]
- Choudhury, P.; Starr, E.; Agarwal, R. Machine learning and human capital complementarities: Experimental evidence on bias mitigation. Strateg. Manag. J. 2020, 41, 1381–1411. [Google Scholar] [CrossRef]
- Luo, X.; Jia, N.; Ouyang, E.; Fang, Z. Introducing machine-learning-based data fusion methods for analyzing multimodal data: An application of measuring trustworthiness of microenterprises. Strateg. Manag. J. 2024, 45, 1597–1629. [Google Scholar] [CrossRef]
- Krakowski, S.; Luger, J.; Raisch, S. Artificial intelligence and the changing sources of competitive advantage. Strateg. Manag. J. 2023, 44, 1425–1452. [Google Scholar] [CrossRef]
- Detwal, P.K.; Soni, G.; Jakhar, S.K.; Srivastava, D.K.; Madaan, J.; Kayikci, Y. Machine learning-based technique for predicting vendor Incoterm in global omnichannel pharmaceutical supply chain. J. Bus. Res. 2023, 144, 392–406. [Google Scholar] [CrossRef]
- Gupta, A.K.; Awatade, G.V.; Padole, S.S. Digital supply chain management using AI, ML, and blockchain. In Supply Chain Management via Blockchain; Springer: Singapore, 2022; pp. 1–18. [Google Scholar] [CrossRef]
- El Emary, I.M. Handbook of research on artificial intelligence and soft computing techniques in personalized healthcare services. In Proceedings of the International Conference on E-Commerce and Internet Technology (ECIT), Zhangjiajie, China, 22–24 April 2020; Taylor & Francis: London, UK, 2020; pp. 245–247. [Google Scholar] [CrossRef]
- Tripathi, A.; Misra, K.; Dhanuka, R.; Singh, J.P. Artificial intelligence in accelerating drug discovery and development. Recent Pat. Biotechnol. 2023, 17, 9–23. [Google Scholar] [CrossRef]
- Gangwal, A.; Lavecchia, A. Unlocking the potential of generative AI in drug discovery. Drug Discov. Today 2024, 29, 103992. [Google Scholar] [CrossRef]
- Han, R.; Yoon, H.; Kim, G.; Lee, H.; Lee, Y. Revolutionizing medicinal chemistry: The application of artificial intelligence (AI) in early drug discovery. Pharmaceuticals 2023, 16, 1259. [Google Scholar] [CrossRef]
- Ala, A.; Goli, A.; Mirjalili, S.; Simic, V. A fuzzy multi-objective optimization model for sustainable healthcare supply chain network design. Appl. Soft Comput. 2024, 150, 111012. [Google Scholar] [CrossRef]
- Hamdi, F.; Ghorbel, A.; Masmoudi, F.; Dupont, L. Optimization of a supply portfolio in the context of supply chain risk management: Literature review. J. Intell. Manuf. 2018, 29, 763–788. [Google Scholar] [CrossRef]
- Long, P.; Lu, L.; Chen, Q.; Chen, Y.; Li, C.; Luo, X. Intelligent selection of healthcare supply chain mode: An applied research based on artificial intelligence. Front. Public Health 2023, 11, 1310016. [Google Scholar] [CrossRef] [PubMed]
- Thethi, S.K. Machine learning models for cost-effective healthcare delivery systems: A global perspective. In Digital Transformation in Healthcare 5.0: Volume 1: IoT, AI and Digital Twin; De Gruyter: Berlin, Germany, 2024; p. 199. [Google Scholar] [CrossRef]
- Farchi, F.; Farchi, C.; Touzi, B. A comparative study on AI-based algorithms for cost prediction in pharmaceutical transport logistics. Acadlore Trans. Artif. Intell. Mach. Learn. 2023, 2, 129–141. Available online: https://library.acadlore.com/ATAIML/2023/2/3/ATAIML_02.03_02.pdf (accessed on 1 October 2025). [CrossRef]
- Farchi, F.; Touzi, B.; Farchi, C.; Mabrouki, C. Machine learning prediction model: A case study of urban transport of medical and pharmaceutical products. Rev. Intelligence Artif. 2024, 38, 147. [Google Scholar] [CrossRef]
- Gomasta, S.S.; Dhali, A.; Tahlil, T.; Anwar, M.M.; Ali, A.B.M.S. PharmaChain: Blockchain-based drug supply chain provenance verification system. Heliyon 2023, 9, e17957. [Google Scholar] [CrossRef]
- Farouk, A.; Alahmadi, A.; Ghose, S.; Mashatan, A. Blockchain platform for industrial healthcare: Vision and future opportunities. Comput. Commun. 2020, 154, 223–235. [Google Scholar] [CrossRef]
- Aljohani, A. Predictive analytics and machine learning for real-time supply chain risk mitigation and agility. Sustainability 2023, 15, 15088. [Google Scholar] [CrossRef]
- Dahrouj, H.; Alghamdi, R.; Alwazani, H.; Bahanshal, S.; Ahmad, A.A.; Faisal, A.; Shamma, J.S.; Alhadrami, R.; Subasi, A.; Al-Nory, M.T.; et al. An overview of machine learning-based techniques for solving optimization problems in communications and signal processing. IEEE Access 2021, 9, 74908–74938. [Google Scholar] [CrossRef]
- Zhu, X.; Ninh, A.; Zhao, H.; Liu, Z. Demand forecasting with supply-chain information and machine learning: Evidence in the pharmaceutical industry. Prod. Oper. Manag. 2021, 30, 3231–3252. [Google Scholar] [CrossRef]
- Liotine, M. Shaping the next generation pharmaceutical supply chain control tower with autonomous intelligence. J. Auton. Intell. 2019, 2, 56–71. [Google Scholar] [CrossRef]
- Abubakar, A.I.; Omeke, K.G.; Ozturk, M.; Hussain, S.; Imran, M.A. The role of artificial intelligence driven 5G networks in COVID-19 outbreak: Opportunities, challenges, and future outlook. Front. Commun. Netw. 2020, 1, 575065. [Google Scholar] [CrossRef]
- Javaid, M.; Haleem, A.; Singh, R.P.; Suman, R. 5G technology for healthcare: Features, serviceable pillars, and applications. Intell. Pharm. 2023, 1, 2–10. [Google Scholar] [CrossRef]
- Wu, G.; de Carvalho Servia, M.A.; Mowbray, M. Distributional reinforcement learning for inventory management in multi-echelon supply chains. Digit. Chem. Eng. 2023, 6, 100073. [Google Scholar] [CrossRef]
- Cannas, V.G.; Ciano, M.P.; Saltalamacchia, M.; Secchi, R. Artificial intelligence in supply chain and operations management: A multiple case study research. Int. J. Prod. Res. 2023, 62, 3333–3360. [Google Scholar] [CrossRef]
- Kemmer, L.; von Kleist, H.; de Rochebouët, D.; Tziortziotis, N.; Read, J. Reinforcement learning for supply chain optimization. In Proceedings of the European Workshop on Reinforcement Learning 14, Lille, France, 1–3 October 2018; Available online: https://ewrl.wordpress.com/wp-content/uploads/2018/09/ewrl_14_2018_paper_44.pdf (accessed on 1 October 2025).
- Grewatsch, S.; Kennedy, S.; Bansal, P. Tackling wicked problems in strategic management with systems thinking. Strateg. Organ. 2023, 21, 721–732. [Google Scholar] [CrossRef]
- Doby, L. Supply Chain Shipment Pricing Dataset; USAID US Agency for International Development Data Library: Washington, DC, USA, 2023. Available online: https://www.kaggle.com/datasets/divyeshardeshana/supply-chain-shipment-pricing-data (accessed on 1 October 2025).
- Global Fund. Global Fund Price and Quality Reporting; Global Fund: Geneva, Switzerland, 2023; Publicly Available Dataset; Available online: https://www.theglobalfund.org/en/sourcing-management/price-quality-reporting/ (accessed on 1 October 2025).
- Cornelius, K. Contextualizing Transformation of Healthcare Sector in Asia-Pacific in the Post-COVID-19 Era. 2022. Available online: https://hdl.handle.net/20.500.12870/4218 (accessed on 1 October 2025).
- Renaud, J.; Couturier, R.; Guyeux, C.; Courjal, B.; Giot, C. A Comparative Study of Predictive Models for Pharmaceutical Sales Data. In Proceedings of the 2022 2nd International Conference on Computer, Control and Robotics (ICCCR), Shanghai, China, 18–20 March 2022; IEEE: New York, NY, USA; pp. 191–195. [Google Scholar] [CrossRef]
- Meenakshi; Sharma, P. AI-Enabled Techniques for Intelligent Transportation System for Smarter Use of the Transport Network for Healthcare Services. In Blockchain and Deep Learning for Smart Healthcare; Wiley: Hoboken, NJ, USA, 2023; pp. 205–233. [Google Scholar] [CrossRef]
- Kavididevi, V.; Monikapreethi, S.K.; Rajapriya, M.; Juliet, P.S.; Yuvaraj, S.; Muthulekshmi, M. IoT-Enabled Reinforcement Learning for Enhanced Cold Chain Logistics Performance in Refrigerated Transport. In Proceedings of the 2024 2nd International Conference on Sustainable Computing and Smart Systems (ICSCSS), Chennai, India, 4–6 January 2024; IEEE: New York, NY, USA; pp. 379–384. [Google Scholar] [CrossRef]
- Mishra, T.; Singh, S.; Hazela, B.; Srivastava, G. Potentials of Internet of Medical Things: Fundamentals and Challenges. In Federated Learning for Internet of Medical Things; CRC Press: Boca Raton, FL, USA, 2023; pp. 1–21. [Google Scholar] [CrossRef]
- Naz, F.; Kumar, A.; Majumdar, A.; Agrawal, R. Is artificial intelligence an enabler of supply chain resiliency post COVID-19? An exploratory state-of-the-art review for future research. Oper. Manag. Res. 2022, 15, 378–398. [Google Scholar] [CrossRef]
- Park, K.M.; Liew, N.; Pattnaik, S.; Kures, A.O.; Pinsky, E. Exploring the Transition to Low-Carbon Energy: A Comparative Analysis of Population, Economic Growth, and Energy Consumption in Oil-Producing OECD and BRICS Nations. Sustainability 2025, 17, 6221. [Google Scholar] [CrossRef]


Disclaimer/Publisher’s Note: The statements, opinions and data contained in all publications are solely those of the individual author(s) and contributor(s) and not of MDPI and/or the editor(s). MDPI and/or the editor(s) disclaim responsibility for any injury to people or property resulting from any ideas, methods, instructions or products referred to in the content. |
© 2025 by the authors. Licensee MDPI, Basel, Switzerland. This article is an open access article distributed under the terms and conditions of the Creative Commons Attribution (CC BY) license (https://creativecommons.org/licenses/by/4.0/).