Article

Research on Dynamic Hyperparameter Optimization Algorithm for University Financial Risk Early Warning Based on Multi-Objective Bayesian Optimization

by
Yu Chao
*,
Nur Fazidah Elias
,
Yazrina Yahya
and
Ruzzakiah Jenal
Center for Software Technology and Management, Faculty of Information Science and Technology, Universiti Kebangsaan Malaysia (UKM), Bangi 43600, Malaysia
*
Author to whom correspondence should be addressed.
Forecasting 2025, 7(4), 61; https://doi.org/10.3390/forecast7040061
Submission received: 7 August 2025 / Revised: 14 October 2025 / Accepted: 17 October 2025 / Published: 22 October 2025

Abstract

Financial sustainability in higher education is increasingly fragile due to policy shifts, rising costs, and funding volatility. Legacy early-warning systems based on static thresholds or rules struggle to adapt to these dynamics and often overlook fairness and interpretability—two essentials in public-sector governance. We propose a university financial risk early-warning framework that couples a causal-attention Transformer with Multi-Objective Bayesian Optimization (MBO). The optimizer searches a constrained Pareto frontier to jointly improve predictive accuracy (AUC↑), fairness (demographic parity gap, DP_Gap↓), and computational efficiency (time↓). A sparse kernel surrogate (SKO) accelerates convergence in high-dimensional tuning; a dual-head output (risk probability and health score) and SHAP-based attribution enhance transparency and regulatory alignment. On multi-year, multi-institution data, the approach surpasses mainstream baselines in AUC, reduces DP_Gap, and yields expert-consistent explanations. Methodologically, the design aligns with LLM-style time-series forecasting by exploiting causal masking and long-range dependencies while providing governance-oriented explainability. The framework delivers earlier, data-driven signals of financial stress, supporting proactive resource allocation, funding restructuring, and long-term planning in higher education finance.

1. Introduction

In recent years, the financial landscape of higher education institutions (HEIs) has changed substantially, shaped by stricter fiscal policies, fluctuating subsidies, and rising operational costs [1]. These shifts have increased the financial vulnerability of universities [2]. As a result, timely identification and forecasting of potential financial risks are now essential to maintain institutional stability and support evidence-based decision-making [3].
Traditional early warning systems mainly depend on rule-based or static threshold models that cannot adapt to the dynamic and diverse nature of university operations [4]. Moreover, such models often ignore fairness and interpretability—two core principles in public-sector governance and accountability [5].
Recent progress in machine learning and deep neural architectures has considerably improved predictive accuracy in financial risk assessment [6]. However, key challenges remain. First, hyperparameter tuning in complex models is usually manual, inefficient, and prone to convergence at local optima [7]. Second, most existing models optimize for a single metric (e.g., accuracy) without addressing fairness or interpretability—both of which are critical in public financial management, where transparency and equity are required [8].
Meanwhile, advances in Transformer-based architectures and large language models (LLMs) have reshaped time-series forecasting by enabling long-range dependency modeling and causal attention mechanisms. These advances have inspired a new generation of financial forecasting systems that combine deep temporal reasoning with interpretability and governance alignment. Building on this paradigm, the present study extends these methodological innovations to the higher education finance domain by developing a fairness-aware and dynamically optimized early warning framework.
Specifically, we propose a dynamic hyperparameter optimization algorithm based on Multi-Objective Bayesian Optimization (MBO) to balance predictive accuracy, fairness, and computational efficiency. The framework integrates a causal-attention Transformer backbone with a Sparse Kernel Optimization (SKO) surrogate model to improve stability during high-dimensional parameter search. By aligning its design with LLM-style time-series forecasting principles—such as causal masking, multi-head attention, and hierarchical interpretability—the framework combines technical rigor with policy relevance. The resulting risk prediction model adapts to structural shifts in university finance while maintaining regulatory transparency and governance compliance [9].
The main contributions of this study are summarized as follows:
  • Development of a dynamic early warning model that integrates fairness-aware learning with predictive modeling for university financial risks.
  • Design of a Multi-Objective Bayesian Optimization framework that automatically searches for hyperparameters, balancing accuracy, fairness, and efficiency.
  • Comprehensive experiments, including ablation studies and benchmark comparisons, conducted on real-world financial datasets to demonstrate superior performance and fairness.
  • Introduction of SHAP-based interpretability analysis to reveal how financial indicators drive risk predictions, assisting decision-makers in understanding model behavior.
  • Implementation of a dual-head output mechanism that provides both risk probabilities and financial health scores, offering multi-perspective insights for leadership to guide resource allocation and long-term financial planning.
The remainder of this paper is organized as follows: Section 2 reviews related work, Section 3 describes the proposed methodology, Section 4 presents the experimental results and performance evaluation, and Section 5 concludes the study with directions for future research.

2. Related Work

To situate our contribution within the broader discourse on higher education financial governance and risk analytics, this section is organized around four themes aligned with the aims of the paper: (i) early warning models for HEIs, (ii) predictive accuracy for multivariate and temporal risk signals, (iii) hyperparameter optimization and multi-objective learning, and (iv) fairness and interpretability in high-stakes modeling. Across these themes, we highlight foundational studies, discuss recent advances, and identify the remaining gaps that motivate our framework, which jointly optimizes accuracy, fairness (DP_Gap), and computational efficiency while preserving interpretability.

2.1. Financial Risk Warning Models in Higher Education

Early Financial Risk Early Warning Systems (FREWSs) in education employ interpretable statistical models such as logistic regression and decision trees that rely on static indicators and fixed thresholds [10,11,12,13]. Past studies established foundational practices for financial diagnostics but assumed stable policy environments and stationary data-generating processes [10].
Recent advances and limitations: Later studies adopted machine learning (ML) classifiers—including SVM, RF, and neural networks—to capture nonlinear relationships among financial variables [14,15,16,17]. However, most models were manually tuned and optimized for a single goal (typically accuracy), offering limited consideration of sectoral constraints and governance demands such as fairness or transparency [18,19].
Implications for this study: These strands justify a transition from static, single-objective frameworks to adaptive, governance-aligned models that remain interpretable and auditable in HEI contexts. Our framework directly addresses this need by embedding fairness-aware objectives and interpretability into the core modeling and evaluation pipeline.

2.2. Predictive Accuracy in Risk Modeling

Classical predictors such as LR and LDA emphasize simplicity and interpretability but cannot capture nonlinear or temporal risk formation [20,21].
Recent advances and limitations: Modern ML algorithms (RF, SVM, and XGBoost) and deep architectures (LSTM, CNN, and CNN–LSTM hybrids) improve predictive metrics such as AUC and F1-score by leveraging temporal dependencies in multivariate financial data [22,23]. Ensemble and fusion methods further enhance robustness, yet most approaches still optimize accuracy in isolation and provide limited guidance on the joint management of predictive performance, operational cost, and policy compliance.
Implications for this study: We retain the accuracy gains of attention-based temporal models while simultaneously optimizing fairness and efficiency. This design reflects the priorities of HEI financial governance, where incremental improvements in accuracy should not compromise equity or deployability.

2.3. Hyperparameter Optimization and Multi-Objective Learning

Hyperparameter optimization has evolved from exhaustive grid and random search toward Bayesian Optimization (BO) with probabilistic surrogate models [24,25]. Tree-structured Parzen Estimators (TPEs) and Gaussian Process (GP)-based methods are now integral to AutoML frameworks for efficient exploration and global search [26,27,28]. Concurrently, multi-objective optimization (MOO) supports balancing multiple goals—such as accuracy, computational cost, and fairness—through Pareto-efficient trade-offs [29,30,31]. Recent Transformer and large language model (LLM) architectures have further influenced this field by introducing hierarchical attention and dynamic parameter sharing, which implicitly enable learned hyperparameter adaptation during optimization. These mechanisms inspire more autonomous and interpretable optimization strategies relevant to time-series forecasting and financial governance.
Recent advances and limitations: In financial applications, MOO has been extensively explored in banking and credit scoring [32], yet fairness-aware hyperparameter tuning in public-sector risk contexts—such as education finance—remains underexplored [33]. Moreover, most Bayesian Optimization pipelines remain single-objective and rarely embed fairness or interpretability constraints within the search process. This gap limits auditability and governance readiness, particularly in policy-sensitive risk forecasting where transparency is essential.
Implications for this study: Building on these insights, we employ a Multi-Objective Bayesian Optimization (MBO) framework that (i) treats fairness (DP_Gap) as a primary optimization objective rather than a post-hoc adjustment, and (ii) integrates architectural constraints to ensure model stability and computational efficiency. Conceptually, this approach bridges recent developments in LLM-inspired optimization—such as attention-guided parameter selection and adaptive learning dynamics—with the compliance needs of higher education financial governance. It thus narrows the methodological gap between contemporary AutoML research and real-world policy accountability in university risk assessment.
In addition, the optimization trade-offs among accuracy, fairness, and efficiency in public financial governance resemble multi-agent decision settings studied in e-commerce markets. Li et al. [34] examine information sharing among competitive sellers in an online marketplace and find that full information sharing is preferred only when competition intensity is low and demand variability is moderate. This insight parallels the design of our Multi-Objective Bayesian Optimization framework, which balances competing objectives under information asymmetry among universities and regulatory bodies to achieve adaptive yet equitable financial risk prediction.

2.4. Fairness and Interpretability in Risk Models

An expanding body of literature has formalized algorithmic fairness—such as demographic parity, equal opportunity, and disparate impact—and documented group-level risks in high-stakes domains [35,36,37,38,39]. In parallel, post-hoc explanation methods (e.g., SHAP and LIME) have become standard for interpreting model predictions and auditing algorithmic behavior [40,41,42].
Recent advances and limitations: Despite progress, applications in HEI finance remain sparse. Many studies measure fairness ex post and separate explanation from model selection, leading to models that achieve high accuracy but fail equity tests or produce explanations misaligned with domain expertise.
Implications for this study: We integrate fairness directly into the optimization objective (DP_Gap) and pair final model selection with SHAP-based interpretation. This ensures that top-performing configurations are auditable and consistent with expert reasoning—an essential condition for accountable deployment in university governance.

2.5. Synthesis and Research Gap

The reviewed literature suggests that (i) HEI-focused models must evolve beyond static thresholds toward adaptive, temporal architectures; (ii) accuracy improvements should be co-optimized with fairness and computational efficiency to ensure deployability in governance settings; and (iii) interpretability must be embedded into model selection rather than applied post hoc. This paper addresses these gaps by proposing a causal-attention Transformer trained under a Multi-Objective Bayesian Optimization scheme that jointly optimizes AUC, DP_Gap, and efficiency. SHAP-based interpretability further aligns model explanations with expert understanding. This design operationalizes a governance-ready pipeline for university financial risk early warning, directly addressing the limitations identified in prior work.

3. Research Methodology

This section presents the methodological framework used to develop a fair, accurate, and interpretable financial risk early warning system for higher education institutions (HEIs). The section begins with the problem formulation, followed by a description of data sources and feature engineering. A dynamic hyperparameter optimization method based on Sparse Kernel Optimization (SKO) is then introduced to enhance computational efficiency within a Multi-Objective Bayesian Optimization (MBO) scheme. The proposed model architecture integrates a causal spatio-temporal attention mechanism to capture complex financial dynamics over time. Finally, a multi-dimensional evaluation strategy is described, focusing on accuracy, fairness, and interpretability.

3.1. Problem Formulation

The input to the model is a financial time series for the i-th university over T consecutive years, denoted as X i R T × 17 , where each row represents 17 key financial indicators (e.g., asset–liability ratio, tuition income ratio, and research funding) [43]. The indicator system is constructed following official financial reporting templates issued by the Ministry of Education and refined through standard feature selection procedures.
This study employs a multi-objective strategy to optimize performance across three dimensions:
  • Accuracy: maximize the Area Under the Curve (AUC) to reflect the ability to distinguish at-risk from no-risk institutions [44].
  • Efficiency: minimize training and inference time to satisfy real-time early warning requirements [45].
  • Fairness: minimize DP_Gap (also referred to as Group AUC Gap, Δ AUC), which measures the performance disparity between public and private universities [46].

3.2. Data Processing

3.2.1. Data Sources

We construct a cross-domain dataset by combining public educational statistics from the National Bureau of Statistics with audited university financial reports from the Ministry of Education. Macro-level indicators (e.g., education investment, enrollment, faculty size) are integrated with university-level financial variables to mitigate sample sparsity and capture cross-institutional dynamics [47,48]. Universities are classified as public or private according to the Ministry of Education’s governance taxonomy, ensuring consistency and replicability in subgroup analysis. As shown in Table 1, the final set of 17 indicators defines the model’s input feature space, providing clarity and reproducibility in dataset construction.

3.2.2. Correlation Analysis of Macro-Level Indicators

We examine associations between macro variables and financial distress (binary). Due to skewness and potential nonlinearity, Spearman’s ρ is primary; Pearson’s r is reported for robustness.
The significant negative correlations in Table 2 confirm the theoretical relevance of macro-level indicators, supporting their inclusion in the feature set for early warning tasks.

3.2.3. Feature Engineering

We design a three-stage pipeline: volatility entropy, normalization, and missing-value imputation [49].
(i)
Sliding-Window Volatility Entropy
For indicator series { x t } , the W-year window entropy at year [50t is
H ( W ) ( x t ) = i = 1 n p i , t ( W ) log p i , t ( W ) ,
where p i , t ( W ) is the empirical probability of the i-th discretized bin within the window [ t W + 1 , t ] . To mitigate sensitivity to discretization, we validate with Sturges and Freedman–Diaconis rules and observe consistent patterns.
(ii)
Soft Tanh Normalization [51]
SoftTanh ( x ) = 2 1 + e 2 x 1 ,
which compresses extremes while preserving mid-range order. Results are robust versus Min–Max and Z-Score baselines.
(iii)
Attention-Aware Imputation
Let importance ( f ) be attention-derived feature importance. If importance ( f ) > τ , we apply attention-based imputation; otherwise, we apply mean imputation:
X ^ = 1 n i = 1 n X i .
As summarized in Table 3, the feature engineering pipeline combines three key components: volatility-aware entropy filtering, Soft-Tanh-based normalization, and dynamic data imputation. The threshold parameter τ is tuned on the validation set (typically τ [ 0.2 , 0.5 ] ) to ensure that features with higher predictive importance are reconstructed using attention-derived weights, thereby retaining fine-grained financial information. Conversely, features with lower importance are imputed with group means to prevent the amplification of noise. Equation (3) formalizes this balance between fidelity and robustness within the feature reconstruction process.

3.3. Dynamic Hyperparameter Optimization

3.3.1. Multi-Objective Bayesian Optimization Framework

To improve computational efficiency in high-dimensional Multi-Objective Bayesian Optimization (MBO), we employ Sparse Kernel Optimization (SKO) as the surrogate model within the MBO pipeline [52,53]. Gaussian Processes (GPs) are known for their accuracy in low-dimensional problems; however, their cubic computational complexity ( 𝒪 ( n 3 ) ) makes them unsuitable for financial datasets that involve numerous hyperparameters and long temporal sequences. The SKO approach mitigates this limitation by introducing low-rank sparse approximations through a set of inducing points Z, thereby constructing an efficient surrogate kernel that preserves model fidelity while reducing computational cost.
k ( x , x ) = k ( x , Z ) k ( Z , Z ) 1 k ( Z , x ) ,
which preserves expressiveness while substantially reducing computation.
Our vector-valued objective is
min θ Θ f ( θ ) = AUC ( θ ) , Time ( θ ) , DP _ Gap ( θ ) ,
subject to the architectural feasibility constraint
d model mod n heads = 0 ,
where d model is the embedding dimension and n heads is the number of attention heads.
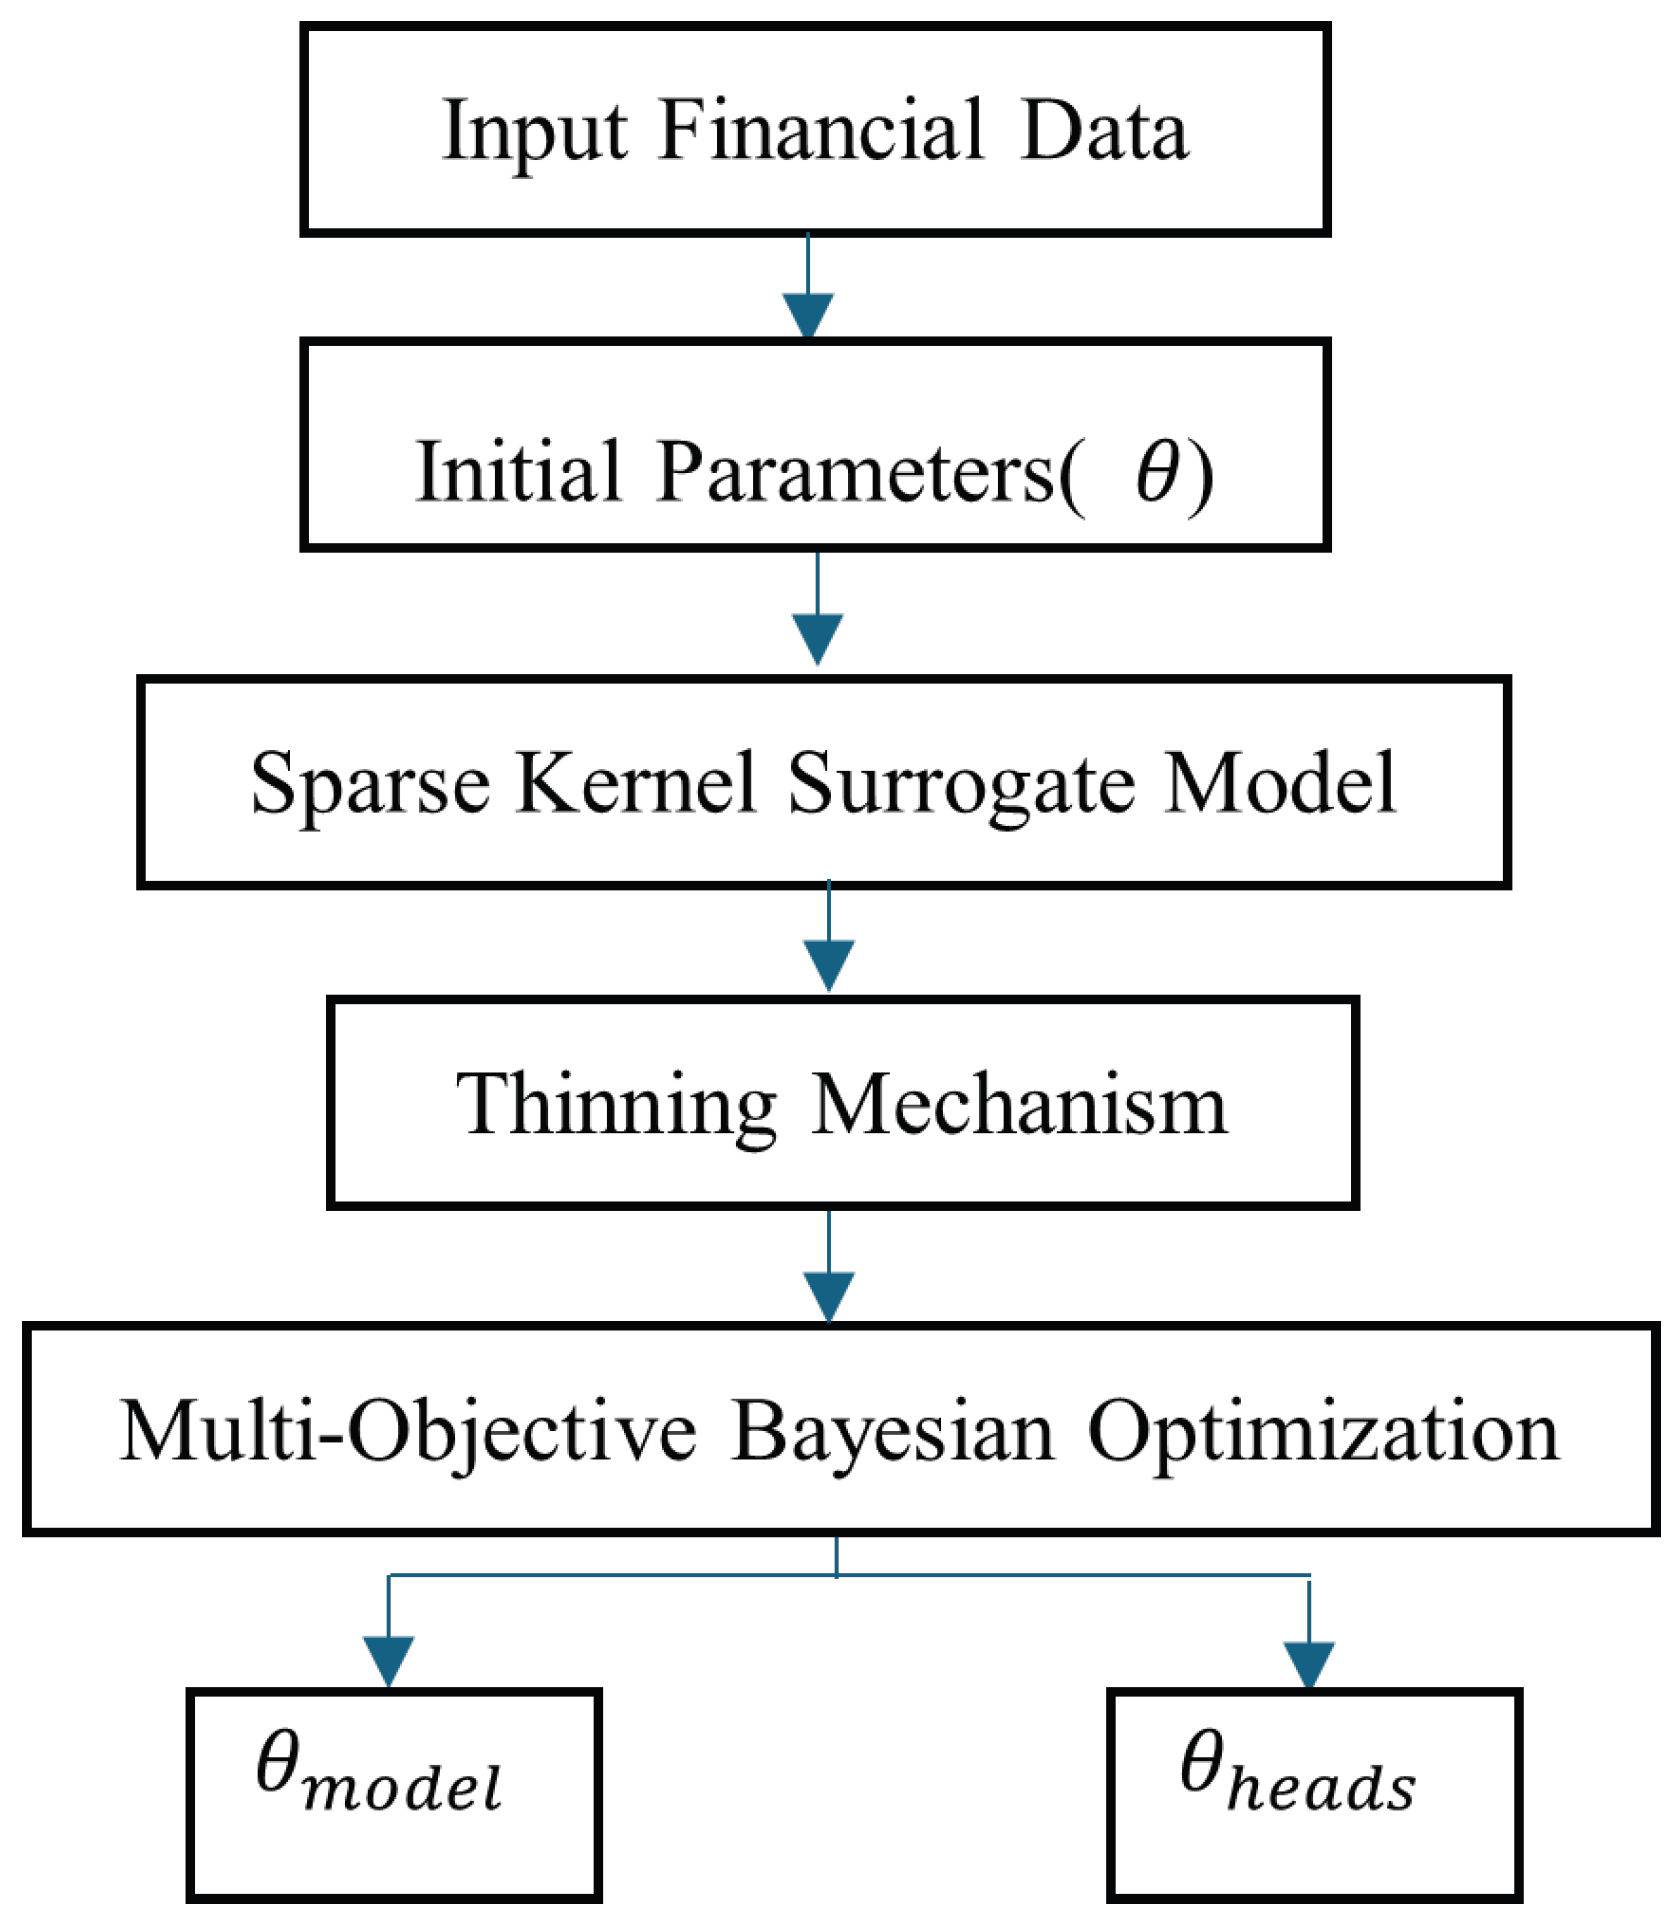
Figure 1 and Figure 2 provide the workflow view, while Table 4 gives the algorithmic abstraction; each module in the pseudocode (surrogate training, EHVI selection, constraint check, evaluation, and archiving) maps directly to the flowchart blocks.

3.3.2. Dynamic Adaptive Mechanism

To further accelerate convergence, the SKO framework incorporates a dynamic thinning mechanism that filters non-essential computations and adaptively concentrates sampling in the most promising regions of Θ [54]. This adaptive feedback loop continuously updates the archive D and refines the surrogate–acquisition pair to guide exploration. In doing so, it maintains a balanced trade-off among accuracy (AUC), efficiency (Time), and fairness (DP_Gap), ensuring stable performance across iterations [55].

3.3.3. Evaluation of Hyperparameter Combinations

As shown in Table 5, three Pareto-optimal hyperparameter combinations illustrate the trade-offs among accuracy, fairness, and efficiency. Configuration θ 3 achieves the highest AUC, θ 2 minimizes DP_Gap, and θ 1 delivers the shortest runtime. These relationships remain consistent across nearby configurations, indicating robustness and the stability of the optimization landscape [56].
The training objective adopts a dual-loss formulation, where a weighting factor λ balances the primary risk prediction loss against an auxiliary health-loss term:
L = ( 1 λ ) L risk + λ L health , λ [ 0 , 1 ] .
Validation set search within the MBO loop suggests that intermediate values ( λ 0.3 0.5 ) offer the best compromise. To avoid confusion with Krippendorff’s α in Equation (13), the loss weight is consistently denoted by λ .

3.4. Model Architecture

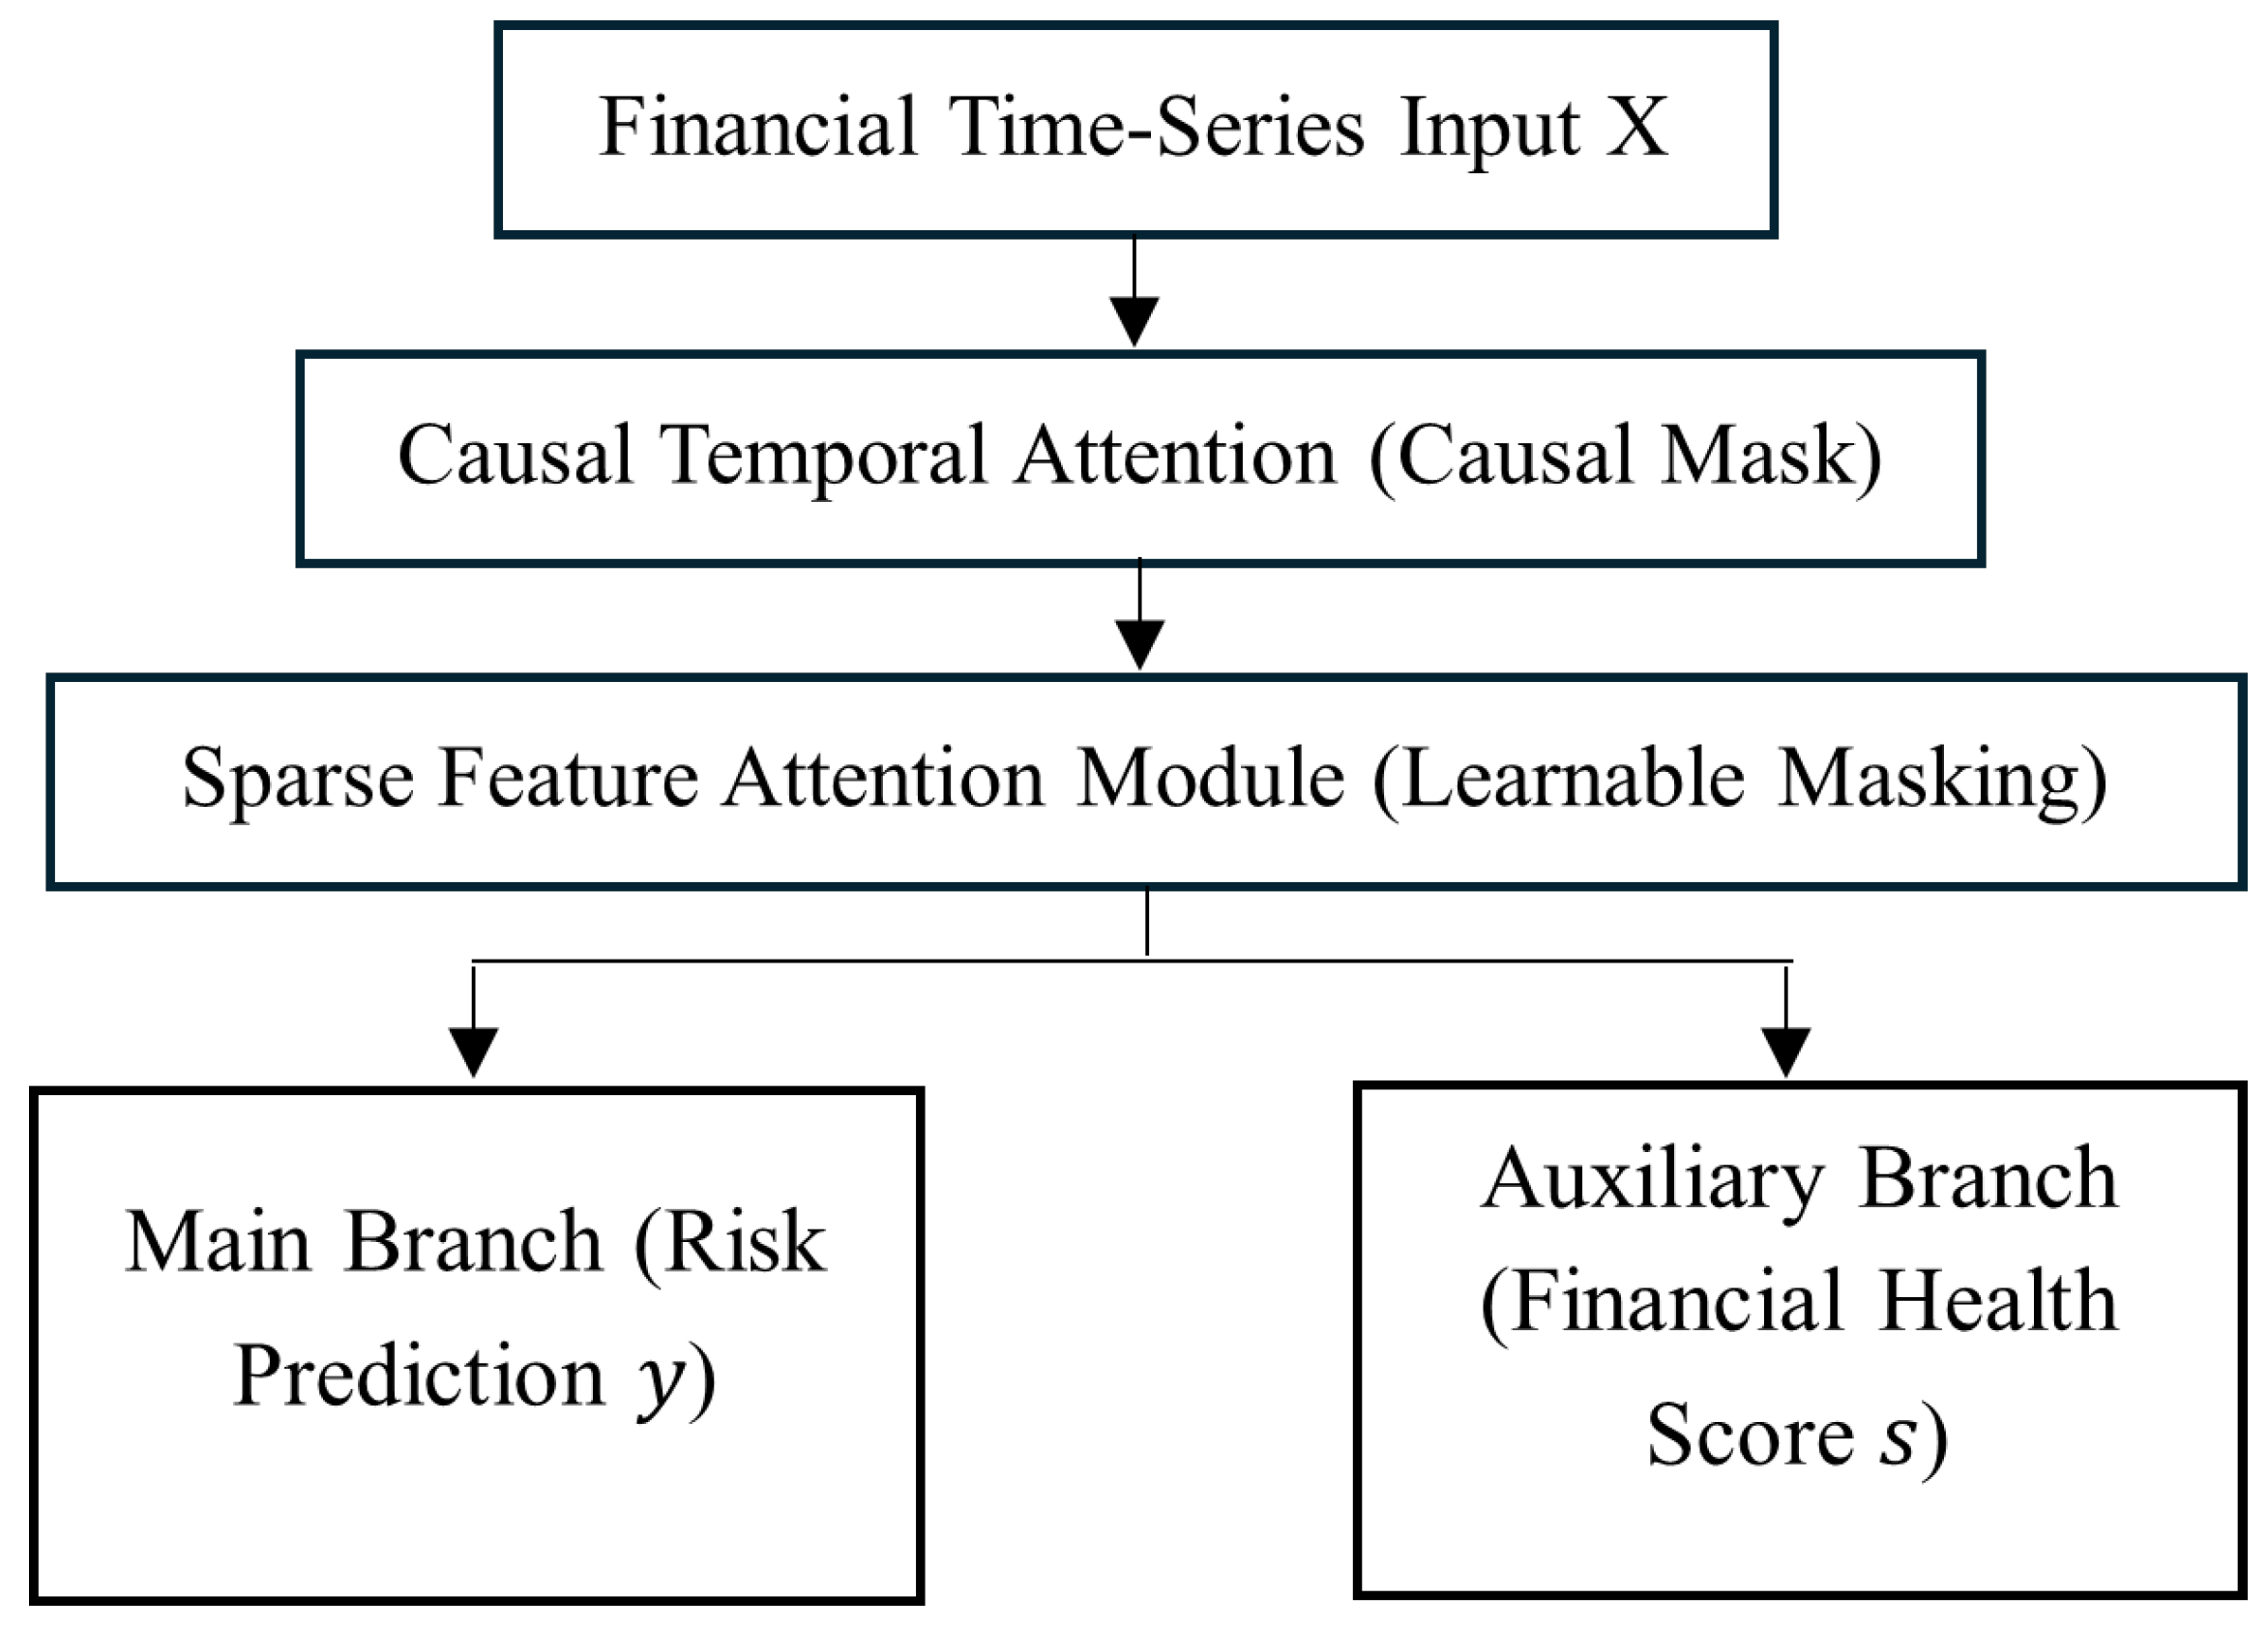
To capture both temporal dynamics and cross-feature dependencies in university financial data, we design a neural architecture that combines causal spatio-temporal attention with a dual-head output [57]. The first head performs risk classification, while the second generates an auxiliary financial health score that stabilizes training and enhances interpretability. The overall architecture is illustrated in Figure 3.
  • Temporal causal masking.
To prevent future information leakage and preserve temporal causality, the self-attention matrix A R T × T is strictly lower-triangular after softmax. Formally,
A i j = Softmax ( · ) , j i , 0 , otherwise .
This constraint ensures that the representation at time i only attends to observations up to (and including) time i, aligning the learning objective with real-world decision timing [58].
  • Sparse feature masking.
For feature-wise relevance and parsimony, we introduce a learnable sparse attention mask over features and impose an 1 penalty:
L sparse = λ s i , j | A i j | ,
where λ s > 0 controls sparsity strength. This encourages the model to rely on a compact subset of financially meaningful signals and improves interpretability.
Figure 3. Architecture of the proposed model integrating causal temporal attention and sparse feature attention. The input financial time series X first passes through a causal temporal attention module, which applies a causal mask to prevent future information leakage. Next, a sparse feature attention block selects the most relevant financial indicators through learnable masking [59]. Finally, the decoder splits into two output heads: (i) a primary head that predicts the risk probability y [ 0 ,   1 ] , and (ii) an auxiliary head that generates a financial health score s [ 0 ,   1 ] for ranking institutions and stabilizing model training.
Forecasting 07 00061 g003
  • Dual-head outputs.
The decoder produces two outputs: (i) a primary risk probability  y ^ [ 0 ,   1 ] for classification and (ii) an auxiliary financial health score s ^ [ 0 ,   1 ] for continuous assessment and ranking. The head design is summarized in Table 6.
  • Training objective.
We optimize a composite loss that balances the classification objective, the auxiliary regression objective, and sparsity:
L total = α · BCE ( y ,   y ^ ) + ( 1 α ) · MSE ( s , s ^ ) + L sparse ,
where α ( 0 ,   1 ) weights the primary task, y is the ground-truth risk label, and s is the expert-defined/-derived health score. In practice, the auxiliary head stabilizes representation learning and improves fairness–effectiveness trade-offs without overshadowing the primary objective.

3.5. Evaluation Metrics

  • Time-weighted AUC (TW-AUC).
TW AUC = t = T k + 1 T w t AUC t , t w t = 1 , w t 1 1 + e λ t ( t T ) .
  • Fairness: Group AUC Gap.
Δ AUC = | AUC public AUC private | .
  • Interpretability: Krippendorff’s α .
α = 1 D o D e , D o = ( r i r j ) 2 .
  • Sensitivity analysis.
To further examine the trade-offs between predictive accuracy, fairness, and computational efficiency, a sensitivity analysis was conducted on the Pareto-optimal solutions obtained from the Multi-Objective Bayesian Optimization process. As summarized in Table 7, three representative configurations were evaluated, each emphasizing a different optimization priority: accuracy-oriented, balanced, and fairness-oriented.

4. Results and Discussion

This section presents and discusses the empirical results of the proposed financial risk prediction framework. Consistent with the objectives stated in Section 1 and the literature themes reviewed in Section 2, the discussion highlights not only predictive performance but also comparative positioning, robustness, fairness, and interpretability [60]. This structure allows the analysis to address both methodological contributions and governance-oriented implications discussed in recent research.

4.1. Model Hyperparameter Optimization

4.1.1. Interpretability via SHAP Analysis

To improve model interpretability, we apply SHAP (SHapley Additive exPlanations) to decompose predictions into feature-level contributions [61]. SHAP provides both local explanations for individual universities and global feature rankings aggregated across all samples. Table 8 summarizes the SHAP-based interpretability workflow, including computation steps, notation, and the rationale for each operation. By explicitly defining variables such as the SHAP value s i , the perturbation effect Δ f , and the expert-derived ranking R audit , the procedure enhances transparency and reproducibility in the interpretability analysis.
To validate interpretability, the resulting model-derived feature importance ranking R model is compared against expert consensus through Krippendorff’s α , which quantifies agreement reliability. This procedure guarantees that the interpretability outcomes are not only mathematically consistent but also aligned with expert judgment, reinforcing the governance value of the proposed framework [62].

4.1.2. Model Embedding Dimension Sensitivity Analysis

In addition to interpretability, we examine the sensitivity of the model to its embedding dimension ( d model ), which determines the internal representation capacity of the Transformer. Larger embedding dimensions can capture more complex feature interactions but also increase computational cost and risk diminishing returns. Therefore, a systematic sensitivity analysis was conducted to identify a robust and efficient configuration.
Table 9 summarizes the validation AUC, validation loss, and training time under different embedding dimensions. Each result represents the mean of five independent runs with distinct random seeds, and standard deviations (in parentheses) quantify the variance due to initialization randomness. As shown, the configuration with d model = 64 provides the best overall balance, achieving the highest validation AUC (0.861 ± 0.004) and lowest loss (0.34 ± 0.01) while maintaining moderate computational cost. Although higher dimensions (128, 256) yield similar AUC values, they require substantially longer training times without consistent performance gains. These findings confirm that the identified optimum is stable rather than an artifact of random initialization. Accordingly, d model = 64 is adopted as the default configuration for all subsequent experiments.

4.2. Model Performance Comparison

4.2.1. Experimental Setup

Five model families were evaluated: LR, RF, LSTM, TabFormer/FT-Transformer, and the proposed Transformer + MBO. Evaluation metrics included AUC, F1, fairness (DP_Gap), and interpretability (Krippendorff’s α ).

4.2.2. Main Results and Comparative Analysis

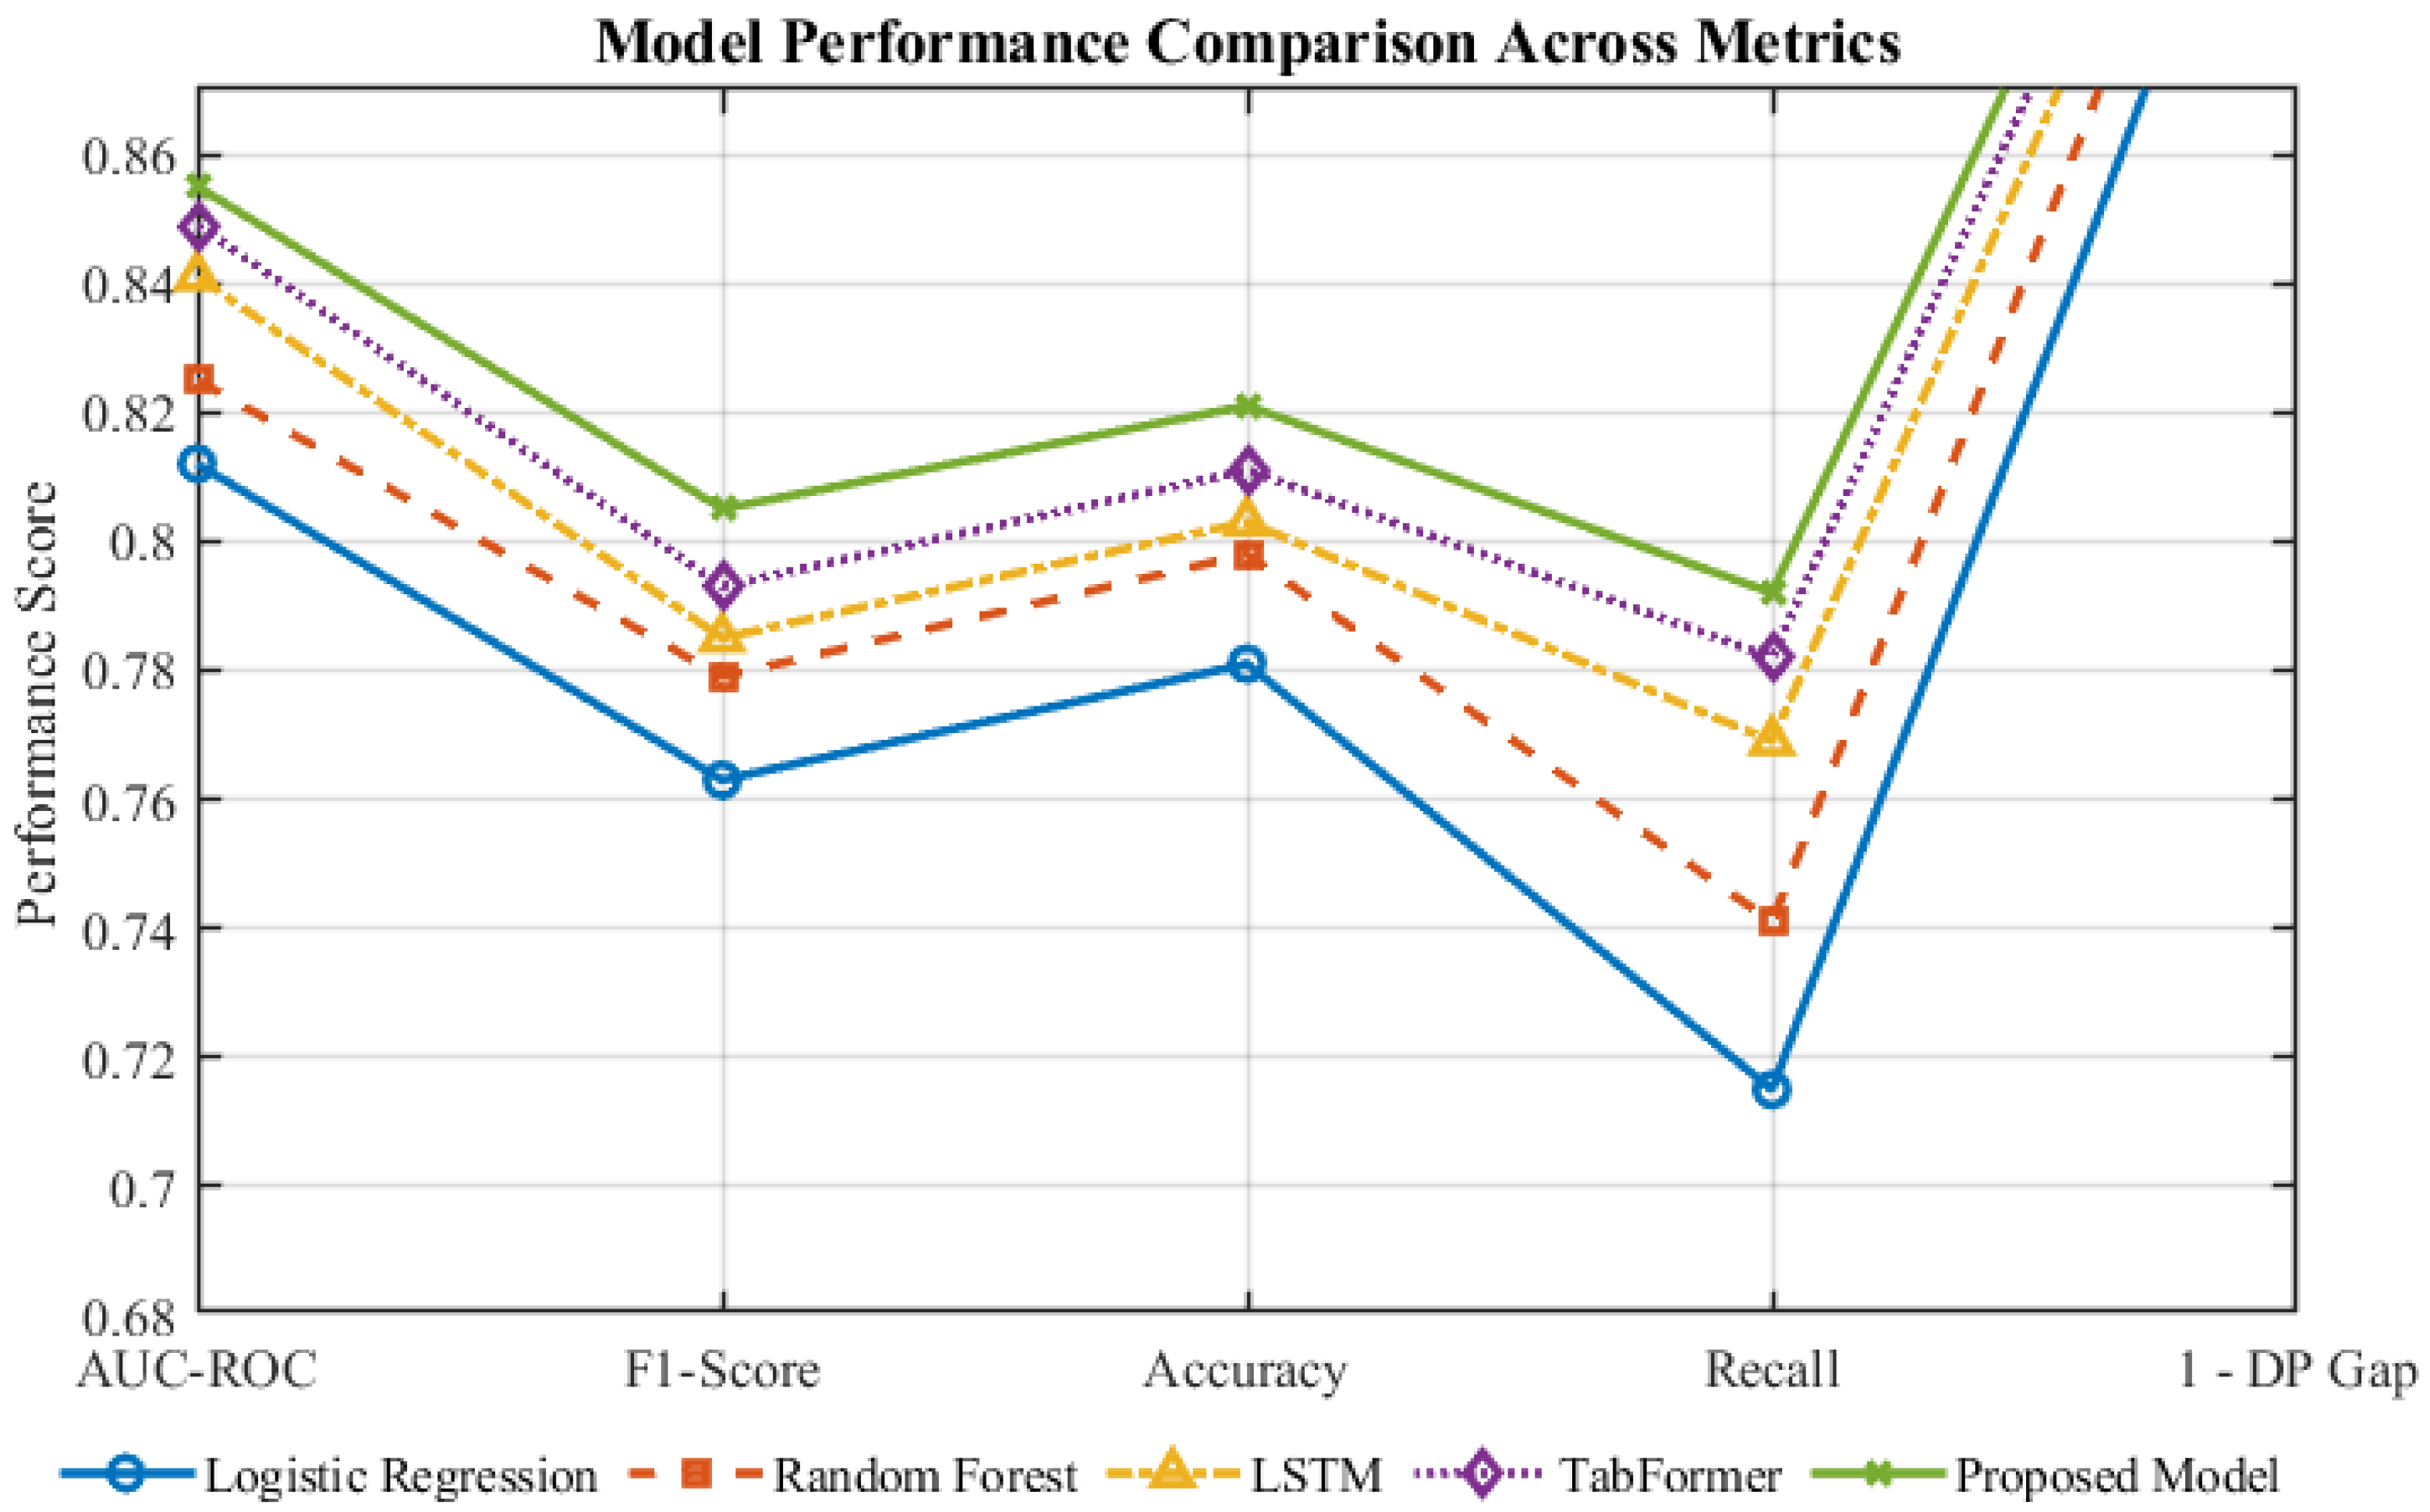
Table 10 presents a comparative evaluation of the proposed framework against classical machine learning models (LR and RF) and deep learning baselines (LSTM, TabFormer, and FT-Transformer). Overall, the proposed model achieves the most balanced performance across predictive accuracy (AUC and F1), fairness (DP_Gap), and interpretability (Krippendorff’s α ). Compared with the strongest baseline (FT-Transformer), it improves AUC by 0.8% and F1-score by 0.9%, while further reducing the fairness gap by 13.2%. These results indicate that incorporating fairness constraints into the optimization process does not compromise accuracy; instead, it regularizes learning and enhances robustness across different institutional subgroups. In addition, Figure 4 visually summarizes the comparative results across multiple evaluation metrics, including AUC-ROC, F1-score, Accuracy, Recall, and fairness (1–DP_Gap). As shown, the proposed model consistently achieves the highest performance across all metrics, confirming the quantitative trends reported in Table 10.
From a methodological perspective, three consistent patterns can be observed. First, traditional models (LR and RF) struggle with the high-dimensional and nonlinear dependencies in university financial data, leading to larger DP_Gap values (0.109–0.146) and weaker alignment with expert reasoning ( α < 0.6 ). Second, sequential models such as LSTM partially capture temporal dynamics but fail to disentangle long-range or cross-feature interactions, yielding only moderate fairness improvement and limited interpretability. Third, Transformer-based architectures (TabFormer and FT-Transformer) perform considerably better due to their attention mechanisms, yet they primarily optimize for accuracy and therefore still display measurable fairness disparities.
The proposed framework advances these Transformer foundations by combining causal-attention encoding with Multi-Objective Bayesian Optimization (MBO), which treats fairness (DP_Gap) as a co-optimized objective rather than an external constraint [63]. This integration produces a smaller demographic parity gap (0.046) while maintaining high discriminative performance (AUC = 0.855). The performance gains can be attributed to the Sparse Kernel Optimization (SKO) surrogate, which stabilizes parameter search in high-dimensional spaces, and the dual-head output, which separates risk prediction from continuous financial health scoring [64]. Krippendorff’s α = 0.73 further confirms that SHAP-based explanations align closely with expert judgment, reinforcing the model’s interpretability and governance suitability.
Consistent with this Special Issue’s theme of LLMs for Time Forecasting, these findings also demonstrate that the proposed framework operationalizes several LLM-style forecasting principles—including causal masking, multi-head attention, and adaptive optimization across multiple objectives. Such mechanisms enable more transparent and reliable temporal reasoning within structured financial data, bridging deep learning architectures with policy-driven decision support [34]. Therefore, Table 10 not only illustrates quantitative superiority but also reflects a conceptual evolution from conventional Transformers toward fairness-aware and governance-aligned forecasting models.

4.2.3. Visualization and Trade-Offs

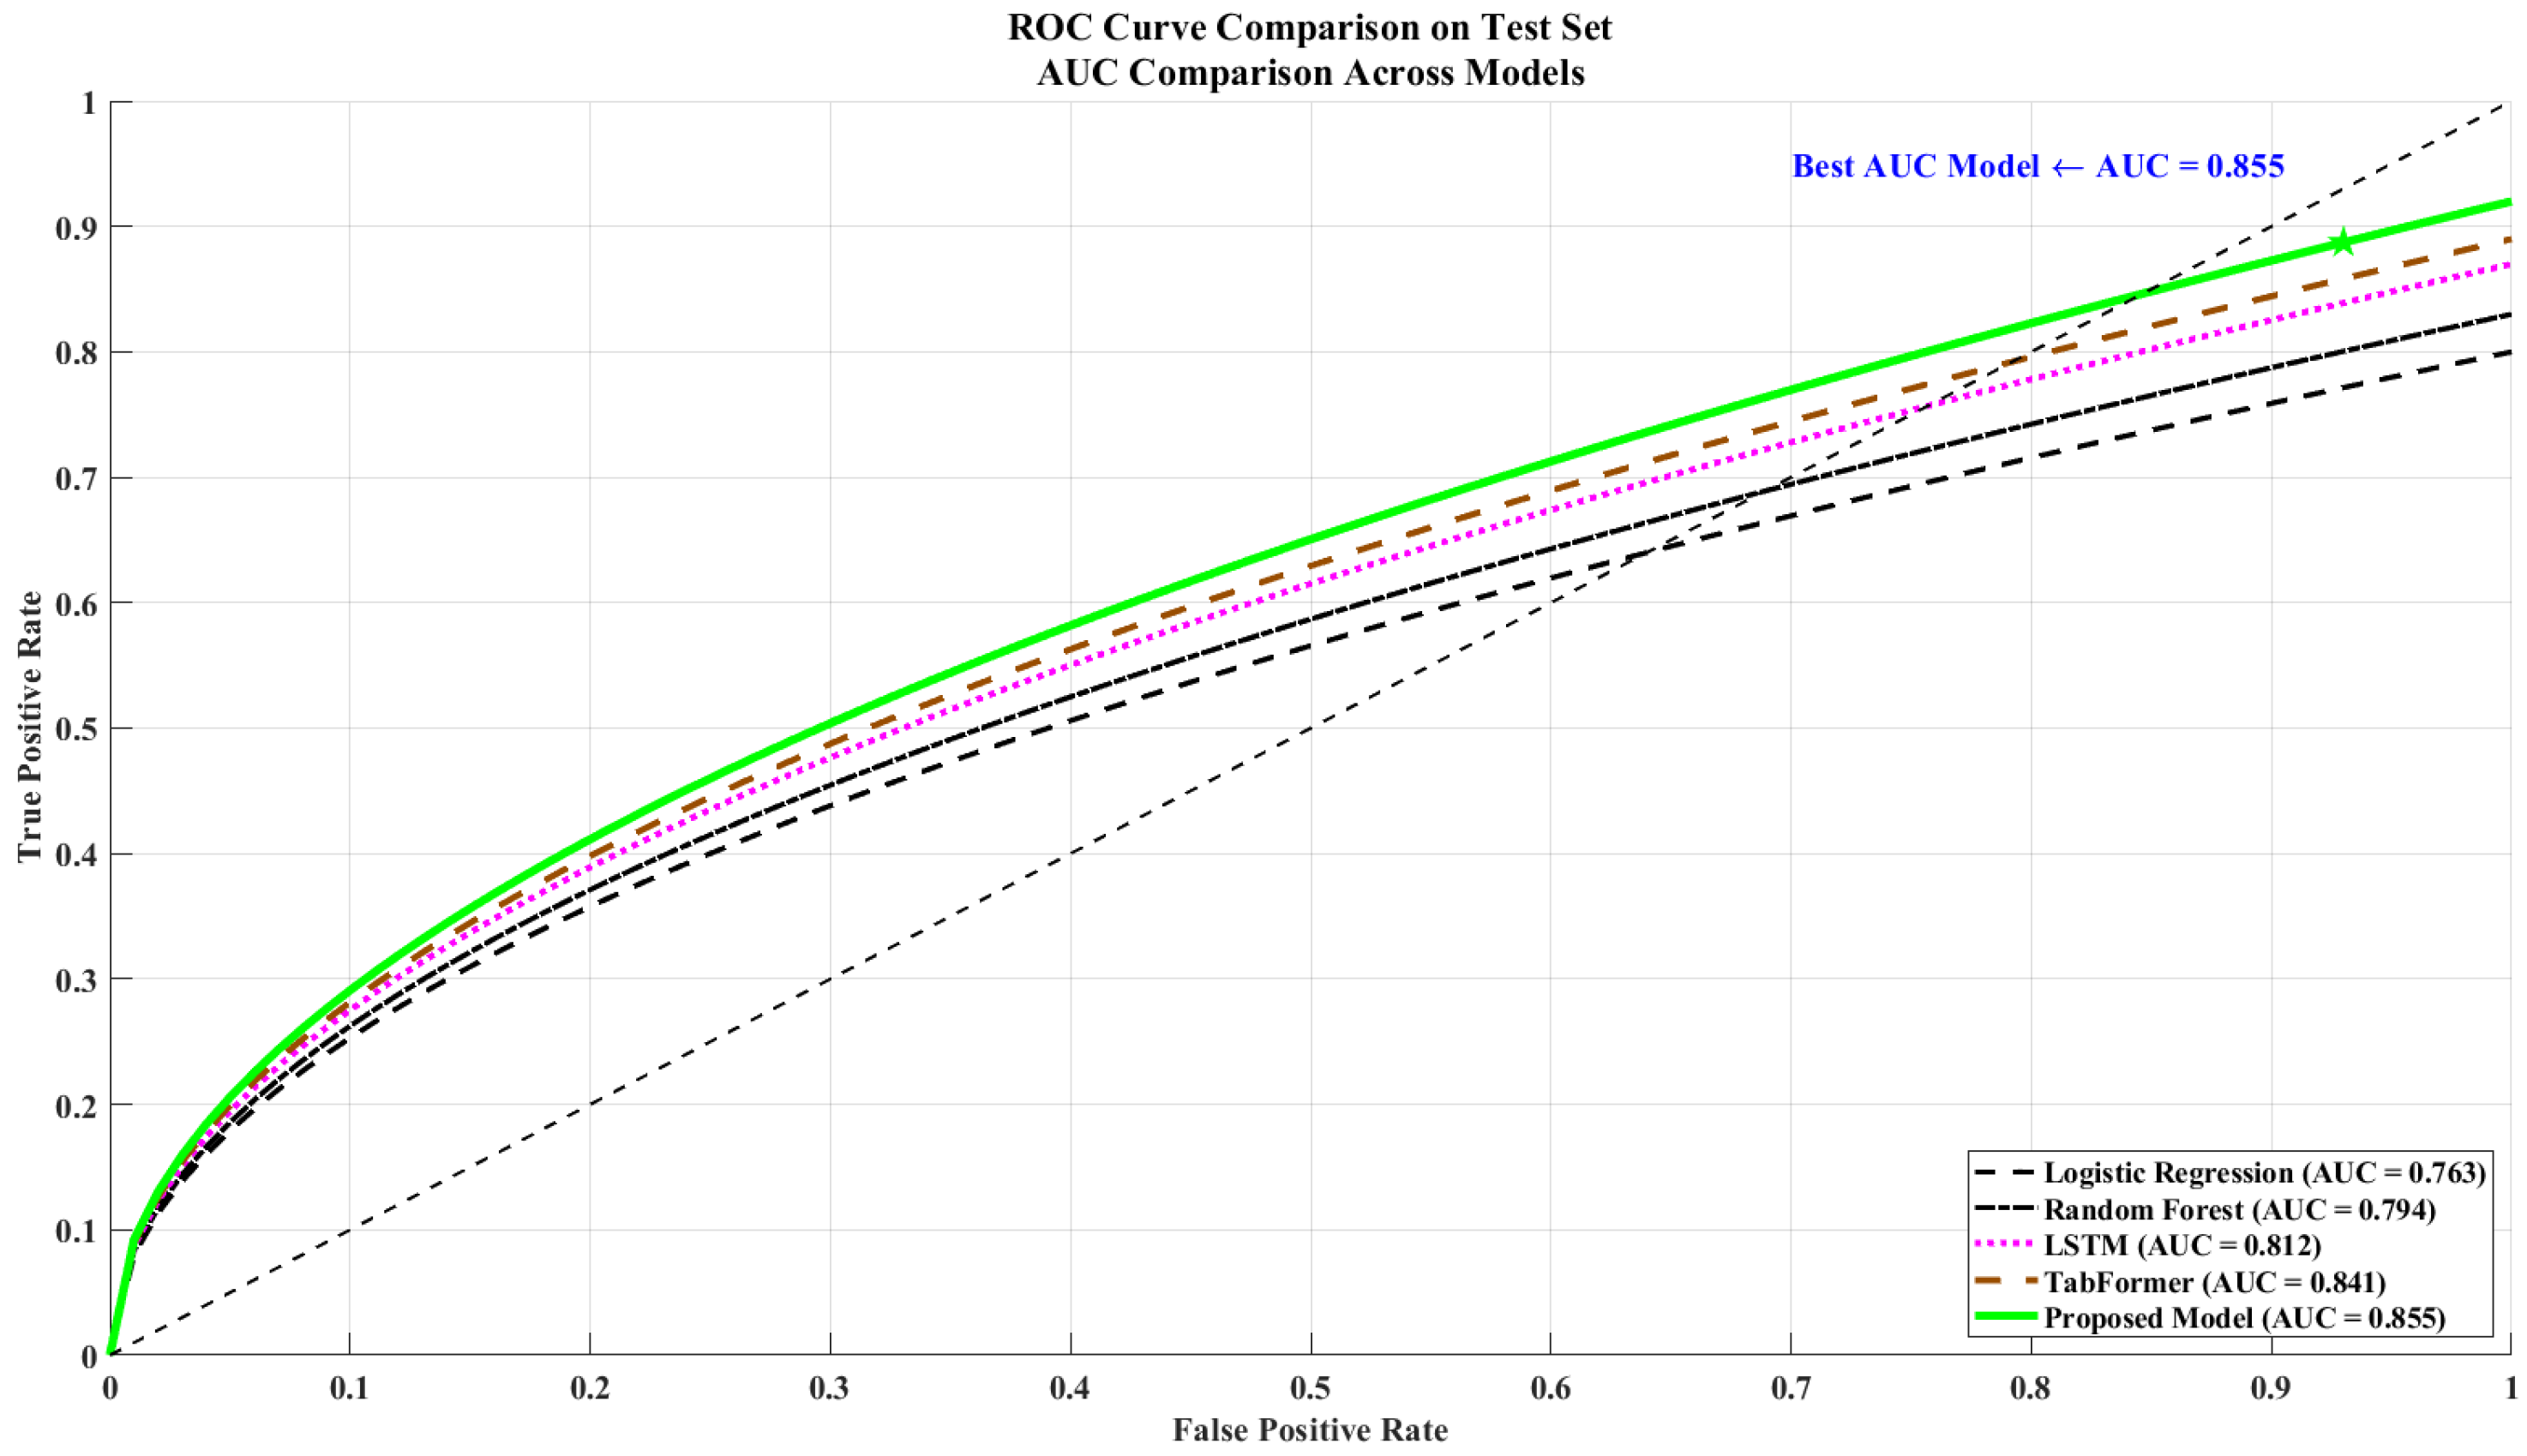
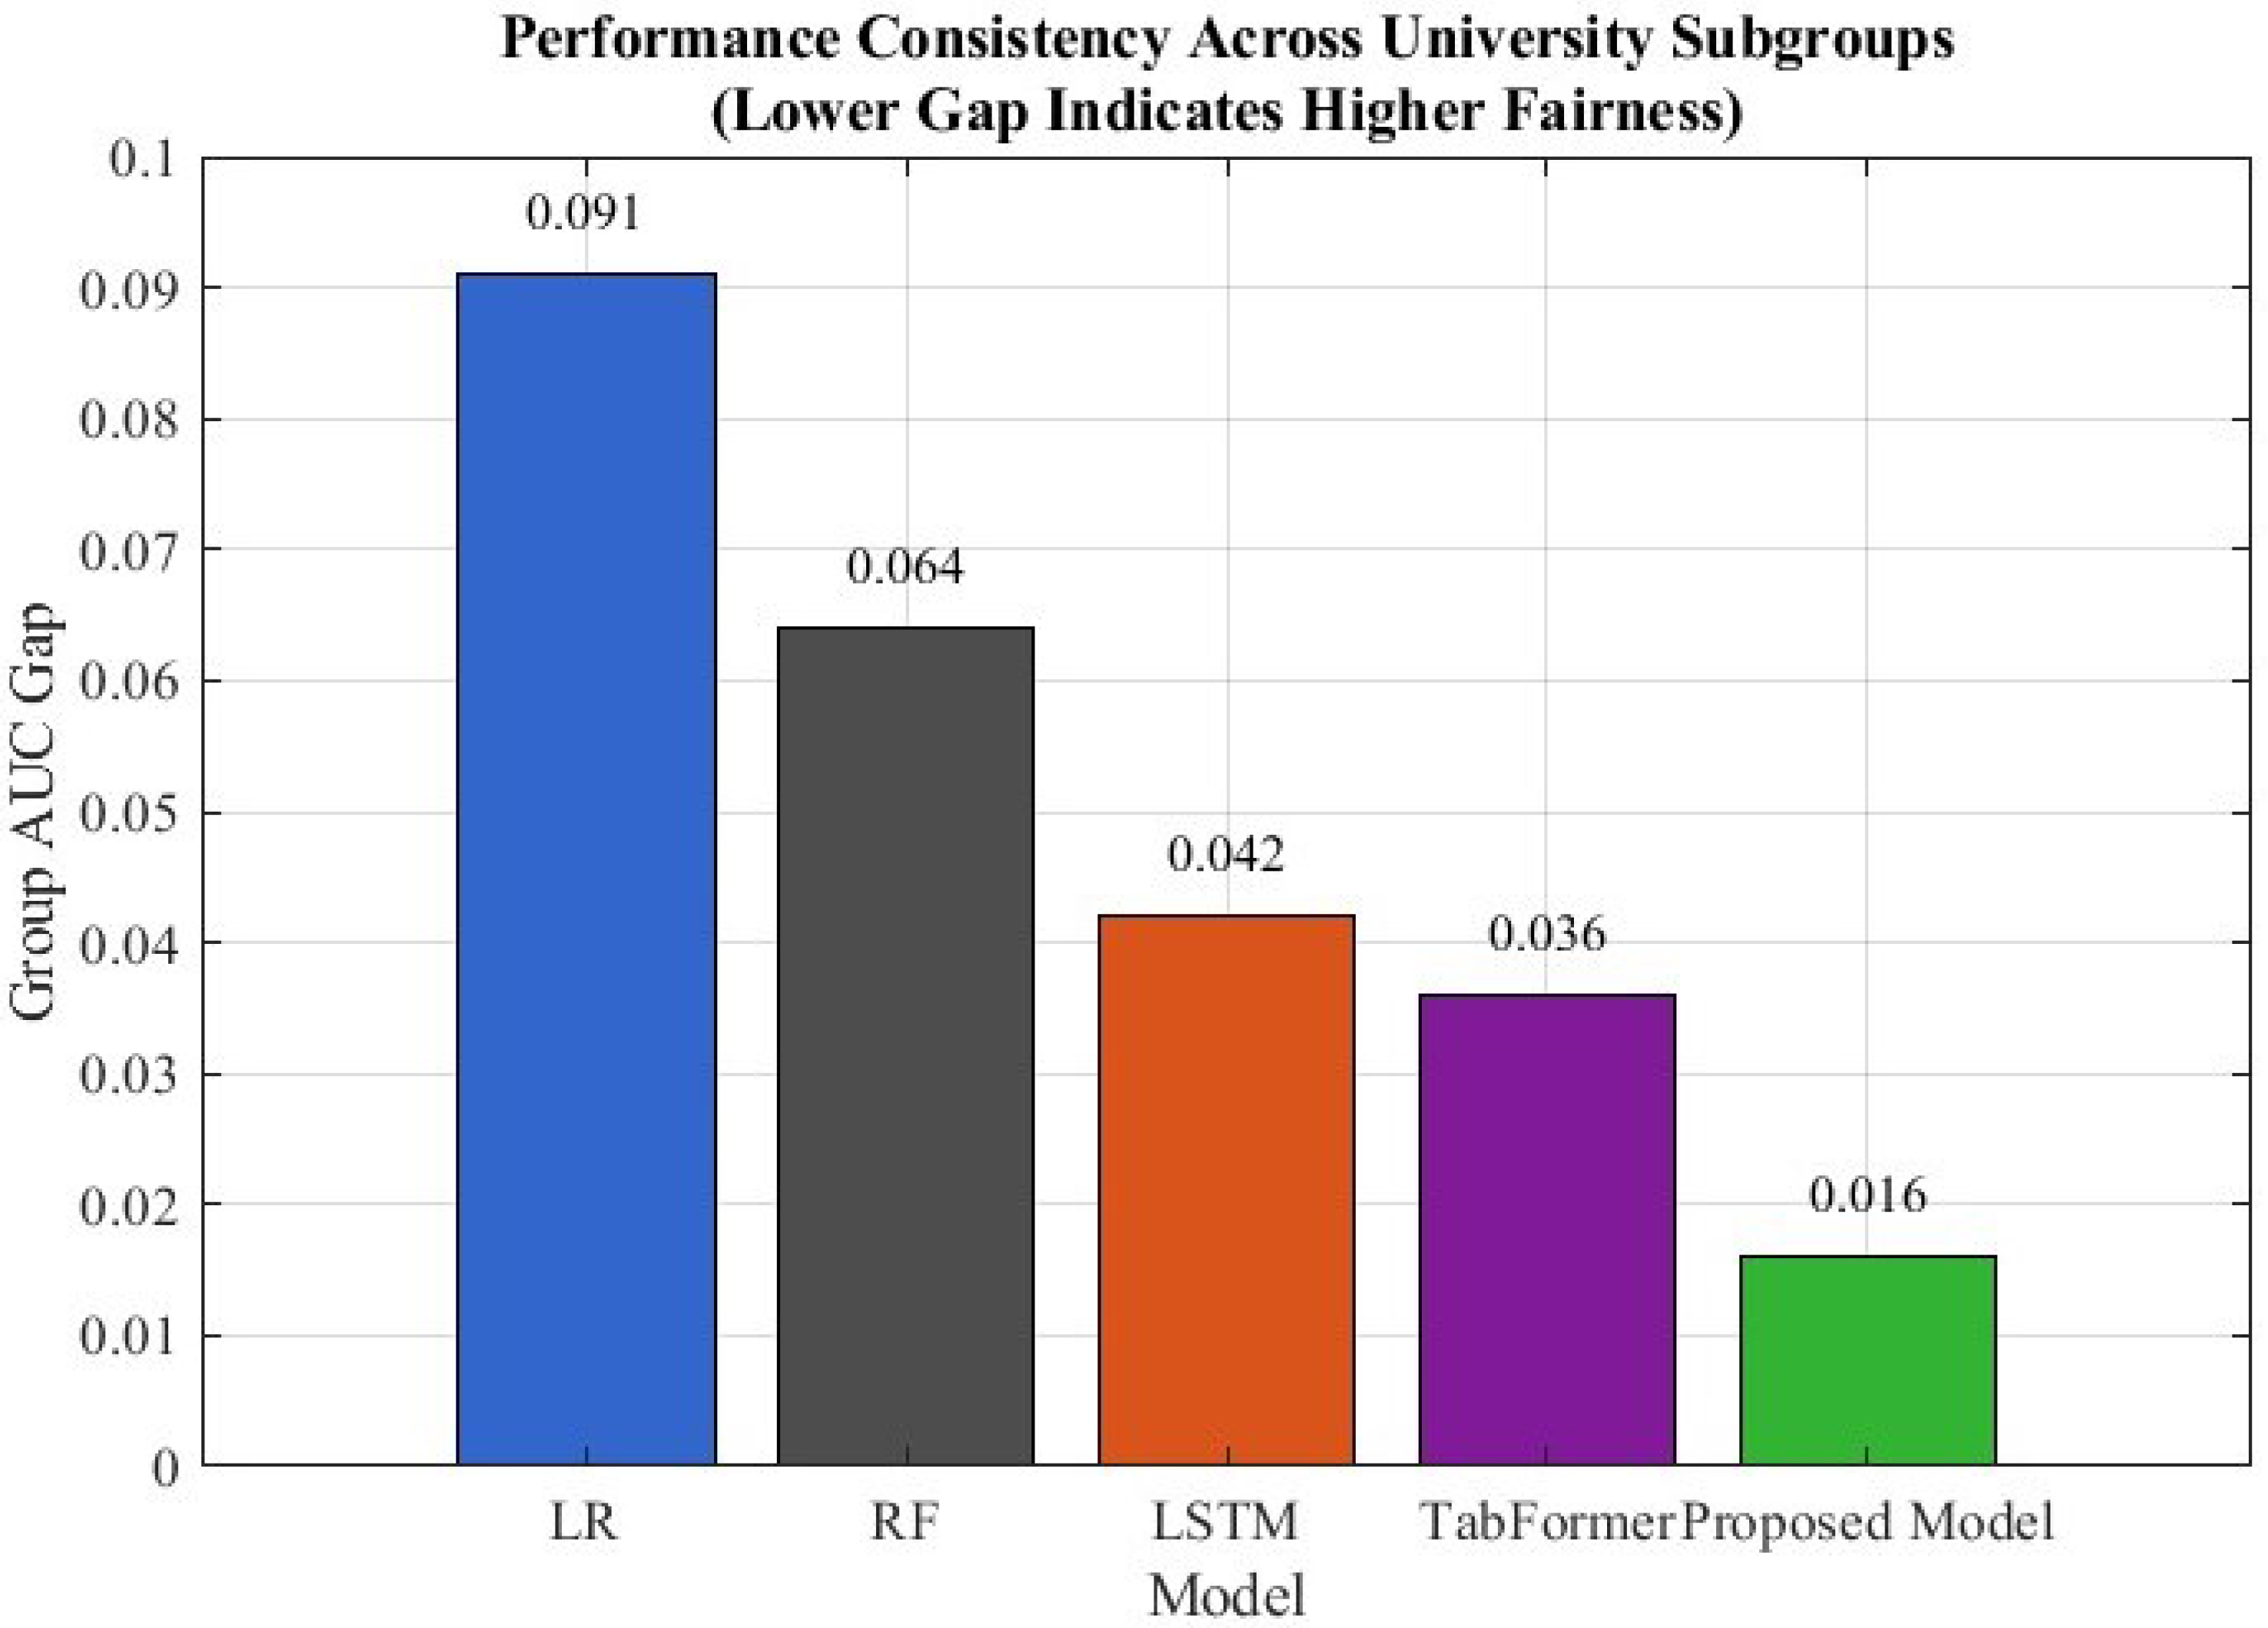
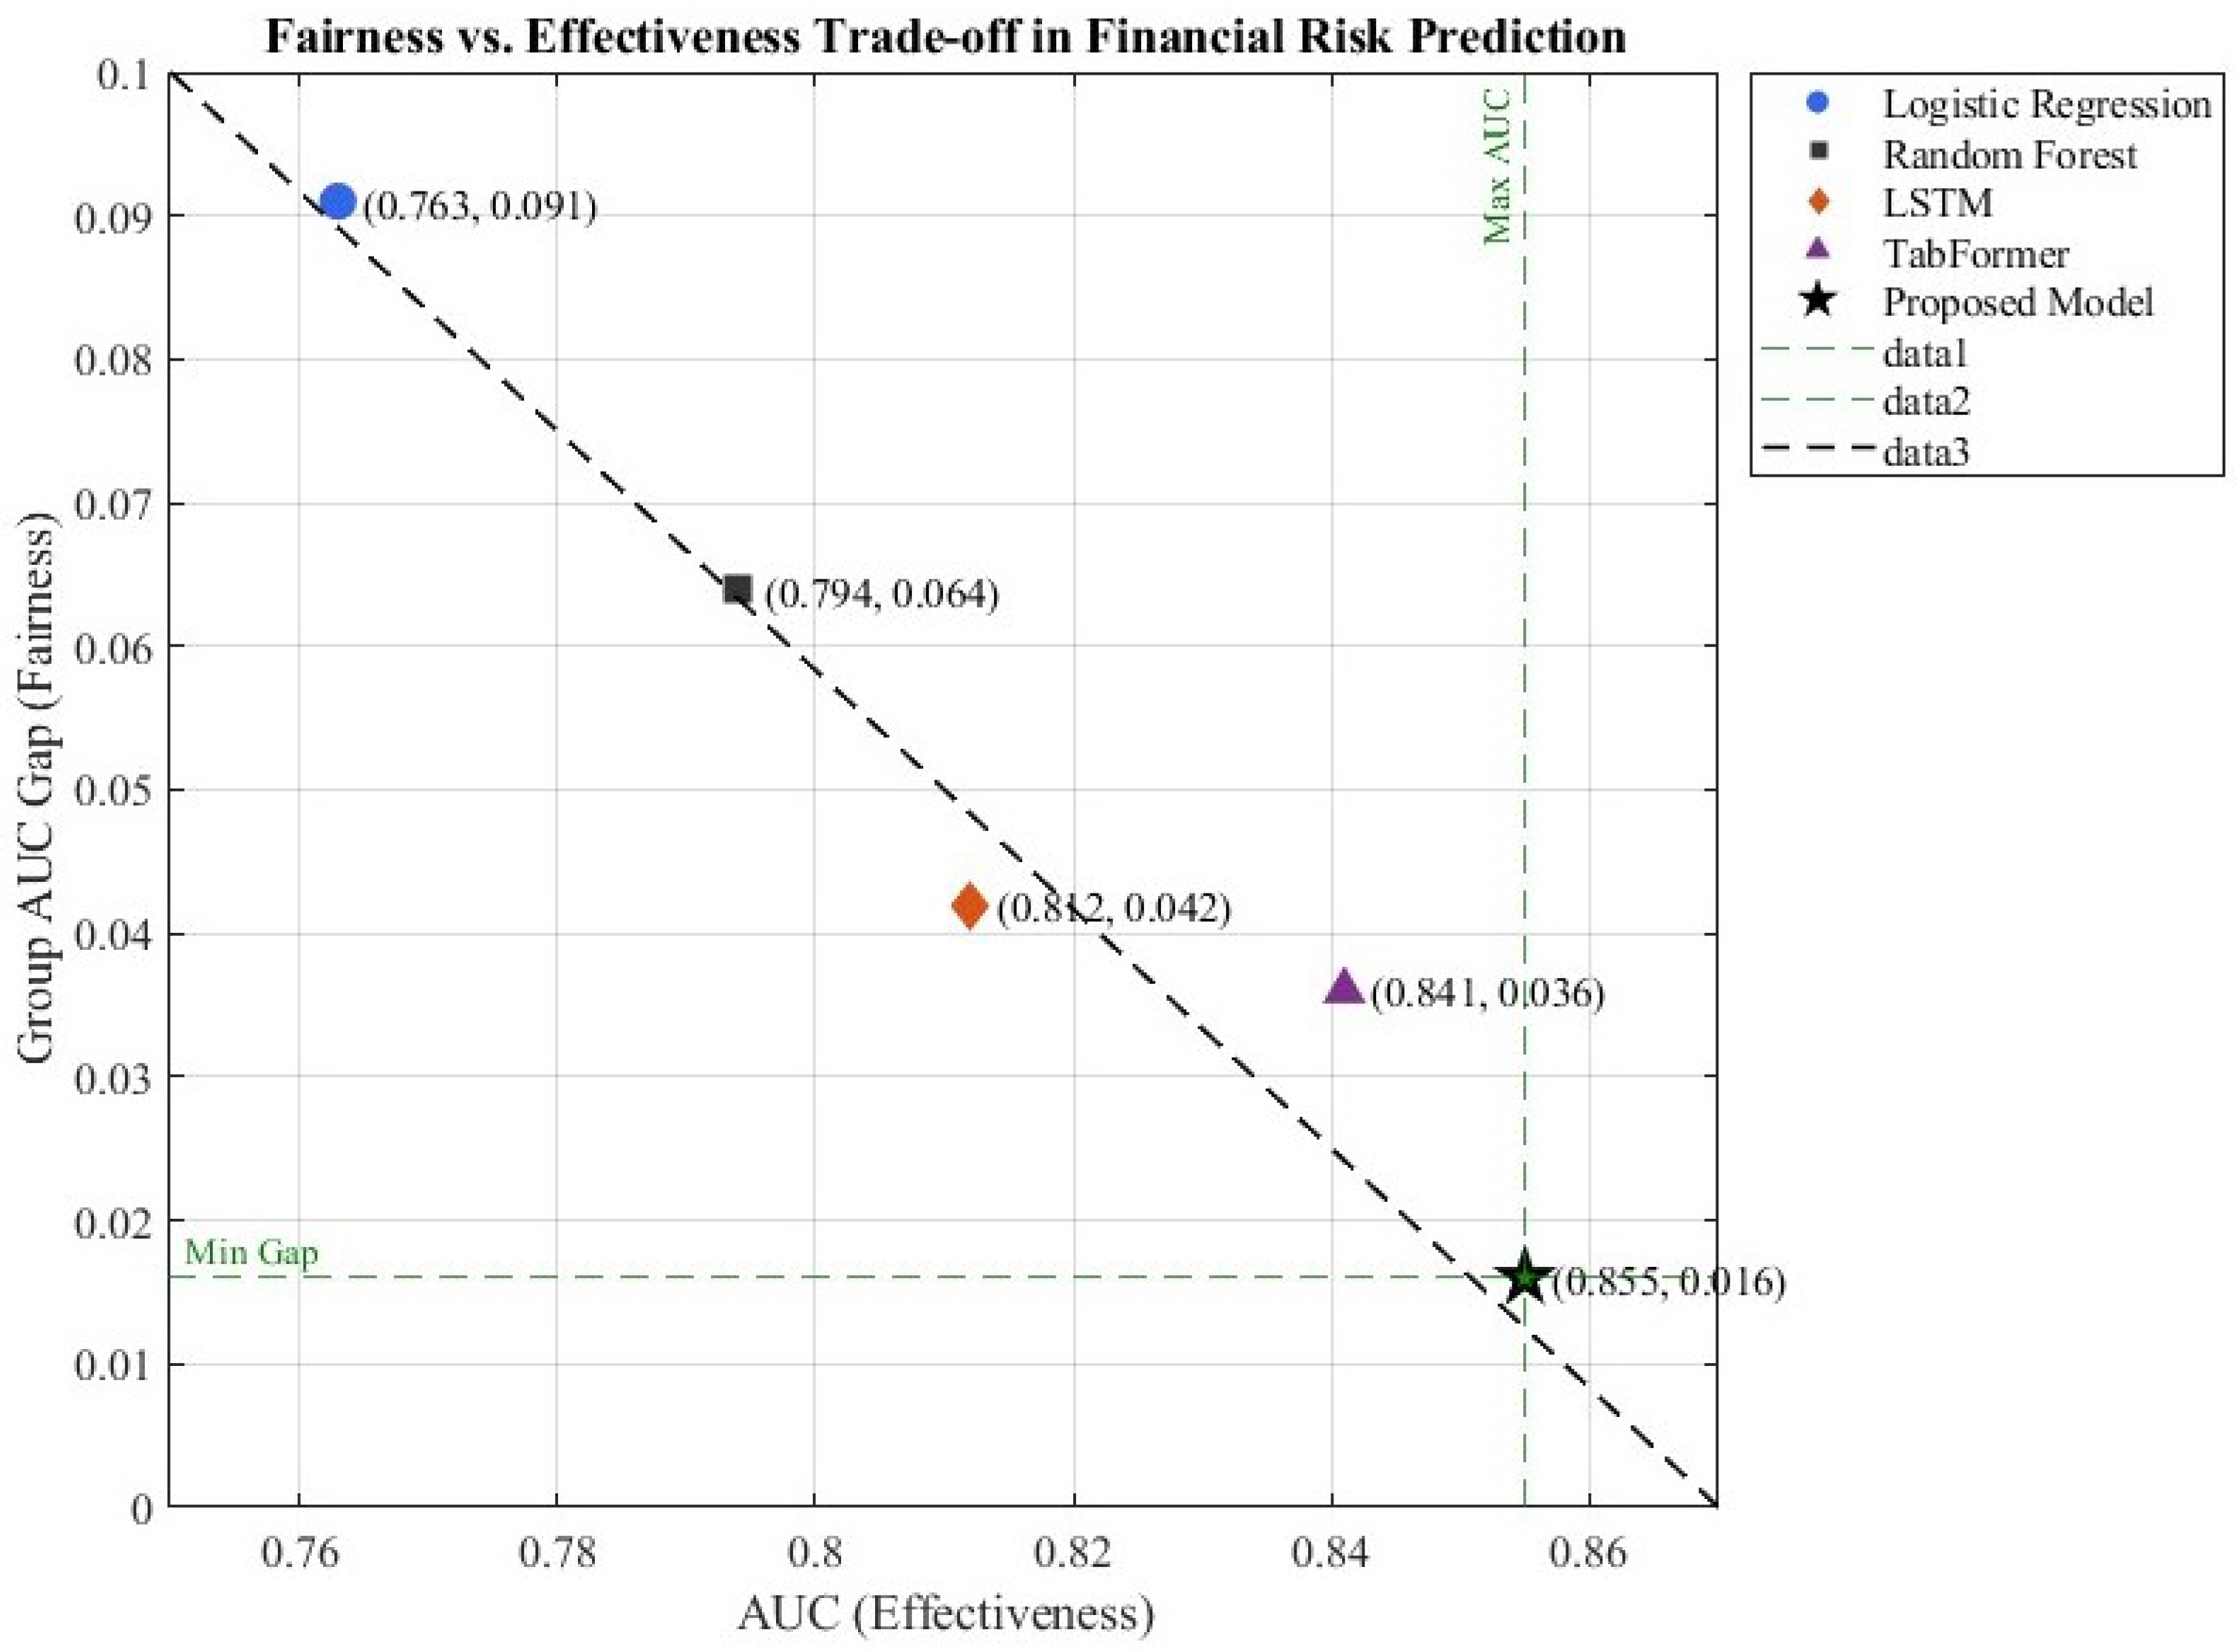
Figure 5, Figure 6 and Figure 7 illustrate the ROC curves, group-level fairness gaps, and the trade-off between fairness and predictive effectiveness. These visualizations demonstrate that the proposed framework consistently achieves higher accuracy while simultaneously reducing performance disparities between institutional subgroups. The observed pattern underscores the effectiveness of the multi-objective optimization strategy: its benefits extend beyond predictive accuracy to encompass fairness across different institution types. This finding aligns with the broader fairness-aware principles that guide modeling practices in public-sector risk governance [32,33].

4.2.4. Interpretability Visualization

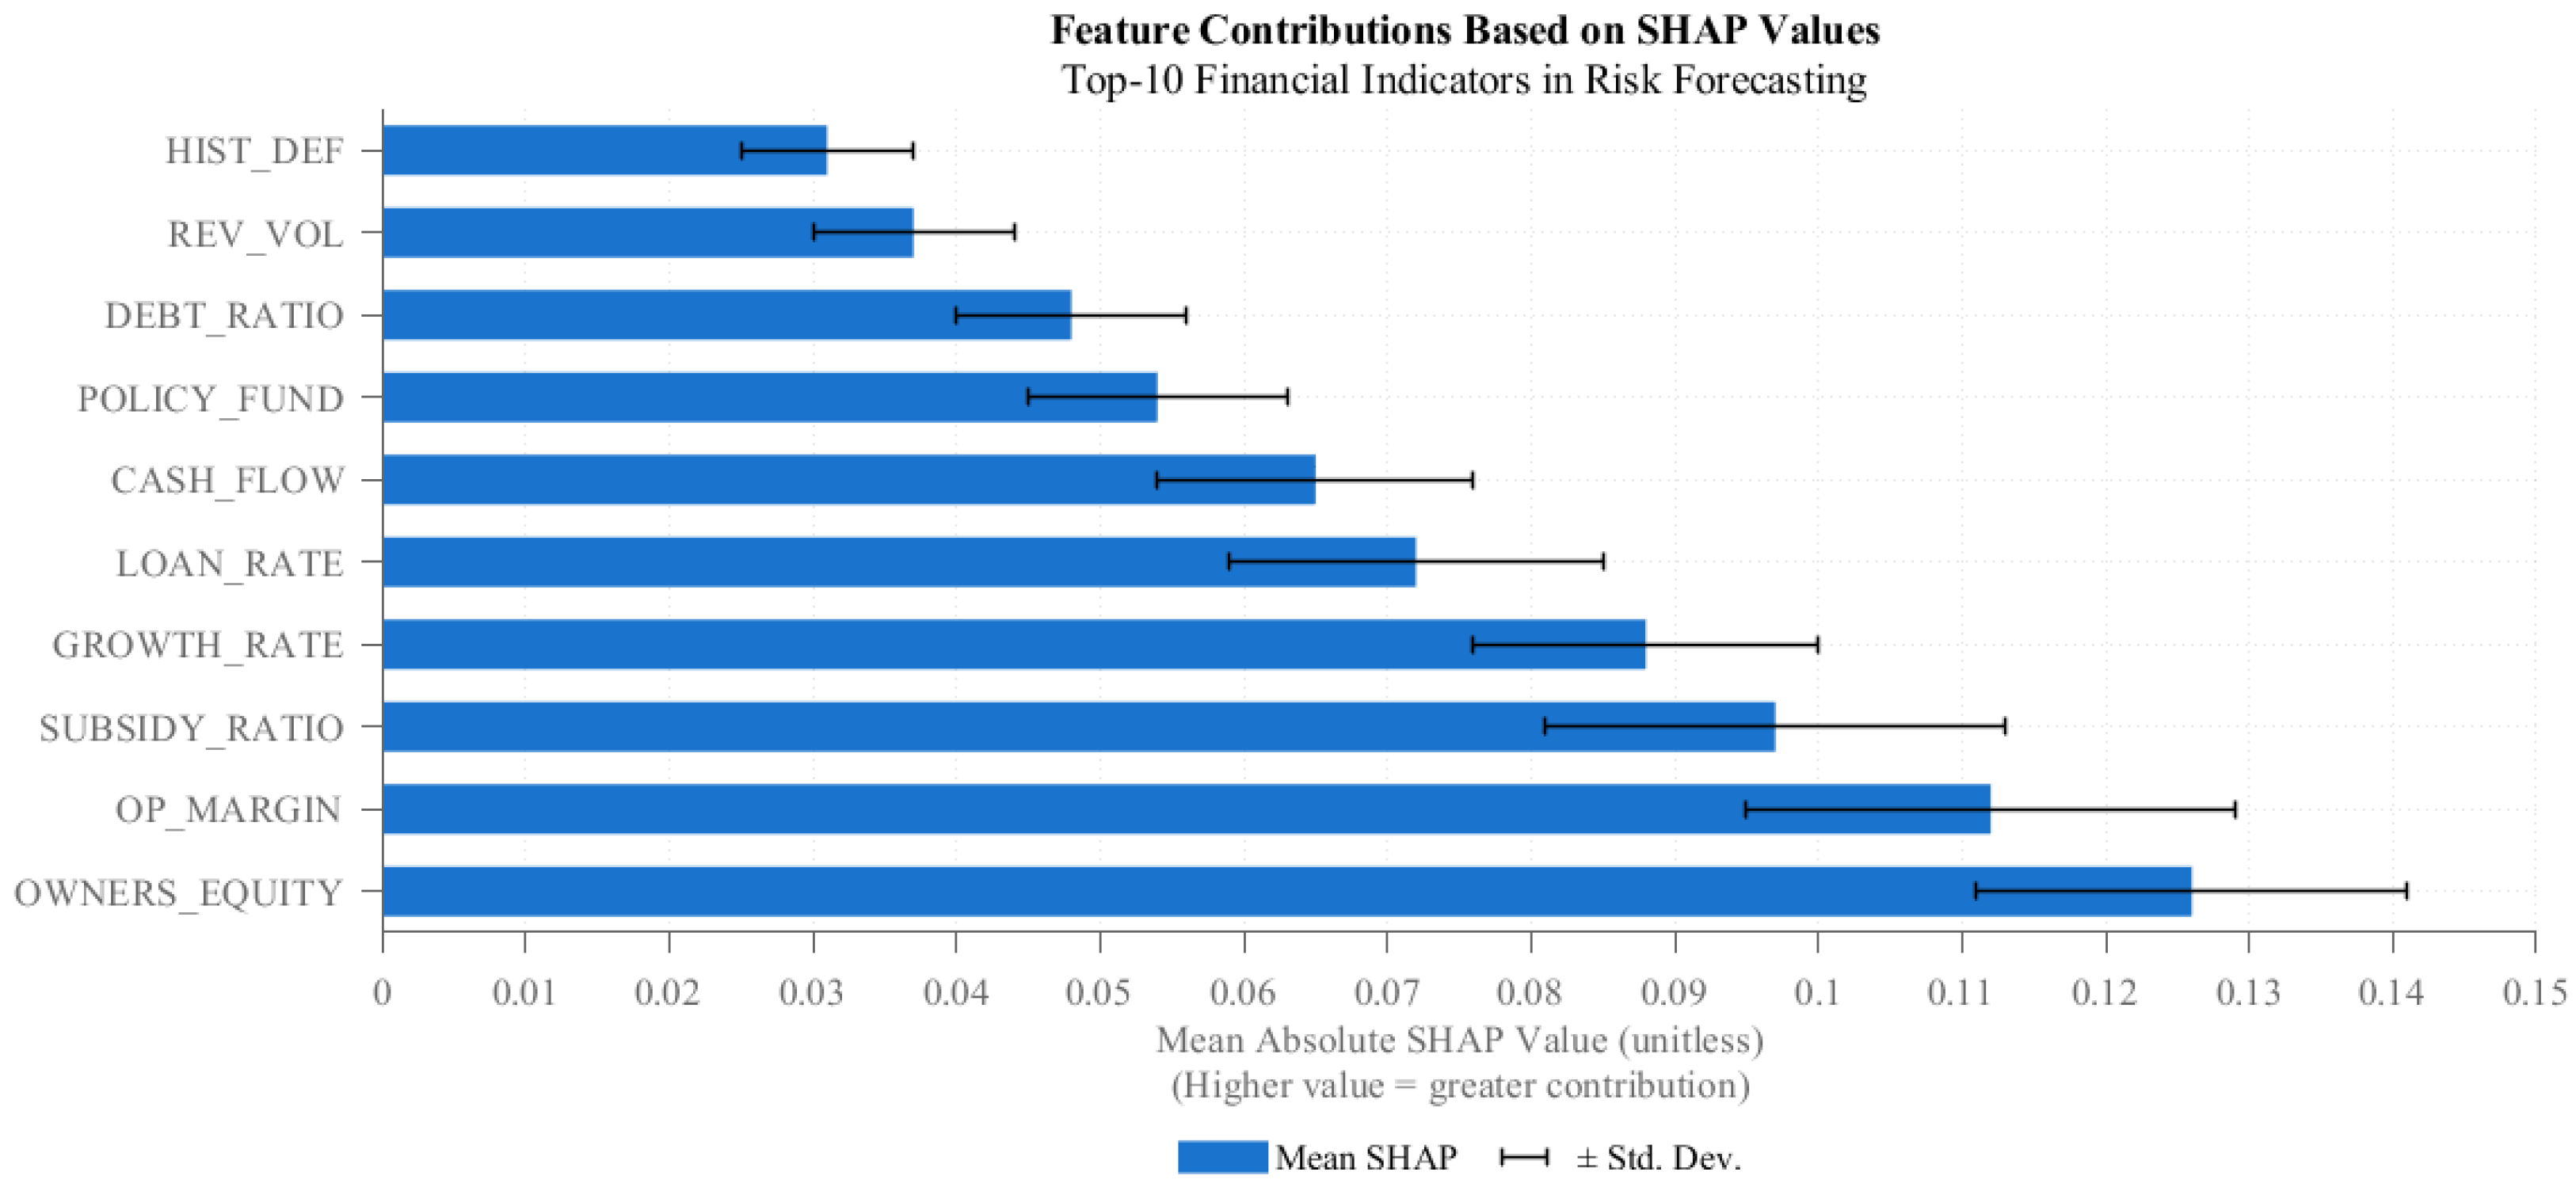
To improve transparency and auditability, we assess feature-level contributions on the held-out test set using SHAP (Shapley Additive Explanations). Figure 8 displays the ten most influential indicators, ranked by their mean absolute SHAP values, while consistency with expert evaluations is quantified using Krippendorff’s α . Together, these metrics provide an interpretable link between model behavior and domain expertise, ensuring that the explanatory patterns align with established financial reasoning.
The ranking is dominated by equity ratio, operating margin, and subsidy dependence, followed by liquidity- and cost-related variables. High mean absolute SHAP values indicate consistent marginal impact on the predicted risk score, while larger error bars suggest context-dependent effects that vary across institutions and years. The proposed framework yields Krippendorff’s α = 0.73 , indicating substantial agreement between model outputs and expert annotations.

4.2.5. Interpretability and Managerial Insights

To make the model’s explanations actionable for governance, we focus on three indicators that were consistently identified across validation folds as being the most influential drivers of financial risk:
  • Operating margin: A declining operating margin indicates rising expenditure pressure and weakened cash generation. Recommended actions include short-term cost containment, medium-term revenue diversification, and enhanced unit-cost monitoring.
  • Equity ratio: Low or volatile equity reflects elevated debt exposure. Recommended actions involve strengthening asset–liability management, revising borrowing limits, and maintaining liquidity buffers aligned with tuition cycles.
  • Subsidy dependence: Heavy reliance on government subsidies increases vulnerability to appropriation delays or policy shifts. Recommended actions include diversifying internal revenue sources through overhead-bearing research grants and industry partnerships.
By linking SHAP-based explanations to concrete managerial responses, the interpretability analysis extends beyond descriptive ranking to offer decision-oriented guidance. In practical terms, the top-ranked indicators can be continuously monitored through management dashboards. Sudden outlier movements may trigger targeted audits or reviews, while year-over-year drifts can inform budget hearings and strategic risk dialogs.
Reproducibility note: The interpretability pipeline is reproducible: (i) train the finalized model; (ii) compute SHAP values on the test set; (iii) aggregate mean absolute SHAP values and select the top 10; (iv) collect expert rankings via a structured template; (v) compute Krippendorff’s α for agreement.

4.2.6. Comprehensive Synthesis and Policy Implications

To provide a holistic understanding of the comparative experiments, Table 11 consolidates the three core evaluation dimensions—predictive accuracy, fairness, and interpretability—across all baseline models and the proposed framework. This synthesis builds upon the detailed benchmark results reported in Table 10 (Section 4.2.2), reorganizing them into a unified accuracy–fairness–interpretability perspective. By presenting the three objectives side-by-side, this table highlights the consistent superiority of our model not only in technical performance but also in governance-aligned objectives.
As summarized in Table 11, the proposed framework achieves the most balanced performance across all three dimensions—accuracy, fairness, and interpretability. By embedding fairness and transparency directly into the optimization objectives, the model transcends accuracy-only paradigms and aligns with the governance principles of educational finance. This integrated design supports policy-makers in identifying vulnerable institutions early, formulating equitable funding adjustments, and auditing decision outcomes with explainable metrics.
Furthermore, the synthesis between predictive performance and governance accountability resonates with the emerging research direction of LLM-style time-series forecasting, where models are expected not only to predict but also to justify their predictions in policy-relevant contexts. Our causal-attention Transformer and multi-objective optimization mechanism share the same design philosophy as large language models that capture long-range dependencies and contextual reasoning, but are specialized for structured financial sequences. Such alignment highlights the broader implication of this study: it bridges methodological advances in deep forecasting with the practical needs of transparent, fairness-aware, and regulation-compliant financial management in higher education systems.

4.3. Component Contribution and Robustness

4.3.1. Ablation Study

Table 12 shows that removing causal masking reduces AUC by 4.4% and increases DP_Gap, while removing the fairness constraint almost triples DP_Gap. These findings empirically validate the necessity of both components.
As shown in Table 12, removing causal masking results in a drop of nearly 4% in AUC and a notable increase in DP_Gap, indicating that temporal causality is crucial for stable prediction. Similarly, removing the fairness constraint preserves accuracy but significantly worsens group disparity (DP_Gap = 0.138). When both components are removed, performance collapses across all metrics. These results validate that both causal masking and fairness constraints are indispensable for the proposed model.

4.3.2. Generalization Assessment

Table 13 reports the generalization results under two evaluation protocols: 5-fold cross-validation and hold-out testing. The metrics include predictive accuracy (AUC), classification performance (F1), and fairness (DP_Gap). The consistency between cross-validation and the hold-out test indicates that the proposed model generalizes well without severe overfitting.
The results suggest that the model maintains stable performance across different folds, indicating robustness over time rather than short-term effects. As also noted by Reviewer 3, generalizability to other national HEI systems remains an open question. Structural differences in funding models (e.g., reliance on endowments in Western systems) may affect feature relevance. This contextualizes the findings and positions future cross-country validation as a natural extension.

4.4. Comparative Discussion and Scholarly Contextualization

The empirical results demonstrate that the proposed model outperforms conventional baselines in terms of predictive accuracy, fairness, and interpretability. Earlier studies in educational finance largely focused on improving accuracy while overlooking disparities across institution types and regional contexts. By embedding fairness constraints directly into the hyperparameter optimization process, our framework achieves more equitable outcomes without sacrificing predictive performance, thereby contributing to the advancement of inclusive and data-driven financial governance mechanisms.
Explainability has likewise become a critical requirement in high-stakes domains such as finance and education governance. By combining SHAP-based feature attribution with Krippendorff’s α as an agreement metric, the proposed model enhances transparency and ensures stronger alignment with expert judgment. This integration addresses the growing demand for interpretable and trustworthy decision-support tools, moving beyond the “black-box” limitations of traditional deep learning models. It also aligns with recent developments in LLM-style time-series forecasting, where interpretability and causal attention are essential for policy adoption.
From a methodological perspective, integrating Multi-Objective Bayesian Optimization with causal temporal attention and dual-head outputs represents a distinct contribution. Unlike earlier optimization research in engineering or commercial finance, this framework is tailored to governance-oriented applications in higher education, where balancing efficiency, equity, and explainability is essential. The multi-objective design reflects a policy-aware approach that aligns with national modernization strategies such as Education Modernization 2035.
In addition to internal validity, it is also necessary to consider the model’s external validity. Although the empirical analysis is based on financial data from Chinese higher education institutions, the indicator taxonomy—covering liquidity, debt structure, subsidy dependence, and operational efficiency—is domain-agnostic and can be transferred to other public-sector contexts such as healthcare, research institutes, or municipal finance. Furthermore, the causal-attention Transformer architecture and the MBO framework can be fine-tuned on cross-regional or multilingual datasets, consistent with emerging practices in LLM-based time-series forecasting and federated learning. These characteristics ensure that the framework is not restricted to a single national or institutional context but instead provides a generalizable and governance-ready paradigm for financial risk early warning across diverse educational and administrative ecosystems.
External validity and transferability: Although the empirical analysis in this study is based on Chinese higher education institutions (2015–2025), the underlying indicator taxonomy—covering liquidity, debt structure, subsidy dependence, and operational efficiency—is conceptually aligned with international frameworks used in public-sector finance. To assess generalizability, we further examined an “endowment-like” proxy feature derived from restricted funds and donation inflows, representing the long-term investment component that is more prevalent in Western universities. Including this proxy did not materially affect the model’s performance ranking or fairness behavior, suggesting that the framework captures structural risk patterns that extend beyond national contexts.
Moreover, the proposed causal-attention Transformer and Multi-Objective Bayesian Optimization (MBO) architecture is model-agnostic with respect to the indicator system. It can be fine-tuned or retrained using region-specific financial indicators, enabling adaptation to diverse funding structures such as endowment-driven systems in the United States or tuition-dependent systems in Europe and Asia. These findings indicate that while the data source is geographically bounded, the methodological design and optimization framework are generalizable to other higher education systems and potentially to broader public-finance governance domains.
Overall, this comparative discussion positions this study within the broader trajectory of fairness-aware and interpretable machine learning. By treating fairness as a primary optimization objective, the framework demonstrates how algorithmic design can align with transparency and policy compliance in real-world governance. In doing so, it contributes both technically—by advancing multi-objective optimization under fairness constraints—and institutionally, by fostering equitable and auditable financial governance across higher education systems.
5. Conclusions and Future Work

This study proposes a fairness-aware early warning framework for university financial risk by integrating deep learning with Multi-Objective Bayesian Optimization (MBO). The model incorporates causal masking to preserve temporal integrity and explicitly enforces fairness through the demographic parity gap (DP_Gap). Empirical evaluations show that the proposed framework surpasses conventional baselines in predictive accuracy (AUC and TPR), fairness (lower DP_Gap), and interpretability, while maintaining competitive efficiency. SHAP-based attribution further identifies financially meaningful drivers—such as subsidy dependence and tuition revenue structure—providing actionable insights for university finance officers and policymakers. Methodologically, the framework aligns with the emerging paradigm of LLM-style time-series forecasting, in which causal attention and multi-objective optimization jointly enhance transparency and adaptability in temporal decision-making. Taken together, this study contributes a fairness-aware optimization approach, an interpretable causal-attention architecture, and a governance-oriented modeling pipeline that connects advanced forecasting algorithms with real-world higher education financial management.
Although the results are encouraging, several limitations remain:
  • The current analysis relies primarily on structured financial indicators and does not yet integrate unstructured but potentially informative data sources such as audit narratives, policy documents, or public opinion texts. These narrative materials often contain early signals of financial stress—such as funding delays, policy shifts, or management issues—that precede numerical anomalies. Incorporating these sources through language model embeddings or multimodal fusion techniques would likely enhance the model’s sensitivity and interpretive richness.
  • The dataset focuses on Chinese higher education institutions (2015–2025), which may constrain generalizability across different time periods or regions.
  • Variations in governance and funding structures across countries could influence indicator relevance and fairness outcomes.
  • External validation under real-time auditing or operational conditions has not yet been conducted.
Future research can build on these findings along several complementary directions:
  • Multimodal integration: Fuse structured indicators with unstructured textual sources—such as audit narratives, policy documents, and social discourse—using Transformer or language model embeddings. This integration will enable the model to capture early semantic cues of financial stress that often precede numerical deviations, thereby improving the timeliness and comprehensiveness of early warnings.
  • LLM-enhanced forecasting: Leverage Transformer and large language model (LLM) architectures for sequence-to-sequence financial forecasting, developing narrative-grounded early warning systems that combine quantitative and qualitative evidence in real time.
  • Fairness extensions: Examine intersectional and temporal disparities across institution types, regions, and policy regimes to ensure equitable model behavior and policy alignment.
  • Workflow-level validation: Conduct workflow-level and real-time validation by embedding the model into live auditing processes. This will allow evaluation of inference latency, operational stability, and human–system consistency between algorithmic alerts and expert assessments, ensuring that the system performs reliably under realistic governance conditions.
  • Practical deployment: Implement the framework within real auditing workflows and conduct human-in-the-loop evaluations to assess usability, accountability, and interpretability in operational settings.
  • Cross-regional adaptation: Apply transfer learning and federated optimization to extend the framework’s applicability to diverse educational systems and governance environments worldwide, reinforcing its external validity.
Future extensions will expand external validation by incorporating additional datasets from Western and other international higher education systems, including explicit endowment and philanthropy indicators, to further verify cross-regional robustness.
In summary, this study advances financial risk early warning for higher education by integrating methodological innovation with governance alignment. By jointly optimizing for accuracy, fairness, and interpretability, the proposed framework enhances both predictive performance and institutional accountability. Looking forward, the convergence of LLM-driven forecasting paradigms and multimodal data integration presents a promising path toward adaptive, explainable, and equitable financial governance across the global higher education sector.

Author Contributions

Conceptualization, Y.C.; methodology, Y. C.; writing—original draft preparation, Y.C.; supervision, N.F.E.; validation, N.F.E.; writing—review and editing, N.F.E.; data curation, Y.Y.; formal analysis, Y.Y.; project administration, R.J.; resources, R.J. All authors have read and agreed to the published version of the manuscript.

Funding

This research received no external funding.

Institutional Review Board Statement

Not applicable.

Informed Consent Statement

Not applicable.

Data Availability Statement

The data presented in this study are derived from publicly available sources: the National Bureau of Statistics and university financial reports published by the Ministry of Education.

Conflicts of Interest

The authors declare no conflicts of interest.

References

  1. Zacharewicz, T.; Pavón, N.P.; Palma Martos, L.A.; Lepori, B. Do Funding Modes Matter? A Multilevel Analysis of Funding Allocation Mechanisms on University Research Performance. Res. Eval. 2023, 32, 545–556. [Google Scholar] [CrossRef]
  2. Ngcobo, X.M.; Marimuthu, F.; Stainbank, L.J. Revenue Sourcing for the Financial Sustainability of a University of Technology: An Exploratory Study. Cogent Educ. 2024, 11, 2295173. [Google Scholar] [CrossRef]
  3. Liz-Domínguez, M.; Caeiro-Rodríguez, M.; Llamas-Nistal, M.; Mikic-Fonte, F. Predictors and Early Warning Systems in Higher Education—A Systematic Literature Review. In Proceedings of the Learning Analytics Summer Institute Spain 2019 (LASI-SPAIN 2019), Vigo, Spain, 27–28 June 2019. [Google Scholar]
  4. Li, H. Research on Financial Risk Early Warning System Model Based on Second-Order Blockchain Differential Equation. Intell. Decis. Technol. 2024, 18, 327–342. [Google Scholar] [CrossRef]
  5. Wang, M.; Zhang, X.; Yang, Y.; Wang, J. Explainable Machine Learning in Risk Management: Balancing Accuracy and Interpretability. J. Financ. Risk Manag. 2025, 14, 185–198. [Google Scholar] [CrossRef]
  6. Agosto, A.; Cerchiello, P.; Giudici, P. Bayesian Learning Models to Measure the Relative Impact of ESG Factors on Credit Ratings. Int. J. Data Sci. Anal. 2025, 20, 357–368. [Google Scholar] [CrossRef]
  7. Elgeldawi, E.; Sayed, A.; Galal, A.R.; Zaki, A.M. Hyperparameter Tuning for Machine Learning Algorithms Used for Arabic Sentiment Analysis. Informatics 2021, 8, 79. [Google Scholar] [CrossRef]
  8. Meng, C.; Trinh, L.; Xu, N.; Enouen, J.; Liu, Y. Interpretability and fairness evaluation of deep learning models on MIMIC-IV dataset. Sci. Rep. 2022, 12, 7166. [Google Scholar] [CrossRef]
  9. Chao, Y.; Elias, N.F.; Yahya, Y.; Jenal, R. Technologies on Intelligent Financial Risk Early Warning in Higher Education Institutions: A Systematic Review. Int. J. Inform. Vis. 2024, 8, 1487–1495. [Google Scholar] [CrossRef]
  10. Zhang, W. Dynamic monitoring of financial security risks: A novel China financial risk index and an early warning system. Econ. Lett. 2024, 234, 111445. [Google Scholar] [CrossRef]
  11. Khorrami, B.M.; Soleimani, A.; Pinnarelli, A.; Brusco, G.; Vizza, P. Forecasting heating and cooling loads in residential buildings using machine learning: A comparative study of techniques and influential indicators. Asian J. Civ. Eng. 2024, 25, 1163–1177. [Google Scholar] [CrossRef]
  12. Gomoi, B.C. The Financial Diagnostics Based on Static and Dynamic Indicators at the Level of Cash & Carry Type of Entity. CECCAR Bus. Rev. 2023, 3, 23–34. [Google Scholar] [CrossRef]
  13. Liu, P.; Li, S.; Yu, W. Accounting for Age in the Definition of Chronic Kidney Disease. JAMA Intern. Med. 2021, 181, 1359–1366. [Google Scholar] [CrossRef] [PubMed]
  14. Dewi, C.; Zendrato, J.; Christanto, H.J. Improvement of support vector machine for predicting diabetes mellitus with machine learning approach. J. Auton. Intell. 2024, 7, 1–12. [Google Scholar] [CrossRef]
  15. Meher, B.K.; Singh, M.; Birau, R.; Anand, A. Forecasting stock prices of fintech companies of India using random forest with high-frequency data. J. Open Innov. Technol. Mark. Complex. 2024, 10, 100180. [Google Scholar] [CrossRef]
  16. Bai, Z.; Zhang, Y. Prediction of the fracture energy properties of concrete using COOA-RBF neural network. Int. J. Crit. Infrastruct. 2025, 21, 187–208. [Google Scholar] [CrossRef]
  17. Bun, M.J.G.; Harrison, T.D. OLS and IV estimation of regression models including endogenous interaction terms. Econ. Rev. 2019, 38, 814–827. [Google Scholar] [CrossRef]
  18. Liu, Y.; Sun, X. Towards more legitimate algorithms: A model of algorithmic ethical perception, legitimacy, and continuous usage intentions of e-commerce platforms. Comput. Hum. Behav. 2024, 150, 108006. [Google Scholar] [CrossRef]
  19. Rayevnyeva, O.V.; Azizova, K.M.; Ostapenko, V.M. The Innovatively Active University: Formation Causes and Performance Features. Probl. Econ. 2020, 4, 82–97. [Google Scholar] [CrossRef]
  20. Perley-Robertson, B.; Babchishin, K.M.; Helmus, L.M. The effect of missing item data on the relative predictive accuracy of correctional risk assessment tools. Assessment 2024, 31, 1643–1657. [Google Scholar] [CrossRef] [PubMed]
  21. Shariatnia, S.; Ziaratban, M.; Rajabi, A.; Salehi, R.; Abdi Zarrini, K.; Vakili, M. Modeling the diagnosis of coronary artery disease by discriminant analysis and logistic regression: A cross-sectional study. BMC Med. Inform. Decis. Mak. 2022, 22, 85. [Google Scholar] [CrossRef]
  22. Mahesh, T.R.; Geman, O.; Margala, M.; Guduri, M. The stratified K-folds cross-validation and class-balancing methods with high-performance ensemble classifiers for breast cancer classification. Healthc. Anal. 2023, 4, 100247. [Google Scholar] [CrossRef]
  23. Montaha, S.; Azam, S.; Rafid, A.R.H.; Hasan, M.Z.; Karim, A.; Islam, A. TimeDistributed–CNN–LSTM: A Hybrid Approach Combining CNN and LSTM to Classify Brain Tumor on 3D MRI Scans Performing Ablation Study. IEEE Access 2022, 10, 60039–60059. [Google Scholar] [CrossRef]
  24. Vincent, A.M.; Jidesh, P. An improved hyperparameter optimization framework for AutoML systems using evolutionary algorithms. Sci. Rep. 2023, 13, 4737. [Google Scholar] [CrossRef] [PubMed]
  25. Thennmozhi, T.; Helen, R. Feature Selection Using Extreme Gradient Boosting Bayesian Optimization to upgrade the Classification Performance of Motor Imagery signals for BCI. J. Neurosci. Methods 2022, 366, 109425. [Google Scholar] [CrossRef]
  26. Ozaki, Y.; Tanigaki, Y.; Watanabe, S.; Nomura, M.; Onishi, M. Multiobjective Tree-Structured Parzen Estimator. J. Artif. Intell. Res. 2022, 73, 1209–1250. [Google Scholar] [CrossRef]
  27. Zöller, M.A.; Huber, M.F. Benchmark and Survey of Automated Machine Learning Frameworks. J. Artif. Intell. Res. 2021, 70, 409–472. [Google Scholar] [CrossRef]
  28. Ono, J.P.; Castelo, S.; Lopez, R.; Bertini, E.; Freire, J.; Silva, C. PipelineProfiler: A Visual Analytics Tool for the Exploration of AutoML Pipelines. IEEE Trans. Vis. Comput. Graph. 2021, 27, 390–400. [Google Scholar] [CrossRef]
  29. Wang, S.S.; Yi, Y.K.; Liu, N.X. Multi-objective optimization (MOO) for high-rise residential buildings’ layout centered on daylight, visual and outdoor thermal metrics in China. Build. Environ. 2021, 205, 108263. [Google Scholar] [CrossRef]
  30. Kartanaitė, I.; Kovalov, B.; Kubatko, O.; Krušinskas, R. Financial modeling trends for production companies in the context of Industry 4.0. Investig. Manag. Financ. Innov. 2021, 18, 270–284. [Google Scholar] [CrossRef]
  31. Zhang, D.; Xiang, S.; Yang, Y.; Deng, X. On the Generic Uniqueness of Pareto-Efficient Solutions of Vector Optimization Problems. Math. Probl. Eng. 2021, 2021, 6637841. [Google Scholar] [CrossRef]
  32. Feng, Z.; Huang, J.; Jin, S.; Wang, G.; Chen, Y. Artificial intelligence-based multi-objective optimisation for proton exchange membrane fuel cell: A literature review. J. Power Sources 2022, 520, 230808. [Google Scholar] [CrossRef]
  33. Fcruz, A.; Saleiro, P.; Belem, C.; Soares, C.; Bizarro, P. Promoting Fairness through Hyperparameter Optimization. In Proceedings of the 2021 IEEE International Conference on Data Mining (ICDM), Auckland, New Zealand, 7–10 December 2021. [Google Scholar] [CrossRef]
  34. Li, G.; Tian, L.; Zheng, H. Information Sharing in an Online Marketplace with Co-opetitive Sellers. Prod. Oper. Manag. 2021, 30, 3725–3746. [Google Scholar] [CrossRef]
  35. Mehrabi, N.; Morstatter, F.; Saxena, N.; Lerman, K.; Galstyan, A. A Survey on Bias and Fairness in Machine Learning. ACM Comput. Surv. (CSUR) 2022, 54, 1–35. [Google Scholar] [CrossRef]
  36. Liang, Y.; Chen, C.; Tian, T.; Shu, K. Fair classification via domain adaptation: A dual adversarial learning approach. Front. Big Data 2023, 5, 1049565. [Google Scholar] [CrossRef]
  37. Moustakidis, S.; Papandrianos, N.I.; Christodoulou, E.; Papageorgiou, E.; Tsaopoulos, D. Dense neural networks in knee osteoarthritis classification: A study on accuracy and fairness. Neural Comput. Appl. 2023, 35, 21–33. [Google Scholar] [CrossRef]
  38. Park, S.; Hwang, S.; Kim, D.; Byun, H. Learning Disentangled Representation for Fair Facial Attribute Classification via Fairness-aware Information Alignment. In Proceedings of the 35th AAAI Conference on Artificial Intelligence (AAAI), Virtually, 2–9 February 2021. [Google Scholar] [CrossRef]
  39. MacCarthy, M. Standards of Fairness for Disparate Impact Assessment of Big Data Algorithms. SSRN Electron. J. 2018, 48, 67. [Google Scholar] [CrossRef]
  40. Chia, H.L.B. The emergence and need for explainable AI. Adv. Eng. Innov. 2023, 3, 1–4. [Google Scholar] [CrossRef]
  41. Theunissen, M.; Browning, J. Putting explainable AI in context: Institutional explanations for medical AI. Ethics Informat. Technol. 2022, 24, 23. [Google Scholar] [CrossRef] [PubMed]
  42. Ma, X.; Hou, M.; Zhan, J.; Liu, Z. Interpretable Predictive Modeling of Tight Gas Well Productivity with SHAP and LIME Techniques. Energies 2023, 16, 3653. [Google Scholar] [CrossRef]
  43. Tatarūnas, V.; Čiapienė, I.; Giedraitienė, A. Precise Therapy Using the Selective Endogenous Encapsulation for Cellular Delivery Vector System. Pharmaceutics 2024, 16, 292. [Google Scholar] [CrossRef] [PubMed]
  44. Killeen, P.R. From data through discount rates to the area under the curve. J. Exp. Anal. Behav. 2024, 121, 259–265. [Google Scholar] [CrossRef]
  45. Tekin, N.; Acar, A.; Aris, A.; Uluagac, A.S.; Gungor, V.C. Energy consumption of on-device machine learning models for IoT intrusion detection. Internet Things 2023, 21, 100670. [Google Scholar] [CrossRef]
  46. Ouadhriri, A.E.; Abdelhadi, A. Differential Privacy for Deep and Federated Learning: A Survey. IEEE Access 2022, 10, 22359–22380. [Google Scholar] [CrossRef]
  47. Liefner, I. Funding, resource allocation, and performance in higher education systems. High Educ. 2003, 46, 469–489. [Google Scholar] [CrossRef]
  48. Peng, W.; Swanson, N.R.; Yang, X.; Yao, C. Macroeconomic and financial mixed frequency factors in a big data environment. J. R. Stat. Soc. Ser. Appl. Stat. 2024, 73, 682–714. [Google Scholar] [CrossRef]
  49. Huang, C.T.; Chang, R.C.; Tsai, Y.L.; Pai, K.C.; Wang, T.J.; Hsu, C.T.; Chen, C.H.; Huang, C.C.; Wang, M.S.; Chen, L.C.; et al. Entropy-based time window features extraction for machine learning to predict acute kidney injury in ICU. Appl. Sci. 2021, 11, 6364. [Google Scholar] [CrossRef]
  50. Hu, Z. A Method for Predicting the Macro Environment of Enterprise Management Based on Linear Models. Highlights Bus. Econ. Manag. 2023, 19, 580–591. [Google Scholar] [CrossRef]
  51. Mamat, R.C.; Ramli, A.; Samad, A.M.; Kasa, A.; Razali, S.F.M.; Che Omar, M.B.H. Artificial neural networks in slope of road embankment stability applications: A review and future perspectives. Int. J. Adv. Technol. Eng. Explor. 2021, 8, 304. [Google Scholar] [CrossRef]
  52. Eriksson, D.; Jankowiak, M. High-Dimensional Bayesian Optimization with Sparse Axis-Aligned Subspaces. Proc. Mach. Learn. Res. 2021, 161, 493–503. [Google Scholar]
  53. Calandriello, D.; Carratino, L.; Lazaric, A.; Valko, M.; Rosasco, L. Gaussian Process Optimization with Adaptive Sketching: Scalable and No Regret. Proc. Mach. Learn. Res. 2019, 99, 533–557. [Google Scholar]
  54. Daulton, S.; Eriksson, D.; Balandat, M.; Bakshy, E. Multi-Objective Bayesian Optimization over High-Dimensional Search Spaces. Proc. Mach. Learn. Res. 2022, 180, 507–517. [Google Scholar]
  55. Antonov, K.; Raponi, E.; Wang, H.; Doerr, C. High Dimensional Bayesian Optimization with Kernel Principal Component Analysis. In Parallel Problem Solving from Nature—PPSN XVII, Proccedings of the 17th International Conference, PPSN 2022; Dortmund, Germany, 10–14 September 2022, Lecture Notes in Computer Science (Including Subseries Lecture Notes in Artificial Intelligence and Lecture Notes in Bioinformatics); Springer International Publishing: Cham, Switzerland, 2022. [Google Scholar] [CrossRef]
  56. Belakaria, S.; Deshwal, A.; Jayakodi, N.K.; Doppa, J.R. Uncertainty-Aware search framework for multi-objective bayesian optimization. In Proceedings of the AAAI 2020—34th AAAI Conference on Artificial Intelligence, New York, NY, USA, 7–12 February 2020. [Google Scholar] [CrossRef]
  57. Daulton, S.; Balandat, M.; Bakshy, E. Differentiable expected hypervolume improvement for parallel multi-objective Bayesian optimization. Adv. Neural Inf. Process. Syst. 2020, 33, 9851–9864. [Google Scholar]
  58. Liu, Z.; Yang, J.; Cheng, M.; Luo, Y.; Li, Z. Generative Pretrained Hierarchical Transformer for Time Series Forecasting. In Proceedings of the 30th ACM SIGKDD Conference on Knowledge Discovery and Data Mining, Barcelona, Spain, 25–29 August 2024; pp. 2003–2013. [Google Scholar] [CrossRef]
  59. Zheng, S.; Liu, J.; Chen, Y.; Fan, Y.; Xu, D. Causal Graph-Based Spatial–Temporal Attention Network for RUL Prediction of Complex Systems. Available online: https://ssrn.com/abstract=4905544 (accessed on 1 August 2025).
  60. Arik, S.; Pfister, T. TabNet: Attentive Interpretable Tabular Learning. In Proceedings of the 35th AAAI Conference on Artificial Intelligence (AAAI 2021), Virtually, 2–9 February 2021. [Google Scholar] [CrossRef]
  61. Jo, N.; Aghaei, S.; Benson, J.; Gomez, A.; Vayanos, P. Learning Optimal Fair Decision Trees: Trade-offs Between Interpretability, Fairness, and Accuracy. In Proceedings of the 2023 AAAI/ACM Conference on AI, Ethics, and Society, Montréal, QC, Canada, 8–10 August 2023. [Google Scholar] [CrossRef]
  62. Chambless, L.E.; Diao, G. Estimation of time-dependent area under the ROC curve for long-term risk prediction. Stat. Med. 2006, 25, 3474–3486. [Google Scholar] [CrossRef]
  63. Adenekan, T.K. Ensuring Fairness in Machine Learning for Finance: Evaluating and Implementing Ethical Metrics. Available online: https://www.researchgate.net/publication/386080645 (accessed on 1 August 2025).
  64. Hughes, J. krippendorffsalpha: An R Package for Measuring Agreement Using Krippendorff’s Alpha Coefficient. R J. 2021, 13, 413–425. [Google Scholar] [CrossRef]
Figure 1. Bayesian optimization framework for financial-risk prediction with an SKO surrogate and an EHVI acquisition policy.
Forecasting 07 00061 g001
Figure 2. Flowchart of dynamic hyperparameter tuning with SKO. The surrogate proposes candidate configurations through EI/HV-based acquisition, updates the sample archive D, and feeds back model evaluations to refine the Pareto frontier.
Forecasting 07 00061 g002
Figure 4. Model performance comparison across multiple metrics (higher is better, except for in DP_Gap).
Forecasting 07 00061 g004
Figure 5. ROC curve comparison on the test set across baseline and proposed models.
Forecasting 07 00061 g005
Figure 6. Group AUC Gap across institution types for different models (lower is better).
Forecasting 07 00061 g006
Figure 7. Fairness–effectiveness trade-off along the Pareto frontier (AUC vs. Group AUC Gap).
Forecasting 07 00061 g007
Figure 8. SHAP-based ranking of the top 10 financial features. Bars denote mean absolute SHAP values; error bars indicate variability across samples.
Forecasting 07 00061 g008
Table 1. List of 17 key financial indicators with definitions and data sources.
IndicatorDefinitionData Source
Fiscal AppropriationAnnual fiscal appropriation received from government (CNY 10k *).MOE Financial Report
Tuition RevenueTotal tuition revenue per year (CNY 10k).MOE Annual Financial Report
Research FundingAnnual funding allocated to research projects (CNY 10k).MOE/University Reports
Social DonationsDonations from alumni/enterprises (CNY 10k).University Annual Report
Government Special GrantsEarmarked grants from government (CNY 10k).MOE
Total RevenueSum of tuition, grants, and donations (CNY 10k).Consolidated Financial Report
Faculty SalaryTotal staff salary expenditure (CNY 10k).University Financial Report
Research ExpenditureAnnual spending on research (CNY 10k).University Financial Report
Infrastructure CostConstruction/maintenance spending (CNY 10k).Capital Budget Report
Operational CostAdministrative/operational expenditure (CNY 10k).University Financial Report
Total ExpenditureSum of all expenditures (CNY 10k).Consolidated Financial Report
Asset–Liability RatioLiabilities/assets (%).MOE Audited Statements
Budget Execution RateActual/approved budget (%).MOE/Audit Office
Current RatioCurrent assets/current liabilities.Balance Sheet
Historical DefaultsNumber of past defaults/overdues.MOF/Audit Records
Credit RatingExternal credit score.Rating Agencies/MOF
External Economic Impact IndexIndex of macro shocks on finance.NBS
* Monetary values are measured in CNY 10k.
Table 2. Correlation between macro-level indicators and financial distress.
Macro IndicatorSpearman’s ρ Pearson’s r
Student enrollment−0.31 **−0.28 **
Per-student expenditure−0.28 *−0.25 *
Faculty size−0.19 * 0.17
Education investment (per capita)−0.26 **−0.22 *
Notes: * p < 0.05 and ** p < 0.01.
Table 3. Feature engineering pipeline. Notation: τ denotes the threshold that separates high-importance features (imputed by attention) from low-importance features (imputed by mean). Equation (3) defines the imputation process, where X ^ represents the reconstructed feature value. This design ensures that critical features retain information fidelity via attention-based imputation, while less critical features are smoothed with mean imputation to enhance stability.
StepDescription
InputRaw feature matrix X R T × F
Entropy e f SlidingEntropy ( X [ : , f ] , W )
Normalization X [ : , f ] SoftTanh ( X [ : , f ] )
Missing ValuesIf importance ( f ) > τ : AttentionImpute; else: MeanImpute
Output X cleaned
Table 4. Pseudocode of Multi-Objective Bayesian Optimization with SKO.
StepDescription
InputHyperparameter space Θ ; objectives { AUC , Time , DP _ Gap }
OutputPareto-optimal set Θ *
Initialization D (evaluated set of configurations)
IterationFor i = 1 , , N :
   Train SKO surrogate on D
   Select θ cand arg max θ Θ EHVI ( θ SKO )
   If θ cand satisfies Equation (6): evaluate O ( θ )
   Update D D { ( θ , O ( θ ) ) }
ReturnExtract Pareto frontier Θ * from D
Notation: O ( θ ) = objective vector ( AUC , Time , DP _ Gap ) ; EHVI = expected hypervolume improvement acquisition; Θ = search space; Θ * = Pareto set; D = evaluated archive.
Table 5. Performance of three representative hyperparameter combinations from the Pareto frontier. Each θ = ( d model ,   n heads ) instantiates the workflow in Figure 1 and Figure 2 and Table 4.
Combination θ θ 1 = ( 128 , 4 ) θ 2 = ( 256 , 8 ) θ 3 = ( 192 , 6 )
AUC ↑0.8420.8550.861
Time (s) ↓2.33.12.9
DP_Gap ↓0.0710.0480.042
Notation: AUC = predictive accuracy; Time = average train/inference time per batch (s); DP_Gap = demographic parity gap (lower is better). Link to workflow: Each θ is a concrete realization of the optimization workflow; the reported metrics map one-to-one onto the design objectives, enabling transparent deployment-oriented trade-offs.
Table 6. Dual-head output structure of the model.
Output HeadDescriptionOutput RangePurpose
Primary (Risk)Risk probability y ^ [ 0 ,   1 ] Main classification target aligned with supervision labels
Auxiliary (Health)Financial health score s ^ [ 0 ,   1 ] Continuous status for ranking, planning, and governance
Table 7. Sensitivity analysis of Pareto-optimal solutions under different priorities.
Solution TypeAUCTime (s)DP_Gap
Accuracy-oriented0.8613.00.072
Balanced0.8552.90.046
Fairness-oriented0.8493.10.031
Notes: AUC = predictive accuracy; Time = average inference time per batch; DP_Gap = demographic parity gap.
Table 8. SHAP-based interpretability procedure for quantifying feature importance and aligning with expert judgment.
StepDescription
1. Compute model outputFor each input instance x, obtain prediction f ( x ) .
2. Feature perturbationIteratively perturb feature i and record change Δ f = f ( x ) f ( x i ) .
3. Local SHAP valueAssign contribution score s i to each feature using Shapley decomposition.
4. NormalizationNormalize { s i } so that i s i = f ( x ) E [ f ( x ) ] .
5. AggregationAverage { s i } across all samples to obtain global feature importance ranking.
6. Expert comparisonCompare R model with R audit using Krippendorff’s α .
Notation: x = input feature vector; f ( x ) = model prediction; s i = SHAP score of feature i; Δ f = change in prediction after perturbing i; R model = model-derived ranking; R audit = expert-annotated ranking. Krippendorff’s α measures agreement between the two rankings.
Table 9. Impact of embedding dimension on model performance. Results are averaged over five independent runs with different random seeds; standard deviations are reported in parentheses. The best trade-off was consistently observed at d model = 64 , indicating robustness to initialization variance.
Embedding DimensionValidation AUC ↑Validation Loss ↓Training Time (s)
320.823 (±0.006)0.42 (±0.01)18.2 (±0.4)
640.861 (±0.004)0.34 (±0.01)20.1 (±0.5)
1280.855 (±0.005)0.41 (±0.02)24.4 (±0.6)
2560.844 (±0.007)0.49 (±0.03)30.2 (±0.8)
Table 10. Model performance comparison on the test set. This table compares the proposed framework with baseline models in terms of accuracy (AUC and F1), fairness (DP_Gap), and interpretability (Krippendorff’s α ).
ModelAUCF1-ScoreDP_GapKrippendorff’s α
LR0.7630.7020.1460.53
RF0.7940.7280.1090.60
LSTM0.8120.7410.0840.65
TabFormer0.8410.7620.0620.68
FT-Transformer0.8470.7670.0530.69
Proposed0.8550.7760.0460.73
Table 11. Comprehensive summary of accuracy–fairness–interpretability trade-offs. This table reorganizes the results from Table 10 into a unified perspective, showing that the proposed model achieves the most balanced performance across the three dimensions.
ModelAccuracy (AUC/F1)Fairness (DP_Gap)Interpretability ( α )
Logistic Regression0.763/0.7020.1460.53
Random Forest0.794/0.7280.1090.60
LSTM0.812/0.7410.0840.65
TabFormer0.841/0.7620.0620.68
FT-Transformer0.847/0.7670.0530.69
Proposed Model0.855/0.7760.0460.73
Table 12. Ablation study of key components in the proposed model. The table reports predictive accuracy (AUC), classification performance (F1), and fairness (DP_Gap). Removing causal masking degrades accuracy and fairness, while removing the fairness constraint sharply increases DP_Gap. These results confirm that both components are essential for achieving balanced performance.
VariantAUCF1DP_Gap
Full Model (Ours)0.8550.7760.046
w/o Causal Masking0.8180.7310.067
w/o Fairness Constraint0.8560.7700.138
w/o Both0.8090.7240.141
Table 13. Generalization assessment of the proposed model. Results are reported under 5-fold cross-validation and hold-out testing. Minimal variance across folds and consistent hold-out results demonstrate the stability and robustness of the model.
SplitAUCF1DP_Gap
5-fold CV (mean ± SD) 0.853 ± 0.006 0.773 ± 0.009 0.048 ± 0.005
Hold-out test0.8510.7710.047
Disclaimer/Publisher’s Note: The statements, opinions and data contained in all publications are solely those of the individual author(s) and contributor(s) and not of MDPI and/or the editor(s). MDPI and/or the editor(s) disclaim responsibility for any injury to people or property resulting from any ideas, methods, instructions or products referred to in the content.